UNIT UNIT UNIT UNIT –––– 3 3 3 3
INTRODUCTION TO OPERATIONS MANAGEMENTINTRODUCTION TO OPERATIONS MANAGEMENTINTRODUCTION TO OPERATIONS MANAGEMENTINTRODUCTION TO OPERATIONS MANAGEMENT
Plant location: Plant location is a strategic decision several factors influence
this decision. The main objective of any business is to optimize its cost and
revenue that is, minimize its costs and maximize its returns.
The degree of significance for the selection of location for any enterprise
mainly depends on its size and nature large scale industries requiring huge
amount of investment there are many considerations other than the local demand
in the selection proper plant location these plants cannot be easily shifted to
other place and an error of judgment in the selection of site can be vary
expensive to the organization. However, small-scale industry mainly selects the
site where in accordance with its capacity; the local market is available for its
products. It can easily shift to other place when there is any change in the
market.
Factors affecting plant location:
Nearness to Market: If the plant is located close to the market the cost of
transportation can be minimized. This also helps the producers to have direct
knowledge of the requirements of the customers.
Nearness to supply of raw materials: As far as possible the site selected should
be near the source of raw materials, so that the cost of transportation can be
minimized and storing cost can be reduced due to shorter lead time.
Availability of labour: Availability of right kind of labour force in required number
at reasonable rates is also a deciding factor in selection of site
Transport and communication facilities: Generally, industries have a tendency to
locate the industrial units near the railway station, highway or port areas.
Availability of power and fuel: Coal, electricity, oil and natural gas are the
important sources of power in the industries.
Ex: Tata iron and steel industry is established near the coalmines of Bihar.
Climatic conditions: Climatic conditions largely affect certain production
processes and also the efficiency of the employees.
www.jntuworld.com
www.jntuworld.com

Ex: Textile mills require moist climate that why these plant located at Mumbai
and Ahmedabad.
Availability of water: Water is used in industries for processing as in paper in
chemical industries, for generation of power in hydroelectric power, plants and
also required for drinking sanitary purpose also.
Ancillary industries: Many industries such as processing and assembly
industries are not producing al the parts of their product but purchase some of
the parts from ancillary industries producing it.
Financial and other aids: For the development of backward regions central as
well as state government provide certain incentives and facilities such as cash-
subsides, concession financial assistance, land, power and other facilities at
cheaper rates, tax concession etc.
Plant Layout: A technique of locating machines, processes and plant services
within the factory in order to secure the greatest possible output of high quality at
the lowest possible total cost of production
Type of plant layout:
Product or line layout: This type of layout is developed for product-focused
systems. In this type of layout only one product, or one type of product, is
produced in a given area. In case of product being assembled, this type of layout
is popularly known as an assembly line layout.
The work centers are organized in the sequence of appearance. The raw
material centre at one end of the line and goes from one operation to another
rapidly with minimum of work-in-process storage and material handling
Raw
Material
Cutting Turning Milling Grinding Painting Inspect packing
Finished
Goods
1 2 3 4 5 6 7
www.jntuworld.com
www.jntuworld.com
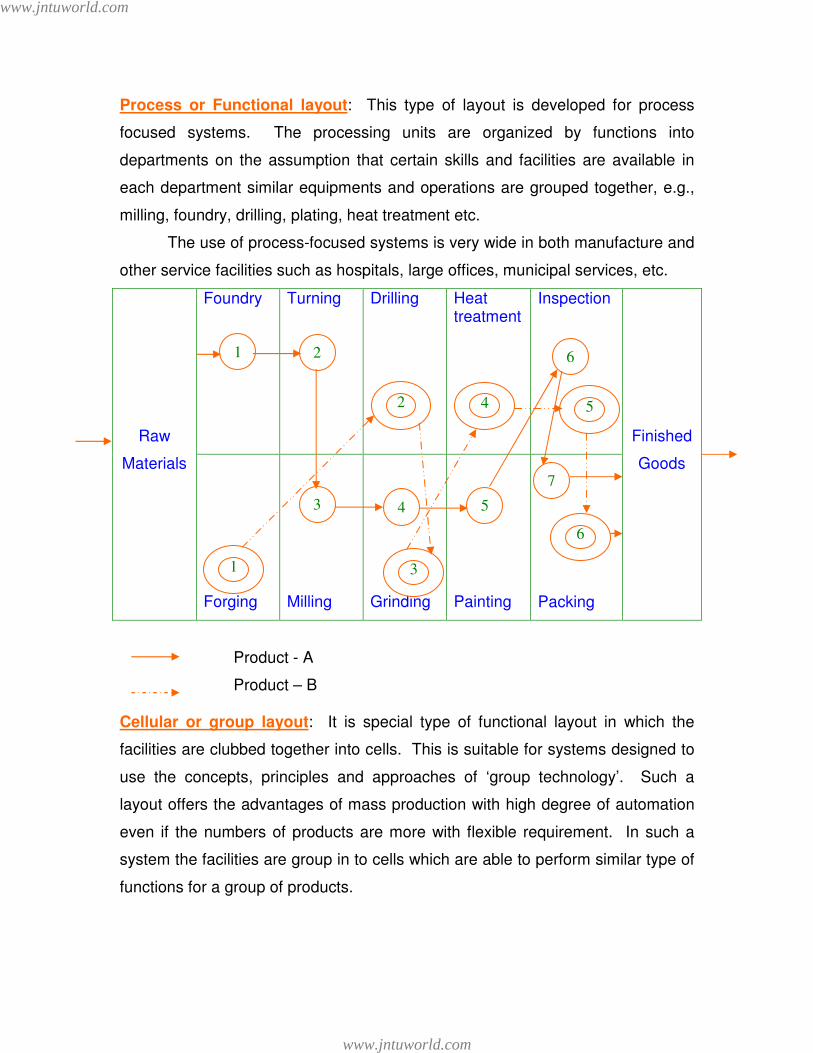
Process or Functional layout: This type of layout is developed for process
focused systems. The processing units are organized by functions into
departments on the assumption that certain skills and facilities are available in
each department similar equipments and operations are grouped together, e.g.,
milling, foundry, drilling, plating, heat treatment etc.
The use of process-focused systems is very wide in both manufacture and
other service facilities such as hospitals, large offices, municipal services, etc.
Foundry Turning Drilling Heat treatment
Inspection
Raw
Materials
Forging
Milling
Grinding
Painting
Packing
Finished
Goods
Product - A
Product – B Cellular or group layout: It is special type of functional layout in which the
facilities are clubbed together into cells. This is suitable for systems designed to
use the concepts, principles and approaches of ‘group technology’. Such a
layout offers the advantages of mass production with high degree of automation
even if the numbers of products are more with flexible requirement. In such a
system the facilities are group in to cells which are able to perform similar type of
functions for a group of products.
1 2 6
2 4 5
3 1
6
7
3 4 5
www.jntuworld.com
www.jntuworld.com

Lathe
Milling
Drilling
Lathe
Milling
Grinding
Hardening
Tempering Testing
Shaper
Milling
Drilling
Drilling
Boring Forging
Packing
Inspection
A B C D
Job Shop Layout: It is a layout for a very general flexible system that is
processing job production, The preparation of such a layout is dependent on the
analysis of the possible populations of orders and is a relatively, complex affair.
Project or Fixed position Layout: This is the layout for project type systems in
which the major component is kept at a fixed position and all other materials,
components, tools machines, work etc. are brought and assembly or fabrication
is carried out. This type of layout is now not used very commonly as the
machines required for manufacturing work are big and complicated. The fixed
position layout is used only when it is difficult to move the major component and
fabrication is to be carried out. Ex: production of ships.
Handling Equipment Machine – 1 Machine – 2
Worker – 1 Worker – 2
Product - A
Product - B
Product - C
Product - D
Main Assembly
Tools
www.jntuworld.com
www.jntuworld.com
Factors influencing plant layout:
Management policy: Management has to decide on many matters e.g. nature
and quality of products, size of the plant, integration of production process, plans
for expansion, amount of inventory in stock, employee facilities
Manufacturing process: The type of manufacturing process e.g.
synthetic/analytical, continuous/intermittent and repetitive/non-repetitive, will
govern the type of plant layout.
Nature of product: Small and light products can be moved easily to the machines,
whereas for heavy and bulky products the machines may have to be moved.
Type of equipment: The use of single purpose and multi-purpose machine
substantially affects the plant layout. Similarly, noisy and vibrating machines
require special attention in the plant layout decision.
Types of buildings: The plant layout in a single storey building will be different
from that in a multi storey building. The covered areas, the number of storey’s,
elevators and stairs, parking and storage area all affect the layout.
Availability of total floor area: The allocation of space for machines, work-
benches, sub-store aisles etc., is made on the basis of the available floor area
use of overhead space is made in case of shortage of space.
Arrangement of materials handing equipment: Provide sufficient aisles for free
movement of material handling equipment such as hand truck, fork truck etc.
Service facilities: The layout of factory must include proper service facilities
required for the comfort and welfare of workers. These include canteen, lockers,
drinking water, first aid etc.
Possibility of future expansion: Plant layout is made in the light of future
requirement and installations of additional activities.
Principles of plant layout:
Principle of integration: The best layout is one which integrates the men,
materials, machinery, supporting activities and any other such a factors that
results in the best compromise.
Principle of minimum movement: The number of movement of workers and
materials and the distance moved should be minimized. The materials should be
transported in bulk rather than in small amounts.
www.jntuworld.com
www.jntuworld.com

Principle of smooth and continue flow: It states that bottlenecks, congestion
points and bulk tracking should be removed by proper line balancing techniques.
Principle of cubic space: Space of a room, it the ceiling height is also utilized,
more materials can be accommodated in the same space.
Principle of satisfaction of safety: Working places-safe, well-ventilated and free
from dust, noise fumes, odors and other hazardous conditions, help to increase
the efficiency of the workers and improve their morale.
Principle of flexibility: It means the best layout in one which can be adopted and
re-arranged at a minimum cost with least inconvenience.
Productivity:
Definition: Productivity is defined as the rate at which the goods and services are
produced.
It refers to the relationship between the inputs and the output. It is
calculated as a ratio between the amount produced and the amount of resources
(land, labour, capital, technology etc.) used in the course of production in other
words
Input
Outputoductivity =Pr
And also defined productivity as human efforts to produce more and more with
less and less inputs of resources as a result of which the benefits of production
are distributed among maximum number of people.
www.jntuworld.com
www.jntuworld.com

Method of Production:
Job production: In this system, goods are produced according to the orders
with this method, individual requirements of the consumers can be met. Each job
order stands alone and is not likely to be repeated. This type of production has a
lot of flexibility of operation and hence general purpose machines are required.
Factories adopting this type of production, are generally small in size.
Advantages:
1. It is the only method, which can meet the individual requirement.
2. There is no managerial problem, because of very less number of workers,
and small size of concern.
3. Such type of production requires less money and is easy to start.
Disadvantages:
1. There is no scope for continuous production and demand
2. As the purchase of raw materials is less, hence cost of raw materials per
unit will be slightly more.
3. For handling different type of jobs, only skilled and intelligent workers are
needed, thus labour cost increases.
Batch production: This type of production is generally adopted in medium size
enterprise. Batch production is in between job production and mass production.
Batch production is bigger in scale than the job production. While it is smaller
than that of mass production, batch production requires more machines than job
production and fewer machines that the of mass production.
Advantages:
1. While comparing with mass production it requires less capital
2. Comparing with job production, it is more advantageous commercially.
3. If demand for one product decrease then production, for another product
may be increased, thus the risk of loss is very less.
Disadvantages:
1. Comparing with mass production cost of scales and advertisement per
unit is more
www.jntuworld.com
www.jntuworld.com

2. Raw materials to be purchased are in less quantity than that in mass
production; therefore it is slightly costlier than that of mass production
because less quantity discount is available.
Mass production: This method of production is used by concerns where
manufacturing is carried on continuously in anticipation of demand though
demand of the product may not be uniform through the year.
In mass production, simplification and standardization of products are
made with the help of specialized (one purpose) machine, articles of
standardized nature can easily and economically be produced on a large scale.
There is a small difference between mass production and continuous
production. This is mainly in the kind of product and its relation to the plant. In
mass production plant and equipment are flexible enough to deal with other
products, involving same production process. Where as in continuous or process
production only standardized product in a sequence produced. In this method
layout and requirement of additional tools and equipment
Advantages:
1. A smooth flow of materials from one work station to the next in logical
order.
2. Since the work from one process is fed directly into the next, small in
process inventories result
3. Total production time per unit short
4. Simple production planning control system are possible
5. Little skill is usually required by operations at the production line, hence
training is simple, short and inexpensive.
Disadvantages:
1. A breakdown of one machine may lead to a complete stoppage of the line
that follows the machine. Hence maintenance and repair is challenging
job.
2. Since the product dictates the layout, changes in product design may
require major changes in the layout.
3. Generally high investment are required owing to the specialized nature of
the machines and their possible duplication in the line
www.jntuworld.com
www.jntuworld.com

Work Study: Work study is one of the most important management techniques
which is employed to improve the activities in the production. The main objective
of work study is to assist the management in the optimum use of the human and
material resources.
Definition: Work study refers to the method study and work measurement, which
are used to examine human work in all its contexts by systematically
investigating into all factors affecting its efficiency and economy to bring forth the
desired improvement.
Method Study:
Definition: The systematic recording and critical examination of existing and
proposed ways of doing work, as a means of developing and applying easier and
more effective methods and reducing cost it is also called motion study.
Work Measurement:
Definition: Work measurement is the application of techniques designed to
establish time for a qualified worker to carry out a specified job at a defined level
of performance.
Work study has two parts, Method Study and Work Measurement.
Method study deals with the techniques of analyzing the way to do a given job
better, Work Measurement seeks to measure the time required to perform the
job.
Basic procedure for Method Study:
Select: The work to be studied
Record: All the relevant facts of the present or proposed method study by
observation
Work Study
Method Study To improve method of production
Work Measurement To assess human
effectiveness
www.jntuworld.com
www.jntuworld.com

Examine: The recorded facts critically every thing that is done, considering in
turn, the purpose of the activity, the place where it is performed, the sequence in
which it is done, the person who is doing it and the means by which it is done.
Develop: The most practical, economical and effective method considering all
the circumstances.
Define: The new method so that it can always be identified.
Install: The method as standard practice
Maintain: That standard practice by regular routine checks.
Recording: The current process of doing the job has to be recorded, while doing
so every detail however small it may be, has to be identified.
Where the process is too long, involving many stages of production,
inspection or transportation, the present process of doing the job is recorded
sufficiently together with all the relevant information, using the process chart
symbols.
www.jntuworld.com
www.jntuworld.com

Symbol Meanings
Operation: Operation involving changes in the condition of a
product
Ex: Assembly of spare parts
Transport: Something from the location to another
Ex: Assemble PC is moved to inspection section
Storage: (permanent) To store the materials, goods etc.
Ex: When PC is put into the store after inspection
Delay: (Temporary storage) Arises when the product waits for
next stage in the process
Ex: Machinery breakdown etc.
Inspection: To check whether the quality and quantity of the
product is satisfactory or not
Operation – cum – Inspection: Inspection is taken place during
the production process
Operation – cum – Transportation: Assemble is taking place
while the belt conveyer transports the spares.
www.jntuworld.com
www.jntuworld.com

Recording Techniques: The recording techniques are of three types
a) Process chart b) Diagrams c) Motion and film analysis d) Models
A) Process Charts:
1) Out line process chart: This chart outlines the main events sequence wise
considering only operations and inspections in the given job
Ex: TASK : Changing refill of a Ball Point pen
Chart begins : Unscrew the cap
Chart ends : Screw the cap
Chart by : --------------
Chart Ends : --------------
Unscrew cap
Unscrew neck
Remove the old refill
Assemble the spring on new refill
Place the refill in the barrel
Screw the neck Check if the ball pen writes Screw the cap
No. of operations 7 No. of inspections 1 Total No. of activities 8
1
1
2
3
4
6
5
7
www.jntuworld.com
www.jntuworld.com

2) Flow process chart: These are scale drawings of the work place, which
indicate where each activity takes place. This chart is capable of reflecting
undue delays in transferring work between workstations duplication of work, and
unfair work assignment, which may delay the completion process. It classified
into three types
Man Type : It records what the worker does
Materials Type : It records what happens to the materials
Equipment Type : It records how the equipment used.
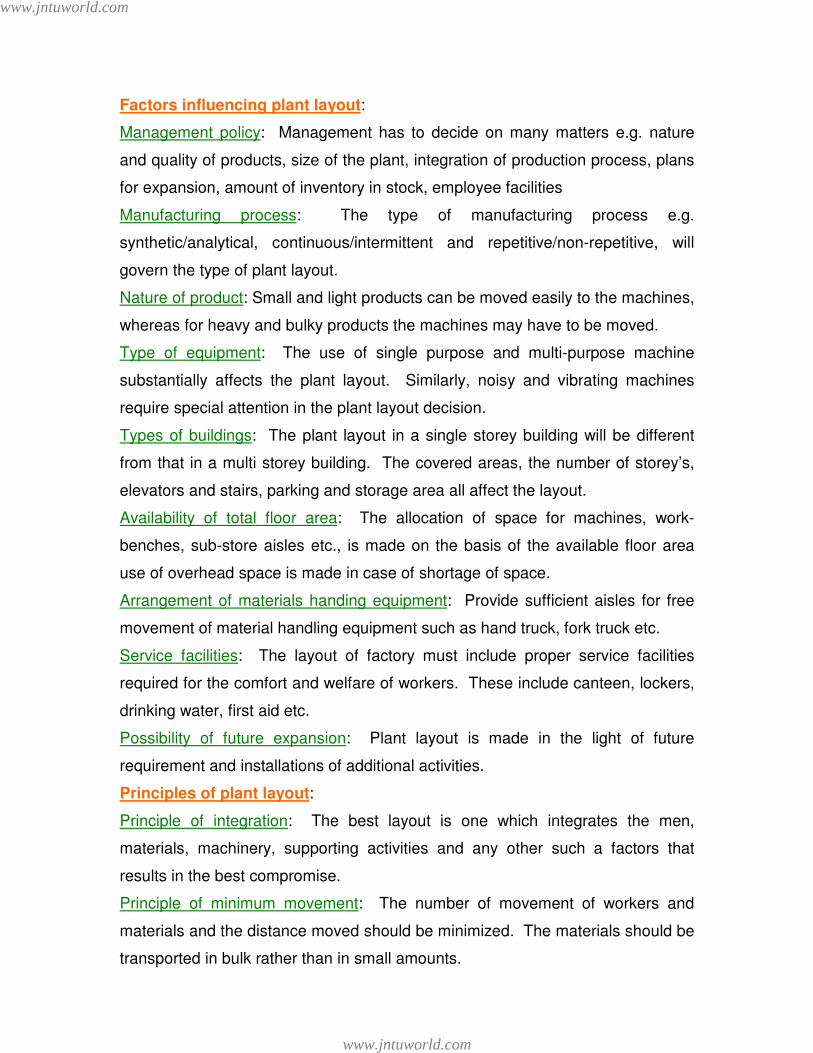
a) Man Type
Ex:
Job : Writing a letter using short hand typist
Chart begins : Typist in own office-awaiting dictation
Chart ends : Typist puts letter and copy in out tray
Typist office : 6 meters manager’s office
www.jntuworld.com
www.jntuworld.com
Summary
EVENT NO TIME DISTANCE
8
1
4 24 meters
1
1
1
2
2
3
4
1
5
3
1
4
6
7
8
To author’s office
Take dictation
To own office
Prepare Type Set
Type letter and copy
Remove from machine and separate copy
Check the copy
Place in a file for signature
To author’s office
Delay for signature
To own office
Type envelopes
Letter to envelopes
Letter and copy aside to out tray
www.jntuworld.com
www.jntuworld.com

b) Material Type:
Ex: Job : Making the casting ready for machining
Chart begins : Casting lying in foundry
Chart ends : Casting ready for machining
Operations Activity
Distance
moved mts Time Remarks
Costing laying in foundry
store
- - -
Moved to gas cutting
machine
10 3
By
Trolley
Wait, cutting machine
being set
- 5 -
Rises cut
- 20 -
Wait for trolley
- 10 -
Moved to inspection
department
6 2 -
Inspection before
machining
- 15
By
Trolley
Move to machine shop
10 3 -
Summary
Event No. Time Distance
1 20 -
1 15 -
1 - -
2 15 (5+10) -
3 8 26
www.jntuworld.com
www.jntuworld.com

3) Two handed process chart: The two hand process chart is a chart is which the
activities of a workers hand are recorded, in their relationship to one another. It
is commonly used for repetitive and short operations.
Ex: Job : Assemble to washers and nut to bolt Chart begins : Hand empty material in boxes Part No. : ------------- Chart ends : Completed assembly aside to box Operation No. : ------------- Method : Present/proposed
To first washer
1
1
1
2
3
2
To bolt
Pick up bolt
To Position
To Box
Aside to Box
To Bolt
Pick up washer
To position
Assemble to bolt
To second washer
Pick up washer
To position
Assemble to bolt
To Nut
Pick up Nut
To Position
Delay
To first washer
1
2
2
1
3
4
3
4
5
5
6
1
7 Assemble to bolt
www.jntuworld.com
www.jntuworld.com

4) Multiple activity chart: A multiple activity chart is a chart in which the activities
of more than one item (worker, machine or equipment) are recorded on a
common time scale to show their inter relationship.
By using separate vertical columns to represent the activities of
different operators or machines on a common time scale, the chart shows very
clearly the period of idleness on the part of any items during the process.
Ex:
Chart No.----------------- Sheet No. ------------------- Department ---------------------
Material : B201 casting Job : Making a slot on the casing
Machine : Slotted Operation : XYZ
Charted by : ------------ Date : ------------
Time (min.)
Man Machine Time (min.)
0.2 Removes finished casting cleans with compressed air
Idle 0.2
0.4 Gauges depth of slot on surface plate
Idle 0.4
0.6 Breaks sharp edges with file cleans with compressed air
Idle 0.6
0.8 Place in a box obtains new casting
Idle 0.8
1.0 Cleans machine with compressed air
Idle 1.0
1.2
Locates casting in fixture, starts machine and automatic fee
Idle 1.2
1.4 Idle
Cutting slot
1.4
1.6 Idle
Cutting slot
1.6
1.8 Idle
Cutting slot
1.8
2.0 Idle
Cutting slot 2.0
www.jntuworld.com
www.jntuworld.com

Summary:
Cycle time : 2 min.
Working Time: Utilization:
a) Man : 1.2 min. a) Man : 60%
b) Machine : 0.8 min. b) Machine : 40%
Idle time:
a) Man : 0.8 min.
b) Machine : 1.2 min.
www.jntuworld.com
www.jntuworld.com

B) Diagrams:
1) Flow diagrams: Flow process chart only shows the sequence of various
activities necessary for performing the specified work. It does not show clearly
the path of movement of men and materials from one location to another.
Definition: It is a diagrams, drawn to scale, intended to show the relative position
of the production machinery and marks the route followed by the machines,
materials and men.
2) String diagrams: The workers are moving at irregular intervals between a
number of points in a working area with or without materials in many industrial
activities.
Definition: The string diagram is a scale plan or model on which a tread its used
to trace and measure the path of workers, materials or equipment during a
specified sequence of events.
3) Cycle graph: In this method a small electric bulb is attached to each part of
the body, which makes the movement for carrying out an operation. The path of
movement is photographed by high-speed camera.
4) Chronocycle graph: This is a photographic record, which traces the path of
movement onto a photographic place. In principle, it is similar to the string
diagram, and is most effective when recording short, rapid movements.
C) Micro motion Study and film analysis: Micro motion study is a set of
techniques intended to divide human activity into groups of movements or micro
motions (therbiligs) and the study of such movements help to find for an operator
one best pattern of movements that consumes less time and requires less effort
to accomplish the task.
Film analysis: Once the activity has been filmed and the film processed, a
projector runs the film very slowly and the film can be stopped or reversed
whenever required.
1) SIMO Chart (simultaneous motion cycle chart): A SIMO chart is based on film
analysis, it is a graphic representation of the coordinated activities of an
operators body embers. The activities are described in terms of basic or
fundamental motions. The time required for completion of these motions is also
recorded on the chart.
www.jntuworld.com
www.jntuworld.com

D) Models: Sometimes the picture of the existing conditions is not clear by the
use of flow process chart or flow diagram. In such cases instead of the scales
plans of the shop facilities models are used to provide visual representation of
the proposed layout before proceeding with actual rearrangement of the work
place.
Work Measurement: Work measurement is the application of technique to
establish the time for a qualified worker to carry out a specified job at a defined
level of performance.
Procedure for Work Measurement:
1) Sect: The work to be studied and determine the objectives of the study
2) Record: All the relevant data relating to circumstances in which the work is
being done, the methods to be used breakdown the job into its elements
3) Examine: The recorded data and the detailed breakdown critically to ensure
the most effective method and motions are being used and that unproductive
elements are separated from productive elements.
4) Measure: The time required to complete each element using the appropriate
work measurement techniques and calculate the time required to compete the
work cycle which is known as basic time.
5) Compile: The standard time for the operation or work place, in case of stop
watch time study the various allowances to cover relation, personal needs etc.
are added to the basic time to estimate the standard time.
Techniques of work measurement:
1. Time study
2. Synthesis from standard data
3. Predetermined Motion Time System (PMTS)
4. Analytical estimating
5. Work Sampling
1) Time study: It is defined as the art of observing and recording the time
required to do each detailed element of all industrial operation.
Time study equipment: Time study equipment can be broadly grouped two
categories
A) Time measuring device B) Time study boards and time study chart
www.jntuworld.com
www.jntuworld.com

A) Time measuring devices:
a) Stop Watch b) Motion picture camera c) Time recording machine
d) Electronic timer.
a) Stop Watch:
i) Decimal minute stop watch: In this type of watch the movements is started and
stopped by moving the slide “A”, forward and backward respectively are
complete revolution of large hand represents 1 minute and since the dial is
divided into 100 parts reading to with in 0.01 minutes can be obtained. Every
time the large hand make one revolution the small hand will register 1 minute and
is able to register up to 30 minutes.
ii) Decimal hour stop watch: The dial in this watch is divided into 100 parts. The
needle completes 10 revolutions in one hour. The least count in this watch is
0.001 hours. The small dial of this watch is divided into 30 equl spaces
(representing 0.01 hour) and the small needle makes 31/3 revolutions in one
hour.
b) Motion picture camera: Every element of the operation involving motion of the
workers is made into film through motion picture camera when this film is run at a
slow speed through a projector; the time of each element is recorded using a
stopwatch.
c) Time recording machine: A moving tape is run is this machine at a uniform
velocity of 10 inches/minutes with the help of electric motor. The machine has
two keys: one key, when pressed, indicates starting of an operation, and the
other key used to take a print on the scaled tape at the end of elements.
d) Electronic timer: The timing of starting and ending of an operation of an
element is automatically recorded through electronic timers.
B) Time study boards and time study charts:
Time study board: These are simple and handy hard wood boards equipped with
stopwatch holders and clamps for holding the observation sheets and time study
forms. These boards help to see and record the observation and time at the
same instant.
Observations forms: Printed or cyclostyled forms are used for recording the
observation during that time study. It ensures that time study are made in a
www.jntuworld.com
www.jntuworld.com
standard manner and that no essential data are omitted. These forms are
attached to the study board by means of clip provided
2) Synthesis from standard data: This one technique of work measurement to
obtained synthetic times that are synthesis from element times previously
obtained from direct time studies. The analysis and measurement stage are thus
conducted prior to the actual study.
3) Predetermine motion time system (PMTS): Every element of work is
composed of some combination of basic human motions. Apart from mental
activity all works can broken down into elements that usually a fundamental
movement of the body or body members. After this analysis stage the basic
motions that have been isolated have a time allotted to them on the basis of
predetermine motion times.
4) Analytical estimation: Analytical estimating serves as best for measuring
work. In the analysis stage we find the usually these basic elements or much
larger as compared to the elements in PMTS or time study. For measuring
stages the time, which will be occupied by the element at a specific speed of
working is estimated.
5) Work Sampling: It is work measurement technique which large number of
instantaneous observation are made random interval over a specified period of
time of a group of workers, machine and processes. Each observation records
what is happening at that instantant and the present observations recorded for a
particular activity or delay is a measure of the percentage of time during which
that activity or delay occurs.
It can also defined as a method of finding the percentage
occurrence of a certain activity by statistical sampling and random observations.
Procedure for conducting time study: For conducting time study average
workers and average machines are selected. This study id conducted by the time
study expert, who should be familiar with all the information related to the job and
the conditions in which it is being done.
Time study is performed in the following stages.
A) Analysis of work B) Standardization of methods
C) Making time study
www.jntuworld.com
www.jntuworld.com

A) Analysis of work: It includes all the tasks performed by the workers, not just
the effective work. In the end, time required for job preparation, cleaning of
machine, etc. should also be included.
B) Standardization of methods: Related to materials, equipment, tools, working
conditions to ensure an acceptable method which is easy, safe and the fastest.
C) Making time study: Time study is done on a printed time study record sheet,
which is fixed on a board known as time study board. On one corner, a
stopwatch is placed.
Different time readings of element are recorded in the corresponding
column of the record sheet. Several sets of reading are taken to arrive at an
accurate result after noting all these readings, average tome is calculated,
neglecting abnormal values, if any.
Standard time: it is the time, which is taken by a normal worker for a specific task
or job, working under moderate conditions and including other allowances. Such
as fatigue setting of tool and job, repairing of tool and checking of job etc
Standard time is the basis for the calculation of wages and
incentives.
Standard time= Average time* Rating factor+ other allowances
Rating factor: the study engineer multiplies actual time with a factor known as
Rating factor or leveling factor to set the average time which a normal worker
would take. This is expressed as a percentage of the effacing of representative
operator, which is in comparison to some of his average fellow workers.
Performance rating: performance rating is that process, during which the time
study engineer compares the performance of the operator of normal
performance.
Performance rating= 100eperformancNormal
epersormancObserved×
The rating can be
a) Standard rating: A qualified worker will naturally work if he is motivated to
apply himself to his work at the average rate of pace.
b) Normal rating: It is the average rate or pace at which a qualified worker will
naturally work even if he has no specific motivation to apply himself to this work.
www.jntuworld.com
www.jntuworld.com

Rating techniques:
1) Speed rating : Speed rating consists of determining the speed of the
operator’s movements in relation to a normal pace as a factor and applying it to
each element so as to get the normal time for the element.
Normal or basic time = ratingdardtanS
RatingtimeObsered ×
Rating = Worker’s speed
Standard rating = Speed expected from the worker
2) Westing-house system of rating: It is based upon four factors- system
comprising skill, effort, conditions and consistency and arrives at cumulative
rating.
3) Synthetic rating: It is the ratio of the standard tome for the element to that of
observed time.
4) Objective rating; It is determined in two stages- first the speed rating and
second the adjustment for job difficulties.
5) Psychological evaluation of performance level: In this rating we consider the
amount of oxygen consumed, change of heart rate etc to determine rating factor.
Types of allowances in time study:
1) Process allowances: Process allowances to compensate for enforced idleness
due to no work power failure, faulty material or tools and equipment.
2) Personal allowances: It comprises personal needs and fatigue. Fatigue
allowance contains, in turn, a constant portion and a variable portion.
3) Interference allowances: When a worker is attending more than one machine
4) Contingency allowances: These allowances are to meet legitimate but
irregular or infrequent items of work or delays.
5) Special allowances: Special allowances decided as a policy matter, covering
activities that are essential for satisfactory performance of work but may not be
part of the job, like start up, shut down, change over, cleaning, set up, tool
changing etc.
www.jntuworld.com
www.jntuworld.com

STATISTICAL QUALITY CONTROL
Introduction: Quality is the determining factor the success of any product or service
large resource are committed in every organization to ensure quality
Definition: It is defined as customer satisfaction in general and fitness for use in
particular. Both the external consumer who buy the product and services and the
internal consumers that is, all divisions or departments of the business organization
are equally interested in the quality.
Statistical quality control: The process of applying statistical principles to solve the
problem of controlling the quality control of a product or service is called statistical
quality control.
Quality elements: a) Quality design b) Quality conformance
a) Quality design: Quality of design refers to product feature such as performance,
reliability durability, ease of use, serviceability
b) Quality conformance: Quality conformance means whether the product meets the
given quality specification or not
Inspection: The process of measuring the out put and comparing it to check whether
it meets the given specified requirements or not, is called inspection.
Inspection Methods: The following are the methods of inspection based on merits
1) Incoming inspection: In this method, the quality of the goods and services arriving
into the organization is inspected. This ensures that the material suppliers adhere to
the given specifications with this defective material cannot enter into the production
process. This focuses on the vendor’s quality and ability to supply acceptable raw
materials.
2) Critical point inspection: Inspecting at the critical points of a product manufacture
gives valuable insight into the completely functional process. At the points of
manufacture that involve high costs or which offer no possibility for repair or rework,
inspection is crucial further operation depend on these results critical point inspection
helps to drop the defective production, and thereby, facilitate avoiding unnecessary
further expenditure on them.
3) Process inspection: This is also called patrolling inspection or floor inspection or
roving inspection. Here the inspector goes around the manufacturing points in the
shop floor to inspect the goods produced on random sample basis from time to time.
www.jntuworld.com
www.jntuworld.com

4) Fixed inspection: It provides for a centralized and independent where work is
brought for inspection from time to time. This method is followed where the inspection
equipment cannot be moved to the points of productions.
5) Final inspection: This is centralized inspection making use of special equipment.
This certifies the quality of the goods before they are shipped.
Elements of statistical Quality Control: The technique under SQC can be divided
in to two parts a) Process control b) Acceptance sampling
a) Process control: Process control is a technique of ensuring the quality of the
products during the manufacturing process itself. If a process consistently produces
items with acceptable or tolerable range of specification. It is said to be statically
under control. Process control is achieved through control charts. Process control
aims to control and maintain the quality of the products in the manufacturing process.
Statistical control charts: A control chart compares graphically the process
performance data to computed statistical control limits. These control limits act as
limit lines on the chart control chats are the tools to determine whether the process is
under control or not.
The quality of the production process may be affected by chance cause or
assignable cause.
Chance cause: such causes, which may or may not affect the manufacturing process
are called chance cause, chance cause cannot even be identified. It is not possible to
always maintain the given specification.
Assignable Cause: Assignable causes affect the quality of the production process.
These causes can be identified and specified. Causes such as change in the labour
shift, power fluctuations, or excessive tool wear are said to be assignable causes as
they affect the quality of manufacturing process in different ways.
Process capability: Process capability refers to the ability to achieve measurable
results from a combination of machines, tools, methods, materials and people
engaged in production.
www.jntuworld.com
www.jntuworld.com

Confidence limits and control limit:
Confidence limit: It indicate the range of confidence level. A confidence level refers to
the probability that the value of measurement or parameter, such as length of screw,
is correct.
Ex: If a component is required with measurement of 50 mm. across, then the buy
accept all components measuring between 48 mm and 52 mm across, considering a
five percent confidence level.
Control limit: Control limits are found in the control charts. There are two control
limits 1) Upper control limit (UCL) and 2) Lower control limit (LCL). These are
determined based on the principles of normal distribution
Ex: In a pilot investigation of the length of the nails produced in the shop floor, it is
found that the mean length X is cm, the S.D 3σ, the measure of variability of the
nails produced 0.2 cm. How do you construct the control chart for this data.
x
Control charts for variables: A variable is one whose quality measurement changes
from unit to unit. The quality of these variables is measured in terms of hardness,
thickness, length, and so on. The control charts for variables are drawn using the
principles of normal distribution. There are two types of control charts for variables x
and R chart.
X and R Chart: The X chart is used to show the process variations based on the
average measurement of samples collected. It shows more light on diagnosing quality
problem when read along with R chart. It shows the erratic or cyclic shifts in the
manufacturing process. It can also focus on when to take a remedial measure to set
-3σ Lower control limit
+3σ Upper control limit
4.6
4
3.4
Length of nail
Sample number
www.jntuworld.com
www.jntuworld.com

right the quality problems. However, collecting data about all the variables involves a
large amount of time and resources.
The R chart is based on the range of the items in the given ample. It highlights
the changes in the process variability. It is a good measure of spread or range. It
shows better results when read along with the X chart.
For x charts: UCL = x + A2 R When x = Mean of Means
LCL = x - A2 R R = Mean of sample range
A2= Constant
For R chart: UCL = D4 R D4, D3 are constants
LCL = D3 R
R is the average of sample ranges (Ranges is the difference between the
maximum variable and minimum variable)
EX: Construct x and R charts from the following information and state whether the
process is in control for each of the following x has been computed from a sample of
5 units drawn at an interval of half an hour from an ongoing manufacturing process.
Samples 1 2 3 4 5 6 7 8 9 10
x 24 34 35 39 26 29 13 34 37 29
R 23 39 14 5 20 17 21 11 40 10
Solution: The mean of means x = n
x∑ =
10
300 = 30
R is calculated as R = 2010
200
n
R==
∑
x Chart: x chart UCL and LCL compute at sample size 5 A 2 table value is 0.58
UCL= x +A2 R = 30 + (0.58x20) =41.6
LCL = D3 R = 30 – (0.58x20) = 18.4
www.jntuworld.com
www.jntuworld.com

0
10
20
30
40
50
60
1 2 3 4 5 6 7 8 9 10
x = 30
UCL = 41.6
LCL = 18.4
Number of samples
Measurement of variables
www.jntuworld.com
www.jntuworld.com

R Chart: R chart UCL and LCL compute at sample size 5, D4 table value is 2.11 and
D3 table value is 0
UCL = D4 R = 2.11 x 20 = 42.2
LCL = D3 R = 0 x 20 = 0
Therefore 3, 7 points the process is out of control.
Control charts for attributes: The quality of attributes can be determined on
the basis of ‘Yes’ or ‘No’, ‘Go’ or ‘No go’. In other words, in case of a mirror
glass, even if there is one scratch it is not considered to be a quality mirror, in
such a case quality is decided base on whether the mirror has any scratch or not.
The control charts for attributes are ‘C’ chart and ‘P’ charts
‘C’ Chart: ‘C’ chart is use where there a number defects per unit. This control
charts controls the number of defects per unit. Here the sample size should be
constant. This calculate as below.
UCL = c + 3 c and LCL = c - 3 c
Where the c = inspectedsamplesofnumberTotal
samplestheallindefectsofnumberTotal
0
5
10
15
20
25
45
1 2 3 4 5 6 7 8 9 10LCL = 0
UCL = 42.6
R = 42.6
Number of samples
Measurement of variables
www.jntuworld.com
www.jntuworld.com

Ex:
Sample Number No. of defects Sample Number No. of defects
1
2
3
4
5
6
7
8
9
10
5
4
9
7
8
9
4
5
2
6
11
12
13
14
15
16
17
18
19
20
4
6
7
3
5
3
3
1
7
2
Total number of defects = 100
c = 520
100=
UCL = c + 3 c = 5 + 3 5 = 11.69
LCL = c - 3 c = 5 - 3 5 = 0
LCL = 0 means, LCL got negative value, take it as equal to zero
0
4
6
8
10
15
20
4 6 12 14 15 18
5
2
2 8 10 20 LCL = 0
UCL = 11.69
Number of samples
No. defects per each sampled unit
c = 5
www.jntuworld.com
www.jntuworld.com

‘P’ Chart: ‘P’ Chart is used where there is date about the number of defectives
per sample. It is also called fraction defective chart or percentage defectives
chart. Here each item is classified on ‘go or no go’ basis that is good or bad.
Hence if the sample size is larger, the results could be better.
UCL =
LCL =
Where average defective ( p ) = inspectedpiecesofnoTotal
founddefectiveofnoTotal
.
.
‘n’ = Number of pieces inspected per day
Ex: For each of the 14 days a number of magnets used in electric relays are
inspected and the number of defectives is recorded. The total number of
magnets tested is 14,000. The following are the particular of the number of
defectives found every day.
Day number Number of
defective Day number
Number of
defective
1 2 3 4 5 6 7
100 50
150 200 150 50 80
8 9
10 11 12 13 14
120 60
140 50 70 40 40
Solution:
Total number of defectives = 14000
The average sample size(n) per day= 14000/14 days = 1000
Percentage of defective per day = dayperinspectedpiecesofnoTotal
dayperfounddefectiveofnoTotal
.
.
Day
number
Percentage of
defectives
Number of
defective
Percentage of
defectives
Day
number
Number of
defective
1 2 3 4 5 6 7
100/1000=0.10 50/1000 =0.05 150/1000=0.15 200/1000=0.20 150/1000=0.15 50/1000 =0.05 80/1000 =0.08
100 50
150 200 150 50 80
120/1000=0.12 60/1000 =0.06 140/1000=0.14 50/1000 =0.05 70/1000 =0.07 40/1000 =0.04 140/1000=0.14
8 9
10 11 12 13 14
120 60
140 50 70 40 40
www.jntuworld.com
www.jntuworld.com

( p ) = inspectedpiecesofnoTotal
founddefectiveofnoTotal
.
.
1400/14000 = 0.1
UCL = 0.1 + 3( )
1000
1.011.0 −
= 0.4
LCL = 0.1 - 3( )
1000
1.011.0 −
= 0
Acceptance Sampling: Acceptance sampling is a technique of deciding
whether to accept the whole lot or not based on the number of defectives from a
random drawn sample.
It is widely use in buying food products, such as rice, wheat etc. Before
buying the random samples drawn from the bags of say rice are tested. If the
quality of sample drawn looks good or free from defects then according to the
requirement the entire bag or part of it can be brought
The process of acceptance sampling through operating characteristic
curve (OCC)
Day Number
1 5 10 15
Percentage of defective
0.45
0.40
0.30
0.20
0.15
0.10
0.05
1.0=p
LCL = 0
UCL = 0.4
www.jntuworld.com
www.jntuworld.com

Operating characteristic curve (OCC): The graphical relationship between
percentage defective in the lots being submitted for inspection and the
probability acceptance is termed as “operating characteristic of a particular
sampling plan”
C = 1 (Acceptance number) n = 50 (sample size) It gives a clear picture about the probability of acceptance of lot for
various values of percent defectives in the lot. The probability of acceptance
of a lot is high for low values of actual percentage decrease and it is low for
high values of actual percentage defectives.
Construction of OC curve: To develop a sampling plan for acceptance
sampling, an appropriate O.C curve must be selected to construct an OC
curve an agreement has to be reached between the producer and the
consumer on the following four point.
1) Acceptable quality level (AQL): This is the maximum proportion of
defectives that will make the lot definitely acceptable.
2) Lot tolerance percentage defective (LTPD): This is the maximum
proportion of defectives that will make the lot definitely unacceptable.
3) Producers risk (α): This is the risk, the producer is willing to take that lots
of the quality level AQL will be rejected, even though, they are acceptable
usually α = 5%
100
80
60
40
20
1 2 3 4 5 6 7 8 9 10
Actual percentage of defectives
Probability of acceptance percentage
www.jntuworld.com
www.jntuworld.com

4) Consumer risk (β): This is the risk, the consumer is willing to take that lots
of the quality level LTPD will be accepted, event though, they are actually
unacceptable usually β = 10%.
α AQL = 20% LTPD = 60% β Sampling plans: Based on the number of samples drawn for taking accept/
reject decisions, the sampling methods are used. There are four methods of
acceptance samplings.
1) Single sampling plan: A lot is accepted or rejected on the basis of a single
sample drawn from that cost
2) Double sampling plan: If it is not possible to decide the fate of the lot on
the basis of first sample, a second sample is drawn and the decision is taken
on the basis of the combined results of first and second sample.
3) Multiple sampling plan: A lot is accepted or rejected based upon the result
obtained from several samples (of parts) drawn from the lot.
4) Sequential sampling plan: (Item by item analysis)
Sequential sampling involves increasing the sample size by one part at
a time till the sample becomes large enough and contains sufficient number
of defectives to decide intelligently whether to accept or reject the lot.
20% 60% 100%
Percentage of defectives (p)
Probability of acceptance
Consumers risk β = 10%
Producers risk α = 10%
www.jntuworld.com
www.jntuworld.com
Recommended