Unit 3 - Investing: Unit 3 - Investing: Making Money Work for YouMaking Money Work for You
Mr. Vogel
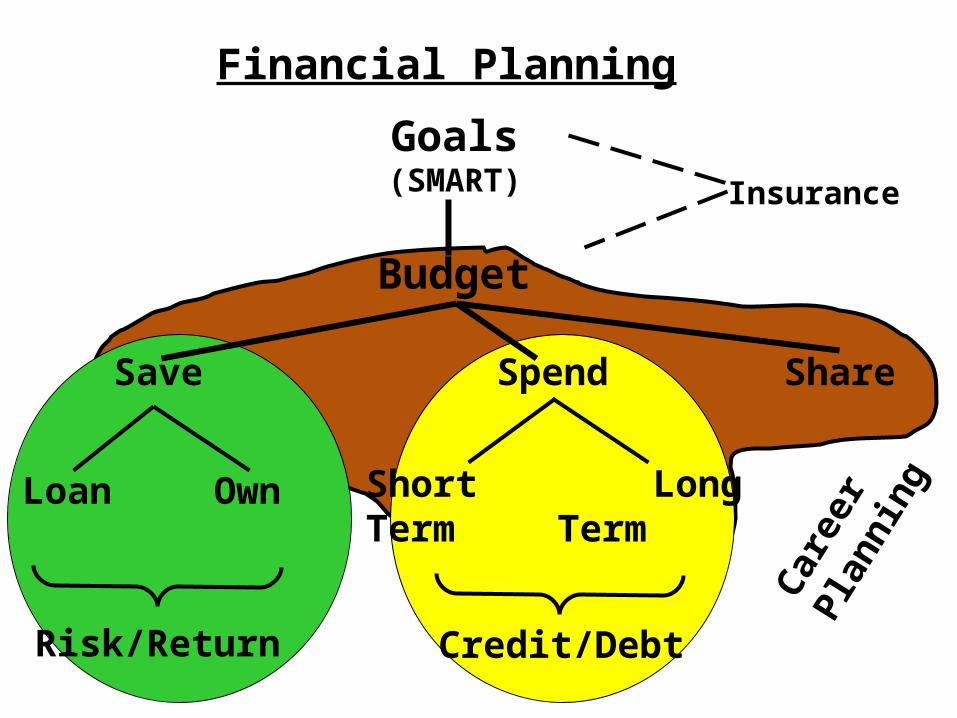
Financial Planning
Goals(SMART)
Budget
Save Spend Share
Loan Own Short LongTerm Term
Risk/Return Credit/Debt
Car
eer
Plan
ning
Insurance
Credit/Debt - Review
Is it part of your Plan (Budget) ???
Use Emergency Fund for your emergencies
Use Insurance for any catastrophies
Concept of Compounding – time and interest rate
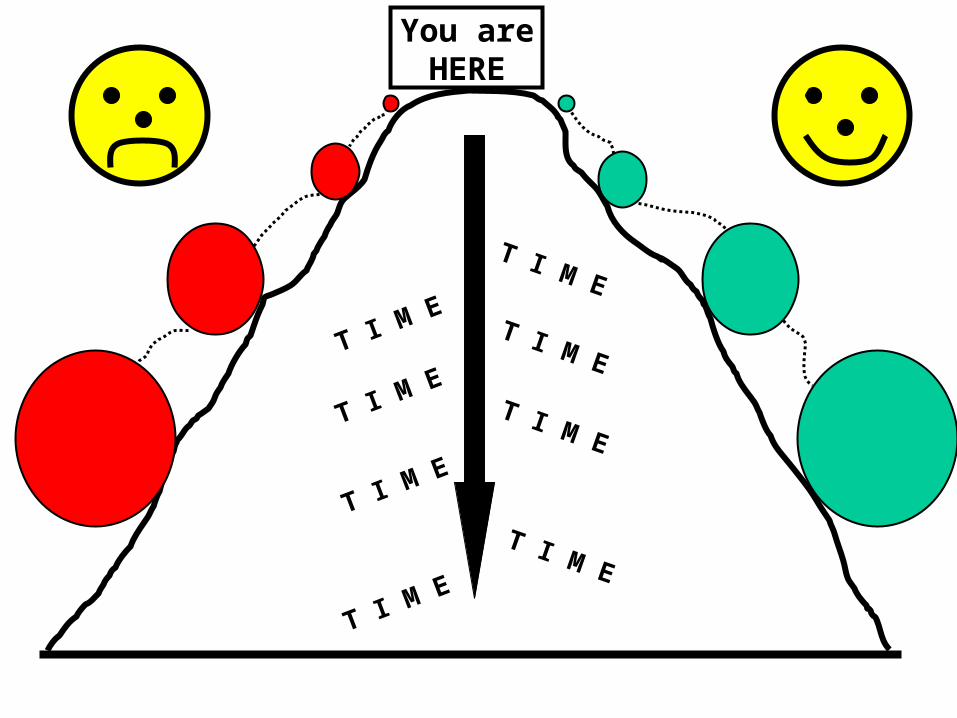
T I M E
You areHERE
T I M E
T I M E
T I M E
T I M E
T I M E
T I M E
T I M E
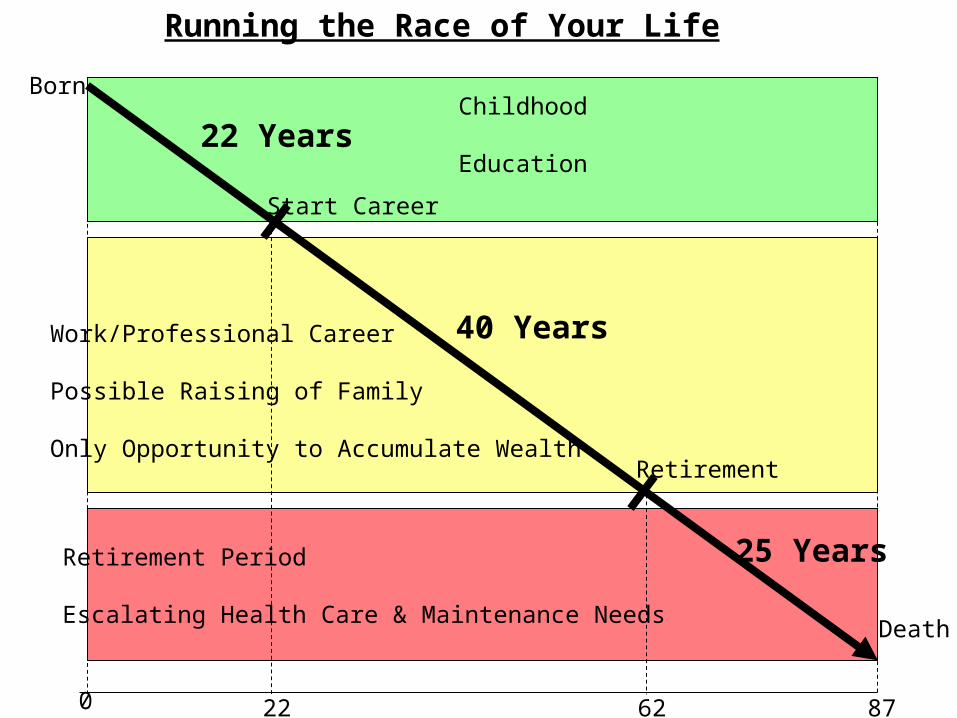
Born
Start Career
Retirement
Death
0 22 62 87
22 Years
40 Years
25 Years
Childhood
Education
Work/Professional Career
Possible Raising of Family
Only Opportunity to Accumulate Wealth
Retirement Period
Escalating Health Care & Maintenance Needs
Running the Race of Your Life
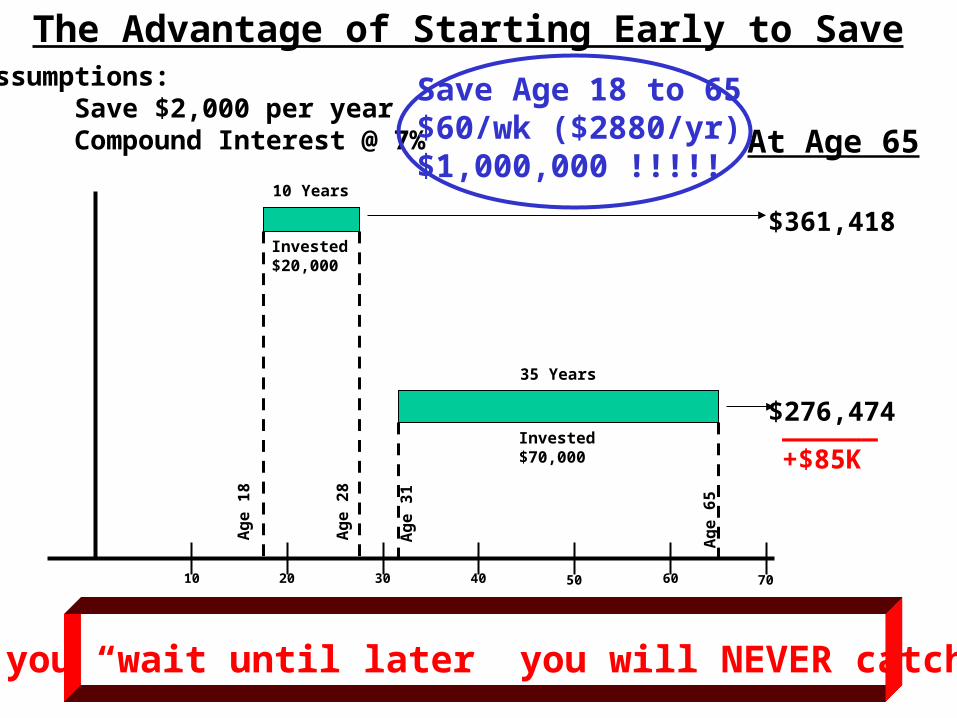
10 20 30 40 50 60 70
Ag e
18
Age
28
10 Years
Invested$20,000
Age
31
Age
65
35 Years
Invested$70,000
$276,474
$361,418
At Age 65
Assumptions: Save $2,000 per year Compound Interest @ 7%
The Advantage of Starting Early to Save
______+$85K
Save Age 18 to 65$60/wk ($2880/yr)$1,000,000 !!!!!
If you “wait until later” you will NEVER catch up
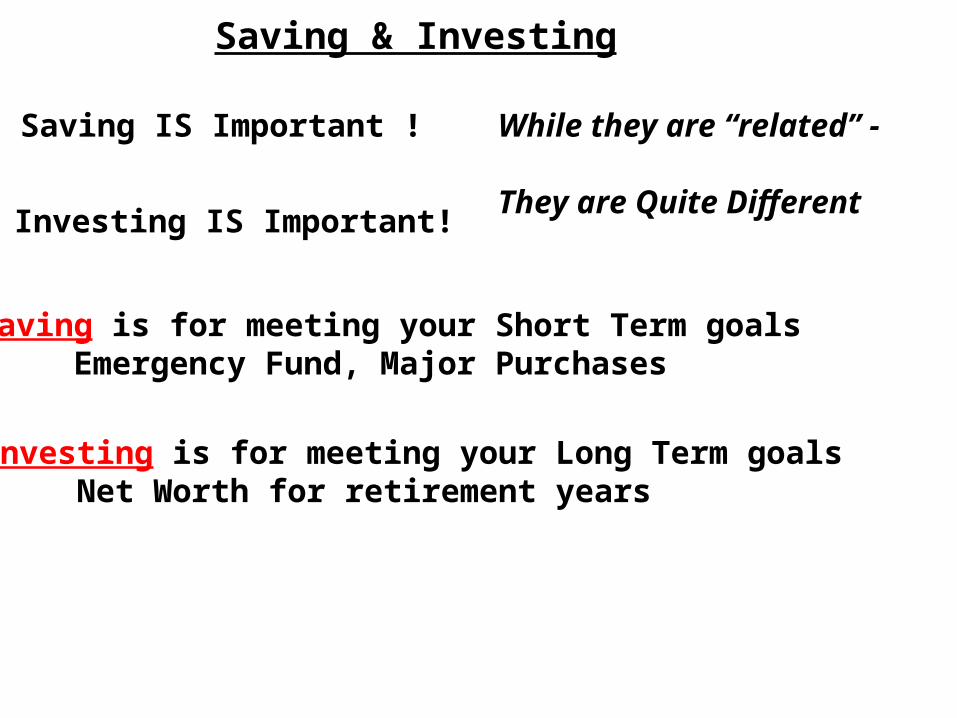
Saving & Investing
Saving IS Important !
Investing IS Important!
While they are “related” -
They are Quite Different
Saving is for meeting your Short Term goalsEmergency Fund, Major Purchases
Investing is for meeting your Long Term goalsNet Worth for retirement years
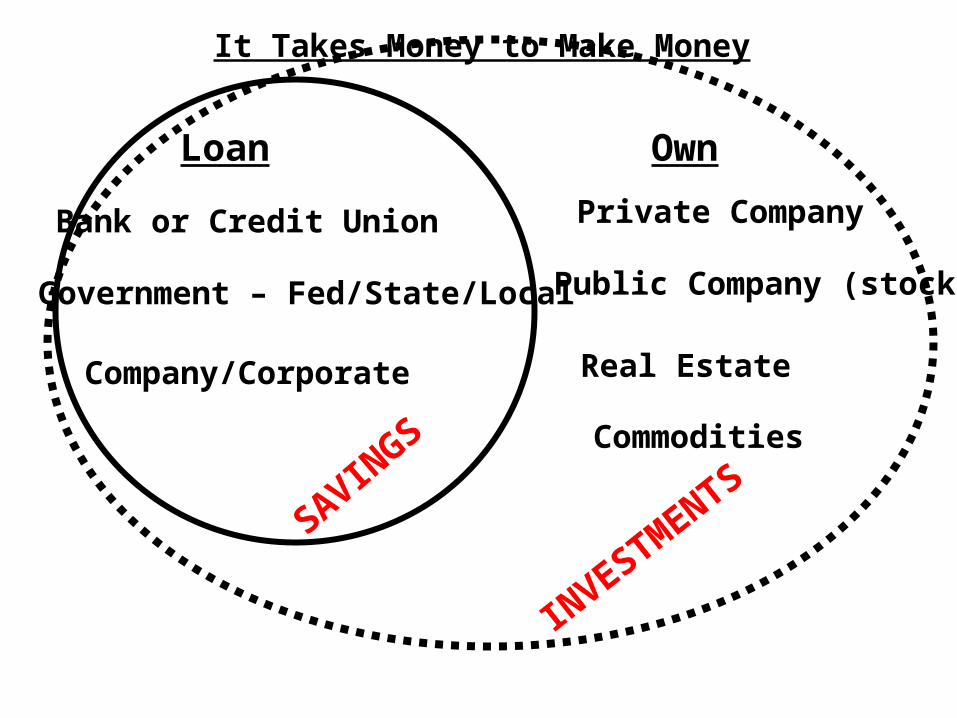
It Takes Money to Make Money
Loan Own
Bank or Credit Union
Government – Fed/State/Local
Company/Corporate
Private Company
Public Company (stock)
Real Estate
Commodities
SAVINGS
INVESTM
ENTS
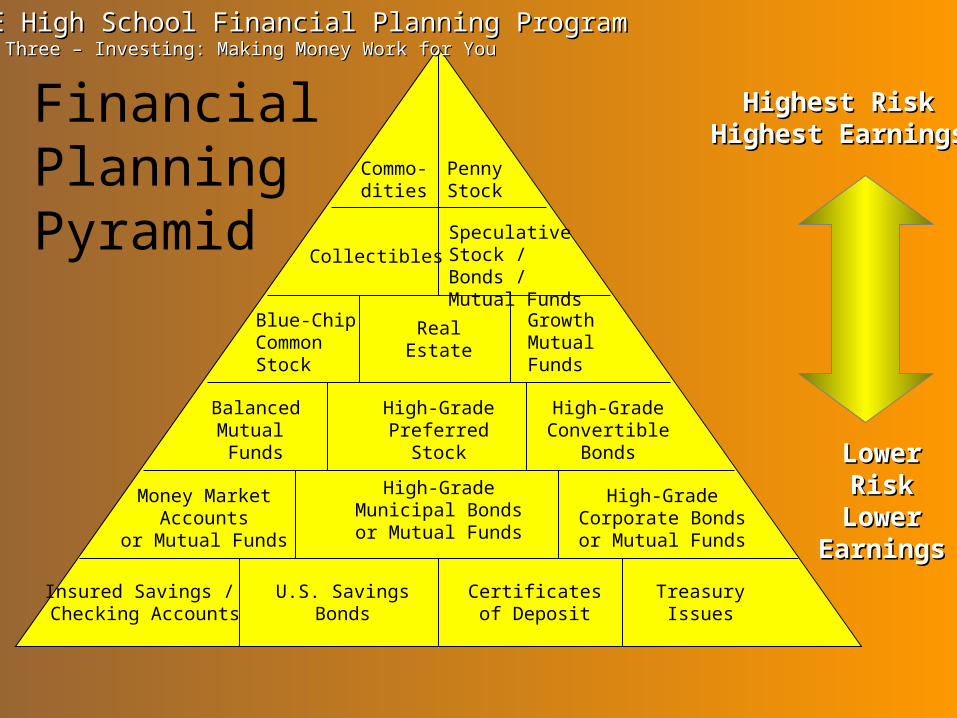
FinancialPlanningPyramid
PennyStock
Commo- dities
CollectiblesSpeculative Stock / Bonds /Mutual Funds
RealEstate
Blue-ChipCommonStock
GrowthMutual Funds
High-GradeConvertible
Bonds
High-GradePreferred
Stock
BalancedMutual Funds
High-GradeCorporate Bondsor Mutual Funds
High-GradeMunicipal Bondsor Mutual Funds
Money MarketAccounts
or Mutual Funds
Certificatesof Deposit
U.S. SavingsBonds
Insured Savings / Checking Accounts
TreasuryIssues
Highest RiskHighest RiskHighest EarningsHighest Earnings
Lower Lower RiskRisk
Lower Lower EarningsEarnings
NEFE High School Financial Planning ProgramNEFE High School Financial Planning ProgramUnit Three – Investing: Making Money Work for YouUnit Three – Investing: Making Money Work for You
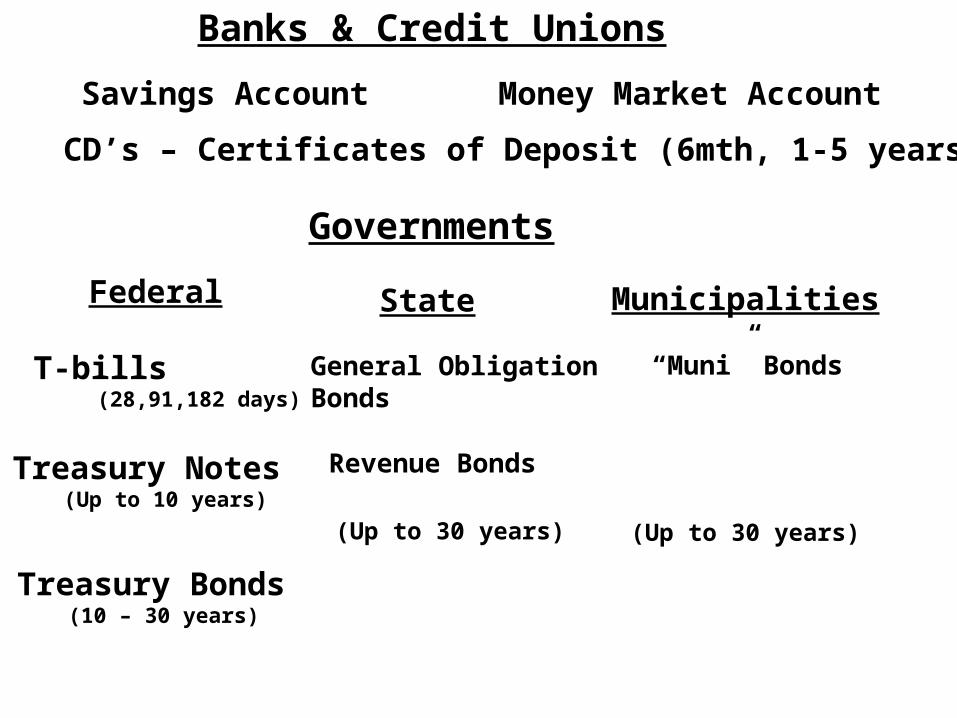
Banks & Credit Unions
Savings Account Money Market Account
CD’s – Certificates of Deposit (6mth, 1-5 years)
Governments
Federal
T-bills (28,91,182 days)
Treasury Notes (Up to 10 years)
Treasury Bonds (10 – 30 years)
State
General ObligationBonds
Revenue Bonds
(Up to 30 years)
Municipalities
“Muni” Bonds
(Up to 30 years)
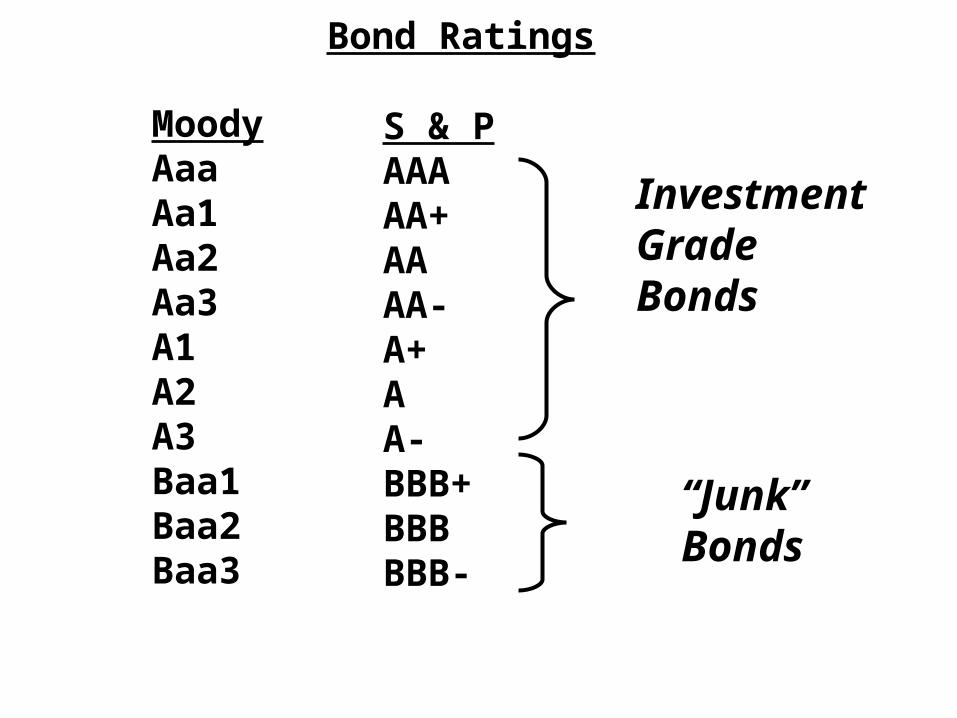
Bond Ratings
MoodyAaaAa1Aa2Aa3A1A2A3Baa1Baa2Baa3
S & PAAAAA+AAAA-A+AA-BBB+BBBBBB-
InvestmentGrade Bonds
“Junk”Bonds
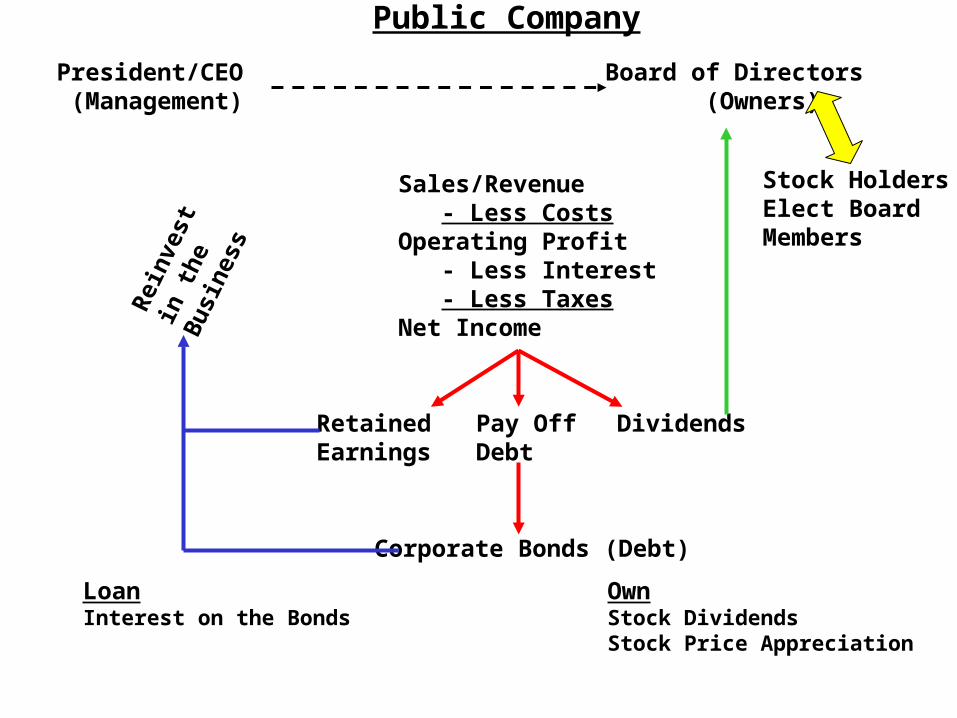
Public Company
President/CEO (Management)
Board of Directors (Owners)
Sales/Revenue - Less CostsOperating Profit - Less Interest - Less TaxesNet Income
RetainedEarnings
DividendsPay OffDebt
Corporate Bonds (Debt)
Rei
nves
t in
the
Bus
ines
s
LoanInterest on the Bonds
OwnStock DividendsStock Price Appreciation
Stock HoldersElect BoardMembers
Stock Certificate Example

StockExchange
S E L L E R S O F S T O C K
B U Y E R S O F S T O C K
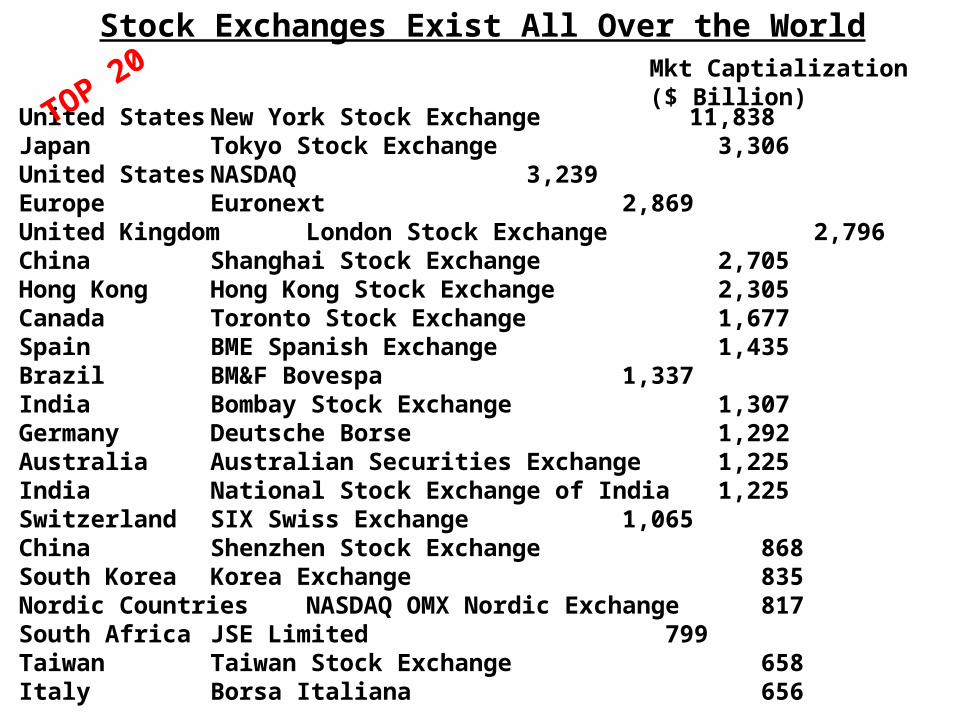
United States New York Stock Exchange 11,838Japan Tokyo Stock Exchange 3,306United States NASDAQ 3,239Europe Euronext 2,869United Kingdom London Stock Exchange 2,796China Shanghai Stock Exchange 2,705Hong Kong Hong Kong Stock Exchange 2,305Canada Toronto Stock Exchange 1,677Spain BME Spanish Exchange 1,435Brazil BM&F Bovespa 1,337India Bombay Stock Exchange 1,307Germany Deutsche Borse 1,292Australia Australian Securities Exchange 1,225India National Stock Exchange of India 1,225Switzerland SIX Swiss Exchange 1,065China Shenzhen Stock Exchange 868South Korea Korea Exchange 835Nordic Countries NASDAQ OMX Nordic Exchange 817South Africa JSE Limited 799Taiwan Taiwan Stock Exchange 658Italy Borsa Italiana 656
Stock Exchanges Exist All Over the WorldMkt Captialization($ Billion)TOP 20
-60
-40
-20
0
20
40
60
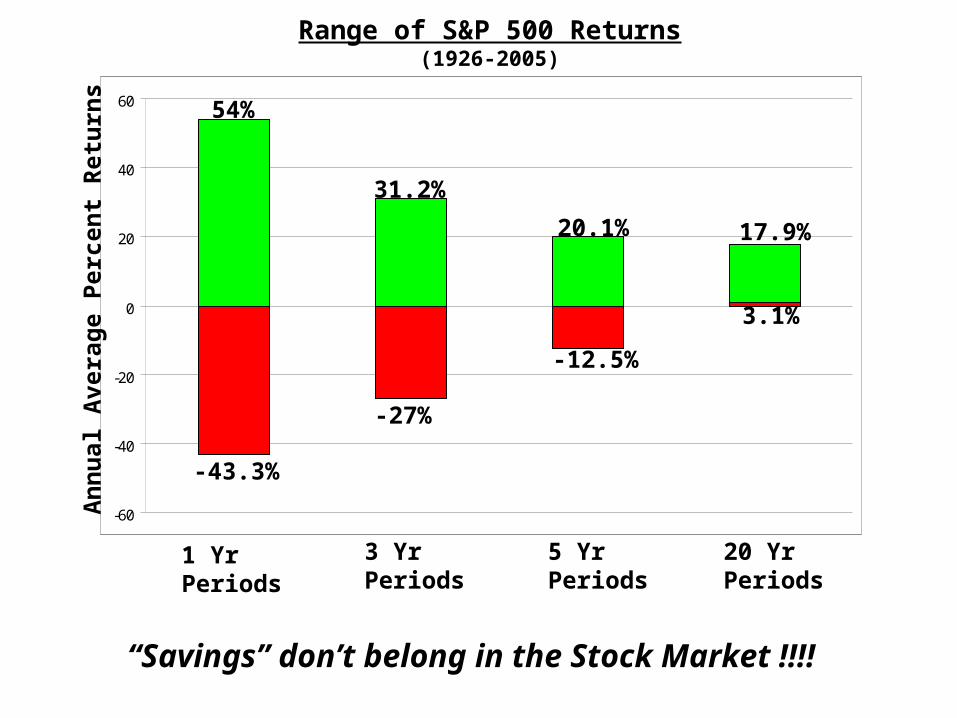
Range of S&P 500 Returns(1926-2005)
1 YrPeriods
3 YrPeriods
5 YrPeriods
20 YrPeriods
54%
-43.3%
31.2%
-27%
20.1%
-12.5%
17.9%
3.1%
An
nual
Ave
rage
Per
cent
Ret
urn
s
“Savings” don’t belong in the Stock Market !!!!
-8
-6
-4
-2
0
2
4
6
8
10
1 2 3 4 5
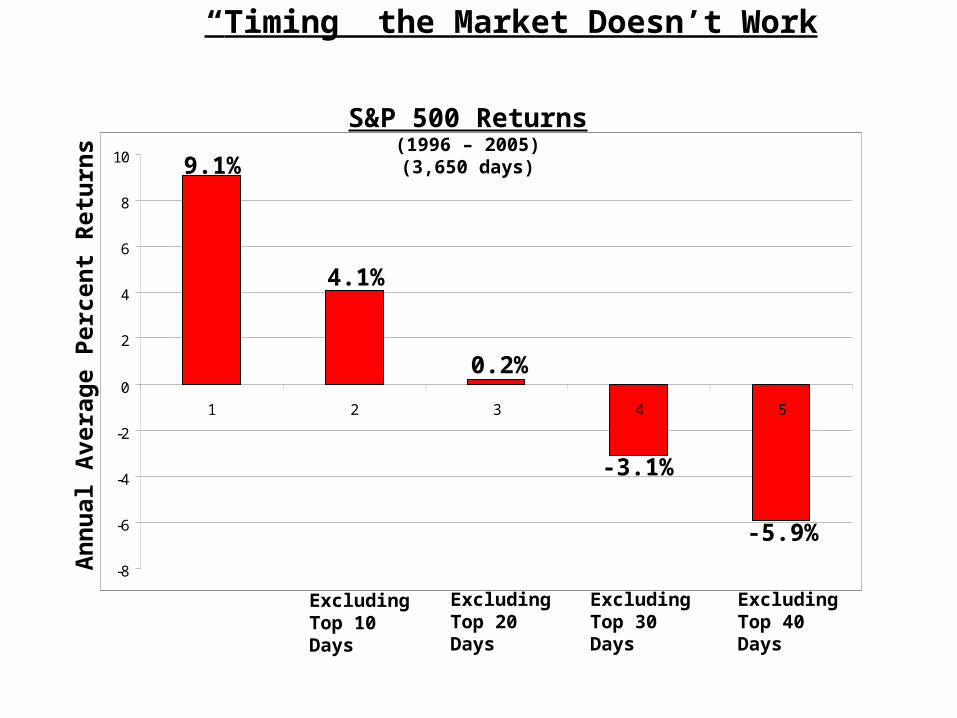
S&P 500 Returns(1996 – 2005)(3,650 days)9.1%
4.1%
0.2%
-3.1%
-5.9%
An
nual
Ave
rage
Per
cent
Ret
urn
s
ExcludingTop 10Days
ExcludingTop 20Days
ExcludingTop 30Days
ExcludingTop 40Days
“Timing” the Market Doesn’t Work
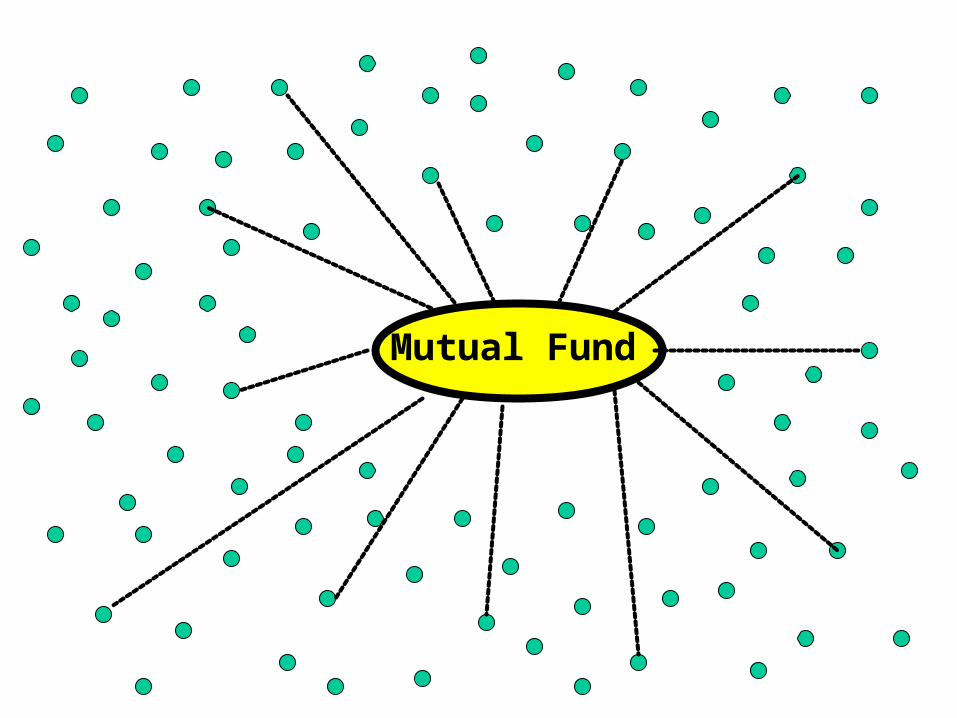
Mutual Fund
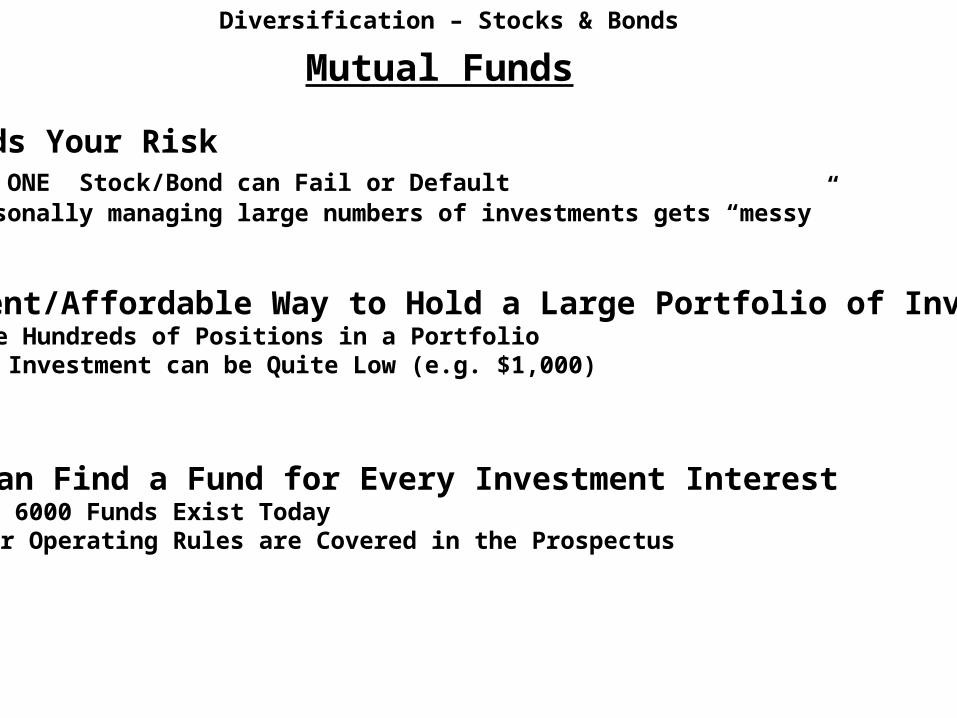
Diversification – Stocks & Bonds
Mutual Funds
Spreads Your Risk Any ONE Stock/Bond can Fail or Default Personally managing large numbers of investments gets “messy”
Convenient/Affordable Way to Hold a Large Portfolio of Investments Can Have Hundreds of Positions in a Portfolio Minimum Investment can be Quite Low (e.g. $1,000)
You Can Find a Fund for Every Investment Interest Over 6000 Funds Exist Today Their Operating Rules are Covered in the Prospectus
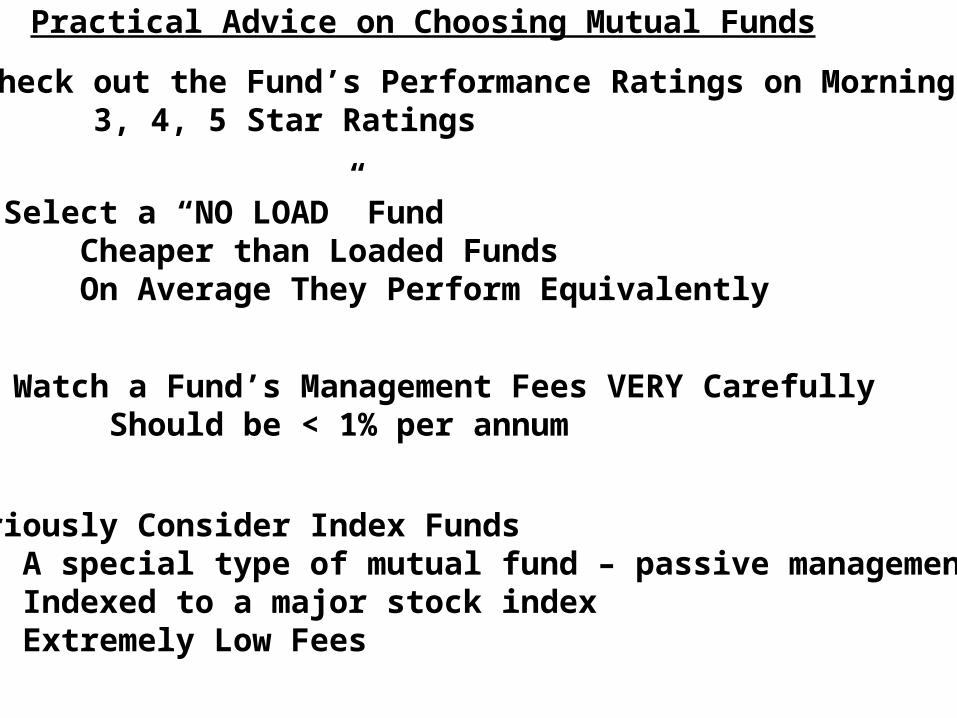
Practical Advice on Choosing Mutual Funds
Check out the Fund’s Performance Ratings on Morningstar 3, 4, 5 Star Ratings
Select a “NO LOAD” Fund Cheaper than Loaded Funds On Average They Perform Equivalently
Watch a Fund’s Management Fees VERY Carefully Should be < 1% per annum
Seriously Consider Index Funds A special type of mutual fund – passive management Indexed to a major stock index Extremely Low Fees
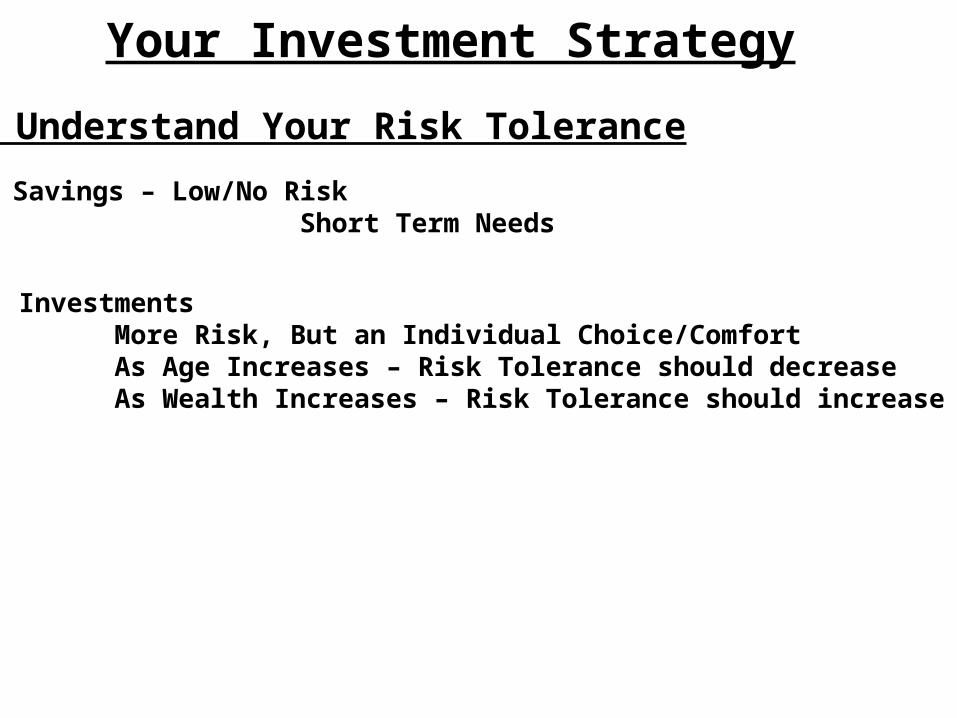
1. Understand Your Risk Tolerance
Savings – Low/No Risk Short Term Needs
Investments More Risk, But an Individual Choice/ComfortAs Age Increases – Risk Tolerance should decreaseAs Wealth Increases – Risk Tolerance should increase
Your Investment Strategy
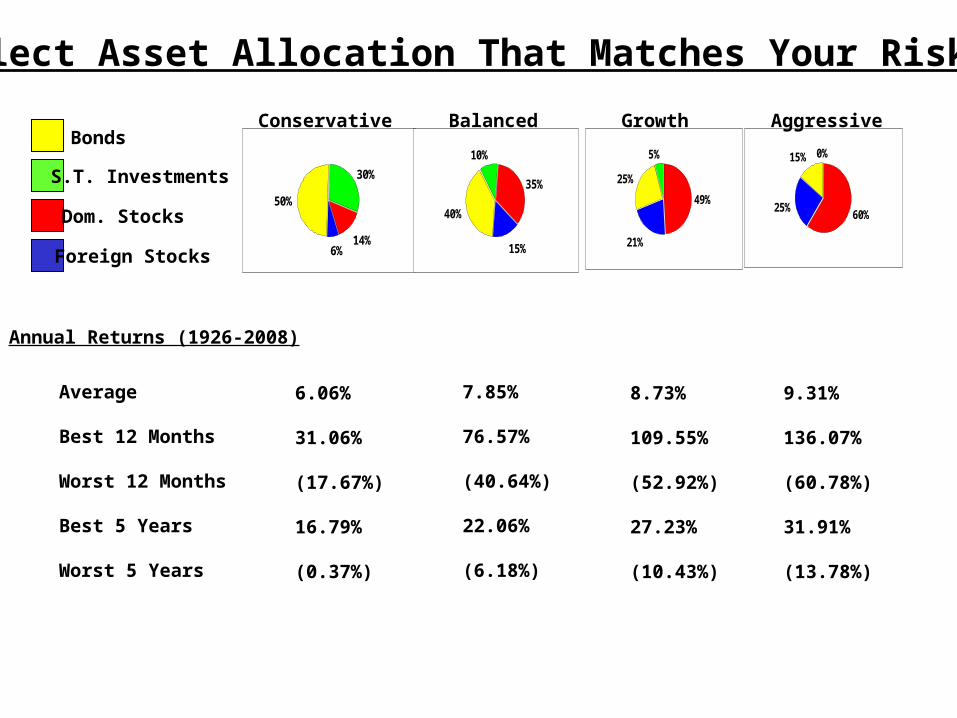
Bonds
S.T. Investments
Dom. Stocks
Foreign Stocks
50%
30%
14%6%
Conservative
40%
10%
35%
15%
Balanced
25%
5%
49%
21%
Growth
15% 0%
60%25%
Aggressive
Annual Returns (1926-2008)
Average
Best 12 Months
Worst 12 Months
Best 5 Years
Worst 5 Years
6.06%
31.06%
(17.67%)
16.79%
(0.37%)
7.85%
76.57%
(40.64%)
22.06%
(6.18%)
8.73%
109.55%
(52.92%)
27.23%
(10.43%)
9.31%
136.07%
(60.78%)
31.91%
(13.78%)
2. Select Asset Allocation That Matches Your Risk Target
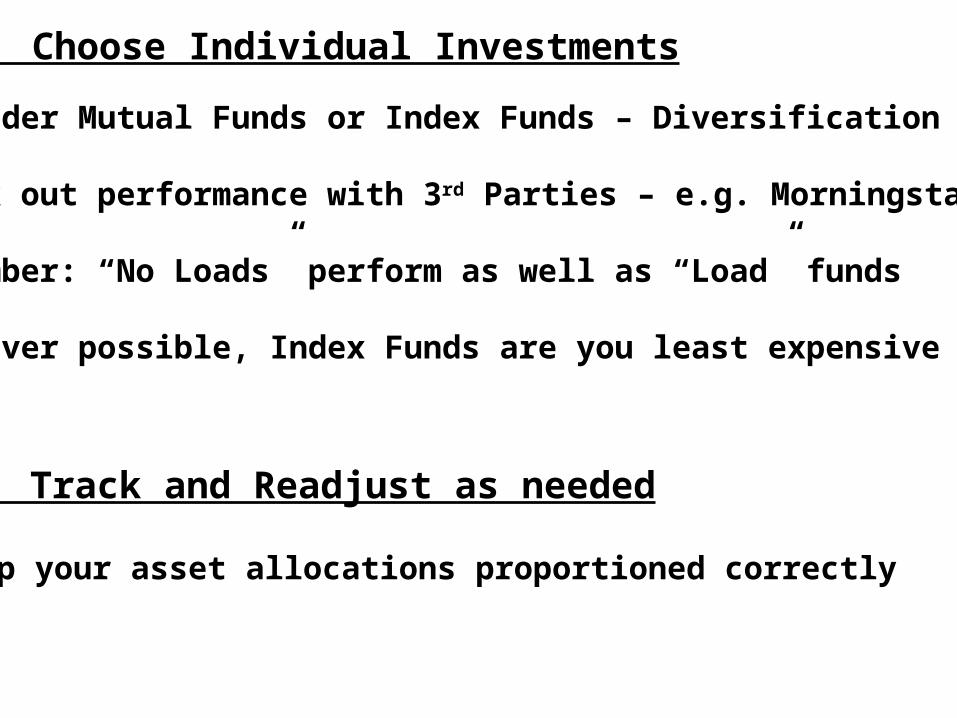
3. Choose Individual Investments
Consider Mutual Funds or Index Funds – Diversification
Check out performance with 3rd Parties – e.g. Morningstar
Remember: “No Loads” perform as well as “Load” funds
Wherever possible, Index Funds are you least expensive choice
4. Track and Readjust as needed
Keep your asset allocations proportioned correctly
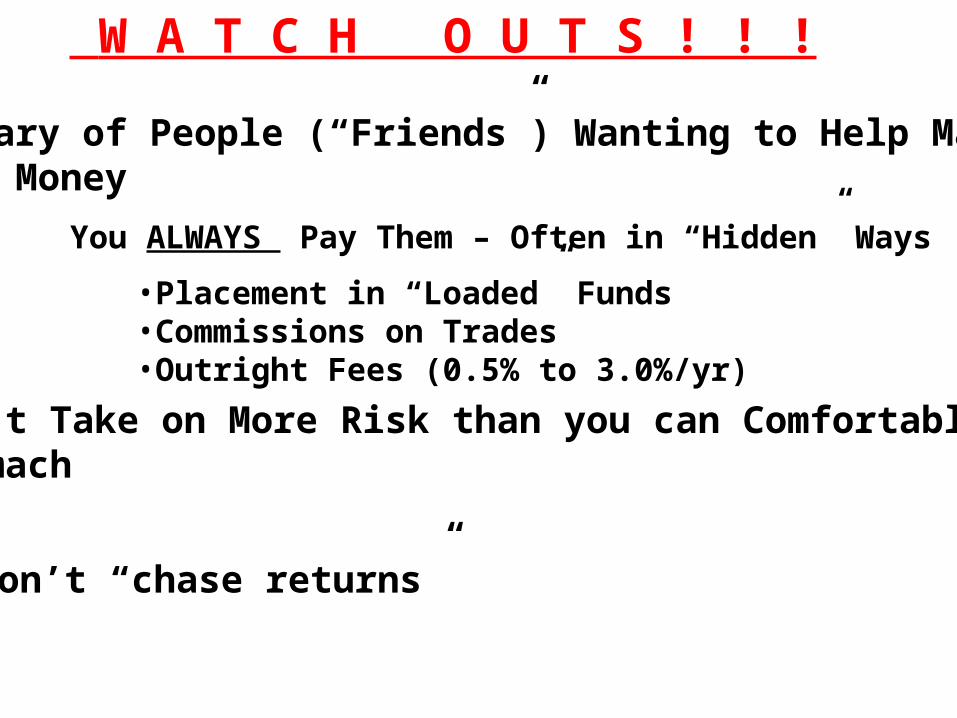
W A T C H O U T S ! ! !
Be Wary of People (“Friends”) Wanting to Help ManageYour Money
You ALWAYS Pay Them – Often in “Hidden” Ways
•Placement in “Loaded” Funds•Commissions on Trades•Outright Fees (0.5% to 3.0%/yr)
Don’t Take on More Risk than you can ComfortablyStomach
Don’t “chase returns”
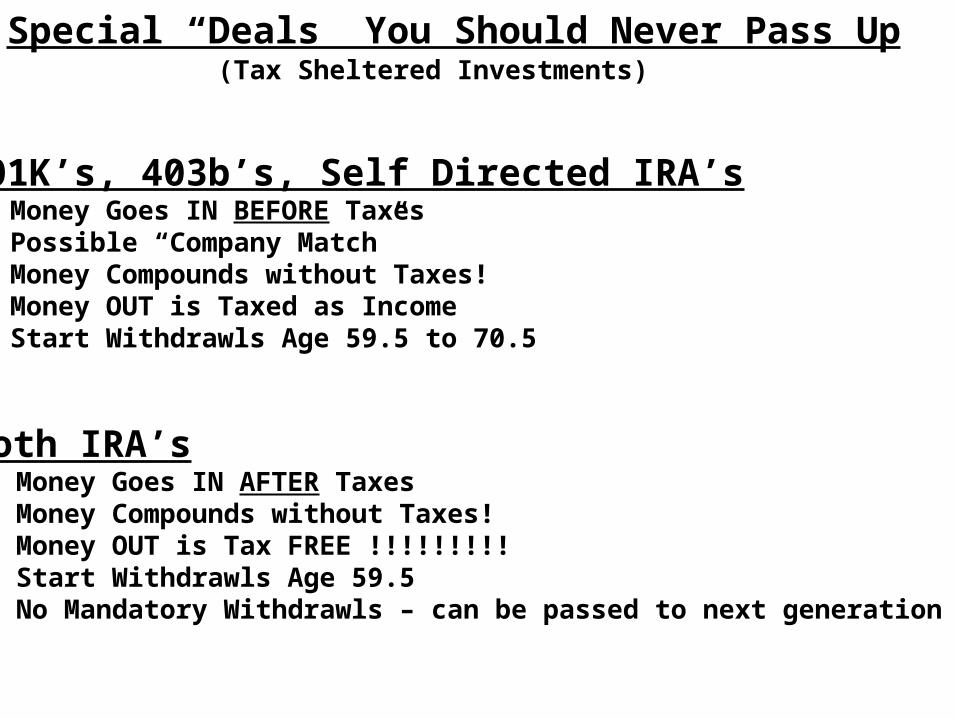
Special “Deals” You Should Never Pass Up(Tax Sheltered Investments)
401K’s, 403b’s, Self Directed IRA’sMoney Goes IN BEFORE TaxesPossible “Company Match”Money Compounds without Taxes!Money OUT is Taxed as IncomeStart Withdrawls Age 59.5 to 70.5
Roth IRA’sMoney Goes IN AFTER TaxesMoney Compounds without Taxes!Money OUT is Tax FREE !!!!!!!!!Start Withdrawls Age 59.5No Mandatory Withdrawls – can be passed to next generation
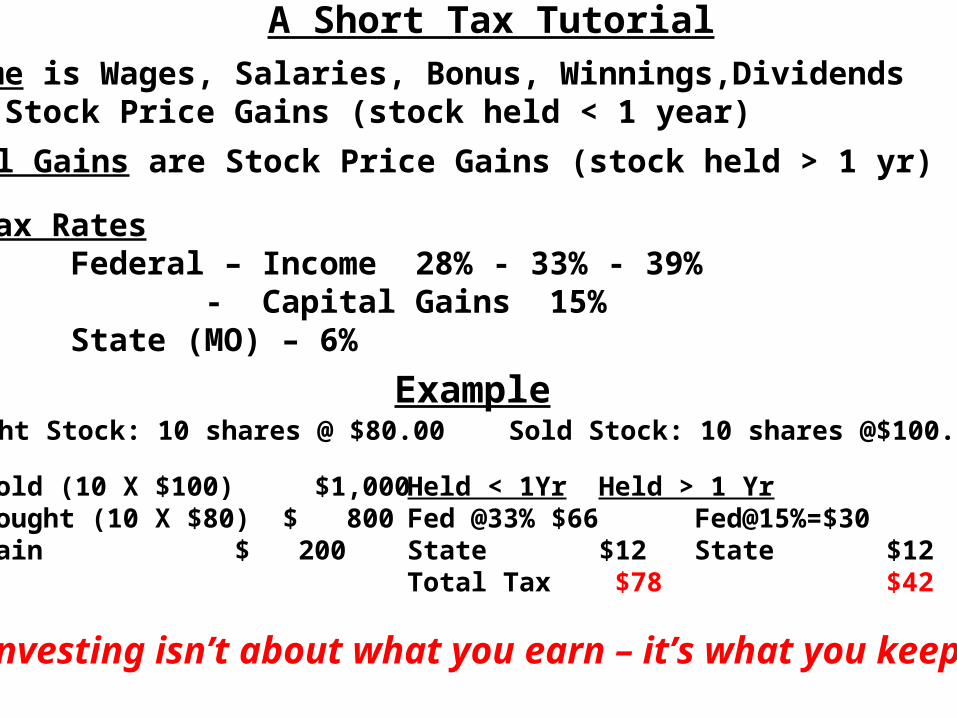
A Short Tax Tutorial
Tax RatesFederal – Income 28% - 33% - 39%
- Capital Gains 15%State (MO) – 6%
Income is Wages, Salaries, Bonus, Winnings,Dividends & Stock Price Gains (stock held < 1 year)
Capital Gains are Stock Price Gains (stock held > 1 yr)
ExampleBought Stock: 10 shares @ $80.00 Sold Stock: 10 shares @$100.00
Sold (10 X $100) $1,000Bought (10 X $80) $ 800Gain $ 200
Held < 1Yr Held > 1 YrFed @33% $66 Fed@15%=$30State $12 State $12Total Tax $78 $42
Investing isn’t about what you earn – it’s what you keep!

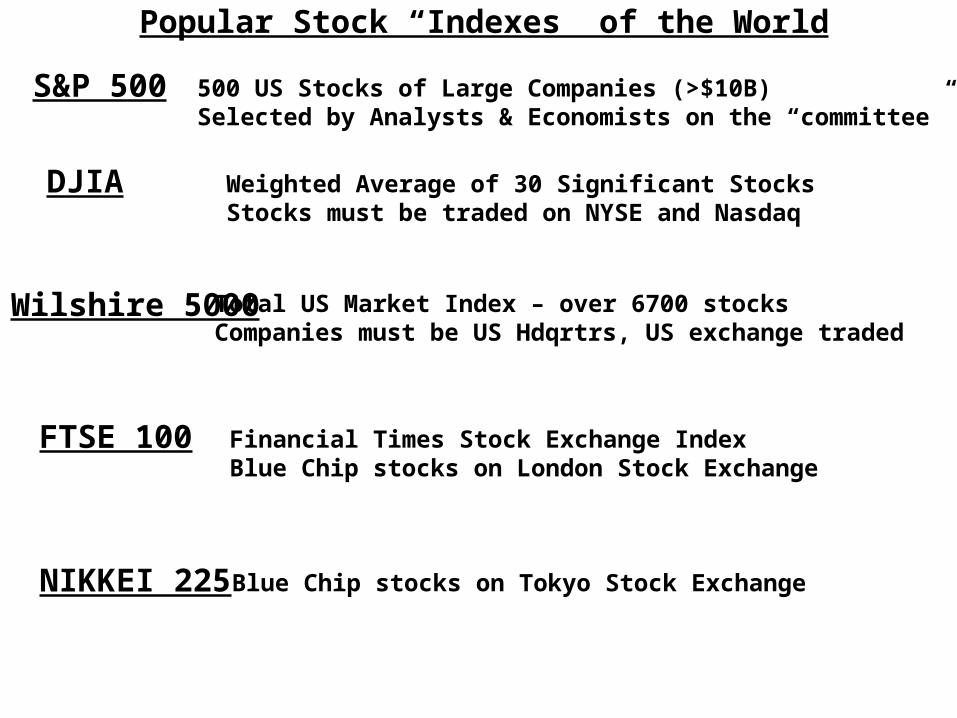
Popular Stock “Indexes” of the World
S&P 500 500 US Stocks of Large Companies (>$10B)Selected by Analysts & Economists on the “committee”
DJIA Weighted Average of 30 Significant StocksStocks must be traded on NYSE and Nasdaq
Wilshire 5000 Total US Market Index – over 6700 stocksCompanies must be US Hdqrtrs, US exchange traded
FTSE 100 Financial Times Stock Exchange IndexBlue Chip stocks on London Stock Exchange
NIKKEI 225 Blue Chip stocks on Tokyo Stock Exchange
Recommended