UNIT 1Motion Graphs
LyzinskiPhysics
x
t
Days 7 - 10

Day #7
* a-t graphs* “THE MAP”
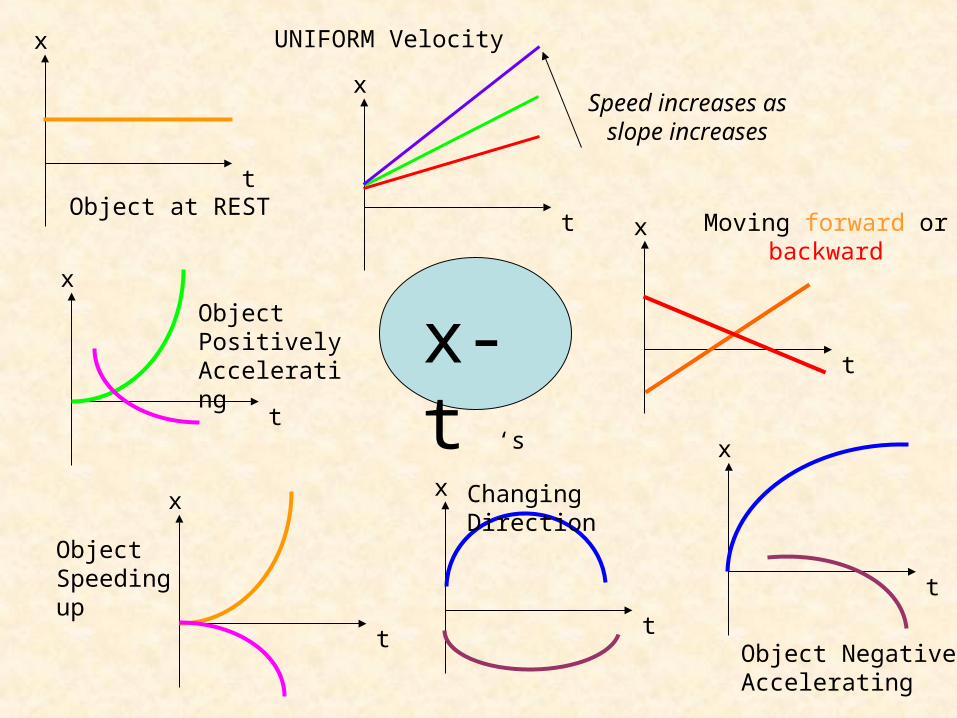
x
t
UNIFORM Velocity
Speed increases as slope increases
x
tObject at REST
x
t
Object Positively Accelerating
x
t
Object Negatively Accelerating
x
t
Moving forward or backward
x-t ‘s
x
t
Changing Directionx
t
Object Speeding up
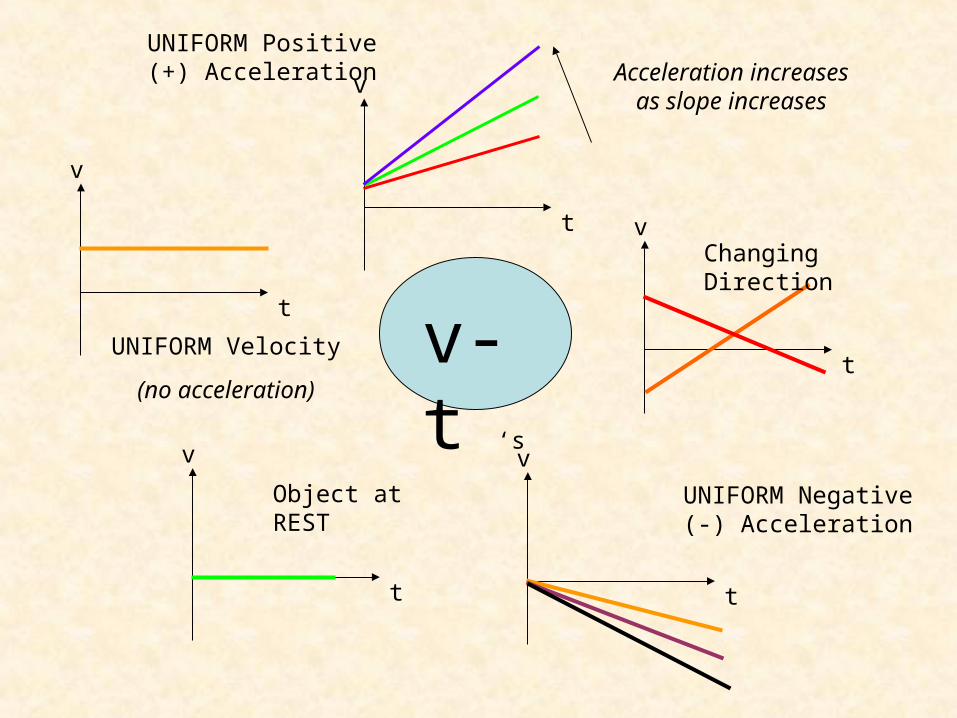
v
t
UNIFORM Positive (+) Acceleration Acceleration increases
as slope increases
v
t
UNIFORM Velocity
(no acceleration)
Object at REST
v
t
Changing Direction
v-t ‘s
v
t
UNIFORM Negative (-) Acceleration
v
t
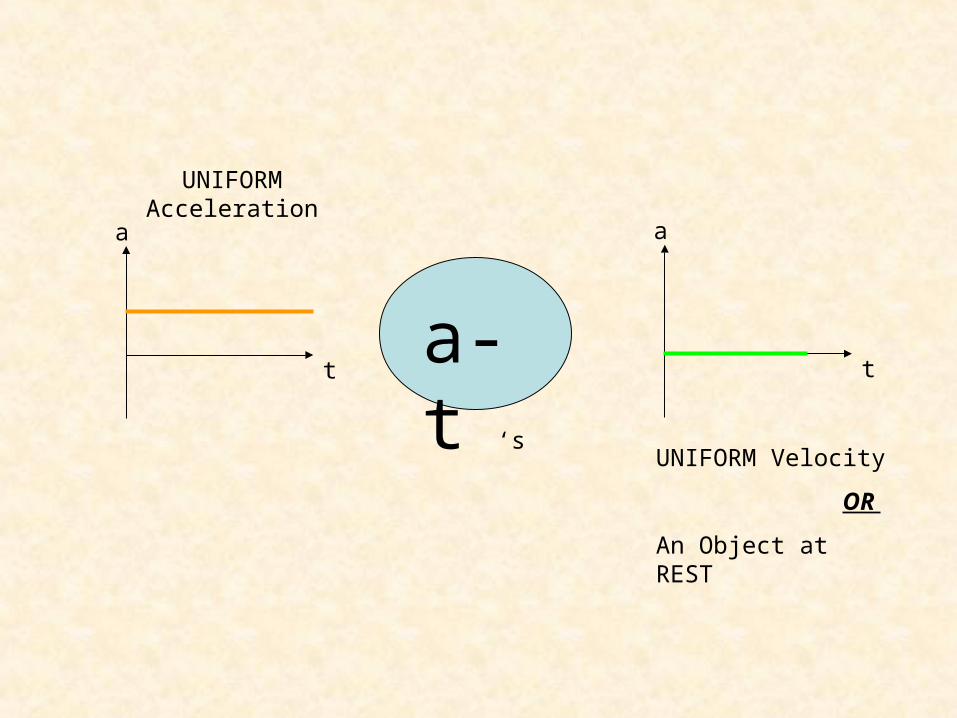
a
t
UNIFORM Acceleration
UNIFORM Velocity
OR
An Object at REST
a-t ‘s
a
t
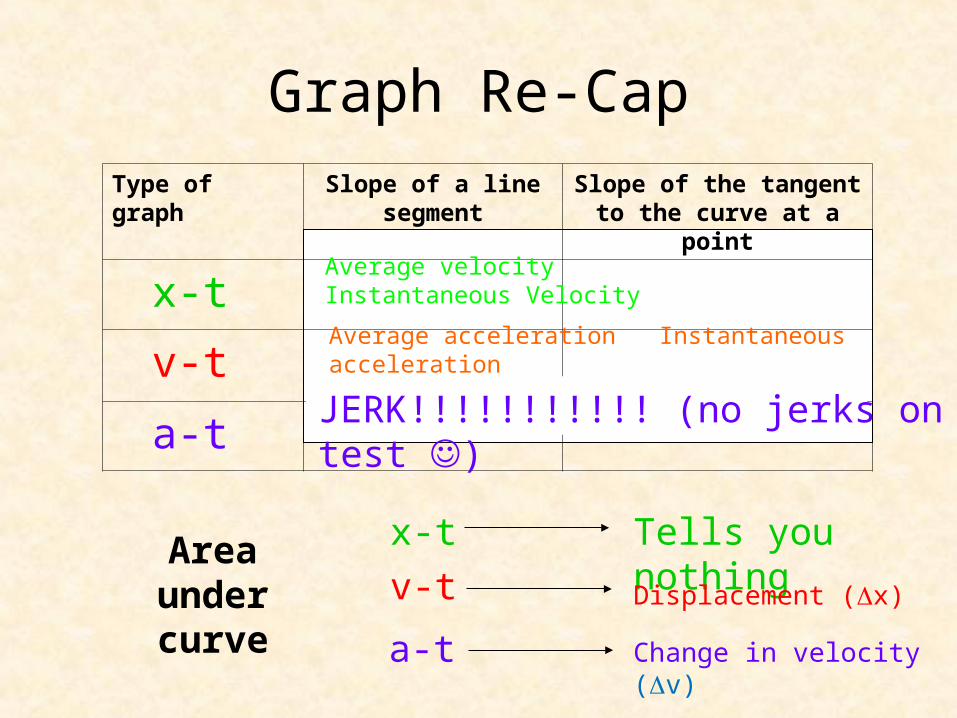
Graph Re-CapType of graph
Slope of a line segment
Slope of the tangent to the curve at a
point
x-t v-t a-t
Average velocity Instantaneous Velocity
Average acceleration Instantaneous acceleration
JERK!!!!!!!!!!! (no jerks on test )
Area under curve
x-t
v-t
a-t
Tells you nothingDisplacement (x)
Change in velocity (v)
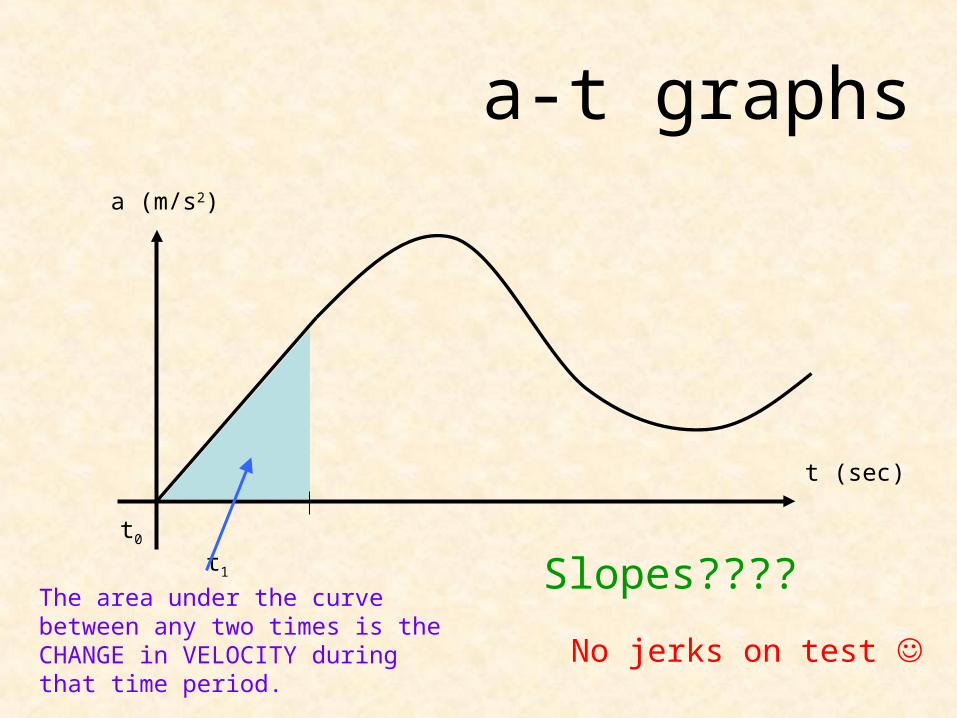
a-t graphs
t (sec)
a (m/s2)
t0 t1
The area under the curve between any two times is the CHANGE in VELOCITY during that time period.
Slopes????
No jerks on test
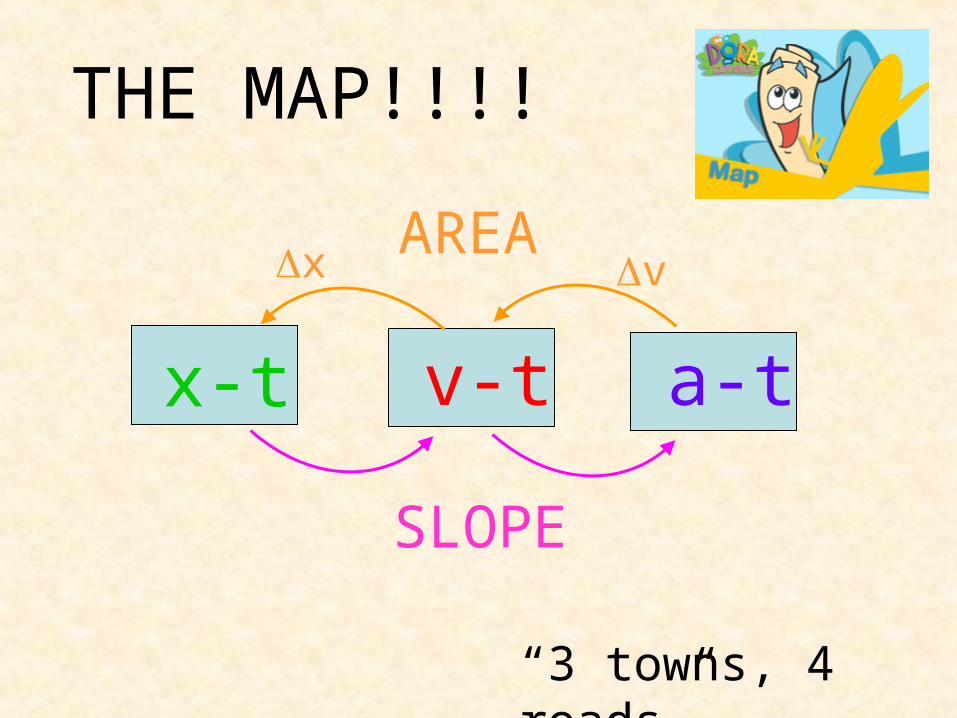
THE MAP!!!!
x-t v-t a-t
SLOPE
AREA
“3 towns, 4 roads”
x v
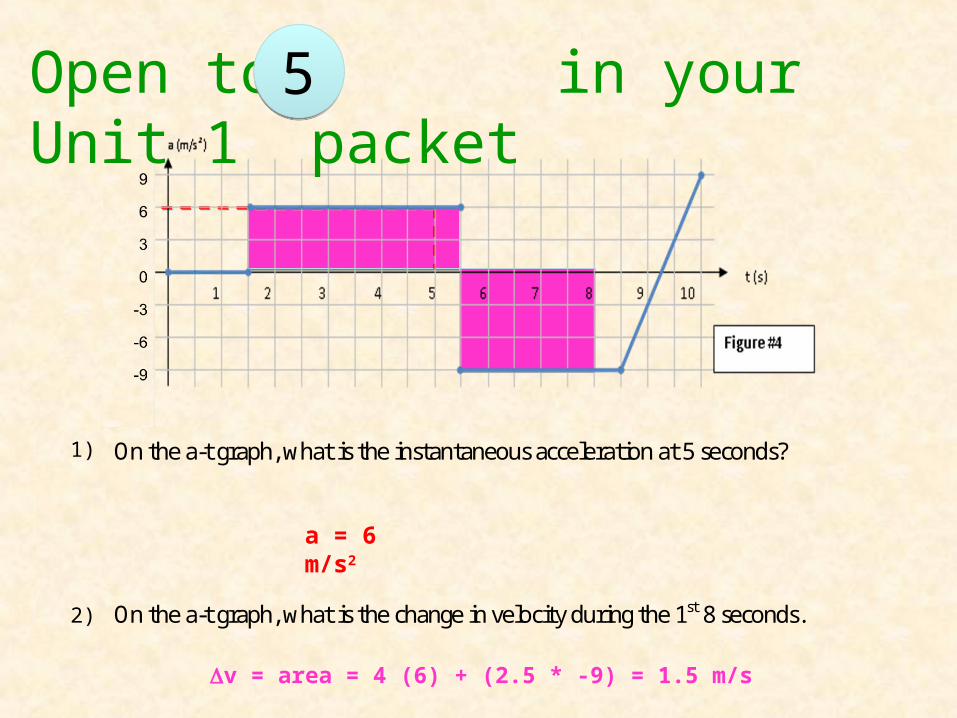
1) On the a-t graph, what is the instantaneous acceleration at 5 seconds?
2) On the a-t graph, what is the change in velocity during the 1st 8 seconds.
a = 6 m/s2
1)
2)
v = area = 4 (6) + (2.5 * -9) = 1.5 m/s
Open to in your Unit 1 packet5
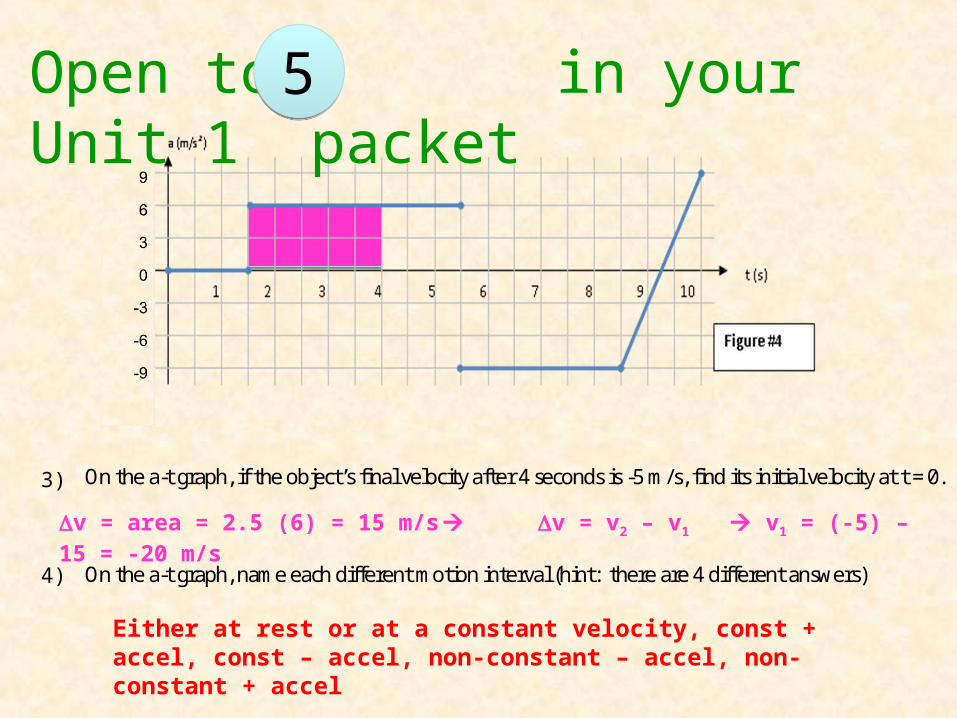
1) On the a-t graph, if the object’s final velocity after 4 seconds is -5 m/s, find its initial velocity at t = 0.
2) On the a-t graph, name each different motion interval (hint: there are 4 different answers)
Either at rest or at a constant velocity, const + accel, const – accel, non-constant – accel, non-constant + accel
3)
4)
v = area = 2.5 (6) = 15 m/s v = v2 – v1 v1 = (-5) – 15 = -20 m/s
Open to in your Unit 1 packet5

Day #8
FREE-FALL LAB

Day #9
Drawing Physics Graphs from word-problem scenarios
Day #10
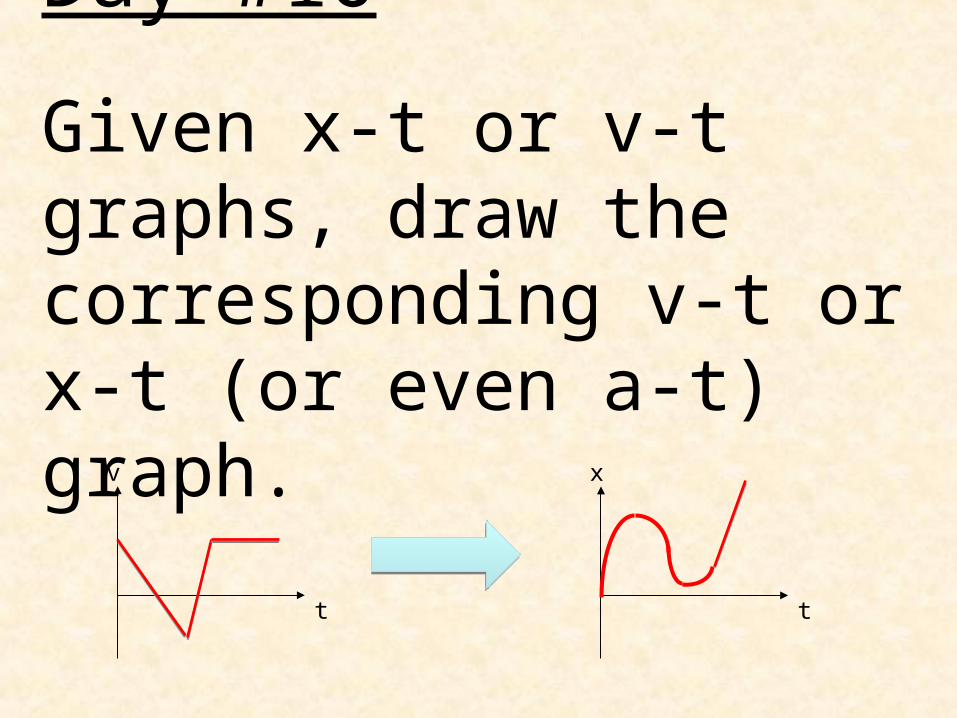
Given x-t or v-t graphs, draw the corresponding v-t or x-t (or even a-t) graph.
v
t
x
t
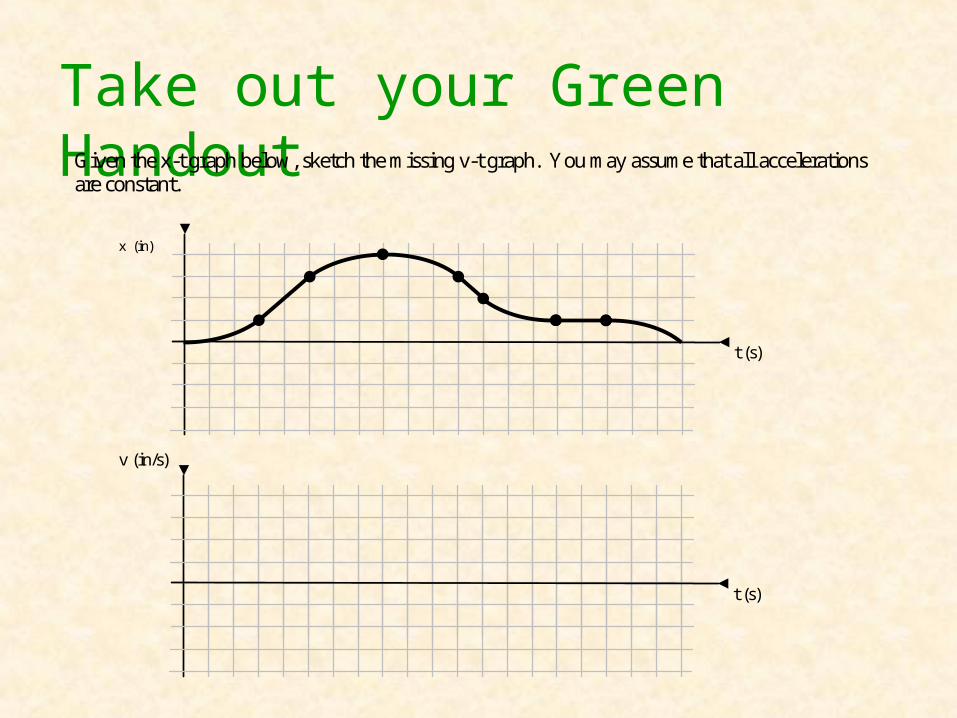
Take out your Green HandoutGiven the x-t graph below, sketch the missing v-t graph. You may assume that all accelerations are constant.
x (in)
t (s)
t (s)
v (in/s)
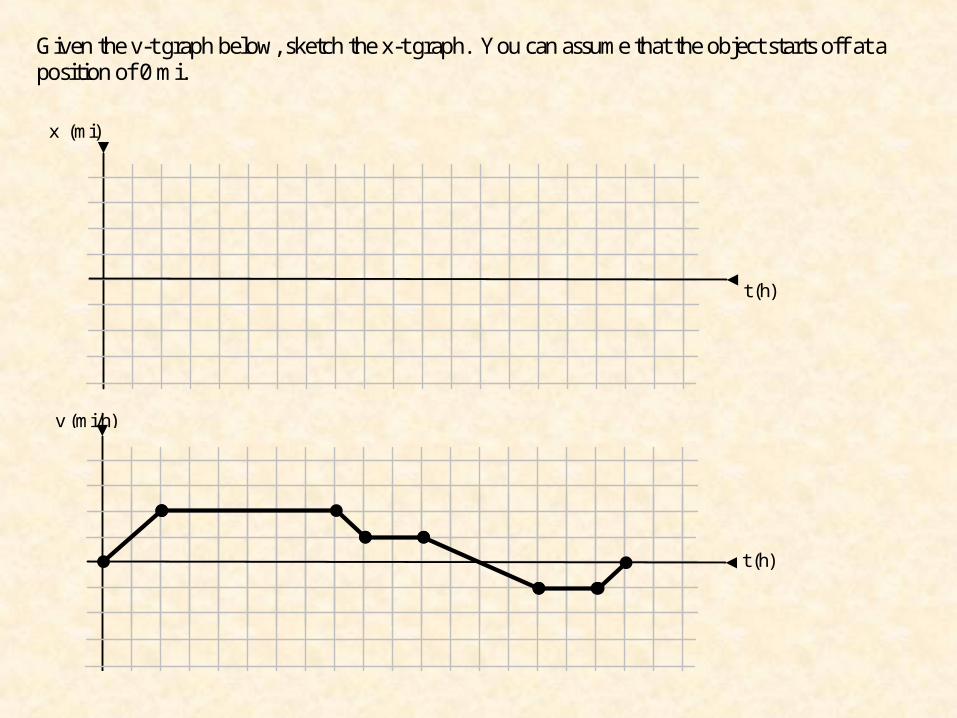
Given the v-t graph below, sketch the x-t graph. You can assume that the object starts off at a position of 0 mi.
x (mi)
t (h)
t (h)
v (mi/h)
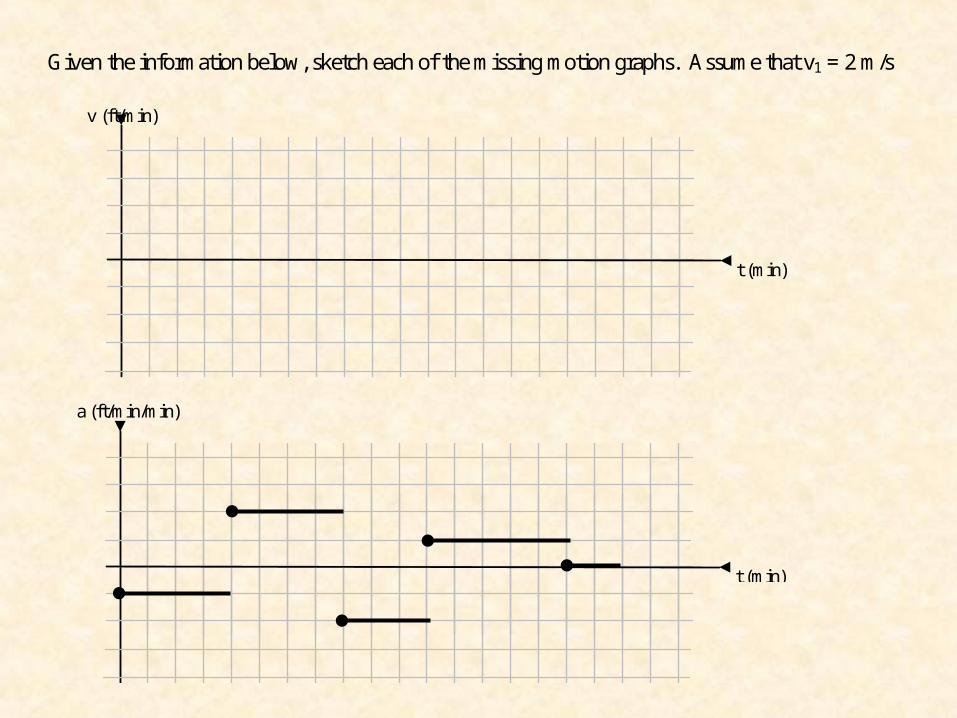
Given the information below, sketch each of the missing motion graphs. Assume that v1 = 2 m/s
t (min)
v (ft/min)
t (min)
a (ft/min/min)
Figures for In-Class Notes
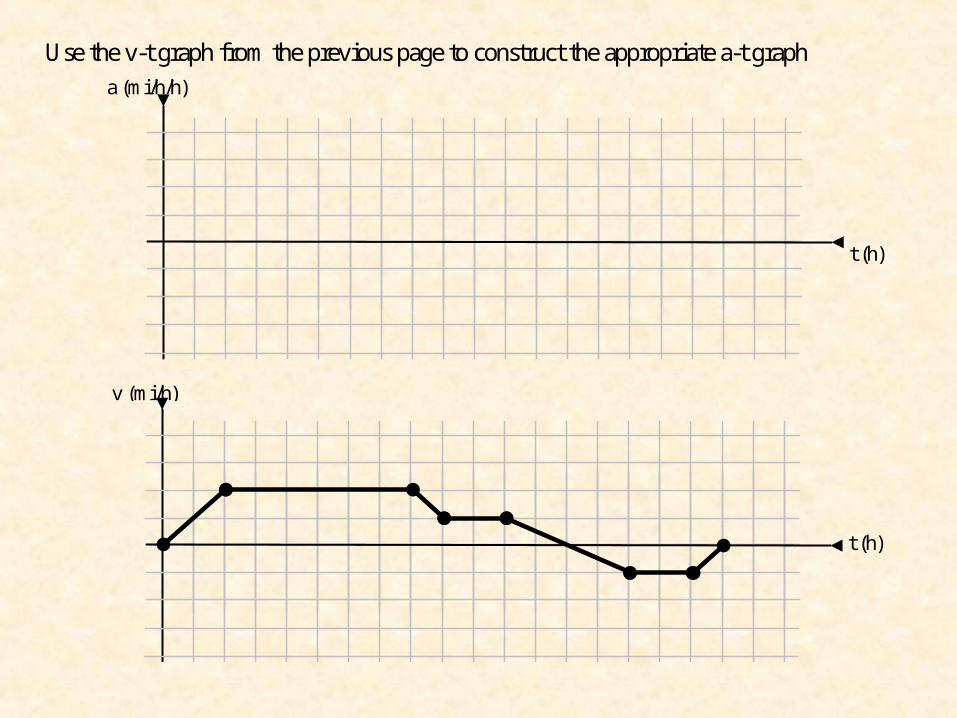
Use the v-t graph from the previous page to construct the appropriate a-t graph a (mi/h/h)
t (h)
t (h)
v (mi/h)
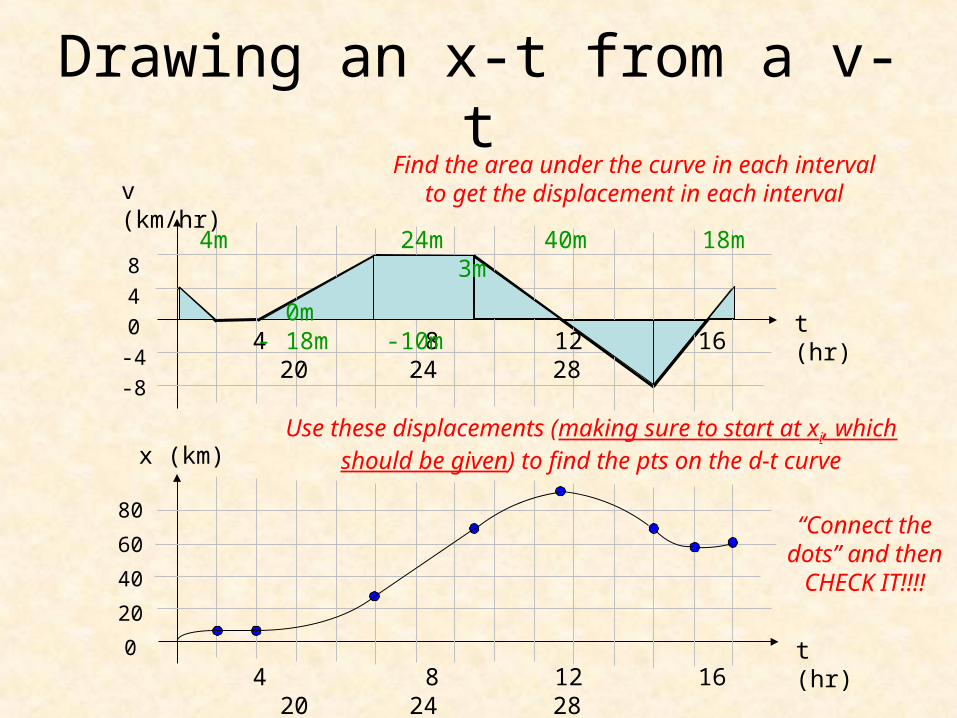
Drawing an x-t from a v-t
t (hr)
8
4
0
-4
-8
v (km/hr)
t (hr) 4 8 12 16 20 24 28
80
60
40
20
0
x (km)
Find the area under the curve in each interval to get the displacement in each interval
4 8 12 16 20 24 28
Use these displacements (making sure to start at xi, which should be given) to find the pts on the d-t curve
4m 24m 40m 18m 3m
0m - 18m -10m
“Connect the dots” and then CHECK IT!!!!
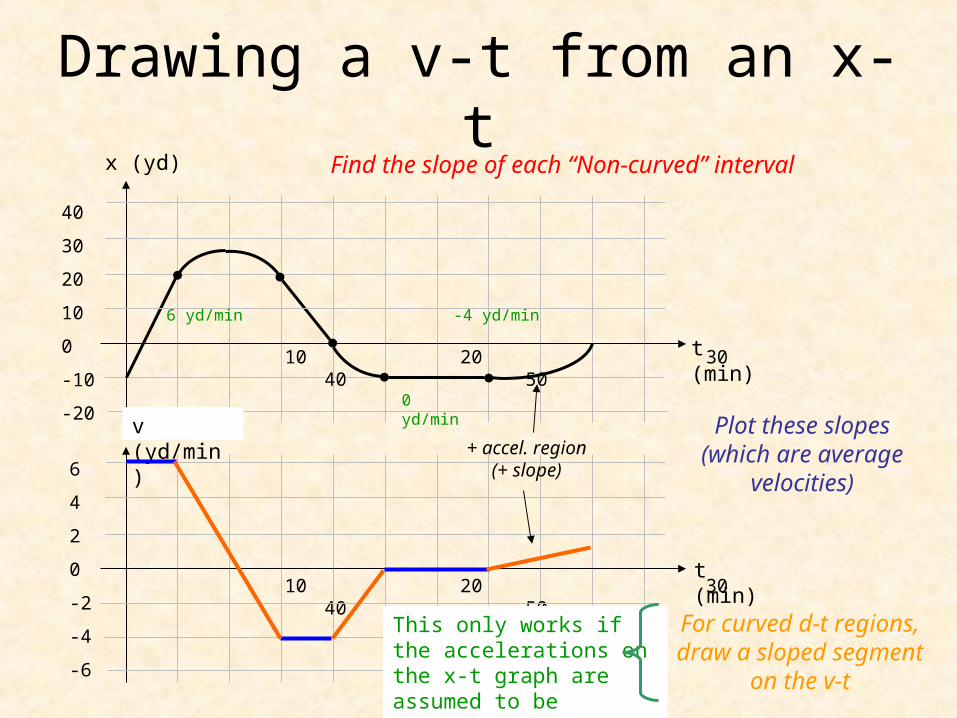
Drawing a v-t from an x-tFind the slope of each “Non-curved” intervalx (yd)
10 20 30 40 50 t (min)
40
30
20
10
0
-10
-20v (yd/min)
10 20 30 40 50 t (min)
6 yd/min -4 yd/min
0 yd/min
Plot these slopes (which are average
velocities)
For curved d-t regions, draw a sloped segment
on the v-t
+ accel. region (+ slope)6
4
2
0
-2
-4
-6
This only works if the accelerations on the x-t graph are assumed to be constant
Recommended