THE ECONOMIC WEEKLY September 8, 1856
Unemployment in Urban Areas
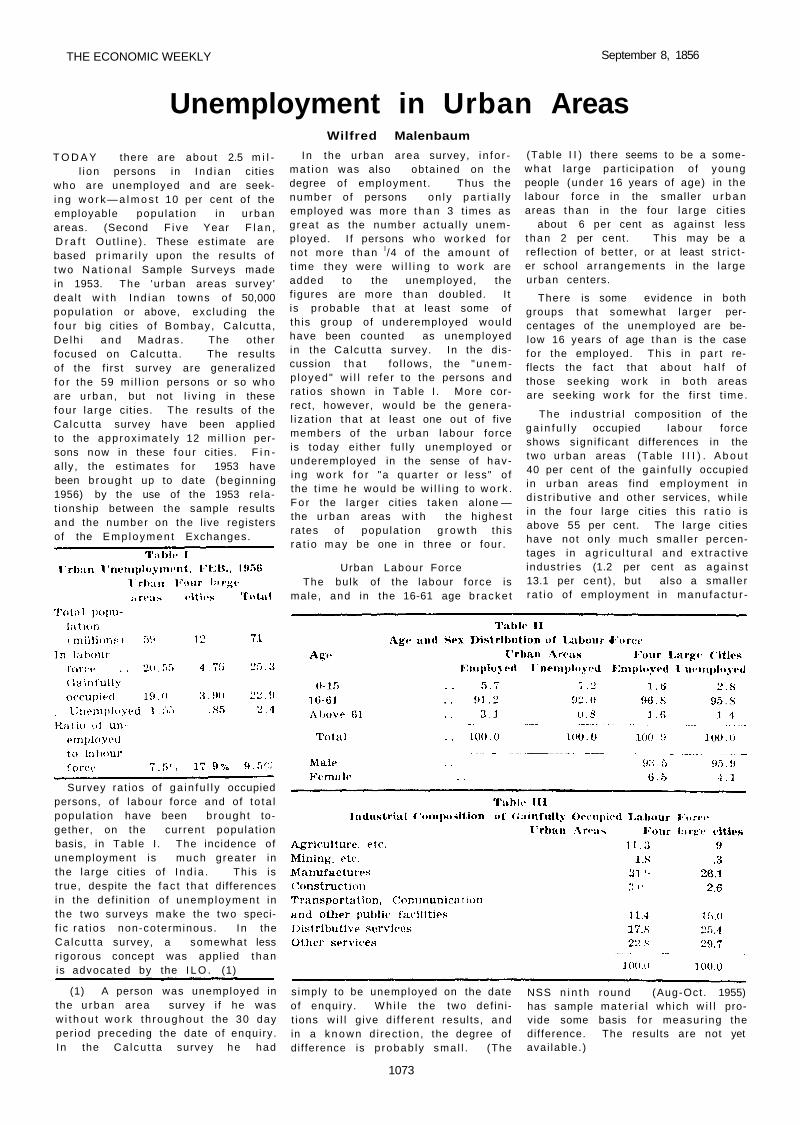
T O D A Y there are about 2.5 m i l -l i on persons in I nd ian cit ies
who are unemployed and are seeki ng w o r k — a l m o s t 10 per cent of the employable popula t ion in u rban areas. (Second F i ve Year F l a n , D r a f t Ou t l i ne ) . These est imate are based p r i m a r i l y upon the resul ts of two Na t i ona l Sample Surveys made in 1953. The 'urban areas survey ' deal t w i t h I nd i an towns of 50,000 populat ion or above, exc lud ing the fou r b ig cit ies of Bombay , Ca lcu t ta , De lh i and Madras . The other focused on Ca lcu t ta . The results of the f i rst survey are general ized f o r the 59 m i l l i on persons or so who are u rban , but not l i v i n g in these four large cit ies. The results of the Ca lcu t ta survey have been applied to the approx imate ly 12 m i l l i on persons now in these four cit ies. F i n a l ly , the est imates for 1953 have been b rought up to date (beg inn ing 1956) by the use of the 1953 re lat ionship between the sample results and the number on the l ive registers of the Emp loymen t Exchanges.
In the u rban area survey, i n f o r ma t ion was also obta ined on the degree of employment . Thus the number of persons on l y pa r t i a l l y employed was more t h a n 3 t imes as g rea t as the number ac tua l l y unemployed. I f persons who wo rked for no t more t han l /4 of the amoun t of t ime they were w i l l i n g to w o r k are added to the unemployed, the f igures are more than doubled. I t is probable t h a t at least some of th is group of underemployed wou ld have been counted as unemployed in the Ca lcu t ta survey. In the discussion t h a t fo l lows, the "unemp loyed" w i l l refer to the persons and ra t ios shown in Tab le I . More correct, however, wou ld be the general iza t ion tha t at least one out of five members of the urban labour force is today ei ther fu l l y unemployed or underemployed in the sense of having w o r k f o r "a quar te r o r less" o f the t ime he would be w i l l i n g to w o r k . Fo r the larger cit ies taken alone — the u rban areas w i t h the h ighest rates of populat ion g r o w t h th is ra t i o may be one in three or four .
Urban Labour Force The bulk of the labour force is
male, and in the 16-61 age b racke t
(Table I I ) there seems to be a somewha t large par t ic ipat ion o f young people (under 16 years of age) in the labour force in the smal ler u r b a n areas t han in the four la rge ci t ies
about 6 per cent as against less t han 2 per cent. This may be a reflection of better, or at least s t r i c t er school a r rangements in the large urban centers.
There is some evidence in both groups tha t somewhat la rger percentages of the unemployed are below 16 years of age t h a n is the case fo r the employed. Th is in pa r t reflects the fact that about ha l f of those seeking work in bo th areas are seeking w o r k for the f i rs t t ime.
The indus t r i a l composit ion of the g a i n f u l l y occupied labour force shows s ign i f icant differences in the two urban areas (Table I I I ) . A b o u t 40 per cent of the ga in fu l l y occupied in u rban areas f ind employment in d is t r ibu t i ve and other services, wh i l e in the four large cities this r a t i o is above 55 per cent. The large cit ies have not only much smal ler percentages in ag r i cu l t u ra l and ex t rac t i ve industr ies (1.2 per cent as aga ins t 13.1 per cent) , but also a smal ler ra t i o of employment in manu fac tu r -
s imply to be unemployed on the date of enquiry. Wh i l e the two def in i t ions w i l l g ive d i f fe rent results, and in a k n o w n d i rec t ion , the degree of dif ference is p robab ly sma l l . (The
NSS n i n t h round (Aug-Oct . 1955) has sample ma te r ia l wh ich w i l l provide some basis fo r measur ing the difference. The results are not yet avai lable. )
1073
Wilfred Malenbaum
Survey rat ios of ga in fu l l y occupied persons, of labour force and of to ta l populat ion have been b rought together, on the current populat ion basis, in Table I . The incidence of unemployment is much greater in the large cit ies of I nd i a . Th is is t rue, despite the fac t t ha t differences in the def in i t ion of unemployment in the two surveys make the two specif i c ra t ios non-coterminous. In the Ca lcu t ta survey, a somewhat less r igorous concept was appl ied than is advocated by the I L O . (1)
(1) A person was unemployed in the u rban area survey i f he was w i t h o u t w o r k th roughou t the 30 day per iod preceding the date of enquiry. In the Ca lcu t ta survey he had
THE ECONOMIC WEEKLY September 8, 1956
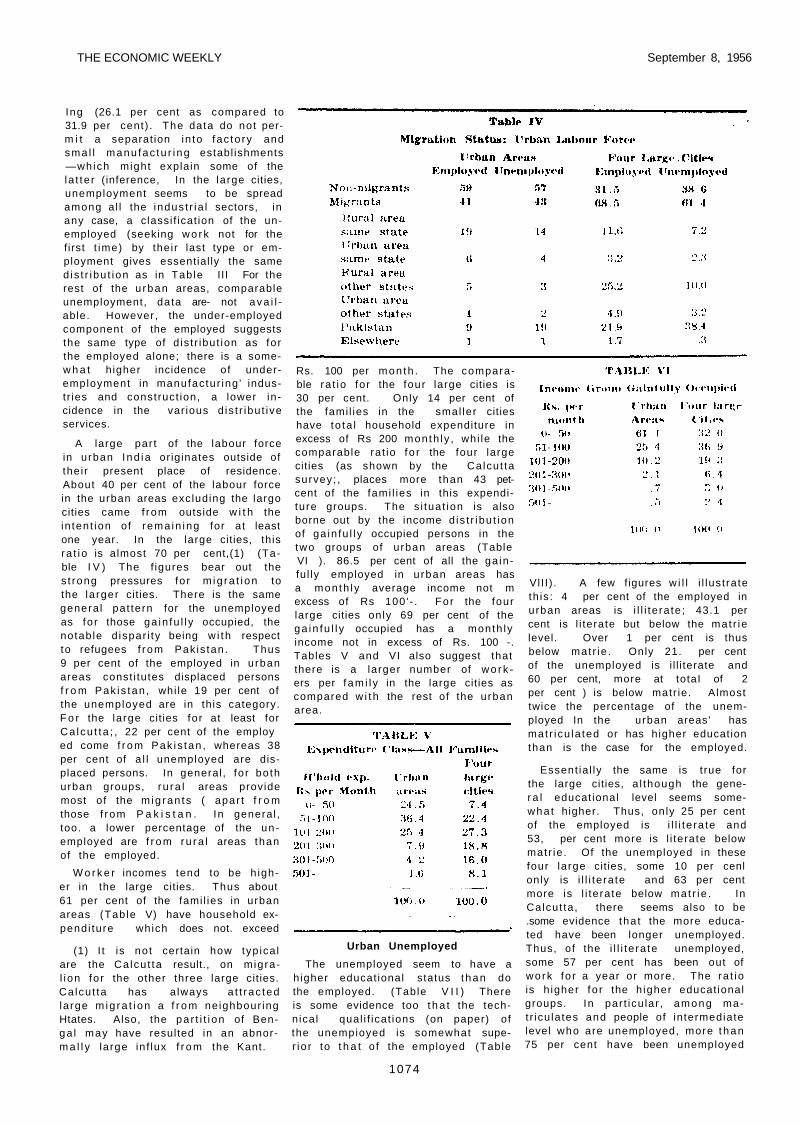
Ing (26.1 per cent as compared to 31.9 per cent) . The data do not perm i t a separat ion in to fac to ry and sma l l manu fac tu r i ng establ ishments —which might explain some of the la t te r (inference, In the large cities, unemployment seems to be spread among a l l the indus t r ia l sectors, in any case, a classi f icat ion of the unemployed (seeking w o r k not for the f irst t ime) by their last type or employment gives essential ly the same d is t r ibu t ion as in Tab le III For the rest of the u rban areas, comparable unemployment, data are- not ava i l able. However, the under-employed component of the employed suggests the same type of d is t r ibut ion as for the employed alone; there is a somew h a t higher incidence of underemployment in manufactur ing ' industr ies and construct ion, a lower incidence in the var ious d is t r ibu t ive services.
A large par t of the labour force in urban Ind ia or iginates outside of thei r present place of residence. About 40 per cent of the labour force in the urban areas excluding the largo cities came f rom outside w i t h the in tent ion of rema in ing for at least one year. In the large cities, this ra t i o is almost 70 per cent,(1) (Table I V ) The f igures bear out the s t rong pressures for m ig ra t i on to the larger cities. There is the same genera l pat tern for the unemployed as fo r those ga in fu l l y occupied, the notable d ispar i ty being w i th respect to refugees f rom Pak is tan. Thus 9 per cent of the employed in urban areas const i tutes displaced persons f r o m Pak is tan , whi le 19 per cent of the unemployed are in this category. F o r the large cit ies for at least for Ca lcu t ta ; , 22 per cent of the employ ed come f r o m Pak is tan , whereas 38 per cent of a l l unemployed are displaced persons. In general , fo r both urban groups, ru ra l areas provide most of the m ig ran ts ( apar t f r o m those f rom P a k i s t a n . In general , too. a lower percentage of the unemployed are f r o m ru ra l areas than of the employed.
W o r k e r incomes tend to be h igher in the large cities. Thus about 61 per cent of the fami l ies in urban areas (Table V) have household expendi ture which does not. exceed
(1) I t is no t certain how typ ica l are the Ca lcu t ta result., on migra-l ion fo r the other three large cit ies. Ca lcu t ta has a lways a t t rac ted large m ig ra t i on a f r o m neighbour ing Htates. Also, the pa r t i t i on of Benga l may have resulted in an abnorm a l l y large in f lux f r o m the Kant.
Rs. 100 per mon th . The comparable ra t io for the four large cities is 30 per cent. Only 14 per cent of the fami l ies in the smal ler cities have to ta l household expenditure in excess of Rs 200 month ly , whi le the comparable rat io fo r the four large cities (as shown by the Calcut ta survey; , places more than 43 pet-cent of the fami l ies in this expenditure groups. The s i tuat ion is also borne out by the income d is t r ibu t ion of ga in fu l l y occupied persons in the two groups of urban areas (Table VI ). 86.5 per cent of all the ga inful ly employed in u rban areas has a month ly average income not m excess of Rs 100 ' - . For the four large cities only 69 per cent of the ga in fu l l y occupied has a month ly income not in excess of Rs. 100 -. Tables V and VI also suggest that there is a larger number of w o r k ers per f am i l y in the large cities as compared w i t h the rest of the urban area.
Urban Unemployed
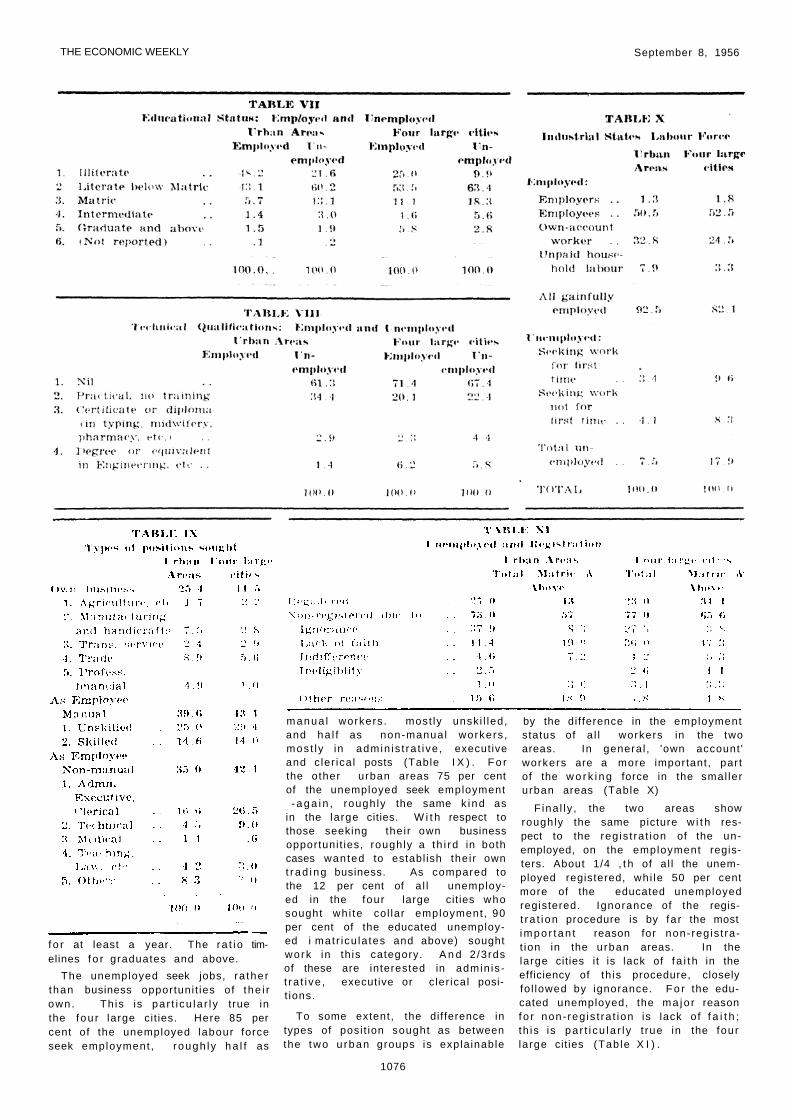
The unemployed seem to have a higher educat ional status than do the employed. (Table V I I ) There is some evidence too t h a t the technical qual i f icat ions (on paper) of the unempioyed is somewhat super io r to t h a t o f the employed (Table
Vl I I ) . A few figures w i l l i l lus t rate th is : 4 per cent of the employed in urban areas is i l l i te ra te ; 43.1 per cent is l i terate but below the mat r ie level. Over 1 per cent is thus below mat r ie . Only 21. per cent of the unemployed is i l l i terate and 60 per cent, more at totaI of 2 per cent ) is below matr ie. Almost twice the percentage of the unemployed In the urban areas' has mat r icu la ted or has higher education than is the case for the employed.
Essent ia l ly the same is t rue for the large cities, a l though the gener a l educat ional level seems somewha t higher. Thus, only 25 per cent of the employed is i l l i te ra te and 53, per cent more is l i terate below matr ie . Of the unemployed in these four large cit ies, some 10 per cenl only is i l l i te ra te and 63 per cent more is l i te ra te below mat r ie . In Calcut ta , there seems also to be .some evidence tha t the more educated have been longer unemployed. Thus, of the i l l i te ra te unemployed, some 57 per cent has been out of work fo r a year or more. The ra t io is h igher fo r the h igher educat ional groups. In par t icu lar , among mat r icu lates and people of intermediate level who are unemployed, more t han 75 per cent have been unemployed
1074

THE ECONOMIC WEEKLY September 8 , 1 9 5 6
1075
THE ECONOMIC WEEKLY September 8, 1956
f o r at least a year. The ra t i o timelines f o r graduates and above.
The unemployed seek jobs, ra ther than business opportuni t ies of the i r own . Th is is pa r t i cu la r l y true in the fou r large cit ies. Here 85 per cent of the unemployed labour force seek employment , rough ly ha l f as
manua l workers . most ly unsk i l led, and ha l f as non-manual workers , mos t l y in admin is t ra t i ve , executive and c ler ica l posts (Table I X ) . F o r the other urban areas 75 per cent of the unemployed seek employment - a g a i n , rough ly the same k ind as
in the large cities. W i t h respect to those seeking thei r own business opportuni t ies, roughly a th i rd in both cases wanted to establ ish the i r own t rad ing business. As compared to the 12 per cent of a l l unemployed in the four large cit ies who sought wh i te col lar employment , 90 per cent of the educated unemployed i mat r icu la tes and above) sought work in th is category. A n d 2 /3rds of these are interested in admin is t ra t i ve , executive or c ler ical posit ions.
To some extent, the difference in types of posi t ion sought as between the two u rban groups is expla inable
by the dif ference in the employment status of a l l workers in the two areas. In general , 'own account ' workers are a more important, par t of the w o r k i n g force in the smal ler urban areas (Table X)
F ina l l y , the two areas show roughly the same picture w i t h respect to the reg is t ra t ion of the unemployed, on the employment registers. About 1/4 , t h of a l l the unemployed registered, whi le 50 per cent more of the educated unemployed registered. Ignorance of the regist ra t i on procedure is by fa r the most impo r t an t reason for non-reg is t rat ion in the urban areas. In the large cities i t is lack of f a i t h in the efficiency of th is procedure, closely fo l lowed by ignorance. F o r the educated unemployed, the ma jo r reason f o r non- reg is t ra t ion is lack of f a i t h ; th is is pa r t i cu la r l y t rue in the four large cit ies (Tab le X I ) .
1076
Recommended