Unemployment Duration and Labour
Market Outcomes of University
Graduates in Ghana
Andaratu A. Achuliwor, Charles Ackah and Nana Akua
Anyidoho
University of Ghana

Introduction Youthful population
Economic development characterised with fundamental and structural problems
Widening gap between youth unemployment and global adult unemployment (ILO,
2016)
The youth as a ‘lost generation’(Vigh, 2006; OECD, 2010)
“Jobless growth” (Baah-Boateng, 2017; Aryeetey and Baah-Boateng,
2015)
Youth still marginalized, unemployed and vulnerable (ILO, 2018)3

Introduction cont’d Graduate unemployment in Ghana has been attributed to skills mismatch and lack of
experience (Baah-Boateng, 2015; Ewusi, 2013)
Literature has also highlighted the role of job search, social capital on youth youth
unemployment (Carlsson, Eriksson & Rooth, 2018; Huffman & Torres, 2002; Saks
& Ashforth, 2000)
In Asia, Chen (2017) found that the social network increases employability and improves
the chances of exiting unemployment of fresh university graduates in the Zhejiang
Province of China
Europe have found a social network as a facilitating tool in reducing duration of
unemployment and also results in increases in the number of job offer of university
graduates (Piróg, 2016; Baay et al., 2014; Macmillan, Tyler & Vignoles, 2015)
Governments initiatives such as NYEP, GYEEDA, YEA in curbing youth
unemployment
Current initiative is the NABCO

Motivation
0
1
2
3
4
5
6
2013 2014 2015 2016 2017 2018
Unem
plo
ym
ent
Rat
e
Unemployment Youth unemployment
5
• Youth Unemployment outweighs the general unemployment rate
• Unemployment rate increase with increase in education

Motivation
0
10
20
30
40
50
60
70
No Education JHS or Less Secondary Post Sec Bachelors+
Un
em
plo
ym
en
t ra
te
Source : Computed from 2015 Labour Force Survey
Unemployment Rate by Education in 2015
6

MethodologyResearch Design Quantitative Approach: Cross-sectional design
Study Population Bachelor Degree Graduates from 4 Universities-
UG,KNUST,UCC, UDS
National Service-2012/2013 cohort
Sampling technique Multi-stage Random Sample
Sample frame (NSS) 14,252 UG(4,143) KNUST(2,881) UCC(3,462) UDS(3,766)
Sample size 1,470 UG(401) KNUST(302) UCC(357) UDS(410)
Instrument Questionnaire (few open ended)
Data collection method Computer Assisted Telephone Interview (CATI)
Data Analysis Survival Analysis
7
Methodology
University Population Weight Sample (expected)
UG 4,143 0.2907 582
KNUST 2,881 0.2021 404
UCC 3,462 0.2429 486
UDS 3,766 0.2642 528
Total 14,252 100 2,000
8

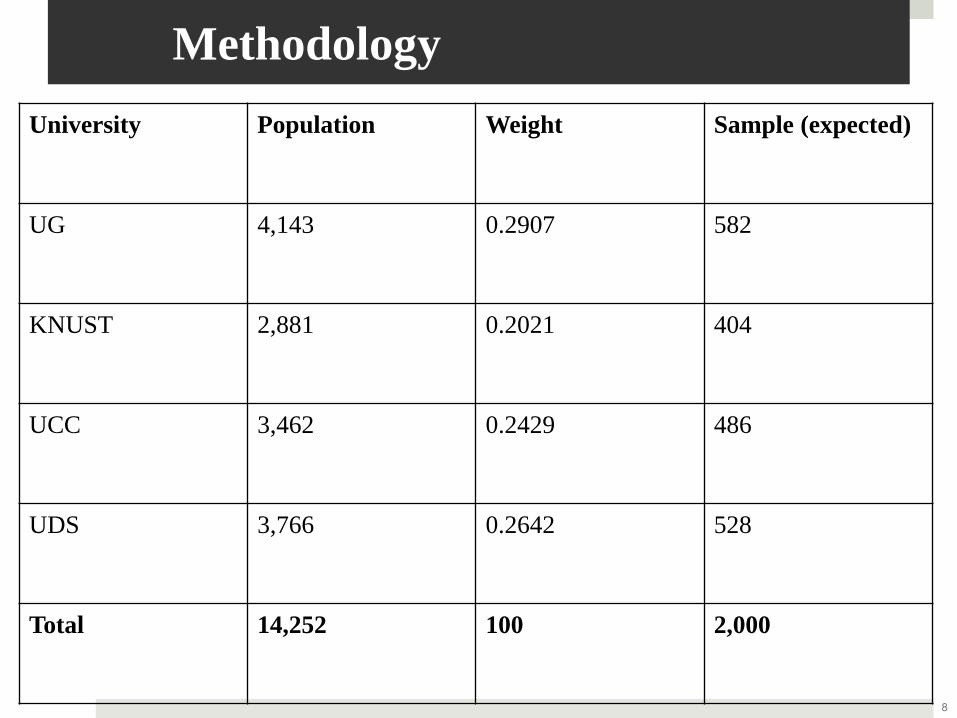
MethodologyResearch Design Quantitative Approach: Cross-sectional design
Study Population Primary ( Bachelor Degree Graduates from 4 Universities-
UG,KNUST,UCC, UDS
National Service-2012/2013 cohort
Sampling technique Multi-stage Random Sample
Sample frame (NSS) 14,252 UG(4,143) KNUST(2,881) UCC(3,462) UDS(3,766)
Expected Sample 2,000 UG (582) KNUST (404) UCC(486) UDS (528)
Sample size 1,470 UG(401) KNUST(302) UCC(357) UDS(410)
Instrument Questionnaire (few open ended)
Data collection method Computer Assisted Telephone Interview (CATI)
Data Analysis Survival Analysis9

Methodology
10

Methodology
Actual Sample (total valid surveys)
UG KNUST UCC UDS Total
Humanities 237 102 216 280 835
Science 70 60 91 51 301
Engineering 6 79 - - 85
Business 50 18 27 8 103
Agriculture 9 40 20 71 140
Fine Arts 0 3 3 - 6
Total 401 302 357 410 1,470
12
Methodology
Research Design Quantitative Approach: Cross-sectional design
Study Population Primary ( Bachelor Degree Graduates from 4 Universities-
UG,KNUST,UCC, UDS
National Service-2012/2013 cohort
Sampling technique Multi-stage Random Sample
Sample frame (NSS) 14,252 UG(4,143) KNUST(2,881) UCC(3,462) UDS(3,766)
Expected Sample 2,000 UG (582) KNUST (404) UCC(486) UDS (528)
Sample size 1,470 UG(401) KNUST(302) UCC(357) UDS(410)
Instrument Questionnaire (few open ended)
Data collection method Computer Assisted Telephone Interview (CATI)
Data Analysis Survival Analysis13

Descriptive Statistics
Variable Mean Min Max
Age 28.03 26 32
Employed 0.70 0 1
Bonding Social capital 3.01 2 5
Linking Social capital 1.82 0 9
Marital Status 1.34 1 9
Programme 1.24 1 6
Work Experience 0.15 0 1
Intensity of Job Search 5.30 0 25
Perceived Job Availability 0.12 0 1
Service Sector 0.41 0 1
Unemployment Duration 3.04 0 514

Sector of Employment
Sector Male Female ALL
Education 34.33 19.47 31.28
Legal (Law) 0.27 1.58 0.54
Health 6.92 5.79 6.69
Financial, Banking, Insurance 18.72 27.37 20.5
Manufacturing 3.39 3.68 3.45
Tourism and hospitality 0.95 0.53 0.86
Sales/marketing 3.66 5.26 3.99
Oil industry 1.90 3.16 2.16
Development work 6.11 3.68 5.61
Agricultural related 6.51 3.68 5.93
Military/Armed forces 0.81 0.53 0.76
Other (specify) 16.42 25.26 18.23

Job Search Strategies and Job Offers
Job search Strategies
Strategy Male Female All
Ask family and friend 21.23 78.77 42.18
Read newspaper
advertisement 74 26 5.39
Approach employers
directly 82.23 17.77 21.25
Use employment agency 73.08 26.92 2.8
Go to career fairs 80 20 1.08
Search on the internet 75.16 24.84 17.37
Other (specify) 89.13 10.87 9.92
Search strategies and number of job offers
Strategy One Two
Three or
more
Ask family and friend 53.92 38.54 16.67
Read newspaper
advert 3.92 6.25 11.11
Approach employers
directly 17.65 20.83 13.89
Use employment
agency 2.94 2.08 0
Go to career fairs 0.98 3.12 0
Search on the internet 9.80 18.75 50
Other (specify) 10.78 10.42 8.33

Unemployment Duration
Kaplan-Meier Survival Estimate Kaplan-Meier Survival Function
Time
Survival
Function
<1 0.9436
1 0.4342
2 0.2948
3 0.2132
4 0.183517

Unemployment Duration
Kaplan Meier Survival Estimate Kaplan Meier Survival Function by Programme
Time FA Ag Eng AH Sci
Busi
ness
<1 0.98 0.91 0.86 0.87 0.97 0.70
1 0.46 0.42 0.33 0.45 0.37 0.67
2 0.31 0.29 0.22 0.31 0.19 0.43
3 0.23 0.20 0.17 0.23 0.13 0.40
4 0.20 0.16 0.13 0.20 0 0.25
18

Unemployment Duration
Kaplan Meier Survival Estimates Kaplan Meier Survival Function by Sex
Time Male Female
<1 0.98 0.97
1 0.44 0.41
2 0.29 0.30
3 0.22 0.20
4 0.19 0.17

Regression Estimates for Unemployment
Duration
Variable Hazard Rate Variable Hazard Rate
Age 1.028*** Private sector 1.364***
Female 1.392*** Family and friends 1.762***
Married 0.985 News papers 0.425
Previous Work
Experience
0.988 Approach Employers 0.351
Bonding Social Capital 1.278** Employment agencies 0.272
Linking Social Capital 1.519*** Career fairs 0.598
Job Search Intensity 0.885 Internet 0.575
Science 1.013 First class 0.933
Business 1.148 Second upper 0.874
Agriculture 1.124 Second class 1.000
Engineering 1.532***
Fine Arts 1.385 Statistical significance: *** 1%, ** 5% *
10%

Conclusion Tracer study of graduates from 4 main public universities in Ghana
First empirical attempt in Ghana
Majority of graduates are employed in the education and financial sectors
Social network facilitates labour market entry in Ghana
Unemployment duration decreases with time but differs according to programme
Gender, social capital, programme of study and type of search strategy
significantly determine exit from unemployment

Policy Recommendation
Implementation of job matching strategies
to strengthen the effective foundation of the labour market and ensure the optimal
allocation of jobs
There is an over supply of graduates with business related certificates
University authorities should therefore run degree programmes in areas where there is
a high demand for a particular skill set to enable an easier transition into employment
Job creation programmes should be targeted at graduates with higher
unemployment duration

THANK YOU
Recommended