RESEARCH ARTICLE
Uncovering the subtype-specific temporal
order of cancer pathway dysregulation
Sahand KhakabimamaghaniID*, Dujian DingID, Oliver SnowID, Martin Ester
School of Computing Science, Simon Fraser University, Burnaby, British Columbia, Canada
Abstract
Cancer is driven by genetic mutations that dysregulate pathways important for proper cell
function. Therefore, discovering these cancer pathways and their dysregulation order is key
to understanding and treating cancer. However, the heterogeneity of mutations between dif-
ferent individuals makes this challenging and requires that cancer progression is studied in
a subtype-specific way. To address this challenge, we provide a mathematical model, called
Subtype-specific Pathway Linear Progression Model (SPM), that simultaneously captures
cancer subtypes and pathways and order of dysregulation of the pathways within each sub-
type. Experiments with synthetic data indicate the robustness of SPM to problem specifics
including noise compared to an existing method. Moreover, experimental results on glio-
blastoma multiforme and colorectal adenocarcinoma show the consistency of SPM’s results
with the existing knowledge and its superiority to an existing method in certain cases. The
implementation of our method is available at https://github.com/Dalton386/SPM.
Author summary
Different biological processes within a cell are performed through biological pathways. A
biological pathway consists of a group of proteins and other molecules and complex inter-
actions between them. It is known that cancer arises due to malfunction, also known as
dysregulation, of one or more pathways. Interestingly, a dysregulation in a patient is often
caused by mutations in only one (and not more) molecule in the pathway. This phenome-
non is known as mutual exclusivity of mutations and can be used for identification of
groups of genes forming (cancer) pathways. The same type of cancer in different patients
can result due to different trajectories of dysregulations in possibly different pathways
resulting in cancer heterogeneity. Cancer heterogeneity implies that cancer treatment
should be personalized according to each patient’s specific characteristics and mutations.
Therefore, grouping patients based on their pathway dysregulation trajectories into cancer
subtypes can help identify different cancer mechanisms, inform subtype-specific treat-
ment strategies and improve efficacy. In this paper, we provide a method that uses
patients’ mutation information captured by DNA sequencing and identifies dysregulated
pathways (i.e. molecules involved in each cancer pathway), cancer subtypes (i.e. groups of
patients sharing a common pathway dysregulation trajectory) and subtype-specific path-
way dysregulation orders (i.e. trajectories defining the different subtypes). The results on
PLOS Computational Biology | https://doi.org/10.1371/journal.pcbi.1007451 November 11, 2019 1 / 19
a1111111111
a1111111111
a1111111111
a1111111111
a1111111111
OPEN ACCESS
Citation: Khakabimamaghani S, Ding D, Snow O,
Ester M (2019) Uncovering the subtype-specific
temporal order of cancer pathway dysregulation.
PLoS Comput Biol 15(11): e1007451. https://doi.
org/10.1371/journal.pcbi.1007451
Editor: Rachel Karchin, Johns Hopkins University,
UNITED STATES
Received: June 7, 2019
Accepted: September 30, 2019
Published: November 11, 2019
Peer Review History: PLOS recognizes the
benefits of transparency in the peer review
process; therefore, we enable the publication of
all of the content of peer review and author
responses alongside final, published articles. The
editorial history of this article is available here:
https://doi.org/10.1371/journal.pcbi.1007451
Copyright: © 2019 Khakabimamaghani et al. This is
an open access article distributed under the terms
of the Creative Commons Attribution License,
which permits unrestricted use, distribution, and
reproduction in any medium, provided the original
author and source are credited.
Data Availability Statement: The COAD and GBM
data used in this research are respectively provided
in DOI: 10.1038/nature11252 and DOI:10.1038/
nature07385 and are publicly available from
cBioPortal (http://www.cbioportal.org/).

synthetic and real-world data indicate that the method can recover meaningful informa-
tion about the progression of cancer in different groups of patients.
This is a PLOS Computational Biology Methods paper.
Introduction
It is well understood that human tumors develop over an extended time period through the
accumulation of genetic mutations. Thanks to the advancements in DNA sequencing technol-
ogies, we now have an increasing amount of high quality genomic data for studying the trajec-
tories of cancer mutations (e.g. The Cancer Genome Atlas (TCGA) [1] and International
Cancer Genome Consortium (ICGC) [2]). Two intriguing questions for these studies are:
(1) Which mutations are crucial for tumor development, and which are not? In other words,
what are the so called “driver” mutations and which mutations are only “passengers”? (2) Is
there any meaningful temporal pattern for the driver mutations and how can we infer it if it
exists? While the first problem can be solved in part by comparing observed frequencies of
mutations across different patients [3], the second problem concerning the temporal order of
mutations remains challenging. This is because most of the existing genomic datasets contain
cross-sectional data taken from single samples across different individuals and not longitudi-
nal data. Moreover, solving the second problem can provide insights into the relative impor-
tance of the driver mutations (i.e. the earlier the mutation time, the more important the
mutation).
A number of studies have focused on inferring the temporal order of single mutations in
different cancers. These works can be categorized into two main classes. The first class consists
of methods based on sequencing data from a single individual. Some of the earlier methods in
this class used bulk sequencing data from a single sample (e.g. rec-BTP [4], CTPsingle [5]) or
multiple samples from the same tumor or patient (e.g. PhyloWGS [6], AncesTree [7], LICHeE
[8], CITUP [9]). The latest developments are based on single-cell data (e.g. OncoNEM [10],
SCITE [11], SiFit [12]) or simultaneously utilize single-cell and bulk sequencing to create syn-
ergy between the two data types (B-SCITE [13] and PhISCS [14]).
The second class contains methods based on sequencing data from several individuals.
Unlike the methods of the first class, ensemble level methods mostly use binarized cross-sec-
tional mutation data indicating whether the mutation has occurred or not. The first work in
this class models the relationship between the mutations as a linear path [15]. This was fol-
lowed by the idea of a phylogenetic tree among the mutations (e.g. [16, 17]). Other works con-
sider different possible evolutionary trajectories for subsets of individuals and infer a mixture
of trees (e.g. [18–21]). Others have used a probabilistic graphical model with mutations as the
variables to allow for later convergence of mutations (e.g. [22–28]), which is not possible in a
tree model. A recent publication using an ensemble approach [29] leveraged non-binary can-
cer cell fraction data which provides more information about the timing of mutations.
Because the above methods work at the level of single mutation or gene, they are challenged
by the extensive heterogeneity in the mutation data, which results in weak temporal patterns.
This heterogeneity is associated with the fact that somatic mutations target specific biological
pathways [30]. “A biological pathway is a series of actions among molecules in a cell that leads
Subtype-specific temporal order of cancer pathway dysregulation
PLOS Computational Biology | https://doi.org/10.1371/journal.pcbi.1007451 November 11, 2019 2 / 19
Funding: The authors received no specific funding
for this work.
Competing interests: The authors have declared
that no competing interests exist.

to a certain product or a change in the cell. Such a pathway can trigger the assembly of new
molecules, such as a fat or protein. Pathways can also turn genes on and off, or spur a cell to
move”. [31] Pathways can be dysregulated due to the mutation of any of their critical member
genes. This results in different individuals having mutations on different genes of the same
pathway. Based on this observation, cancer is modulated by dysregulation of pathways and the
relevant order of mutations might be at the level of pathways not genes [3]. This approach
decreases the challenges associated with the heterogeneity of mutations across individuals.
Some previous work has been done on the detection of temporal patterns in pathway dysre-
gulations. Some of these approaches (e.g. [32, 33]), which demonstrate advantages over gene-
based methods, are based on the known pathways (e.g. KEGG [34]). Since most annotated
pathways are large and overlap with other pathways, they are inapplicable for the discoveries
of mutation progression in smaller sets of interacting genes [3]. One alternative is to discover
pathways de novo. Raphael and Vandin [3] proposed a method to simultaneously infer path-
ways and the timing relation between them. They hypothesized that tumor development is
driven by a linear sequence of pathway dysregulations and proposed the Pathway Linear Pro-
gression Model (PLPM). PLPM exploits a property known as mutual exclusivity, which is first
mentioned in [35] and indicates that an individual is unlikely to have more than one mutation
in a particular pathway. Mutual exclusivity has also been used to successfully identify pathways
in cancer datasets [36–39]. To find the optimal PLPM model for the observed cross-sectional
sequencing data represented in a binary format, an integer linear program is used. Later, Cris-
tea et al. [40] relaxed the linear progression assumption of PLPM in their method called path-
TiMEx. They provided a probabilistic graphical model that captures mutual exclusivity as well
as the complex progression models. It generalizes both TiMEx [41], which finds mutually
exclusive sets of genes, and Conjunctive Bayesian Networks [23, 26], which identifies partial
orders of mutations.
However, the effectiveness of PLPM and pathTiMEx is limited because of their simplifying
assumptions. Firstly, they assume that all individuals follow the same progression model of
pathway dysregulation, but different cancer subtypes have been widely observed in cancer
patients [42, 43]. Within the context of cancer analysis, subtypes refer to “the smaller groups
that a type of cancer can be divided into, based on certain characteristics of the cancer cells”
[44]. Some recent biological studies (e.g. [45, 46]) have indicated a relationship between differ-
ences in observed phenotypes and differences in temporal orders of mutations, which implies
the possible subtype-specificity of the temporal pattern of mutations. Hence, by assuming a
single progression model for all individuals, subtype-specific information from input profiles
is lost in the PLPM approach and the risk of making biased inference increases. Secondly,
PLPM and pathTiMEx assume binary mutation profiles and cannot exploit the additional
information that sequencing technologies (e.g. bulk sequencing) can provide about the tempo-
ral order of mutations (e.g. Cancer Cell Fractions (CCFs) extracted from read count data).
In this work, we also assume linear progression among pathways and irreversible mutations
(a mutation is inherited by all descendent cells after it occurs in a cell) as in PLPM. To address
the aforementioned drawbacks, we relax other assumptions of the PLPM model and propose a
novel model, called the Subtype-specific Pathway Linear Progression Model (SPM), that (1)
detects different cancer subtypes and their corresponding progression models and (2) exploits
CCFs extracted from read count data. In our method, cancer subtypes are captured by the
notion of tumor lineage. That is, the subtype of a tumor is identified by clustering the pathway
dysregulation orders of individual tumors. We also use the concept of mutual exclusivity for
detecting the pathways. However, we incorporate non-binary data providing more informa-
tion for inference of pathway dysregulation order and allowing for stronger enforcement of
mutual exclusivity between more important mutations, i.e. mutations that appear earlier. Last,
Subtype-specific temporal order of cancer pathway dysregulation
PLOS Computational Biology | https://doi.org/10.1371/journal.pcbi.1007451 November 11, 2019 3 / 19

but not least, our model can employ both binary and continuous sequencing data, which
increases the versatility and accuracy of the model.
The rest of the paper is organized as follows. First, we define the problem of finding the
optimal SPM from mutation profiles. Then, an Integer Linear Program solution is provided.
Finally, the feasibility and accuracy of the proposed method is demonstrated through experi-
ments with two real cancer datasets.
Problem definition
In a SPM problem, we are given:
• An m × n mutation matrix C, with samples on the rows and genes on the columns, where Ci,j
is the Cancer Cell Fraction (CCF) of gene j in sample i. CCF of a variant denotes the propor-
tion of cancer cells in a sample that harbour that variant. For a single nucleotide variation
(SNV) locus with neutral copy number, the CCF is computed as 2vrþv, where v and r are respec-
tively the number of variant and reference read counts mapped to an area covering that
locus. This computation is assuming a sample purity of 1, otherwise the read counts should
be corrected based on the known purity by reducing the value of r. If the sample purity val-
ues are not known, CCF values can be replaced with Variant Allele Frequency values com-
puted as vvþr. For loci with copy number variation (CNV), computation of CCF is very
difficult and associated with uncertainty. Therefore, we do not consider loci with CNV
regardless of occurrence of SNV in the locus. For a gene, we take the largest CCF of the cor-
responding variants if there are more than one variant in that gene. Based on our assump-
tions, i.e. linear progression and irreversible mutations, this choice refers to the earliest
mutation that has happened for that gene.
• An integer K, which indicates the number of pathways to discover.
• An integer T, which indicates the number of subtypes to discover.
• A tolerance value �, which indicates the sequencing noise. If the difference between two
CCFs is smaller than �, they will be accounted the same. Larger � should be used for lower
sequencing coverage.
We are interested in the following outputs:
• A partitioning of genes into K pathways, such that mutual exclusivity is maximized within
each pathway. Specifically, we want to avoid having pathways that include two or more
simultaneous mutations with large CCFs, i.e. the larger the CCFs, the larger the penalty
because the larger CCFs indicate generally stronger signals and more confident mutations.
• A partitioning of samples into T subtypes, such that the pathway linear progression is consis-
tent among samples of each subtype as described next.
• For each subtype, a linear progression model capturing the linear temporal order of dysregu-
lation of the K pathways. In other words, linear progression corresponds to a sequence of
pathways with decreasing CCFs with a tolerance �. Thus, pathway x is necessarily dysregu-
lated before pathway y in sample i if and only if Zi,x − Zi,y> �. Otherwise, if |Zi,x − Zi,y|��,
the order of the two pathways is ambiguous for sample i and should be identified based on
the observations for other samples in the same subtype. We note that the CCF value is con-
sidered correlated with mutation timing based on the assumptions of linear cancer progres-
sions and irreversible mutations and excluding the CNVs. Under a different set of
assumptions, CCF and mutation time are not necessarily correlated.
Subtype-specific temporal order of cancer pathway dysregulation
PLOS Computational Biology | https://doi.org/10.1371/journal.pcbi.1007451 November 11, 2019 4 / 19

Fig 1 shows an example of inputs (left) and outputs (right). One possible SPM is color-
coded in the input matrix and also depicted in the output. Subtypes in the solution are identi-
fied by different colors in the CCF matrix. The intensity of colors is correlated with the CCF
values. The CCF values corresponding to each pathway are shown in bold and the false positive
detected is underlined. Because the progression order in subtype 3 is P3! P1, the value of larg-
est CCF for sample r7 in pathway P1 is 0.4 (for g1), and 0.4 − 0.2 > � = 0.1, this largest CCF is
not selected for pathway P1 in sample r7 (i.e. is detected as false positive) and the value for g3 is
instead chosen as the corresponding CCF. The white circles indicate the initial normal state.
The pathway progression steps are shown by colored circles with the connecting edges labeled
by dysregulated pathways.
Theorem 1. The SPM problem is NP-hard for any K� 2, T� 1, and �� 0.
Proof. This proof is inspired by the proof provided in [47] for NP-hardness of PLPM prob-
lem. We extend that proof to incorporate CCF values instead of binary mutation data and gen-
eralize it to the case of having multiple subtypes.
We prove by reduction from weighted Minimum-UnCut problem [48], which is a
well-known NP-Complete problem. The input to the weighted Minimum-UnCut problem is
a graph G = (V, E) where each edge e 2 E has a positive weight we. The output is a cut in Gresulting in two sets S and its complement �S such that the weight sum of edges
feab : a; b 2 S _ a; b 2 �Sg (i.e. edges within the two sets) is minimized.
Given a graph G and the edge weights we, we construct the equivalent SPM problem as fol-
lows. First, we assume K� 2 pathways and genes {g1, . . ., gn}[{gn+1, . . ., gn+K−1}, where n = |V|
and {gn+1, . . ., gn+K−1} are auxiliary genes. Second, we assume T� 1 subtypes and assign a path-
way progression order for each subtype. Pathways K and K − 1 get positions 1 and 2 respec-
tively for all subtypes. The position of pathways l� K − 2 are selected arbitrarily and the
corresponding position of pathway l in the progression order for subtype t is indicated as
Post(l), which is between 3 and K.
Now we construct the input matrix C for the SPM problem as follows. For every e = (u, v)2
E, T samples re1;t (1� t� T) are generated such that for each t, we set gu = gv = we + Δ (Δ> �)
in the corresponding sample. Additional Δ is to make sure that the weights will be larger than
Fig 1. An example input with the corresponding outputs.
https://doi.org/10.1371/journal.pcbi.1007451.g001
Subtype-specific temporal order of cancer pathway dysregulation
PLOS Computational Biology | https://doi.org/10.1371/journal.pcbi.1007451 November 11, 2019 5 / 19

the tolerance �. The values for genes in {g1, . . ., gn} other than u and v are set to 0. Let w be the
maximum edge weight for G. Then, for sample re1;t we set gnþl ¼ w þ PostðlÞ � D for {l:
Post(l)> 1}. Similarly, we define T samples re2;t for every e 2 E, except that we set values of aux-
iliary genes as gnþl ¼ w þ PostðlÞ � D for {l: Post(l)> 2}. So the auxiliary gene gn+K−1 is set to 0.
This results in a matrix C with 2T|E| rows and n + K − 1 columns. Since we want to maxi-
mize the mutual exclusivity of mutations of each sample s, if there are more than one mutated
genes assigned to a pathway, all but one mutation will be considered as false positive and the
cost for that assignment will be equal to sum of the CCF values of false positive mutations. The
choice of the true positive mutation among those mutations within the pathway depends on
both the CCF values of those mutations (smaller CCFs are most likely to be false positive) and
the progression constraint (based on the CCFs of the pathways dysregulated before and after
that pathway). We indicate the total cost for a sample s as a result of a pathway assignment ρ:
{1..n}! {1..K} by fρ(s). For each e and t there are different possibilities in a solution ρ for SPM
problem. Denoting the pathways of genes u and v as ρ(u) = lu and ρ(v) = lv, there are following
possibilities for each subtype t:
1. Post(lu), Post(lv)> 2 (both genes are outside of the pathways K and K − 1): Both genes will
be considered as false positive as there is a larger value for gnþlu and gnþlv within the path-
ways lu and lv. So, for all e 2 E, frðre1;tÞ ¼ frðre2;tÞ ¼ 2we and frðre1;tÞ þ frðre2;tÞ ¼ 4we.
2. Post(lu)� 2 and Post(lv)> 2 (one gene is inside one of the pathways K of K − 1 and other
gene is outside them): Assuming that Post(K) = 1, if the gene u is inside pathway K, then, for
all e 2 E, frðre1;tÞ ¼ we and frðre2;tÞ ¼ 2we. Else, if u is inside pathway K − 1, then frðre1;tÞ ¼ 2we
and frðre2;tÞ ¼ we. So, in any case, frðre1;tÞ þ frðre2;tÞ ¼ 3we. This is also true for Post(K) = 2.
3. Post(lu) = Post(lv)� 2 (both genes are in one of the pathways K or K − 1): In either case
when both u and v are in K or in K − 1, we have frðre1;tÞ þ frðre2;tÞ ¼ 3we for all e 2 E.
4. Post(lu), Post(lv)� 2 and Post(lu) 6¼ Post(lv) (both genes are in one of the pathways K or K− 1, but not in the same pathway): We have frðre1;tÞ þ frðre2;tÞ ¼ we for all e 2 E.
Based on the weighting scheme and the costs of the four mentioned cases, it is easy to see
that in the optimal pathway assignment, (1) all genes {g1, . . ., gn} will be in pathways K − 1
and K, (2) each auxiliary gene in {gn+1, . . ., gn+K−2} will be in a separate pathway, (3) gn+K−1
will be assigned to pathway K − 1, and (4) the order of pathway progression for each subtype
will follow the arbitrarily assigned orders. Accordingly, we will have only costs shown in
cases 3 and 4 above. Thus, the total cost of the optimal solution will be 3λ3 + λ4 = TW + 2λ3,
where λ3 and λ4 are the sum of weights of the edges corresponding to samples of cases 3 and
4, respectively, and W = ∑e2E we. Since TW is constant, the optimal solution minimizes the λ3
value which is T times the objective for the weighted Minimum-UnCut problem. Indeed, the
two pathways K − 1 and K correspond to the sets S and �S of Maximum-Cut/Minimum-UnCutin graph G. This concludes that SPM problem is at least as complex as the Minimum-UnCutproblem.
As the last piece of the proof, we show that reduction from weighted Minimum-UnCutproblem can be performed in polynomial time. The equivalent SPM input matrix C con-
structed as above for a weighted Minimum-UnCut problem on a graph G = (V, E) contains
2T|E| rows, with a cost of O(n + K) for each row. This results in a total polynomial complexity
of O(T|E|(n + K)). The cost of generating the arbitrary subtype-specific progression orders Posis O(TK) and does not change the overall big-oh cost. This concludes that the SPM problem is
NP-hard.
Subtype-specific temporal order of cancer pathway dysregulation
PLOS Computational Biology | https://doi.org/10.1371/journal.pcbi.1007451 November 11, 2019 6 / 19

Simulation results
Synthetic data generation
Different synthetic datasets are generated based on different configurations of four factors: m,
T, K and CCF noise. For a given configuration, first m patients are assigned to T subtypes with
a uniform distribution. Then, genes are randomly assigned to pathways based on input Kassuming equal size for all pathways. For each subtype, a unique random linear progression
order is generated. Then, for each patient, K genes are randomly selected from K different
pathways. CCF values of these genes are set according to the progression order using a Dirich-
let distribution for the distances between the values of consecutive CCFs, assuming value of 1
for the largest CCF. Then, a noise of λ 2 {0.01, 0.05, 0.1} is added to the input matrix in two
steps: 1) adding a Gaussian noise with standard deviation of λ to the non-zero elements of the
current matrix and 2) by selecting mnλ of the zero elements of the input matrix and changing
their value to 2λ. The second step introduces false positives and the value of 2λ is used to
ensure that these values will not be detected by a filter that removes mutations with a small
CCF.
Sensitivity analysis
The tested values for the four factors considered in the simulations and their default settings
are shown in Table 1. When analysing the sensitivity to a factor, the other factors are set to
their default values. In addition to these factors, we consider running the algorithm with differ-
ent tolerance values � 2 {0.05, 0.1, 0.2}. We limited the running time to 10 hours and available
memory to 128 GB for both methods.
The following measures are used for performance evaluation. The accuracy of identified
subtypes and pathways is measured by the Rand index between the ground-truth clusters and
the methods’ outputs. With respect to detecting the correct progression order, we used 1–Ken-
dall tau distance to measure the similarity between the ground-truth orders and methods’ out-
puts. Because there are multiple orders for different subtypes, we first associate each output
subtype and pathway to its corresponding most overlapping ground-truth subtype and path-
way. For SPM, for each identified subtype, we compute the Kendall tau distance with the order
of the corresponding ground-truth subtype and take the average over all subtypes. For, PLPM,
because it does not produce subtypes, we report the value for the ground-truth order with the
maximum similarity. In cases with more than one solutions, we take the mean of the men-
tioned measures over all solutions.
The results are shown in Fig 2. As expected, because PLPM does not detect subtypes, the
Rand index of its outputs is always smaller than SPM. SPM performs an almost perfect subtyp-
ing and pathway detection in most of the experiments. SPM outperforms PLPM in detecting
pathways because of its ability to consider multiple different progression orders for different
subtypes. Moreover, in presence of higher noise, binary data results in worse performance for
PLPM as it assigns similar weights to small (uncertain) and large (certain) CCFs. The pathways
Table 1. Factors of synthetic data generation and their values. The default values are underlined.
Factor Value
m 50, 100, 200
K 3, 4, 5
T 2, 3, 4
Noise 0.01, 0.05, 1
https://doi.org/10.1371/journal.pcbi.1007451.t001
Subtype-specific temporal order of cancer pathway dysregulation
PLOS Computational Biology | https://doi.org/10.1371/journal.pcbi.1007451 November 11, 2019 7 / 19

and their order detected by PLPM are also more sensitive to the number of provided samples
m and PLPM require more samples to detect the correct pathways and an order matching pro-
gression of one of the subtypes. PLPM can detect one of the subtype progression orders in
three cases: 1) with 2 subtypes, because, compared to 3 subtypes, there are more samples per
subtype and less number of conflicting progression orders, 2) 4 subtypes, because the particu-
lar random example generated for this case had very similar progression orders across differ-
ent subtypes and 3) low noise, because of small number of false positives. However, PLPM
does not assign the genes to the pathways as accurate as SPM does in those cases.
Real data results
Datasets
We evaluated our method by applying it to two datasets from TCGA containing somatic muta-
tion data from patients with colorectal adenocarcinoma (COAD) [43] and glioblastoma multi-
forme (GBM) [42]. As described earlier, we used CCF values as opposed to the binarized data
used in previous works. This enables us infer more about the proper ordering of mutations but
Fig 2. Results of sensitivity analysis using synthetic data. Note that each graphs might have different scales for the vertical axes.
https://doi.org/10.1371/journal.pcbi.1007451.g002
Subtype-specific temporal order of cancer pathway dysregulation
PLOS Computational Biology | https://doi.org/10.1371/journal.pcbi.1007451 November 11, 2019 8 / 19

limited us to only somatic mutation information as copy number variation data would reduce
the accuracy of the analysis. Although there are tools for inferring the CCF values for copy
number variations (e.g. PyClone [49]), their accuracy is limited for low-coverage cross-sec-
tional data, including the two datasets we investigated. Therefore, we opted to filter out any
sample that had a copy number variation in any of genes of the panels we studied. This filtering
avoids the type of bias that can be caused by ignoring CNVs that indeed exist in a patient.
Although this process reduces sample size and limits our biological conclusions to the relation-
ships between SNVs, the implications are still interesting with respect to the cancer progres-
sion and involved mutations.
Moreover, all weak signals including the loci with total read count less than 20, variant read
count less than 10, or CCF smaller than 0.05 were considered false positives and were elimi-
nated. To tolerate the potential data noise, we set � = 0.2 for SPM. This value was selected from
values {0.05, 0.1, 0.2} based on the consistency of the output pathways and subtypes with the
existing knowledge about the pathways or using clinical data (e.g. survival or disease stage).
We focused our analysis on the list of driver genes considered in [47] for evaluating PLPM.
After the mentioned filtering of CNVs and weak signals, the COAD dataset included 132 sam-
ples and 14 genes (APC, FBXW7, ACVR2A, AMER1, PIK3CA, TCF7L2, TP53, BRAF, KRAS,
NRAS, SMAD2, SMAD4, SOX9, ELF3) with at least one mutation in those samples. The GBM
dataset consisted of 69 samples and 15 genes (IDH1, PTEN, FGFR1, EGFR, NF1, RB1, TP53,
PIK3R1, PIK3R2, PIK3CA, PIK3CB, PIK3C2G, FGFR3, PIK3C2A, ATRX). 12 genes out of 27
initial genes used in [47] were filtered out in our preprocessing as they corresponded to copy
number variations. To compare the results of SPM and PLPM for the same datasets, we binar-
ized these COAD and GBM datasets and applied PLPM on them.
As per the hyper-parameters, we tried the range of values T 2 {1, . . ., 4} and K 2 {2, . . ., 8}
and picked the result with the best value of the objective function. Each experiment was per-
formed in a parallel mode with 32 CPU cores using Rcplex R package [50], which is an R inter-
face for CPLEX solver [51]. We limited the running time and memory to at most 40 hours and
256 GB. Due to the complexity of the model and small number of samples, some of the experi-
ments reached these limits and the solutions were not guaranteed to be optimal. However, the
optimality gaps computed by CPLEX for the presented results, which were respectively *13%
and *0% for COAD and GBM datasets, indicate that the solutions are near optimal. As the
sequencing technologies are advancing, the increasing quality of data will make it possible to
incorporate copy number variation data and more samples, which is expected to inform the
searching strategy to find better solutions in shorter time.
Glioblastoma multiforme
GBM has been well studied and a number of notable genes and pathways have been implicated
in the progression of the disease [52]. Mutations in the canonical cancer genes TP53 and
EGFR are well known drivers of GBM in addition to disruptions in the PI3K pathway. Applied
to the GBM dataset, SPM identified four distinct pathways that were significantly altered in
samples, recapitulating much of the known pathways involved in GBM (Fig 3). In three out of
four cases, SPM groups together two or more genes from a known pathway and is reasonably
good at separating pathways from each other. Where SPM struggles is in grouping the PI3K
pathway genes together, spreading them across identified pathways. Despite this, SPM excels
in preserving the mutual exclusivity of the pathways, with no violations of this property in any
of the cases. This is due to the freedom of having multiple subtypes. In contrast, PLPM violates
the mutual exclusivity property in 10 cases, equating to *14%, for the first pathway (Fig 3).
Subtype-specific temporal order of cancer pathway dysregulation
PLOS Computational Biology | https://doi.org/10.1371/journal.pcbi.1007451 November 11, 2019 9 / 19

The reason for this is that the first pathway that PLPM identifies contains 12 genes that corre-
spond to multiple (at least four) known biological pathways. Thus it is highly probably that
two genes from this pathway will be altered in the same sample, therefore violating the mutual
exclusivity property.
Four unique GBM subtypes were also discovered, in contrast to the single subtype
of PLPM, based on the different temporal ordering of mutations in the four pathways. Inter-
estingly, only the first subtype contains aberrations in all of the four identified pathways,
while the subtypes 2, 3, and 4 have 3, 3, and 2 mutated pathways respectively. Survival
analysis (Fig 4) shows subtype 4 having noticeably better survival probability than the other
subtypes, suggesting that the temporal order of mutations is predictive of cancer progres-
sion. Importantly, subtype 4 has no alterations in TP53 or PTEN, two of the main drivers of
GBM.
Additionally, two of the detected subtypes map reasonably onto two of the five subtypes of
GBM described in [52]. Subtype 4 captures the G-CIMP subtype with Jaccard index 0.47 (FDR
p-value 0.04) and subtype 2 maps to Neural subtype with Jaccard index 0.33 (FDR p-value
0.07). In particular, both G-CIMP-high and our subtype 4 are characterized by a high fre-
quency of mutations in IDH1, and in our case is the first mutation to occur (Fig 5). Survival
analysis in [52] shows a striking difference between the G-CIMP-high subtype and their other
molecular subtypes, similar to the difference seen in our survival analysis. A recent review
[53], reinforces the connection between G-CIMP-high tumours and mutations in IDH1 and
the favourable prognoses associated with this subtype. This further supports the importance of
our identified subtypes as they may be predictive of patient outcomes. Furthermore, since the
pathway order is directly related to CCF values, earlier mutations in pathways will be more
populous in the tumour. The relatively small size of each of our pathways makes this even
more actionable from a clinicians standpoint, as opposed to the large and uninformative first
pathway from PLPM.
Fig 3. Results for GBM using SPM (left) and PLPM (right). Genes within the same known pathway are coded by the same color.
The numbers on pathways refer to the pathway numbers in Fig 5.
https://doi.org/10.1371/journal.pcbi.1007451.g003
Subtype-specific temporal order of cancer pathway dysregulation
PLOS Computational Biology | https://doi.org/10.1371/journal.pcbi.1007451 November 11, 2019 10 / 19

Colorectal adenocarcinoma
When applied to the COAD dataset, SPM again identifies four distinct pathways and four sub-
types based on the temporal ordering of those pathways (Fig 6). However, in contrast to the
GBM results, all pathways are altered in each subtype, with no wild-type pathways present.
The separation of genes into their known biological pathways, as defined in [43], is less clear
with the COAD dataset, with genes being spread across the identified pathways. However,
SPM is still effective at maintaining mutual exclusivity with only an average of 13 cases
(� 10%) per pathway as opposed to PLPM which violates this property in 22 cases (� 16%)
per pathway.
Although we could not recognize any advantage for any of the four identified progressions
compared to the progression from PLPM and no single progression fully recapitulating the
known pathways, they provide a meaningful way to stratify patients by correlating to disease
subtype. Therefore, identifying the separate subtypes can still be informative, in particular for
finding the proper ordering of mutations. Raphael and Vandin [47] made the argument that
TP53 mutations occur before KRAS mutations, in contrast to previous reports for COAD but
in line with more recent work on other cancer types. Although their progression supported
this hypothesis, it is in conflict with the high CCF values for KRAS in some samples (Fig 5). In
88 cases (� 67%), the progression from PLPM does not match the ordering of the CCF values,
whereas SPM does not suffer from this issue due to its hard constraints. Our resulting subtypes
are in agreement with the CCF values and suggest that the ordering of KRAS and TP53 is per-
haps more variable than once thought, with KRAS preceeding TP53 in subtypes 1 and 4 and
TP53 preceeding KRAS in subtypes 2 and 3. Finding a single progression based on binarized
data and not CCF values limits this kind of inquiry.
Fig 4. Survival analysis for identified subtypes of GBM.
https://doi.org/10.1371/journal.pcbi.1007451.g004
Subtype-specific temporal order of cancer pathway dysregulation
PLOS Computational Biology | https://doi.org/10.1371/journal.pcbi.1007451 November 11, 2019 11 / 19
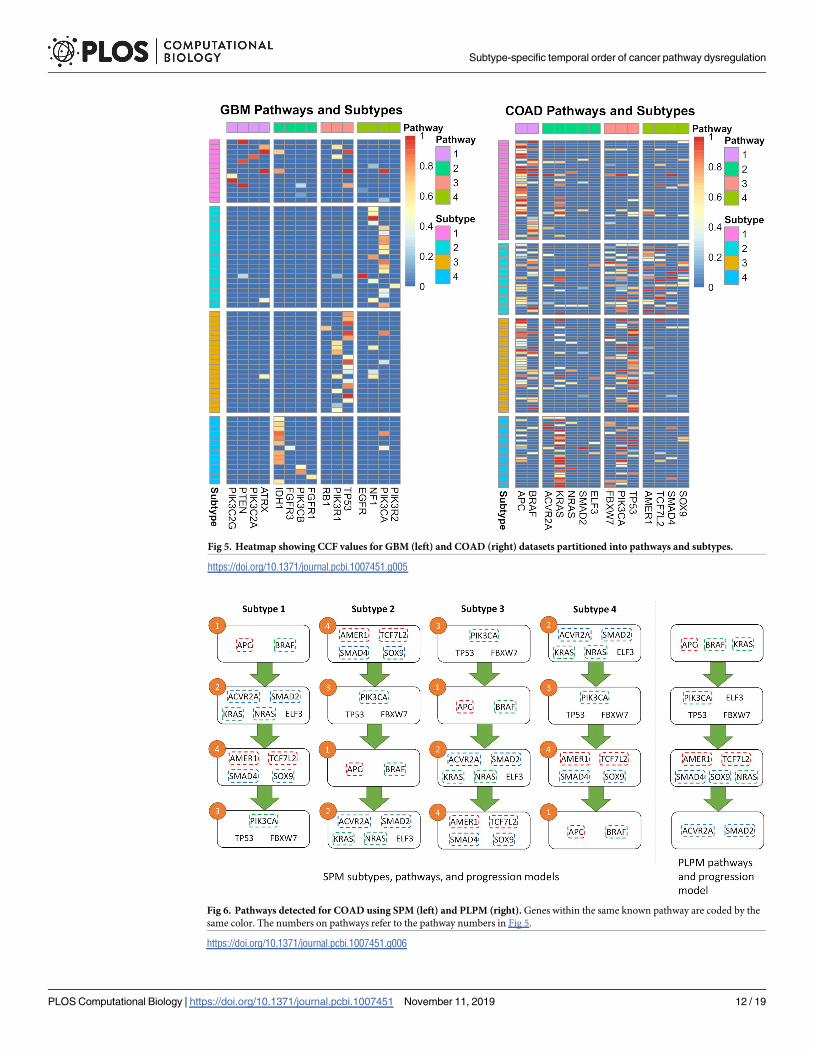
Fig 5. Heatmap showing CCF values for GBM (left) and COAD (right) datasets partitioned into pathways and subtypes.
https://doi.org/10.1371/journal.pcbi.1007451.g005
Fig 6. Pathways detected for COAD using SPM (left) and PLPM (right). Genes within the same known pathway are coded by the
same color. The numbers on pathways refer to the pathway numbers in Fig 5.
https://doi.org/10.1371/journal.pcbi.1007451.g006
Subtype-specific temporal order of cancer pathway dysregulation
PLOS Computational Biology | https://doi.org/10.1371/journal.pcbi.1007451 November 11, 2019 12 / 19

The resulting subtypes for COAD failed to show any meaningful difference in the survival
analysis, unlike the GBM results. However, the subtypes did show some separation when
aligned to the tumour stage, a clinical variable included in the COAD dataset (Fig 7). Subtype
3 appears to be more prevalent in stage iiib compared to other subtypes, indicating that sub-
type 3 maybe be more agressive than the other subtypes. This is further supported by the fact
that subtype 3 is characterized by a high frequency of mutations with large CCF values in
TP53, a major driver in all cancers but especially crucial in COAD progression where TP53mutations are associated with drug resistance and poor prognosis [54]. These results suggest
that these identified subtypes may be informative for categorizing samples according to
tumour stage and predicting patient outcomes.
Fig 7. Prevalence of each identified COAD subtype in different disease stages.
https://doi.org/10.1371/journal.pcbi.1007451.g007
Subtype-specific temporal order of cancer pathway dysregulation
PLOS Computational Biology | https://doi.org/10.1371/journal.pcbi.1007451 November 11, 2019 13 / 19

Methods
We propose an integer linear program to solve the SPM problem, which simultaneously opti-
mizes pathways, cancer subtypes, and subtype-specific pathway linear progression. Before
describing our solution for the SPM reconstruction problem, we explain the existing solution
for the PLPM problem proposed in [47], upon which we build the solution of the SPM
problem.
Integer linear program for the PLPM problem
Raphael and Vandin [47] proposed an integer linear programming (ILP) method for the
PLPM. Given a binary matrix M 2 {0, 1}m×n indicating the existence (1) or absence (0) of a
mutation in genes {g1, g2, . . ., gn} for samples {r1, r2, . . ., rm}, where rows and columns of Mrespectively correspond to the samples and the genes, and a parameter K indicating the num-
ber of pathways to be discovered, they introduced a model for partitioning the genes into Kpathways P = {P1, . . ., PK} such that:
• For all 1� k� K we have |{gj 2 Pk: Mi,j = 1}|� 1 (mutual exclusivity)
• For all 1� k� K, if |{gj 2 Pk: Mi,j = 1}| > 0 then |{gj 2 Pk−1: Mi,j = 1}| > 0 (progression)
The first constraint guarantees the mutual exclusivity of genes inside each pathway k and
the second constraint ensures that if pathway k has a mutation then all preceding pathways in
the progression model (Pk0, k0 < k) are also mutated (i.e., have at least one mutation). Then,
they define the objective function as the number of elements of the matrix M that need to be
flipped (0! 1 or 1! 0) such that the above-mentioned constraints are satisfied. Their objec-
tive was:
minXm
i¼1
XK
k¼1
Xn
j¼1
ðMi;jpj;k � ai;k þ 2fi;kÞ; ð1Þ
where pj,k is a binary variable indicating whether gene gj is assigned to pathway Pk (pj,k = 1) or
not (pj,k = 0), ai,k is a binary variable indicating whether sample ri has mutation (after the
required flips) in pathway Pk (ai,k = 1) or not (ai,k = 0), and fi,k is a binary variable indicating
whether any of the genes in Pk for sample ri should be flipped 0! 1 (fi,k = 1) or not (fi,k = 0).
Then the constraints for the linear program are as follows:
• Each gene is assigned to exactly one partition: for 1� j� n,PK
k¼1pj;k ¼ 1;
• For each pathway Pk, at least one gene is assigned to it: for 1� k� K,Pn
j¼1pj;k � 1.
• PLPM is satisfied for each sample: for 1� i�m and 1� k� K − 1, ai,k� ai,k+1.
• For each sample ri, pathway Pk is considered mutated if it has a 1 in ri or if one of its
entries in ri is flipped to make it mutated (i.e. fi,k = 1): for 1� i�m and 1� k� K,Pn
j¼1Mi;jpj;k þ fi;k � ai;k.
Integer linear program for the SPM problem
As stated earlier, we assume that the linear relationships between the pathways are subtype-
specific, meaning that the samples can be divided into groups with different linear orders.
More specifically, in our model, each subtype is associated with a distinct linear progression
model between K pathways.
Subtype-specific temporal order of cancer pathway dysregulation
PLOS Computational Biology | https://doi.org/10.1371/journal.pcbi.1007451 November 11, 2019 14 / 19

To model cancer subtypes and continuous CCF values instead of binary mutations, new
variables are introduced and some of the variables in PLPM ILP are replaced, resulting in a
total of [Kn(m + 1) + T(m + K2)] 2 O(mnK) binary latent values. We add the SPM inputs C, T,
and � as well as the following variables and inputs:
• A binary variable s 2 {0, 1}m×T, where si,t denotes that whether sample i belongs to subtype t.The total number of subtypes is restricted by an input parameter T, which is given as input.
For 1� t� T and 1� i�m, si,t = 1 means that sample i is consistent with the progression
in subtype t and si,t = 0 means otherwise.
• A binary variable A 2 {0, 1}T×K×K representing the ancestry matrices of relationships of path-
ways for each subtype. At,k, l denotes that, according to the progression model defined by
subtype t, whether the mutation of pathway k happens before pathway l (At,k, l = 1) or not
(At,k, l = 0). A captures and constraints the linear order of mutation of pathways.
• A binary input M 2 {0, 1}m×n indicating whether Ci,j> 0 (Mi,j = 1) or not (Mi,j = 0). Mi,j is
the binarization of the original CCF matrix and facilitates the design of integer linear pro-
gram as described later.
• A binary variable α 2 {0, 1}m×n×K with αi,j, k indicating whether gene j of sample i corre-
sponds to the CCF value representative of pathway k (αi,j, k = 1) or not (αi,j, k = 0). If this vari-
able is equal to 1, it means that first, gene j is assigned to pathway k (pj,k = 1), second, there is
a mutation in gene j of sample i (Mi,j = 1), and third, considering the CCF of gene j for path-
way k in sample i is consistent with the progression model and results in an optimal model.
Thus, αi,j, k gives us control over the choice of mutation within each pathway to optimize the
objective function.
We also extend the constraints of the PLPM ILP. Firstly, similar to constraints for pathways,
we introduce two constraints to enforce a surjective function from samples to subtypes. These
constraints will guarantee each subtype is assigned at least one sample and each sample is
assigned to exactly one subtype. Second, we introduce a constraint to regulate the behavior of
αi,j,k, that is, αi,j,k = 1 can be true only if pj,k = 1. Third, progression constraints are updated
using both At,k,l and si,t in order to satisfy our assumption of subtype-specificity. Additionally,
since bulk-sequencing data become more and more reliable as the sequencing technologies
improve and since, unlike binary data, flipping from 0 to 1 is not accurate for continuous CCF
data, we assume there is no false negative in the observed mutation matrix.
More formally, the [m + n + mn + K + T + KT + mK(n + 1 + T(K − 1)/2)] 2 O(max{mTK2,
mnK}) constraints for SPM ILP are as follows:
• Each gene is assigned to exactly one pathway: for 1� j� n,PK
k¼1pj;k ¼ 1.
• For each pathway Pk, at least one gene is assigned to it: for 1� k� K,Pn
j¼1pj;k � 1.
• Each sample is assigned to exactly one subtype: for 1� i�m,PT
t¼1si;t ¼ 1.
• For each subtype, at least one sample is assigned to it: 1� t� T,Pm
i¼1si;t � 1.
• Gene gj is considered mutated in pathway Pk only if it belongs to that pathway: for 1� i�m, 1� j� n, and 1� k� K, αi,j,k� pj,k.
• Each pathway Pk has at most one gene mutated: for 1� i�m and 1� k� K,Pn
j¼1ai;j;k � 1.
• For each subtype, pathways are mutated in a linear order, for 1� k� K and 1� t� T,PK
l¼1ðAt;k;l þ At;l;kÞ ¼ K � 1; ðl 6¼ kÞ.
Subtype-specific temporal order of cancer pathway dysregulation
PLOS Computational Biology | https://doi.org/10.1371/journal.pcbi.1007451 November 11, 2019 15 / 19

• Each sample satisfies the progression model of its corresponding subtype: for 1� i�m, 1�
t� T, and 1� k, l� K (l 6¼ k),Pn
j¼1ai;j;kCi;j �
Pnj¼1ai;j;lCi;j � si;t þ At;k;l � 2 � �.
• The values of α is bounded by observed mutations and we assume no false negatives: for 1�
i�m and 1� j� n,PK
k¼1ai;j;k � Mi;j.
The objective function of SPM is as follows:
minX
i;j;k
ðCi;jpj;k � Ci;jai;j;kÞ ð2Þ
In this formula, the term Ci,j pj,k represents the observed CCF profiles, and the term Ci,j αi,j,k represents the CCF profile “predicted” by the SPM. The objective of SPM is to determine the
pathways, subtypes, and the pathway progression models of the subtypes that minimize the dif-
ference between the observed CCFs and the CCFs “predicted” by the SPM.
Conclusions
This work introduces a new mathematical model, called SPM, to simultaneously capture can-
cer subtypes and pathways as well as the pathway progression models of each subtype. The
underlying assumptions are mutual exclusivity of mutations within each pathway, the correla-
tion between CCF value and mutation timing, and the subtype-specificity of cancer progres-
sion. Based on experiments with 9 synthetic datasets, SPM is very robust against different
problem specifics, such as the number of patients, subtypes and pathways and data noise,
while PLPM is sensitive to these factors. Based on experiments with two real datasets, namely
GBM and COAD, the detected subtypes correlated to the clinical attributes such as survival
and tumor stage. Additionally, the discovered pathways contained genes known to be related
to each other. The relative importance of the pathways in different subtypes with respect to the
progression models was consistent with the existing knowledge. In some cases, the pathways
detected by the SPM were more informative than the pathways identified by an existing
model, namely PLPM.
As an NP-Hard problem, similar to PLPM, the ILP solution for SPM is hindered by factors
such as quality of the input data and available computational power. This also restricts the
number of genes and samples that can be included in the input. Therefore, employing alterna-
tive optimization methods is a new direction for future work. Moreover, extending the model
to automatically select a subset of the input genes (e.g. based on mutual exclusivity) to be
included in the progression inference can increase the generality of SPM. Although the pro-
posed model is applicable to both SNVs and CNVs, this study was restricted to SNVs due to
the limitation of current technology for computing CCF values in presence of CNVs. This lim-
itation should be addressed in future work as the required technology becomes available.
Author Contributions
Conceptualization: Sahand Khakabimamaghani.
Data curation: Sahand Khakabimamaghani, Dujian Ding.
Formal analysis: Sahand Khakabimamaghani, Dujian Ding.
Investigation: Martin Ester.
Methodology: Sahand Khakabimamaghani, Dujian Ding, Martin Ester.
Project administration: Sahand Khakabimamaghani.
Subtype-specific temporal order of cancer pathway dysregulation
PLOS Computational Biology | https://doi.org/10.1371/journal.pcbi.1007451 November 11, 2019 16 / 19

Software: Dujian Ding.
Supervision: Martin Ester.
Validation: Sahand Khakabimamaghani, Dujian Ding, Oliver Snow.
Visualization: Sahand Khakabimamaghani, Oliver Snow.
Writing – original draft: Sahand Khakabimamaghani, Dujian Ding, Oliver Snow, Martin
Ester.
Writing – review & editing: Oliver Snow, Martin Ester.
References1. The Cancer Genome Atlas Research Network. Comprehensive genomic characterization defines
human glioblastoma genes and core pathways. Nature. 2008; 455:1061. https://doi.org/10.1038/
nature07385 PMID: 18772890
2. Zhang J, Baran J, Cros A, Whitty B, Rivkin E, Hsu J, et al. International Cancer Genome Consortium
Data Portal—a one-stop shop for cancer genomics data. Database. 2011; 2011. https://doi.org/10.
1093/database/bar026
3. Raphael BJ, Vandin F. Simultaneous Inference of Cancer Pathways and Tumor Progression from
Cross-Sectional Mutation Data. Journal of Computational Biology. 2015; 22(6):510–527. https://doi.org/
10.1089/cmb.2014.0161 PMID: 25785493
4. Hajirasouliha I, Mahmoody A, Raphael BJ. A combinatorial approach for analyzing intra-tumor hetero-
geneity from high-throughput sequencing data. Bioinformatics. 2014; 30(12):i78–i86. https://doi.org/10.
1093/bioinformatics/btu284 PMID: 24932008
5. Donmez N, Malikic S, Wyatt AW, Gleave ME, Collins CC, Sahinalp SC. Clonality Inference from Single
Tumor Samples Using Low Coverage Sequence Data. In: Singh M, editor. Research in Computational
Molecular Biology. Cham: Springer International Publishing; 2016. p. 83–94.
6. Deshwar AG, Vembu S, Yung CK, Jang GH, Stein L, Morris Q. PhyloWGS: reconstructing subclonal
composition and evolution from whole-genome sequencing of tumors. Genome biology. 2015; 16(1):35.
https://doi.org/10.1186/s13059-015-0602-8 PMID: 25786235
7. El-Kebir M, Oesper L, Acheson-Field H, Raphael BJ. Reconstruction of clonal trees and tumor composi-
tion from multi-sample sequencing data. Bioinformatics. 2015; 31(12):i62–i70. https://doi.org/10.1093/
bioinformatics/btv261 PMID: 26072510
8. Popic V, Salari R, Hajirasouliha I, Kashef-Haghighi D, West RB, Batzoglou S. Fast and scalable infer-
ence of multi-sample cancer lineages. Genome biology. 2015; 16(1):91. https://doi.org/10.1186/
s13059-015-0647-8 PMID: 25944252
9. Malikic S, McPherson AW, Donmez N, Sahinalp CS. Clonality inference in multiple tumor samples
using phylogeny. Bioinformatics. 2015; 31(9):1349–1356. https://doi.org/10.1093/bioinformatics/btv003
PMID: 25568283
10. Ross EM, Markowetz F. OncoNEM: inferring tumor evolution from single-cell sequencing data. Genome
Biology. 2016; 17(1):69. https://doi.org/10.1186/s13059-016-0929-9 PMID: 27083415
11. Jahn K, Kuipers J, Beerenwinkel N. Tree inference for single-cell data. Genome biology. 2016; 17(1):86.
https://doi.org/10.1186/s13059-016-0936-x PMID: 27149953
12. Zafar H, Tzen A, Navin N, Chen K, Nakhleh L. SiFit: inferring tumor trees from single-cell sequencing
data under finite-sites models. Genome biology. 2017; 18(1):178. https://doi.org/10.1186/s13059-017-
1311-2 PMID: 28927434
13. Malikic S, Jahn K, Kuipers J, Sahinalp C, Beerenwinkel N. Integrative inference of subclonal tumour
evolution from single-cell and bulk sequencing data. bioRxiv. 2017;.
14. Malikic S, Ciccolella S, Mehrabadi FR, Ricketts C, Rahman MK, Haghshenas E, et al. PhISCS-A Com-
binatorial Approach for Sub-perfect Tumor Phylogeny Reconstruction via Integrative use of Single Cell
and Bulk Sequencing Data. bioRxiv. 2018; p. 376996.
15. Fearon ER, Vogelstein B. A genetic model for colorectal tumorigenesis. Cell. 1990; 61(5):759–767.
https://doi.org/10.1016/0092-8674(90)90186-i PMID: 2188735
16. Desper R, Jiang F, Kallioniemi OP, Moch H, Papadimitriou CH, Schaffer AA. Inferring Tree Models for
Oncogenesis from Comparative Genome Hybridization Data. Journal of Computational Biology. 1999;
6(1):37–51. https://doi.org/10.1089/cmb.1999.6.37 PMID: 10223663
Subtype-specific temporal order of cancer pathway dysregulation
PLOS Computational Biology | https://doi.org/10.1371/journal.pcbi.1007451 November 11, 2019 17 / 19

17. Desper R, Jiang F, Kallioniemi OP, Moch H, Papadimitriou CH, Schaffer AA. Distance-Based Recon-
struction of Tree Models for Oncogenesis. Journal of Computational Biology. 2000; 7(6):789–803.
https://doi.org/10.1089/10665270050514936 PMID: 11382362
18. Beerenwinkel N, Rahnenfuhrer J, Daumer M, Hoffmann D, Kaiser R, Selbig J, et al. Learning Multiple
Evolutionary Pathways from Cross-Sectional Data. Journal of Computational Biology. 2005; 12(6):584–
598. https://doi.org/10.1089/cmb.2005.12.584 PMID: 16108705
19. Beerenwinkel N, Rahnenfuhrer J, Kaiser R, Hoffmann D, Selbig J, Lengauer T. Mtreemix: a software
package for learning and using mixture models of mutagenetic trees. Bioinformatics. 2005; 21(9):2106–
2107. https://doi.org/10.1093/bioinformatics/bti274 PMID: 15657098
20. Rahnenfuhrer J, Beerenwinkel N, Schulz WA, Hartmann C, von Deimling A, Wullich B, et al. Estimating
cancer survival and clinical outcome based on genetic tumor progression scores. Bioinformatics. 2005;
21(10):2438–2446. https://doi.org/10.1093/bioinformatics/bti312 PMID: 15705654
21. Tofigh A, Sjolund E, Hoglund M, Lagergren J. A Global Structural EM Algorithm for a Model of Cancer
Progression. Adv Neural Inform Process Syst. 2011; 24:163–171.
22. Hjelm M, Hoglund M, Lagergren J. New Probabilistic Network Models and Algorithms for Oncogenesis.
Journal of Computational Biology. 2006; 13(4):853–865. https://doi.org/10.1089/cmb.2006.13.853
PMID: 16761915
23. Gerstung M, Baudis M, Moch H, Beerenwinkel N. Quantifying cancer progression with conjunctive
Bayesian networks. Bioinformatics. 2009; 25(21):2809–2815. https://doi.org/10.1093/bioinformatics/
btp505 PMID: 19692554
24. Beerenwinkel N, Sullivant S. Markov models for accumulating mutations. Biometrika. 2009; 96(3):645–
661. https://doi.org/10.1093/biomet/asp023
25. Beerenwinkel N, Eriksson N, Sturmfels B. Evolution on distributive lattices. Journal of Theoretical Biol-
ogy. 2006; 242(2):409—420. https://doi.org/10.1016/j.jtbi.2006.03.013 PMID: 16650439
26. Beerenwinkel N, Eriksson N, Sturmfels B. Conjunctive Bayesian Networks. Bernoulli. 2007; 13(4):893–
909. https://doi.org/10.3150/07-BEJ6133
27. Sakoparnig T, Beerenwinkel N. Efficient sampling for Bayesian inference of conjunctive Bayesian net-
works. Bioinformatics. 2012; 28(18):2318–2324. https://doi.org/10.1093/bioinformatics/bts433 PMID:
22782551
28. Shahrabi Farahani H, Lagergren J. Learning Oncogenetic Networks by Reducing to Mixed Integer Lin-
ear Programming. PLOS ONE. 2013; 8(6):1–8. https://doi.org/10.1371/journal.pone.0065773
29. Caravagna G, Giarratano Y, Ramazzotti D, Tomlinson I, Graham TA, Sanguinetti G, et al. Detecting
repeated cancer evolution from multi-region tumor sequencing data. Nature Methods. 2018; 15(9):707–
714. https://doi.org/10.1038/s41592-018-0108-x PMID: 30171232
30. Vogelstein B, Papadopoulos N, Velculescu VE, Zhou S, Diaz LA, Kinzler KW. Cancer Genome Land-
scapes. Science. 2013; 339(6127):1546–1558. https://doi.org/10.1126/science.1235122 PMID:
23539594
31. Biological Pathways;. https://www.genome.gov/27530687/.
32. Gerstung M, Eriksson N, Lin J, Vogelstein B, Beerenwinkel N. The Temporal Order of Genetic and Path-
way Alterations in Tumorigenesis. PLOS ONE. 2011; 6(11):1–9. https://doi.org/10.1371/journal.pone.
0027136
33. Cheng YK, Beroukhim R, Levine RL, Mellinghoff IK, Holland EC, Michor F. A Mathematical Methodol-
ogy for Determining the Temporal Order of Pathway Alterations Arising during Gliomagenesis. PLOS
Computational Biology. 2012; 8(1):1–15. https://doi.org/10.1371/journal.pcbi.1002337
34. Kanehisa M, Goto S. KEGG: Kyoto Encyclopedia of Genes and Genomes. Nucleic Acids Research.
2000; 28(1):27–30. https://doi.org/10.1093/nar/28.1.27 PMID: 10592173
35. Yeang CH, McCormick F, Levine A. Combinatorial patterns of somatic gene mutations in cancer. The
FASEB Journal. 2008; 22(8):2605–2622. https://doi.org/10.1096/fj.08-108985 PMID: 18434431
36. Miller CA, Settle SH, Sulman EP, Aldape KD, Milosavljevic A. Discovering functional modules by identi-
fying recurrent and mutually exclusive mutational patterns in tumors. BMC Medical Genomics. 2011;
4(1):34. https://doi.org/10.1186/1755-8794-4-34 PMID: 21489305
37. Vandin F, Upfal E, Raphael BJ. De novo discovery of mutated driver pathways in cancer. Genome
Research. 2012; 22(2):375–385. https://doi.org/10.1101/gr.120477.111 PMID: 21653252
38. Ciriello G, Cerami E, Sander C, Schultz N. Mutual exclusivity analysis identifies oncogenic network mod-
ules. Genome Research. 2012; 22(2):398–406. https://doi.org/10.1101/gr.125567.111 PMID: 21908773
39. Leiserson MDM, Blokh D, Sharan R, Raphael BJ. Simultaneous Identification of Multiple Driver Path-
ways in Cancer. PLOS Computational Biology. 2013; 9(5):1–15. https://doi.org/10.1371/journal.pcbi.
1003054
Subtype-specific temporal order of cancer pathway dysregulation
PLOS Computational Biology | https://doi.org/10.1371/journal.pcbi.1007451 November 11, 2019 18 / 19

40. Cristea S, Kuipers J, Beerenwinkel N. pathTiMEx: Joint Inference of Mutually Exclusive Cancer Path-
ways and Their Progression Dynamics. Journal of Computational Biology. 2017; 24(6):603–615.
https://doi.org/10.1089/cmb.2016.0171 PMID: 27936934
41. Szczurek E, Beerenwinkel N, Mohammadi P, Constantinescu S, Rahnenfuhrer J. TiMEx: a waiting time
model for mutually exclusive cancer alterations. Bioinformatics. 2015; 32(7):968–975. https://doi.org/
10.1093/bioinformatics/btv400 PMID: 26163509
42. Cancer Genome Atlas Research Network. Comprehensive genomic characterization defines human
glioblastoma genes and core pathways. Nature. 2008; 455(7216):1061. https://doi.org/10.1038/
nature07385 PMID: 18772890
43. Cancer Genome Atlas Network. Comprehensive molecular characterization of human colon and rectal
cancer. Nature. 2012; 487(7407):330. https://doi.org/10.1038/nature11252 PMID: 22810696
44. National Cancer Institute. NCI Dictionary of Cancer Terms;. https://www.cancer.gov/publications/
dictionaries/cancer-terms/def/cancer-subtype.
45. Ortmann CA, Kent DG, Nangalia J, Silber Y, Wedge DC, Grinfeld J, et al. Effect of Mutation Order on
Myeloproliferative Neoplasms. New England Journal of Medicine. 2015; 372(7):601–612. https://doi.
org/10.1056/NEJMoa1412098 PMID: 25671252
46. Nangalia J, Nice FL, Wedge DC, Godfrey AL, Grinfeld J, Thakker C, et al. DNMT3A mutations occur
early or late in patients with myeloproliferative neoplasms and mutation order influences phenotype.
Haematologica. 2015; 100(11):e438–e442. https://doi.org/10.3324/haematol.2015.129510 PMID:
26250577
47. Raphael BJ, Vandin F. Simultaneous Inference of Cancer Pathways and Tumor Progression from
Cross-Sectional Mutation Data. In: Sharan R, editor. Research in Computational Molecular Biology.
Cham: Springer International Publishing; 2014. p. 250–264.
48. Agarwal A, Charikar M, Makarychev K, Makarychev Y. (ffiffiffiffiffiffiffiffiffiffilog n
p) Approximation Algorithms for Min
UnCut, Min 2CNF Deletion, and Directed Cut Problems. In: Proceedings of the Thirty-seventh Annual
ACM Symposium on Theory of Computing. STOC’05. New York, NY, USA: ACM; 2005. p. 573–581.
Available from: http://doi.acm.org/10.1145/1060590.1060675.
49. Roth A, Khattra J, Yap D, Wan A, Laks E, Biele J, et al. PyClone: statistical inference of clonal popula-
tion structure in cancer. Nat Methods. 2014; 11(4):396–398. https://doi.org/10.1038/nmeth.2883 PMID:
24633410
50. Bravo HC, Theussl S. Rcplex: R Interface to CPLEX; 2016. Available from: https://CRAN.R-project.org/
package=Rcplex.
51. IBM. CPLEX Optimizer;. https://www.ibm.com/analytics/cplex-optimizer.
52. Brennan CW, Verhaak RG, McKenna A, Campos B, Noushmehr H, Salama SR, et al. The somatic
genomic landscape of glioblastoma. Cell. 2013; 155(2):462–477. https://doi.org/10.1016/j.cell.2013.09.
034 PMID: 24120142
53. Malta TM, de Souza CF, Sabedot TS, Silva TC, Mosella MS, Kalkanis SN, et al. Glioma CpG island
methylator phenotype (G-CIMP): biological and clinical implications. Neuro-oncology. 2017; 20(5):608–
620. https://doi.org/10.1093/neuonc/nox183
54. Li XL, Zhou J, Chen ZR, Chng WJ. P53 mutations in colorectal cancer-molecular pathogenesis and
pharmacological reactivation. World journal of gastroenterology: WJG. 2015; 21(1):84. https://doi.org/
10.3748/wjg.v21.i1.84 PMID: 25574081
Subtype-specific temporal order of cancer pathway dysregulation
PLOS Computational Biology | https://doi.org/10.1371/journal.pcbi.1007451 November 11, 2019 19 / 19
Recommended