Unclassified ECO/WKP(98)8
Organisation de Coopération et de Développement Economiques OLIS : 23-Apr-1998Organisation for Economic Co-operation and Development Dist. : 04-May-1998__________________________________________________________________________________________
English text onlyECONOMICS DEPARTMENT
TRENDS IN OECD COUNTRIES’ INTERNATIONAL COMPETITIVENESS :THE INFLUENCE OF EMERGING MARKET ECONOMIES :ECONOMICS DEPARTMENT WORKING PAPERS N0. 195
byMartine Durand, Christophe Madaschi and Flavia Terribile
64737
Document complet disponible sur OLIS dans son format d’origine
Complete document available on OLIS in its original format
Unclassified
EC
O/W
KP
(98)8 E
nglish text only
Most Economics Department Working Papers beginning with No. 144 are now available through OECD’sInternet Web site at http://www.oecd.org/eco/eco.
ECO/WKP(98)8
2
ABSTRACT/RÉSUMÉ
The large exchange rate depreciations registered in a number of Asian countries since mid-1997have raised the issue of whether this could lead to major shifts in the relative costs and prices ofproduction across countries, and hence in the relative competitive positions of OECD and non-OECDcountries. To take account of the growing importance of Asian emerging economies in world markets,they have been added, together with a number of other non-OECD emerging market economies, to thegroup of countries covered in the calculation of the OECD Secretariat competitiveness indicators. Themain findings that emerge from the analysis presented in this Working Paper are the following: first, theUnited States is by far the most competitive economy among major OECD countries, both in terms ofhigher productivity performance and lower absolute cost levels in the manufacturing sector. However,emerging market economies for which data are available display significantly lower levels of unit labourcosts than industrialised countries. Recent depreciations will therefore tend to reinforce the competitiveadvantage that these economies already enjoy. Second, Asian emerging market economies influence in asignificant way the pattern of competition of OECD countries and trends in competitiveness indicators.Third, recent changes in relative competitive positions, if lasting, may add to the existing large bilateraltrade imbalances between the major three OECD regions and emerging Asia and affect the location offoreign direct investment.
* * *
Les importantes dépréciations de change enregistrées par un certain nombre d’économiesémergentes d’Asie depuis la mi-97 ont soulevé la question de savoir si cela risquait de conduire à deschangements significatifs de prix et coûts relatifs entre les pays OCDE et non-OECD. Afin de prendre encompte l’importance croissante des économies émergentes d’Asie dans les échanges mondiaux, cesdernières ont été ajoutées, avec d’autres économies émergentes, au groupe de pays entrant dans le calculdes indicateurs de compétitivité du Secrétariat de l’OCDE. Les principaux résultats de l’analyse présentéedans ce document de travail sont les suivants: premièrement, les Etats Unis sont de loin l’économie la pluscompétitive parmi les pays de l’OCDE,à la fois en termes de niveaux de productivité ou de coûts salariauxunitaires de main d’oeuvre dans le secteur manufacturier. Cependant, les niveaux de coût dans leséconomies émergentes pour lesquelles il existe des données sont nettement plus bas que dans n’importequel pays industrialisé. Les dépréciations récentes auront donc tendance à renforcer l’avantageconcurrentiel dont ces économies bénéficient déjà. Deuxièmement, les économies émergentes d’Asie ontune influence significative sur la structure de la concurrence des pays de l’OCDE et sur les évolutions desindicateurs de compétitivité. Troisièmement, s’ils perdurent, les récents changements intervenus dans lespositions concurrentielles relatives risquent d’accroître les importants déséquilibres commerciaux quiexistent déjà entre les principales régions de l’OCDE et les économies émergentes d’Asie ainsi qued’affecter la location des investissements directs à l’étranger.
Copyright: OECD 1998
Applications for permission to reproduce or translate all, or part of, this material should be madeto: Head of Publications Service, OECD, 2 rue André-Pascal, 75775 PARIS CEDEX 16, France.
ECO/WKP(98)8
3
TABLE OF CONTENTS
TRENDS IN OECD COUNTRIES’ INTERNATIONAL COMPETITIVENESS: THE INFLUENCE OF EMERGING MARKET ECONOMIES
I. Introduction and Summary................................................................................................................ 4II. Indicators of relative levels of competitiveness................................................................................ 6III. Indicators of changes in international competitiveness.................................................................... 7
A. The emergence of new competitors in world markets.............................................................. 8B. Changes in relative competitive positions................................................................................ 10
IV. Implications for trade and FDI developments.................................................................................. 11A. Indicators of international competitiveness and trade performance......................................... 12B. Changes in competitiveness and FDI........................................................................................ 13
Tables
1. Relative labour productivity levels in manufacturing2. Manufacturing labour productivity levels by sector3. Relative levels of unit labour costs in manufacturing4. Shares in world merchandise trade5. The importance of emerging market economies in the determination of major OECD regions’ pattern
of competition6. Decomposition by market of the pattern of competition of the three major OECD regions7. Direction of trade8. Bilateral trade balances9. Impact of recent exchange rate changes on current-account balances10. Geographical breakdown of stocks of direct investment abroad in selected countries
Figures
1. Movements in nominal exchange rates2. Structure of manufactured exports in selected OECD and non OECD Asian countries, 19953. Nominal and real effective exchange rates4. Decomposition of real effective exchange rates based on CPI by region5. Real effective exchange rates based on CPI and merchandise export performance6. Shares held in manufactured imports of the three major OECD markets7. Import penetration in major OECD regions
Annex: Recent revisions to international competitiveness indicatorsAnnex Table 1. Weighting MatricesAnnex Figure 1. Real and nominal effective exchange rates in selected non-OECD countriesAnnex Figure 2. Nominal effective exchange rates
ECO/WKP(98)8
4
TRENDS IN OECD COUNTRIES’ INTERNATIONAL COMPETITIVENESS:THE INFLUENCE OF EMERGING MARKET ECONOMIES
Martine Durand, Christophe Madaschi and Flavia Terribile1
I. Introduction and Summary
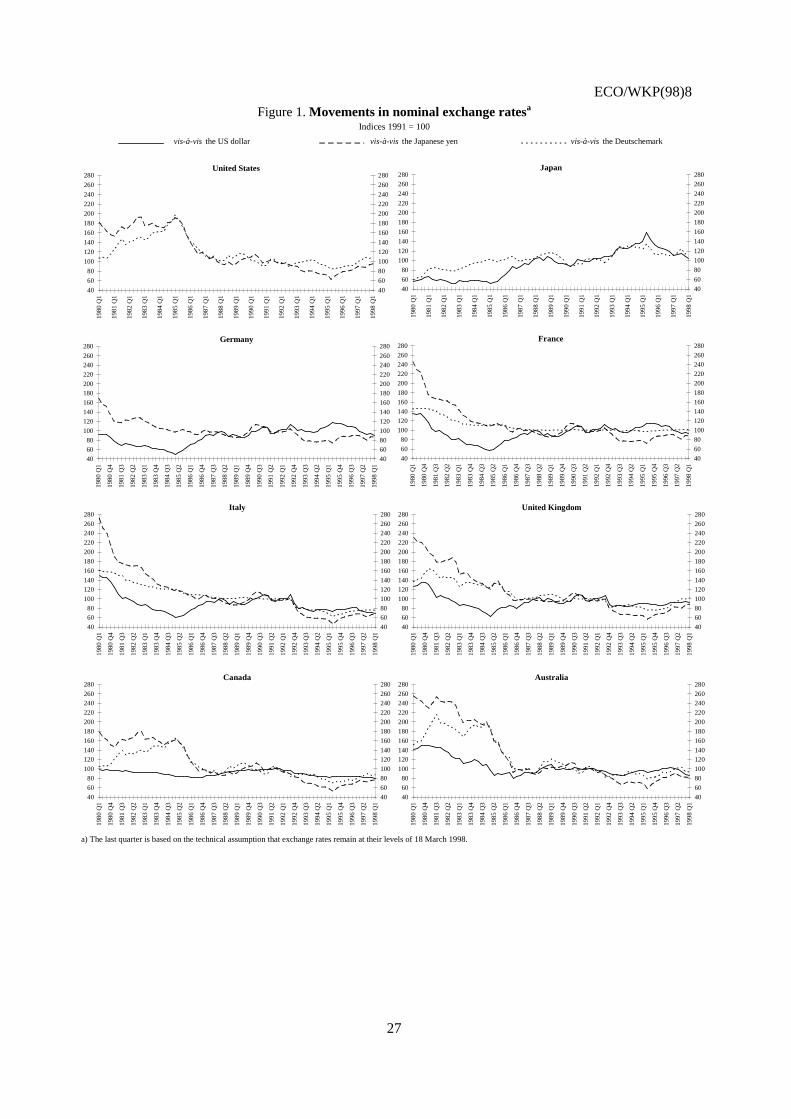
1. Over the past two decades or so, there have been wide swings in nominal exchange ratesbetween the currencies of major OECD countries as well as between the currencies of OECD and anumber of non-OECD countries (Figure 1). These very large movements in exchange rates have at timesproduced substantial shifts in the relative costs and prices of production across countries, and hence in therelative competitive positions and trade balances of OECD and non-OECD countries. Given theincreasing importance of Asian emerging market economies in world trade, the massive currencydepreciations registered by a number of them since mid-1997 have raised the issue of whether this couldlead to a major redistribution of competitiveness gains and losses across countries, resulting in substantialcurrent-account adjustment. In the past, however, potential competitiveness gains deriving from nominalexchange rate depreciations have often tended to be eroded by rising inflation. This paper looks in somedetails at how exchange rate variations and a number of other factors, in particular initial conditions, haveaffected OECD countries’ competitiveness over time.
2. The notion of competitiveness is somewhat vague, however. The broadest approach consists ofcomparing macroeconomic performance and overall living standards, by generally focusing onproductivity trends. In a more narrow sense, the concept of competitiveness captures countries’ ability tosell their products in world markets2. In this context, competitiveness is usually discussed in terms of costand price differentials. Non-price factors, such as technological innovation or the quality of products(including after-sales services), may be equally -- or more -- important, but are typically given less
1. The authors are all members of the OECD Economics Department. Martine Durand is counsellor for
macroeconomic policy. Christophe Madaschi is research assistant in the Non-Member Economies Divisionand Flavia Terribile is an economist in the Monetary and Finance Division. Special thanks go to SusanGascard for technical preparation. Thanks also go to Michael Feiner and Ignazio Visco for their commentson an earlier draft.
2. In principle, competitiveness is a relevant concept only for firms which can gain and lose market shares,and in the latter case, may eventually go out of business. It is not really a relevant concept for countries,because, as argued by P. Krugman (1996), countries cannot go out of business and therefore should not careabout “competitor countries”. There are nonetheless reasons for a country to be concerned with shifts inmarket shares at the sectoral level, because such shifts may imply changes in the sectoral composition ofoutput and in living standards. It clearly cannot be an objective of policy to prevent losses in sectoralmarket shares, as this type of policies cannot be pursued in all countries at the same time, but policies mustensure that the economy is flexible enough to adjust to these shifts at minimum costs and to reallocateresources in order to ultimately improve living standards.
ECO/WKP(98)8
5
attention because they are usually more difficult to compare across countries or do not lend themselvesreadily to quantification.
3. The paper concentrates mainly on the quantifiable aspects of competitiveness, in particular thosethat help explain international trade trends. Estimates of levels of manufacturing productivity3 are firstpresented for a number of countries. While these estimates may provide insights into countries’ relativeeconomic performance and on the potential for catch up, they also give an indication of countries’comparative advantage at any point in time. It is not always the case, however, that high productivityperformance automatically translates into improved competitive positions as measured by relative costsand prices. Much depends, among other things, on trends in labour compensation and exchange rates.Estimates of absolute levels of manufacturing unit labour costs are also reported and compared withproductivity levels. To the extent that prices of tradeable goods across countries converge over time,absolute cost levels also provide benchmarks for assessing equilibrium exchange rates.
4. Given data limitations, however, absolute cost comparisons can only be made for a limitednumber of countries. In order to expand the country coverage, and in particular to take into account theincreasing importance of some emerging market economies as competitors in world markets, trends inindicators of changes in relative prices are also presented4. As opposed to absolute cost, these indicatorsdo not permit a comparison of levels of relative competitiveness across countries, but they provide anindication of whether a country has become more or less competitive than its trading partners over aparticular period. A final section of the paper analyses the implications that changes in relativecompetitive positions among OECD as well as non-OECD countries have had on international trade andforeign direct investment (FDI) developments.
5. The main findings of the paper can be summarised as follows:
-- The United States remains by far the most competitive economy among major OECDcountries. In the manufacturing sector, productivity is higher and absolute cost levels lowerthan elsewhere. However, there is more cross-country variation at the sectoral level;
-- Emerging market economies in Asia, for which similar data are available, display much lowerlevels of unit labour costs than OECD countries;
-- The emergence of new competitors on world markets, especially from East Asia, hassignificantly altered the pattern of OECD countries’ competition. These competitors nowaccount for about 40 per cent of overall competition on domestic and foreign markets forJapan, 25 per cent for the United States and 20 per cent for the European Union. Among thesenew competitors, China in particular is emerging as a major player;
3. While for most OECD countries the services sector now accounts for a growing share of international trade,
data limitations have so far prevented comparisons for a sufficient large number of countries.
4. Up until now, the relative cost and price indices calculated by the OECD were designed so as to encompasscompetition on world markets among competitors from OECD countries as well as from a limited numberof countries in South East Asia whose shares in world trade were expanding rapidly (i.e. Chinese Taipei;Singapore; and Hong Kong, China). To take into account the increasing importance of other emergingmarket economies as competitors in world markets, the OECD Secretariat has revised its indicators toinclude China, Indonesia, Malaysia, the Philippines, Thailand, India, Argentina, Brazil and Russia (thelatter from 1992 onwards). See the Annex for a description of the revised international competitivenessindicators.
ECO/WKP(98)8
6
-- The relative importance of this source of new competition reflects in part the increasingsimilarity of export structures between emerging market economies and OECD countries;
-- The inclusion of new emerging market economies influences more the trends in nominaleffective rates than that of real rates. This is because most phases of effective nominaldepreciations experienced by these economies have, to a large extent, been associated withrising cost and price inflation. Nevertheless, emerging market economies have a significantinfluence on the US and Japanese competitiveness indicators.
-- There appears to be a fairly good link between changes in OECD and non-OECD countries’competitiveness and gains and losses in export market shares;
-- These trends in trade and competitiveness have resulted in large bilateral trade imbalancesbetween the major three OECD regions and Asian emerging market economies takentogether; whether the recent massive depreciations registered in some of these economieswill induce further adjustment is not certain, as there are a number of factors that mightprevent the realisation of potential competitiveness gains;
-- Similarly, competitiveness developments appear to have affected past foreign directinvestment trends, and recent changes in exchange rates, if lasting, may also have an impacton future FDI and thus indirectly on trade flows.
II. Indicators of relative levels of competitiveness
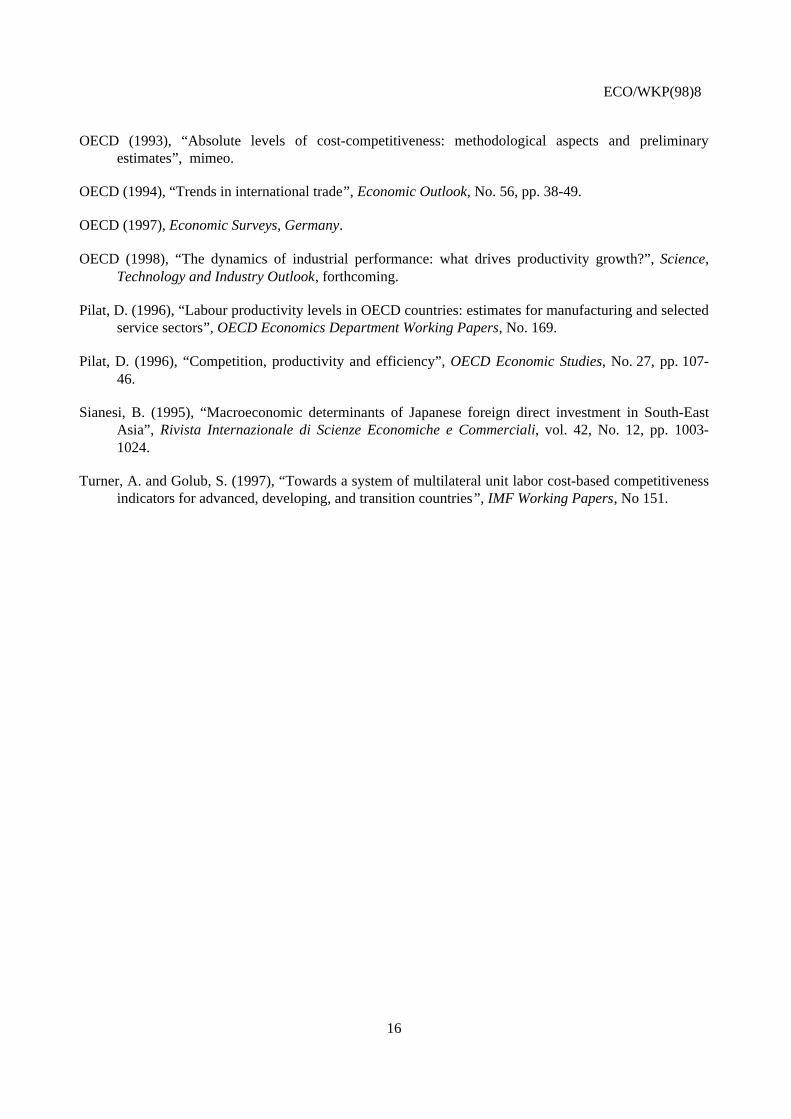
6. The OECD Secretariat has conducted a number of studies to estimate sectoral productivitylevels5. The results of these studies suggest that, notwithstanding the significant changes in the relativeproductivity performance of OECD countries over the past two or three decades, the United States hasconsistently produced more output for labour input at the aggregate manufacturing level than other majorOECD countries. Evidence presented in Table 1 also suggests that US productivity performance has alsoimproved relative to a number of other OECD countries over the past decade. For example, Canada’smanufacturing productivity level was relatively high during the 1970s, but has fallen substantially over thepast decade. Similarly, Germany’s and France’s relative productivity performance has tended todeteriorate since 1985. On the other hand, the productivity gap vis-à-vis the United States has steadilynarrowed in Japan, Italy and the United Kingdom. A number of smaller countries, such as Belgium,Finland, the Netherlands and Sweden are estimated to have high productivity levels. In particular, Finlandand to a lesser extent Sweden improved labour productivity relative to the United States over the pastdecade. This reflects the fact that the manufacturing sectors of these smaller economies tend to be morespecialised than that of the larger countries and relatively capital-intensive.
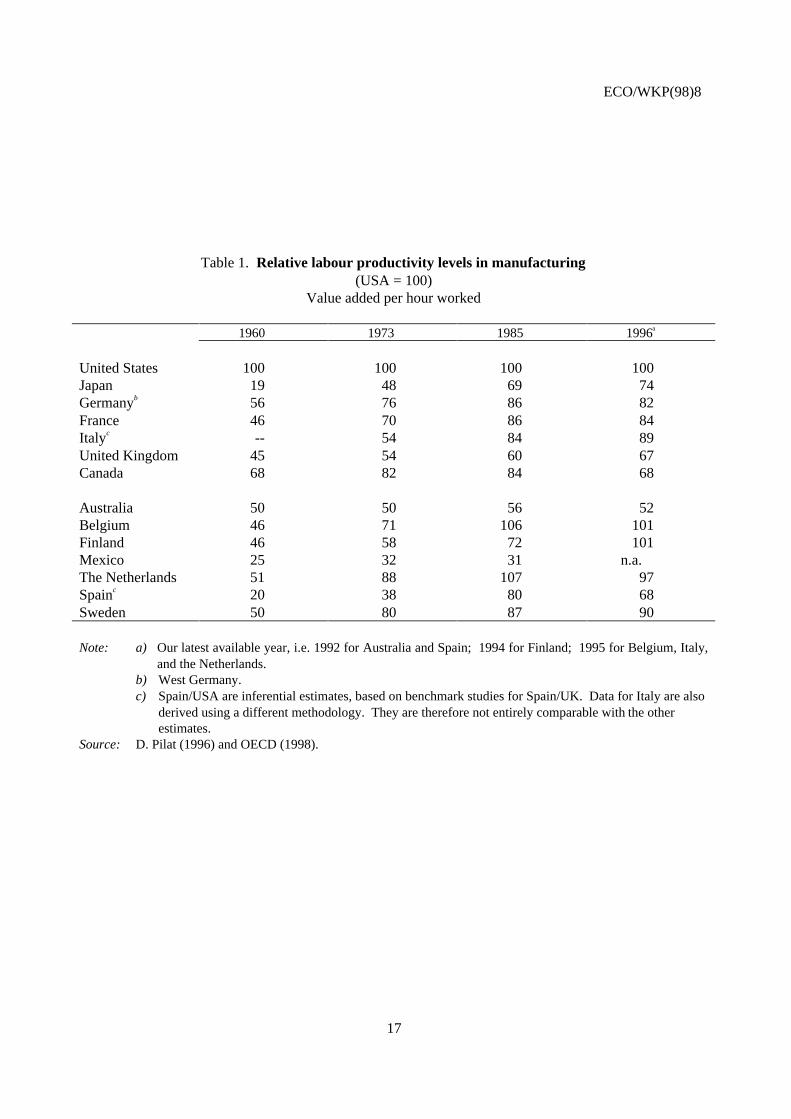
7. Estimates for individual manufacturing industries suggest more cross-country variation than forthe manufacturing sector as a whole (Table 2). In particular, the leadership in specific manufacturingindustries is more diversified. In 1987, the United States was the productivity leader in food products andelectrical machinery, the Netherlands in textiles and chemical products, Japan in basic metal products andtransport equipment, Sweden in paper and metal products. By 1993, some of these relative positions hadchanged however, with the Swedish performance, in particular, improving substantially. The greaterdiversity at the industry level partly reflects differences in specialisation and comparative advantage.However, it may also indicate that productivity performance in some countries is far removed from best- 5. See, for example, D. Pilat (1996) and OECD (forthcoming, 1998).
ECO/WKP(98)8
7
practice, thus indicating a potential for catch-up. Other similar analyses (Hooper and Vrankovich, 1995),as well as country-specific case studies conducted for a few OECD countries (McKinsey, 1993, 1994,1995) which have the advantage that firms and products can be carefully matched, confirm the resultsobtained by the OECD Secretariat regarding the existence of large differences in performance across theOECD area. For instance, in food products, the United States is found to be the undisputed leader, withJapan particularly trailing far behind. In motor vehicles, Japan and the United States are the worldproductivity leaders, clearly outperforming the European countries. In computer equipment, the samestudies point to only small differences between the three major OECD regions for which data areavailable.
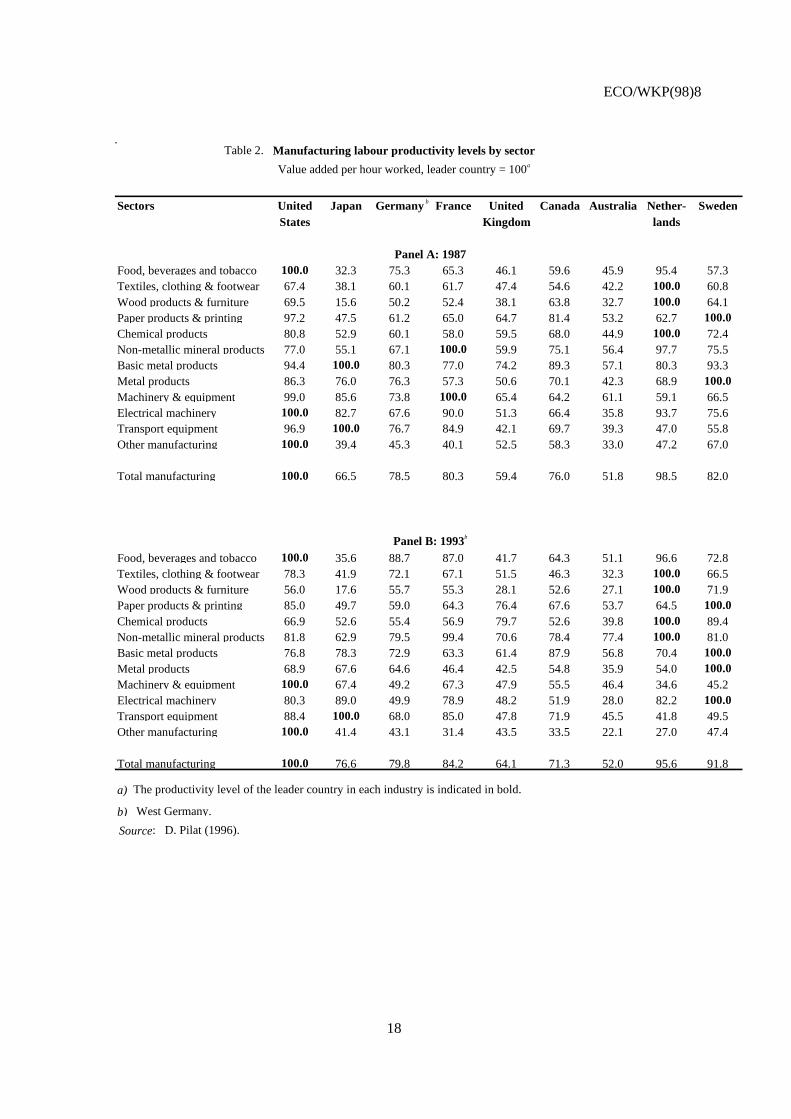
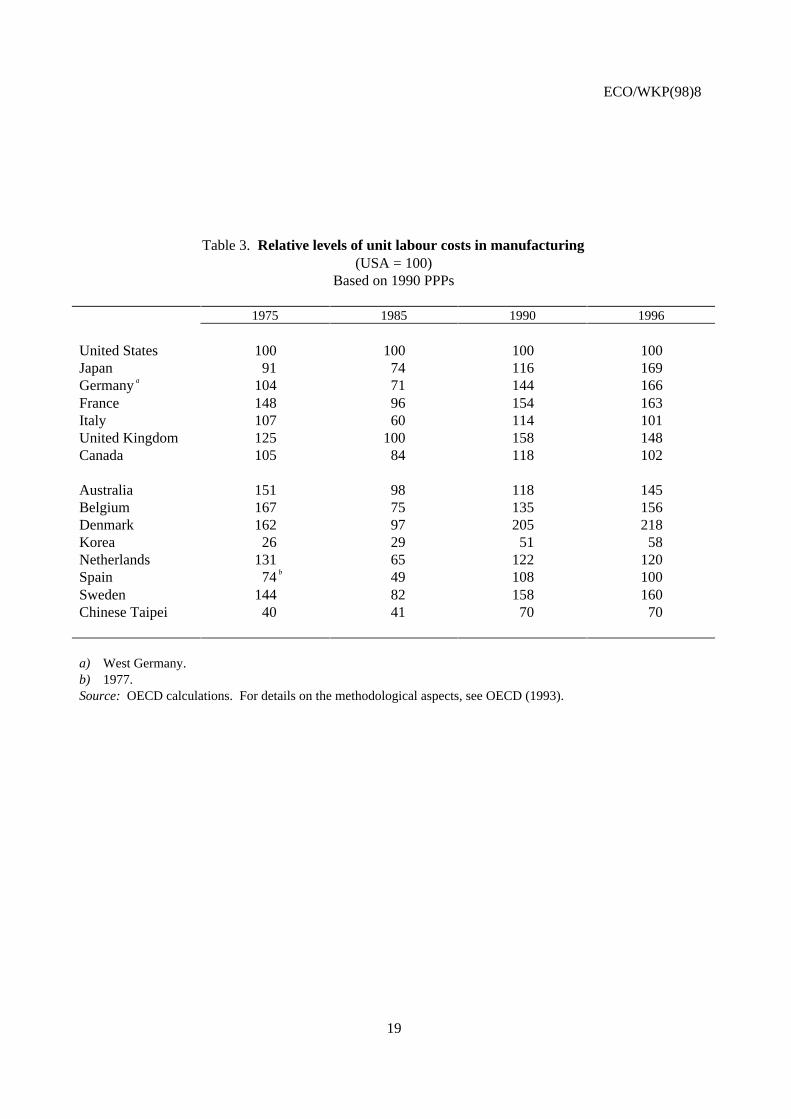
8. Trends in relative levels of manufacturing productivity do not appear to have automaticallytranslated into similar trends in absolute cost levels. In a number of countries cost levels in themanufacturing sector have also been markedly influenced by opposite developments in relative labourcompensation levels and exchange rates. The United States is an exception to this overall picture. Indeed,estimates of absolute unit labour costs in manufacturing6 suggest that the United States has generally beenholding a cost advantage over its main OECD trading partners (Table 3). Since the late 1980s, thisfavourable cost differential has tended to widen, reflecting the depreciation of the US dollar vis-à-vis othermajor OECD currencies. On the other hand, while Japan was estimated to be one of the lowest OECDcost producers in the 1970s and in the early 1980s, its absolute cost competitiveness has deterioratedrapidly and continuously after 1985 when the yen started to appreciate, despite its improved productivityperformance. Germany has experienced a larger relative deterioration in costs than in productivity sincethe mid-80s mainly reflecting a widening of the gap between this country’s and other OECD countries’compensation rates7. Italy and Spain appear to enjoy lower levels of unit labour costs in manufacturingthan other non-emerging OECD countries for which data are available. In the European Union as a wholehowever, as well as in Japan, relative absolute labour costs in 1996 were much higher than those in theUnited States. This may point to future potential exchange rate pressures for the yen and the future euroexchange rates vis-à-vis the US dollar, in the absence of adjustments in Japan’s and EU productivity levelsand/or levels of labour compensation.
9. Among emerging market economies for which absolute cost data are available, it appears that,over the 1975-96 period, Chinese Taipei and Korea have been able to maintain significantly lower levelsof unit labour costs than other OECD countries, despite a substantial deterioration since the late 1980s.Although comparative data are not available, labour cost levels in other emerging market economies inEast Asia are most certainly also lower than in OECD countries. The recent massive exchange ratedepreciations of these economies’ currencies will reinforce the absolute cost advantage that they alreadyenjoy, making them even more competitive internationally.
III. Indicators of changes in international competitiveness
10. Given the difficulty in obtaining and constructing reliable data on comparative levels of unitlabour costs for a sufficiently large number of countries, most analysis on international competitivenessfocuses on variations in relative costs or prices. While this undoubtedly presents some drawbacks, it
6. These absolute cost estimates are based on a somewhat different methodology than the one used to derive
estimates of productivity levels. Comparisons should therefore be interpreted with caution. For moredetails see D. Pilat (1996) and OECD (1993).
7. Figures in Table 3 refer to West Germany only. For developments in productivity and unit labour costs inEastern Germany see OECD Economic Surveys, Germany (1997).
ECO/WKP(98)8
8
nonetheless provides useful information on comparative movements across countries since a base period.For a long time, the OECD Secretariat has calculated and published indicators based on relative unitlabour costs and export prices for the manufacturing sector, as well as relative CPIs8. The principlesguiding the construction of these indicators were that they should encompass most sectors exposed tocompetition, all markets where competition takes place and as many competitors as possible. In practice,the OECD indicators cover the manufacturing sector (taken as a proxy for the tradeable sector) or thewhole economy, competition in all markets, and competitors from OECD countries as well as three Asiannewly industrialising economies (Chinese Taipei, Singapore and Hong Kong, China). Regarding thecoverage of competitors, the recent financial crisis in Asia has raised the question of whether othercountries, mainly emerging market economies, should be included in the calculation of competitivenessindicators.
A. The emergence of new competitors in world markets
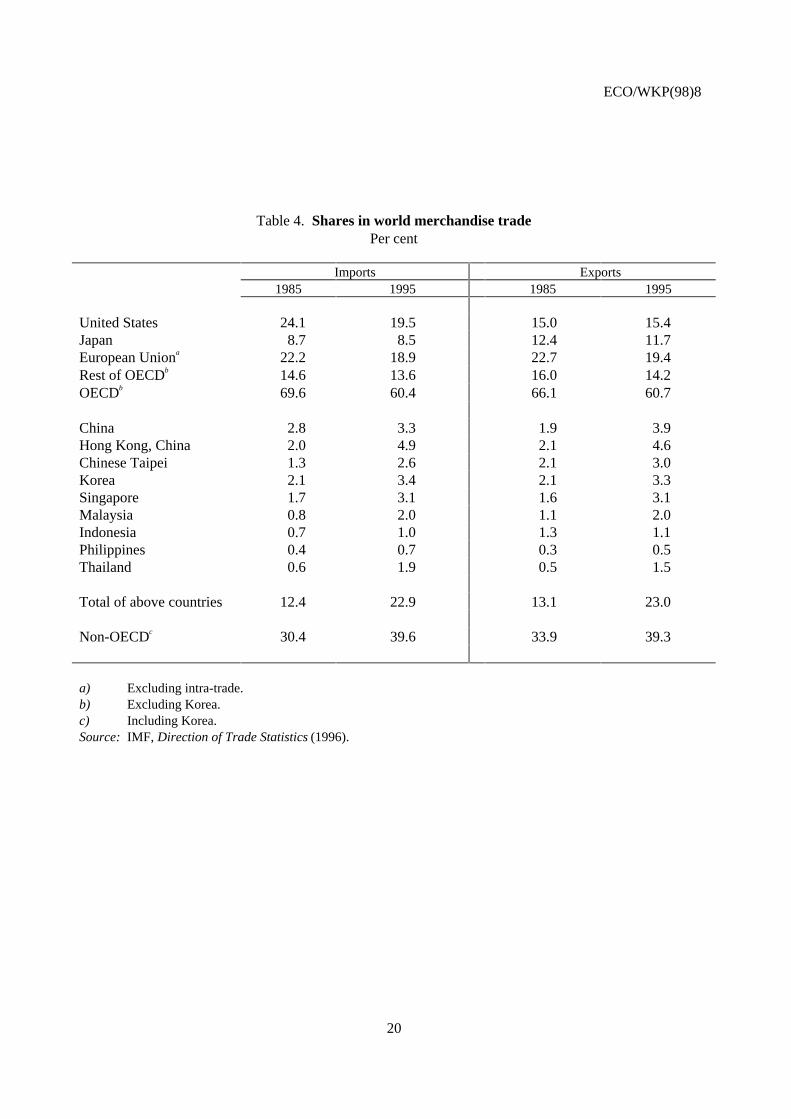
11. While OECD countries continue to dominate world trade, accounting for about three quarters ofboth world merchandise exports and imports (60 per cent if intra-EU trade is excluded), over the past twodecades a number of countries outside the OECD area have become increasingly important players(Table 4). This reflects a major redistribution of both exports and imports within the non-OECD area.From the mid-1970s to the time of the sharp fall in oil prices in 1986, OPEC was by far the largest non-OECD exporter and importer. Since then, however, OPEC’s importance in world trade has diminishedsubstantially. In contrast, emerging economies in Asia -- China, in particular -- have seen their share inword trade expanding steadily, especially in manufacturing. By 1996, Korea, China and other Asianemerging market economies taken as a group had a higher share in world merchandise exports than theUnited States, at about 23 per cent, compared with 13 per cent in 1985.
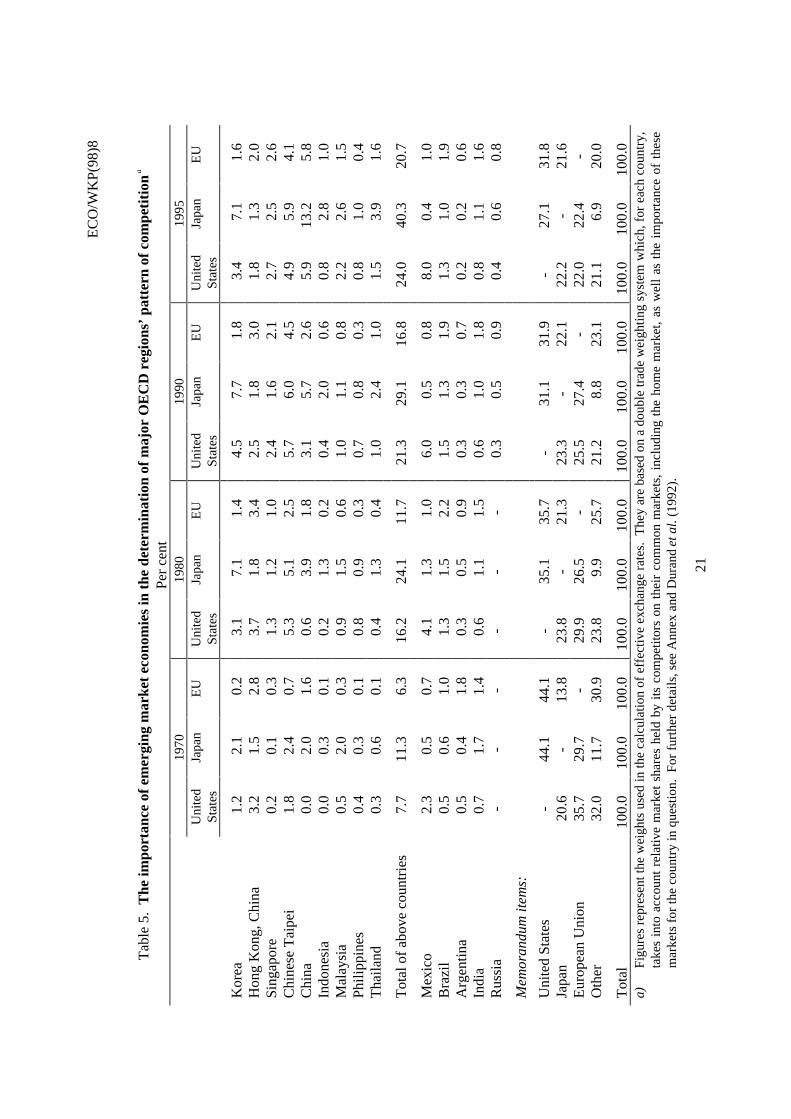
12. The greater importance of emerging Asia in world trade of manufactured goods has had majorimplications for the pattern of competition of the three major OECD regions. Table 5 reports figuresrepresenting market shares held by competitors of the three major OECD regions on all their commonmarkets, including the domestic market, weighted by the importance of these markets for each region.These figures can thus be interpreted as an indication of the relative weight of each competitor in thepattern of competition facing each major OECD economy on their domestic market as well as on thirdmarkets. While in 1970 competition on world markets exerted itself essentially among OECD countries,this is no longer the case. For instance, competition from emerging Asia represented about 6 to 8 per centof overall competition on world markets for the United States and Europe and about 11 per cent for Japanin 1970. It now accounts for more than 20 per cent for Europe, about 25 per cent for the United States andmore than 40 per cent for Japan. Among Asian emerging countries, competition facing OECD regions hasincreased most from Chinese Taipei and Korea in the late 70s and in the 80s, and especially from Chinasince 1990. China is now half as important as a competitor for Japan as either the United States or theEuropean Union. Other emerging market economies outside Asia have also become sizeable competitorsfor the OECD countries. This is especially the case of Mexico for the United States.
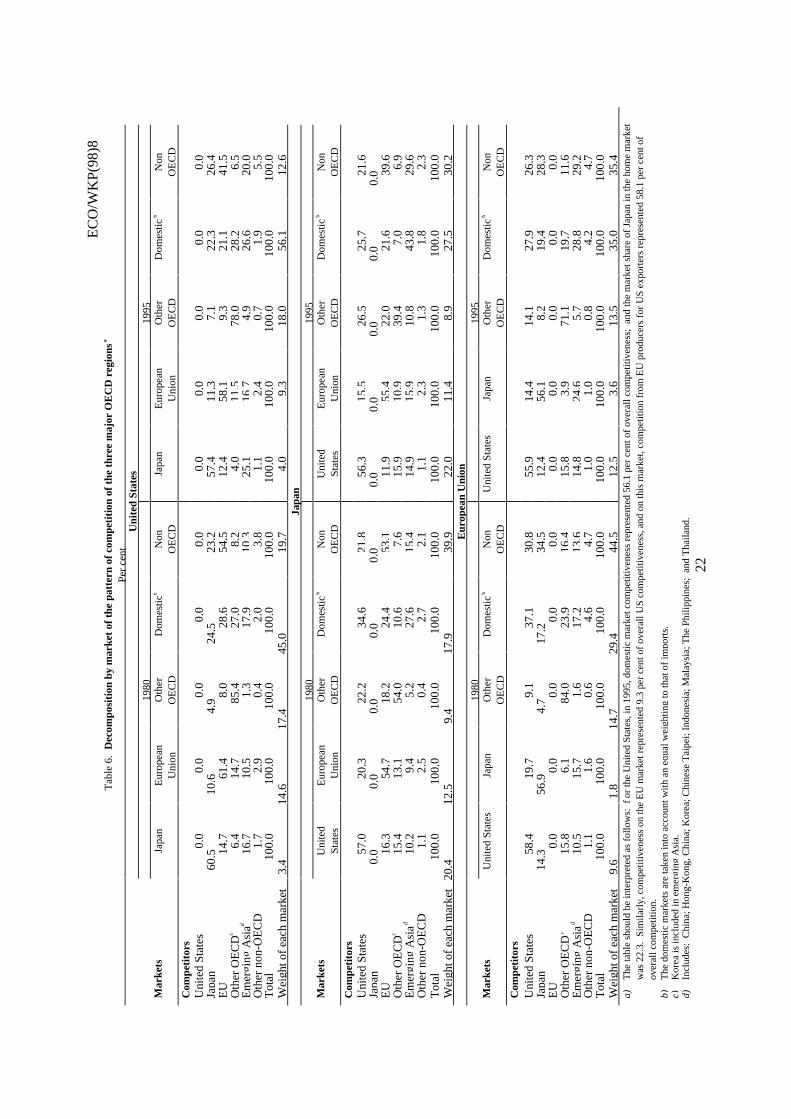
13. A more detailed analysis of changes in the pattern of competition for the major OECD regionscan be obtained by decomposing overall competition according to individual markets. Such adecomposition (Table 6) shows that for the United States, the pattern of competition remains dominatedby the home market (i.e. by competition facing US producers on their own market -- see bottom line of the
8. For a methodological review of the measures of international competitiveness calculated by the OECD, see
Durand and Giorno (1987).
ECO/WKP(98)8
9
panel on the United States). On this market, exporters from Asian emerging countries have becomeincreasingly important as competitors to US producers. Indeed, competition from Asian emerging marketeconomies is now similar to that from Canada and Mexico combined, and has outpaced that from Japanand Europe. The second most important markets for the determination of competition facing the UnitedStates are the “other OECD countries”, which consist mainly of Canada and Mexico, and the non-OECDcountries. In the “other OECD” market, domestic producers have tended to remain the main competitorsfor US exporters. On the non-OECD market, competition from EU exporters -- albeit still the mostimportant -- has declined significantly, compensated by an increase in competition from East Asianeconomies.
14. For Japan, the share of the domestic market in the determination of overall competitiveness hasincreased over time, though remaining much less important than in the case of the United States. Themarket share of exporters from Asian emerging countries on the Japanese home market has increaseddramatically at the expense of US and EU exporters. Other important markets determining Japan’scompetition include the non-OECD countries and the United States. The relative shares of Japan’s maincompetitors on the US market have changed little since 1980, US producers remaining by far the mostimportant ones. On the non-OECD market, which includes mainly other countries in Asia, competitionfrom domestic producers has increased substantially, mainly at the expense of EU exporters. By 1995,however, Japan’s main competitors on the non-OECD Asian market remained EU exporters and,interestingly enough, not US exporters.
15. The pattern of EU competition remains dominated by the domestic and the non-OECD market.The importance of the latter has tended to decline however, mainly reflecting diminishing EU exports tonon-OECD countries outside Asia. On all non-OECD markets, producers and exporters from Asianemerging countries have increased their importance as competitors to EU countries since 1980, at theexpense of US and Japanese exporters. On the domestic market, main competition for EU producers in1995 came about equally from emerging Asia and US exporters, while it was dominated by the latterfifteen years before.
16. The above analysis, while providing insights into how competition in manufacturing amongmajor trading partners has evolved over time, should nonetheless be interpreted as representing possible,rather than actual, changes that have occurred over the past decades. Indeed, the calculations underlyingthe figures cited above are based on bilateral trade in aggregate manufactured goods. As such they do notallow for any degree of substitution between different categories of manufactured goods9. This caveatmay be particularly important when looking at competition emanating from emerging market economies.Indeed, while the degree of intra-trade for similar products is generally high for OECD countries, this isnot necessarily the case of trade between OECD and non-OECD countries10. In that respect, it is useful toalso compare the composition of manufactured exports in OECD and non-OECD Asian countries. Twogroups of non-OECD Asian countries seem to emerge. In the first group, which includes China, Indonesiaand Hong Kong, China, exports are concentrated in products with relatively low technological contentsuch as textile, footwear, toys and other consumer goods (Figure 2). By 1995, these products accountedfor almost 50 per cent of these countries’ merchandise exports. In contrast, in the second group ofcountries, which includes Chinese Taipei, Malaysia, Singapore and Thailand, exports consist more of highto medium-to-high technological goods, in particular computers, electrical and communication goods
9. The method for calculating the weights presented here derive from the Armington framework (1969), with
the simplification that there is no substitution among manufactured goods, and that there is no pricing-to-market strategy from the part of competitors.
10. See OECD (1994).
ECO/WKP(98)8
10
which represent more than 50 per cent of these countries’ total exports. The structure of Korea’s exportslies in between the two groups identified above with about 23 per cent of its exports consisting of textileand apparel and about 35 per cent of electrical and electronic products. Exports from the second group ofcountries, and to a lesser extent from Korea, would therefore appear to enter more directly in competitionwith OECD countries’ exports than exports from the first group. Among the major three OECD regions,Japan seems to be the most likely to be affected, given its export structure, and the European Union theleast.
B. Changes in relative competitive positions
17. The characteristics of competition facing OECD countries described above and their evolutionover time are those embodied in the weighting pattern used in the calculation of indices of nominal andreal effective exchange rates reported in Figure 311. For the majority of countries, relative CPIs andindices of relative manufacturing unit labour costs move broadly together and show less variability overtime than corresponding nominal effective exchange rates. For a few countries, however, competitivenessindicators based on unit labour costs in the manufacturing sector tend to have more pronounced trendsthan those based on consumer prices and higher short-run volatility reflecting the offsetting effect ofexchange rate movements on CPIs via import prices. Trends in these indicators since 1985 for OECDcountries as well as for the EU aggregate12, indicate that several periods can be distinguished (indicatorsfor emerging market economies, are reported in the Annex Figure 1):
-- despite significant bilateral movements, there has been a simultaneous nominal effectiveappreciation of the three major OECD regions’ currencies between the late 1980s and early1995. This was accompanied by very large depreciations in many emerging market economiesover this period;
-- on the other hand, over the same period, the Japanese yen and, to a lesser extent, some EUcurrencies have appreciated in real effective terms, while the US dollar has depreciated;
-- this trend was reversed between early 1995 and mid-1997, with the Japanese yen and EUcurrencies depreciating in nominal and real effective terms and the US dollar appreciating;
--since mid-97, all OECD countries’ nominal and real effective exchange rates haveappreciated, as the result of the massive depreciations in the currencies of emerging marketeconomies in Asia. By mid-March 1998 the nominal effective appreciation amounts to 11, 5and 3 per cent for the United States, Japan and the European Union, respectively. In Japanand the EU, however, this appreciation has only partially unwound earlier depreciations.
18. The decomposition of competitiveness indicators, as measured by relative CPIs, according toOECD and emerging Asian competitors indicates that trends in relative prices since 1991 remain largelydominated by currency and price movements within the OECD area (Figure 4). However, there are a
11. Historical data on manufacturing unit labour costs for emerging market economies extend only through
1996. Thereafter, data are based on OECD Secretariat estimates. Unit labour costs are therefore moreappropriate for examining longer-term trends, while CPI data, which are readily available for the mostrecent period, are more relevant for the analysis of the latest developments in competitiveness. See theAnnex for a description of the sources of data.
12. See the Annex for details on how an aggregate EU exchange rate has been calculated.
ECO/WKP(98)8
11
number of episodes where developments vis-à-vis Asian emerging market economies have affected trendsin OECD countries’ overall competitive positions.
19. Movements in US competitiveness vis-à-vis Asian emerging market countries between 1995 andmid-1997 have to some extent worked to reduce the overall US competitiveness losses registered over thatperiod. Indeed, there was no reversal in the trend of improved US competitiveness vis-à-vis emergingAsia when the competitive position of the United States vis-à-vis other OECD competitors deterioratedmarkedly. To a large extent, this reflects the exchange rate policies followed by most Asian emergingmarket economies during that period, to maintain close ties between their currencies and the US dollar.
20. Such ties have also tended to reinforce the influence of the movements in the dollar exchangerate on Japan’s competitive position. Thus, the appreciation of the yen exchange rate between 1991 andmid-1993 corresponds to a period of loss in Japanese competitiveness vis-à-vis both the OECD andemerging Asia, while the reverse holds for the period between early 1995 and early 1997. On the otherhand, the devaluation of the Chinese yuan during 1993-94 was responsible for some deterioration inJapan’s overall competitiveness.
21. For the EU as a whole, as well as for EU countries individually, intra-ERM currency movementshave had the major influence on overall competitiveness trends between 1992 and 1994, as a number ofEuropean currencies depreciated both against the Deutschemark and other core ERM currencies andagainst currencies outside the EU. Nevertheless, between late-1995 and mid-1997 improvements in theEU overall competitiveness have reflected ERM currencies’ depreciations against the dollar but also amarked improvement in EU competitive position vis-à-vis emerging Asia.
22. Since mid-1997, the massive depreciations of the Korean and non-OECD Asian currencies haveled to large deteriorations in the competitive positions of the three major OECD regions vis-à-vis Asianemerging market economies. For the United States, this added to the deterioration of competitiveness vis-à-vis other OECD countries. On the other hand, for Japan, the loss of competitiveness vis-à-vis emergingAsia has more than offset the improvement vis-à-vis other OECD countries since the third quarter of 1997.In contrast, the EU overall competitive position thus far appears to have been less affected by currencymovements in East Asia.
IV. Implications for trade and FDI developments
23. As noted above, the measures of international competitiveness encompass competition in bothdomestic and external markets. They can de facto be seen as representing a weighted average of importand export competitiveness. These indicators therefore are relatively well suited to analysing trends intrade balances13, although they are of course not the only determinant of these trends. This is done in thefollowing section.
13. As opposed to indicators of import and export competitiveness that should be used to analyse import and
export trends, respectively.
ECO/WKP(98)8
12
A. Indicators of international competitiveness and trade performance
24. For a number of countries there is a fairly good correlation14 (allowing for time lags) betweensignificant movements in indicators of OECD countries’ international competitiveness and gains andlosses of export market shares15. The real effective depreciation of the US dollar between 1985 and 1995has been accompanied by substantial cumulative market share gains (Figure 5). Conversely, thedeterioration in Japan’s competitiveness was followed by large export market share losses since 1985.Among European Union countries, the correlation between competitiveness and export performanceappears to have been the greatest in Italy, Sweden and to a lesser extent Germany. In France, Belgiumand the Netherlands both competitiveness and export performance have remained remarkably stable since1985. In a number of other European countries (e.g. Switzerland, Germany and the United Kingdom),there appears to be a trend deterioration in export performance. This generally can be associated withlosses in competitiveness vis-à-vis Asian emerging market countries, but also vis-à-vis Spain and Portugalwhich have registered large market share gains since joining the European Community.
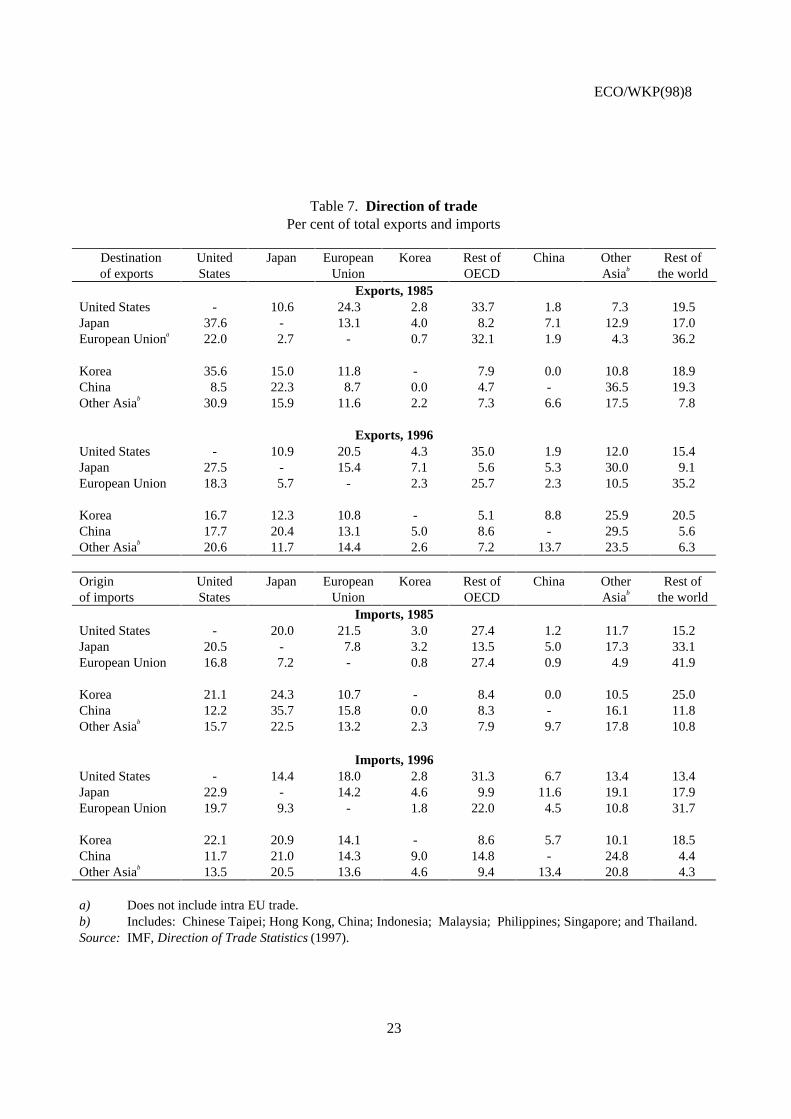
25. The rising importance of Asian emerging market countries as world exporters also reflectsimprovements in their aggregate competitiveness, although for a number of them, export market sharegains have been achieved in spite of a marked deterioration in their competitive position (e.g. Singapore,and Hong-Kong, China). These developments, however, have to be seen against the background of thelow levels of unit labour cost mentioned earlier. While reflecting third market gains, emerging Asia’simproved trade performance also results, at least to some extent, from a deterioration in the relative importcompetitiveness of OECD countries. This is illustrated by the impressive increase in China’s share in theJapanese market, from 4 to 13 per cent between 1985 and 1995 (Figure 6). China also gained marketshares in the US and EU markets, although the rise was less dramatic than in Japan, from less than 2 percent to around 6 per cent. China is now the fourth biggest foreign supplier in the United States whileKorea, China and other Asian emerging countries taken as a group account for about 23 per cent of USimports, i.e. more than either Japan or the EU (Table 7). This group of countries have also by farsurpassed the United States as the principal supplier of the Japanese market. The penetration of Chineseand other Asian emerging countries’ imports in the European Union market is now just a little below thatof the US once intra-EU trade is excluded.
26. Notwithstanding the higher import penetration of China and other Asian emerging economies onthe Japanese market, Japan’s overall trade openness indicator, as measured by the ratio of merchandiseimports to GDP, despite fluctuations, was no higher recently than it was in the mid-1980s (Figure 7). Thiswas also more or less the case for the European Union (once intra-EU trade is excluded) and for theUnited States until the late 1980s. Since the early 1990s, however, the import penetration ratio has tendedto increase in the United States.
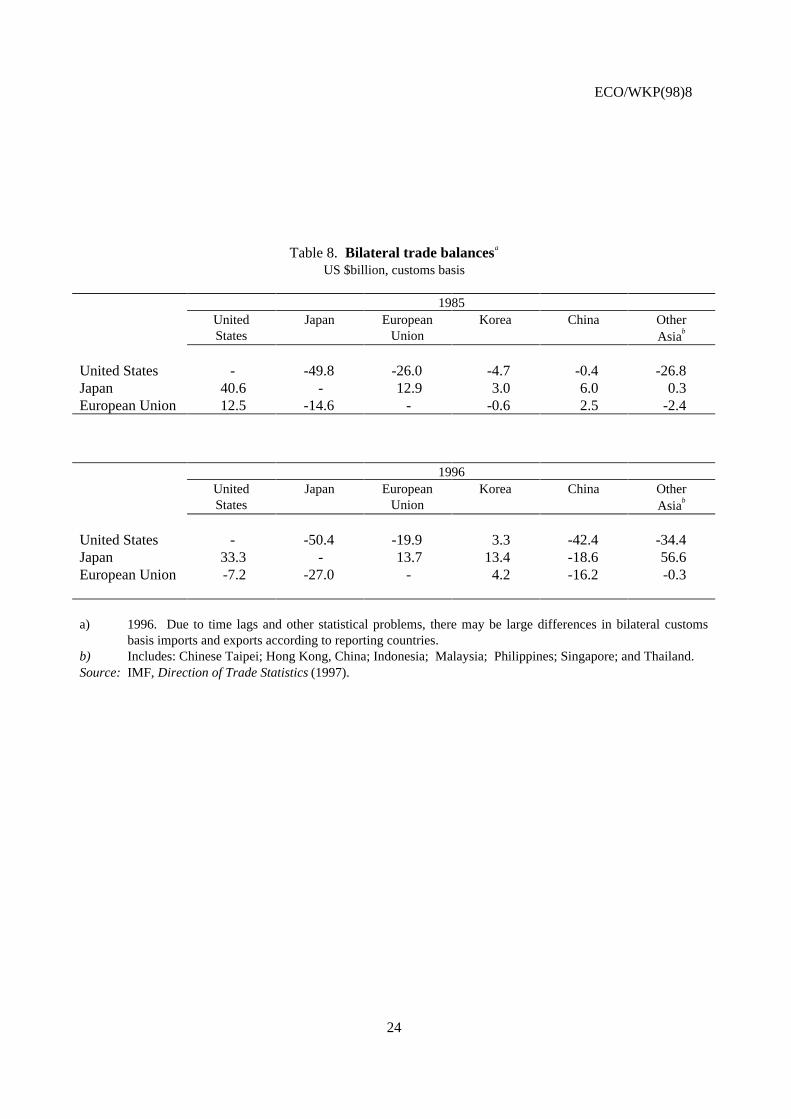
27. Overall, the changes in international competitiveness and related trade performance describedabove have contributed to the large shifts in major OECD regions’ bilateral trade balances16, especially
14. The OECD Secretariat has estimated a regression of manufacturing export performance on
contemporaneous and lagged indicators of competitiveness over the period 1975-98. For the majority ofcountries analysed here, the R-squared was above 0.5.
15. The current pattern of trade balances of OECD countries is also reflecting an important absorption effect.For that reason, this section analyses the link between real effective exchange rates and export performanceonly.
16. Some care has to be taken in focusing analysis on bilateral balances, given that the fundamental nature ofthe international trading system is multi-lateral and multi-product.
ECO/WKP(98)8
13
with Asian emerging market economies. By 1996, China was running a trade surplus vis-à-vis all threeOECD regions, and other non-OECD East Asian countries had a substantial surplus vis-à-vis the UnitedStates (Table 8). In contrast, in 1985 trade between the United States and China was virtually balanced,while Japan and the European Union had a surplus vis-à-vis China. In 1996, the combined US deficit vis-à-vis China and other Asian emerging countries amounted to around $80 billion, compared with a deficitof $50 billion vis-à-vis Japan.
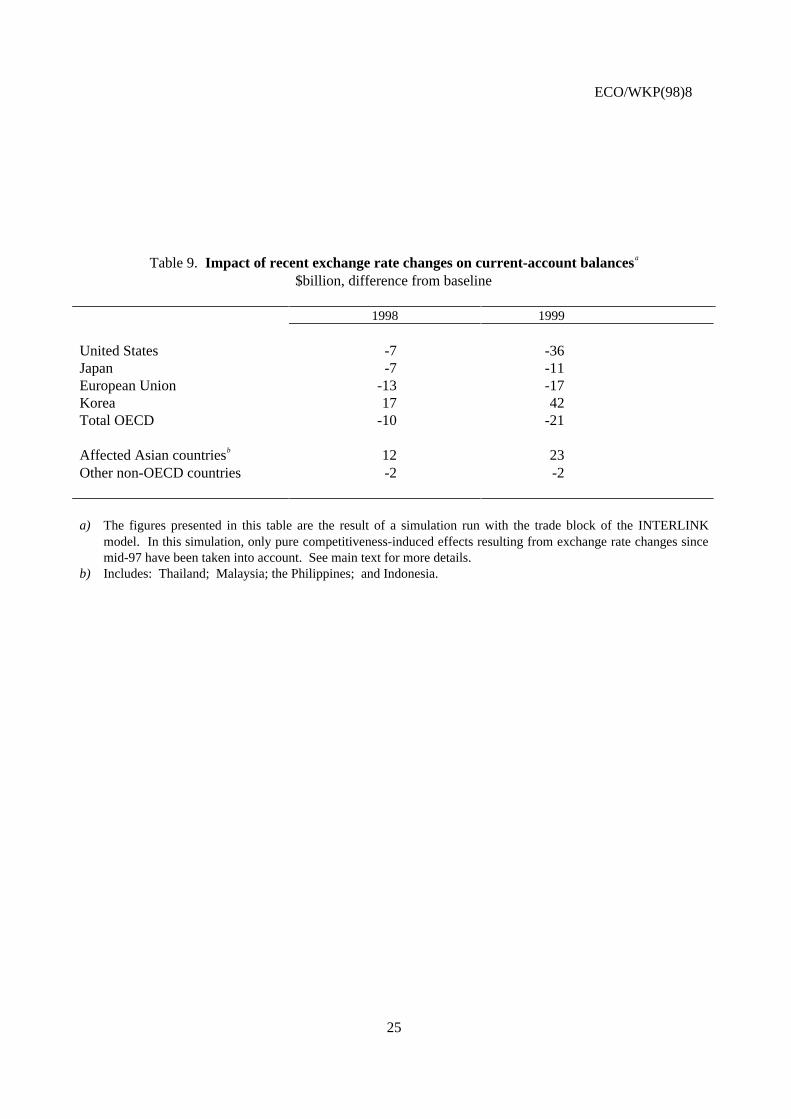
28. The recent massive depreciations of the Korean and non-OECD East Asian currencies are likelyto add to the present imbalances vis-à-vis emerging Asia. A simulation of the impact of the potentialrecent competitiveness changes on trade and current accounts has been conducted using the OECDINTERLINK model. This exercise is a partial simulation of the trade block of the model only. It does nottake into account the adjustments in domestic demand resulting in part from the change in the policyframework that followed the depreciations in the affected countries, nor the eventual policy responses inthe OECD countries17. The results of the simulation presented in Table 9 suggest that the potentialadjustment might be quite substantial. By 1999, the positive swing in the Korean and affected non-OECDAsian countries’ current accounts amounts to more than $40 billion and $20 billion, respectively. Thecounterpart is found for about half in the United States and for the other half in Europe and Japancombined. This estimated adjustment, however, is likely to represent an upper bound of the order ofmagnitude of competitiveness-induced trade changes. First, the pass-throughs of changes in nominalexchange rates into trade prices are particularly uncertain in the face of such large depreciations, and thesecould well be lower than those embodied in the simulation18. Second, a number of exporters in theaffected countries seem to face financing constraints due to the underlying weak situation of the bankingsectors. Third, the reservation made earlier regarding the fact that OECD and non-OECD East Asiancountries have a different export structure also imply that potential exports may not translate into actualexports. Fourth, competitiveness gains might be reversed if the large nominal depreciations of Asiancurrencies prove temporary or translate into higher rates of inflation, as seems to be the case already forsome of these countries.
B. Changes in competitiveness and FDI
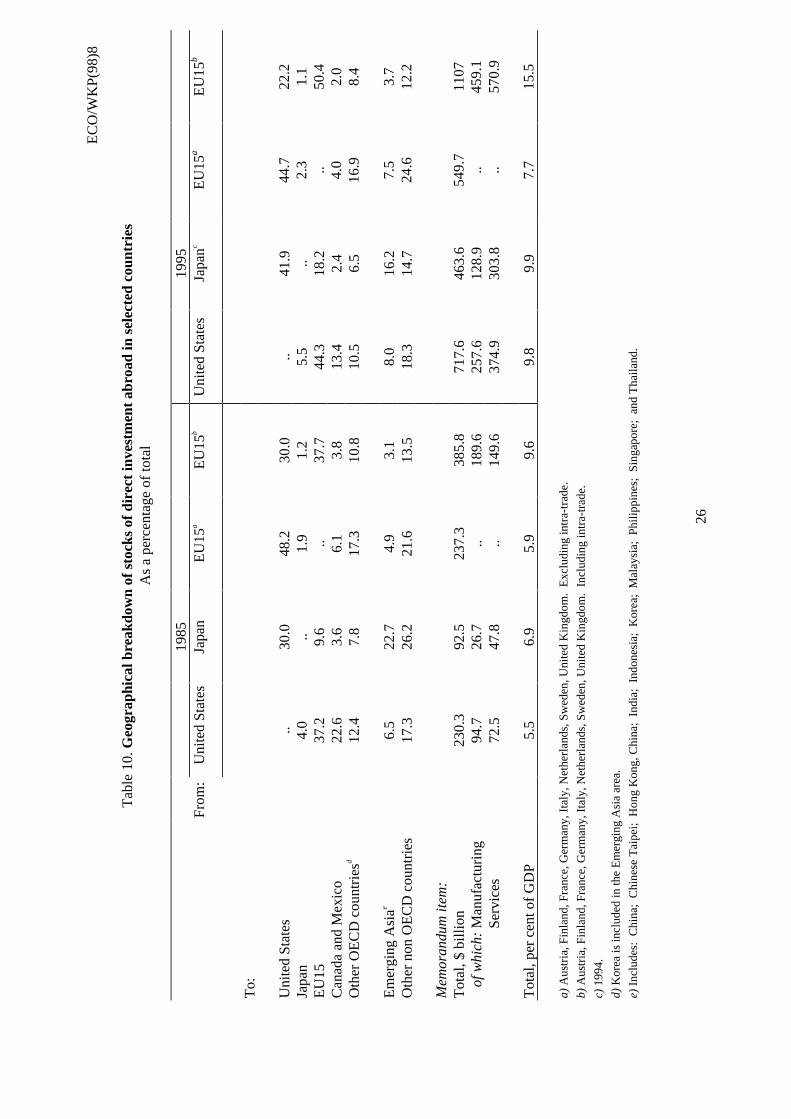
29. Foreign direct investment has expanded rapidly since the mid-1980. Cumulative outflows fromOECD countries totalled $2¼ trillion between 1985 and 1996, with the aggregate stock of outward directinvestment rising from 6 per cent of OECD-wide GDP in 1985 to around 10 per cent in 199519. The UScompanies remain the most active foreign investors, total outstanding direct investment abroad amountingto over $700 billion in 1995 (Table 10). Since 1990, the United States has invested directly abroad around$400 billion, or over a quarter of total OECD outflows. Around 44 per cent of these outflows weredirected to the European Union, 8 per cent to emerging Asia and only 5 per cent to Japan.
17. The OECD Secretariat’s most recent projections, which take these factors into account, envisage a larger
swing in current accounts of these countries than presented in Table 9, which is concerned exclusively withthe effects of competitiveness changes.
18. In the affected countries, the pass-through of the exchange rate changes on dollar import prices has beenassumed to be equal to about 30 per cent after one year. For dollar export prices the pass-through has beenassumed to be equal to 55 per cent after one year and declining thereafter.
19. The stock of foreign direct investment understates the level of multinational activity, since it does notinclude operations financed by funds raised from outside the home country.
ECO/WKP(98)8
14
30. After having invested primarily in OECD countries until the late 1980s, Japanese multinationalfirms have since directed large part of their foreign investment to emerging market economies in Asia.While until the second half of the 1980s, more than one half of Japanese investment in Asia went to thenewly-industrialising economies (Chinese Taipei; Singapore; and Hong Kong, China), these locationswere then superseded by the emerging markets of South-East Asia. Since 1993, China has become thefavoured destination in Asia for direct investment by Japanese manufacturing companies. In contrast,although expanding, the share of FDI in East Asia has remained small for the major European countries;the largest share of the European Union investment has remained within Europe itself.
31. A number of factors play a role in the determination of the scale and location of foreign directinvestment20. In particular, real effective exchange rates influence foreign direct investment decisionsbecause they directly affect the relative competitive position of different locations. For example,empirical evidence suggests that the strong appreciation of the yen between 1985 and early 1995 has beena major determinant of Japanese direct investment in Asia and the United States.21 The effectiveappreciation led to a growth in capital outflows, as Japanese multinational companies tried to takeadvantage of the relatively cheaper factor costs in host economies. In addition, it raised the relativewealth of Japanese firms, leading to an increase in purchases of foreign assets. Studies on thedeterminants of US and Japanese foreign direct investment flows in the European Union during the 1980sand early 1990s also show that the real exchange rate has been an important explanatory variable22.Recent exchange rate changes, if lasting, may therefore have important implications for future FDI flows,especially in Asia.
32. While there is widespread evidence of a positive relationship between inward direct investmentand export performance, empirical research on the impact of outward investment on exports remainslargely inconclusive, the effects varying significantly between countries and the time period underconsideration. On balance, the evidence from early cross-sectional studies and panel studies with alimited time dimension suggests a complementary relationship between exports and outward directinvestment, owing to an increased demand for intermediate products and the expansion of distributionfacilities. However, more recent time-series studies obtain stronger evidence of a substitution effectbetween foreign affiliates production and domestic exports, suggesting that the relationship may changeover time, possibly reflecting the maturity of investments23. Given a negative relationship between FDIand exports, this could reinforce the response of trade flows to changes in competitiveness.
20. These factors include: relative factor costs and factor endowments; local market size; scale economies and
the presence of firm-specific assets, such as managerial and production expertise and process innovations,which can act as “joint’ inputs across plants for a firm operating in different countries; national and regionalbarriers to trade and non-trade barriers such as technical standards; different tax regimes; the developmentof distribution channels abroad and the provision of after-sales service facilities; the quality ofinfrastructure, research capacities, the level of education and training of the labour force. See, for example,Barrell and Pain (1997).
21. See Sianesi (1995). This study analyses Japanese FDI outflows directed to Malaysia, Thailand andIndonesia during 1973-1992. See also Cushman (1988).
22. See, for example, Aristotelous and Fountas (1996).
23. See Barrell and Pain (1997); Barry and Bradly (1997); and Blomström et al. (1997). A recent MITI studyon the impact of Japanese overseas business activities in manufacturing on the balance of trade estimatesthat the positive impact of foreign affiliates on Japan’s trade surplus has gradually declined from a peak of2.7 trillion yen in 1992 to an insignificant amount (100 billion yen) in 1995, due to the increased exportsubstitution effect. This corresponds to about 60 per cent of the overall decline in Japanese trade surplus.
ECO/WKP(98)8
15
BIBLIOGRAPHY
Aristotelous, K. and Fountas, S. (1996), “An empirical analysis of inward foreign direct investment flowsin the EU with emphasis on the market enlargement hypothesis”, Journal of Common MarketStudies, vol. 34, No. 4, pp. 571-583.
Armington, P. (1969), “A theory of demand for products distinguished by place of production”,International Monetary Fund Staff Papers, March, pp. 159-175.
Barrell, R. and N. Pain (1997), "The growth of foreign direct investment in Europe", National InstituteEconomic Review, April.
Barrell, R. and N. Pain (1997), “Foreign direct investment, technological change, and economic growthwithin Europe, The Economic Journal, vol. 107, No. 445, pp. 1770-1797.
Barry, F. and J. Bradley (1997), “FDI and Trade: the Irish host-country experience”, The EconomicJournal, vol. 107, No. 445, pp. 1798-1811.
Blomström, M., G. Fors and R. E. Lipsey, “Foreign direct investment and employment: home countryexperience in the United States and Sweden”, The Economic Journal, Vol. 107, No. 445, pp. 1787-1797.
Cushman, D. O. (1988), “Exchange-rate uncertainty and foreign direct investment in the United States”,Weltwirtschaftliches Archiv, No. 2, pp. 322-36.
Durand, M. and C. Giorno (1987), “Indicators of international competitiveness: conceptual aspects andevaluation”, OECD Economic Studies, No. 9.
Durand, M., J. Simon J. and C. Webb (1992), “OECD’s Indicators of International Trade andCompetitiveness, OECD Economics Department Working Papers, No. 120.
Hooper, P. (1996), "Comparing manufacturing output levels among the major industrial countries", inOECD, Industry Productivity - International Comparison and Measurement Issues .
Hooper, P. and E. Vrankovich (1995), “International comparisons of the levels of unit labor costs inmanufacturing”, Board of Governors of the Federal Reserve System, International FinanceDiscussion Papers, No. 527.
Krugman, P. (1996), Pop Internationalism, The MIT Press, Cambridge, Massachusetts.
McKinsey (1992), Service sector productivity, McKinsey Global Institute, Washington D.C.
McKinsey (1993), Manufacturing productivity, McKinsey Global Institute, Washington D.C.
McKinsey (1994), Employment performance, McKinsey Global Institute, Washington D.C.
McKinsey (1995), Sweden’s economic performance, McKinsey Global Institute, Stockholm.
ECO/WKP(98)8
16
OECD (1993), “Absolute levels of cost-competitiveness: methodological aspects and preliminaryestimates”, mimeo.
OECD (1994), “Trends in international trade”, Economic Outlook, No. 56, pp. 38-49.
OECD (1997), Economic Surveys, Germany.
OECD (1998), “The dynamics of industrial performance: what drives productivity growth?”, Science,Technology and Industry Outlook, forthcoming.
Pilat, D. (1996), “Labour productivity levels in OECD countries: estimates for manufacturing and selectedservice sectors”, OECD Economics Department Working Papers, No. 169.
Pilat, D. (1996), “Competition, productivity and efficiency”, OECD Economic Studies, No. 27, pp. 107-46.
Sianesi, B. (1995), “Macroeconomic determinants of Japanese foreign direct investment in South-EastAsia”, Rivista Internazionale di Scienze Economiche e Commerciali, vol. 42, No. 12, pp. 1003-1024.
Turner, A. and Golub, S. (1997), “Towards a system of multilateral unit labor cost-based competitivenessindicators for advanced, developing, and transition countries”, IMF Working Papers, No 151.
ECO/WKP(98)8
17
Table 1. Relative labour productivity levels in manufacturing(USA = 100)
Value added per hour worked
1960 1973 1985 1996a
United States 100 100 100 100Japan 19 48 69 74Germanyb 56 76 86 82France 46 70 86 84Italyc -- 54 84 89United Kingdom 45 54 60 67Canada 68 82 84 68
Australia 50 50 56 52Belgium 46 71 106 101Finland 46 58 72 101Mexico 25 32 31 n.a.The Netherlands 51 88 107 97Spainc 20 38 80 68Sweden 50 80 87 90
Note: a) Our latest available year, i.e. 1992 for Australia and Spain; 1994 for Finland; 1995 for Belgium, Italy,and the Netherlands.
b) West Germany.c) Spain/USA are inferential estimates, based on benchmark studies for Spain/UK. Data for Italy are also
derived using a different methodology. They are therefore not entirely comparable with the other estimates.
Source: D. Pilat (1996) and OECD (1998).
ECO/WKP(98)8
18
.Table 2. Manufacturing labour productivity levels by sector
Value added per hour worked, leader country = 100a
Sectors United Japan Germany b France United Canada Australia Nether- SwedenStates Kingdom lands
Panel A: 1987Food, beverages and tobacco 100.0 32.3 75.3 65.3 46.1 59.6 45.9 95.4 57.3Textiles, clothing & footwear 67.4 38.1 60.1 61.7 47.4 54.6 42.2 100.0 60.8Wood products & furniture 69.5 15.6 50.2 52.4 38.1 63.8 32.7 100.0 64.1Paper products & printing 97.2 47.5 61.2 65.0 64.7 81.4 53.2 62.7 100.0Chemical products 80.8 52.9 60.1 58.0 59.5 68.0 44.9 100.0 72.4Non-metallic mineral products 77.0 55.1 67.1 100.0 59.9 75.1 56.4 97.7 75.5Basic metal products 94.4 100.0 80.3 77.0 74.2 89.3 57.1 80.3 93.3Metal products 86.3 76.0 76.3 57.3 50.6 70.1 42.3 68.9 100.0Machinery & equipment 99.0 85.6 73.8 100.0 65.4 64.2 61.1 59.1 66.5Electrical machinery 100.0 82.7 67.6 90.0 51.3 66.4 35.8 93.7 75.6Transport equipment 96.9 100.0 76.7 84.9 42.1 69.7 39.3 47.0 55.8Other manufacturing 100.0 39.4 45.3 40.1 52.5 58.3 33.0 47.2 67.0
Total manufacturing 100.0 66.5 78.5 80.3 59.4 76.0 51.8 98.5 82.0
Panel B: 1993b
Food, beverages and tobacco 100.0 35.6 88.7 87.0 41.7 64.3 51.1 96.6 72.8Textiles, clothing & footwear 78.3 41.9 72.1 67.1 51.5 46.3 32.3 100.0 66.5Wood products & furniture 56.0 17.6 55.7 55.3 28.1 52.6 27.1 100.0 71.9Paper products & printing 85.0 49.7 59.0 64.3 76.4 67.6 53.7 64.5 100.0Chemical products 66.9 52.6 55.4 56.9 79.7 52.6 39.8 100.0 89.4Non-metallic mineral products 81.8 62.9 79.5 99.4 70.6 78.4 77.4 100.0 81.0Basic metal products 76.8 78.3 72.9 63.3 61.4 87.9 56.8 70.4 100.0Metal products 68.9 67.6 64.6 46.4 42.5 54.8 35.9 54.0 100.0Machinery & equipment 100.0 67.4 49.2 67.3 47.9 55.5 46.4 34.6 45.2Electrical machinery 80.3 89.0 49.9 78.9 48.2 51.9 28.0 82.2 100.0Transport equipment 88.4 100.0 68.0 85.0 47.8 71.9 45.5 41.8 49.5Other manufacturing 100.0 41.4 43.1 31.4 43.5 33.5 22.1 27.0 47.4
Total manufacturing 100.0 76.6 79.8 84.2 64.1 71.3 52.0 95.6 91.8
a) The productivity level of the leader country in each industry is indicated in bold.
b) West Germany.
Source: D. Pilat (1996).
ECO/WKP(98)8
19
Table 3. Relative levels of unit labour costs in manufacturing(USA = 100)
Based on 1990 PPPs
1975 1985 1990 1996
United States 100 100 100 100Japan 91 74 116 169Germany a 104 71 144 166France 148 96 154 163Italy 107 60 114 101United Kingdom 125 100 158 148Canada 105 84 118 102
Australia 151 98 118 145Belgium 167 75 135 156Denmark 162 97 205 218Korea 26 29 51 58Netherlands 131 65 122 120Spain 74 b 49 108 100Sweden 144 82 158 160Chinese Taipei 40 41 70 70
a) West Germany.b) 1977.Source: OECD calculations. For details on the methodological aspects, see OECD (1993).
ECO/WKP(98)8
20
Table 4. Shares in world merchandise tradePer cent
Imports Exports1985 1995 1985 1995
United States 24.1 19.5 15.0 15.4Japan 8.7 8.5 12.4 11.7European Uniona 22.2 18.9 22.7 19.4Rest of OECDb 14.6 13.6 16.0 14.2OECDb 69.6 60.4 66.1 60.7
China 2.8 3.3 1.9 3.9Hong Kong, China 2.0 4.9 2.1 4.6Chinese Taipei 1.3 2.6 2.1 3.0Korea 2.1 3.4 2.1 3.3Singapore 1.7 3.1 1.6 3.1Malaysia 0.8 2.0 1.1 2.0Indonesia 0.7 1.0 1.3 1.1Philippines 0.4 0.7 0.3 0.5Thailand 0.6 1.9 0.5 1.5
Total of above countries 12.4 22.9 13.1 23.0
Non-OECDc 30.4 39.6 33.9 39.3
a) Excluding intra-trade.b) Excluding Korea.c) Including Korea.Source: IMF, Direction of Trade Statistics (1996).
EC
O/W
KP(
98)8
21
Tab
le 5
. T
he im
port
ance
of e
mer
ging
mar
ket e
cono
mie
s in
the
dete
rmin
atio
n of
maj
or O
EC
D r
egio
ns’ p
atte
rn o
f com
petit
ion
a
Per
cent
1970
1980
1990
1995
Uni
ted
Stat
esJa
pan
EU
Uni
ted
Stat
esJa
pan
EU
Uni
ted
Stat
esJa
pan
EU
Uni
ted
Stat
esJa
pan
EU
Kor
ea1.
22.
10.
23.
17.
11.
44.
57.
71.
83.
47.
11.
6H
ong
Kon
g, C
hina
3.2
1.5
2.8
3.7
1.8
3.4
2.5
1.8
3.0
1.8
1.3
2.0
Sing
apor
e0.
20.
10.
31.
31.
21.
02.
41.
62.
12.
72.
52.
6C
hine
se T
aipe
i1.
82.
40.
75.
35.
12.
55.
76.
04.
54.
95.
94.
1C
hina
0.0
2.0
1.6
0.6
3.9
1.8
3.1
5.7
2.6
5.9
13.2
5.8
Indo
nesi
a0.
00.
30.
10.
21.
30.
20.
42.
00.
60.
82.
81.
0M
alay
sia
0.5
2.0
0.3
0.9
1.5
0.6
1.0
1.1
0.8
2.2
2.6
1.5
Phili
ppin
es0.
40.
30.
10.
80.
90.
30.
70.
80.
30.
81.
00.
4T
haila
nd0.
30.
60.
10.
41.
30.
41.
02.
41.
01.
53.
91.
6
Tot
al o
f ab
ove
coun
trie
s7.
711
.36.
316
.224
.111
.721
.329
.116
.824
.040
.320
.7
Mex
ico
2.3
0.5
0.7
4.1
1.3
1.0
6.0
0.5
0.8
8.0
0.4
1.0
Bra
zil
0.5
0.6
1.0
1.3
1.5
2.2
1.5
1.3
1.9
1.3
1.0
1.9
Arg
entin
a0.
50.
41.
80.
30.
50.
90.
30.
30.
70.
20.
20.
6In
dia
0.7
1.7
1.4
0.6
1.1
1.5
0.6
1.0
1.8
0.8
1.1
1.6
Rus
sia
--
--
--
0.3
0.5
0.9
0.4
0.6
0.8
Mem
oran
dum
item
s:
Uni
ted
Stat
es-
44.1
44.1
-35
.135
.7-
31.1
31.9
-27
.131
.8Ja
pan
20.6
-13
.823
.8-
21.3
23.3
-22
.122
.2-
21.6
Eur
opea
n U
nion
35.7
29.7
-29
.926
.5-
25.5
27.4
-22
.022
.4-
Oth
er32
.011
.730
.923
.89.
925
.721
.28.
823
.121
.16.
920
.0
Tot
al10
0.0
100.
010
0.0
100.
010
0.0
100.
010
0.0
100.
010
0.0
100.
010
0.0
100.
0a)
Figu
res
repr
esen
t the
wei
ghts
use
d in
the
calc
ulat
ion
of e
ffec
tive
exch
ange
rat
es.
The
y ar
e ba
sed
on a
dou
ble
trad
e w
eigh
ting
syst
em w
hich
, for
eac
h co
untr
y,ta
kes
into
acc
ount
rel
ativ
e m
arke
t sh
ares
hel
d by
its
com
petit
ors
on t
heir
com
mon
mar
kets
, in
clud
ing
the
hom
e m
arke
t, as
wel
l as
the
im
port
ance
of
thes
em
arke
ts f
or th
e co
untr
y in
que
stio
n. F
or f
urth
er d
etai
ls, s
ee A
nnex
and
Dur
and
et a
l. (1
992)
.
EC
O/W
KP(
98)8
22
Tab
le 6
. D
ecom
posi
tion
by
mar
ket
of t
he p
atte
rn o
f co
mpe
titi
on o
f th
e th
ree
maj
or O
EC
D r
egio
nsa
Per
cent
Uni
ted
Stat
es19
8019
95M
arke
tsJa
pan
Eur
opea
nU
nion
Oth
erO
EC
DD
omes
ticb
Non
OE
CD
Japa
nE
urop
ean
Uni
onO
ther
OE
CD
Dom
estic
bN
onO
EC
DC
ompe
tito
rsU
nite
d St
ates
0.0
0.0
0.0
0.0
0.0
0.0
0.0
0.0
0.0
0.0
Japa
n60
.510
.64.
924
.523
.257
.411
.37.
122
.326
.4E
U14
.761
.48.
028
.654
.512
.458
.19.
321
.141
.5O
ther
OE
CD
c6.
414
.785
.427
.08.
24.
011
.578
.028
.26.
5E
mer
ging
Asi
ad16
.710
.51.
317
.910
.325
.116
.74.
926
.620
.0O
ther
non
-OE
CD
1.7
2.9
0.4
2.0
3.8
1.1
2.4
0.7
1.9
5.5
Tot
al10
0.0
100.
010
0.0
100.
010
0.0
100.
010
0.0
100.
010
0.0
100.
0W
eigh
t of
each
mar
ket
3.4
14.6
17.4
45.0
19.7
4.0
9.3
18.0
56.1
12.6
Japa
n19
8019
95M
arke
tsU
nite
dSt
ates
Eur
opea
nU
nion
Oth
erO
EC
DD
omes
tic b
Non
OE
CD
Uni
ted
Stat
esE
urop
ean
Uni
onO
ther
OE
CD
Dom
estic
bN
onO
EC
DC
ompe
tito
rsU
nite
d St
ates
57.0
20.3
22.2
34.6
21.8
56.3
15.5
26.5
25.7
21.6
Japa
n0.
00.
00.
00.
00.
00.
00.
00.
00.
00.
0E
U16
.354
.718
.224
.453
.111
.955
.422
.021
.639
.6O
ther
OE
CD
c15
.413
.154
.010
.67.
615
.910
.939
.47.
06.
9E
mer
ging
Asi
a d10
.29.
45.
227
.615
.414
.915
.910
.843
.829
.6O
ther
non
-OE
CD
1.1
2.5
0.4
2.7
2.1
1.1
2.3
1.3
1.8
2.3
Tot
al10
0.0
100.
010
0.0
100.
010
0.0
100.
010
0.0
100.
010
0.0
100.
0W
eigh
t of
each
mar
ket
20.4
12.5
9.4
17.9
39.9
22.0
11.4
8.9
27.5
30.2
Eur
opea
n U
nion
1980
1995
Mar
kets
Uni
ted
Stat
esJa
pan
Oth
erO
EC
DD
omes
tic b
Non
OE
CD
Uni
ted
Stat
esJa
pan
Oth
erO
EC
DD
omes
tic b
Non
OE
CD
Com
peti
tors
Uni
ted
Stat
es58
.419
.79.
137
.130
.855
.914
.414
.127
.926
.3Ja
pan
14.3
56.9
4.7
17.2
34.5
12.4
56.1
8.2
19.4
28.3
EU
0.0
0.0
0.0
0.0
0.0
0.0
0.0
0.0
0.0
0.0
Oth
er O
EC
D c
15.8
6.1
84.0
23.9
16.4
15.8
3.9
71.1
19.7
11.6
Em
ergi
ng A
sia d
10.5
15.7
1.6
17.2
13.6
14.8
24.6
5.7
28.8
29.2
Oth
er n
on-O
EC
D1.
11.
60.
64.
64.
71.
01.
00.
84.
24.
7T
otal
100.
010
0.0
100.
010
0.0
100.
010
0.0
100.
010
0.0
100.
010
0.0
Wei
ght o
f ea
ch m
arke
t9.
61.
814
.729
.444
.512
.53.
613
.535
.035
.4a)
The
tabl
e sh
ould
be
inte
rpre
ted
as f
ollo
ws:
for
the
Uni
ted
Stat
es, i
n 19
95, d
omes
tic m
arke
t com
petit
iven
ess
repr
esen
ted
56.1
per
cen
t of
over
all c
ompe
titiv
enes
s; a
nd th
e m
arke
t sha
re o
f Ja
pan
in th
e ho
me
mar
ket
was
22.
3. S
imila
rly,
com
petit
iven
ess
on th
e E
U m
arke
t rep
rese
nted
9.3
per
cen
t of
over
all U
S co
mpe
titiv
enes
s, a
nd o
n th
is m
arke
t, co
mpe
titio
n fr
om E
U p
rodu
cers
for
US
expo
rter
s re
pres
ente
d 58
.1 p
er c
ent o
fov
eral
l com
petit
ion.
b)T
he d
omes
tic m
arke
ts a
re ta
ken
into
acc
ount
with
an
equa
l wei
ghtin
g to
that
of
impo
rts.
c )K
orea
is in
clud
ed in
em
ergi
ng A
sia.
d)In
clud
es:
Chi
na; H
ong-
Kon
g, C
hina
; Kor
ea; C
hine
se T
aipe
i; In
done
sia;
Mal
aysi
a; T
he P
hilip
pine
s; a
nd T
haila
nd.
ECO/WKP(98)8
23
Table 7. Direction of tradePer cent of total exports and imports
Destinationof exports
UnitedStates
Japan EuropeanUnion
Korea Rest ofOECD
China OtherAsiab
Rest ofthe world
Exports, 1985United States - 10.6 24.3 2.8 33.7 1.8 7.3 19.5Japan 37.6 - 13.1 4.0 8.2 7.1 12.9 17.0European Uniona 22.0 2.7 - 0.7 32.1 1.9 4.3 36.2
Korea 35.6 15.0 11.8 - 7.9 0.0 10.8 18.9China 8.5 22.3 8.7 0.0 4.7 - 36.5 19.3Other Asiab 30.9 15.9 11.6 2.2 7.3 6.6 17.5 7.8
Exports, 1996United States - 10.9 20.5 4.3 35.0 1.9 12.0 15.4Japan 27.5 - 15.4 7.1 5.6 5.3 30.0 9.1European Union 18.3 5.7 - 2.3 25.7 2.3 10.5 35.2
Korea 16.7 12.3 10.8 - 5.1 8.8 25.9 20.5China 17.7 20.4 13.1 5.0 8.6 - 29.5 5.6Other Asiab 20.6 11.7 14.4 2.6 7.2 13.7 23.5 6.3
Originof imports
UnitedStates
Japan EuropeanUnion
Korea Rest ofOECD
China OtherAsiab
Rest ofthe world
Imports, 1985United States - 20.0 21.5 3.0 27.4 1.2 11.7 15.2Japan 20.5 - 7.8 3.2 13.5 5.0 17.3 33.1European Union 16.8 7.2 - 0.8 27.4 0.9 4.9 41.9
Korea 21.1 24.3 10.7 - 8.4 0.0 10.5 25.0China 12.2 35.7 15.8 0.0 8.3 - 16.1 11.8Other Asiab 15.7 22.5 13.2 2.3 7.9 9.7 17.8 10.8
Imports, 1996United States - 14.4 18.0 2.8 31.3 6.7 13.4 13.4Japan 22.9 - 14.2 4.6 9.9 11.6 19.1 17.9European Union 19.7 9.3 - 1.8 22.0 4.5 10.8 31.7
Korea 22.1 20.9 14.1 - 8.6 5.7 10.1 18.5China 11.7 21.0 14.3 9.0 14.8 - 24.8 4.4Other Asiab 13.5 20.5 13.6 4.6 9.4 13.4 20.8 4.3
a) Does not include intra EU trade.b) Includes: Chinese Taipei; Hong Kong, China; Indonesia; Malaysia; Philippines; Singapore; and Thailand.Source: IMF, Direction of Trade Statistics (1997).
ECO/WKP(98)8
24
Table 8. Bilateral trade balancesa
US $billion, customs basis
1985UnitedStates
Japan EuropeanUnion
Korea China OtherAsiab
United States - -49.8 -26.0 -4.7 -0.4 -26.8Japan 40.6 - 12.9 3.0 6.0 0.3European Union 12.5 -14.6 - -0.6 2.5 -2.4
1996UnitedStates
Japan EuropeanUnion
Korea China OtherAsiab
United States - -50.4 -19.9 3.3 -42.4 -34.4Japan 33.3 - 13.7 13.4 -18.6 56.6European Union -7.2 -27.0 - 4.2 -16.2 -0.3
a) 1996. Due to time lags and other statistical problems, there may be large differences in bilateral customsbasis imports and exports according to reporting countries.
b) Includes: Chinese Taipei; Hong Kong, China; Indonesia; Malaysia; Philippines; Singapore; and Thailand.Source: IMF, Direction of Trade Statistics (1997).
ECO/WKP(98)8
25
Table 9. Impact of recent exchange rate changes on current-account balancesa
$billion, difference from baseline
1998 1999
United States -7 -36Japan -7 -11European Union -13 -17Korea 17 42Total OECD -10 -21
Affected Asian countriesb 12 23Other non-OECD countries -2 -2
a) The figures presented in this table are the result of a simulation run with the trade block of the INTERLINKmodel. In this simulation, only pure competitiveness-induced effects resulting from exchange rate changes sincemid-97 have been taken into account. See main text for more details.
b) Includes: Thailand; Malaysia; the Philippines; and Indonesia.
EC
O/W
KP(
98)8
26
Tab
le 1
0. G
eogr
aphi
cal b
reak
dow
n of
sto
cks
of d
irec
t in
vest
men
t ab
road
in s
elec
ted
coun
trie
sA
s a
perc
enta
ge o
f to
tal
1985
1995
From
:U
nite
d St
ates
Japa
nE
U15
aE
U15
bU
nite
d St
ates
Japa
ncE
U15
aE
U15
b
To:
Uni
ted
Stat
es..
30.0
48.2
30.0
..41
.944
.722
.2Ja
pan
4.0
..1.
91.
25.
5..
2.3
1.1
EU
1537
.29.
6..
37.7
44.3
18.2
..50
.4C
anad
a an
d M
exic
o22
.63.
66.
13.
813
.42.
44.
02.
0O
ther
OE
CD
cou
ntri
esd
12.4
7.8
17.3
10.8
10.5
6.5
16.9
8.4
Em
ergi
ng A
siae
6.5
22.7
4.9
3.1
8.0
16.2
7.5
3.7
Oth
er n
on O
EC
D c
ount
ries
17.3
26.2
21.6
13.5
18.3
14.7
24.6
12.2
Mem
oran
dum
item
:T
otal
, $ b
illio
n23
0.3
92.5
237.
338
5.8
717.
646
3.6
549.
711
07
of w
hich
: M
anuf
actu
ring
94.7
26.7
..18
9.6
257.
612
8.9
..45
9.1
Ser
vice
s72
.547
.8..
149.
637
4.9
303.
8..
570.
9
Tot
al, p
er c
ent o
f G
DP
5.5
6.9
5.9
9.6
9.8
9.9
7.7
15.5
a) A
ustr
ia, F
inla
nd, F
ranc
e, G
erm
any,
Ita
ly, N
ethe
rlan
ds, S
wed
en, U
nite
d K
ingd
om.
Exc
ludi
ng in
tra-
trad
e.
b) A
ustr
ia, F
inla
nd, F
ranc
e, G
erm
any,
Ita
ly, N
ethe
rlan
ds, S
wed
en, U
nite
d K
ingd
om.
Incl
udin
g in
tra-
trad
e.
c) 1
994.
d) K
orea
is in
clud
ed in
the
Em
ergi
ng A
sia
area
.
e) I
nclu
des:
Chi
na;
Chi
nese
Tai
pei;
Hon
g K
ong,
Chi
na;
Indi
a; I
ndon
esia
; K
orea
; M
alay
sia;
Phi
lippi
nes;
Sin
gapo
re;
and
Tha
iland
.
ECO/WKP(98)8
27
Figure 1. Movements in nominal exchange ratesa
Indices 1991 = 100
a) The last quarter is based on the technical assumption that exchange rates remain at their levels of 18 March 1998.
United States
40
60
80
100
120
140
160
180
200
220
240
260
280
1980
Q1
1981
Q1
1982
Q1
1983
Q1
1984
Q1
1985
Q1
1986
Q1
1987
Q1
1988
Q1
1989
Q1
1990
Q1
1991
Q1
1992
Q1
1993
Q1
1994
Q1
1995
Q1
1996
Q1
1997
Q1
1998
Q1
40
60
80
100
120
140
160
180
200
220
240
260
280Japan
40
60
80
100
120
140
160
180
200
220
240
260
280
1980
Q1
1981
Q1
1982
Q1
1983
Q1
1984
Q1
1985
Q1
1986
Q1
1987
Q1
1988
Q1
1989
Q1
1990
Q1
1991
Q1
1992
Q1
1993
Q1
1994
Q1
1995
Q1
1996
Q1
1997
Q1
1998
Q1
40
60
80
100
120
140
160
180
200
220
240
260
280
Germany
40
6080
100
120
140
160
180200
220
240260
280
1980
Q1
1980
Q4
1981
Q3
1982
Q2
1983
Q1
1983
Q4
1984
Q3
1985
Q2
1986
Q1
1986
Q4
1987
Q3
1988
Q2
1989
Q1
1989
Q4
1990
Q3
1991
Q2
1992
Q1
1992
Q4
1993
Q3
1994
Q2
1995
Q1
1995
Q4
1996
Q3
1997
Q2
1998
Q1
40
6080
100
120
140
160
180200
220
240260
280France
40
60
80
100
120140
160
180
200
220
240260
280
1980
Q1
1980
Q4
1981
Q3
1982
Q2
1983
Q1
1983
Q4
1984
Q3
1985
Q2
1986
Q1
1986
Q4
1987
Q3
1988
Q2
1989
Q1
1989
Q4
1990
Q3
1991
Q2
1992
Q1
1992
Q4
1993
Q3
1994
Q2
1995
Q1
1995
Q4
1996
Q3
1997
Q2
1998
Q1
40
60
80
100
120140
160
180
200
220
240260
280
Italy
40
6080
100
120140
160
180
200
220
240260
280
1980
Q1
1980
Q4
1981
Q3
1982
Q2
1983
Q1
1983
Q4
1984
Q3
1985
Q2
1986
Q1
1986
Q4
1987
Q3
1988
Q2
1989
Q1
1989
Q4
1990
Q3
1991
Q2
1992
Q1
1992
Q4
1993
Q3
1994
Q2
1995
Q1
1995
Q4
1996
Q3
1997
Q2
1998
Q1
40
6080
100
120140
160
180
200
220
240260
280United Kingdom
40
6080
100
120140
160
180
200
220
240260
280
1980
Q1
1980
Q4
1981
Q3
1982
Q2
1983
Q1
1983
Q4
1984
Q3
1985
Q2
1986
Q1
1986
Q4
1987
Q3
1988
Q2
1989
Q1
1989
Q4
1990
Q3
1991
Q2
1992
Q1
1992
Q4
1993
Q3
1994
Q2
1995
Q1
1995
Q4
1996
Q3
1997
Q2
1998
Q1
40
6080
100
120140
160
180
200
220
240260
280
Canada
40
60
80
100
120140
160
180
200
220
240260
280
1980
Q1
1980
Q4
1981
Q3
1982
Q2
1983
Q1
1983
Q4
1984
Q3
1985
Q2
1986
Q1
1986
Q4
1987
Q3
1988
Q2
1989
Q1
1989
Q4
1990
Q3
1991
Q2
1992
Q1
1992
Q4
1993
Q3
1994
Q2
1995
Q1
1995
Q4
1996
Q3
1997
Q2
1998
Q1
40
60
80
100
120140
160
180
200
220
240260
280Australia
40
60
80
100
120140
160
180
200
220
240260
280
1980
Q1
1980
Q4
1981
Q3
1982
Q2
1983
Q1
1983
Q4
1984
Q3
1985
Q2
1986
Q1
1986
Q4
1987
Q3
1988
Q2
1989
Q1
1989
Q4
1990
Q3
1991
Q2
1992
Q1
1992
Q4
1993
Q3
1994
Q2
1995
Q1
1995
Q4
1996
Q3
1997
Q2
1998
Q1
40
60
80
100
120140
160
180
200
220
240260
280
vis-à-vis the US dollar vis-à-vis the Japanese yen vis-à-vis the Deutschemark
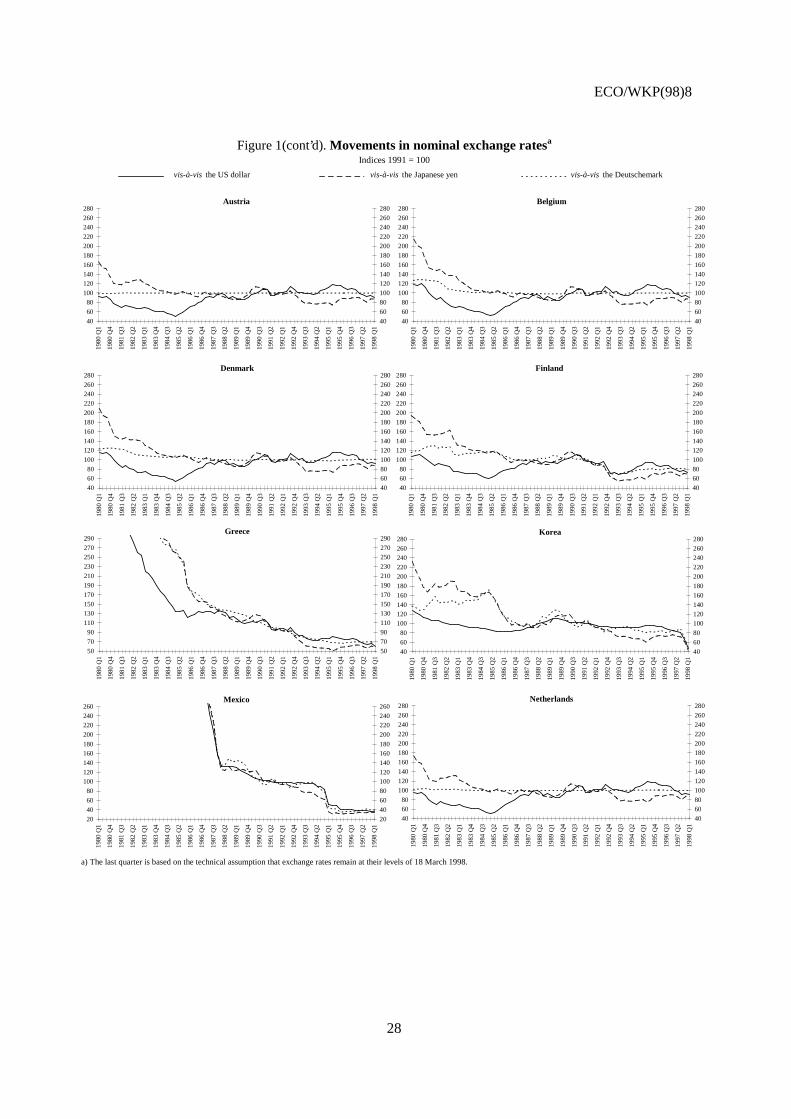
ECO/WKP(98)8
28
Figure 1(cont’d). Movements in nominal exchange ratesa
Indices 1991 = 100
a) The last quarter is based on the technical assumption that exchange rates remain at their levels of 18 March 1998.
Austria
40
60
80
100
120140
160
180
200
220
240260
280
1980
Q1
1980
Q4
1981
Q3
1982
Q2
1983
Q1
1983
Q4
1984
Q3
1985
Q2
1986
Q1
1986
Q4
1987
Q3
1988
Q2
1989
Q1
1989
Q4
1990
Q3
1991
Q2
1992
Q1
1992
Q4
1993
Q3
1994
Q2
1995
Q1
1995
Q4
1996
Q3
1997
Q2
1998
Q1
40
60
80
100
120140
160
180
200
220
240260
280Belgium
40
60
80
100
120140
160
180
200
220
240260
280
1980
Q1
1980
Q4
1981
Q3
1982
Q2
1983
Q1
1983
Q4
1984
Q3
1985
Q2
1986
Q1
1986
Q4
1987
Q3
1988
Q2
1989
Q1
1989
Q4
1990
Q3
1991
Q2
1992
Q1
1992
Q4
1993
Q3
1994
Q2
1995
Q1
1995
Q4
1996
Q3
1997
Q2
1998
Q1
40
60
80
100
120140
160
180
200
220
240260
280
Denmark
40
6080
100
120140
160
180
200
220
240260
280
1980
Q1
1980
Q4
1981
Q3
1982
Q2
1983
Q1
1983
Q4
1984
Q3
1985
Q2
1986
Q1
1986
Q4
1987
Q3
1988
Q2
1989
Q1
1989
Q4
1990
Q3
1991
Q2
1992
Q1
1992
Q4
1993
Q3
1994
Q2
1995
Q1
1995
Q4
1996
Q3
1997
Q2
1998
Q1
40
6080
100
120140
160
180
200
220
240260
280Finland
40
6080
100
120140
160
180
200
220
240260
280
1980
Q1
1980
Q4
1981
Q3
1982
Q2
1983
Q1
1983
Q4
1984
Q3
1985
Q2
1986
Q1
1986
Q4
1987
Q3
1988
Q2
1989
Q1
1989
Q4
1990
Q3
1991
Q2
1992
Q1
1992
Q4
1993
Q3
1994
Q2
1995
Q1
1995
Q4
1996
Q3
1997
Q2
1998
Q1
40
6080
100
120140
160
180
200
220
240260
280
Greece
50
70
90
110
130150
170
190
210
230
250270
290
1980
Q1
1980
Q4
1981
Q3
1982
Q2
1983
Q1
1983
Q4
1984
Q3
1985
Q2
1986
Q1
1986
Q4
1987
Q3
1988
Q2
1989
Q1
1989
Q4
1990
Q3
1991
Q2
1992
Q1
1992
Q4
1993
Q3
1994
Q2
1995
Q1
1995
Q4
1996
Q3
1997
Q2
1998
Q1
50
70
90
110
130150
170
190
210
230
250270
290Korea
40
60
80
100
120140
160
180
200
220
240260
280
1980
Q1
1980
Q4
1981
Q3
1982
Q2
1983
Q1
1983
Q4
1984
Q3
1985
Q2
1986
Q1
1986
Q4
1987
Q3
1988
Q2
1989
Q1
1989
Q4
1990
Q3
1991
Q2
1992
Q1
1992
Q4
1993
Q3
1994
Q2
1995
Q1
1995
Q4
1996
Q3
1997
Q2
1998
Q1
40
60
80
100
120140
160
180
200
220
240260
280
Mexico
20
40
60
80
100120
140
160180
200
220240
260
1980
Q1
1980
Q4
1981
Q3
1982
Q2
1983
Q1
1983
Q4
1984
Q3
1985
Q2
1986
Q1
1986
Q4
1987
Q3
1988
Q2
1989
Q1
1989
Q4
1990
Q3
1991
Q2
1992
Q1
1992
Q4
1993
Q3
1994
Q2
1995
Q1
1995
Q4
1996
Q3
1997
Q2
1998
Q1
20
40
60
80
100120
140
160180
200
220240
260Netherlands
40
6080
100
120
140
160
180200
220
240
260
280
1980
Q1
1980
Q4
1981
Q3
1982
Q2
1983
Q1
1983
Q4
1984
Q3
1985
Q2
1986
Q1
1986
Q4
1987
Q3
1988
Q2
1989
Q1
1989
Q4
1990
Q3
1991
Q2
1992
Q1
1992
Q4
1993
Q3
1994
Q2
1995
Q1
1995
Q4
1996
Q3
1997
Q2
1998
Q1
40
6080
100
120
140
160
180200
220
240
260
280
vis-à-vis the US dollar vis-à-vis the Japanese yen vis-à-vis the Deutschemark
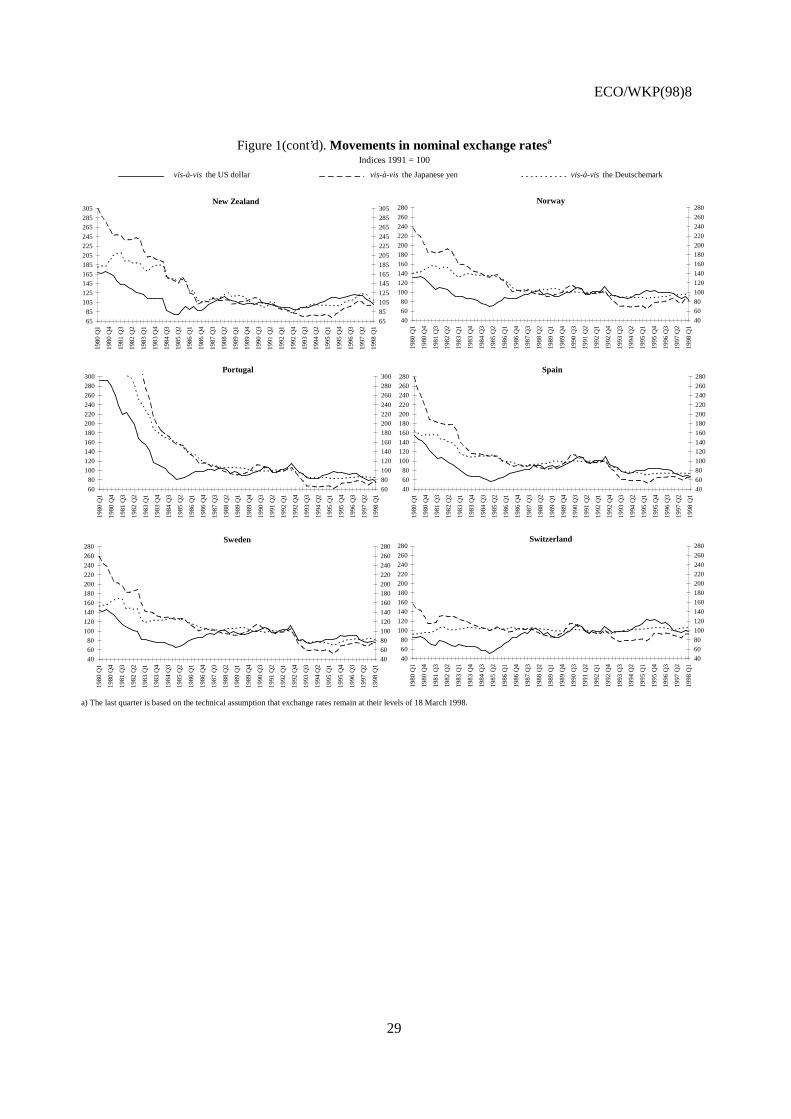
ECO/WKP(98)8
29
Figure 1(cont’d). Movements in nominal exchange ratesa
Indices 1991 = 100
a) The last quarter is based on the technical assumption that exchange rates remain at their levels of 18 March 1998.
New Zealand
65
85
105
125
145165
185
205
225
245
265285
305
1980
Q1
1980
Q4
1981
Q3
1982
Q2
1983
Q1
1983
Q4
1984
Q3
1985
Q2
1986
Q1
1986
Q4
1987
Q3
1988
Q2
1989
Q1
1989
Q4
1990
Q3
1991
Q2
1992
Q1
1992
Q4
1993
Q3
1994
Q2
1995
Q1
1995
Q4
1996
Q3
1997
Q2
1998
Q1
65
85
105
125
145165
185
205
225
245
265285
305Norway
40
6080
100
120
140
160
180200
220
240
260
280
1980
Q1
1980
Q4
1981
Q3
1982
Q2
1983
Q1
1983
Q4
1984
Q3
1985
Q2
1986
Q1
1986
Q4
1987
Q3
1988
Q2
1989
Q1
1989
Q4
1990
Q3
1991
Q2
1992
Q1
1992
Q4
1993
Q3
1994
Q2
1995
Q1
1995
Q4
1996
Q3
1997
Q2
1998
Q1
40
6080
100
120
140
160
180200
220
240
260
280
Portugal
60
80
100
120
140160
180
200220
240
260280
300
1980
Q1
1980
Q4
1981
Q3
1982
Q2
1983
Q1
1983
Q4
1984
Q3
1985
Q2
1986
Q1
1986
Q4
1987
Q3
1988
Q2
1989
Q1
1989
Q4
1990
Q3
1991
Q2
1992
Q1
1992
Q4
1993
Q3
1994
Q2
1995
Q1
1995
Q4
1996
Q3
1997
Q2
1998
Q1
60
80
100
120
140160
180
200220
240
260280
300Spain
40
60
80
100
120140
160
180200
220
240260
280
1980
Q1
1980
Q4
1981
Q3
1982
Q2
1983
Q1
1983
Q4
1984
Q3
1985
Q2
1986
Q1
1986
Q4
1987
Q3
1988
Q2
1989
Q1
1989
Q4
1990
Q3
1991
Q2
1992
Q1
1992
Q4
1993
Q3
1994
Q2
1995
Q1
1995
Q4
1996
Q3
1997
Q2
1998
Q1
40
60
80
100
120140
160
180200
220
240260
280
Sweden
40
6080
100
120
140
160
180200
220
240
260
280
1980
Q1
1980
Q4
1981
Q3
1982
Q2
1983
Q1
1983
Q4
1984
Q3
1985
Q2
1986
Q1
1986
Q4
1987
Q3
1988
Q2
1989
Q1
1989
Q4
1990
Q3
1991
Q2
1992
Q1
1992
Q4
1993
Q3
1994
Q2
1995
Q1
1995
Q4
1996
Q3
1997
Q2
1998
Q1
40
6080
100
120
140
160
180200
220
240
260
280Switzerland
40
6080
100
120
140
160
180200
220
240
260
280
1980
Q1
1980
Q4
1981
Q3
1982
Q2
1983
Q1
1983
Q4
1984
Q3
1985
Q2
1986
Q1
1986
Q4
1987
Q3
1988
Q2
1989
Q1
1989
Q4
1990
Q3
1991
Q2
1992
Q1
1992
Q4
1993
Q3
1994
Q2
1995
Q1
1995
Q4
1996
Q3
1997
Q2
1998
Q1
40
6080
100
120
140
160
180200
220
240
260
280
vis-à-vis the US dollar vis-à-vis the Japanese yen vis-à-vis the Deutschemark
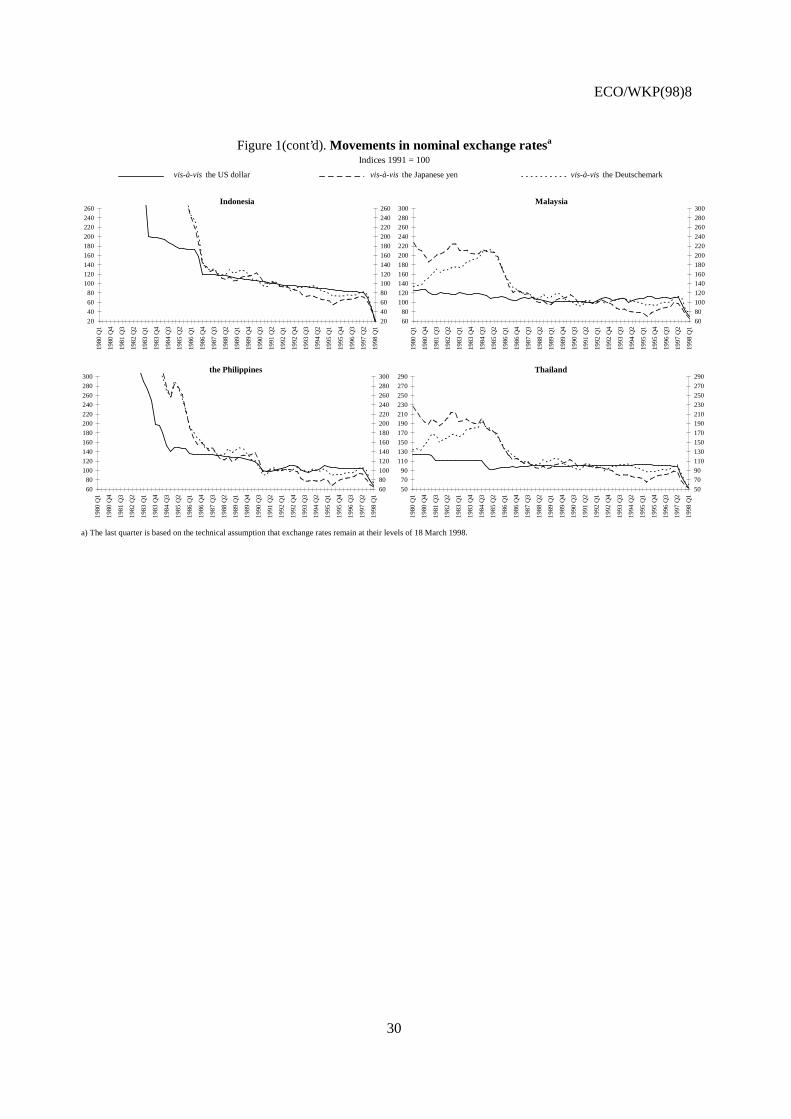
ECO/WKP(98)8
30
Figure 1(cont’d). Movements in nominal exchange ratesa
Indices 1991 = 100
a) The last quarter is based on the technical assumption that exchange rates remain at their levels of 18 March 1998.
Indonesia
20
40
60
80
100120
140
160
180
200
220240
260
1980
Q1
1980
Q4
1981
Q3
1982
Q2
1983
Q1
1983
Q4
1984
Q3
1985
Q2
1986
Q1
1986
Q4
1987
Q3
1988
Q2
1989
Q1
1989
Q4
1990
Q3
1991
Q2
1992
Q1
1992
Q4
1993
Q3
1994
Q2
1995
Q1
1995
Q4
1996
Q3
1997
Q2
1998
Q1
20
40
60
80
100120
140
160
180
200
220240
260Malaysia
60
80
100
120
140160
180
200
220
240
260280
300
1980
Q1
1980
Q4
1981
Q3
1982
Q2
1983
Q1
1983
Q4
1984
Q3
1985
Q2
1986
Q1
1986
Q4
1987
Q3
1988
Q2
1989
Q1
1989
Q4
1990
Q3
1991
Q2
1992
Q1
1992
Q4
1993
Q3
1994
Q2
1995
Q1
1995
Q4
1996
Q3
1997
Q2
1998
Q1
60
80
100
120
140160
180
200
220
240
260280
300
the Philippines
60
80100
120
140
160
180
200220
240
260
280
300
1980
Q1
1980
Q4
1981
Q3
1982
Q2
1983
Q1
1983
Q4
1984
Q3
1985
Q2
1986
Q1
1986
Q4
1987
Q3
1988
Q2
1989
Q1
1989
Q4
1990
Q3
1991
Q2
1992
Q1
1992
Q4
1993
Q3
1994
Q2
1995
Q1
1995
Q4
1996
Q3
1997
Q2
1998
Q1
60
80100
120
140
160
180
200220
240
260
280
300Thailand
50
7090
110
130
150
170
190210
230
250
270
290
1980
Q1
1980
Q4
1981
Q3
1982
Q2
1983
Q1
1983
Q4
1984
Q3
1985
Q2
1986
Q1
1986
Q4
1987
Q3
1988
Q2
1989
Q1
1989
Q4
1990
Q3
1991
Q2
1992
Q1
1992
Q4
1993
Q3
1994
Q2
1995
Q1
1995
Q4
1996
Q3
1997
Q2
1998
Q1
50
7090
110
130
150
170
190210
230
250
270
290
vis-à-vis the US dollar vis-à-vis the Japanese yen vis-à-vis the Deutschemark
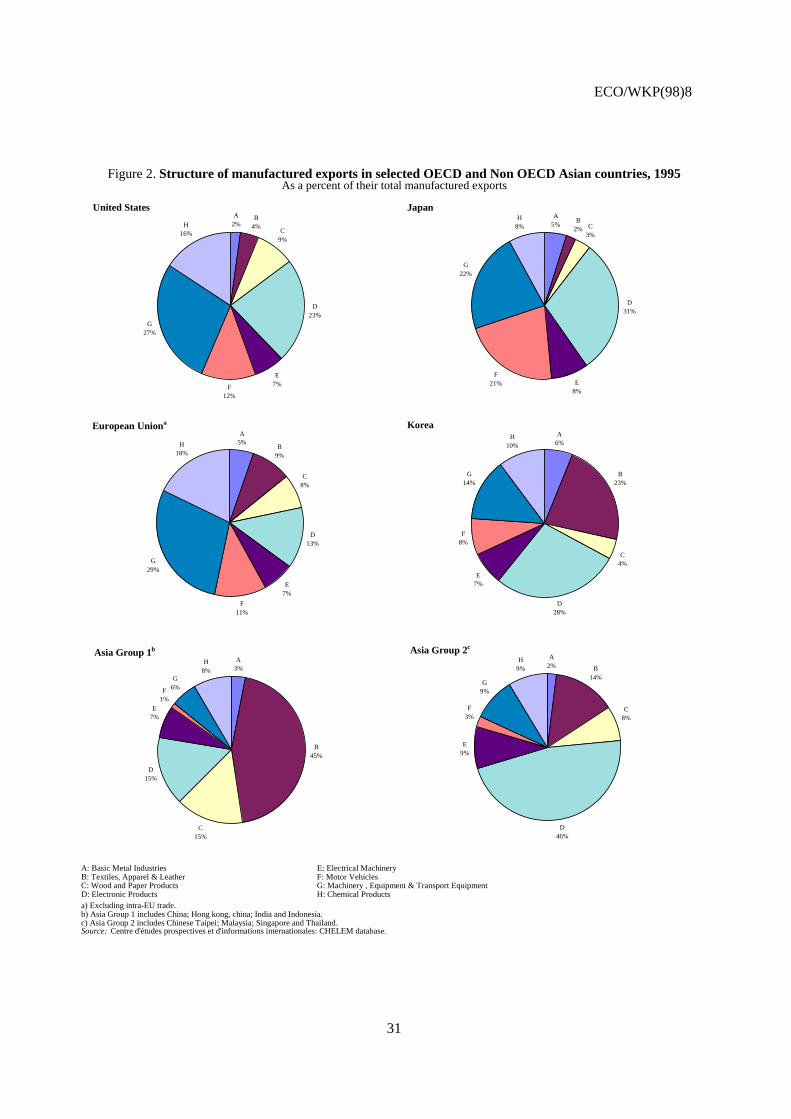
ECO/WKP(98)8
31
Figure 2. Structure of manufactured exports in selected OECD and Non OECD Asian countries, 1995As a percent of their total manufactured exports
A: Basic Metal Industries E: Electrical MachineryB: Textiles, Apparel & Leather F: Motor VehiclesC: Wood and Paper Products G: Machinery , Equipment & Transport EquipmentD: Electronic Products H: Chemical Productsa) Excluding intra-EU trade.b) Asia Group 1 includes China; Hong kong, china; India and Indonesia.c) Asia Group 2 includes Chinese Taipei; Malaysia; Singapore and Thailand.Source: Centre d'études prospectives et d'informations internationales: CHELEM database.
A2%
B4%
C9%
D23%
E7%F
12%
G27%
H16%
United StatesA
5%B
2% C3%
D31%
E8%
F21%
G22%
H8%
Japan
A5%
B9%
C8%
D13%
E7%
F11%
G29%
H18%
European Uniona
A6%
B23%
C4%
D28%
E7%
F8%
G14%
H10%
Korea
A3%
B45%
C15%
D15%
E7%
F1%
G6%
H8%
Asia Group 1bA
2% B14%
C8%
D46%
E9%
F3%
G9%
H9%
Asia Group 2c
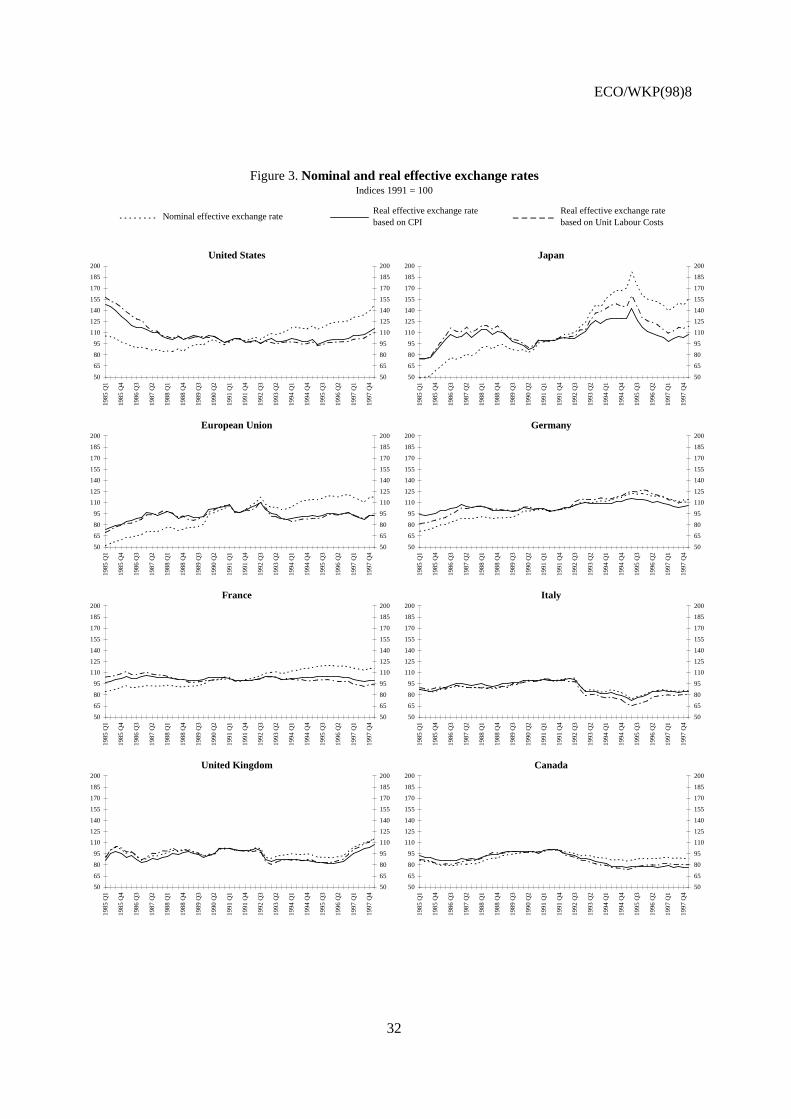
ECO/WKP(98)8
32
Figure 3. Nominal and real effective exchange ratesIndices 1991 = 100
United States
50
65
80
95
110
125
140
155
170
185
200
1985
Q1
1985
Q4
1986
Q3
1987
Q2
1988
Q1
1988
Q4
1989
Q3
1990
Q2
1991
Q1
1991
Q4
1992
Q3
1993
Q2
1994
Q1
1994
Q4
1995
Q3
1996
Q2
1997
Q1
1997
Q4
50
65
80
95
110
125
140
155
170
185
200
Japan
50
65
80
95
110
125
140
155
170
185
200
1985
Q1
1985
Q4
1986
Q3
1987
Q2
1988
Q1
1988
Q4
1989
Q3
1990
Q2
1991
Q1
1991
Q4
1992
Q3
1993
Q2
1994
Q1
1994
Q4
1995
Q3
1996
Q2
1997
Q1
1997
Q4
50
65
80
95
110
125
140
155
170
185
200
European Union
50
65
80
95
110
125
140
155
170
185
200
1985
Q1
1985
Q4
1986
Q3
1987
Q2
1988
Q1
1988
Q4
1989
Q3
1990
Q2
1991
Q1
1991
Q4
1992
Q3
1993
Q2
1994
Q1
1994
Q4
1995
Q3
1996
Q2
1997
Q1
1997
Q4
50
65
80
95
110
125
140
155
170
185
200
Germany
50
65
80
95
110
125
140
155
170
185
200
1985
Q1
1985
Q4
1986
Q3
1987
Q2
1988
Q1
1988
Q4
1989
Q3
1990
Q2
1991
Q1
1991
Q4
1992
Q3
1993
Q2
1994
Q1
1994
Q4
1995
Q3
1996
Q2
1997
Q1
1997
Q4
50
65
80
95
110
125
140
155
170
185
200
France
50
65
80
95
110
125
140
155
170
185
200
1985
Q1
1985
Q4
1986
Q3
1987
Q2
1988
Q1
1988
Q4
1989
Q3
1990
Q2
1991
Q1
1991
Q4
1992
Q3
1993
Q2
1994
Q1
1994
Q4
1995
Q3
1996
Q2
1997
Q1
1997
Q4
50
65
80
95
110
125
140
155
170
185
200
Italy
50
65
80
95
110
125
140
155
170
185
200
1985
Q1
1985
Q4
1986
Q3
1987
Q2
1988
Q1
1988
Q4
1989
Q3
1990
Q2
1991
Q1
1991
Q4
1992
Q3
1993
Q2
1994
Q1
1994
Q4
1995
Q3
1996
Q2
1997
Q1
1997
Q4
50
65
80
95
110
125
140
155
170
185
200
United Kingdom
50
65
80
95
110
125
140
155
170
185
200
1985
Q1
1985
Q4
1986
Q3
1987
Q2
1988
Q1
1988
Q4
1989
Q3
1990
Q2
1991
Q1
1991
Q4
1992
Q3
1993
Q2
1994
Q1
1994
Q4
1995
Q3
1996
Q2
1997
Q1
1997
Q4
50
65
80
95
110
125
140
155
170
185
200
Canada
50
65
80
95
110
125
140
155
170
185
200
1985
Q1
1985
Q4
1986
Q3
1987
Q2
1988
Q1
1988
Q4
1989
Q3
1990
Q2
1991
Q1
1991
Q4
1992
Q3
1993
Q2
1994
Q1
1994
Q4
1995
Q3
1996
Q2
1997
Q1
1997
Q4
50
65
80
95
110
125
140
155
170
185
200
Nominal effective exchange rateReal effective exchange rate based on CPI
Real effective exchange rate based on Unit Labour Costs
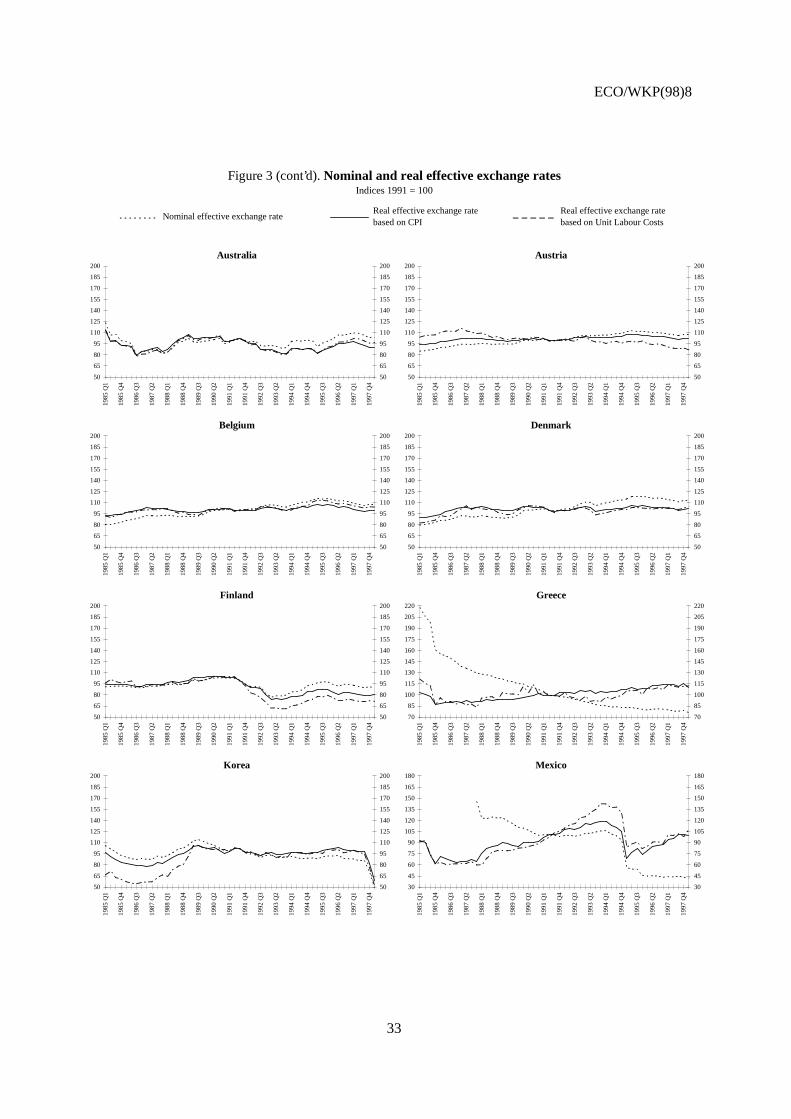
ECO/WKP(98)8
33
Figure 3 (cont’d). Nominal and real effective exchange ratesIndices 1991 = 100
Australia
50
65
80
95
110
125
140
155
170
185
200
1985
Q1
1985
Q4
1986
Q3
1987
Q2
1988
Q1
1988
Q4
1989
Q3
1990
Q2
1991
Q1
1991
Q4
1992
Q3
1993
Q2
1994
Q1
1994
Q4
1995
Q3
1996
Q2
1997
Q1
1997
Q4
50
65
80
95
110
125
140
155
170
185
200
Austria
50
65
80
95
110
125
140
155
170
185
200
1985
Q1
1985
Q4
1986
Q3
1987
Q2
1988
Q1
1988
Q4
1989
Q3
1990
Q2
1991
Q1
1991
Q4
1992
Q3
1993
Q2
1994
Q1
1994
Q4
1995
Q3
1996
Q2
1997
Q1
1997
Q4
50
65
80
95
110
125
140
155
170
185
200
Belgium
50
65
80
95
110
125
140
155
170
185
200
1985
Q1
1985
Q4
1986
Q3
1987
Q2
1988
Q1
1988
Q4
1989
Q3
1990
Q2
1991
Q1
1991
Q4
1992
Q3
1993
Q2
1994
Q1
1994
Q4
1995
Q3
1996
Q2
1997
Q1
1997
Q4
50
65
80
95
110
125
140
155
170
185
200
Denmark
50
65
80
95
110
125
140
155
170
185
200
1985
Q1
1985
Q4
1986
Q3
1987
Q2
1988
Q1
1988
Q4
1989
Q3
1990
Q2
1991
Q1
1991
Q4
1992
Q3
1993
Q2
1994
Q1
1994
Q4
1995
Q3
1996
Q2
1997
Q1
1997
Q4
50
65
80
95
110
125
140
155
170
185
200
Finland
50
65
80
95
110
125
140
155
170
185
200
1985
Q1
1985
Q4
1986
Q3
1987
Q2
1988
Q1
1988
Q4
1989
Q3
1990
Q2
1991
Q1
1991
Q4
1992
Q3
1993
Q2
1994
Q1
1994
Q4
1995
Q3
1996
Q2
1997
Q1
1997
Q4
50
65
80
95
110
125
140
155
170
185
200
Greece
70
85
100
115
130
145
160
175
190
205
220
1985
Q1
1985
Q4
1986
Q3
1987
Q2
1988
Q1
1988
Q4
1989
Q3
1990
Q2
1991
Q1
1991
Q4
1992
Q3
1993
Q2
1994
Q1
1994
Q4
1995
Q3
1996
Q2
1997
Q1
1997
Q4
70
85
100
115
130
145
160
175
190
205
220
Korea
50
65
80
95
110
125
140
155
170
185
200
1985
Q1
1985
Q4
1986
Q3
1987
Q2
1988
Q1
1988
Q4
1989
Q3
1990
Q2
1991
Q1
1991
Q4
1992
Q3
1993
Q2
1994
Q1
1994
Q4
1995
Q3
1996
Q2
1997
Q1
1997
Q4
50
65
80
95
110
125
140
155
170
185
200
Mexico
30
45
60
75
90
105
120
135
150
165
180
1985
Q1
1985
Q4
1986
Q3
1987
Q2
1988
Q1
1988
Q4
1989
Q3
1990
Q2
1991
Q1
1991
Q4
1992
Q3
1993
Q2
1994
Q1
1994
Q4
1995
Q3
1996
Q2
1997
Q1
1997
Q4
30
45
60
75
90
105
120
135
150
165
180
Nominal effective exchange rateReal effective exchange rate based on CPI
Real effective exchange rate based on Unit Labour Costs
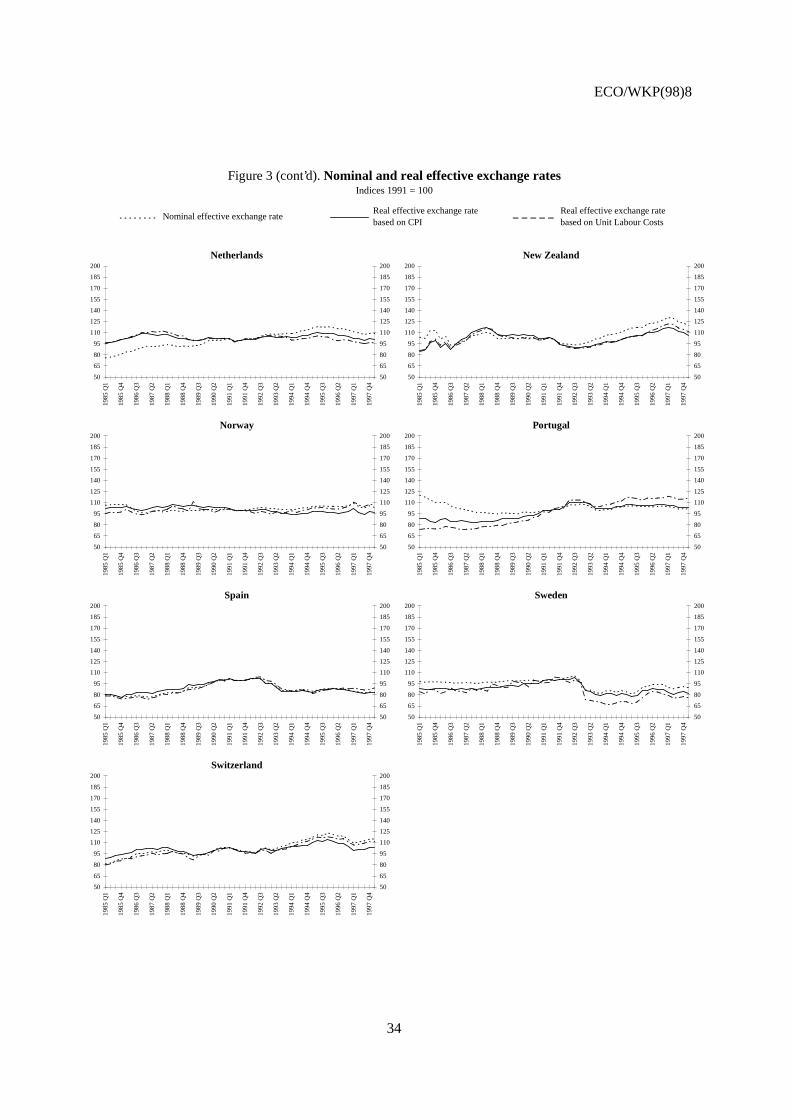
ECO/WKP(98)8
34
Figure 3 (cont’d). Nominal and real effective exchange ratesIndices 1991 = 100
Netherlands
50
65
80
95
110
125
140
155
170
185
200
1985
Q1
1985
Q4
1986
Q3
1987
Q2
1988
Q1
1988
Q4
1989
Q3
1990
Q2
1991
Q1
1991
Q4
1992
Q3
1993
Q2
1994
Q1
1994
Q4
1995
Q3
1996
Q2
1997
Q1
1997
Q4
50
65
80
95
110
125
140
155
170
185
200
New Zealand
50
65
80
95
110
125
140
155
170
185
200
1985
Q1
1985
Q4
1986
Q3
1987
Q2
1988
Q1
1988
Q4
1989
Q3
1990
Q2
1991
Q1
1991
Q4
1992
Q3
1993
Q2
1994
Q1
1994
Q4
1995
Q3
1996
Q2
1997
Q1
1997
Q4
50
65
80
95
110
125
140
155
170
185
200
Norway
50
65
80
95
110
125
140
155
170
185
200
1985
Q1
1985
Q4
1986
Q3
1987
Q2
1988
Q1
1988
Q4
1989
Q3
1990
Q2
1991
Q1
1991
Q4
1992
Q3
1993
Q2
1994
Q1
1994
Q4
1995
Q3
1996
Q2
1997
Q1
1997
Q4
50
65
80
95
110
125
140
155
170
185
200
Portugal
50
65
80
95
110
125
140
155
170
185
200
1985
Q1
1985
Q4
1986
Q3
1987
Q2
1988
Q1
1988
Q4
1989
Q3
1990
Q2
1991
Q1
1991
Q4
1992
Q3
1993
Q2
1994
Q1
1994
Q4
1995
Q3
1996
Q2
1997
Q1
1997
Q4
50
65
80
95
110
125
140
155
170
185
200
Spain
50
65
80
95
110
125
140
155
170
185
200
1985
Q1
1985
Q4
1986
Q3
1987
Q2
1988
Q1
1988
Q4
1989
Q3
1990
Q2
1991
Q1
1991
Q4
1992
Q3
1993
Q2
1994
Q1
1994
Q4
1995
Q3
1996
Q2
1997
Q1
1997
Q4
50
65
80
95
110
125
140
155
170
185
200
Sweden
50
65
80
95
110
125
140
155
170
185
200
1985
Q1
1985
Q4
1986
Q3
1987
Q2
1988
Q1
1988
Q4
1989
Q3
1990
Q2
1991
Q1
1991
Q4
1992
Q3
1993
Q2
1994
Q1
1994
Q4
1995
Q3
1996
Q2
1997
Q1
1997
Q4
50
65
80
95
110
125
140
155
170
185
200
Switzerland
50
65
80
95
110
125
140
155
170
185
200
1985
Q1
1985
Q4
1986
Q3
1987
Q2
1988
Q1
1988
Q4
1989
Q3
1990
Q2
1991
Q1
1991
Q4
1992
Q3
1993
Q2
1994
Q1
1994
Q4
1995
Q3
1996
Q2
1997
Q1
1997
Q4
50
65
80
95
110
125
140
155
170
185
200
Nominal effective exchange rateReal effective exchange rate based on CPI
Real effective exchange rate based on Unit Labour Costs
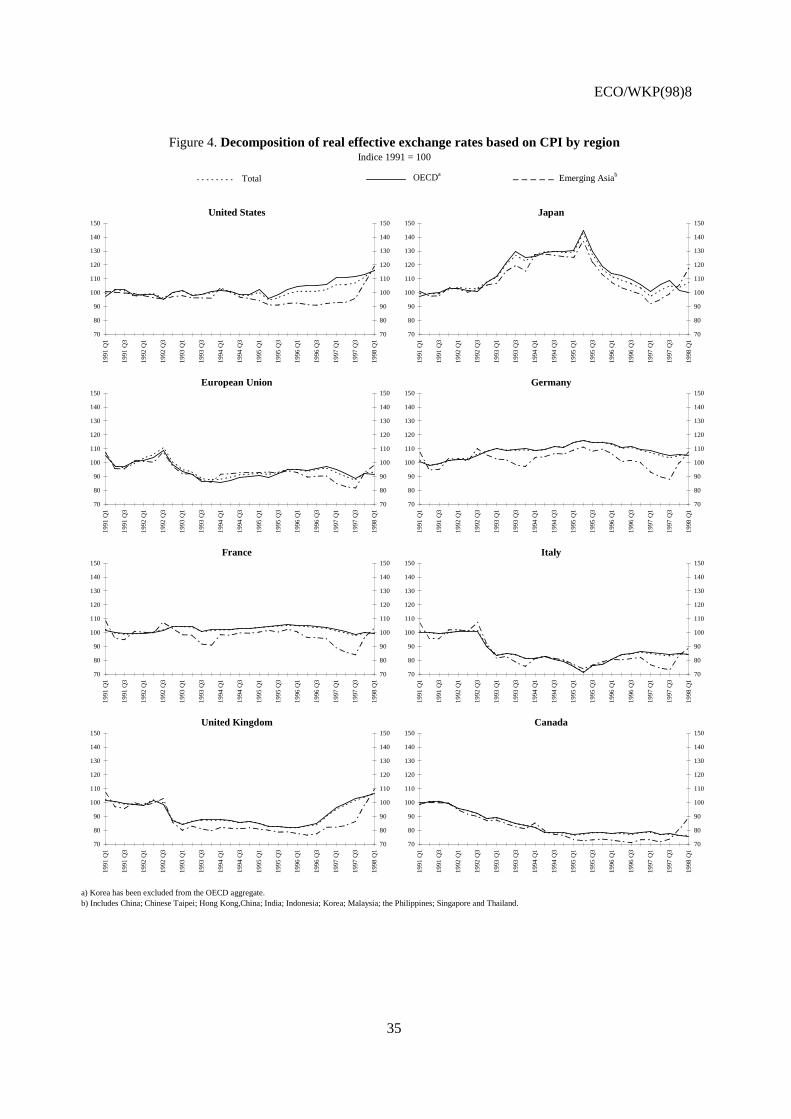
ECO/WKP(98)8
35
Figure 4. Decomposition of real effective exchange rates based on CPI by regionIndice 1991 = 100
a) Korea has been excluded from the OECD aggregate.b) Includes China; Chinese Taipei; Hong Kong,China; India; Indonesia; Korea; Malaysia; the Philippines; Singapore and Thailand.
United States
70
80
90
100
110
120
130
140
150
1991
Q1
1991
Q3
1992
Q1
1992
Q3
1993
Q1
1993
Q3
1994
Q1
1994
Q3
1995
Q1
1995
Q3
1996
Q1
1996
Q3
1997
Q1
1997
Q3
1998
Q1
70
80
90
100
110
120
130
140
150
Japan
70
80
90
100
110
120
130
140
150
1991
Q1
1991
Q3
1992
Q1
1992
Q3
1993
Q1
1993
Q3
1994
Q1
1994
Q3
1995
Q1
1995
Q3
1996
Q1
1996
Q3
1997
Q1
1997
Q3
1998
Q1
70
80
90
100
110
120
130
140
150
European Union
70
80
90
100
110
120
130
140
150
1991
Q1
1991
Q3
1992
Q1
1992
Q3
1993
Q1
1993
Q3
1994
Q1
1994
Q3
1995
Q1
1995
Q3
1996
Q1
1996
Q3
1997
Q1
1997
Q3
1998
Q1
70
80
90
100
110
120
130
140
150
Germany
70
80
90
100
110
120
130
140
150
1991
Q1
1991
Q3
1992
Q1
1992
Q3
1993
Q1
1993
Q3
1994
Q1
1994
Q3
1995
Q1
1995
Q3
1996
Q1
1996
Q3
1997
Q1
1997
Q3
1998
Q1
70
80
90
100
110
120
130
140
150
France
70
80
90
100
110
120
130
140
150
1991
Q1
1991
Q3
1992
Q1
1992
Q3
1993
Q1
1993
Q3
1994
Q1
1994
Q3
1995
Q1
1995
Q3
1996
Q1
1996
Q3
1997
Q1
1997
Q3
1998
Q1
70
80
90
100
110
120
130
140
150
Italy
70
80
90
100
110
120
130
140
150
1991
Q1
1991
Q3
1992
Q1
1992
Q3
1993
Q1
1993
Q3
1994
Q1
1994
Q3
1995
Q1
1995
Q3
1996
Q1
1996
Q3
1997
Q1
1997
Q3
1998
Q1
70
80
90
100
110
120
130
140
150
United Kingdom
70
80
90
100
110
120
130
140
150
1991
Q1
1991
Q3
1992
Q1
1992
Q3
1993
Q1
1993
Q3
1994
Q1
1994
Q3
1995
Q1
1995
Q3
1996
Q1
1996
Q3
1997
Q1
1997
Q3
1998
Q1
70
80
90
100
110
120
130
140
150
Canada
70
80
90
100
110
120
130
140
150
1991
Q1
1991
Q3
1992
Q1
1992
Q3
1993
Q1
1993
Q3
1994
Q1
1994
Q3
1995
Q1
1995
Q3
1996
Q1
1996
Q3
1997
Q1
1997
Q3
1998
Q1
70
80
90
100
110
120
130
140
150
Total OECDa Emerging Asiab
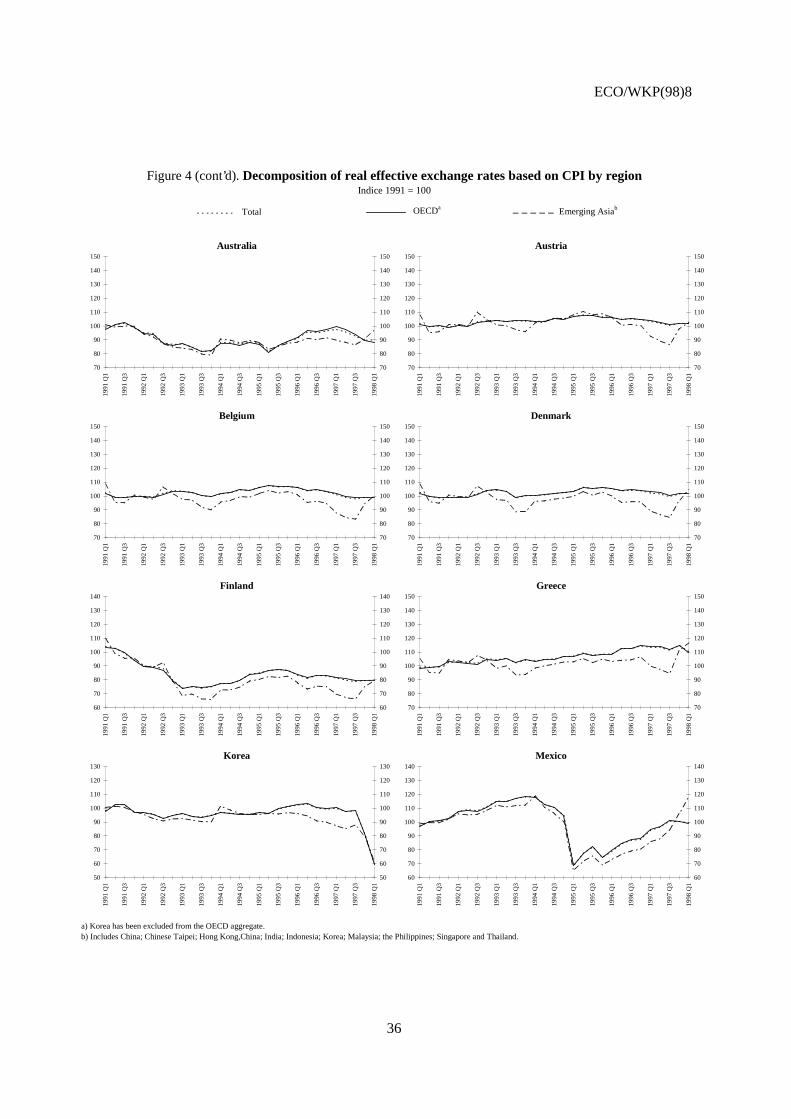
ECO/WKP(98)8
36
Figure 4 (cont’d). Decomposition of real effective exchange rates based on CPI by regionIndice 1991 = 100
a) Korea has been excluded from the OECD aggregate.b) Includes China; Chinese Taipei; Hong Kong,China; India; Indonesia; Korea; Malaysia; the Philippines; Singapore and Thailand.
Australia
70
80
90
100
110
120
130
140
150
1991
Q1
1991
Q3
1992
Q1
1992
Q3
1993
Q1
1993
Q3
1994
Q1
1994
Q3
1995
Q1
1995
Q3
1996
Q1
1996
Q3
1997
Q1
1997
Q3
1998
Q1
70
80
90
100
110
120
130
140
150
Austria
70
80
90
100
110
120
130
140
150
1991
Q1
1991
Q3
1992
Q1
1992
Q3
1993
Q1
1993
Q3
1994
Q1
1994
Q3
1995
Q1
1995
Q3
1996
Q1
1996
Q3
1997
Q1
1997
Q3
1998
Q1
70
80
90
100
110
120
130
140
150
Belgium
70
80
90
100
110
120
130
140
150
1991
Q1
1991
Q3
1992
Q1
1992
Q3
1993
Q1
1993
Q3
1994
Q1
1994
Q3
1995
Q1
1995
Q3
1996
Q1
1996
Q3
1997
Q1
1997
Q3
1998
Q1
70
80
90
100
110
120
130
140
150
Denmark
70
80
90
100
110
120
130
140
15019
91 Q
1
1991
Q3
1992
Q1
1992
Q3
1993
Q1
1993
Q3
1994
Q1
1994
Q3
1995
Q1
1995
Q3
1996
Q1
1996
Q3
1997
Q1
1997
Q3
1998
Q1
70
80
90
100
110
120
130
140
150
Finland
60
70
80
90
100
110
120
130
140
1991
Q1
1991
Q3
1992
Q1
1992
Q3
1993
Q1
1993
Q3
1994
Q1
1994
Q3
1995
Q1
1995
Q3
1996
Q1
1996
Q3
1997
Q1
1997
Q3
1998
Q1
60
70
80
90
100
110
120
130
140
Greece
70
80
90
100
110
120
130
140
150
1991
Q1
1991
Q3
1992
Q1
1992
Q3
1993
Q1
1993
Q3
1994
Q1
1994
Q3
1995
Q1
1995
Q3
1996
Q1
1996
Q3
1997
Q1
1997
Q3
1998
Q1
70
80
90
100
110
120
130
140
150
Korea
50
60
70
80
90
100
110
120
130
1991
Q1
1991
Q3
1992
Q1
1992
Q3
1993
Q1
1993
Q3
1994
Q1
1994
Q3
1995
Q1
1995
Q3
1996
Q1
1996
Q3
1997
Q1
1997
Q3
1998
Q1
50
60
70
80
90
100
110
120
130
Mexico
60
70
80
90
100
110
120
130
140
1991
Q1
1991
Q3
1992
Q1
1992
Q3
1993
Q1
1993
Q3
1994
Q1
1994
Q3
1995
Q1
1995
Q3
1996
Q1
1996
Q3
1997
Q1
1997
Q3
1998
Q1
60
70
80
90
100
110
120
130
140
Total OECDa Emerging Asiab
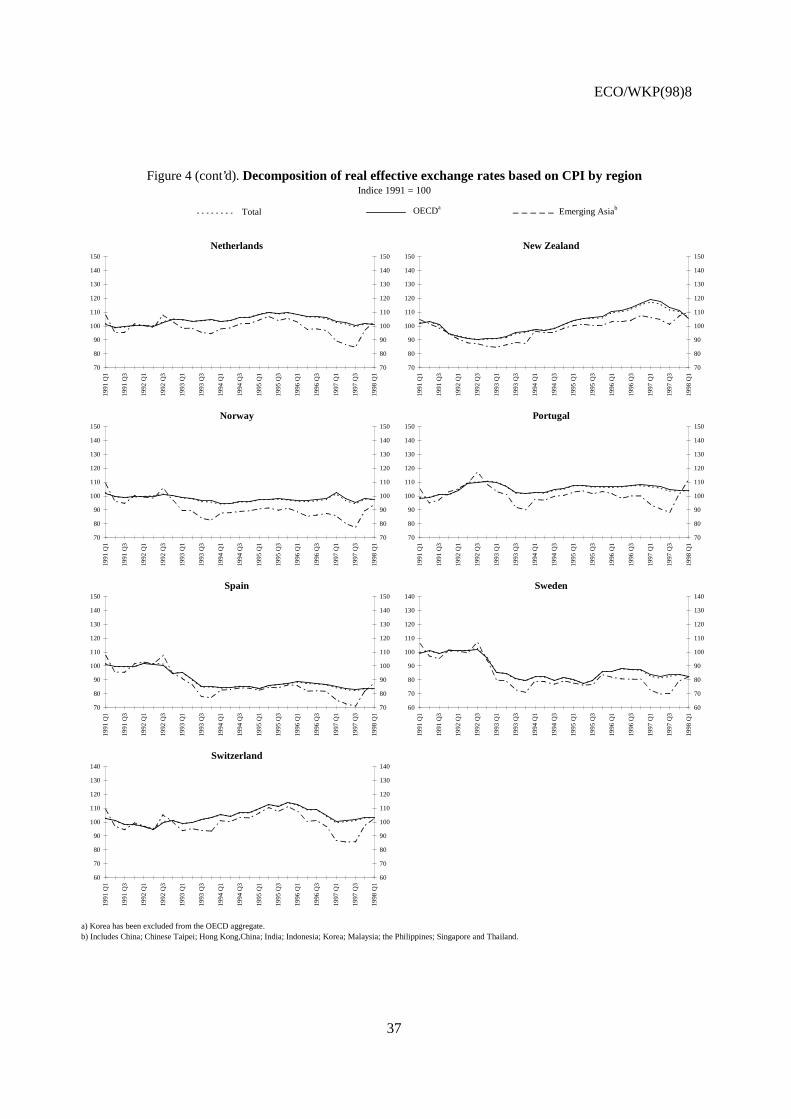
ECO/WKP(98)8
37
Figure 4 (cont’d). Decomposition of real effective exchange rates based on CPI by regionIndice 1991 = 100
a) Korea has been excluded from the OECD aggregate.b) Includes China; Chinese Taipei; Hong Kong,China; India; Indonesia; Korea; Malaysia; the Philippines; Singapore and Thailand.
Netherlands
70
80
90
100
110
120
130
140
150
1991
Q1
1991
Q3
1992
Q1
1992
Q3
1993
Q1
1993
Q3
1994
Q1
1994
Q3
1995
Q1
1995
Q3
1996
Q1
1996
Q3
1997
Q1
1997
Q3
1998
Q1
70
80
90
100
110
120
130
140
150
New Zealand
70
80
90
100
110
120
130
140
150
1991
Q1
1991
Q3
1992
Q1
1992
Q3
1993
Q1
1993
Q3
1994
Q1
1994
Q3
1995
Q1
1995
Q3
1996
Q1
1996
Q3
1997
Q1
1997
Q3
1998
Q1
70
80
90
100
110
120
130
140
150
Norway
70
80
90
100
110
120
130
140
150
1991
Q1
1991
Q3
1992
Q1
1992
Q3
1993
Q1
1993
Q3
1994
Q1
1994
Q3
1995
Q1
1995
Q3
1996
Q1
1996
Q3
1997
Q1
1997
Q3
1998
Q1
70
80
90
100
110
120
130
140
150
Portugal
70
80
90
100
110
120
130
140
15019
91 Q
1
1991
Q3
1992
Q1
1992
Q3
1993
Q1
1993
Q3
1994
Q1
1994
Q3
1995
Q1
1995
Q3
1996
Q1
1996
Q3
1997
Q1
1997
Q3
1998
Q1
70
80
90
100
110
120
130
140
150
Spain
70
80
90
100
110
120
130
140
150
1991
Q1
1991
Q3
1992
Q1
1992
Q3
1993
Q1
1993
Q3
1994
Q1
1994
Q3
1995
Q1
1995
Q3
1996
Q1
1996
Q3
1997
Q1
1997
Q3
1998
Q1
70
80
90
100
110
120
130
140
150
Sweden
60
70
80
90
100
110
120
130
140
1991
Q1
1991
Q3
1992
Q1
1992
Q3
1993
Q1
1993
Q3
1994
Q1
1994
Q3
1995
Q1
1995
Q3
1996
Q1
1996
Q3
1997
Q1
1997
Q3
1998
Q1
60
70
80
90
100
110
120
130
140
Switzerland
60
70
80
90
100
110
120
130
140
1991
Q1
1991
Q3
1992
Q1
1992
Q3
1993
Q1
1993
Q3
1994
Q1
1994
Q3
1995
Q1
1995
Q3
1996
Q1
1996
Q3
1997
Q1
1997
Q3
1998
Q1
60
70
80
90
100
110
120
130
140
Total OECDa Emerging Asiab
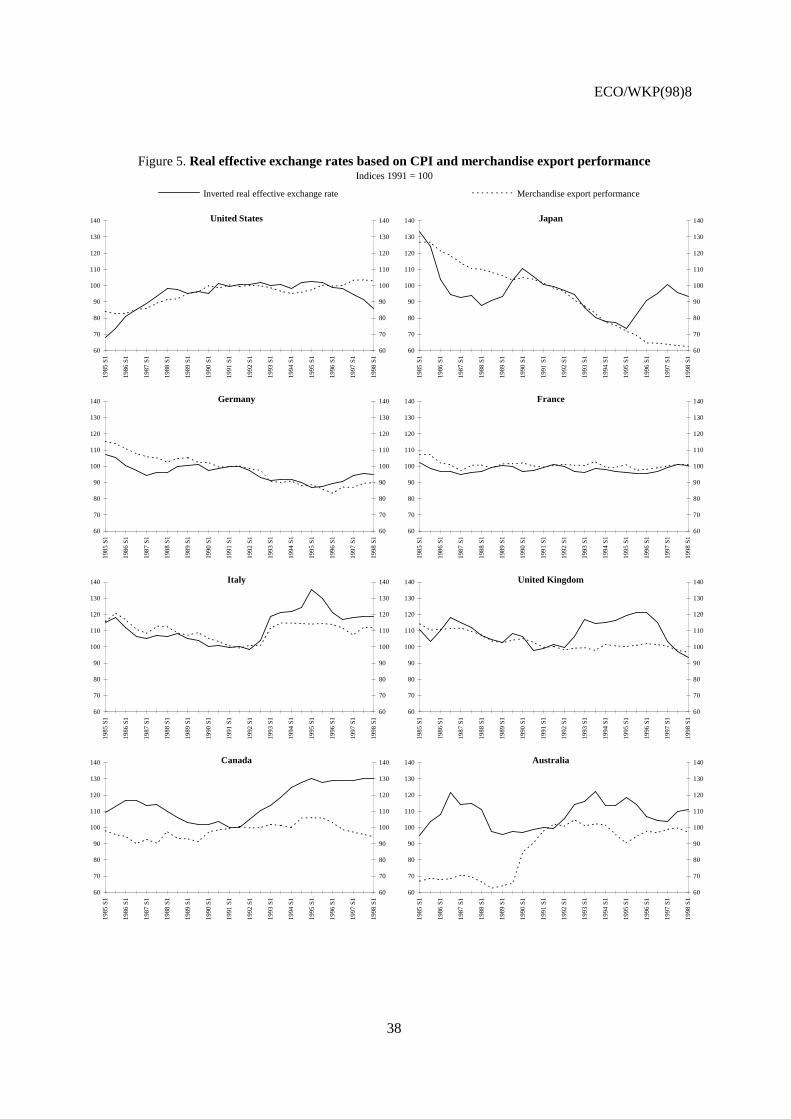
ECO/WKP(98)8
38
Figure 5. Real effective exchange rates based on CPI and merchandise export performanceIndices 1991 = 100
United States
60
70
80
90
100
110
120
130
140
1985
S1
1986
S1
1987
S1
1988
S1
1989
S1
1990
S1
1991
S1
1992
S1
1993
S1
1994
S1
1995
S1
1996
S1
1997
S1
1998
S1
60
70
80
90
100
110
120
130
140 Japan
60
70
80
90
100
110
120
130
140
1985
S1
1986
S1
1987
S1
1988
S1
1989
S1
1990
S1
1991
S1
1992
S1
1993
S1
1994
S1
1995
S1
1996
S1
1997
S1
1998
S1
60
70
80
90
100
110
120
130
140
Germany
60
70
80
90
100
110
120
130
140
1985
S1
1986
S1
1987
S1
1988
S1
1989
S1
1990
S1
1991
S1
1992
S1
1993
S1
1994
S1
1995
S1
1996
S1
1997
S1
1998
S1
60
70
80
90
100
110
120
130
140 France
60
70
80
90
100
110
120
130
140
1985
S1
1986
S1
1987
S1
1988
S1
1989
S1
1990
S1
1991
S1
1992
S1
1993
S1
1994
S1
1995
S1
1996
S1
1997
S1
1998
S1
60
70
80
90
100
110
120
130
140
Italy
60
70
80
90
100
110
120
130
140
1985
S1
1986
S1
1987
S1
1988
S1
1989
S1
1990
S1
1991
S1
1992
S1
1993
S1
1994
S1
1995
S1
1996
S1
1997
S1
1998
S1
60
70
80
90
100
110
120
130
140 United Kingdom
60
70
80
90
100
110
120
130
140
1985
S1
1986
S1
1987
S1
1988
S1
1989
S1
1990
S1
1991
S1
1992
S1
1993
S1
1994
S1
1995
S1
1996
S1
1997
S1
1998
S1
60
70
80
90
100
110
120
130
140
Canada
60
70
80
90
100
110
120
130
140
1985
S1
1986
S1
1987
S1
1988
S1
1989
S1
1990
S1
1991
S1
1992
S1
1993
S1
1994
S1
1995
S1
1996
S1
1997
S1
1998
S1
60
70
80
90
100
110
120
130
140 Australia
60
70
80
90
100
110
120
130
140
1985
S1
1986
S1
1987
S1
1988
S1
1989
S1
1990
S1
1991
S1
1992
S1
1993
S1
1994
S1
1995
S1
1996
S1
1997
S1
1998
S1
60
70
80
90
100
110
120
130
140
Inverted real effective exchange rate Merchandise export performance
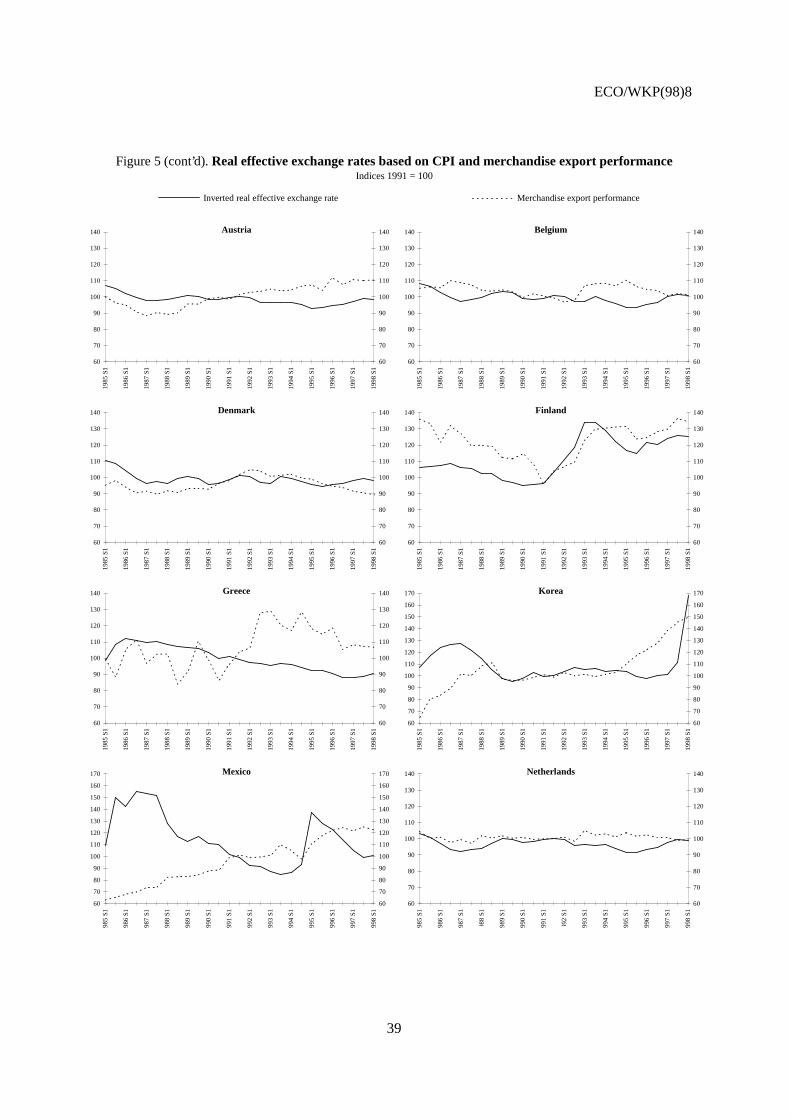
ECO/WKP(98)8
39
Figure 5 (cont’d). Real effective exchange rates based on CPI and merchandise export performanceIndices 1991 = 100
Austria
60
70
80
90
100
110
120
130
140
1985
S1
1986
S1
1987
S1
1988
S1
1989
S1
1990
S1
1991
S1
1992
S1
1993
S1
1994
S1
1995
S1
1996
S1
1997
S1
1998
S1
60
70
80
90
100
110
120
130
140 Belgium
60
70
80
90
100
110
120
130
140
1985
S1
1986
S1
1987
S1
1988
S1
1989
S1
1990
S1
1991
S1
1992
S1
1993
S1
1994
S1
1995
S1
1996
S1
1997
S1
1998
S1
60
70
80
90
100
110
120
130
140
Denmark
60
70
80
90
100
110
120
130
140
1985
S1
1986
S1
1987
S1
1988
S1
1989
S1
1990
S1
1991
S1
1992
S1
1993
S1
1994
S1
1995
S1
1996
S1
1997
S1
1998
S1
60
70
80
90
100
110
120
130
140 Finland
60
70
80
90
100
110
120
130
14019
85 S
1
1986
S1
1987
S1
1988
S1
1989
S1
1990
S1
1991
S1
1992
S1
1993
S1
1994
S1
1995
S1
1996
S1
1997
S1
1998
S1
60
70
80
90
100
110
120
130
140
Greece
60
70
80
90
100
110
120
130
140
1985
S1
1986
S1
1987
S1
1988
S1
1989
S1
1990
S1
1991
S1
1992
S1
1993
S1
1994
S1
1995
S1
1996
S1
1997
S1
1998
S1
60
70
80
90
100
110
120
130
140 Korea
60
70
80
90
100
110
120
130
140
150
160
170
1985
S1
1986
S1
1987
S1
1988
S1
1989
S1
1990
S1
1991
S1
1992
S1
1993
S1
1994
S1
1995
S1
1996
S1
1997
S1
1998
S1
60
70
80
90
100
110
120
130
140
150
160
170
Mexico
60
70
80
90
100
110
120
130
140
150
160
170
985
S1
986
S1
987
S1
988
S1
989
S1
990
S1
991
S1
992
S1
993
S1
994
S1
995
S1
996
S1
997
S1
998
S1
60
70
80
90
100
110
120
130
140
150
160
170 Netherlands
60
70
80
90
100
110
120
130
140
985
S1
986
S1
987
S1
988
S1
989
S1
990
S1
991
S1
992
S1
993
S1
994
S1
995
S1
996
S1
997
S1
998
S1
60
70
80
90
100
110
120
130
140
Inverted real effective exchange rate Merchandise export performance
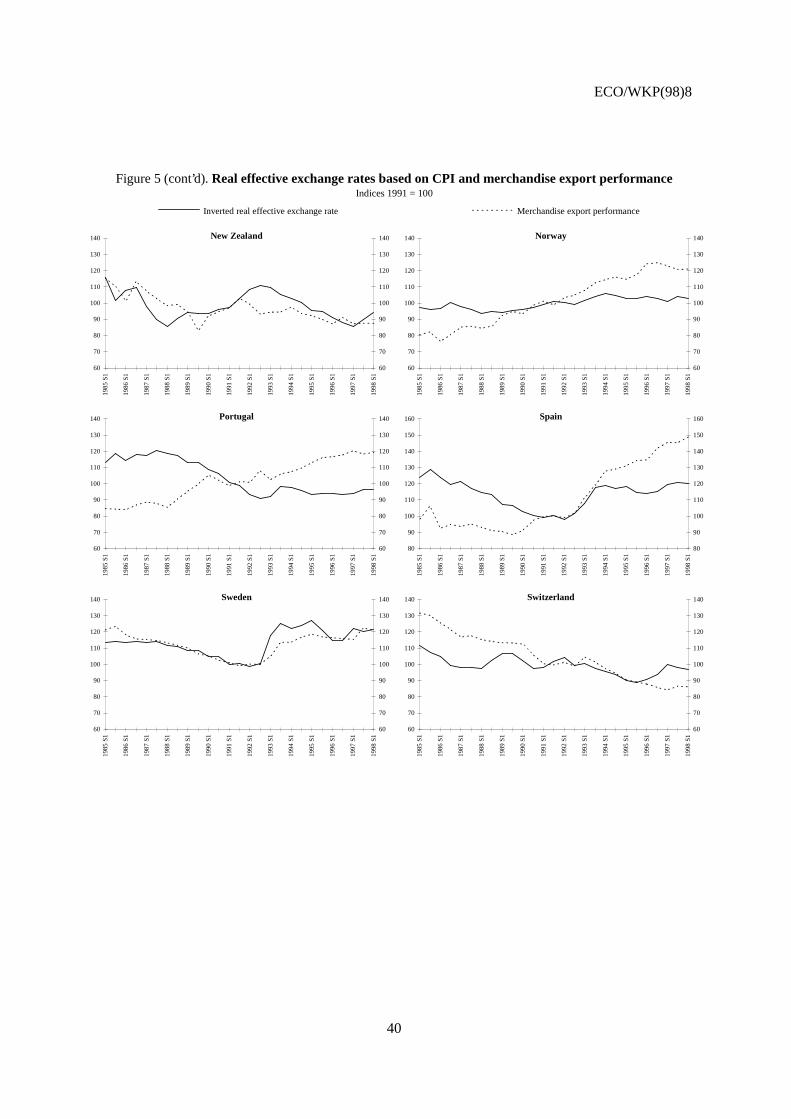
ECO/WKP(98)8
40
Figure 5 (cont’d). Real effective exchange rates based on CPI and merchandise export performanceIndices 1991 = 100
New Zealand
60
70
80
90
100
110
120
130
140
1985
S1
1986
S1
1987
S1
1988
S1
1989
S1
1990
S1
1991
S1
1992
S1
1993
S1
1994
S1
1995
S1
1996
S1
1997
S1
1998
S1
60
70
80
90
100
110
120
130
140 Norway
60
70
80
90
100
110
120
130
140
1985
S1
1986
S1
1987
S1
1988
S1
1989
S1
1990
S1
1991
S1
1992
S1
1993
S1
1994
S1
1995
S1
1996
S1
1997
S1
1998
S1
60
70
80
90
100
110
120
130
140
Portugal
60
70
80
90
100
110
120
130
140
1985
S1
1986
S1
1987
S1
1988
S1
1989
S1
1990
S1
1991
S1
1992
S1
1993
S1
1994
S1
1995
S1
1996
S1
1997
S1
1998
S1
60
70
80
90
100
110
120
130
140 Spain
80
90
100
110
120
130
140
150
16019
85 S
1
1986
S1
1987
S1
1988
S1
1989
S1
1990
S1
1991
S1
1992
S1
1993
S1
1994
S1
1995
S1
1996
S1
1997
S1
1998
S1
80
90
100
110
120
130
140
150
160
Sweden
60
70
80
90
100
110
120
130
140
1985
S1
1986
S1
1987
S1
1988
S1
1989
S1
1990
S1
1991
S1
1992
S1
1993
S1
1994
S1
1995
S1
1996
S1
1997
S1
1998
S1
60
70
80
90
100
110
120
130
140 Switzerland
60
70
80
90
100
110
120
130
140
1985
S1
1986
S1
1987
S1
1988
S1
1989
S1
1990
S1
1991
S1
1992
S1
1993
S1
1994
S1
1995
S1
1996
S1
1997
S1
1998
S1
60
70
80
90
100
110
120
130
140
Inverted real effective exchange rate Merchandise export performance
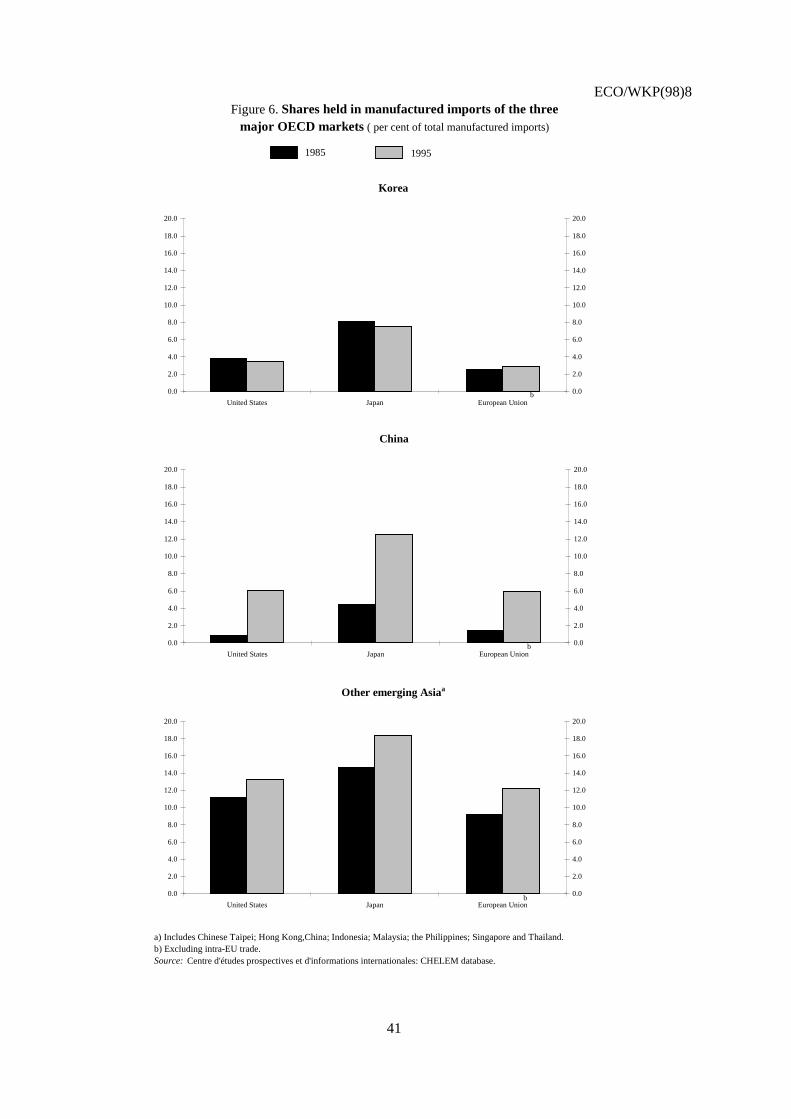
ECO/WKP(98)8
41
Figure 6. Shares held in manufactured imports of the threemajor OECD markets ( per cent of total manufactured imports)
a) Includes Chinese Taipei; Hong Kong,China; Indonesia; Malaysia; the Philippines; Singapore and Thailand. b) Excluding intra-EU trade.Source: Centre d'études prospectives et d'informations internationales: CHELEM database.
China
0.0
2.0
4.0
6.0
8.0
10.0
12.0
14.0
16.0
18.0
20.0
United States Japan European Union
0.0
2.0
4.0
6.0
8.0
10.0
12.0
14.0
16.0
18.0
20.0
b
Other emerging Asiaa
0.0
2.0
4.0
6.0
8.0
10.0
12.0
14.0
16.0
18.0
20.0
United States Japan European Union
0.0
2.0
4.0
6.0
8.0
10.0
12.0
14.0
16.0
18.0
20.0
b
Korea
0.0
2.0
4.0
6.0
8.0
10.0
12.0
14.0
16.0
18.0
20.0
United States Japan European Union
0.0
2.0
4.0
6.0
8.0
10.0
12.0
14.0
16.0
18.0
20.0
b
1985 1995
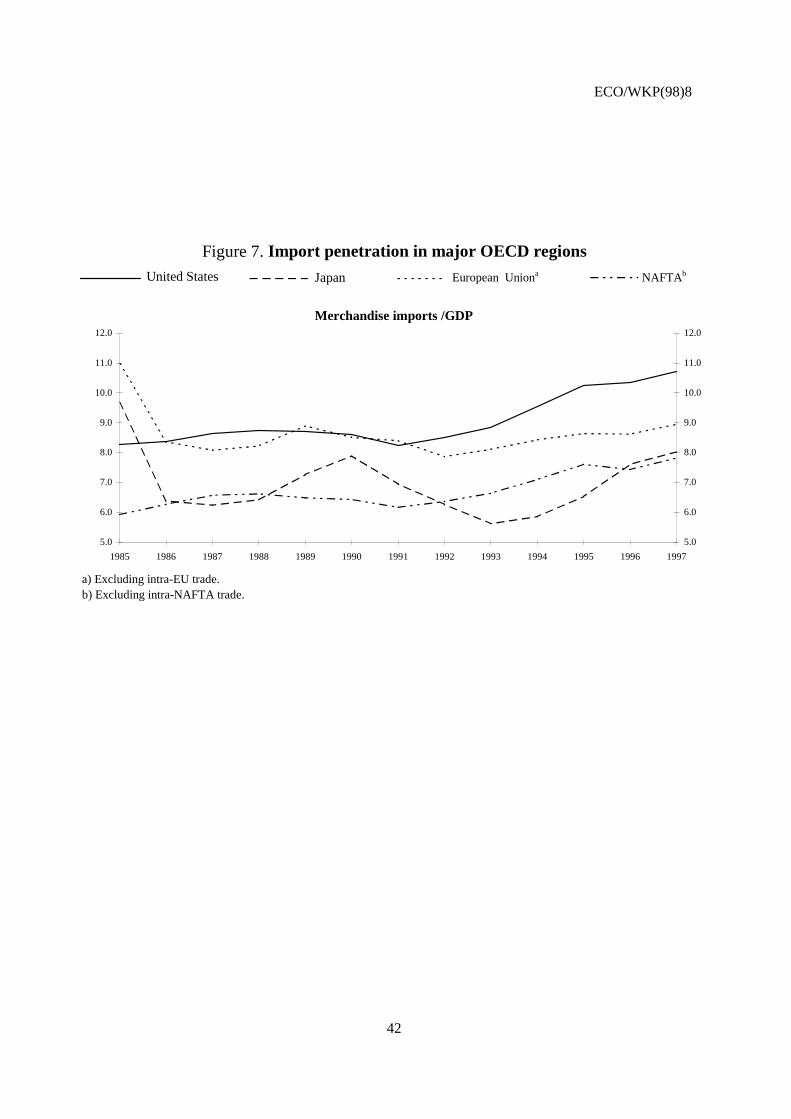
ECO/WKP(98)8
42
Figure 7. Import penetration in major OECD regions
a) Excluding intra-EU trade.b) Excluding intra-NAFTA trade.
Merchandise imports /GDP
5.0
6.0
7.0
8.0
9.0
10.0
11.0
12.0
1985 1986 1987 1988 1989 1990 1991 1992 1993 1994 1995 1996 1997
5.0
6.0
7.0
8.0
9.0
10.0
11.0
12.0
United States Japan European Uniona NAFTAb
ECO/WKP(98)8
43
ANNEX
RECENT REVISIONS TO INTERNATIONAL COMPETITIVENESS INDICATORS
1. The OECD Secretariat calculates three different measures of relative competitiveness, which arepublished in the Economic Outlook. These are based on the ratio between domestic and competitors’average values of manufactured exports, unit labour costs in manufacturing and consumer prices indicesexpressed in a common currency. The OECD also produces indices of nominal effective exchange rates.
2. Competitiveness indicators are currently calculated for twenty-two OECD countries and threeAsian newly industrialising economies (Chinese Taipei; Singapore; and Hong Kong, China)1. Thirty-oneexport markets are considered: twenty-five OECD countries and six non-OECD zones2. The revisedindicators presented in this paper expand the group of competitor countries to include China, Indonesia,Malaysia, the Philippines, Thailand, India, Argentina, Brazil and Russia (the latter from 1992 onwards).Nominal and real effective exchange rates are also calculated for the EU aggregate.
3. The calculation of competitiveness indicators and nominal effective exchange rates uses asystem of weights based on a double-weighting principle, which takes account of the structure ofcompetition in both export and import markets (see weighting matrices reported in Annex Table 1). Adiscussion of this methodology is given in Durand et al. (1992). For each year, starting in 1970, theprocedure calculates for a given country the relative importance of its competitors in the domestic andforeign markets (which is determined by the pattern of supply on that markets), and then weights itaccording to the relative share of the different markets in the total demand directed at this country.
4. The nominal effective exchange rate index is a chain-linked index with base period 1991.Changes in the index are calculated by comparing each country’s percentage change in the nominalexchange rate index to a weighted average of changes in its competitors’ nominal exchange rate indices,
________________________
1. The following twenty-two countries, for which homogeneous unit labour cost data are available, areincluded in the calculations: United States, Japan, Germany, France, Italy, United Kingdom, Canada,Australia, Austria, Belgium, Denmark, Finland, Greece, Korea, Mexico, Netherlands, New Zealand,Norway, Portugal, Spain, Sweden, and Switzerland. Iceland, Ireland, and Turkey, and since January 1991,the Czech Republic, Hungary and Poland, are covered in the calculation of the nominal effective exchangerates published in the Economic Outlook, but are not included in the competitiveness indicators due to alack of comparative data on manufacturing unit labour costs.
2. Iceland, Ireland, and Turkey are included in the export markets. The six non-OECD zones cover thefollowing countries: OPEC countries; Asian newly industrialising economies (Chinese Taipei, Singaporeand Hong Kong, China); other non-OECD Asian countries and the Middle East, excluding OPEC countries;Africa excluding OPEC countries; Latin-America excluding OPEC countries; Central and Eastern Europeancountries.
ECO/WKP(98)8
44
using the weighting matrix of the previous year. The indices of nominal effective exchange rates are thencalculated from a starting period by cumulating changes3. This gives a set of effective exchange ratesbased on moving weights.
5. The competitiveness indicators presented in this paper are also calculated by chain-linkingpercentage changes in relative manufacturing unit labour costs and consumer prices indices from astarting period (1970). Changes in relative indices are computed by comparing the percentage change inthe index for the country concerned (expressed in US dollars at market exchange rates) to a weightedaverage of changes in the indices for the other OECD countries, the three Asian newly industrialisingeconomies and the nine emerging market countries (also expressed in US dollars).
6. More precisely, the calculation of real effective exchange rate is done in the following way:
Let Rit,0 be the index of real effective exchange rate of country i with base period 0. X i
t is the exchange
rate against the US dollar in period t (expressed as US dollars per unit of country i’ s currency) and Pit
represents alternatively country i’s consumer prices or unit labour costs in the manufacturing sector. Theformula to compute real effective exchange rates is the following:
∆ ∆ ∆ln ln . ln,RP
P
X
Xw
P
P
X
Xit i
t
i
it
iijt
j i
jt
j
jt
j0 0 0
10 0
= ⋅
− ⋅
−
≠∑
or equivalently: ∆ ln ln ln,RP X
P Xw
P X
P Xit i
tit
it
it ij
t
j i
jt
jt
jt
jt0 1 1
11 1
= − ⋅− −−
≠− −∑
7. The inclusion of new emerging market economies influences more the trends in nominaleffective rates than that of real rates. This is because most phases of effective nominal depreciationsexperienced by these economies have, to a large extent, been associated with rising inflation. As a result,movements in these countries’ real effective exchange rates are much less pronounced than movements innominal rates. Nevertheless, emerging market economies have more influence on the United States andJapan’s competitiveness indicators, than on those of the European countries, reflecting the relative weightsof these economies as competitors for each OECD region (see Annex Figure 2).
Sources of data for non-OECD countries and the European Union aggregate
8. For each year, starting in 1970, a country by market matrix (34 competitors x 31 markets) hasbeen constructed for the calculations of weights. The use of moving weights allows to take into accountchanging trade patterns. The diagonal elements of this matrix represent the production of manufacturedgoods (net of exports) of individual countries and the off-diagonal elements represent the exports ofmanufactured goods from one country (row) to other OECD countries or non-OECD zones (column). Forthe non-OECD countries, the annual data used for the construction of this matrix are derived from theCEPII database, CHELEM (Comptes Harmonisés sur les Echanges et l’Economie Mondiale).
_________________________
3. By calculating nominal and real effective exchange rates from percentage changes rather than indices, theindicators are not base-dependent.
ECO/WKP(98)8
45
9. The main source of data for non-OECD countries’ consumer prices and nominal exchange ratesis the IMF International Financial Statistics database (series 64 and rf). Recent data for 1998 areobtained from Bloomberg. Consumer prices data for the EU aggregate are derived from the OECD MainEconomic Indicators database. The index is a chain-linked Laspeyres index, with weights for each linkbased on the previous year’s private consumption expenditure and purchasing power parities (PPPs). Thefictive nominal exchange rate for EU is based on a weighted average of the dollar exchange rates of theEU member countries, with GDP weights adjusted for PPPs.
10. Unit labour costs in the manufacturing sector for Chinese Taipei, Singapore and Hong Kong,China are primarily obtained from national sources. The United Nations Industrial DevelopmentOrganisation (UNIDO) Industrial Statistics Database is the main source of data on manufacturing unitlabour costs for the other non-OECD countries4. This database provides time series on value added, wagesand salaries, and employment in the manufacturing sector. Manufacturing value added deflators areobtained from the World Bank Development Indicators database.
11. For some countries, unit labour cost data were not available for some years -- i.e. Argentina1991-96, Brazil and China 1987-96, and India 1994-96. In such cases, the series were extended using thegrowth rate of unit labour costs in the manufacturing sector obtained from the International Labour Office(ILO) Labour Statistics. This source of data provides measures of employment, wages and labour costs inthe manufacturing sector, but the data suffer from various breaks in the series, so the UNIDO databasewas selected when estimates were available from both sources. For reasons of comparability of data,measures of manufacturing labour costs and employment for Thailand were obtained entirely from theILO (supplemented with data on manufacturing value added at constant prices from the World Bank).
12. The data from UNIDO present several drawbacks. First, wages and salaries in themanufacturing sector include all payments in cash or in kind made to employees5, but excludes employers’contributions on behalf of their employees paid to social security, pension and insurance schemes.However, compared to OECD economies, employers’ contributions represent a smaller share of labourcosts in these countries. Second, the measure of manufacturing value added normally used is based on thecensus definition rather than the national accounting concept. Thus, the costs of some non-industrialservices are included in value added, whereas the receipts for those services are excluded from output.Third, differences in definitions and evaluation of labour costs, value added and employment affect thereliability and comparability of data across countries. However, this problem is mitigated to the extentthat changes over time are less affected by these differences than absolute levels. Indeed, where data wereavailable from both sources, ILO and UNIDO, changes in unit labour costs presented similar trends.
_________________________
4. This database has also been used to extend the range of countries covered by the IMF’s real effectiveexchange rate indices based on manufacturing unit labour costs, though the procedure and type of weightingare different from those used by the OECD. See Turner and Golup (1997) for a description of the IMF’ssystem of competitiveness indicators for advanced, developing and transition countries.
5. Payments include: a) direct wages and salaries; b) remuneration for time not worked; c) bonuses andgratuities; d) housing allowances and family allowances paid directly by the employer; and e) payments inkind.
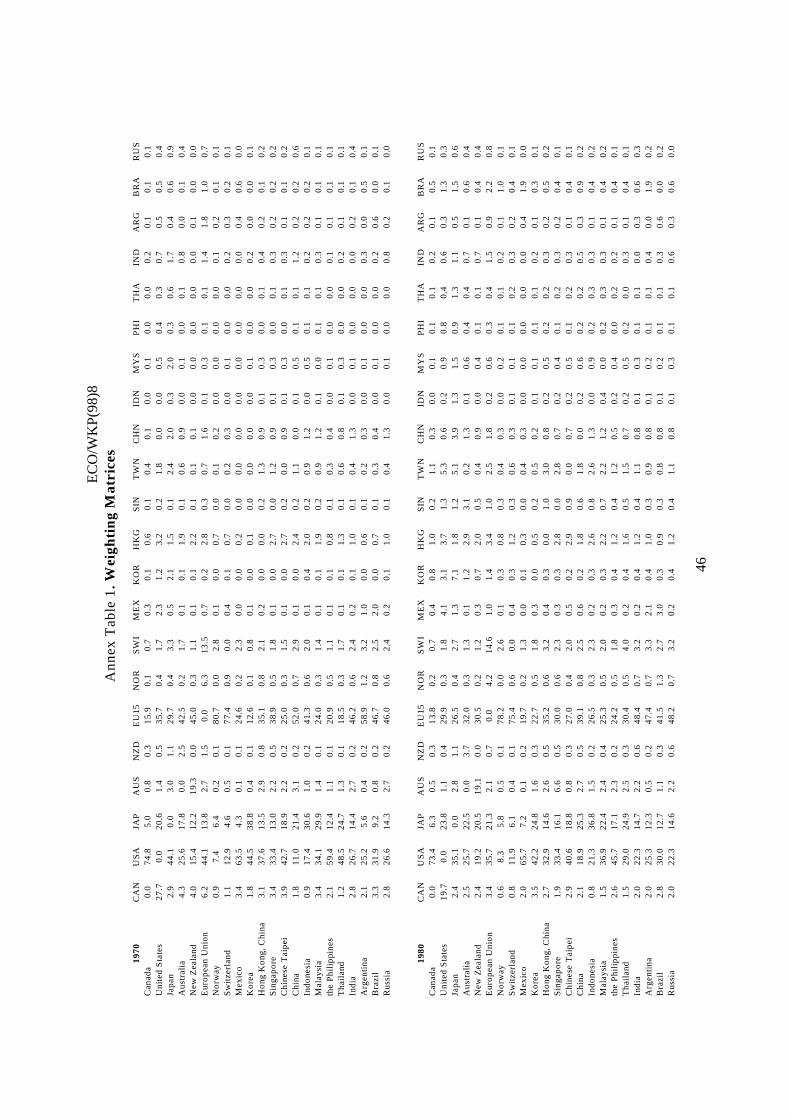
EC
O/W
KP(
98)8
46
Ann
ex T
able
1. W
eigh
tin
g M
atri
ces
1970
CA
NU
SA
JAP
AU
SN
ZD
EU
15N
OR
SW
IM
EX
KO
RH
KG
SIN
TW
NC
HN
IDN
MY
SP
HI
TH
AIN
DA
RG
BR
AR
US
Can
ada
0.0
74.8
5.0
0.8
0.3
15.9
0.1
0.7
0.3
0.1
0.6
0.1
0.4
0.1
0.0
0.1
0.0
0.0
0.2
0.1
0.1
0.1
Uni
ted
Sta
tes
27.7
0.0
20.6
1.4
0.5
35.7
0.4
1.7
2.3
1.2
3.2
0.2
1.8
0.0
0.0
0.5
0.4
0.3
0.7
0.5
0.5
0.4
Japa
n2.
944
.10.
03.
01.
129
.70.
43.
30.
52.
11.
50.
12.
42.
00.
32.
00.
30.
61.
70.
40.
60.
9A
ustr
alia
4.3
25.6
17.8
0.0
2.5
42.5
0.2
1.7
0.1
0.1
1.9
0.1
0.6
0.9
0.0
0.1
0.0
0.1
0.8
0.0
0.1
0.4
New
Zea
land
4.0
15.4
12.2
19.3
0.0
45.0
0.3
1.1
0.1
0.1
2.2
0.1
0.1
0.1
0.0
0.0
0.0
0.0
0.0
0.1
0.0
0.0
Eur
opea
n U
nion
6.2
44.1
13.8
2.7
1.5
0.0
6.3
13.5
0.7
0.2
2.8
0.3
0.7
1.6
0.1
0.3
0.1
0.1
1.4
1.8
1.0
0.7
Nor
way
0.9
7.4
6.4
0.2
0.1
80.7
0.0
2.8
0.1
0.0
0.7
0.0
0.1
0.2
0.0
0.0
0.0
0.0
0.1
0.2
0.1
0.1
Sw
itze
rlan
d1.
112
.94.
60.
50.
177
.40.
90.
00.
40.
10.
70.
00.
20.
30.
00.
10.
00.
00.
20.
30.
20.
1M
exic
o3.
463
.54.
30.
10.
124
.60.
22.
30.
00.
00.
20.
00.
00.
00.
00.
00.
00.
00.
00.
40.
60.
0K
orea
1.8
44.5
38.8
0.4
0.1
12.6
0.1
0.8
0.1
0.0
0.1
0.0
0.0
0.0
0.0
0.1
0.0
0.0
0.2
0.0
0.0
0.1
Hon
g K
ong,
Chi
na3.
137
.613
.52.
90.
835
.10.
82.
10.
20.
00.
00.
21.
30.
90.
10.
30.
00.
10.
40.
20.
10.
2S
inga
pore
3.4
33.4
13.0
2.2
0.5
38.9
0.5
1.8
0.1
0.0
2.7
0.0
1.2
0.9
0.1
0.3
0.0
0.1
0.3
0.2
0.2
0.2
Chi
nese
Tai
pei
3.9
42.7
18.9
2.2
0.2
25.0
0.3
1.5
0.1
0.0
2.7
0.2
0.0
0.9
0.1
0.3
0.0
0.1
0.3
0.1
0.1
0.2
Chi
na1.
811
.021
.43.
10.
252
.00.
72.
90.
10.
02.
40.
21.
10.
00.
10.
50.
10.
11.
20.
20.
20.
6In
done
sia
0.9
17.4
30.6
1.0
0.2
41.3
0.6
2.0
0.1
0.4
2.0
0.2
0.9
1.2
0.0
0.5
0.1
0.1
0.2
0.2
0.2
0.1
Mal
aysi
a3.
434
.129
.91.
40.
124
.00.
31.
40.
10.
11.
90.
20.
91.
20.
10.
00.
10.
10.
30.
10.
10.
1th
e P
hili
ppin
es2.
159
.412
.41.
10.
120
.90.
51.
10.
10.
10.
80.
10.
30.
40.
00.
10.
00.
00.
10.
10.
10.
1T
hail
and
1.2
48.5
24.7
1.3
0.1
18.5
0.3
1.7
0.1
0.1
1.3
0.1
0.6
0.8
0.1
0.3
0.0
0.0
0.2
0.1
0.1
0.1
Indi
a2.
826
.714
.42.
70.
246
.20.
62.
40.
20.
11.
00.
10.
41.
30.
00.
10.
00.
00.
00.
20.
10.
4A
rgen
tina
2.1
25.2
5.6
0.4
0.2
58.9
1.2
3.2
1.0
0.0
0.6
0.1
0.2
0.3
0.0
0.1
0.0
0.0
0.3
0.0
0.5
0.1
Bra
zil
3.3
31.9
9.2
0.8
0.2
46.7
0.8
2.5
2.0
0.0
0.7
0.1
0.3
0.4
0.0
0.1
0.0
0.0
0.2
0.6
0.0
0.1
Rus
sia
2.8
26.6
14.3
2.7
0.2
46.0
0.6
2.4
0.2
0.1
1.0
0.1
0.4
1.3
0.0
0.1
0.0
0.0
0.8
0.2
0.1
0.0
1980
CA
NU
SA
JAP
AU
SN
ZD
EU
15N
OR
SW
IM
EX
KO
RH
KG
SIN
TW
NC
HN
IDN
MY
SP
HI
TH
AIN
DA
RG
BR
AR
US
Can
ada
0.0
73.4
6.3
0.5
0.3
13.8
0.2
0.7
0.4
0.8
1.0
0.2
1.1
0.3
0.0
0.1
0.1
0.1
0.2
0.1
0.5
0.1
Uni
ted
Sta
tes
19.7
0.0
23.8
1.1
0.4
29.9
0.3
1.8
4.1
3.1
3.7
1.3
5.3
0.6
0.2
0.9
0.8
0.4
0.6
0.3
1.3
0.3
Japa
n2.
435
.10.
02.
81.
126
.50.
42.
71.
37.
11.
81.
25.
13.
91.
31.
50.
91.
31.
10.
51.
50.
6A
ustr
alia
2.5
25.7
22.5
0.0
3.7
32.0
0.3
1.3
0.1
1.2
2.9
3.1
0.2
1.3
0.1
0.6
0.4
0.4
0.7
0.1
0.6
0.4
New
Zea
land
2.4
19.2
20.5
19.1
0.0
30.5
0.2
1.2
0.3
0.7
2.0
0.5
0.4
0.9
0.0
0.4
0.1
0.1
0.7
0.1
0.4
0.4
Eur
opea
n U
nion
3.4
35.7
21.3
2.1
0.7
0.0
4.2
14.6
1.0
1.4
3.4
1.0
2.5
1.8
0.2
0.6
0.3
0.4
1.5
0.9
2.2
0.8
Nor
way
0.6
8.3
5.8
0.5
0.1
78.2
0.0
2.6
0.1
0.3
0.8
0.3
0.4
0.3
0.0
0.2
0.1
0.1
0.2
0.1
1.0
0.1
Sw
itze
rlan
d0.
811
.96.
10.
40.
175
.40.
60.
00.
40.
31.
20.
30.
60.
30.
10.
10.
10.
20.
30.
20.
40.
1M
exic
o2.
065
.77.
20.
10.
219
.70.
21.
30.
00.
10.
30.
00.
40.
30.
00.
00.
00.
00.
00.
41.
90.
0K
orea
3.5
42.2
24.8
1.6
0.3
22.7
0.5
1.8
0.3
0.0
0.5
0.2
0.5
0.2
0.1
0.1
0.1
0.1
0.2
0.1
0.3
0.1
Hon
g K
ong,
Chi
na2.
732
.914
.62.
60.
535
.20.
63.
20.
40.
30.
01.
03.
00.
80.
20.
50.
20.
20.
30.
20.
50.
2S
inga
pore
1.9
33.4
16.1
6.6
0.5
30.0
0.6
2.3
0.3
0.3
2.8
0.0
2.8
0.7
0.2
0.4
0.1
0.2
0.3
0.2
0.4
0.1
Chi
nese
Tai
pei
2.9
40.6
18.8
0.8
0.3
27.0
0.4
2.0
0.5
0.2
2.9
0.9
0.0
0.7
0.2
0.5
0.1
0.2
0.3
0.1
0.4
0.1
Chi
na2.
118
.925
.32.
70.
539
.10.
82.
50.
60.
21.
80.
61.
80.
00.
20.
60.
20.
20.
50.
30.
90.
2In
done
sia
0.8
21.3
36.8
1.5
0.2
26.5
0.3
2.3
0.2
0.3
2.6
0.8
2.6
1.3
0.0
0.9
0.2
0.3
0.3
0.1
0.4
0.2
Mal
aysi
a1.
536
.922
.42.
40.
425
.30.
52.
00.
20.
32.
20.
72.
21.
20.
40.
00.
20.
30.
30.
10.
40.
2th
e P
hili
ppin
es2.
645
.717
.12.
30.
224
.20.
51.
80.
30.
41.
20.
41.
20.
50.
20.
40.
00.
20.
20.
10.
40.
1T
hail
and
1.5
29.0
24.9
2.5
0.3
30.4
0.5
4.0
0.2
0.4
1.6
0.5
1.5
0.7
0.2
0.5
0.2
0.0
0.3
0.1
0.4
0.1
Indi
a2.
022
.314
.72.
20.
648
.40.
73.
20.
20.
41.
20.
41.
10.
80.
10.
30.
10.
10.
00.
30.
60.
3A
rgen
tina
2.0
25.3
12.3
0.5
0.2
47.4
0.7
3.3
2.1
0.4
1.0
0.3
0.9
0.8
0.1
0.2
0.1
0.1
0.4
0.0
1.9
0.2
Bra
zil
2.8
30.0
12.7
1.1
0.3
41.5
1.3
2.7
3.0
0.3
0.9
0.3
0.8
0.8
0.1
0.2
0.1
0.1
0.3
0.6
0.0
0.2
Rus
sia
2.0
22.3
14.6
2.2
0.6
48.2
0.7
3.2
0.2
0.4
1.2
0.4
1.1
0.8
0.1
0.3
0.1
0.1
0.6
0.3
0.6
0.0
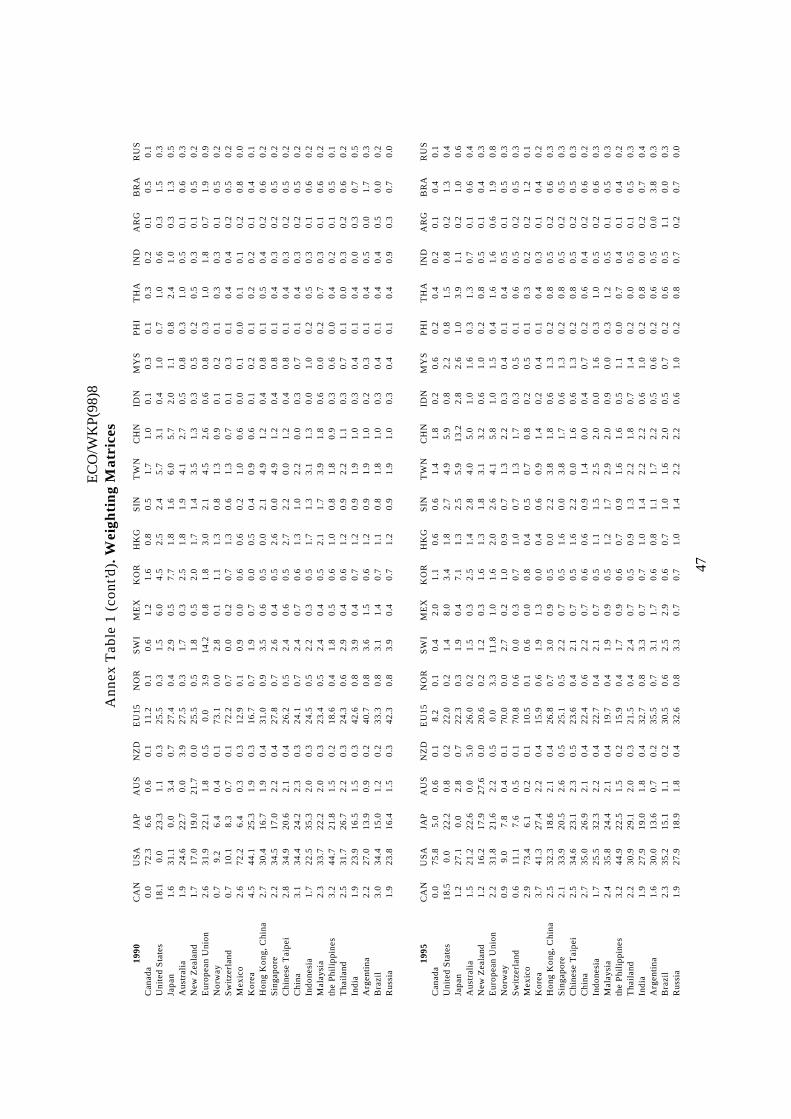
EC
O/W
KP(
98)8
47
Ann
ex T
able
1 (
cont
’d).
Wei
ghti
ng
Mat
rice
s
1990
CA
NU
SA
JAP
AU
SN
ZD
EU
15N
OR
SW
IM
EX
KO
RH
KG
SIN
TW
NC
HN
IDN
MY
SP
HI
TH
AIN
DA
RG
BR
AR
US
Can
ada
0.0
72.3
6.6
0.6
0.1
11.2
0.1
0.6
1.2
1.6
0.8
0.5
1.7
1.0
0.1
0.3
0.1
0.3
0.2
0.1
0.5
0.1
Uni
ted
Sta
tes
18.1
0.0
23.3
1.1
0.3
25.5
0.3
1.5
6.0
4.5
2.5
2.4
5.7
3.1
0.4
1.0
0.7
1.0
0.6
0.3
1.5
0.3
Japa
n1.
631
.10.
03.
40.
727
.40.
42.
90.
57.
71.
81.
66.
05.
72.
01.
10.
82.
41.
00.
31.
30.
5A
ustr
alia
1.9
24.6
22.7
0.0
3.9
27.5
0.3
1.7
0.3
2.5
1.8
1.9
4.1
2.7
0.5
0.8
0.3
1.0
0.5
0.1
0.6
0.3
New
Zea
land
1.7
17.0
19.0
21.7
0.0
25.5
0.5
1.8
0.5
2.0
1.7
1.4
3.5
1.3
0.3
0.5
0.2
0.5
0.3
0.1
0.5
0.2
Eur
opea
n U
nion
2.6
31.9
22.1
1.8
0.5
0.0
3.9
14.2
0.8
1.8
3.0
2.1
4.5
2.6
0.6
0.8
0.3
1.0
1.8
0.7
1.9
0.9
Nor
way
0.7
9.2
6.4
0.4
0.1
73.1
0.0
2.8
0.1
1.1
1.3
0.8
1.3
0.9
0.1
0.2
0.1
0.3
0.3
0.1
0.5
0.2
Sw
itze
rlan
d0.
710
.18.
30.
70.
172
.20.
70.
00.
20.
71.
30.
61.
30.
70.
10.
30.
10.
40.
40.
20.
50.
2M
exic
o2.
672
.26.
40.
30.
312
.90.
10.
90.
00.
60.
60.
21.
00.
60.
00.
10.
00.
10.
10.
20.
80.
0K
orea
4.5
44.1
25.3
1.9
0.3
16.7
0.7
1.9
0.7
0.0
0.5
0.4
0.9
0.6
0.1
0.2
0.1
0.2
0.2
0.1
0.4
0.1
Hon
g K
ong,
Chi
na2.
730
.416
.71.
90.
431
.00.
93.
50.
60.
50.
02.
14.
91.
20.
40.
80.
10.
50.
40.
20.
60.
2S
inga
pore
2.2
34.5
17.0
2.2
0.4
27.8
0.7
2.6
0.4
0.5
2.6
0.0
4.9
1.2
0.4
0.8
0.1
0.4
0.3
0.2
0.5
0.2
Chi
nese
Tai
pei
2.8
34.9
20.6
2.1
0.4
26.2
0.5
2.4
0.6
0.5
2.7
2.2
0.0
1.2
0.4
0.8
0.1
0.4
0.3
0.2
0.5
0.2
Chi
na3.
134
.424
.22.
30.
324
.10.
72.
40.
70.
61.
31.
02.
20.
00.
30.
70.
10.
40.
30.
20.
50.
2In
done
sia
1.7
22.5
35.3
2.0
0.3
24.5
0.5
2.2
0.3
0.5
1.7
1.3
3.1
1.3
0.0
1.0
0.2
0.5
0.3
0.1
0.6
0.2
Mal
aysi
a2.
333
.722
.22.
00.
323
.40.
52.
40.
40.
52.
11.
73.
91.
80.
60.
00.
20.
70.
30.
10.
60.
2th
e P
hili
ppin
es3.
244
.721
.81.
50.
218
.60.
41.
80.
50.
61.
00.
81.
80.
90.
30.
60.
00.
40.
20.
10.
50.
1T
hail
and
2.5
31.7
26.7
2.2
0.3
24.3
0.6
2.9
0.4
0.6
1.2
0.9
2.2
1.1
0.3
0.7
0.1
0.0
0.3
0.2
0.6
0.2
Indi
a1.
923
.916
.51.
50.
342
.60.
83.
90.
40.
71.
20.
91.
91.
00.
30.
40.
10.
40.
00.
30.
70.
5A
rgen
tina
2.2
27.0
13.9
0.9
0.2
40.7
0.8
3.6
1.5
0.6
1.2
0.9
1.9
1.0
0.2
0.3
0.1
0.4
0.5
0.0
1.7
0.3
Bra
zil
3.0
34.4
15.0
1.2
0.2
33.3
0.8
3.1
1.4
0.7
1.1
0.8
1.8
1.0
0.3
0.4
0.1
0.4
0.4
0.5
0.0
0.2
Rus
sia
1.9
23.8
16.4
1.5
0.3
42.3
0.8
3.9
0.4
0.7
1.2
0.9
1.9
1.0
0.3
0.4
0.1
0.4
0.9
0.3
0.7
0.0
1995
CA
NU
SA
JAP
AU
SN
ZD
EU
15N
OR
SW
IM
EX
KO
RH
KG
SIN
TW
NC
HN
IDN
MY
SP
HI
TH
AIN
DA
RG
BR
AR
US
Can
ada
0.0
75.8
5.0
0.6
0.1
8.2
0.1
0.4
2.0
1.1
0.6
0.6
1.4
1.8
0.2
0.6
0.2
0.4
0.2
0.1
0.4
0.1
Uni
ted
Sta
tes
18.5
0.0
22.2
0.8
0.2
22.0
0.2
1.4
8.0
3.4
1.8
2.7
4.9
5.9
0.8
2.2
0.8
1.5
0.8
0.2
1.3
0.4
Japa
n1.
227
.10.
02.
80.
722
.30.
31.
90.
47.
11.
32.
55.
913
.22.
82.
61.
03.
91.
10.
21.
00.
6A
ustr
alia
1.5
21.2
22.6
0.0
5.0
26.0
0.2
1.5
0.3
2.5
1.4
2.8
4.0
5.0
1.0
1.6
0.3
1.3
0.7
0.1
0.6
0.4
New
Zea
land
1.2
16.2
17.9
27.6
0.0
20.6
0.2
1.2
0.3
1.6
1.3
1.8
3.1
3.2
0.6
1.0
0.2
0.8
0.5
0.1
0.4
0.3
Eur
opea
n U
nion
2.2
31.8
21.6
2.2
0.5
0.0
3.3
11.8
1.0
1.6
2.0
2.6
4.1
5.8
1.0
1.5
0.4
1.6
1.6
0.6
1.9
0.8
Nor
way
0.9
9.0
7.8
0.4
0.1
70.0
0.0
2.7
0.2
1.0
0.9
0.7
1.3
2.2
0.3
0.4
0.1
0.4
0.5
0.1
0.5
0.3
Sw
itze
rlan
d0.
611
.17.
60.
50.
170
.80.
60.
00.
30.
71.
00.
71.
31.
70.
30.
50.
10.
60.
50.
20.
50.
3M
exic
o2.
973
.46.
10.
20.
110
.50.
10.
60.
00.
80.
40.
50.
70.
80.
20.
50.
10.
30.
20.
21.
20.
1K
orea
3.7
41.3
27.4
2.2
0.4
15.9
0.6
1.9
1.3
0.0
0.4
0.6
0.9
1.4
0.2
0.4
0.1
0.4
0.3
0.1
0.4
0.2
Hon
g K
ong,
Chi
na2.
532
.318
.62.
10.
426
.80.
73.
00.
90.
50.
02.
23.
81.
80.
61.
30.
20.
80.
50.
20.
60.
3S
inga
pore
2.1
33.9
20.5
2.6
0.5
25.1
0.5
2.2
0.7
0.5
1.6
0.0
3.8
1.7
0.6
1.3
0.2
0.8
0.5
0.2
0.5
0.3
Chi
nese
Tai
pei
2.5
34.6
23.1
2.3
0.5
23.6
0.4
2.1
0.7
0.5
1.6
2.2
0.0
1.6
0.6
1.3
0.2
0.8
0.5
0.2
0.5
0.3
Chi
na2.
735
.026
.92.
10.
422
.40.
62.
20.
70.
60.
60.
91.
40.
00.
40.
70.
20.
60.
40.
20.
60.
2In
done
sia
1.7
25.5
32.3
2.2
0.4
22.7
0.4
2.1
0.7
0.5
1.1
1.5
2.5
2.0
0.0
1.6
0.3
1.0
0.5
0.2
0.6
0.3
Mal
aysi
a2.
435
.824
.42.
10.
419
.70.
41.
90.
90.
51.
21.
72.
92.
00.
90.
00.
31.
20.
50.
10.
50.
3th
e P
hili
ppin
es3.
244
.922
.51.
50.
215
.90.
41.
70.
90.
60.
70.
91.
61.
60.
51.
10.
00.
70.
40.
10.
40.
2T
hail
and
2.2
30.9
29.1
2.0
0.3
21.5
0.4
2.4
0.7
0.5
0.9
1.3
2.2
1.8
0.7
1.4
0.2
0.0
0.5
0.1
0.5
0.3
Indi
a1.
927
.919
.01.
80.
432
.70.
83.
30.
70.
71.
01.
42.
22.
20.
61.
00.
20.
80.
00.
20.
70.
4A
rgen
tina
1.6
30.0
13.6
0.7
0.2
35.5
0.7
3.1
1.7
0.6
0.8
1.1
1.7
2.2
0.5
0.6
0.2
0.6
0.5
0.0
3.8
0.3
Bra
zil
2.3
35.2
15.1
1.1
0.2
30.5
0.6
2.5
2.9
0.6
0.7
1.0
1.6
2.0
0.5
0.7
0.2
0.6
0.5
1.1
0.0
0.3
Rus
sia
1.9
27.9
18.9
1.8
0.4
32.6
0.8
3.3
0.7
0.7
1.0
1.4
2.2
2.2
0.6
1.0
0.2
0.8
0.7
0.2
0.7
0.0
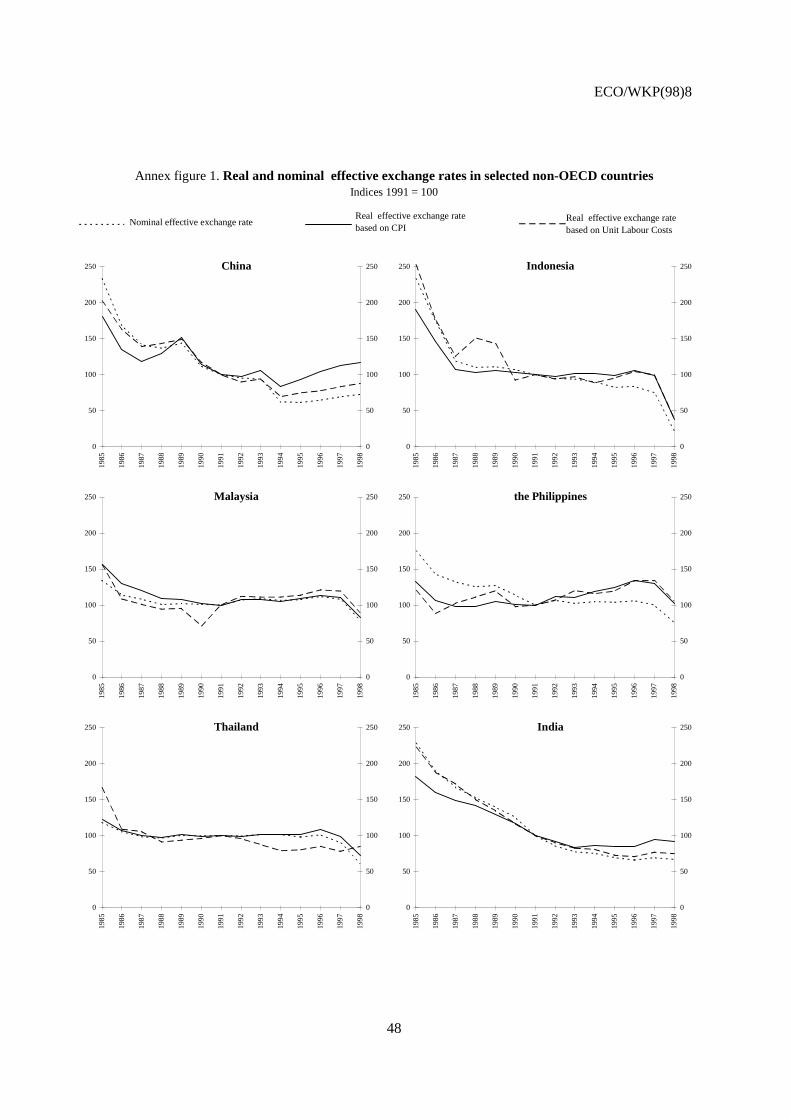
ECO/WKP(98)8
48
Annex figure 1. Real and nominal effective exchange rates in selected non-OECD countriesIndices 1991 = 100
China
0
50
100
150
200
250
1985
1986
1987
1988
1989
1990
1991
1992
1993
1994
1995
1996
1997
1998
0
50
100
150
200
250 Indonesia
0
50
100
150
200
250
1985
1986
1987
1988
1989
1990
1991
1992
1993
1994
1995
1996
1997
1998
0
50
100
150
200
250
Malaysia
0
50
100
150
200
250
1985
1986
1987
1988
1989
1990
1991
1992
1993
1994
1995
1996
1997
1998
0
50
100
150
200
250 the Philippines
0
50
100
150
200
250
1985
1986
1987
1988
1989
1990
1991
1992
1993
1994
1995
1996
1997
1998
0
50
100
150
200
250
Thailand
0
50
100
150
200
250
1985
1986
1987
1988
1989
1990
1991
1992
1993
1994
1995
1996
1997
1998
0
50
100
150
200
250 India
0
50
100
150
200
250
1985
1986
1987
1988
1989
1990
1991
1992
1993
1994
1995
1996
1997
1998
0
50
100
150
200
250
Nominal effective exchange rateReal effective exchange ratebased on CPI
Real effective exchange ratebased on Unit Labour Costs
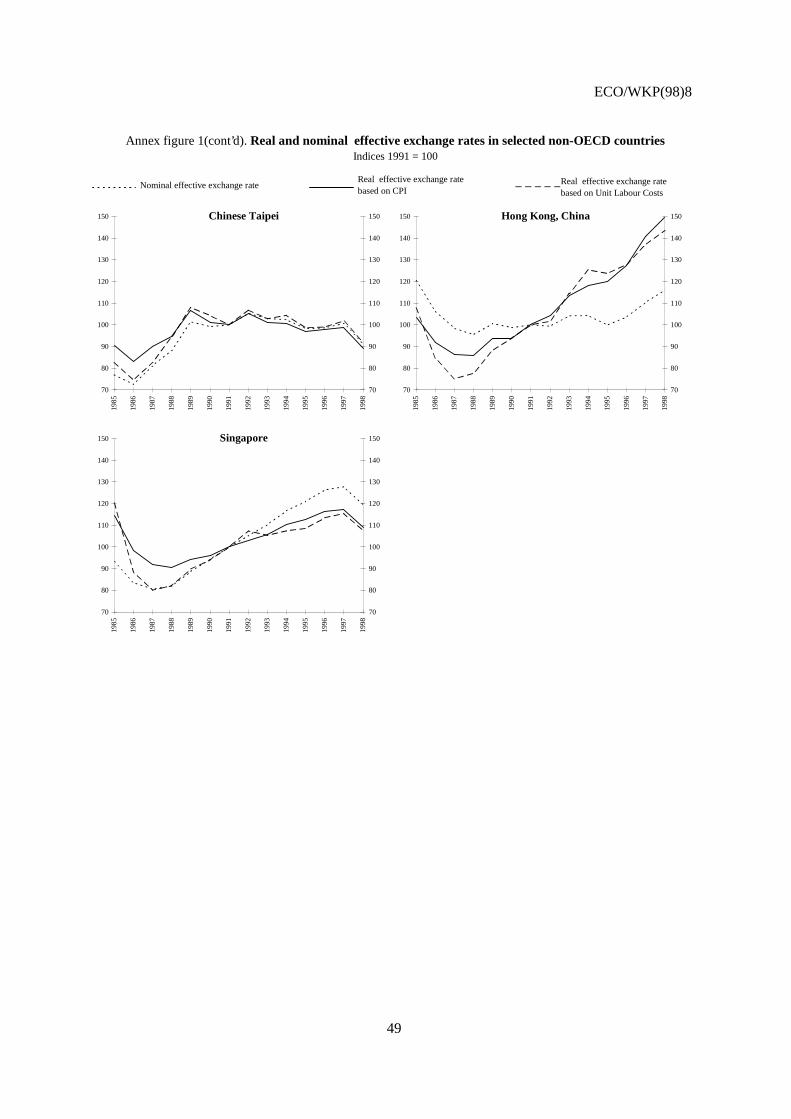
ECO/WKP(98)8
49
Annex figure 1(cont’d). Real and nominal effective exchange rates in selected non-OECD countriesIndices 1991 = 100
Chinese Taipei
70
80
90
100
110
120
130
140
150
1985
1986
1987
1988
1989
1990
1991
1992
1993
1994
1995
1996
1997
1998
70
80
90
100
110
120
130
140
150 Hong Kong, China
70
80
90
100
110
120
130
140
150
1985
1986
1987
1988
1989
1990
1991
1992
1993
1994
1995
1996
1997
1998
70
80
90
100
110
120
130
140
150
Singapore
70
80
90
100
110
120
130
140
150
1985
1986
1987
1988
1989
1990
1991
1992
1993
1994
1995
1996
1997
1998
70
80
90
100
110
120
130
140
150
Nominal effective exchange rateReal effective exchange ratebased on CPI
Real effective exchange ratebased on Unit Labour Costs
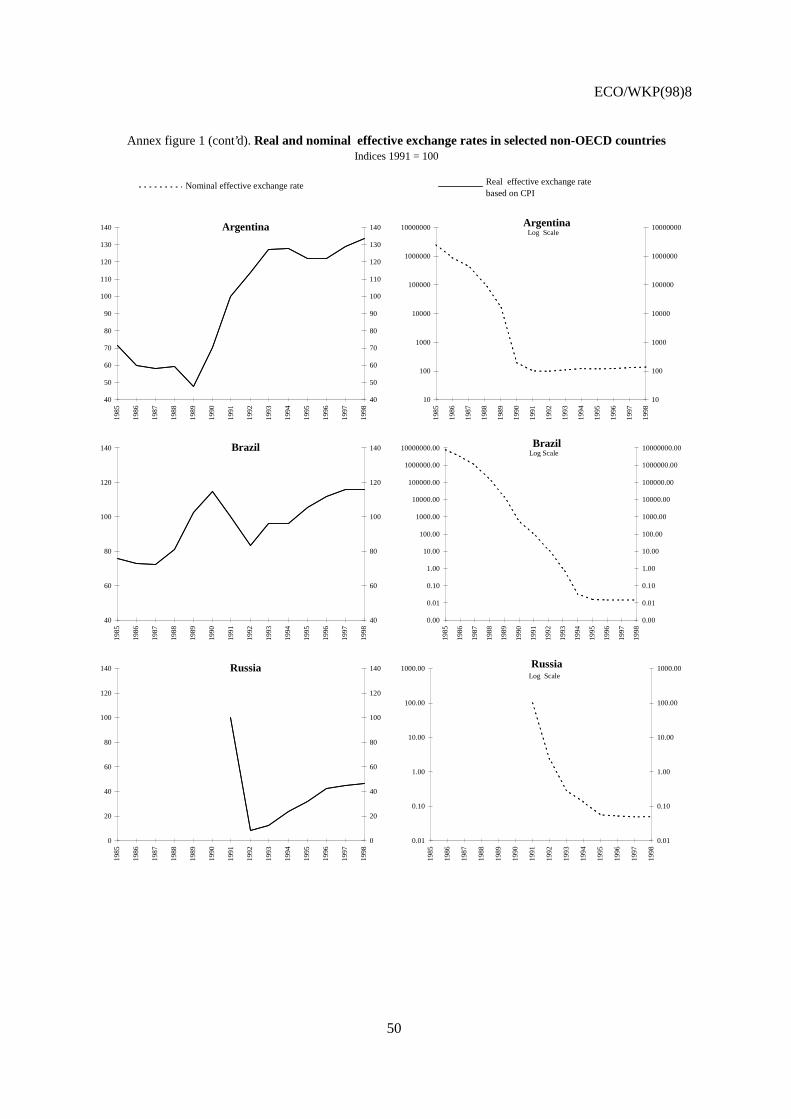
ECO/WKP(98)8
50
Annex figure 1 (cont’d). Real and nominal effective exchange rates in selected non-OECD countriesIndices 1991 = 100
Argentina
40
50
60
70
80
90
100
110
120
130
140
1985
1986
1987
1988
1989
1990
1991
1992
1993
1994
1995
1996
1997
1998
40
50
60
70
80
90
100
110
120
130
140 Argentina
10
100
1000
10000
100000
1000000
10000000
1985
1986
1987
1988
1989
1990
1991
1992
1993
1994
1995
1996
1997
1998
10
100
1000
10000
100000
1000000
10000000Log Scale
Brazil
40
60
80
100
120
140
1985
1986
1987
1988
1989
1990
1991
1992
1993
1994
1995
1996
1997
1998
40
60
80
100
120
140 Brazil
0.00
0.01
0.10
1.00
10.00
100.00
1000.00
10000.00
100000.00
1000000.00
10000000.0019
85
1986
1987
1988
1989
1990
1991
1992
1993
1994
1995
1996
1997
1998
0.00
0.01
0.10
1.00
10.00
100.00
1000.00
10000.00
100000.00
1000000.00
10000000.00Log Scale
Russia
0
20
40
60
80
100
120
140
1985
1986
1987
1988
1989
1990
1991
1992
1993
1994
1995
1996
1997
1998
0
20
40
60
80
100
120
140 Russia
0.01
0.10
1.00
10.00
100.00
1000.00
1985
1986
1987
1988
1989
1990
1991
1992
1993
1994
1995
1996
1997
1998
0.01
0.10
1.00
10.00
100.00
1000.00Log Scale
Nominal effective exchange rate Real effective exchange ratebased on CPI
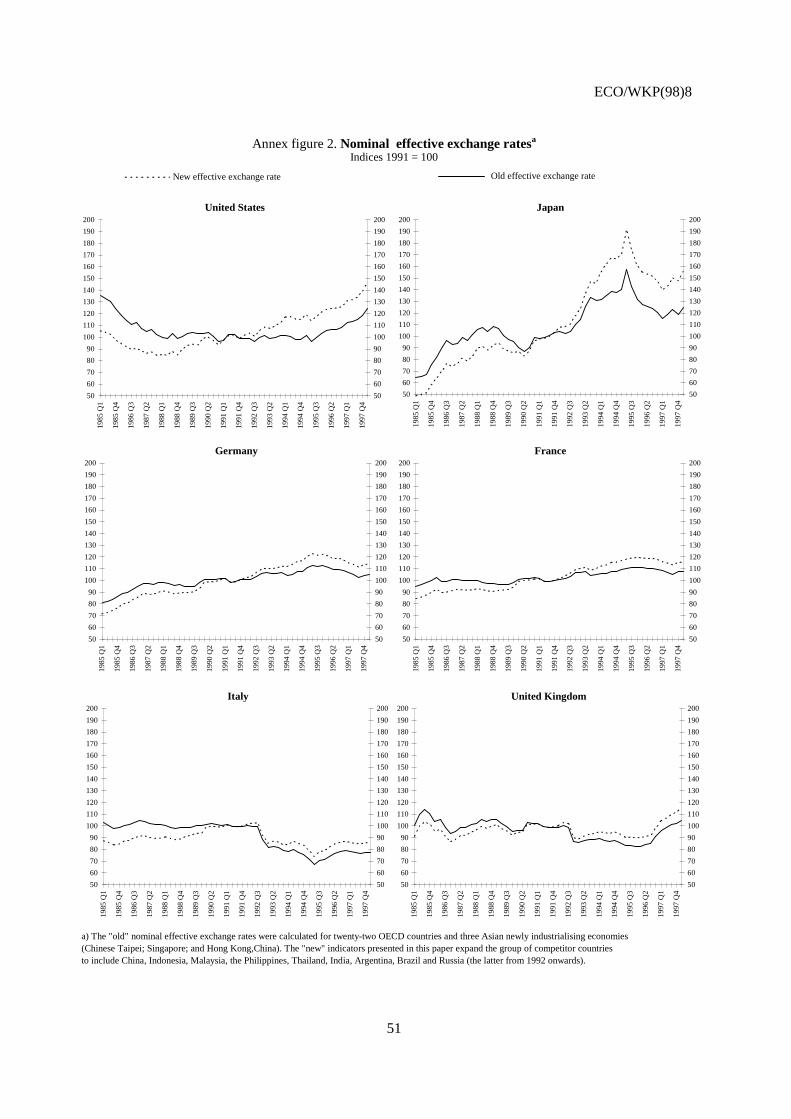
ECO/WKP(98)8
51
Annex figure 2. Nominal effective exchange ratesa
Indices 1991 = 100
a) The "old" nominal effective exchange rates were calculated for twenty-two OECD countries and three Asian newly industrialising economies(Chinese Taipei; Singapore; and Hong Kong,China). The "new" indicators presented in this paper expand the group of competitor countriesto include China, Indonesia, Malaysia, the Philippines, Thailand, India, Argentina, Brazil and Russia (the latter from 1992 onwards).
United States
50
60
70
80
90
100
110
120
130
140
150
160
170
180
190
200
1985
Q1
1985
Q4
1986
Q3
1987
Q2
1988
Q1
1988
Q4
1989
Q3
1990
Q2
1991
Q1
1991
Q4
1992
Q3
1993
Q2
1994
Q1
1994
Q4
1995
Q3
1996
Q2
1997
Q1
1997
Q4
50
60
70
80
90
100
110
120
130
140
150
160
170
180
190
200
Japan
50
60
70
80
90
100
110
120
130
140
150
160
170
180
190
200
1985
Q1
1985
Q4
1986
Q3
1987
Q2
1988
Q1
1988
Q4
1989
Q3
1990
Q2
1991
Q1
1991
Q4
1992
Q3
1993
Q2
1994
Q1
1994
Q4
1995
Q3
1996
Q2
1997
Q1
1997
Q4
50
60
70
80
90
100
110
120
130
140
150
160
170
180
190
200
Germany
50
60
70
80
90
100
110
120
130
140
150
160
170
180
190
200
1985
Q1
1985
Q4
1986
Q3
1987
Q2
1988
Q1
1988
Q4
1989
Q3
1990
Q2
1991
Q1
1991
Q4
1992
Q3
1993
Q2
1994
Q1
1994
Q4
1995
Q3
1996
Q2
1997
Q1
1997
Q4
50
60
70
80
90
100
110
120
130
140
150
160
170
180
190
200
France
50
60
70
80
90
100
110
120
130
140
150
160
170
180
190
200
1985
Q1
1985
Q4
1986
Q3
1987
Q2
1988
Q1
1988
Q4
1989
Q3
1990
Q2
1991
Q1
1991
Q4
1992
Q3
1993
Q2
1994
Q1
1994
Q4
1995
Q3
1996
Q2
1997
Q1
1997
Q4
50
60
70
80
90
100
110
120
130
140
150
160
170
180
190
200
Italy
50
60
70
80
90
100
110
120
130
140
150
160
170
180
190
200
1985
Q1
1985
Q4
1986
Q3
1987
Q2
1988
Q1
1988
Q4
1989
Q3
1990
Q2
1991
Q1
1991
Q4
1992
Q3
1993
Q2
1994
Q1
1994
Q4
1995
Q3
1996
Q2
1997
Q1
1997
Q4
50
60
70
80
90
100
110
120
130
140
150
160
170
180
190
200
United Kingdom
50
60
70
80
90
100
110
120
130
140
150
160
170
180
190
200
1985
Q1
1985
Q4
1986
Q3
1987
Q2
1988
Q1
1988
Q4
1989
Q3
1990
Q2
1991
Q1
1991
Q4
1992
Q3
1993
Q2
1994
Q1
1994
Q4
1995
Q3
1996
Q2
1997
Q1
1997
Q4
50
60
70
80
90
100
110
120
130
140
150
160
170
180
190
200
New effective exchange rate Old effective exchange rate
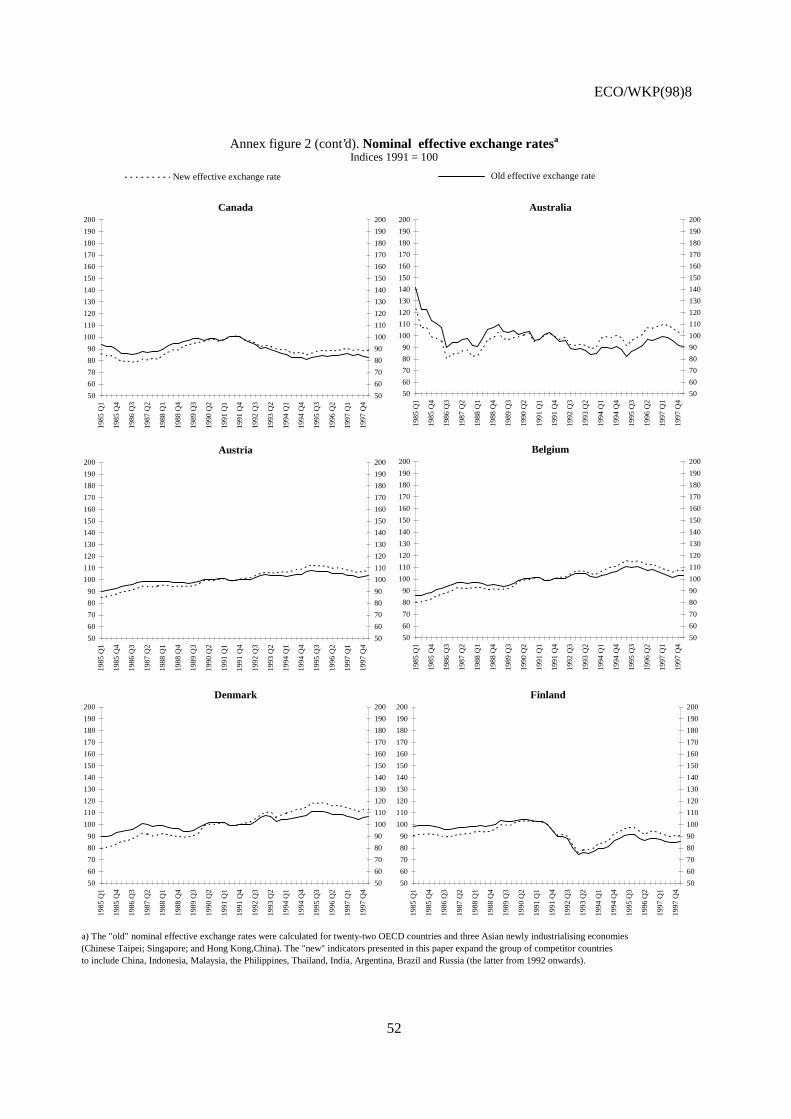
ECO/WKP(98)8
52
Annex figure 2 (cont’d). Nominal effective exchange ratesa
Indices 1991 = 100
a) The "old" nominal effective exchange rates were calculated for twenty-two OECD countries and three Asian newly industrialising economies(Chinese Taipei; Singapore; and Hong Kong,China). The "new" indicators presented in this paper expand the group of competitor countriesto include China, Indonesia, Malaysia, the Philippines, Thailand, India, Argentina, Brazil and Russia (the latter from 1992 onwards).
Canada
50
60
70
80
90
100
110
120
130
140
150
160
170
180
190
200
1985
Q1
1985
Q4
1986
Q3
1987
Q2
1988
Q1
1988
Q4
1989
Q3
1990
Q2
1991
Q1
1991
Q4
1992
Q3
1993
Q2
1994
Q1
1994
Q4
1995
Q3
1996
Q2
1997
Q1
1997
Q4
50
60
70
80
90
100
110
120
130
140
150
160
170
180
190
200
Australia
50
60
70
80
90
100
110
120
130
140
150
160
170
180
190
200
1985
Q1
1985
Q4
1986
Q3
1987
Q2
1988
Q1
1988
Q4
1989
Q3
1990
Q2
1991
Q1
1991
Q4
1992
Q3
1993
Q2
1994
Q1
1994
Q4
1995
Q3
1996
Q2
1997
Q1
1997
Q4
50
60
70
80
90
100
110
120
130
140
150
160
170
180
190
200
Austria
50
60
70
80
90
100
110
120
130
140
150
160
170
180
190
200
1985
Q1
1985
Q4
1986
Q3
1987
Q2
1988
Q1
1988
Q4
1989
Q3
1990
Q2
1991
Q1
1991
Q4
1992
Q3
1993
Q2
1994
Q1
1994
Q4
1995
Q3
1996
Q2
1997
Q1
1997
Q4
50
60
70
80
90
100
110
120
130
140
150
160
170
180
190
200
Belgium
50
60
70
80
90
100
110
120
130
140
150
160
170
180
190
200
1985
Q1
1985
Q4
1986
Q3
1987
Q2
1988
Q1
1988
Q4
1989
Q3
1990
Q2
1991
Q1
1991
Q4
1992
Q3
1993
Q2
1994
Q1
1994
Q4
1995
Q3
1996
Q2
1997
Q1
1997
Q4
50
60
70
80
90
100
110
120
130
140
150
160
170
180
190
200
Denmark
50
60
70
80
90
100
110
120
130
140
150
160
170
180
190
200
1985
Q1
1985
Q4
1986
Q3
1987
Q2
1988
Q1
1988
Q4
1989
Q3
1990
Q2
1991
Q1
1991
Q4
1992
Q3
1993
Q2
1994
Q1
1994
Q4
1995
Q3
1996
Q2
1997
Q1
1997
Q4
50
60
70
80
90
100
110
120
130
140
150
160
170
180
190
200
Finland
50
60
70
80
90
100
110
120
130
140
150
160
170
180
190
200
1985
Q1
1985
Q4
1986
Q3
1987
Q2
1988
Q1
1988
Q4
1989
Q3
1990
Q2
1991
Q1
1991
Q4
1992
Q3
1993
Q2
1994
Q1
1994
Q4
1995
Q3
1996
Q2
1997
Q1
1997
Q4
50
60
70
80
90
100
110
120
130
140
150
160
170
180
190
200
New effective exchange rate Old effective exchange rate
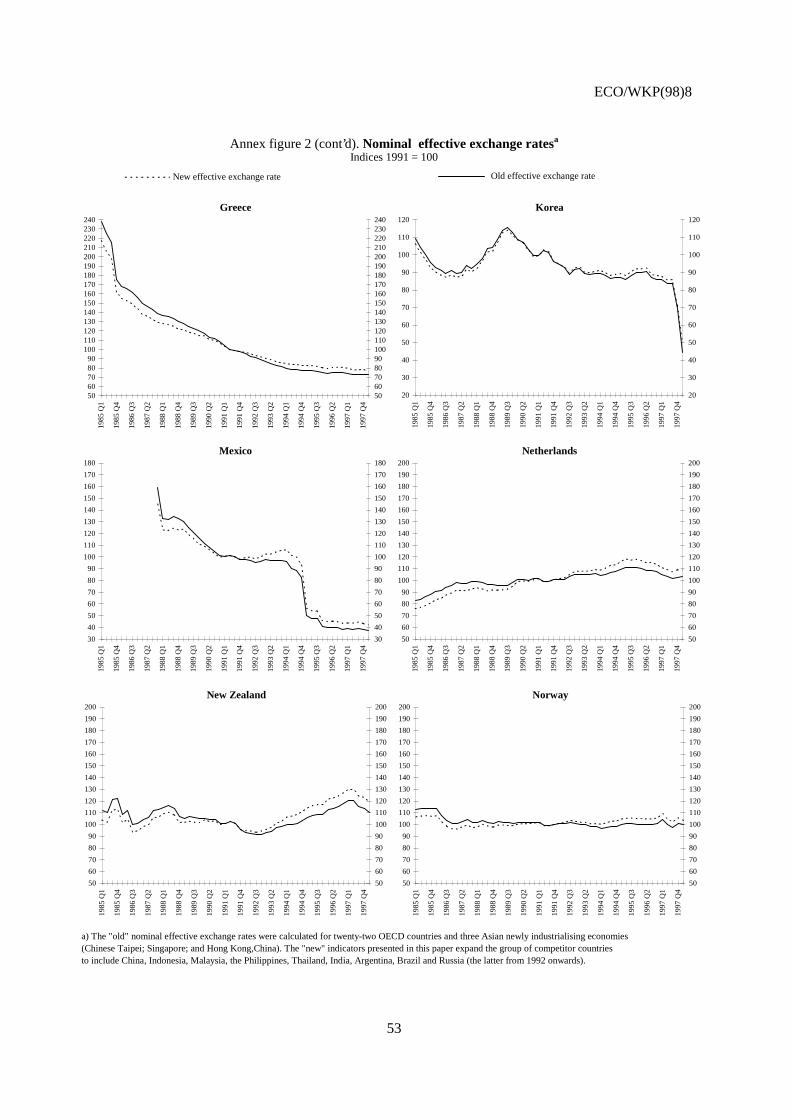
ECO/WKP(98)8
53
Annex figure 2 (cont’d). Nominal effective exchange ratesa
Indices 1991 = 100
a) The "old" nominal effective exchange rates were calculated for twenty-two OECD countries and three Asian newly industrialising economies(Chinese Taipei; Singapore; and Hong Kong,China). The "new" indicators presented in this paper expand the group of competitor countriesto include China, Indonesia, Malaysia, the Philippines, Thailand, India, Argentina, Brazil and Russia (the latter from 1992 onwards).
Greece
5060708090
100110120130140150160170180190200210220230240
1985
Q1
1985
Q4
1986
Q3
1987
Q2
1988
Q1
1988
Q4
1989
Q3
1990
Q2
1991
Q1
1991
Q4
1992
Q3
1993
Q2
1994
Q1
1994
Q4
1995
Q3
1996
Q2
1997
Q1
1997
Q4
5060708090100110120130140150160170180190200210220230240
Korea
20
30
40
50
60
70
80
90
100
110
120
1985
Q1
1985
Q4
1986
Q3
1987
Q2
1988
Q1
1988
Q4
1989
Q3
1990
Q2
1991
Q1
1991
Q4
1992
Q3
1993
Q2
1994
Q1
1994
Q4
1995
Q3
1996
Q2
1997
Q1
1997
Q4
20
30
40
50
60
70
80
90
100
110
120
Mexico
30
40
50
60
70
80
90
100
110
120
130
140
150
160
170
180
1985
Q1
1985
Q4
1986
Q3
1987
Q2
1988
Q1
1988
Q4
1989
Q3
1990
Q2
1991
Q1
1991
Q4
1992
Q3
1993
Q2
1994
Q1
1994
Q4
1995
Q3
1996
Q2
1997
Q1
1997
Q4
30
40
50
60
70
80
90
100
110
120
130
140
150
160
170
180
Netherlands
50
60
70
80
90
100
110
120
130
140
150
160
170
180
190
200
1985
Q1
1985
Q4
1986
Q3
1987
Q2
1988
Q1
1988
Q4
1989
Q3
1990
Q2
1991
Q1
1991
Q4
1992
Q3
1993
Q2
1994
Q1
1994
Q4
1995
Q3
1996
Q2
1997
Q1
1997
Q4
50
60
70
80
90
100
110
120
130
140
150
160
170
180
190
200
New Zealand
50
60
70
80
90
100
110
120
130
140
150
160
170
180
190
200
1985
Q1
1985
Q4
1986
Q3
1987
Q2
1988
Q1
1988
Q4
1989
Q3
1990
Q2
1991
Q1
1991
Q4
1992
Q3
1993
Q2
1994
Q1
1994
Q4
1995
Q3
1996
Q2
1997
Q1
1997
Q4
50
60
70
80
90
100
110
120
130
140
150
160
170
180
190
200
Norway
50
60
70
80
90
100
110
120
130
140
150
160
170
180
190
200
1985
Q1
1985
Q4
1986
Q3
1987
Q2
1988
Q1
1988
Q4
1989
Q3
1990
Q2
1991
Q1
1991
Q4
1992
Q3
1993
Q2
1994
Q1
1994
Q4
1995
Q3
1996
Q2
1997
Q1
1997
Q4
50
60
70
80
90
100
110
120
130
140
150
160
170
180
190
200
New effective exchange rate Old effective exchange rate
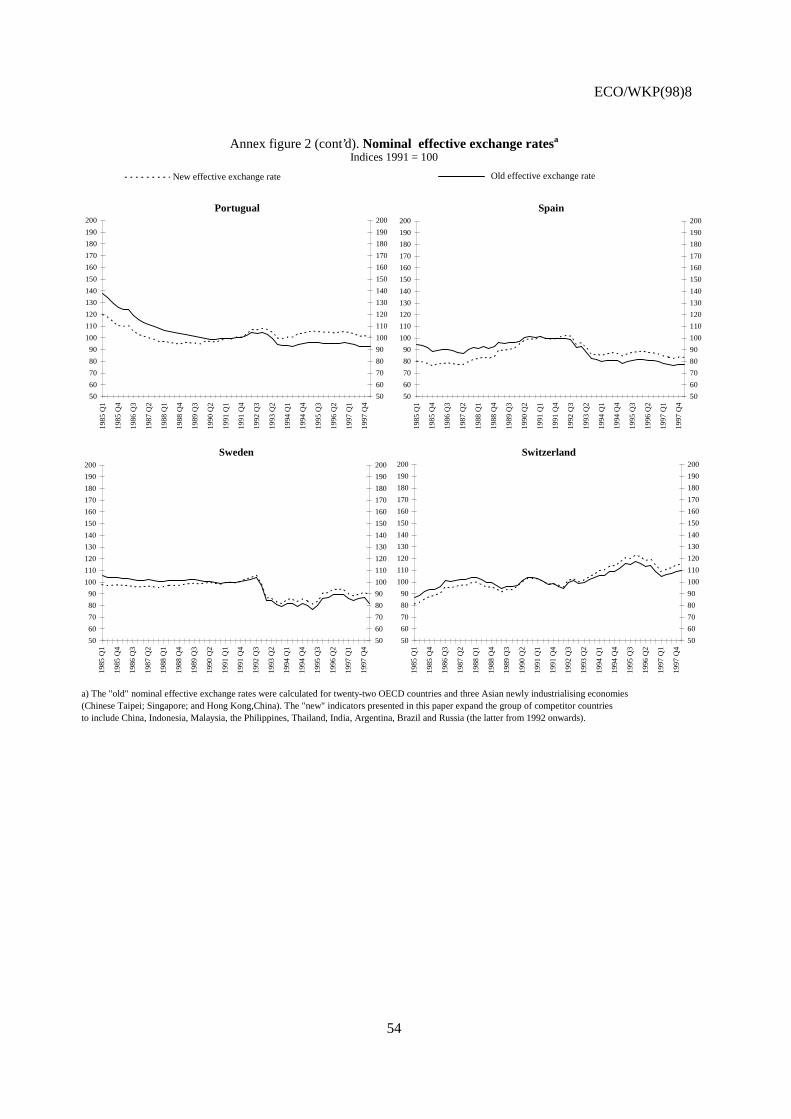
ECO/WKP(98)8
54
Annex figure 2 (cont’d). Nominal effective exchange ratesa
Indices 1991 = 100
a) The "old" nominal effective exchange rates were calculated for twenty-two OECD countries and three Asian newly industrialising economies(Chinese Taipei; Singapore; and Hong Kong,China). The "new" indicators presented in this paper expand the group of competitor countriesto include China, Indonesia, Malaysia, the Philippines, Thailand, India, Argentina, Brazil and Russia (the latter from 1992 onwards).
Portugual
50
60
70
80
90
100
110
120
130
140
150
160
170
180
190
200
1985
Q1
1985
Q4
1986
Q3
1987
Q2
1988
Q1
1988
Q4
1989
Q3
1990
Q2
1991
Q1
1991
Q4
1992
Q3
1993
Q2
1994
Q1
1994
Q4
1995
Q3
1996
Q2
1997
Q1
1997
Q4
50
60
70
80
90
100
110
120
130
140
150
160
170
180
190
200
Spain
50
60
70
80
90
100
110
120
130
140
150
160
170
180
190
200
1985
Q1
1985
Q4
1986
Q3
1987
Q2
1988
Q1
1988
Q4
1989
Q3
1990
Q2
1991
Q1
1991
Q4
1992
Q3
1993
Q2
1994
Q1
1994
Q4
1995
Q3
1996
Q2
1997
Q1
1997
Q4
50
60
70
80
90
100
110
120
130
140
150
160
170
180
190
200
Sweden
50
60
70
80
90
100
110
120
130
140
150
160
170
180
190
200
1985
Q1
1985
Q4
1986
Q3
1987
Q2
1988
Q1
1988
Q4
1989
Q3
1990
Q2
1991
Q1
1991
Q4
1992
Q3
1993
Q2
1994
Q1
1994
Q4
1995
Q3
1996
Q2
1997
Q1
1997
Q4
50
60
70
80
90
100
110
120
130
140
150
160
170
180
190
200
Switzerland
50
60
70
80
90
100
110
120
130
140
150
160
170
180
190
200
1985
Q1
1985
Q4
1986
Q3
1987
Q2
1988
Q1
1988
Q4
1989
Q3
1990
Q2
1991
Q1
1991
Q4
1992
Q3
1993
Q2
1994
Q1
1994
Q4
1995
Q3
1996
Q2
1997
Q1
1997
Q4
50
60
70
80
90
100
110
120
130
140
150
160
170
180
190
200
New effective exchange rate Old effective exchange rate
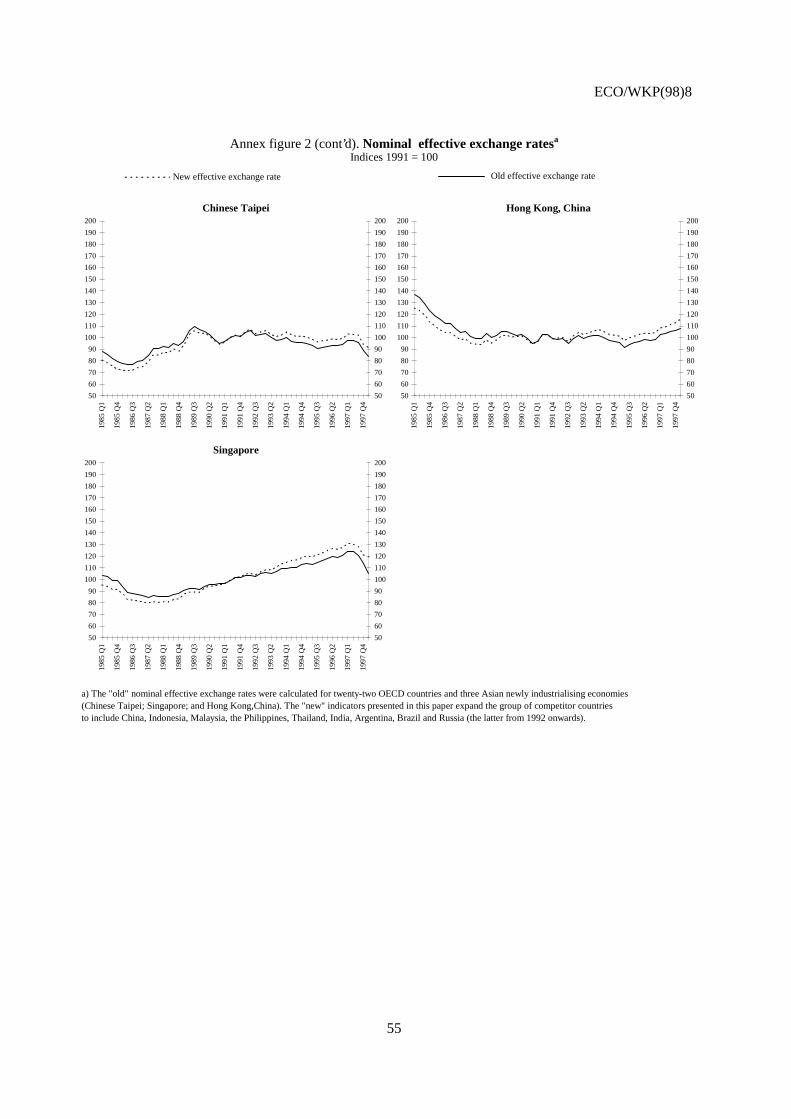
ECO/WKP(98)8
55
Annex figure 2 (cont’d). Nominal effective exchange ratesa
Indices 1991 = 100
a) The "old" nominal effective exchange rates were calculated for twenty-two OECD countries and three Asian newly industrialising economies(Chinese Taipei; Singapore; and Hong Kong,China). The "new" indicators presented in this paper expand the group of competitor countriesto include China, Indonesia, Malaysia, the Philippines, Thailand, India, Argentina, Brazil and Russia (the latter from 1992 onwards).
Chinese Taipei
50
60
70
80
90
100
110
120
130
140
150
160
170
180
190
200
1985
Q1
1985
Q4
1986
Q3
1987
Q2
1988
Q1
1988
Q4
1989
Q3
1990
Q2
1991
Q1
1991
Q4
1992
Q3
1993
Q2
1994
Q1
1994
Q4
1995
Q3
1996
Q2
1997
Q1
1997
Q4
50
60
70
80
90
100
110
120
130
140
150
160
170
180
190
200
Hong Kong, China
50
60
70
80
90
100
110
120
130
140
150
160
170
180
190
200
1985
Q1
1985
Q4
1986
Q3
1987
Q2
1988
Q1
1988
Q4
1989
Q3
1990
Q2
1991
Q1
1991
Q4
1992
Q3
1993
Q2
1994
Q1
1994
Q4
1995
Q3
1996
Q2
1997
Q1
1997
Q4
50
60
70
80
90
100
110
120
130
140
150
160
170
180
190
200
Singapore
50
60
70
80
90
100
110
120
130
140
150
160
170
180
190
200
1985
Q1
1985
Q4
1986
Q3
1987
Q2
1988
Q1
1988
Q4
1989
Q3
1990
Q2
1991
Q1
1991
Q4
1992
Q3
1993
Q2
1994
Q1
1994
Q4
1995
Q3
1996
Q2
1997
Q1
1997
Q4
50
60
70
80
90
100
110
120
130
140
150
160
170
180
190
200
New effective exchange rate Old effective exchange rate
ECO/WKP(98)8
56
ECONOMICS DEPARTMENTWORKING PAPERS
194. The European Union’s Trade Policies and their Economic Effects(April 1998) Peter Hoeller, Nathalie Girouard and Alessandra Colecchia
193. The Macroeconomic Implications of Ageing in a Global Context(March 1998) Dave Turner, Claude Giorno, Alain De Serres, Ann Vourc’h and Pete Richardson
192. Efficiency and Distribution in Computable Models of Carbon Emission Abatement(March 1998) Joaquim Oliveira Martins and Peter Sturm
191. Monetary Policy when Inflation is Low(March 1998) Charles Pigott and Hans Christiansen
190. Submission by the OECD to the G8 Growth, Employability and Inclusion Conference(March 1998)
189. Income Distribution and Poverty in Selected OECD Countries(March 1998) Jean-Marc Burniaux, Thai-Thanh Dang, Douglas Fore, Michael Förster,Marco Mira d’Ercole and Howard Oxley
188. Asset Prices and Monetary Policy(February 1998) Mike Kennedy, Angel Palerm, Charles Pigott and Flavia Terribile
187. NAIRU: Incomes Policy and Inflation(January 1998) Silvia Fabiani, Alberto Locarno, Gian Paolo Oneto and Paolo Sestito
186. OECD Submission to the Irish National Minimum Wage Commission(December 1997)
185. OECD Submission to the UK Low Pay Commission(December 1997)
184. Concept, Measurement and Policy Implications of the NAIRU - Perspective from Belgium(October 1997) Joost Verlinden
183. Structural unemployment in Denmark(September 1997) Agnete Gersing
182. The United Kingdom NAIRU: Concepts, Measurement and Policy Implications(September 1997) Chris Melliss and A.E. Webb
181. Globalisation and Linkages: Macro-Structural Challenges and Opportunities(August 1997) Pete Richardson
180. Regulation and Performance in the Distribution Sector(August 1997) Dirk Pilat
ECO/WKP(98)8
57
179. Measurement of Non-tariff Barriers(July 1997) Alan Deardorff and Robert M. Stern
178. The NAIRU-Concept: A Few Remarks(July 1997) Karl Pichelmann and Andreas Ulrich Schuh
177. Structural Unemployment in Finland(July 1997) Pasi Holm and Elina Somervouri
176. Taxation and Economic Performance(June 1997) Willi Leibfritz, John Thornton and Alexandra Bibbee
175. Long-Term Interest Rates in Globalised Markets(May 1997) Hans Christiansen and Charles Pigott
174. International Implications of European Economic and Monetary Union(May 1997) Norbert Funke and Mike Kennedy
173. The NAIRU in Japan: Measurement and its implications(March 1997) Fumihira Nishizaki
172. The Unemployment Problem - A Norwegian Perspective(February 1997) Steinar Holden
171. The Reliability of Quarterly National Accounts in Seven Major Countries: A User’s Perspective(February 1997) Robert York and Paul Atkinson
170. Confidence Indicators and their Relationship to changes in Economic Activity(November 1996) Teresa Santero and Niels Westerlund.
169. Labour Productivity Levels in OECD Countries. Estimates for Manufacturing and Selected Service Sectors(September 1996) Dirk Pilat
168. Ageing Populations, Pension Systems and Government Budgets: Simulations for 20 OECD Countries(September 1996) Deborah Roseveare, Willi Leibfritz, Douglas Fore and Eckhard Wurzel
167. Modelling the Supply Side of the Seven Major OECD Economies(September 1996) Dave Turner, Pete Richardson and Sylvie Rauffet
166. Size Distribution of Output and Employment: A Data Set For Manufacturing Industries in Five OECDCountries, 1960s-1990(August 1996) Bart van Ark and Erik Monnikhof
165. Trade and Competition: Frictions after the Uruguay Round(July 1996) International Trade and Investment Division
164. Corporate Governance, Competition and Performance(June 1996) Colin Mayer
163. Fiscal Relations within the European Union(May 1996) Peter Hoeller, Marie-Odile Louppe and Patrice Vergriete
Recommended