Ultralow Noise VGAs with Preamplifier and Programmable RIN
Data Sheet AD8331/AD8332/AD8334
Rev. I Document Feedback Information furnished by Analog Devices is believed to be accurate and reliable. However, no responsibility is assumed by Analog Devices for its use, nor for any infringements of patents or other rights of third parties that may result from its use. Specifications subject to change without notice. No license is granted by implication or otherwise under any patent or patent rights of Analog Devices. Trademarks and registered trademarks are the property of their respective owners.
One Technology Way, P.O. Box 9106, Norwood, MA 02062-9106, U.S.A.Tel: 781.329.4700 ©2003–2016 Analog Devices, Inc. All rights reserved. Technical Support www.analog.com
FEATURES Ultralow noise preamplifier (preamp)
Voltage noise = 0.74 nV/√Hz Current noise = 2.5 pA/√Hz
3 dB bandwidth AD8331: 120 MHz AD8332, AD8334: 100 MHz
Low power AD8331: 125 mW/channel AD8332, AD8334: 145 mW/channel
Wide gain range with programmable postamp −4.5 dB to +43.5 dB in LO gain mode 7.5 dB to 55.5 dB in HI gain mode
Low output-referred noise: 48 nV/√Hz typical Active input impedance matching Optimized for 10-bit/12-bit ADCs Selectable output clamping level Single 5 V supply operation AD8332 and AD8334 available in lead frame chip scale package
APPLICATIONS Ultrasound and sonar time-gain controls High performance automatic gain control (AGC) systems I/Q signal processing High speed, dual ADC drivers
GENERAL DESCRIPTION The AD8331/AD8332/AD8334 are single-, dual-, and quad-channel, ultralow noise linear-in-dB, variable gain amplifiers (VGAs). Optimized for ultrasound systems, they are usable as a low noise variable gain element at frequencies up to 120 MHz.
Included in each channel are an ultralow noise preamp (LNA), an X-AMP® VGA with 48 dB of gain range, and a selectable gain postamp with adjustable output limiting. The LNA gain is 19 dB with a single-ended input and differential outputs. Using a single resistor, the LNA input impedance can be adjusted to match a signal source without compromising noise performance.
The 48 dB gain range of the VGA makes these devices suitable for a variety of applications. Excellent bandwidth uniformity is maintained across the entire range. The gain control interface provides precise linear-in-dB scaling of 50 dB/V for control voltages between 40 mV and 1 V. Factory trim ensures excellent part-to-part and channel-to-channel gain matching.
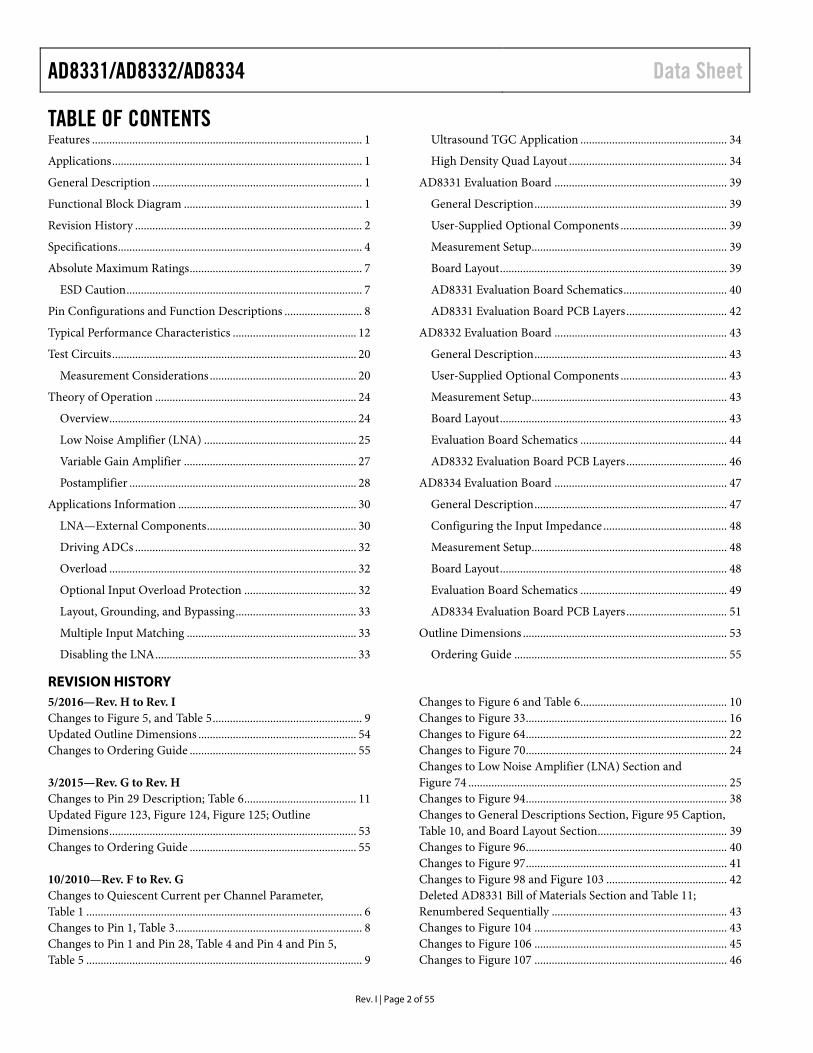
FUNCTIONAL BLOCK DIAGRAM
0319
9-00
1
VOL
VOH
VMIDLNA
48dBATTENUATOR
ENB
INH
LMD
VINVIPLOPLON
GAIN
AD8331/AD8332/AD8334
+
–
CLAMP
RCLMP
HILOVCM
3.5dB OR 15.5dB
19dB PA
VCMBIAS VGA BIAS AND
INTERPOLATOR
GAINCONTROL
INTERFACE
21dB
Figure 1. Signal Path Block Diagram
60
50
40
30
20
10
0
–10100k 1M 10M 100M 1G
GA
IN (
dB
)
FREQUENCY (Hz)
0319
9-00
2
VGAIN = 1V
VGAIN = 0.8V
VGAIN = 0.6V
VGAIN = 0.4V
VGAIN = 0.2V
VGAIN = 0V
HI GAINMODE
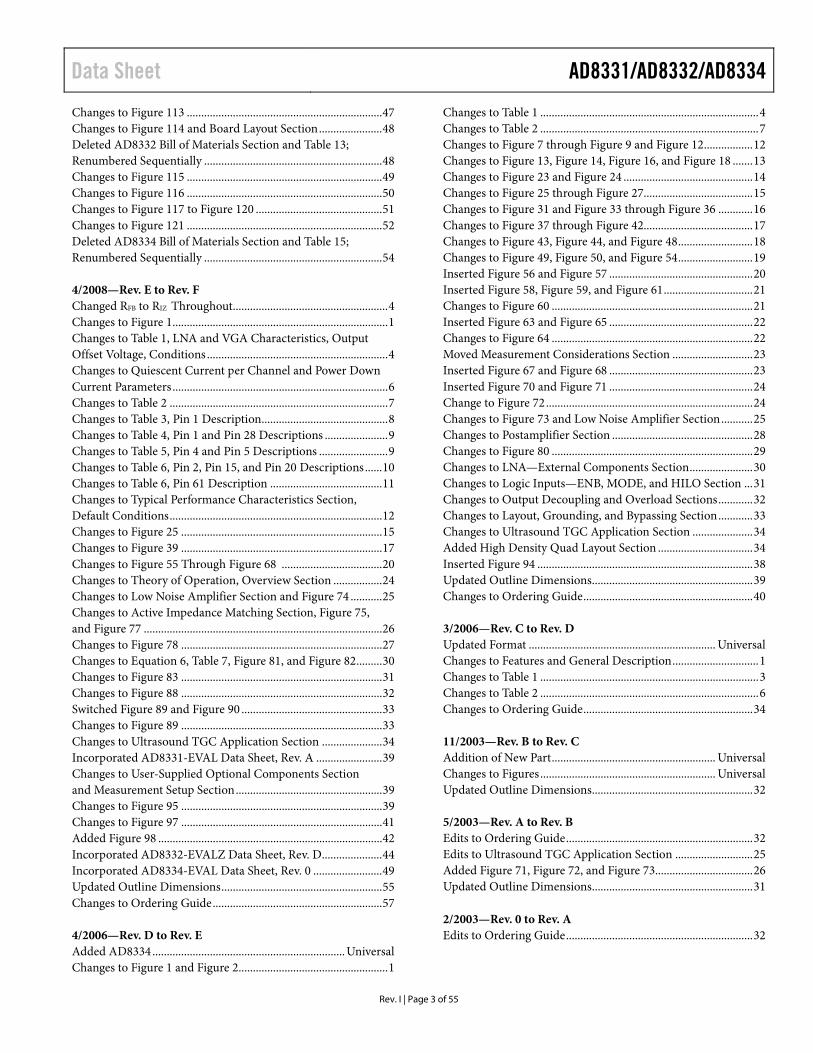
Figure 2. Frequency Response vs. Gain
Differential signal paths result in superb second- and third-order distortion performance and low crosstalk.
The low output-referred noise of the VGA is advantageous in driving high speed differential ADCs. The gain of the postamp can be pin selected to 3.5 dB or 15.5 dB to optimize gain range and output noise for 12-bit or 10-bit converter applications. The output can be limited to a user-selected clamping level, preventing input overload to a subsequent ADC. An external resistor adjusts the clamping level.
The operating temperature range is −40°C to +85°C. The AD8331 is available in a 20-lead QSOP package, the AD8332 is available in 28-lead TSSOP and 32-lead LFCSP packages, and the AD8334 is available in a 64-lead LFCSP package.
AD8331/AD8332/AD8334 Data Sheet
Rev. I | Page 2 of 55
TABLE OF CONTENTS Features .............................................................................................. 1 Applications ....................................................................................... 1 General Description ......................................................................... 1 Functional Block Diagram .............................................................. 1 Revision History ............................................................................... 2 Specifications ..................................................................................... 4 Absolute Maximum Ratings ............................................................ 7
ESD Caution .................................................................................. 7 Pin Configurations and Function Descriptions ........................... 8 Typical Performance Characteristics ........................................... 12 Test Circuits ..................................................................................... 20
Measurement Considerations ................................................... 20 Theory of Operation ...................................................................... 24
Overview ...................................................................................... 24 Low Noise Amplifier (LNA) ..................................................... 25 Variable Gain Amplifier ............................................................ 27 Postamplifier ............................................................................... 28
Applications Information .............................................................. 30 LNA—External Components .................................................... 30 Driving ADCs ............................................................................. 32 Overload ...................................................................................... 32 Optional Input Overload Protection ....................................... 32 Layout, Grounding, and Bypassing .......................................... 33 Multiple Input Matching ........................................................... 33 Disabling the LNA ...................................................................... 33
Ultrasound TGC Application ................................................... 34 High Density Quad Layout ....................................................... 34
AD8331 Evaluation Board ............................................................ 39 General Description ................................................................... 39 User-Supplied Optional Components ..................................... 39 Measurement Setup.................................................................... 39 Board Layout ............................................................................... 39 AD8331 Evaluation Board Schematics .................................... 40 AD8331 Evaluation Board PCB Layers ................................... 42
AD8332 Evaluation Board ............................................................ 43 General Description ................................................................... 43 User-Supplied Optional Components ..................................... 43 Measurement Setup.................................................................... 43 Board Layout ............................................................................... 43 Evaluation Board Schematics ................................................... 44 AD8332 Evaluation Board PCB Layers ................................... 46
AD8334 Evaluation Board ............................................................ 47 General Description ................................................................... 47 Configuring the Input Impedance ........................................... 48 Measurement Setup.................................................................... 48 Board Layout ............................................................................... 48 Evaluation Board Schematics ................................................... 49 AD8334 Evaluation Board PCB Layers ................................... 51
Outline Dimensions ....................................................................... 53 Ordering Guide .......................................................................... 55
REVISION HISTORY 5/2016—Rev. H to Rev. I Changes to Figure 5, and Table 5 .................................................... 9 Updated Outline Dimensions ....................................................... 54 Changes to Ordering Guide .......................................................... 55 3/2015—Rev. G to Rev. H Changes to Pin 29 Description; Table 6 ....................................... 11 Updated Figure 123, Figure 124, Figure 125; Outline Dimensions ...................................................................................... 53 Changes to Ordering Guide .......................................................... 55 10/2010—Rev. F to Rev. G Changes to Quiescent Current per Channel Parameter, Table 1 ................................................................................................ 6 Changes to Pin 1, Table 3 ................................................................. 8 Changes to Pin 1 and Pin 28, Table 4 and Pin 4 and Pin 5, Table 5 ................................................................................................ 9
Changes to Figure 6 and Table 6 ................................................... 10 Changes to Figure 33 ...................................................................... 16 Changes to Figure 64 ...................................................................... 22 Changes to Figure 70 ...................................................................... 24 Changes to Low Noise Amplifier (LNA) Section and Figure 74 .......................................................................................... 25 Changes to Figure 94 ...................................................................... 38 Changes to General Descriptions Section, Figure 95 Caption, Table 10, and Board Layout Section ............................................. 39 Changes to Figure 96 ...................................................................... 40 Changes to Figure 97 ...................................................................... 41 Changes to Figure 98 and Figure 103 .......................................... 42 Deleted AD8331 Bill of Materials Section and Table 11; Renumbered Sequentially ............................................................. 43 Changes to Figure 104 ................................................................... 43 Changes to Figure 106 ................................................................... 45 Changes to Figure 107 ................................................................... 46
Data Sheet AD8331/AD8332/AD8334
Rev. I | Page 3 of 55
Changes to Figure 113 .................................................................... 47 Changes to Figure 114 and Board Layout Section ...................... 48 Deleted AD8332 Bill of Materials Section and Table 13; Renumbered Sequentially .............................................................. 48 Changes to Figure 115 .................................................................... 49 Changes to Figure 116 .................................................................... 50 Changes to Figure 117 to Figure 120 ............................................ 51 Changes to Figure 121 .................................................................... 52 Deleted AD8334 Bill of Materials Section and Table 15; Renumbered Sequentially .............................................................. 54 4/2008—Rev. E to Rev. F Changed RFB to RIZ Throughout...................................................... 4 Changes to Figure 1........................................................................... 1 Changes to Table 1, LNA and VGA Characteristics, Output Offset Voltage, Conditions ............................................................... 4 Changes to Quiescent Current per Channel and Power Down Current Parameters ........................................................................... 6 Changes to Table 2 ............................................................................ 7 Changes to Table 3, Pin 1 Description............................................ 8 Changes to Table 4, Pin 1 and Pin 28 Descriptions ...................... 9 Changes to Table 5, Pin 4 and Pin 5 Descriptions ........................ 9 Changes to Table 6, Pin 2, Pin 15, and Pin 20 Descriptions ...... 10 Changes to Table 6, Pin 61 Description ....................................... 11 Changes to Typical Performance Characteristics Section, Default Conditions .......................................................................... 12 Changes to Figure 25 ...................................................................... 15 Changes to Figure 39 ...................................................................... 17 Changes to Figure 55 Through Figure 68 ................................... 20 Changes to Theory of Operation, Overview Section ................. 24 Changes to Low Noise Amplifier Section and Figure 74 ........... 25 Changes to Active Impedance Matching Section, Figure 75, and Figure 77 ................................................................................... 26 Changes to Figure 78 ...................................................................... 27 Changes to Equation 6, Table 7, Figure 81, and Figure 82 ......... 30 Changes to Figure 83 ...................................................................... 31 Changes to Figure 88 ...................................................................... 32 Switched Figure 89 and Figure 90 ................................................. 33 Changes to Figure 89 ...................................................................... 33 Changes to Ultrasound TGC Application Section ..................... 34 Incorporated AD8331-EVAL Data Sheet, Rev. A ....................... 39 Changes to User-Supplied Optional Components Section and Measurement Setup Section ................................................... 39 Changes to Figure 95 ...................................................................... 39 Changes to Figure 97 ...................................................................... 41 Added Figure 98 .............................................................................. 42 Incorporated AD8332-EVALZ Data Sheet, Rev. D ..................... 44 Incorporated AD8334-EVAL Data Sheet, Rev. 0 ........................ 49 Updated Outline Dimensions ........................................................ 55 Changes to Ordering Guide ........................................................... 57 4/2006—Rev. D to Rev. E Added AD8334 ................................................................... Universal Changes to Figure 1 and Figure 2 .................................................... 1
Changes to Table 1 ............................................................................ 4 Changes to Table 2 ............................................................................ 7 Changes to Figure 7 through Figure 9 and Figure 12 ................. 12 Changes to Figure 13, Figure 14, Figure 16, and Figure 18 ....... 13 Changes to Figure 23 and Figure 24 ............................................. 14 Changes to Figure 25 through Figure 27...................................... 15 Changes to Figure 31 and Figure 33 through Figure 36 ............ 16 Changes to Figure 37 through Figure 42...................................... 17 Changes to Figure 43, Figure 44, and Figure 48 .......................... 18 Changes to Figure 49, Figure 50, and Figure 54 .......................... 19 Inserted Figure 56 and Figure 57 .................................................. 20 Inserted Figure 58, Figure 59, and Figure 61 ............................... 21 Changes to Figure 60 ...................................................................... 21 Inserted Figure 63 and Figure 65 .................................................. 22 Changes to Figure 64 ...................................................................... 22 Moved Measurement Considerations Section ............................ 23 Inserted Figure 67 and Figure 68 .................................................. 23 Inserted Figure 70 and Figure 71 .................................................. 24 Change to Figure 72 ........................................................................ 24 Changes to Figure 73 and Low Noise Amplifier Section ........... 25 Changes to Postamplifier Section ................................................. 28 Changes to Figure 80 ...................................................................... 29 Changes to LNA—External Components Section ...................... 30 Changes to Logic Inputs—ENB, MODE, and HILO Section ... 31 Changes to Output Decoupling and Overload Sections ............ 32 Changes to Layout, Grounding, and Bypassing Section ............ 33 Changes to Ultrasound TGC Application Section ..................... 34 Added High Density Quad Layout Section ................................. 34 Inserted Figure 94 ........................................................................... 38 Updated Outline Dimensions........................................................ 39 Changes to Ordering Guide ........................................................... 40 3/2006—Rev. C to Rev. D Updated Format ................................................................. Universal Changes to Features and General Description .............................. 1 Changes to Table 1 ............................................................................ 3 Changes to Table 2 ............................................................................ 6 Changes to Ordering Guide ........................................................... 34 11/2003—Rev. B to Rev. C Addition of New Part ......................................................... Universal Changes to Figures ............................................................. Universal Updated Outline Dimensions........................................................ 32 5/2003—Rev. A to Rev. B Edits to Ordering Guide ................................................................. 32 Edits to Ultrasound TGC Application Section ........................... 25 Added Figure 71, Figure 72, and Figure 73.................................. 26 Updated Outline Dimensions........................................................ 31 2/2003—Rev. 0 to Rev. A Edits to Ordering Guide ................................................................. 32
AD8331/AD8332/AD8334 Data Sheet
Rev. I | Page 4 of 55
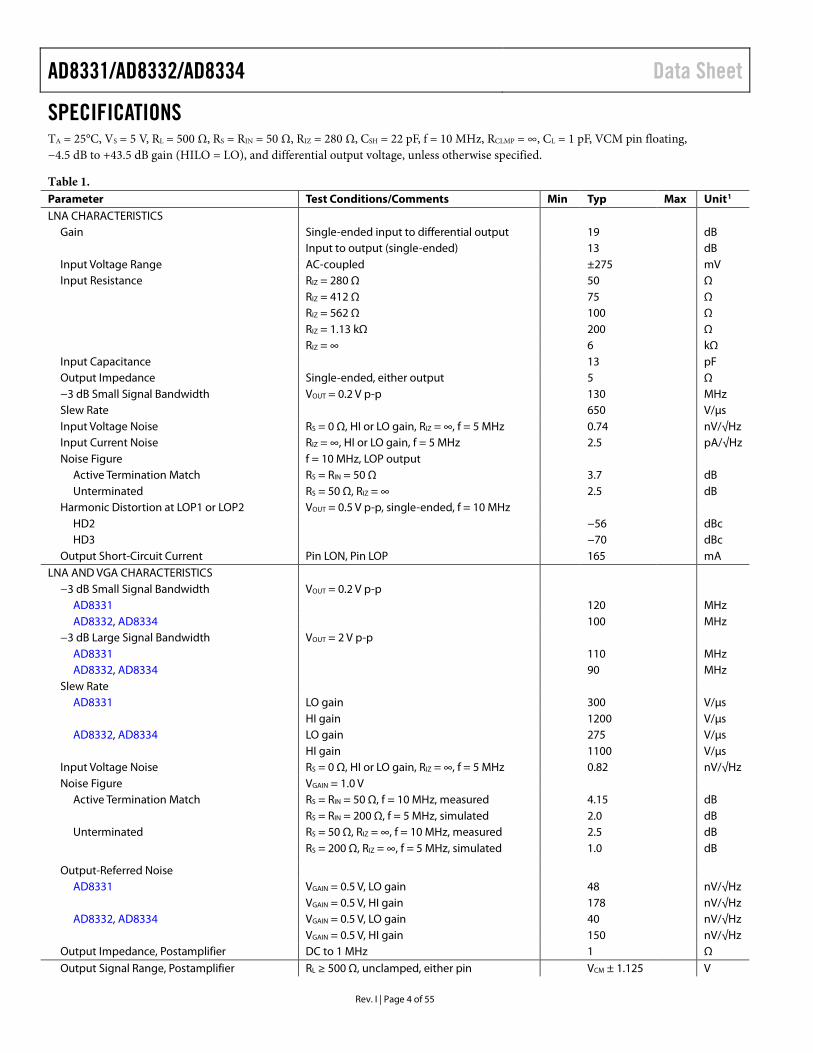
SPECIFICATIONS TA = 25°C, VS = 5 V, RL = 500 Ω, RS = RIN = 50 Ω, RIZ = 280 Ω, CSH = 22 pF, f = 10 MHz, RCLMP = ∞, CL = 1 pF, VCM pin floating, −4.5 dB to +43.5 dB gain (HILO = LO), and differential output voltage, unless otherwise specified.
Table 1. Parameter Test Conditions/Comments Min Typ Max Unit1 LNA CHARACTERISTICS
Gain Single-ended input to differential output 19 dB Input to output (single-ended) 13 dB
Input Voltage Range AC-coupled ±275 mV Input Resistance RIZ = 280 Ω 50 Ω
RIZ = 412 Ω 75 Ω RIZ = 562 Ω 100 Ω RIZ = 1.13 kΩ 200 Ω RIZ = ∞ 6 kΩ
Input Capacitance 13 pF Output Impedance Single-ended, either output 5 Ω −3 dB Small Signal Bandwidth VOUT = 0.2 V p-p 130 MHz Slew Rate 650 V/µs Input Voltage Noise RS = 0 Ω, HI or LO gain, RIZ = ∞, f = 5 MHz 0.74 nV/√Hz Input Current Noise RIZ = ∞, HI or LO gain, f = 5 MHz 2.5 pA/√Hz Noise Figure f = 10 MHz, LOP output
Active Termination Match RS = RIN = 50 Ω 3.7 dB Unterminated RS = 50 Ω, RIZ = ∞ 2.5 dB
Harmonic Distortion at LOP1 or LOP2 VOUT = 0.5 V p-p, single-ended, f = 10 MHz HD2 −56 dBc HD3 −70 dBc
Output Short-Circuit Current Pin LON, Pin LOP 165 mA LNA AND VGA CHARACTERISTICS
−3 dB Small Signal Bandwidth VOUT = 0.2 V p-p AD8331 120 MHz AD8332, AD8334 100 MHz
−3 dB Large Signal Bandwidth VOUT = 2 V p-p AD8331 110 MHz AD8332, AD8334 90 MHz
Slew Rate AD8331 LO gain 300 V/µs
HI gain 1200 V/µs AD8332, AD8334 LO gain 275 V/µs
HI gain 1100 V/µs Input Voltage Noise RS = 0 Ω, HI or LO gain, RIZ = ∞, f = 5 MHz 0.82 nV/√Hz Noise Figure VGAIN = 1.0 V
Active Termination Match RS = RIN = 50 Ω, f = 10 MHz, measured 4.15 dB RS = RIN = 200 Ω, f = 5 MHz, simulated 2.0 dB
Unterminated RS = 50 Ω, RIZ = ∞, f = 10 MHz, measured 2.5 dB RS = 200 Ω, RIZ = ∞, f = 5 MHz, simulated 1.0 dB
Output-Referred Noise AD8331 VGAIN = 0.5 V, LO gain 48 nV/√Hz
VGAIN = 0.5 V, HI gain 178 nV/√Hz AD8332, AD8334 VGAIN = 0.5 V, LO gain 40 nV/√Hz
VGAIN = 0.5 V, HI gain 150 nV/√Hz Output Impedance, Postamplifier DC to 1 MHz 1 Ω Output Signal Range, Postamplifier RL ≥ 500 Ω, unclamped, either pin VCM ± 1.125 V

Data Sheet AD8331/AD8332/AD8334
Rev. I | Page 5 of 55
Parameter Test Conditions/Comments Min Typ Max Unit1 Differential 4.5 V p-p
Output Offset Voltage AD8331 Differential, VGAIN = 0.5 V −50 ±5 +50 mV Common mode −125 −25 +100 mV AD8332, AD8334 Differential, 0.05 V ≤ VGAIN ≤ 1.0 V −20 ±5 +20 mV Common mode −125 –25 +100 mV
Output Short-Circuit Current 45 mA Harmonic Distortion VGAIN = 0.5 V, VOUT = 1 V p-p, HI gain
AD8331 HD2 f = 1 MHz −88 dBc HD3 −85 dBc HD2 f = 10 MHz −68 dBc HD3 −65 dBc
AD8332, AD8334 HD2 f = 1 MHz −82 dBc HD3 −85 dBc HD2 f = 10 MHz −62 dBc HD3 −66 dBc
Input 1 dB Compression Point VGAIN = 0.25 V, VOUT = 1 V p-p, f = 1 MHz to 10 MHz 1 dBm Two-Tone Intermodulation Distortion (IMD3)
AD8331 VGAIN = 0.72 V, VOUT = 1 V p-p, f = 1 MHz −80 dBc VGAIN = 0.5 V, VOUT = 1 V p-p, f = 10 MHz −72 dBc AD8332, AD8334 VGAIN = 0.72 V, VOUT = 1 V p-p, f = 1 MHz −78 dBc VGAIN = 0.5 V, VOUT = 1 V p-p, f = 10 MHz −74 dBc
Output Third-Order Intercept AD8331 VGAIN = 0.5 V, VOUT = 1 V p-p, f = 1 MHz 38 dBm VGAIN = 0.5 V, VOUT = 1 V p-p, f = 10 MHz 33 dBm AD8332, AD8334 VGAIN = 0.5 V, VOUT = 1 V p-p, f = 1 MHz 35 dBm
VGAIN = 0.5 V, VOUT = 1 V p-p, f = 10 MHz 32 dBm Channel-to-Channel Crosstalk (AD8332, AD8334)
VGAIN = 0.5 V, VOUT = 1 V p-p, f = 1 MHz −98 dB
Overload Recovery VGAIN = 1.0 V, VIN = 50 mV p-p/1 V p-p, f = 10 MHz 5 ns Group Delay Variation 5 MHz < f < 50 MHz, full gain range ±2 ns
ACCURACY Absolute Gain Error2 0.05 V < VGAIN < 0.10 V −1 +0.5 +2 dB
0.10 V < VGAIN < 0.95 V −1 ±0.3 +1 dB 0.95 V < VGAIN < 1.0 V −2 −1 +1 dB
Gain Law Conformance3 0.1 V < VGAIN < 0.95 V ±0.2 dB Channel-to-Channel Gain Matching 0.1 V < VGAIN < 0.95 V ±0.1 dB
GAIN CONTROL INTERFACE (Pin GAIN) Gain Scaling Factor 0.10 V < VGAIN < 0.95 V 48.5 50 51.5 dB/V Gain Range LO gain −4.5 to +43.5 dB
HI gain 7.5 to 55.5 dB Input Voltage (VGAIN) Range 0 to 1.0 V Input Impedance 10 MΩ Response Time 48 dB gain change to 90% full scale 500 ns
COMMON-MODE INTERFACE (PIN VCMx) Input Resistance4 Current limited to ±1 mA 30 Ω Output CM Offset Voltage VCM = 2.5 V −125 −25 +100 mV Voltage Range VOUT = 2.0 V p-p 1.5 to 3.5 V
AD8331/AD8332/AD8334 Data Sheet
Rev. I | Page 6 of 55
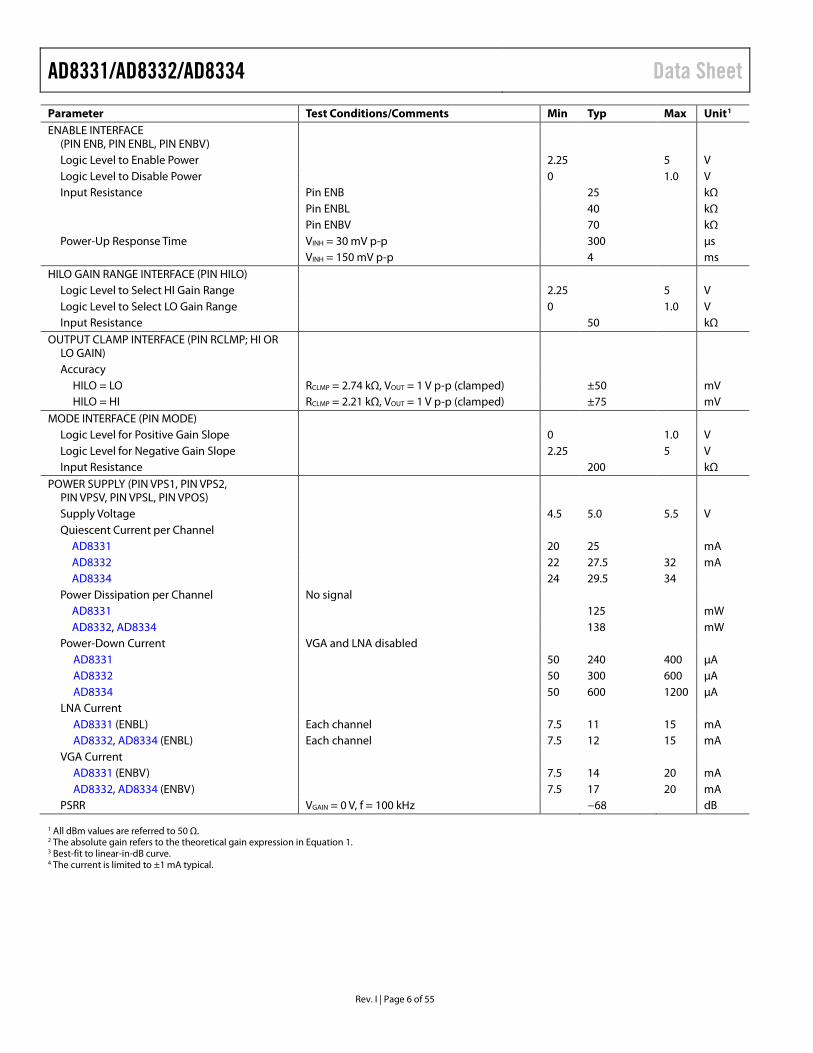
Parameter Test Conditions/Comments Min Typ Max Unit1 ENABLE INTERFACE
(PIN ENB, PIN ENBL, PIN ENBV)
Logic Level to Enable Power 2.25 5 V Logic Level to Disable Power 0 1.0 V Input Resistance Pin ENB 25 kΩ
Pin ENBL 40 kΩ Pin ENBV 70 kΩ
Power-Up Response Time VINH = 30 mV p-p 300 µs VINH = 150 mV p-p 4 ms HILO GAIN RANGE INTERFACE (PIN HILO)
Logic Level to Select HI Gain Range 2.25 5 V Logic Level to Select LO Gain Range 0 1.0 V Input Resistance 50 kΩ
OUTPUT CLAMP INTERFACE (PIN RCLMP; HI OR LO GAIN)
Accuracy HILO = LO RCLMP = 2.74 kΩ, VOUT = 1 V p-p (clamped) ±50 mV HILO = HI RCLMP = 2.21 kΩ, VOUT = 1 V p-p (clamped) ±75 mV
MODE INTERFACE (PIN MODE) Logic Level for Positive Gain Slope 0 1.0 V Logic Level for Negative Gain Slope 2.25 5 V Input Resistance 200 kΩ
POWER SUPPLY (PIN VPS1, PIN VPS2, PIN VPSV, PIN VPSL, PIN VPOS)
Supply Voltage 4.5 5.0 5.5 V Quiescent Current per Channel
AD8331 20 25 mA AD8332 22 27.5 32 mA AD8334 24 29.5 34
Power Dissipation per Channel No signal AD8331 125 mW AD8332, AD8334 138 mW
Power-Down Current VGA and LNA disabled AD8331 50 240 400 µA AD8332 50 300 600 µA AD8334 50 600 1200 µA
LNA Current AD8331 (ENBL) Each channel 7.5 11 15 mA AD8332, AD8334 (ENBL) Each channel 7.5 12 15 mA
VGA Current AD8331 (ENBV) 7.5 14 20 mA AD8332, AD8334 (ENBV) 7.5 17 20 mA
PSRR VGAIN = 0 V, f = 100 kHz −68 dB 1 All dBm values are referred to 50 Ω. 2 The absolute gain refers to the theoretical gain expression in Equation 1. 3 Best-fit to linear-in-dB curve. 4 The current is limited to ±1 mA typical.
Data Sheet AD8331/AD8332/AD8334
Rev. I | Page 7 of 55
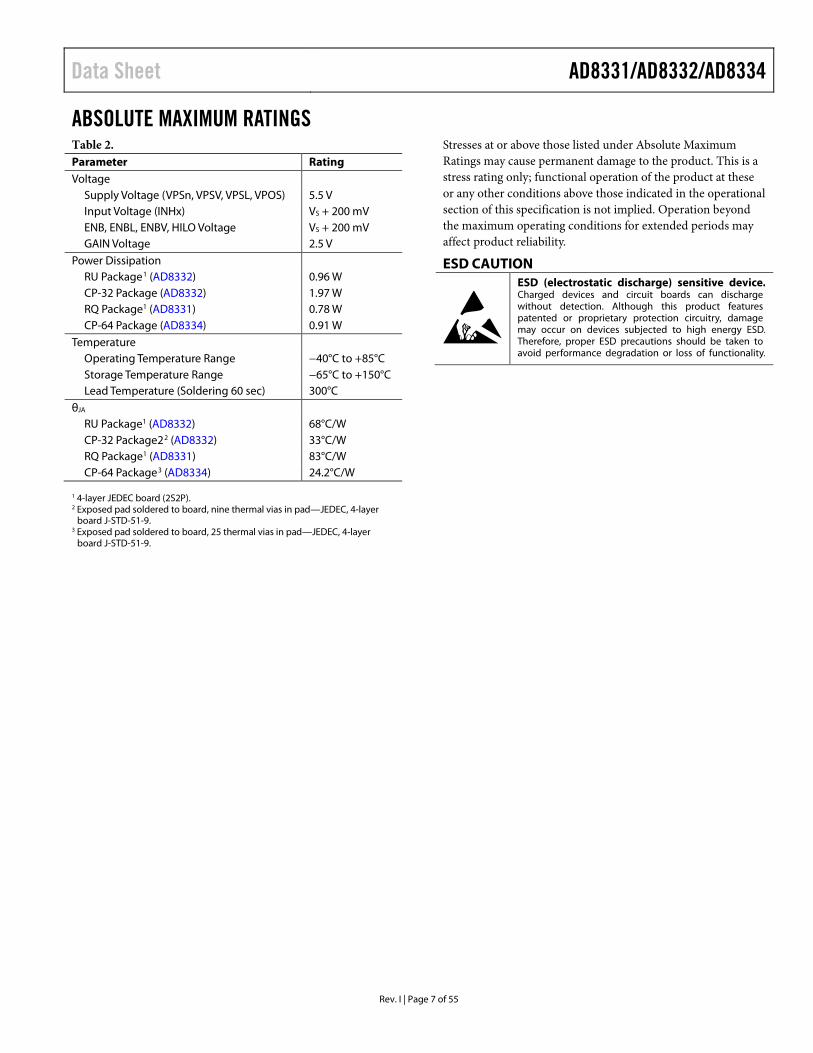
ABSOLUTE MAXIMUM RATINGS Table 2. Parameter Rating Voltage
Supply Voltage (VPSn, VPSV, VPSL, VPOS) 5.5 V Input Voltage (INHx) VS + 200 mV ENB, ENBL, ENBV, HILO Voltage VS + 200 mV GAIN Voltage 2.5 V
Power Dissipation RU Package1 (AD8332) 0.96 W CP-32 Package (AD8332) 1.97 W RQ Package1 (AD8331) 0.78 W CP-64 Package (AD8334) 0.91 W
Temperature Operating Temperature Range −40°C to +85°C Storage Temperature Range −65°C to +150°C Lead Temperature (Soldering 60 sec) 300°C
θJA RU Package1 (AD8332) 68°C/W CP-32 Package22 (AD8332) 33°C/W RQ Package1 (AD8331) 83°C/W CP-64 Package3 (AD8334) 24.2°C/W
1 4-layer JEDEC board (2S2P). 2 Exposed pad soldered to board, nine thermal vias in pad—JEDEC, 4-layer
board J-STD-51-9. 3 Exposed pad soldered to board, 25 thermal vias in pad—JEDEC, 4-layer
board J-STD-51-9.
Stresses at or above those listed under Absolute Maximum Ratings may cause permanent damage to the product. This is a stress rating only; functional operation of the product at these or any other conditions above those indicated in the operational section of this specification is not implied. Operation beyond the maximum operating conditions for extended periods may affect product reliability.
ESD CAUTION
AD8331/AD8332/AD8334 Data Sheet
Rev. I | Page 8 of 55
PIN CONFIGURATIONS AND FUNCTION DESCRIPTIONS
0319
9-00
3MODE
VIP
GAIN
VIN
LOP
COML
LMD
LON
VPSL
INH
1
2
3
4
5
6
7
8
9
10
RCLMP
COMM
VOH
ENBV
VCM
VPOS
VOL
HILO
ENBL
COMM20
19
18
17
16
15
14
13
12
11
AD8331TOP VIEW
(Not to Scale)
PIN 1INDICATOR
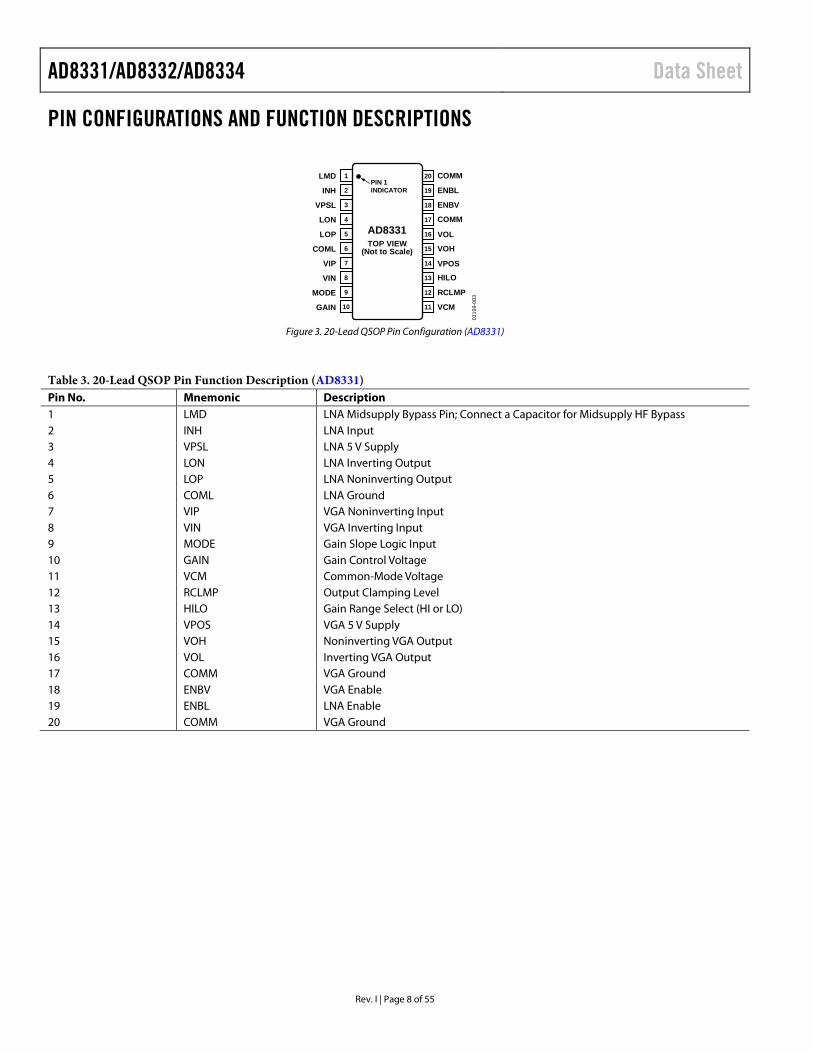
Figure 3. 20-Lead QSOP Pin Configuration (AD8331)
Table 3. 20-Lead QSOP Pin Function Description (AD8331) Pin No. Mnemonic Description 1 LMD LNA Midsupply Bypass Pin; Connect a Capacitor for Midsupply HF Bypass 2 INH LNA Input 3 VPSL LNA 5 V Supply 4 LON LNA Inverting Output 5 LOP LNA Noninverting Output 6 COML LNA Ground 7 VIP VGA Noninverting Input 8 VIN VGA Inverting Input 9 MODE Gain Slope Logic Input 10 GAIN Gain Control Voltage 11 VCM Common-Mode Voltage 12 RCLMP Output Clamping Level 13 HILO Gain Range Select (HI or LO) 14 VPOS VGA 5 V Supply 15 VOH Noninverting VGA Output 16 VOL Inverting VGA Output 17 COMM VGA Ground 18 ENBV VGA Enable 19 ENBL LNA Enable 20 COMM VGA Ground
Data Sheet AD8331/AD8332/AD8334
Rev. I | Page 9 of 55
0319
9-00
4
VCM2
RCLMP
COMM
VOL2
VOH2
VIP2
GAIN
VIN2
LOP2
COM2
LMD2
LON2
VPS2
INH2
1
2
3
4
5
6
7
8
9
10
11
12
13
14
COM1
LOP1
LMD1
LON1
VPS1
INH1
VOH1
ENB
VIP1
VCM1
VIN1
VPSV
VOL1
HILO
28
27
26
25
24
23
22
21
20
19
18
17
16
15
AD8332TOP VIEW
(Not to Scale)
PIN 1INDICATOR
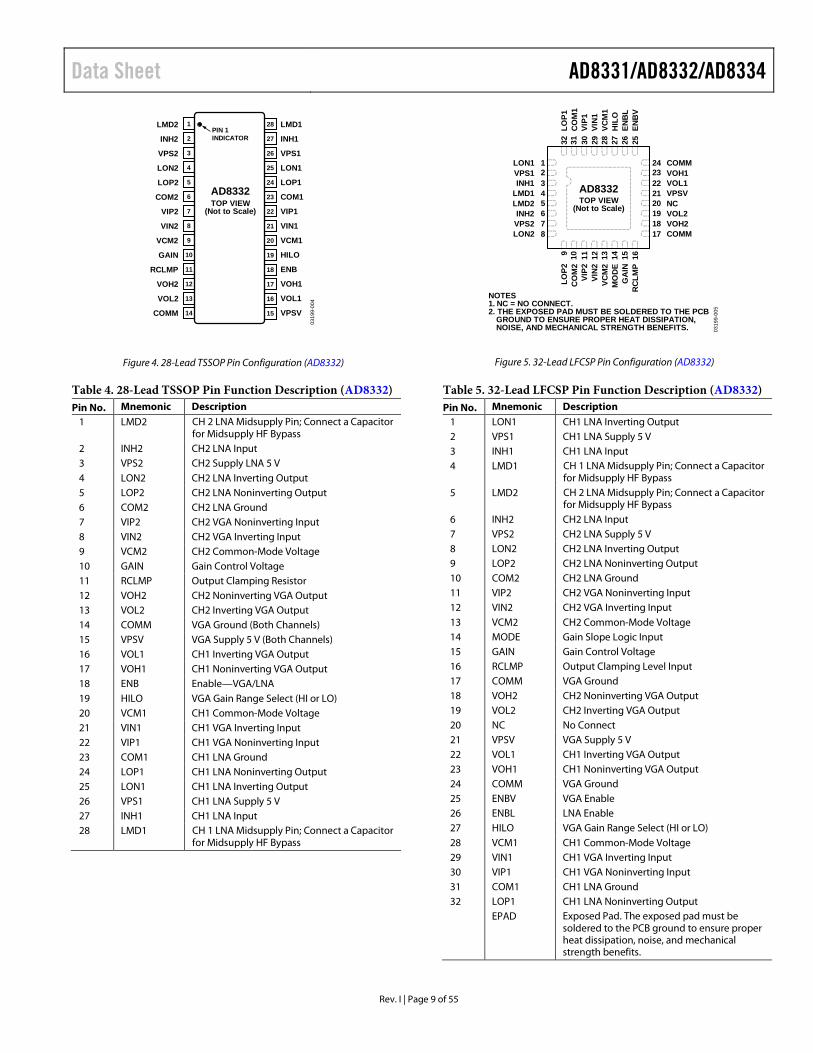
Figure 4. 28-Lead TSSOP Pin Configuration (AD8332)
24 COMM23 VOH122 VOL121 VPSV20 NC19 VOL218 VOH217 COMM
12345678
LON1VPS1INH1
LMD1LMD2INH2
VPS2LON2
9 10 11 12 13 14 15 16
LOP2
CO
M2
VIP2
VIN
2VC
M2
MO
DE
GA
INR
CLM
P
32 31 30 29 28 27 26 25
LOP1
CO
M1
VIP1
VIN
1VC
M1
HIL
OEN
BL
ENB
V
AD8332TOP VIEW
(Not to Scale)
0319
9-00
5
NOTES1. NC = NO CONNECT.2. THE EXPOSED PAD MUST BE SOLDERED TO THE PCB
GROUND TO ENSURE PROPER HEAT DISSIPATION,NOISE, AND MECHANICAL STRENGTH BENEFITS.
Figure 5. 32-Lead LFCSP Pin Configuration (AD8332)
Table 4. 28-Lead TSSOP Pin Function Description (AD8332) Pin No. Mnemonic Description
1 LMD2 CH 2 LNA Midsupply Pin; Connect a Capacitor for Midsupply HF Bypass
2 INH2 CH2 LNA Input 3 VPS2 CH2 Supply LNA 5 V 4 LON2 CH2 LNA Inverting Output 5 LOP2 CH2 LNA Noninverting Output 6 COM2 CH2 LNA Ground 7 VIP2 CH2 VGA Noninverting Input 8 VIN2 CH2 VGA Inverting Input 9 VCM2 CH2 Common-Mode Voltage 10 GAIN Gain Control Voltage 11 RCLMP Output Clamping Resistor 12 VOH2 CH2 Noninverting VGA Output 13 VOL2 CH2 Inverting VGA Output 14 COMM VGA Ground (Both Channels) 15 VPSV VGA Supply 5 V (Both Channels) 16 VOL1 CH1 Inverting VGA Output 17 VOH1 CH1 Noninverting VGA Output 18 ENB Enable—VGA/LNA 19 HILO VGA Gain Range Select (HI or LO) 20 VCM1 CH1 Common-Mode Voltage 21 VIN1 CH1 VGA Inverting Input 22 VIP1 CH1 VGA Noninverting Input 23 COM1 CH1 LNA Ground 24 LOP1 CH1 LNA Noninverting Output 25 LON1 CH1 LNA Inverting Output 26 VPS1 CH1 LNA Supply 5 V 27 INH1 CH1 LNA Input 28 LMD1 CH 1 LNA Midsupply Pin; Connect a Capacitor
for Midsupply HF Bypass
Table 5. 32-Lead LFCSP Pin Function Description (AD8332) Pin No. Mnemonic Description
1 LON1 CH1 LNA Inverting Output 2 VPS1 CH1 LNA Supply 5 V 3 INH1 CH1 LNA Input 4 LMD1 CH 1 LNA Midsupply Pin; Connect a Capacitor
for Midsupply HF Bypass 5 LMD2 CH 2 LNA Midsupply Pin; Connect a Capacitor
for Midsupply HF Bypass 6 INH2 CH2 LNA Input 7 VPS2 CH2 LNA Supply 5 V 8 LON2 CH2 LNA Inverting Output 9 LOP2 CH2 LNA Noninverting Output 10 COM2 CH2 LNA Ground 11 VIP2 CH2 VGA Noninverting Input 12 VIN2 CH2 VGA Inverting Input 13 VCM2 CH2 Common-Mode Voltage 14 MODE Gain Slope Logic Input 15 GAIN Gain Control Voltage 16 RCLMP Output Clamping Level Input 17 COMM VGA Ground 18 VOH2 CH2 Noninverting VGA Output 19 VOL2 CH2 Inverting VGA Output 20 NC No Connect 21 VPSV VGA Supply 5 V 22 VOL1 CH1 Inverting VGA Output 23 VOH1 CH1 Noninverting VGA Output 24 COMM VGA Ground 25 ENBV VGA Enable 26 ENBL LNA Enable 27 HILO VGA Gain Range Select (HI or LO) 28 VCM1 CH1 Common-Mode Voltage 29 VIN1 CH1 VGA Inverting Input 30 VIP1 CH1 VGA Noninverting Input 31 COM1 CH1 LNA Ground 32 LOP1 CH1 LNA Noninverting Output EPAD Exposed Pad. The exposed pad must be
soldered to the PCB ground to ensure proper heat dissipation, noise, and mechanical strength benefits.
AD8331/AD8332/AD8334 Data Sheet
Rev. I | Page 10 of 55
PIN 1INDICATOR
17 18 19 20 21 22 23 24 25 26 27 28 29 30 31 32
CO
M3
CO
M4
INH
4LM
D4
NC
LON
4LO
P4VI
P4VI
N4
VPS4
GA
IN34
CLM
P34
HIL
OVC
M4
VCM
3N
C
64 63 62 61 60 59 58 57 56 55 54 53 52 51 50 49
CO
M2
CO
M1
INH
1LM
D1
NC
LON
1LO
P1VI
P1VI
N1
VPS1
GA
IN12
CLM
P12
EN12
EN34
VCM
1VC
M2
123456789
10111213141516
INH2LMD2
NCLON2LOP2VIP2VIN2
VPS2VPS3VIN3VIP3
LOP3LON3
NCLMD3INH3
COM12VOH1VOL1VPS12VOL2VOH2COM12MODENCCOM34VOH3VOL3VPS34VOL4VOH4COM34
48474645444342414039383736353433
AD8334TOP VIEW
(Not to Scale)
0319
9-00
6
NOTES1. THE EXPOSED PADDLE MUST BE
SOLDERED TO THE PCB GROUNDTO ENSURE PROPER HEATDISSIPATION, NOISE, ANDMECHANICAL STRENGTH BENEFITS.
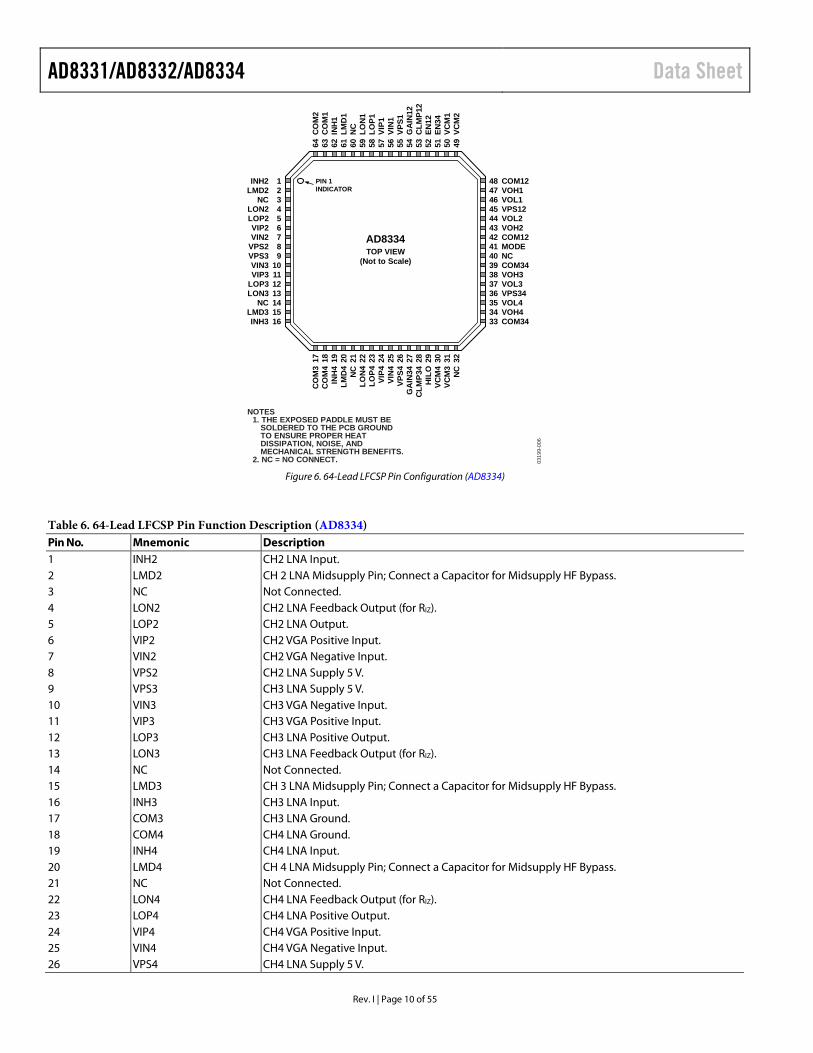
2. NC = NO CONNECT. Figure 6. 64-Lead LFCSP Pin Configuration (AD8334)
Table 6. 64-Lead LFCSP Pin Function Description (AD8334) Pin No. Mnemonic Description 1 INH2 CH2 LNA Input. 2 LMD2 CH 2 LNA Midsupply Pin; Connect a Capacitor for Midsupply HF Bypass. 3 NC Not Connected. 4 LON2 CH2 LNA Feedback Output (for RIZ). 5 LOP2 CH2 LNA Output. 6 VIP2 CH2 VGA Positive Input. 7 VIN2 CH2 VGA Negative Input. 8 VPS2 CH2 LNA Supply 5 V. 9 VPS3 CH3 LNA Supply 5 V. 10 VIN3 CH3 VGA Negative Input. 11 VIP3 CH3 VGA Positive Input. 12 LOP3 CH3 LNA Positive Output. 13 LON3 CH3 LNA Feedback Output (for RIZ). 14 NC Not Connected. 15 LMD3 CH 3 LNA Midsupply Pin; Connect a Capacitor for Midsupply HF Bypass. 16 INH3 CH3 LNA Input. 17 COM3 CH3 LNA Ground. 18 COM4 CH4 LNA Ground. 19 INH4 CH4 LNA Input. 20 LMD4 CH 4 LNA Midsupply Pin; Connect a Capacitor for Midsupply HF Bypass. 21 NC Not Connected. 22 LON4 CH4 LNA Feedback Output (for RIZ). 23 LOP4 CH4 LNA Positive Output. 24 VIP4 CH4 VGA Positive Input. 25 VIN4 CH4 VGA Negative Input. 26 VPS4 CH4 LNA Supply 5 V.
Data Sheet AD8331/AD8332/AD8334
Rev. I | Page 11 of 55
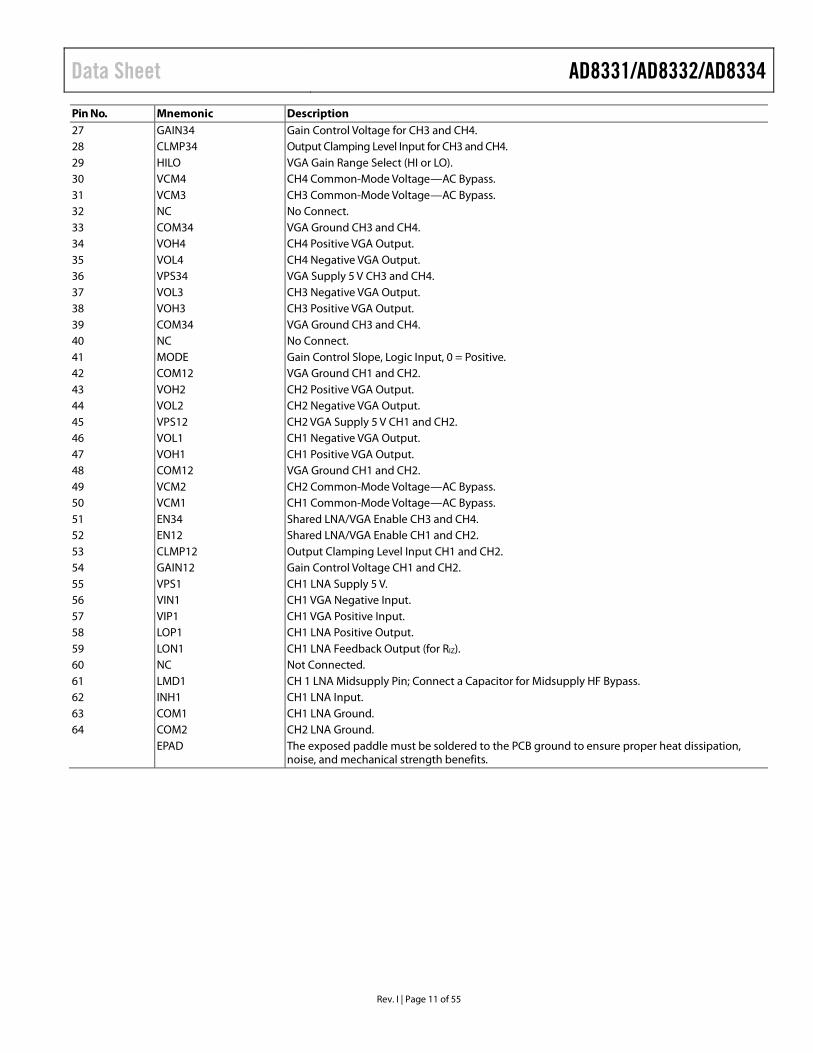
Pin No. Mnemonic Description 27 GAIN34 Gain Control Voltage for CH3 and CH4. 28 CLMP34 Output Clamping Level Input for CH3 and CH4. 29 HILO VGA Gain Range Select (HI or LO). 30 VCM4 CH4 Common-Mode Voltage—AC Bypass. 31 VCM3 CH3 Common-Mode Voltage—AC Bypass. 32 NC No Connect. 33 COM34 VGA Ground CH3 and CH4. 34 VOH4 CH4 Positive VGA Output. 35 VOL4 CH4 Negative VGA Output. 36 VPS34 VGA Supply 5 V CH3 and CH4. 37 VOL3 CH3 Negative VGA Output. 38 VOH3 CH3 Positive VGA Output. 39 COM34 VGA Ground CH3 and CH4. 40 NC No Connect. 41 MODE Gain Control Slope, Logic Input, 0 = Positive. 42 COM12 VGA Ground CH1 and CH2. 43 VOH2 CH2 Positive VGA Output. 44 VOL2 CH2 Negative VGA Output. 45 VPS12 CH2 VGA Supply 5 V CH1 and CH2. 46 VOL1 CH1 Negative VGA Output. 47 VOH1 CH1 Positive VGA Output. 48 COM12 VGA Ground CH1 and CH2. 49 VCM2 CH2 Common-Mode Voltage—AC Bypass. 50 VCM1 CH1 Common-Mode Voltage—AC Bypass. 51 EN34 Shared LNA/VGA Enable CH3 and CH4. 52 EN12 Shared LNA/VGA Enable CH1 and CH2. 53 CLMP12 Output Clamping Level Input CH1 and CH2. 54 GAIN12 Gain Control Voltage CH1 and CH2. 55 VPS1 CH1 LNA Supply 5 V. 56 VIN1 CH1 VGA Negative Input. 57 VIP1 CH1 VGA Positive Input. 58 LOP1 CH1 LNA Positive Output. 59 LON1 CH1 LNA Feedback Output (for RIZ). 60 NC Not Connected. 61 LMD1 CH 1 LNA Midsupply Pin; Connect a Capacitor for Midsupply HF Bypass. 62 INH1 CH1 LNA Input. 63 COM1 CH1 LNA Ground. 64 COM2 CH2 LNA Ground. EPAD The exposed paddle must be soldered to the PCB ground to ensure proper heat dissipation,
noise, and mechanical strength benefits.
AD8331/AD8332/AD8334 Data Sheet
Rev. I | Page 12 of 55
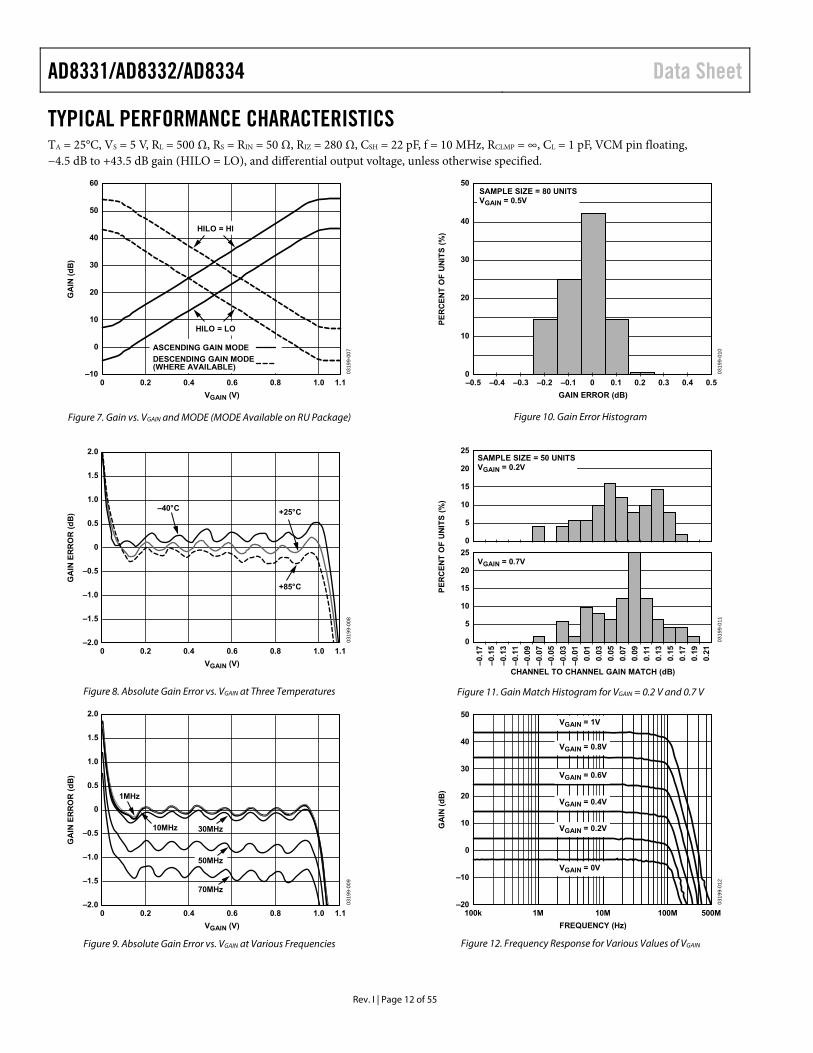
TYPICAL PERFORMANCE CHARACTERISTICS TA = 25°C, VS = 5 V, RL = 500 Ω, RS = RIN = 50 Ω, RIZ = 280 Ω, CSH = 22 pF, f = 10 MHz, RCLMP = ∞, CL = 1 pF, VCM pin floating, −4.5 dB to +43.5 dB gain (HILO = LO), and differential output voltage, unless otherwise specified.
60
50
40
30
20
10
0
–100 0.2 0.4 0.6 0.8 1.0 1.1
GA
IN (
dB
)
VGAIN (V)
0319
9-00
7
HILO = HI
HILO = LO
ASCENDING GAIN MODE
DESCENDING GAIN MODE(WHERE AVAILABLE)
Figure 7. Gain vs. VGAIN and MODE (MODE Available on RU Package)
2.0
–2.0
–1.5
–1.0
–0.5
0
0.5
1.0
1.5
0 0.2 0.4 0.6 0.8 1.0 1.1
GA
IN E
RR
OR
(d
B)
VGAIN (V)
0319
9-00
8
+25°C–40°C
+85°C
Figure 8. Absolute Gain Error vs. VGAIN at Three Temperatures
2.0
–2.0
–1.5
–1.0
–0.5
0
0.5
1.0
1.5
0 0.2 0.4 0.6 0.8 1.0 1.1
GA
IN E
RR
OR
(d
B)
VGAIN (V)
0319
9-00
9
1MHz
30MHz10MHz
70MHz
50MHz
Figure 9. Absolute Gain Error vs. VGAIN at Various Frequencies
50
40
30
20
10
0–0.5 –0.4 –0.3 –0.2 –0.1 0 0.1 0.2 0.3 0.4 0.5
PE
RC
EN
T O
F U
NIT
S (
%)
GAIN ERROR (dB)
0319
9-01
0
SAMPLE SIZE = 80 UNITSVGAIN = 0.5V
Figure 10. Gain Error Histogram
0319
9-01
1
25
VGAIN = 0.7V
0
5
15
20
25
10
0
5
10
20
15–0
.17
–0.1
5
–0.1
3
–0.1
1
–0.0
9
–0.0
7
–0.0
5
–0.0
3
–0.0
1
0.01
0.03
0.05
0.07
0.09
0.11
0.13
0.15
0.17
0.19
0.21
PE
RC
EN
T O
F U
NIT
S (
%)
CHANNEL TO CHANNEL GAIN MATCH (dB)
SAMPLE SIZE = 50 UNITSVGAIN = 0.2V
Figure 11. Gain Match Histogram for VGAIN = 0.2 V and 0.7 V
50
40
30
20
10
0
–20
–10
100k 1M 10M 100M 500M
GA
IN (
dB
)
FREQUENCY (Hz)
0319
9-01
2VGAIN = 1V
VGAIN = 0.8V
VGAIN = 0.6V
VGAIN = 0.4V
VGAIN = 0.2V
VGAIN = 0V
Figure 12. Frequency Response for Various Values of VGAIN
Data Sheet AD8331/AD8332/AD8334
Rev. I | Page 13 of 55
60
50
40
30
20
10
0
–10100k 1M 10M 100M 500M
GA
IN (d
B)
FREQUENCY (Hz)
0319
9-01
3
VGAIN = 1V
VGAIN = 0.8V
VGAIN = 0.6V
VGAIN = 0.4V
VGAIN = 0.2V
VGAIN = 0V
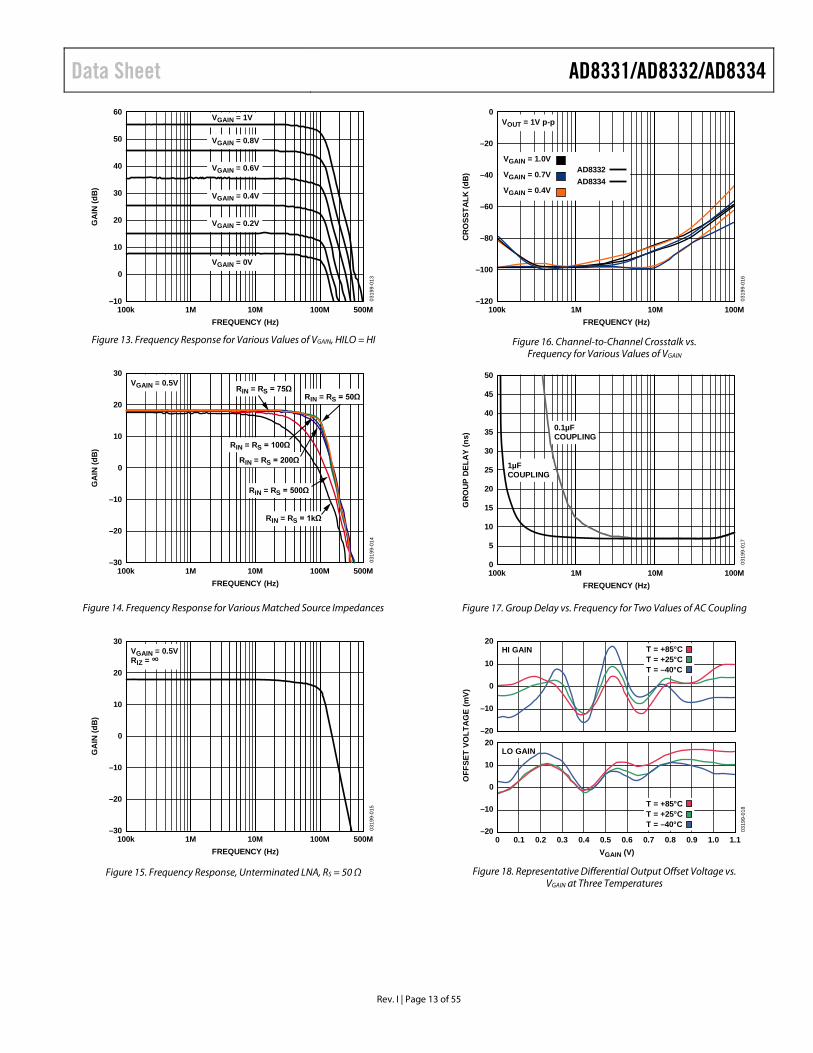
Figure 13. Frequency Response for Various Values of VGAIN, HILO = HI
30
20
–30
–20
–10
0
10
100k 1M 10M 100M 500M
GA
IN (d
B)
FREQUENCY (Hz)
0319
9-01
4
RIN = RS = 50ΩRIN = RS = 75Ω
RIN = RS = 100Ω
RIN = RS = 200Ω
RIN = RS = 500Ω
RIN = RS = 1kΩ
VGAIN = 0.5V
Figure 14. Frequency Response for Various Matched Source Impedances
30
–30
–20
–10
0
10
20
100k 1M 10M 100M 500M
GA
IN (d
B)
FREQUENCY (Hz)
0319
9-01
5
VGAIN = 0.5VRIZ = ∞
Figure 15. Frequency Response, Unterminated LNA, RS = 50 Ω
0
–120
–100
–80
–60
–40
–20
100k 1M 10M 100M
CR
OSS
TALK
(dB
)
FREQUENCY (Hz)
0319
9-01
6
VOUT = 1V p-p
VGAIN = 1.0V
VGAIN = 0.7V
VGAIN = 0.4V
AD8332AD8334
Figure 16. Channel-to-Channel Crosstalk vs. Frequency for Various Values of VGAIN
50
0
5
10
15
20
25
30
35
40
45
100k 1M 10M 100M
GR
OU
P D
ELA
Y (n
s)
FREQUENCY (Hz)
0319
9-01
7
0.1µFCOUPLING
1µFCOUPLING
Figure 17. Group Delay vs. Frequency for Two Values of AC Coupling
0319
9-01
8
20
–20
–10
0
10
20–20
–10
0
10
0 0.1 0.2 0.3 0.4 0.5 0.6 0.7 0.8 0.9 1.0 1.1
OFF
SET
VOLT
AG
E (m
V)
VGAIN (V)
T = +85°CT = +25°CT = –40°C
T = +85°CT = +25°CT = –40°C
HI GAIN
LO GAIN
Figure 18. Representative Differential Output Offset Voltage vs.
VGAIN at Three Temperatures

AD8331/AD8332/AD8334 Data Sheet
Rev. I | Page 14 of 55
0319
9-01
9
35SAMPLE SIZE = 1000.2V < VGAIN < 0.7V
0
5
10
15
20
25
30
49.6 50.550.450.350.250.150.049.949.849.7
% T
OT
AL
GAIN SCALING FACTOR
Figure 19. Gain Scaling Factor Histogram
0319
9-02
0
100
10
1
0.1100k 100M10M1M
OU
TP
UT
IM
PE
DA
NC
E (Ω
)
FREQUENCY (Hz)
SINGLE ENDED, PIN VOH OR PIN VOLRL = ∞
Figure 20. Output Impedance vs. Frequency
0319
9-02
1
10k
1k
100
10100k 100M10M1M
INP
UT
IM
PE
DA
NC
E (Ω
)
FREQUENCY (Hz)
RIZ = 6.65kΩ, CSH = 0pF
RIZ = 3.01kΩ, CSH = 0pF
RIZ = 1.1kΩ, CSH = 1.2pF
RIZ = 549Ω, CSH = 8.2pF
RIZ = 412Ω, CSH = 12pF
RIZ = 270Ω, CSH = 22pF
RIZ = ∞, CSH = 0pF
Figure 21. LNA Input Impedance vs. Frequency for Various Values of RIZ and CSH
RIN = 50Ω,RIZ = 270Ω
RIN = 75Ω,RIZ = 412Ω
RIN = 100Ω,RIZ = 549Ω RIN = 200Ω,
RIZ = 1.1kΩ
RIN = 6kΩ,RIZ =∞
0Ω 17Ω
100j
50j
–50j
–100j
25j
–25j
f = 100kHz
0319
9-02
2
Figure 22. Smith Chart, S11 vs. Frequency, 0.1 MHz to 200 MHz for Various Values of RIZ
20
15
10
5
0
–15
–10
–5
100k 1M 10M 100M 500M
GA
IN (
dB
)
FREQUENCY (Hz)
0319
9-02
3
VIN = 10mV p-p RIN = 50Ω
RIN = 75Ω
RIN = 100Ω
RIN = 200Ω
RIN = 500Ω
RIN = 1kΩ
Figure 23. LNA Frequency Response, Single-Ended, for Various Values of RIN
20
15
10
5
0
–15
–10
–5
100k 1M 10M 100M 500M
GA
IN (
dB
)
FREQUENCY (Hz)
0319
9-02
4RIZ = ∞
Figure 24. Frequency Response for Unterminated LNA, Single-Ended
Data Sheet AD8331/AD8332/AD8334
Rev. I | Page 15 of 55
500
400
300
200
100
00 0.2 0.4 0.6 0.8 1.0
OU
TP
UT
-RE
FE
RR
ED
NO
ISE
(n
V/
Hz)
VGAIN (V)
0319
9-02
5
HI GAIN
LO GAIN
AD8332AD8334
AD8331
f = 10MHz
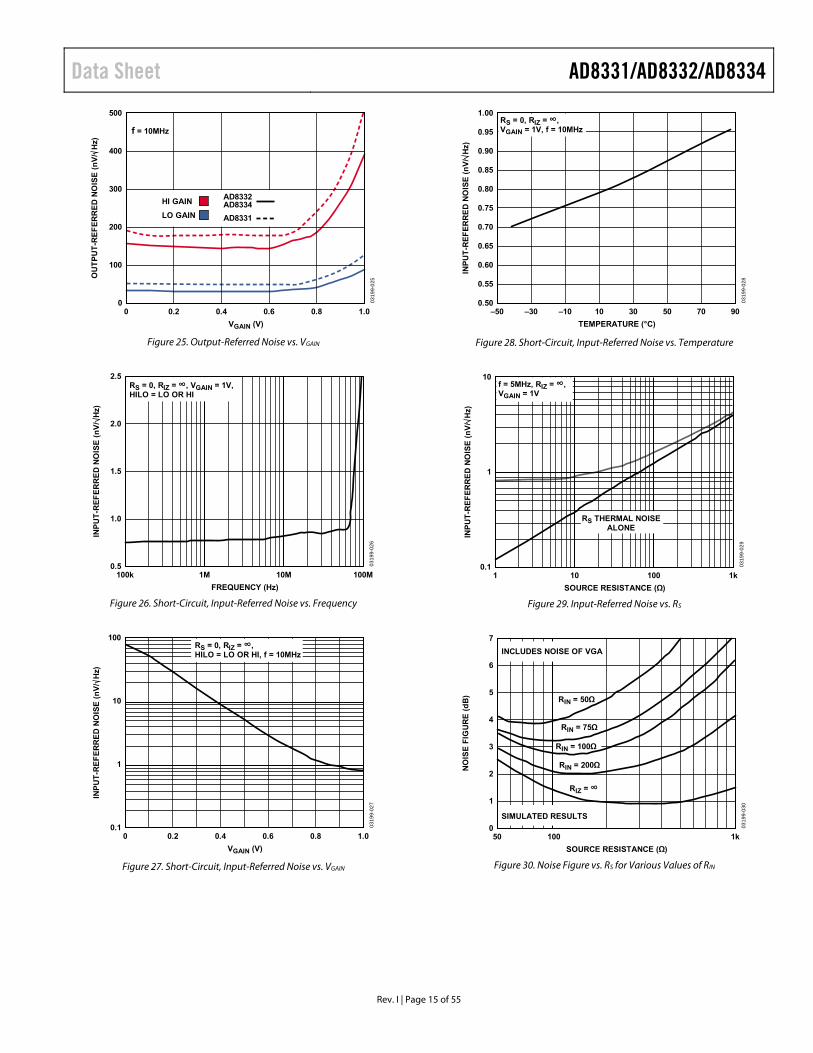
Figure 25. Output-Referred Noise vs. VGAIN
2.5
2.0
1.5
1.0
0.5100k 1M 10M 100M
FREQUENCY (Hz)
0319
9-02
6
RS = 0, RIZ = ∞, VGAIN = 1V,HILO = LO OR HI
INP
UT
-RE
FE
RR
ED
NO
ISE
(n
V/
Hz)
Figure 26. Short-Circuit, Input-Referred Noise vs. Frequency
100
10
1
0.10 0.2 0.4 0.6 0.8 1.0
VGAIN (V)
0319
9-02
7
RS = 0, RIZ = ∞,HILO = LO OR HI, f = 10MHz
INP
UT
-RE
FE
RR
ED
NO
ISE
(n
V/
Hz)
Figure 27. Short-Circuit, Input-Referred Noise vs. VGAIN
1.00
0.95
0.90
0.85
0.80
0.75
0.70
0.65
0.60
0.55
0.50–50 –30 –10 10 30 50 70 90
INP
UT
-RE
FE
RR
ED
NO
ISE
(n
V/
Hz)
TEMPERATURE (°C)
0319
9-02
8
RS = 0, RIZ =∞,VGAIN = 1V, f = 10MHz
Figure 28. Short-Circuit, Input-Referred Noise vs. Temperature
10
1
0.11 10 100 1k
SOURCE RESISTANCE (Ω)
0319
9-02
9
f = 5MHz, RIZ =∞,VGAIN = 1V
RS THERMAL NOISEALONE
INP
UT
-RE
FE
RR
ED
NO
ISE
(n
V/
Hz)
Figure 29. Input-Referred Noise vs. RS
7
6
5
4
3
2
1
050 100 1k
NO
ISE
FIG
UR
E (
dB
)
SOURCE RESISTANCE (Ω)
0319
9-03
0
INCLUDES NOISE OF VGA
RIN = 50Ω
RIN = 75Ω
RIN = 100Ω
RIN = 200Ω
RIZ = ∞
SIMULATED RESULTS
Figure 30. Noise Figure vs. RS for Various Values of RIN
AD8331/AD8332/AD8334 Data Sheet
Rev. I | Page 16 of 55
35
30
25
20
15
10
5
00 0.1 0.2 0.3 0.4 0.5 0.6 0.7 0.8 0.9 1.0 1.1
NO
ISE
FIG
UR
E (
dB
)
VGAIN (V)
0319
9-03
1
f = 10MHz, RS = 50ΩPREAMP LIMITED
HILO = LO, RIN = 50Ω
HILO = LO, RIZ = ∞HILO = HI, RIN = 50ΩHILO = HI, RIz = ∞
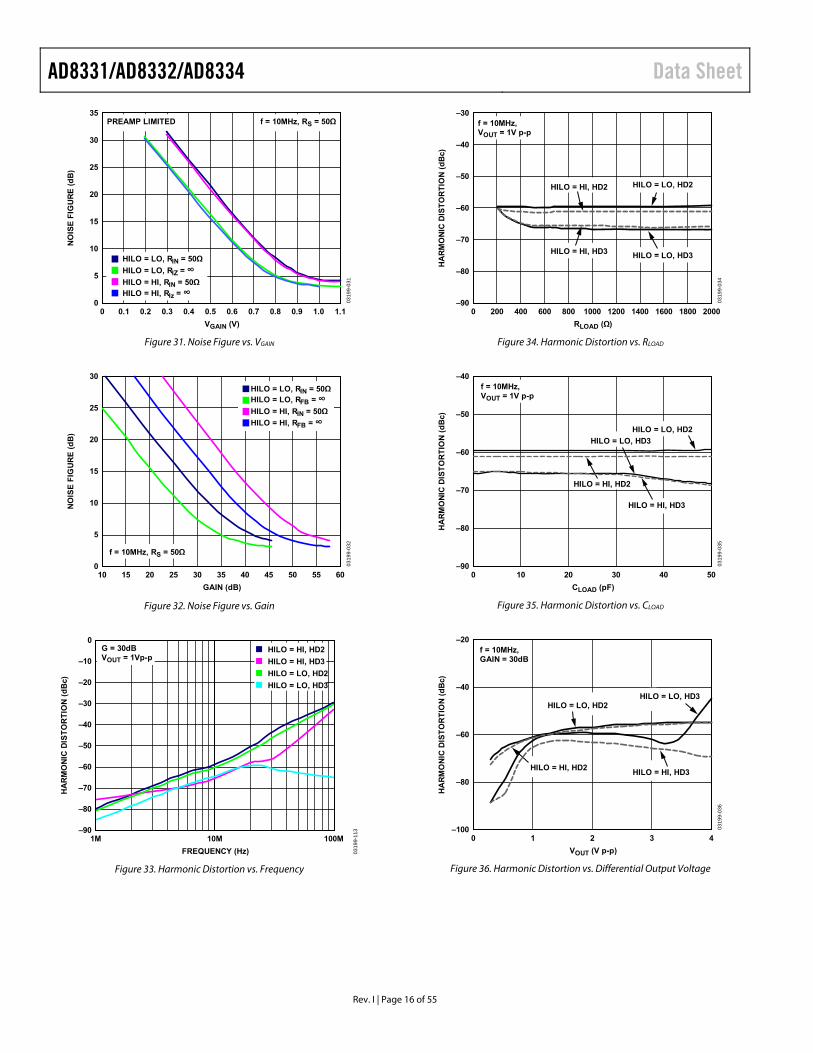
Figure 31. Noise Figure vs. VGAIN
30
25
20
15
10
5
010 15 20 25 30 35 40 45 50 55 60
NO
ISE
FIG
UR
E (
dB
)
GAIN (dB)
0319
9-03
2
f = 10MHz, RS = 50Ω
HILO = LO, RIN = 50ΩHILO = LO, RFB =∞HILO = HI, RIN = 50Ω
HILO = HI, RFB =∞
Figure 32. Noise Figure vs. Gain
0
–90
–80
–70
–60
–50
–40
–30
–20
–10
1M 10M 100M
HA
RM
ON
IC D
IST
OR
TIO
N (
dB
c)
FREQUENCY (Hz) 0319
9-11
3
G = 30dBVOUT = 1Vp-p
HILO = HI, HD2
HILO = HI, HD3
HILO = LO, HD2
HILO = LO, HD3
Figure 33. Harmonic Distortion vs. Frequency
–30
–40
–50
–60
–70
–80
–900 200018001600140012001000800600400200
HA
RM
ON
IC D
IST
OR
TIO
N (
dB
c)
RLOAD (Ω)
0319
9-03
4
HILO = LO, HD2
HILO = LO, HD3
HILO = HI, HD2
HILO = HI, HD3
f = 10MHz,VOUT = 1V p-p
Figure 34. Harmonic Distortion vs. RLOAD
–40
–50
–60
–70
–80
–900 10 20 30 40 50
HA
RM
ON
IC D
IST
OR
TIO
N (
dB
c)
CLOAD (pF)
0319
9-03
5
f = 10MHz,VOUT = 1V p-p
HILO = LO, HD2
HILO = LO, HD3
HILO = HI, HD2
HILO = HI, HD3
Figure 35. Harmonic Distortion vs. CLOAD
–20
–40
–60
–80
–1000 1 2 3 4
HA
RM
ON
IC D
IST
OR
TIO
N (
dB
c)
VOUT (V p-p)
0319
9-03
6
f = 10MHz,GAIN = 30dB
HILO = LO, HD2HILO = LO, HD3
HILO = HI, HD2HILO = HI, HD3
Figure 36. Harmonic Distortion vs. Differential Output Voltage
Data Sheet AD8331/AD8332/AD8334
Rev. I | Page 17 of 55
0
–20
–40
–60
–80
–120
–100
0 0.1 0.2 0.3 0.4 0.5 0.6 0.7 0.8 0.9 1.0
DIS
TO
RT
ION
(d
Bc)
VGAIN (V)
0319
9-03
7
VOUT = 1V p-p
INPUT RANGELIMITED WHENHILO = LO
HILO = LO, HD2
HILO = LO, HD3
HILO = HI, HD2
HILO = HI, HD3
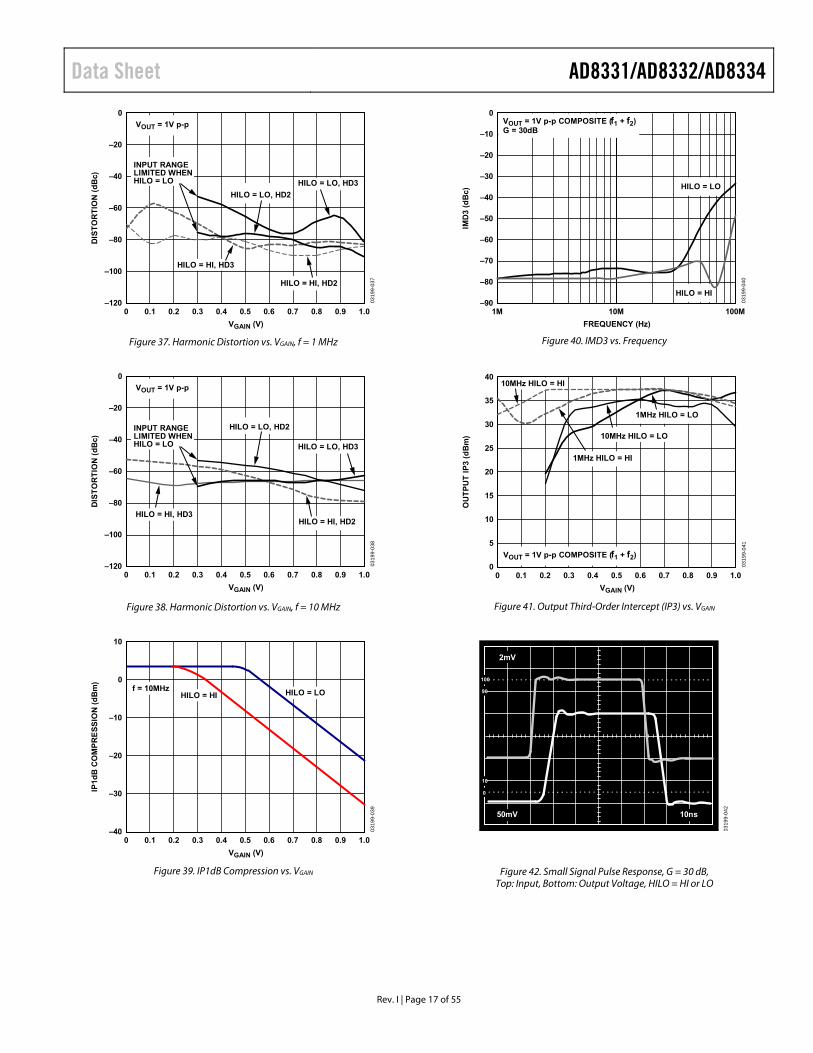
Figure 37. Harmonic Distortion vs. VGAIN, f = 1 MHz
0
–20
–40
–60
–80
–120
–100
0 0.1 0.2 0.3 0.4 0.5 0.6 0.7 0.8 0.9 1.0
DIS
TO
RT
ION
(d
Bc)
VGAIN (V)
0319
9-03
8
VOUT = 1V p-p
INPUT RANGELIMITED WHENHILO = LO
HILO = LO, HD2
HILO = LO, HD3
HILO = HI, HD2HILO = HI, HD3
Figure 38. Harmonic Distortion vs. VGAIN, f = 10 MHz
10
–10
0
–20
–30
–400 0.1 0.2 0.3 0.4 0.5 0.6 0.7 0.8 0.9 1.0
IP1d
B C
OM
PR
ES
SIO
N (
dB
m)
VGAIN (V)
0319
9-03
9
f = 10MHzHILO = HI HILO = LO
Figure 39. IP1dB Compression vs. VGAIN
0
–90
–80
–70
–60
–50
–40
–30
–20
–10
1M 10M 100M
IMD
3 (d
Bc)
FREQUENCY (Hz)
0319
9-04
0
VOUT = 1V p-p COMPOSITE (f1 + f2)G = 30dB
HILO = LO
HILO = HI
Figure 40. IMD3 vs. Frequency
40
35
30
25
20
15
10
5
00 1.00.90.80.70.60.50.40.30.20.1
OU
TP
UT
IP
3 (d
Bm
)
VGAIN (V)
0319
9-04
1
VOUT = 1V p-p COMPOSITE (f1 + f2)
1MHz HILO = HI
10MHz HILO = HI
1MHz HILO = LO
10MHz HILO = LO
Figure 41. Output Third-Order Intercept (IP3) vs. VGAIN
2mV
50mV 10ns
100
90
10
0
0319
9-04
2
Figure 42. Small Signal Pulse Response, G = 30 dB, Top: Input, Bottom: Output Voltage, HILO = HI or LO
AD8331/AD8332/AD8334 Data Sheet
Rev. I | Page 18 of 55
20mV
500mV 10ns
100
90
10
0
0319
9-04
3
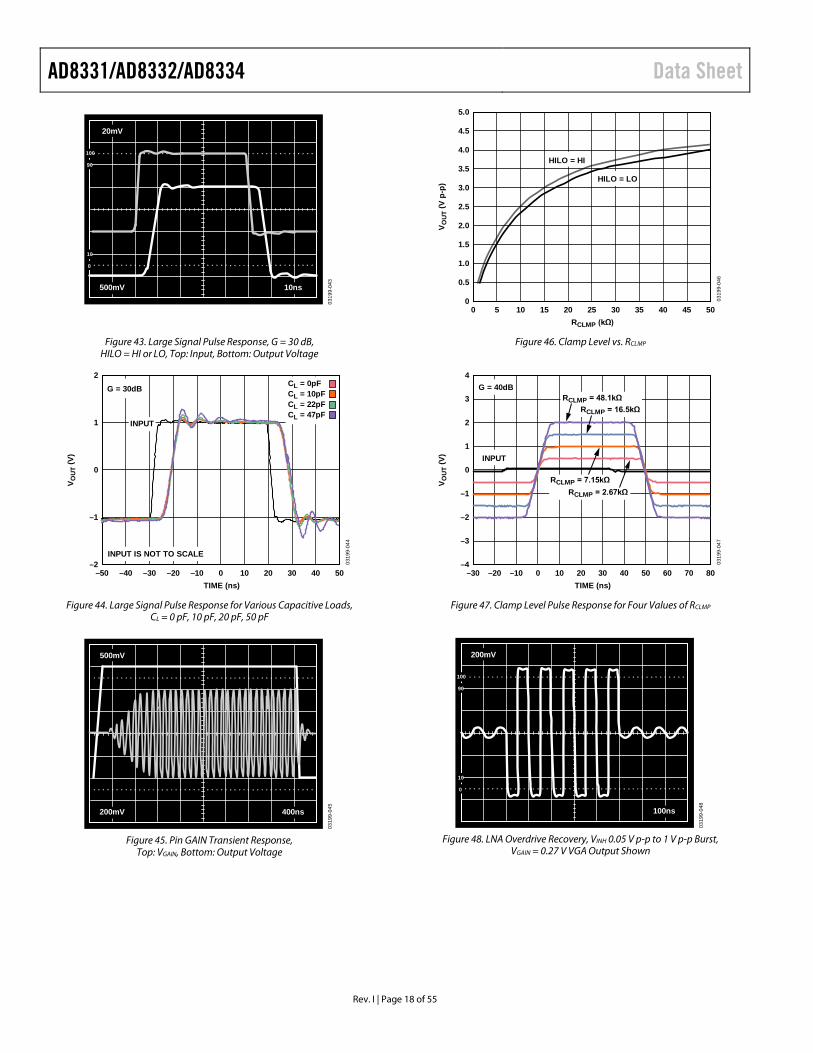
Figure 43. Large Signal Pulse Response, G = 30 dB, HILO = HI or LO, Top: Input, Bottom: Output Voltage
2
–2
–1
0
1
–50 50403020100–10–20–30–40
V OU
T (V
)
TIME (ns)
0319
9-04
4
G = 30dB
INPUT
INPUT IS NOT TO SCALE
CL = 0pFCL = 10pFCL = 22pFCL = 47pF
Figure 44. Large Signal Pulse Response for Various Capacitive Loads, CL = 0 pF, 10 pF, 20 pF, 50 pF
500mV
200mV 400ns
0319
9-04
5
Figure 45. Pin GAIN Transient Response,
Top: VGAIN, Bottom: Output Voltage
5.0
4.0
3.0
2.0
1.0
4.5
3.5
2.5
1.5
0.5
00 5045403530252015105
V OU
T (V
p-p
)
RCLMP (kΩ)
0319
9-04
6
HILO = HI
HILO = LO
Figure 46. Clamp Level vs. RCLMP
4
–4
–3
–2
–1
0
1
2
3
–30 –20 –10 0 10 20 30 40 50 60 70 80
V OU
T (V
)
TIME (ns)
0319
9-04
7
G = 40dB
INPUT
RCLMP = 48.1kΩRCLMP = 16.5kΩ
RCLMP = 7.15kΩRCLMP = 2.67kΩ
Figure 47. Clamp Level Pulse Response for Four Values of RCLMP
200mV
100ns
100
90
10
0
0319
9-04
8
Figure 48. LNA Overdrive Recovery, VINH 0.05 V p-p to 1 V p-p Burst,
VGAIN = 0.27 V VGA Output Shown
Data Sheet AD8331/AD8332/AD8334
Rev. I | Page 19 of 55
1V
100ns
100
90
10
0
0319
9-04
9
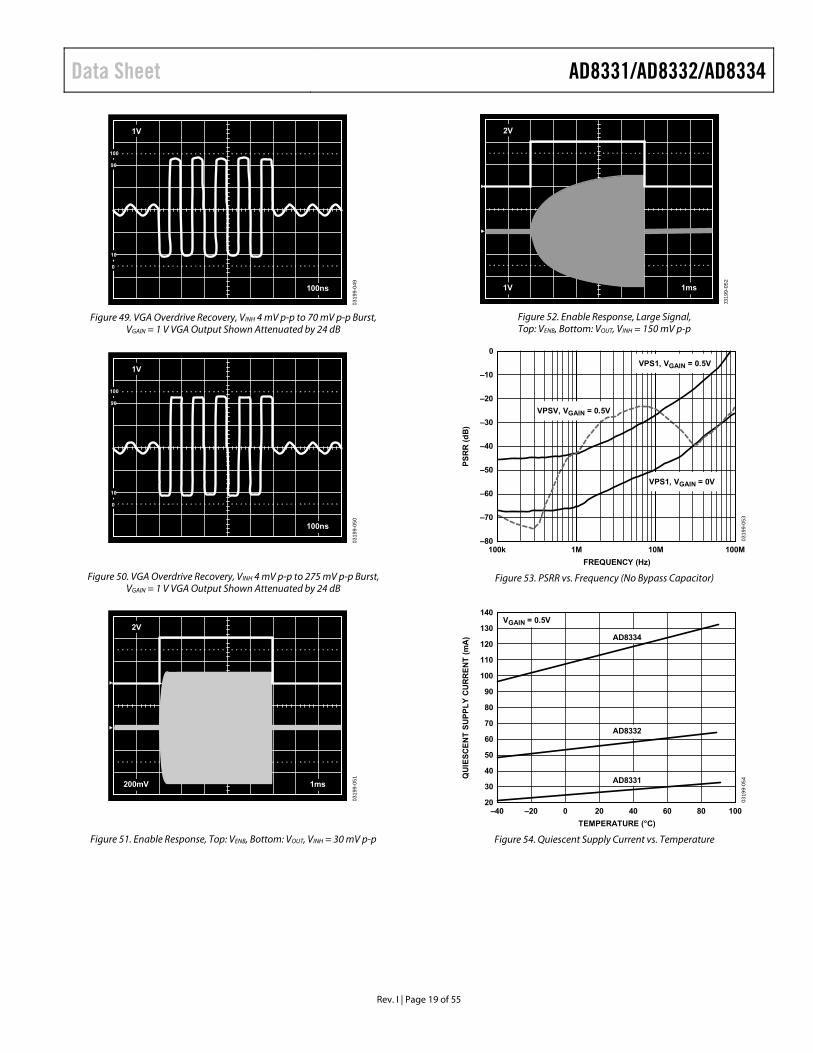
Figure 49. VGA Overdrive Recovery, VINH 4 mV p-p to 70 mV p-p Burst, VGAIN = 1 V VGA Output Shown Attenuated by 24 dB
1V
100ns
100
90
10
0
0319
9-05
0
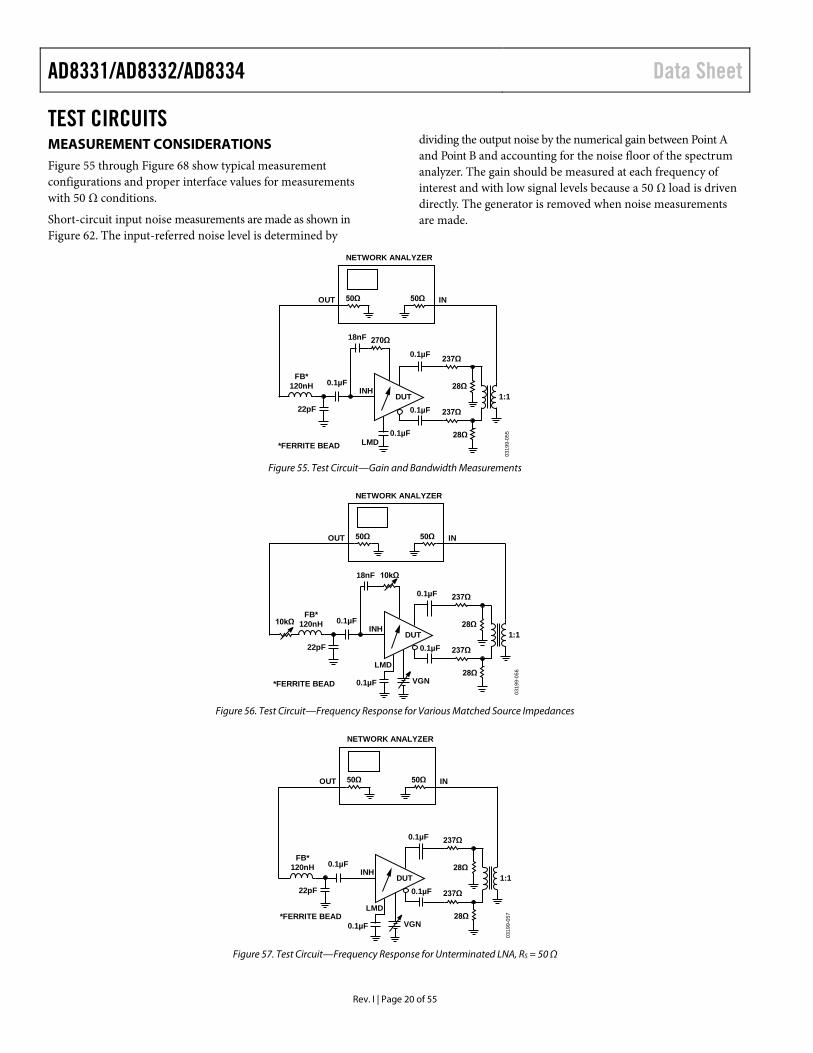
Figure 50. VGA Overdrive Recovery, VINH 4 mV p-p to 275 mV p-p Burst, VGAIN = 1 V VGA Output Shown Attenuated by 24 dB
2V
200mV 1ms
0319
9-05
1
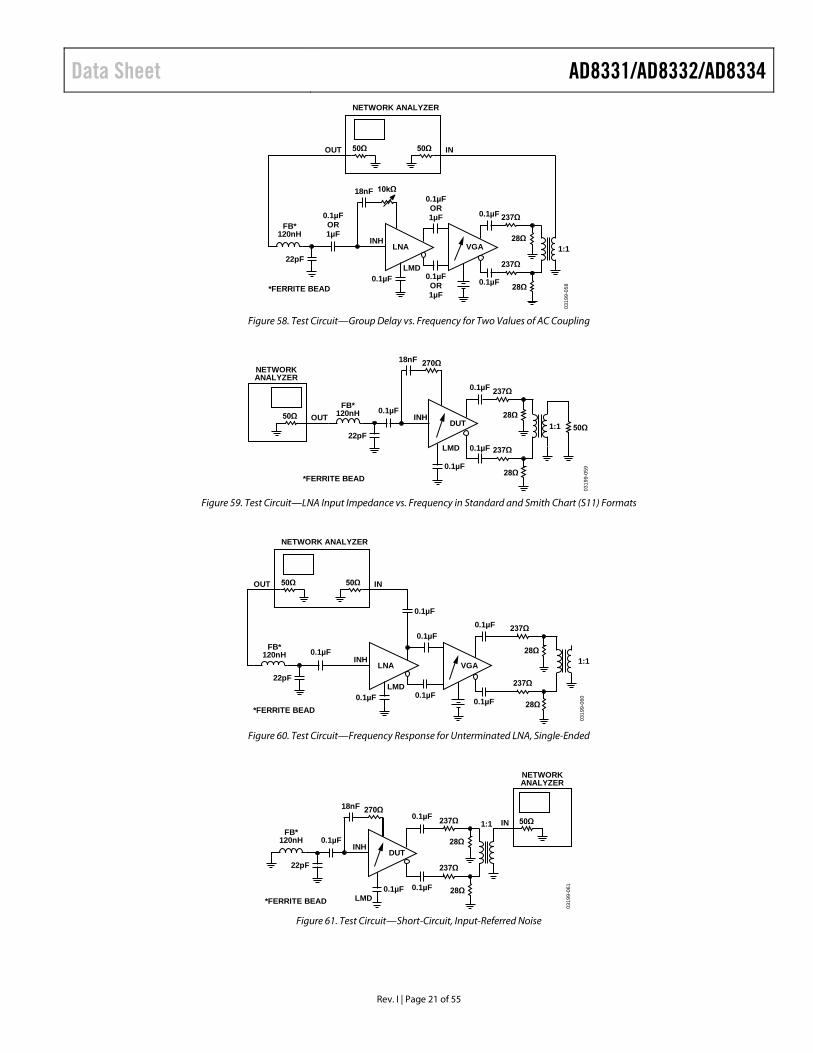
Figure 51. Enable Response, Top: VENB, Bottom: VOUT, VINH = 30 mV p-p
2V
1V 1ms
0319
9-05
2
Figure 52. Enable Response, Large Signal, Top: VENB, Bottom: VOUT, VINH = 150 mV p-p
0
–10
–20
–30
–40
–50
–60
–70
–80100k 1M 10M 100M
PS
RR
(d
B)
FREQUENCY (Hz)
0319
9-05
3
VPS1, VGAIN = 0.5V
VPSV, VGAIN = 0.5V
VPS1, VGAIN = 0V
Figure 53. PSRR vs. Frequency (No Bypass Capacitor)
140
130
120
110
100
90
80
70
60
50
40
30
20–40 100806040200–20
QU
IES
CE
NT
SU
PP
LY
CU
RR
EN
T (
mA
)
TEMPERATURE (°C)
0319
9-05
4
VGAIN = 0.5V
AD8334
AD8332
AD8331
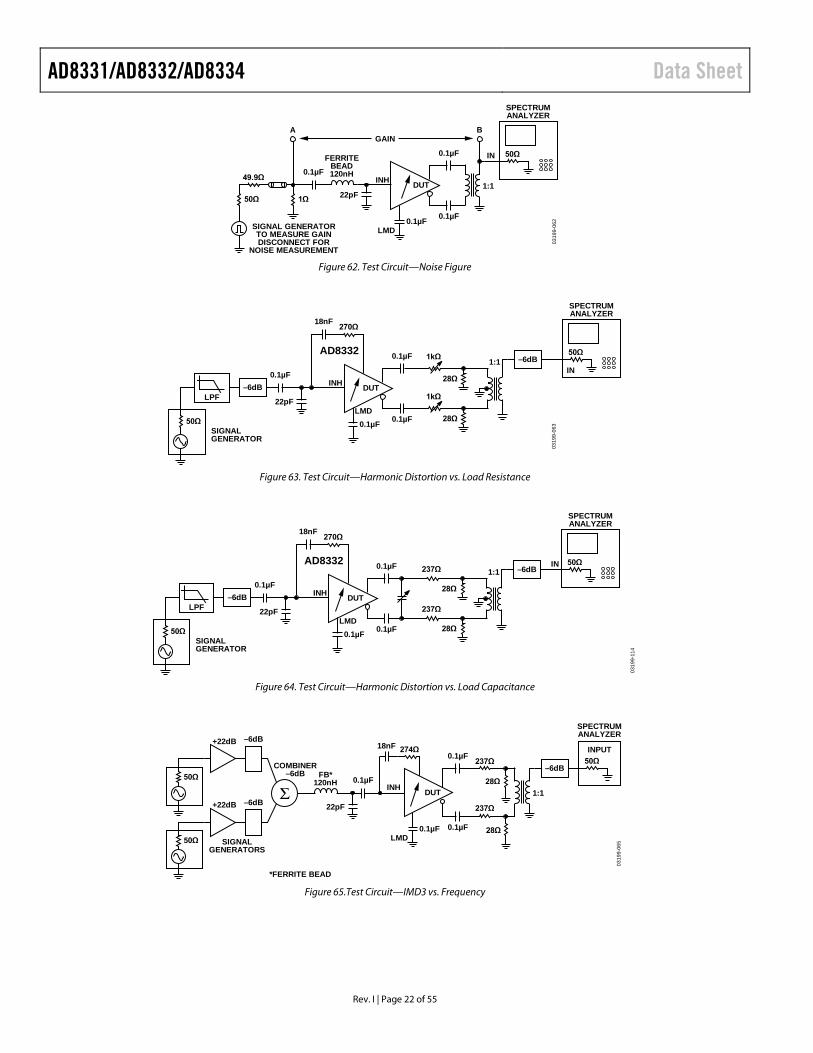
Figure 54. Quiescent Supply Current vs. Temperature
AD8331/AD8332/AD8334 Data Sheet
Rev. I | Page 20 of 55
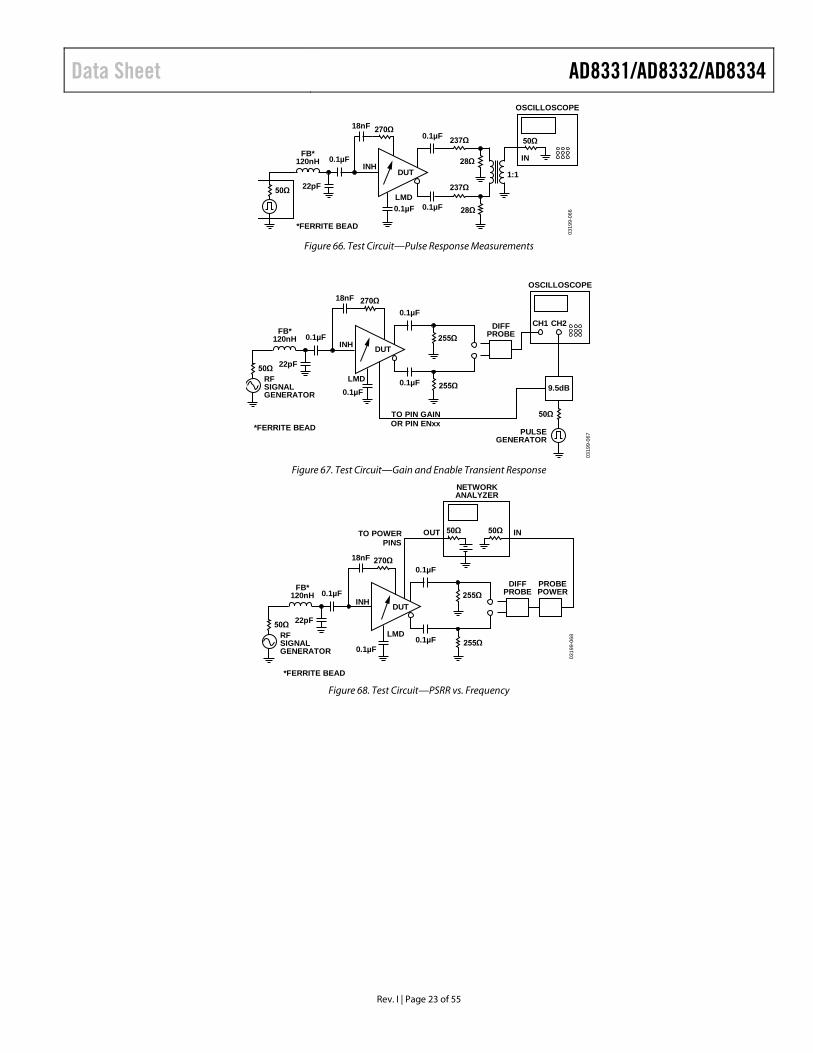
TEST CIRCUITS MEASUREMENT CONSIDERATIONS Figure 55 through Figure 68 show typical measurement configurations and proper interface values for measurements with 50 Ω conditions.
Short-circuit input noise measurements are made as shown in Figure 62. The input-referred noise level is determined by
dividing the output noise by the numerical gain between Point A and Point B and accounting for the noise floor of the spectrum analyzer. The gain should be measured at each frequency of interest and with low signal levels because a 50 Ω load is driven directly. The generator is removed when noise measurements are made.
0319
9-05
5
LMD
18nF
22pF
FB*120nH
*FERRITE BEAD
INOUT
0.1µF
DUT
NETWORK ANALYZER
0.1µF
28Ω
237Ω
28Ω1:1
50Ω50Ω
270Ω
INH
237Ω0.1µF
0.1µF
Figure 55. Test Circuit—Gain and Bandwidth Measurements
10kΩ
10kΩ
0319
9-05
6
LMD
18nF
22pF
FB*120nH
*FERRITE BEAD
INOUT
0.1µF VGN
DUT
NETWORK ANALYZER
0.1µF
28Ω
237Ω
28Ω1:1
50Ω50Ω
INH
237Ω0.1µF
0.1µF
Figure 56. Test Circuit—Frequency Response for Various Matched Source Impedances
0319
9-05
7
LMD
22pF
FB*120nH
*FERRITE BEAD
INOUT
0.1µF VGN
DUT
NETWORK ANALYZER
0.1µF
28Ω
237Ω
28Ω1:1
50Ω50Ω
INH
237Ω0.1µF
0.1µF
Figure 57. Test Circuit—Frequency Response for Unterminated LNA, RS = 50 Ω
Data Sheet AD8331/AD8332/AD8334
Rev. I | Page 21 of 55
0319
9-05
8
18nF
22pF
INOUT
NETWORK ANALYZER
28Ω
237Ω
28Ω1:1
50Ω50Ω
0.1µFOR1µF
237Ω
10kΩ
VGA
FB*120nH
*FERRITE BEAD
LMD0.1µF
LNA
0.1µFOR1µF
INH
0.1µFOR1µF 0.1µF
0.1µF
Figure 58. Test Circuit—Group Delay vs. Frequency for Two Values of AC Coupling
0319
9-05
9
18nF
22pF
28Ω
237Ω
28Ω0.1µF
237Ω
50Ω1:1OUT
NETWORKANALYZER
50Ω
270Ω
FB*120nH
*FERRITE BEAD
LMD
0.1µF
DUT
0.1µF
0.1µF
INH
Figure 59. Test Circuit—LNA Input Impedance vs. Frequency in Standard and Smith Chart (S11) Formats
0319
9-06
0
22pF
28Ω
237Ω
28Ω1:1
0.1µF
0.1µF
237Ω
INOUT
NETWORK ANALYZER
50Ω50Ω
VGALNA
FB*120nH
*FERRITE BEAD
LMD0.1µF 0.1µF
INH
0.1µF0.1µF
0.1µF
Figure 60. Test Circuit—Frequency Response for Unterminated LNA, Single-Ended
0319
9-06
1
18nF
22pF
28Ω
237Ω
28Ω0.1µFINH
237Ω 1:1 IN
NETWORKANALYZER
50Ω270Ω
FB*120nH
*FERRITE BEAD LMD0.1µF
DUT
0.1µF
0.1µF
Figure 61. Test Circuit—Short-Circuit, Input-Referred Noise
AD8331/AD8332/AD8334 Data Sheet
Rev. I | Page 22 of 55
0319
9-06
2
22pF
SIGNAL GENERATORTO MEASURE GAINDISCONNECT FOR
NOISE MEASUREMENT
GAIN
1:1
0.1µF
IN
SPECTRUMANALYZER
50Ω
BA
49.9Ω
50Ω 1Ω
FERRITEBEAD120nH
INH
LMD0.1µF 0.1µF
0.1µF
DUT
Figure 62. Test Circuit—Noise Figure
0319
9-06
3
22pF
AD83321:1
0.1µF IN
SPECTRUMANALYZER
50Ω
50ΩSIGNALGENERATOR
–6dB
–6dB28Ω
28Ω
1kΩ
1kΩ
18nF 270Ω
LPF
INH
LMD0.1µF 0.1µF
0.1µF
DUT
Figure 63. Test Circuit—Harmonic Distortion vs. Load Resistance
0319
9-11
4
22pF
AD83321:1
0.1µF
IN
SPECTRUMANALYZER
50Ω
50ΩSIGNALGENERATOR
–6dB
–6dB28Ω
28Ω
18nF 270Ω
LPF
INH
LMD0.1µF 0.1µF
0.1µF
DUT
237Ω
237Ω
Figure 64. Test Circuit—Harmonic Distortion vs. Load Capacitance
0319
9-06
5
INH0.1µF
SPECTRUMANALYZER
INPUT50Ω
22pF
–6dB
SIGNALGENERATORS
COMBINER–6dB50Ω
–6dB
50Ω
–6dB
+22dB
+22dB
FB*120nH
*FERRITE BEAD
18nF
28Ω
237Ω
237Ω
28Ω
274Ω
LMD0.1µF
DUT
0.1µF
0.1µF
1:1
Figure 65.Test Circuit—IMD3 vs. Frequency
Data Sheet AD8331/AD8332/AD8334
Rev. I | Page 23 of 55
0319
9-06
6
INH0.1µF
OSCILLOSCOPE
IN
50Ω
22pF50Ω
FB*120nH
*FERRITE BEAD
18nF
28Ω
237Ω
28Ω
237Ω
1:1
270Ω
LMD0.1µF
DUT
0.1µF
0.1µF
Figure 66. Test Circuit—Pulse Response Measurements
0319
9-06
7
INH
DIFFPROBE0.1µF
OSCILLOSCOPE
CH1 CH2
22pF
18nF 270Ω
RFSIGNALGENERATOR
TO PIN GAINOR PIN ENxx
50Ω
50Ω
PULSEGENERATOR
9.5dB
FB*120nH
*FERRITE BEAD
255Ω
255Ω
LMD0.1µF
DUT
0.1µF
0.1µF
Figure 67. Test Circuit—Gain and Enable Transient Response
0319
9-06
8
INH
DIFFPROBE0.1µF
22pF
RFSIGNALGENERATOR
50Ω
PROBEPOWER
50Ω
NETWORKANALYZER
INOUT 50Ω
FB*120nH
*FERRITE BEAD
18nF 270Ω
255Ω
255Ω
LMD
0.1µF0.1µF
0.1µF
TO POWERPINS
DUT
Figure 68. Test Circuit—PSRR vs. Frequency
AD8331/AD8332/AD8334 Data Sheet
Rev. I | Page 24 of 55
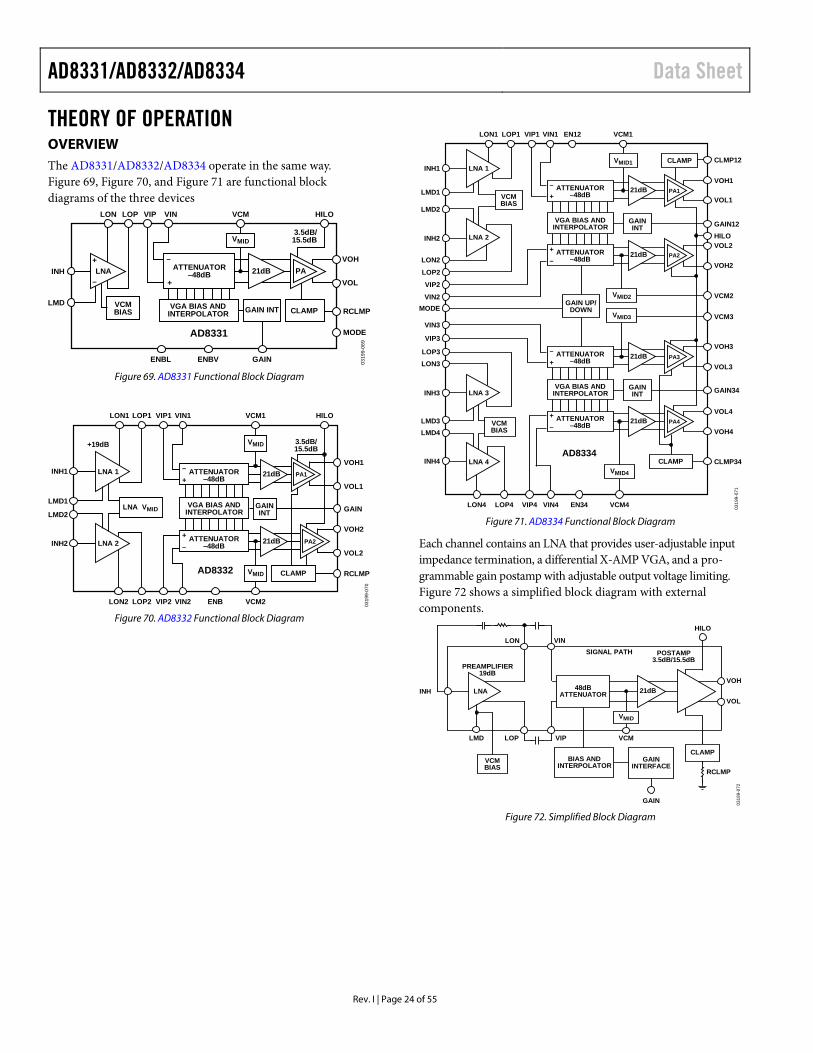
THEORY OF OPERATION OVERVIEW The AD8331/AD8332/AD8334 operate in the same way. Figure 69, Figure 70, and Figure 71 are functional block diagrams of the three devices
0319
9-06
9
VOL
VOHLNA ATTENUATOR
–48dB–
+INH
VINVIPLOPLON
ENBV GAIN
AD8331
+
–
MODE
HILO
3.5dB/15.5dB
RCLMP
VMID
VCM
VGA BIAS ANDINTERPOLATOR
ENBL
GAIN INTVCMBIAS
PA21dB
CLAMPLMD
Figure 69. AD8331 Functional Block Diagram
0319
9-07
0
LNA 2
LNA 1
+19dB
INH1
LON1 LOP1
LON2 LOP2
VIP1
VIP2
VIN1
VIN2
LMD1
LMD2
INH2
LNA VMID
PA1
PA2
– ATTENUATOR–48dB+
VGA BIAS ANDINTERPOLATOR
+ ATTENUATOR–48dB–
3.5dB/15.5dB
ENB
GAININT
VOH1
VOL1
VOH2
VOL2
GAIN
RCLMP
HILO
AD8332
VMID
VCM1
VMID
VCM2
CLAMP
21dB
21dB
Figure 70. AD8332 Functional Block Diagram
0319
9-07
1
CLAMP
LNA 2
LNA 1INH1
LON1 LOP1 VIP1 VIN1 EN12
INH2
LON2
LOP2
VIP2
PA2
– ATTENUATOR–48dB+
VGA BIAS ANDINTERPOLATOR
+ ATTENUATOR–48dB–
GAIN UP/DOWN
VMID1 CLAMP
GAININT
VOH1
CLMP12
VOL1
VOL2
GAIN12HILO
VOH2
VIN2MODE
VCM1
VMID2
VMID3
VCM2
VCM3
VMID4
LNA 4
LNA 3INH3
LON3LOP3
LMD3LMD4
INH4
VCMBIAS
VCMBIAS
PA3
PA4
– ATTENUATOR–48dB+
VGA BIAS ANDINTERPOLATOR
+ ATTENUATOR–48dB–
GAININT
VOH3
VOL3
VOL4
GAIN34
VOH4
CLMP34
21dB
21dB
21dB
21dB
VIP3
VIN3
VCM4EN34VIN4VIP4LON4 LOP4
AD8334
LMD1
LMD2
PA1
Figure 71. AD8334 Functional Block Diagram
Each channel contains an LNA that provides user-adjustable input impedance termination, a differential X-AMP VGA, and a pro-grammable gain postamp with adjustable output voltage limiting. Figure 72 shows a simplified block diagram with external components.
0319
9-07
2
LNAVOL
VOH
HILO
INH
LMD LOP
LON
PREAMPLIFIER19dB
POSTAMP3.5dB/15.5dB
SIGNAL PATH
BIAS ANDINTERPOLATOR
VIN
VIP
RCLMP
21dB
VCM
VMID
CLAMP
48dBATTENUATOR
GAININTERFACE
GAIN
VCMBIAS
Figure 72. Simplified Block Diagram
Data Sheet AD8331/AD8332/AD8334
Rev. I | Page 25 of 55
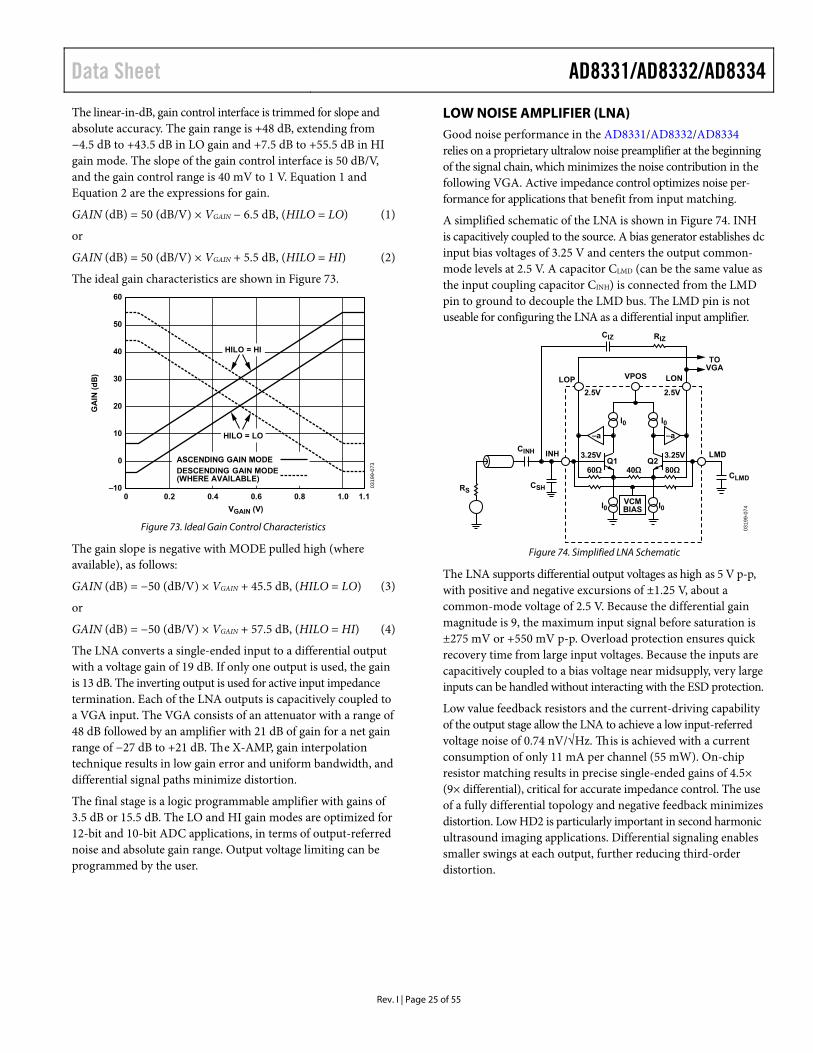
The linear-in-dB, gain control interface is trimmed for slope and absolute accuracy. The gain range is +48 dB, extending from −4.5 dB to +43.5 dB in LO gain and +7.5 dB to +55.5 dB in HI gain mode. The slope of the gain control interface is 50 dB/V, and the gain control range is 40 mV to 1 V. Equation 1 and Equation 2 are the expressions for gain.
GAIN (dB) = 50 (dB/V) × VGAIN − 6.5 dB, (HILO = LO) (1)
or
GAIN (dB) = 50 (dB/V) × VGAIN + 5.5 dB, (HILO = HI) (2)
The ideal gain characteristics are shown in Figure 73. 60
50
40
30
20
10
0
–100 0.2 0.4 0.6 0.8 1.0 1.1
GA
IN (
dB
)
VGAIN (V)
0319
9-07
3
HILO = HI
HILO = LO
ASCENDING GAIN MODEDESCENDING GAIN MODE(WHERE AVAILABLE)
Figure 73. Ideal Gain Control Characteristics
The gain slope is negative with MODE pulled high (where available), as follows:
GAIN (dB) = −50 (dB/V) × VGAIN + 45.5 dB, (HILO = LO) (3)
or
GAIN (dB) = −50 (dB/V) × VGAIN + 57.5 dB, (HILO = HI) (4)
The LNA converts a single-ended input to a differential output with a voltage gain of 19 dB. If only one output is used, the gain is 13 dB. The inverting output is used for active input impedance termination. Each of the LNA outputs is capacitively coupled to a VGA input. The VGA consists of an attenuator with a range of 48 dB followed by an amplifier with 21 dB of gain for a net gain range of −27 dB to +21 dB. The X-AMP, gain interpolation technique results in low gain error and uniform bandwidth, and differential signal paths minimize distortion.
The final stage is a logic programmable amplifier with gains of 3.5 dB or 15.5 dB. The LO and HI gain modes are optimized for 12-bit and 10-bit ADC applications, in terms of output-referred noise and absolute gain range. Output voltage limiting can be programmed by the user.
LOW NOISE AMPLIFIER (LNA) Good noise performance in the AD8331/AD8332/AD8334 relies on a proprietary ultralow noise preamplifier at the beginning of the signal chain, which minimizes the noise contribution in the following VGA. Active impedance control optimizes noise per-formance for applications that benefit from input matching.
A simplified schematic of the LNA is shown in Figure 74. INH is capacitively coupled to the source. A bias generator establishes dc input bias voltages of 3.25 V and centers the output common-mode levels at 2.5 V. A capacitor CLMD (can be the same value as the input coupling capacitor CINH) is connected from the LMD pin to ground to decouple the LMD bus. The LMD pin is not useable for configuring the LNA as a differential input amplifier.
0319
9-07
4
RS
CINH
CSH
I0
I0 I0
I0
Q1 Q2
VPOS
VCMBIAS
LOP
INH 3.25V 3.25V
–a –a
LON
TOVGA
2.5V 2.5V
CLMD
LMD
CIZ RIZ
60Ω 40Ω 80Ω
Figure 74. Simplified LNA Schematic
The LNA supports differential output voltages as high as 5 V p-p, with positive and negative excursions of ±1.25 V, about a common-mode voltage of 2.5 V. Because the differential gain magnitude is 9, the maximum input signal before saturation is ±275 mV or +550 mV p-p. Overload protection ensures quick recovery time from large input voltages. Because the inputs are capacitively coupled to a bias voltage near midsupply, very large inputs can be handled without interacting with the ESD protection.
Low value feedback resistors and the current-driving capability of the output stage allow the LNA to achieve a low input-referred voltage noise of 0.74 nV/√Hz. This is achieved with a current consumption of only 11 mA per channel (55 mW). On-chip resistor matching results in precise single-ended gains of 4.5× (9× differential), critical for accurate impedance control. The use of a fully differential topology and negative feedback minimizes distortion. Low HD2 is particularly important in second harmonic ultrasound imaging applications. Differential signaling enables smaller swings at each output, further reducing third-order distortion.

AD8331/AD8332/AD8334 Data Sheet
Rev. I | Page 26 of 55
Active Impedance Matching
The LNA supports active impedance matching through an external shunt feedback resistor from Pin LON to Pin INH. The input resistance, RIN, is given in Equation 5, where A is the single-ended gain of 4.5, and 6 kΩ is the unterminated input impedance.
IZ
IZIZIN R
RA
RR
+×
=+
=kΩ33
kΩ6kΩ6
1 (5)
CIZ is needed in series with RIZ because the dc levels at Pin LON and Pin INH are unequal. Expressions for choosing RIZ in terms of RIN and for choosing CIZ are found in the Applications Information section. CSH and the ferrite bead enhance stability at higher frequencies, where the loop gain is diminished, and prevent peaking. Frequency response plots of the LNA are shown in Figure 23 and Figure 24. The bandwidth is approximately 130 MHz for matched input impedances of 50 Ω to 200 Ω and declines at higher source impedances. The unterminated bandwidth (when RIZ = ∞) is approximately 80 MHz.
Each output can drive external loads as low as 100 Ω in addition to the 100 Ω input impedance of the VGA (200 Ω differential). Capacitive loading up to 10 pF is permissible. All loads should be ac-coupled. Typically, Pin LOP output is used as a single-ended driver for auxiliary circuits, such as those used for Doppler ultrasound imaging. Pin LON drives RIZ. Alternatively, a differential external circuit can be driven from the two outputs in addition to the active feedback termination. In both cases, important stability considerations discussed in the Applications Information section should be carefully observed.
The impedance at each LNA output is 5 Ω. A 0.4 dB reduction in open circuit gain results when driving the VGA, and a 0.8 dB reduction results with an additional 100 Ω load at the output. The differential gain of the LNA is 6 dB higher. If the load is less than 200 Ω on either side, a compensating load is recommended on the opposite output.
LNA Noise
The input-referred voltage noise sets an important limit on system performance. The short-circuit input voltage noise of the LNA is 0.74 nV/√Hz or 0.82 nV/√Hz (at maximum gain), including the VGA noise. The open circuit, current noise is 2.5 pA/√Hz. These measurements, taken without a feedback resistor, provide the basis for calculating the input noise and noise figure performance of the configurations in Figure 75. Figure 76 and Figure 77 show simulations extracted from these results and the 4.1 dB noise figure (NF) measurement with the input actively matched to a 50 Ω source. Unterminated (RIZ = ∞) operation exhibits the lowest equivalent input noise and noise figure. Figure 76 shows the noise figure vs. source resistance, rising at low RS, where the LNA voltage noise is large compared to the source noise, and again at high RS due to current noise. The VGA input-referred voltage noise of 2.7 nV/√Hz is included in all of the curves.
VOUT
UNTERMINATED
+
–VIN
RINRS
VOUT
RESISTIVE TERMINATION
+
–VIN
RINRS
RS
VOUT
ACTIVE IMPEDANCE MATCH - RS = RIN
+
–VIN
RIN
RIZ
RIZ
1 + 4.5
RS
RIN = 0319
9-07
5
Figure 75. Input Configurations
7
6
5
4
3
2
1
050 100 1k
NO
ISE
FIG
UR
E (d
B)
RS (Ω)
0319
9-07
6
INCLUDES NOISE OF VGA
RESISTIVE TERMINATION(RS = RIN)
ACTIVE IMPEDANCE MATCH
UNTERMINATEDSIMULATION
Figure 76. Noise Figure vs. RS for Resistive, Active Match, and Unterminated Inputs
7
6
5
4
3
2
1
050 100 1k
NO
ISE
FIG
UR
E (d
B)
RS (Ω)
0319
9-07
7
INCLUDES NOISE OF VGA
RIN = 50Ω
RIN = 75Ω
RIN = 100Ω
RIN = 200Ω
RIZ = ∞
(SIMULATED RESULTS)
Figure 77. Noise Figure vs. RS for Various Fixed Values of RIN, Actively Matched
Data Sheet AD8331/AD8332/AD8334
Rev. I | Page 27 of 55
The primary purpose of input impedance matching is to improve the system transient response. With resistive termination, the input noise increases due to the thermal noise of the matching resistor and the increased contribution of the LNA input voltage noise generator. With active impedance matching, however, the contributions of both are smaller than they would be for resistive termination by a factor of 1/(1 + LNA Gain). Figure 76 shows their relative NF performance. In this graph, the input impedance is swept with RS to preserve the match at each point. The noise figures for a source impedance of 50 Ω are 7.1 dB, 4.1 dB, and 2.5 dB, respectively, for the resistive, active, and unterminated configurations. The noise figures for 200 Ω are 4.6 dB, 2.0 dB, and 1.0 dB, respectively.
Figure 77 is a plot of NF vs. RS for various values of RIN, which is helpful for design purposes. The plateau in the NF for actively matched inputs mitigates source impedance variations. For comparison purposes, a preamp with a gain of 19 dB and noise spectral density of 1.0 nV/√Hz, combined with a VGA with 3.75 nV/√Hz, yields a noise figure degradation of approximately 1.5 dB (for most input impedances), significantly worse than the AD8331/AD8332/AD8334 performance.
The equivalent input noise of the LNA is the same for single-ended and differential output applications. The LNA noise figure improves to 3.5 dB at 50 Ω without VGA noise, but this is exclusive of noise contributions from other external circuits connected to LOP. A series output resistor is usually recom-mended for stability purposes when driving external circuits on a separate board (see the Applications Information section). In low noise applications, a ferrite bead is even more desirable.
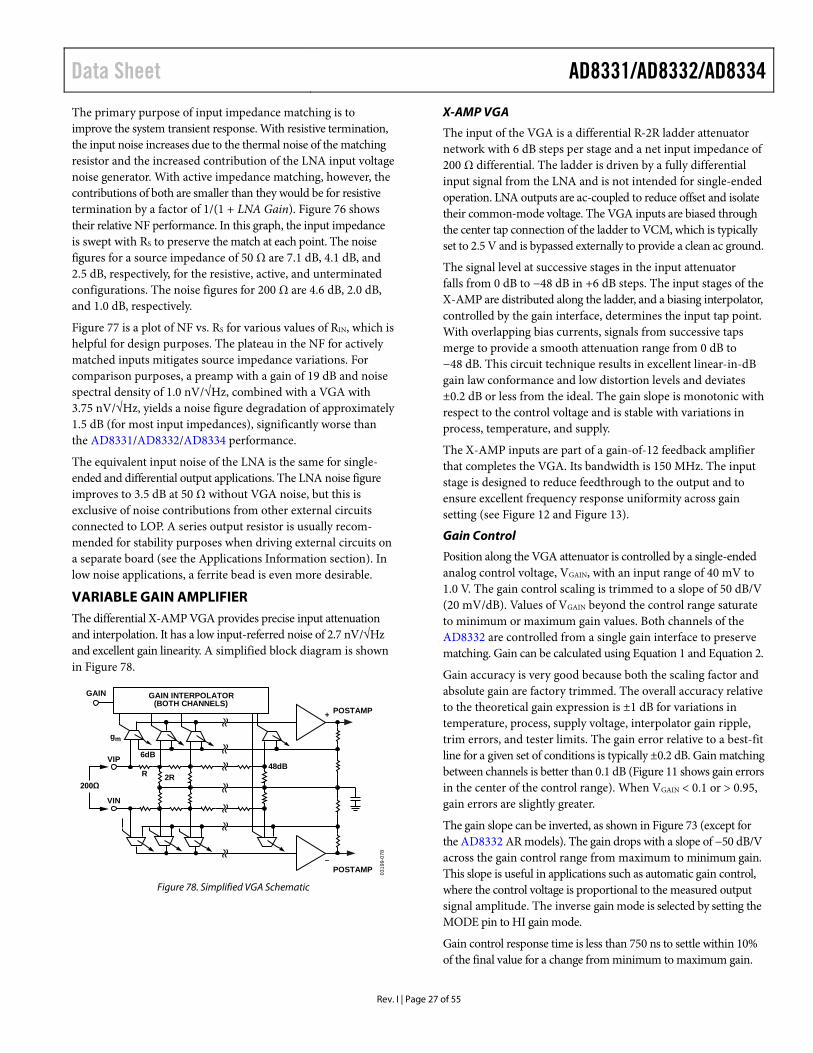
VARIABLE GAIN AMPLIFIER The differential X-AMP VGA provides precise input attenuation and interpolation. It has a low input-referred noise of 2.7 nV/√Hz and excellent gain linearity. A simplified block diagram is shown in Figure 78.
0319
9-07
8
VIP
GAIN
R
6dB
2R200Ω
48dB
VIN
gm
POSTAMP
POSTAMP+
–
GAIN INTERPOLATOR(BOTH CHANNELS)
Figure 78. Simplified VGA Schematic
X-AMP VGA
The input of the VGA is a differential R-2R ladder attenuator network with 6 dB steps per stage and a net input impedance of 200 Ω differential. The ladder is driven by a fully differential input signal from the LNA and is not intended for single-ended operation. LNA outputs are ac-coupled to reduce offset and isolate their common-mode voltage. The VGA inputs are biased through the center tap connection of the ladder to VCM, which is typically set to 2.5 V and is bypassed externally to provide a clean ac ground.
The signal level at successive stages in the input attenuator falls from 0 dB to −48 dB in +6 dB steps. The input stages of the X-AMP are distributed along the ladder, and a biasing interpolator, controlled by the gain interface, determines the input tap point. With overlapping bias currents, signals from successive taps merge to provide a smooth attenuation range from 0 dB to −48 dB. This circuit technique results in excellent linear-in-dB gain law conformance and low distortion levels and deviates ±0.2 dB or less from the ideal. The gain slope is monotonic with respect to the control voltage and is stable with variations in process, temperature, and supply.
The X-AMP inputs are part of a gain-of-12 feedback amplifier that completes the VGA. Its bandwidth is 150 MHz. The input stage is designed to reduce feedthrough to the output and to ensure excellent frequency response uniformity across gain setting (see Figure 12 and Figure 13).
Gain Control
Position along the VGA attenuator is controlled by a single-ended analog control voltage, VGAIN, with an input range of 40 mV to 1.0 V. The gain control scaling is trimmed to a slope of 50 dB/V (20 mV/dB). Values of VGAIN beyond the control range saturate to minimum or maximum gain values. Both channels of the AD8332 are controlled from a single gain interface to preserve matching. Gain can be calculated using Equation 1 and Equation 2.
Gain accuracy is very good because both the scaling factor and absolute gain are factory trimmed. The overall accuracy relative to the theoretical gain expression is ±1 dB for variations in temperature, process, supply voltage, interpolator gain ripple, trim errors, and tester limits. The gain error relative to a best-fit line for a given set of conditions is typically ±0.2 dB. Gain matching between channels is better than 0.1 dB (Figure 11 shows gain errors in the center of the control range). When VGAIN < 0.1 or > 0.95, gain errors are slightly greater.
The gain slope can be inverted, as shown in Figure 73 (except for the AD8332 AR models). The gain drops with a slope of −50 dB/V across the gain control range from maximum to minimum gain. This slope is useful in applications such as automatic gain control, where the control voltage is proportional to the measured output signal amplitude. The inverse gain mode is selected by setting the MODE pin to HI gain mode.
Gain control response time is less than 750 ns to settle within 10% of the final value for a change from minimum to maximum gain.
AD8331/AD8332/AD8334 Data Sheet
Rev. I | Page 28 of 55
VGA Noise
In a typical application, a VGA compresses a wide dynamic range input signal to within the input span of an ADC. While the input-referred noise of the LNA limits the minimum resolvable input signal, the output-referred noise, which depends primarily on the VGA, limits the maximum instantaneous dynamic range that can be processed at any one particular gain control voltage. This limit is set in accordance with the quantization noise floor of the ADC.
Output- and input-referred noise as a function of VGAIN are plotted in Figure 25 and Figure 27 for the short circuited input conditions. The input noise voltage is simply equal to the output noise divided by the measured gain at each point in the control range.
The output-referred noise is flat over most of the gain range because it is dominated by the fixed output-referred noise of the VGA. Values are 48 nV/√Hz in LO gain mode and 178 nV/√Hz in HI gain mode. At the high end of the gain control range, the noise of the LNA and the noise of the source prevail. The input-referred noise reaches its minimum value near the maximum gain control voltage, where the input-referred contribution of the VGA becomes very small.
At lower gains, the input-referred noise, and thus noise figure, increases as the gain decreases. The instantaneous dynamic range of the system is not lost, however, because the input capacity increases with it. The contribution of the ADC noise floor has the same dependence as well. The important relationship is the magnitude of the VGA output noise floor relative to that of the ADC.
With its low output-referred noise levels, these devices ideally drive low voltage ADCs. The converter noise floor drops 12 dB for every two bits of resolution and drops at lower input full-scale voltages and higher sampling rates. ADC quantization noise is discussed in the Applications Information section.
The preceding noise performance discussion applies to a differential VGA output signal. Although the LNA noise performance is the same in single-ended and differential applications, the VGA performance is not. The noise of the VGA is significantly higher in single-ended usage because the contribution of its bias noise is designed to cancel in the differential signal. A transformer can be used with single-ended applications when low noise is desired.
Gain control noise is a concern in very low noise applications. Thermal noise in the gain control interface can modulate the channel gain. The resultant noise is proportional to the output signal level and usually only evident when a large signal is present. Its effect is observable only in LO gain mode where the noise floor is substantially lower. The gain interface includes an on-chip noise filter, which reduces this effect significantly at frequencies above 5 MHz. Care should be taken to minimize noise impinging at the GAIN input. An external RC filter can be used to remove VGAIN source noise. The filter bandwidth should be sufficient to accommodate the desired control bandwidth.
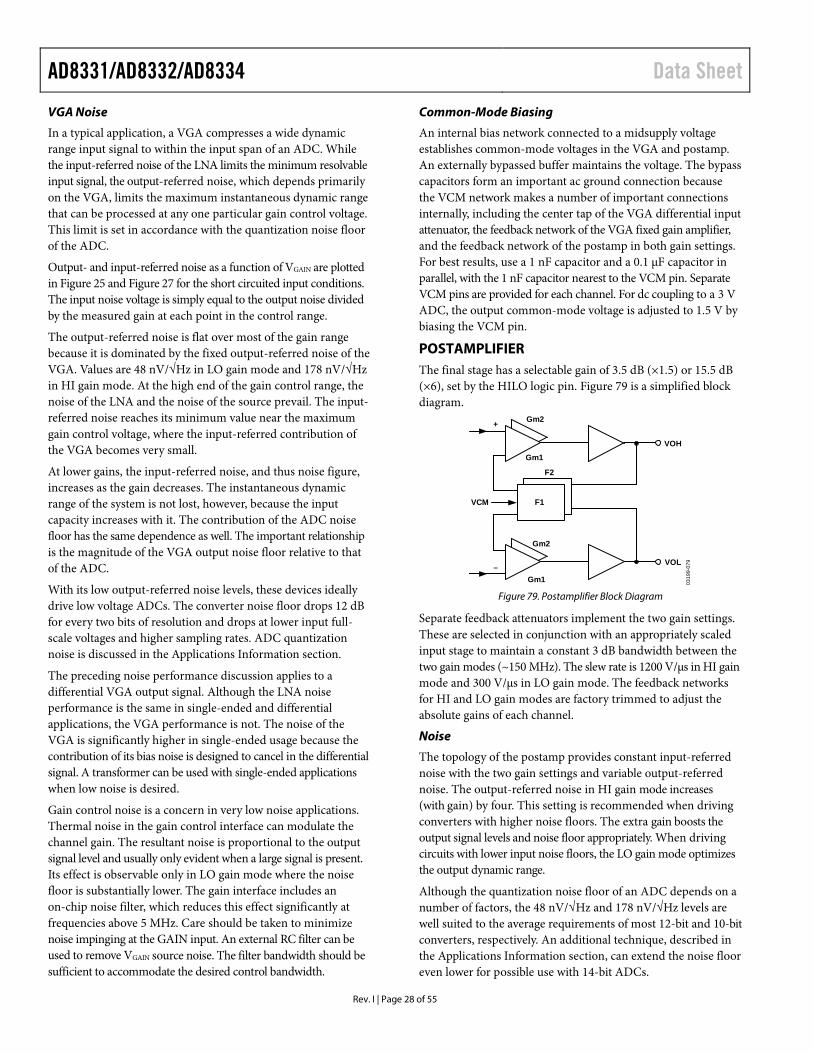
Common-Mode Biasing
An internal bias network connected to a midsupply voltage establishes common-mode voltages in the VGA and postamp. An externally bypassed buffer maintains the voltage. The bypass capacitors form an important ac ground connection because the VCM network makes a number of important connections internally, including the center tap of the VGA differential input attenuator, the feedback network of the VGA fixed gain amplifier, and the feedback network of the postamp in both gain settings. For best results, use a 1 nF capacitor and a 0.1 µF capacitor in parallel, with the 1 nF capacitor nearest to the VCM pin. Separate VCM pins are provided for each channel. For dc coupling to a 3 V ADC, the output common-mode voltage is adjusted to 1.5 V by biasing the VCM pin.
POSTAMPLIFIER The final stage has a selectable gain of 3.5 dB (×1.5) or 15.5 dB (×6), set by the HILO logic pin. Figure 79 is a simplified block diagram.
0319
9-07
9
Gm2+
–Gm1
VOH
VOL
VCM
Gm1
Gm2
F1
F2
Figure 79. Postamplifier Block Diagram
Separate feedback attenuators implement the two gain settings. These are selected in conjunction with an appropriately scaled input stage to maintain a constant 3 dB bandwidth between the two gain modes (~150 MHz). The slew rate is 1200 V/µs in HI gain mode and 300 V/µs in LO gain mode. The feedback networks for HI and LO gain modes are factory trimmed to adjust the absolute gains of each channel.
Noise
The topology of the postamp provides constant input-referred noise with the two gain settings and variable output-referred noise. The output-referred noise in HI gain mode increases (with gain) by four. This setting is recommended when driving converters with higher noise floors. The extra gain boosts the output signal levels and noise floor appropriately. When driving circuits with lower input noise floors, the LO gain mode optimizes the output dynamic range.
Although the quantization noise floor of an ADC depends on a number of factors, the 48 nV/√Hz and 178 nV/√Hz levels are well suited to the average requirements of most 12-bit and 10-bit converters, respectively. An additional technique, described in the Applications Information section, can extend the noise floor even lower for possible use with 14-bit ADCs.
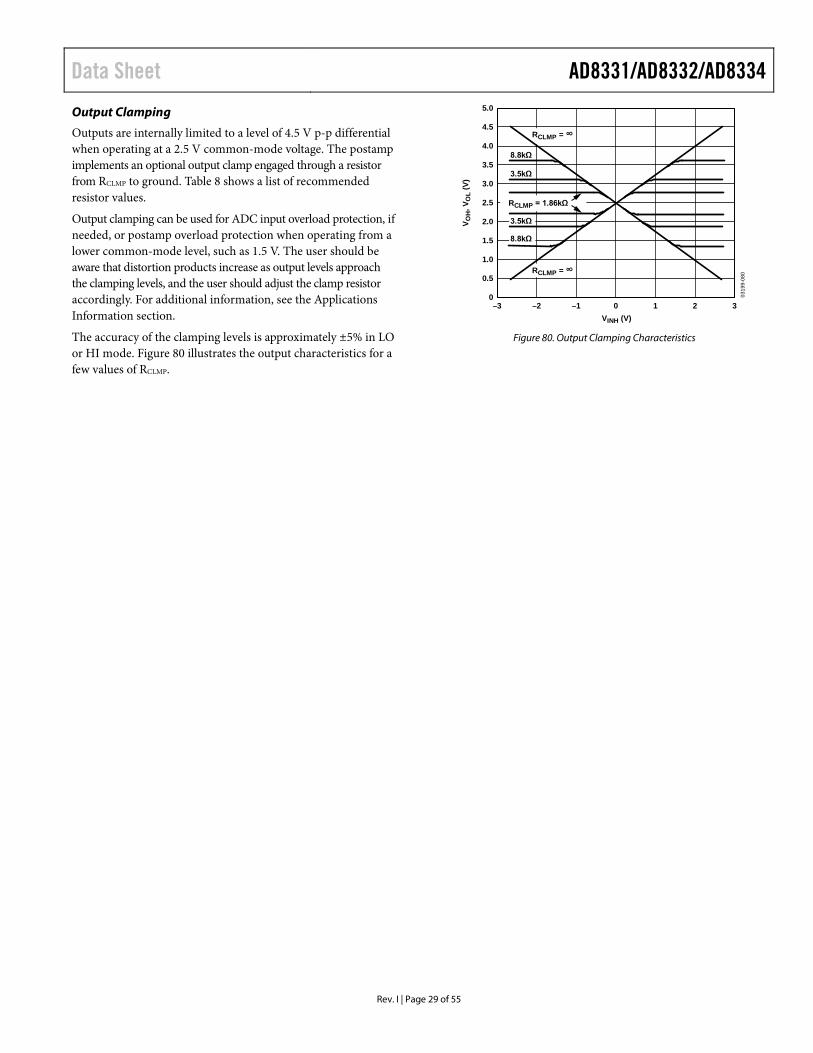
Data Sheet AD8331/AD8332/AD8334
Rev. I | Page 29 of 55
Output Clamping
Outputs are internally limited to a level of 4.5 V p-p differential when operating at a 2.5 V common-mode voltage. The postamp implements an optional output clamp engaged through a resistor from RCLMP to ground. Table 8 shows a list of recommended resistor values.
Output clamping can be used for ADC input overload protection, if needed, or postamp overload protection when operating from a lower common-mode level, such as 1.5 V. The user should be aware that distortion products increase as output levels approach the clamping levels, and the user should adjust the clamp resistor accordingly. For additional information, see the Applications Information section.
The accuracy of the clamping levels is approximately ±5% in LO or HI mode. Figure 80 illustrates the output characteristics for a few values of RCLMP.
5.0
4.5
4.0
3.5
3.0
2.5
2.0
1.5
1.0
0.5
0–3 –2 –1 0 1 2 3
V OH
, VO
L (V
)
VINH (V)
0319
9-08
0
RCLMP = ∞
RCLMP = ∞
8.8kΩ
8.8kΩ
3.5kΩ
3.5kΩ
RCLMP = 1.86kΩ
Figure 80. Output Clamping Characteristics
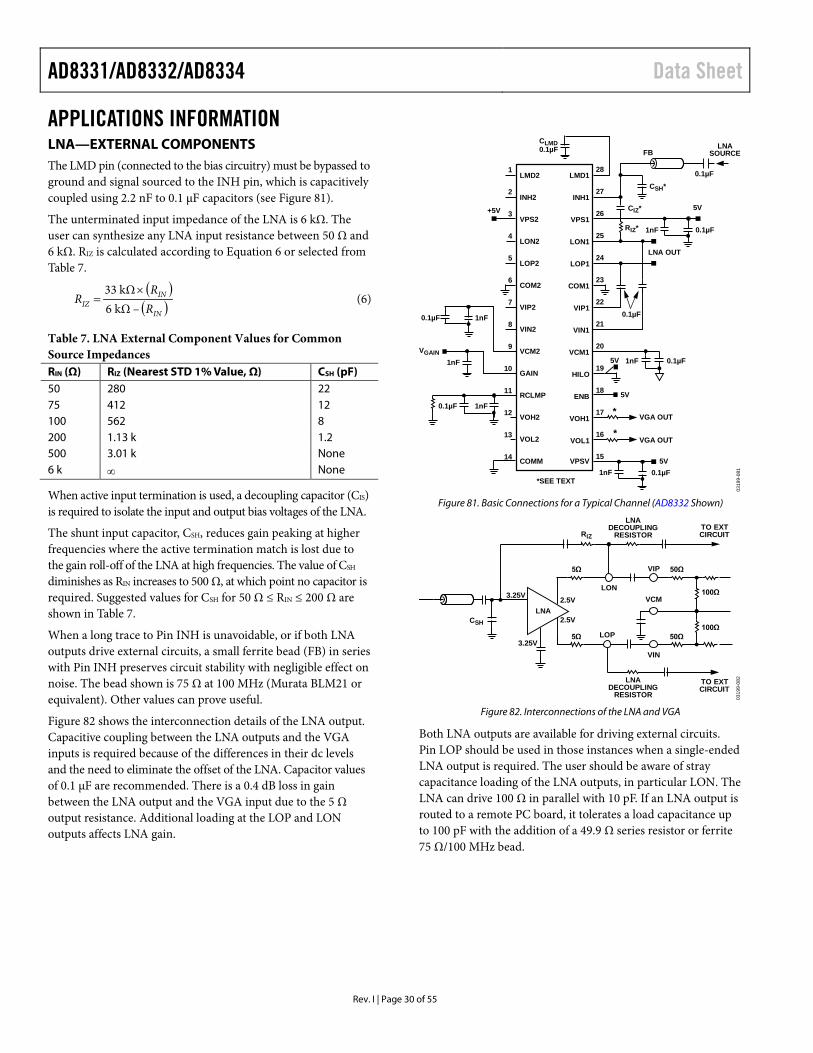
AD8331/AD8332/AD8334 Data Sheet
Rev. I | Page 30 of 55
APPLICATIONS INFORMATION LNA—EXTERNAL COMPONENTS The LMD pin (connected to the bias circuitry) must be bypassed to ground and signal sourced to the INH pin, which is capacitively coupled using 2.2 nF to 0.1 µF capacitors (see Figure 81).
The unterminated input impedance of the LNA is 6 kΩ. The user can synthesize any LNA input resistance between 50 Ω and 6 kΩ. RIZ is calculated according to Equation 6 or selected from Table 7.
( )( )IN
INIZ R
RR
–kΩ6kΩ33 ×
= (6)
Table 7. LNA External Component Values for Common Source Impedances RIN (Ω) RIZ (Nearest STD 1% Value, Ω) CSH (pF) 50 280 22 75 412 12 100 562 8 200 1.13 k 1.2 500 3.01 k None 6 k ∞ None
When active input termination is used, a decoupling capacitor (CIS) is required to isolate the input and output bias voltages of the LNA.
The shunt input capacitor, CSH, reduces gain peaking at higher frequencies where the active termination match is lost due to the gain roll-off of the LNA at high frequencies. The value of CSH diminishes as RIN increases to 500 Ω, at which point no capacitor is required. Suggested values for CSH for 50 Ω ≤ RIN ≤ 200 Ω are shown in Table 7.
When a long trace to Pin INH is unavoidable, or if both LNA outputs drive external circuits, a small ferrite bead (FB) in series with Pin INH preserves circuit stability with negligible effect on noise. The bead shown is 75 Ω at 100 MHz (Murata BLM21 or equivalent). Other values can prove useful.
Figure 82 shows the interconnection details of the LNA output. Capacitive coupling between the LNA outputs and the VGA inputs is required because of the differences in their dc levels and the need to eliminate the offset of the LNA. Capacitor values of 0.1 µF are recommended. There is a 0.4 dB loss in gain between the LNA output and the VGA input due to the 5 Ω output resistance. Additional loading at the LOP and LON outputs affects LNA gain.
21
22
23
24
28
25
26
27
15
16
20
17
18
19
8
7
6
5
1
4
3
2
14
13
9
12
11
10
VCM2
RCLMP
COMM
VOL2
VOH2
VIP2
GAIN
VIN2
LOP2
COM2
LMD2
LON2
VPS2
INH2
COM1
LOP1
LMD1
LON1
VPS1
INH1
VOH1
ENB
VIP1
VCM1
VIN1
VPSV
VOL1
HILO
0.1µF
CIZ*
CSH*
RIZ*
CLMD0.1µF
1nF
5V
5V
1nF
5V+5V
*
* VGA OUT
VGA OUT
5V
1nF0.1µF
LNA OUT
1nFVGAIN
FB
1nF0.1µF
0.1µF
0.1µF
0.1µF
1nF 0.1µF*SEE TEXT
0319
9-08
1
LNASOURCE
Figure 81. Basic Connections for a Typical Channel (AD8332 Shown)
0319
9-08
2
VIN
VIP
LOP
VCM100Ω
50Ω
100Ω
LON
RIZ
CSH
TO EXTCIRCUIT
TO EXTCIRCUIT
LNADECOUPLING
RESISTOR
LNADECOUPLING
RESISTOR
50Ω
5Ω
5Ω
LNA
3.25V
3.25V
2.5V
2.5V
Figure 82. Interconnections of the LNA and VGA
Both LNA outputs are available for driving external circuits. Pin LOP should be used in those instances when a single-ended LNA output is required. The user should be aware of stray capacitance loading of the LNA outputs, in particular LON. The LNA can drive 100 Ω in parallel with 10 pF. If an LNA output is routed to a remote PC board, it tolerates a load capacitance up to 100 pF with the addition of a 49.9 Ω series resistor or ferrite 75 Ω/100 MHz bead.
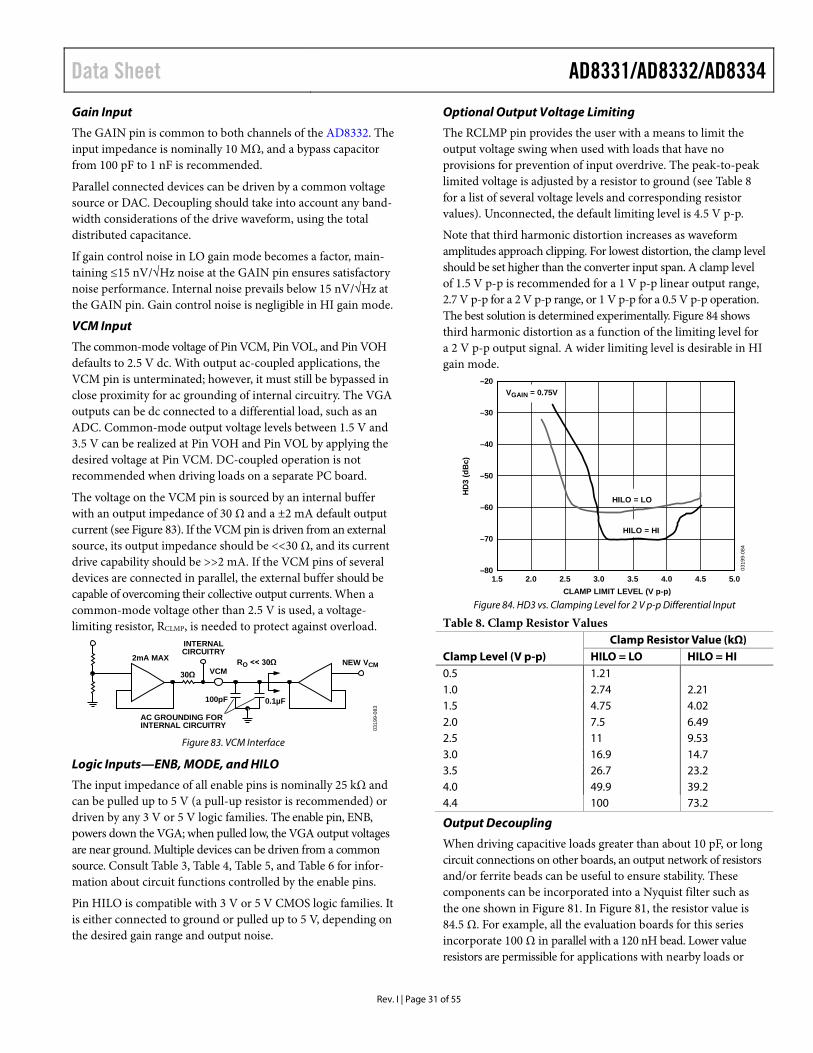
Data Sheet AD8331/AD8332/AD8334
Rev. I | Page 31 of 55
Gain Input
The GAIN pin is common to both channels of the AD8332. The input impedance is nominally 10 MΩ, and a bypass capacitor from 100 pF to 1 nF is recommended.
Parallel connected devices can be driven by a common voltage source or DAC. Decoupling should take into account any band-width considerations of the drive waveform, using the total distributed capacitance.
If gain control noise in LO gain mode becomes a factor, main-taining ≤15 nV/√Hz noise at the GAIN pin ensures satisfactory noise performance. Internal noise prevails below 15 nV/√Hz at the GAIN pin. Gain control noise is negligible in HI gain mode.
VCM Input
The common-mode voltage of Pin VCM, Pin VOL, and Pin VOH defaults to 2.5 V dc. With output ac-coupled applications, the VCM pin is unterminated; however, it must still be bypassed in close proximity for ac grounding of internal circuitry. The VGA outputs can be dc connected to a differential load, such as an ADC. Common-mode output voltage levels between 1.5 V and 3.5 V can be realized at Pin VOH and Pin VOL by applying the desired voltage at Pin VCM. DC-coupled operation is not recommended when driving loads on a separate PC board.
The voltage on the VCM pin is sourced by an internal buffer with an output impedance of 30 Ω and a ±2 mA default output current (see Figure 83). If the VCM pin is driven from an external source, its output impedance should be <<30 Ω, and its current drive capability should be >>2 mA. If the VCM pins of several devices are connected in parallel, the external buffer should be capable of overcoming their collective output currents. When a common-mode voltage other than 2.5 V is used, a voltage-limiting resistor, RCLMP, is needed to protect against overload.
0319
9-08
3
VCMNEW VCMRO << 30Ω
100pF
2mA MAX
30Ω
0.1µF
INTERNALCIRCUITRY
AC GROUNDING FORINTERNAL CIRCUITRY
Figure 83. VCM Interface
Logic Inputs—ENB, MODE, and HILO
The input impedance of all enable pins is nominally 25 kΩ and can be pulled up to 5 V (a pull-up resistor is recommended) or driven by any 3 V or 5 V logic families. The enable pin, ENB, powers down the VGA; when pulled low, the VGA output voltages are near ground. Multiple devices can be driven from a common source. Consult Table 3, Table 4, Table 5, and Table 6 for infor-mation about circuit functions controlled by the enable pins.
Pin HILO is compatible with 3 V or 5 V CMOS logic families. It is either connected to ground or pulled up to 5 V, depending on the desired gain range and output noise.
Optional Output Voltage Limiting
The RCLMP pin provides the user with a means to limit the output voltage swing when used with loads that have no provisions for prevention of input overdrive. The peak-to-peak limited voltage is adjusted by a resistor to ground (see Table 8 for a list of several voltage levels and corresponding resistor values). Unconnected, the default limiting level is 4.5 V p-p.
Note that third harmonic distortion increases as waveform amplitudes approach clipping. For lowest distortion, the clamp level should be set higher than the converter input span. A clamp level of 1.5 V p-p is recommended for a 1 V p-p linear output range, 2.7 V p-p for a 2 V p-p range, or 1 V p-p for a 0.5 V p-p operation. The best solution is determined experimentally. Figure 84 shows third harmonic distortion as a function of the limiting level for a 2 V p-p output signal. A wider limiting level is desirable in HI gain mode.
–20
–30
–40
–50
–60
–70
–801.5 2.0 2.5 3.0 4.03.5 4.5 5.0
HD
3 (d
Bc)
CLAMP LIMIT LEVEL (V p-p)
0319
9-08
4
VGAIN = 0.75V
HILO = LO
HILO = HI
Figure 84. HD3 vs. Clamping Level for 2 V p-p Differential Input
Table 8. Clamp Resistor Values
Clamp Level (V p-p) Clamp Resistor Value (kΩ)
HILO = LO HILO = HI 0.5 1.21 1.0 2.74 2.21 1.5 4.75 4.02 2.0 7.5 6.49 2.5 11 9.53 3.0 16.9 14.7 3.5 26.7 23.2 4.0 49.9 39.2 4.4 100 73.2
Output Decoupling
When driving capacitive loads greater than about 10 pF, or long circuit connections on other boards, an output network of resistors and/or ferrite beads can be useful to ensure stability. These components can be incorporated into a Nyquist filter such as the one shown in Figure 81. In Figure 81, the resistor value is 84.5 Ω. For example, all the evaluation boards for this series incorporate 100 Ω in parallel with a 120 nH bead. Lower value resistors are permissible for applications with nearby loads or
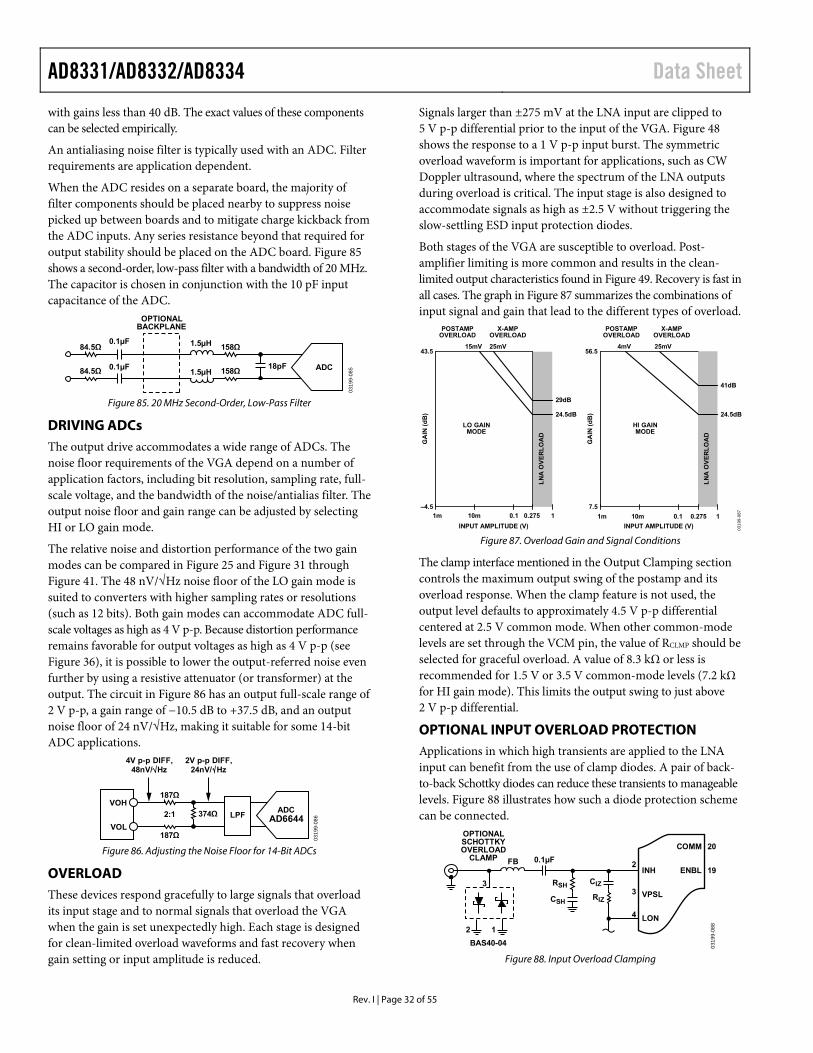
AD8331/AD8332/AD8334 Data Sheet
Rev. I | Page 32 of 55
with gains less than 40 dB. The exact values of these components can be selected empirically.
An antialiasing noise filter is typically used with an ADC. Filter requirements are application dependent.
When the ADC resides on a separate board, the majority of filter components should be placed nearby to suppress noise picked up between boards and to mitigate charge kickback from the ADC inputs. Any series resistance beyond that required for output stability should be placed on the ADC board. Figure 85 shows a second-order, low-pass filter with a bandwidth of 20 MHz. The capacitor is chosen in conjunction with the 10 pF input capacitance of the ADC.
0319
9-08
518pF
OPTIONALBACKPLANE
0.1µF
0.1µF ADC
84.5Ω
84.5Ω
158Ω
158Ω1.5µH
1.5µH
Figure 85. 20 MHz Second-Order, Low-Pass Filter
DRIVING ADCs The output drive accommodates a wide range of ADCs. The noise floor requirements of the VGA depend on a number of application factors, including bit resolution, sampling rate, full-scale voltage, and the bandwidth of the noise/antialias filter. The output noise floor and gain range can be adjusted by selecting HI or LO gain mode.
The relative noise and distortion performance of the two gain modes can be compared in Figure 25 and Figure 31 through Figure 41. The 48 nV/√Hz noise floor of the LO gain mode is suited to converters with higher sampling rates or resolutions (such as 12 bits). Both gain modes can accommodate ADC full-scale voltages as high as 4 V p-p. Because distortion performance remains favorable for output voltages as high as 4 V p-p (see Figure 36), it is possible to lower the output-referred noise even further by using a resistive attenuator (or transformer) at the output. The circuit in Figure 86 has an output full-scale range of 2 V p-p, a gain range of −10.5 dB to +37.5 dB, and an output noise floor of 24 nV/√Hz, making it suitable for some 14-bit ADC applications.
0319
9-08
6
ADCAD6644
187Ω
2:1
187Ω
374ΩVOH
VOL
LPF
4V p-p DIFF,48nV/ Hz
2V p-p DIFF,24nV/ Hz
Figure 86. Adjusting the Noise Floor for 14-Bit ADCs
OVERLOAD These devices respond gracefully to large signals that overload its input stage and to normal signals that overload the VGA when the gain is set unexpectedly high. Each stage is designed for clean-limited overload waveforms and fast recovery when gain setting or input amplitude is reduced.
Signals larger than ±275 mV at the LNA input are clipped to 5 V p-p differential prior to the input of the VGA. Figure 48 shows the response to a 1 V p-p input burst. The symmetric overload waveform is important for applications, such as CW Doppler ultrasound, where the spectrum of the LNA outputs during overload is critical. The input stage is also designed to accommodate signals as high as ±2.5 V without triggering the slow-settling ESD input protection diodes.
Both stages of the VGA are susceptible to overload. Post-amplifier limiting is more common and results in the clean-limited output characteristics found in Figure 49. Recovery is fast in all cases. The graph in Figure 87 summarizes the combinations of input signal and gain that lead to the different types of overload.
0319
9-08
7
GA
IN (
dB
)
1m
LO GAINMODE
15mV
–4.5
25mV
LN
A O
VE
RL
OA
D
X-AMPOVERLOAD
POSTAMPOVERLOAD
X-AMPOVERLOAD
POSTAMPOVERLOAD
29dB
43.5
INPUT AMPLITUDE (V)
0.2750.110m
24.5dB
GA
IN (
dB
)
HI GAINMODE
4mV
7.5
25mV
LN
A O
VE
RL
OA
D
41dB
56.5
INPUT AMPLITUDE (V)
24.5dB
1 1m 0.2750.110m 1
Figure 87. Overload Gain and Signal Conditions
The clamp interface mentioned in the Output Clamping section controls the maximum output swing of the postamp and its overload response. When the clamp feature is not used, the output level defaults to approximately 4.5 V p-p differential centered at 2.5 V common mode. When other common-mode levels are set through the VCM pin, the value of RCLMP should be selected for graceful overload. A value of 8.3 kΩ or less is recommended for 1.5 V or 3.5 V common-mode levels (7.2 kΩ for HI gain mode). This limits the output swing to just above 2 V p-p differential.
OPTIONAL INPUT OVERLOAD PROTECTION Applications in which high transients are applied to the LNA input can benefit from the use of clamp diodes. A pair of back-to-back Schottky diodes can reduce these transients to manageable levels. Figure 88 illustrates how such a diode protection scheme can be connected.
0319
9-08
8
20
19
4
3
2
LON
VPSL
INH
COMM
ENBL0.1µFFB
RSH CIZ
RIZCSH
2
3
1
OPTIONALSCHOTTKYOVERLOAD
CLAMP
BAS40-04 Figure 88. Input Overload Clamping
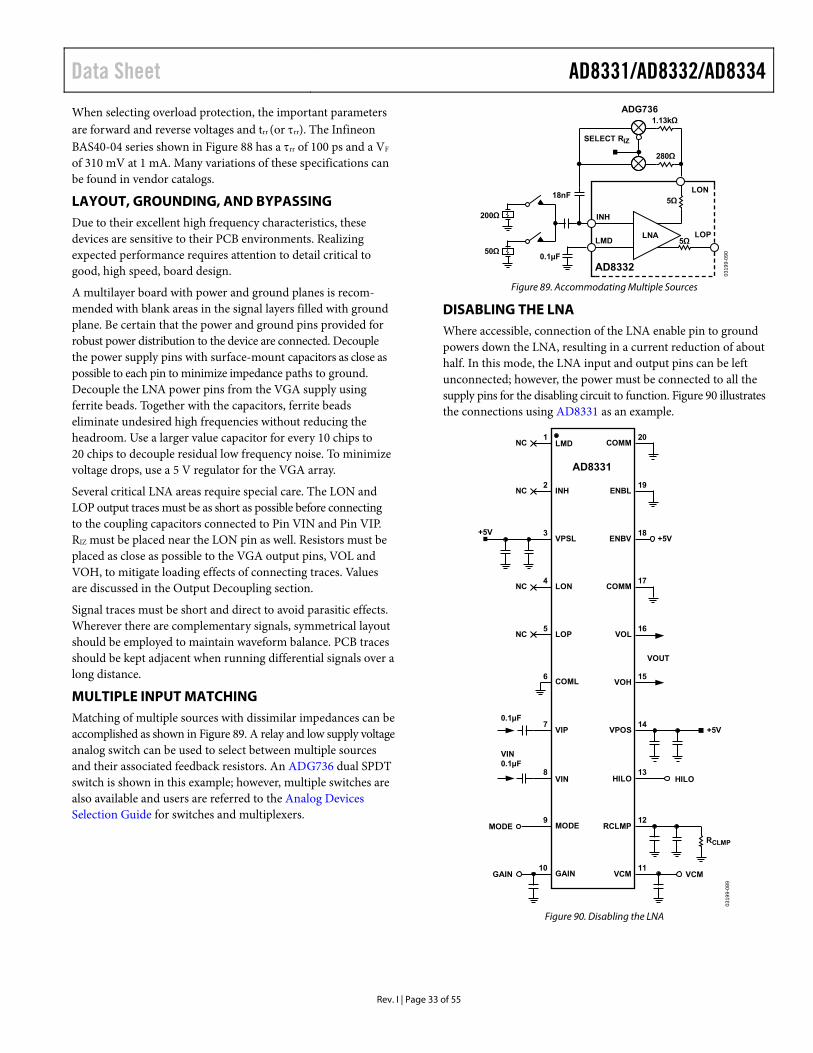
Data Sheet AD8331/AD8332/AD8334
Rev. I | Page 33 of 55
When selecting overload protection, the important parameters are forward and reverse voltages and trr (or rr). The Infineon BAS40-04 series shown in Figure 88 has a rr of 100 ps and a VF of 310 mV at 1 mA. Many variations of these specifications can be found in vendor catalogs.
LAYOUT, GROUNDING, AND BYPASSING Due to their excellent high frequency characteristics, these devices are sensitive to their PCB environments. Realizing expected performance requires attention to detail critical to good, high speed, board design.
A multilayer board with power and ground planes is recom-mended with blank areas in the signal layers filled with ground plane. Be certain that the power and ground pins provided for robust power distribution to the device are connected. Decouple the power supply pins with surface-mount capacitors as close as possible to each pin to minimize impedance paths to ground. Decouple the LNA power pins from the VGA supply using ferrite beads. Together with the capacitors, ferrite beads eliminate undesired high frequencies without reducing the headroom. Use a larger value capacitor for every 10 chips to 20 chips to decouple residual low frequency noise. To minimize voltage drops, use a 5 V regulator for the VGA array.
Several critical LNA areas require special care. The LON and LOP output traces must be as short as possible before connecting to the coupling capacitors connected to Pin VIN and Pin VIP. RIZ must be placed near the LON pin as well. Resistors must be placed as close as possible to the VGA output pins, VOL and VOH, to mitigate loading effects of connecting traces. Values are discussed in the Output Decoupling section.
Signal traces must be short and direct to avoid parasitic effects. Wherever there are complementary signals, symmetrical layout should be employed to maintain waveform balance. PCB traces should be kept adjacent when running differential signals over a long distance.
MULTIPLE INPUT MATCHING Matching of multiple sources with dissimilar impedances can be accomplished as shown in Figure 89. A relay and low supply voltage analog switch can be used to select between multiple sources and their associated feedback resistors. An ADG736 dual SPDT switch is shown in this example; however, multiple switches are also available and users are referred to the Analog Devices Selection Guide for switches and multiplexers.
0319
9-09
0
INH
LNA
5Ω
200Ω
50ΩLMD
LOP
ADG736
LON
0.1µF
18nF
280Ω
1.13kΩ
AD8332
5Ω
SELECT RIZ
Figure 89. Accommodating Multiple Sources
DISABLING THE LNA Where accessible, connection of the LNA enable pin to ground powers down the LNA, resulting in a current reduction of about half. In this mode, the LNA input and output pins can be left unconnected; however, the power must be connected to all the supply pins for the disabling circuit to function. Figure 90 illustrates the connections using AD8331 as an example.
0319
9-08
9
15
16
20
17
18
19
8
7
6
5
1
4
3
2
9
13
10
COMM
VIP
LOP
COML
LMD
LON
VPSL
INH
COMM
ENBV
ENBL
GAIN
0.1µF
HILO
+5V+5V
NC
VOH
VOL
VOUT
VPOS +5V14
11
12
VCM
RCLMP
NC
NC
NC
VIN0.1µF
AD8331
MODE
GAIN
MODE
VCM
HILOVIN
RCLMP
Figure 90. Disabling the LNA

AD8331/AD8332/AD8334 Data Sheet
Rev. I | Page 34 of 55
ULTRASOUND TGC APPLICATION The AD8332 ideally meets the requirements of medical and industrial ultrasound applications. The TGC amplifier is a key subsystem in such applications because it provides the means for echo location of reflected ultrasound energy.
Figure 91 through Figure 93 are schematics of a dual, fully differential system using the AD8332 and the AD9238 12-bit high speed ADC with conversion speeds as high as 65 MSPS.
HIGH DENSITY QUAD LAYOUT The AD8334 is the ideal solution for applications with limited board space. Figure 94 represents four channels routed to and away from this very compact quad VGA. Note that none of the signal paths crosses and that all four channels are spaced apart to eliminate crosstalk.
In this example, all of the components shown are 0402 size; however, the same layout is executable at the expense of slightly more board area. The sketch also assumes that both sides of the printed circuit board are available for components and that the bypass and power supply decoupling circuitry is located on the wiring side of the board.
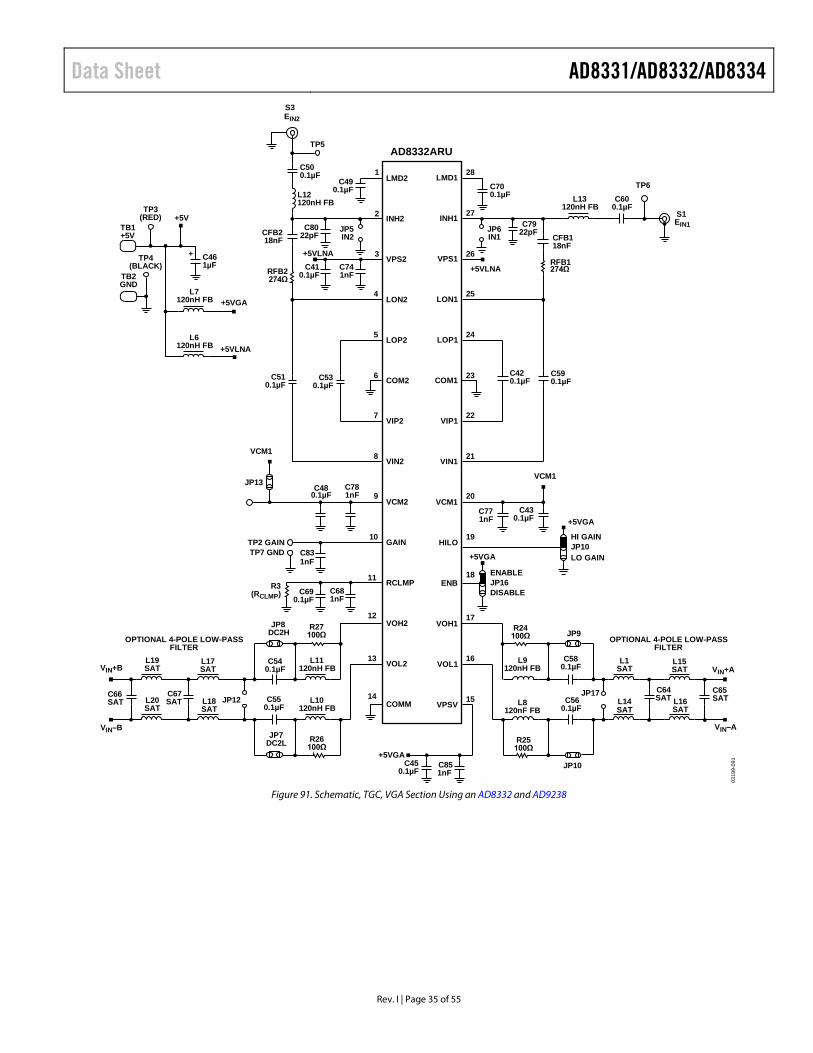
Data Sheet AD8331/AD8332/AD8334
Rev. I | Page 35 of 55
0319
9-09
1
+5VLNA
VOH1
21
25
VIN1
LON1
C781nF
C580.1µF
17
AD8332ARU
VIN+A
1C49
0.1µF
2C80
22pF
3
CFB118nF
C590.1µF
C410.1µF
C741nF
4
7
5
C530.1µF
VPS1 26
6 COM1 23
8
C510.1µF
27INH1 S1EIN1
C600.1µF
C7922pF
L13120nH FB
TP628LMD1
C700.1µF
14
9C48
0.1µF
10
C831nF
11R3
(RCLMP)
C540.1µF
C550.1µF
12
LMD2
INH2
VPS2
LON2
VIP2
LOP2
COM2
VIN2
COMM
VCM2
GAIN
RCLMP
VOH2
VOL213
JP12 VPSV 15
C450.1µF
C851nF
VOL1
C560.1µF
16
L8120nF FB
18ENB
+5VGA
19HILO
20VCM1
C430.1µF
C771nF
22
24
VIP1
LOP1
+5VLNA
VCM1
RFB1274ΩRFB2
274Ω
C500.1µF
S3EIN2
L12120nH FB
TP5
CFB218nF
C681nF
C690.1µF
R27100Ω
L11120nH FB
JP8DC2H
L10120nH FB
JP7DC2L R26
100Ω
+5VGA
ENABLE
HI GAIN
DISABLE
LO GAIN
L9120nH FB
R24100Ω JP9
JP10
JP17
TP2 GAIN
JP5IN2
JP6IN1
TP7 GND
L17SAT
L18SAT
L19SAT
L20SAT
C67SAT
C66SAT
L1SAT
L14SAT
L15SAT
L16SAT
C64SAT
C65SAT
OPTIONAL 4-POLE LOW-PASSFILTER
JP13
VCM1
+5VGA
JP10
JP16
R25100Ω
C420.1µF
VIN–A
TB1+5V
TB2GND
C461µF
+5VGAL7
120nH FB
L6120nH FB
TP4(BLACK)
TP3(RED)
+
+5VLNA
+5V
VIN+B
VIN–B
OPTIONAL 4-POLE LOW-PASSFILTER
Figure 91. Schematic, TGC, VGA Section Using an AD8332 and AD9238
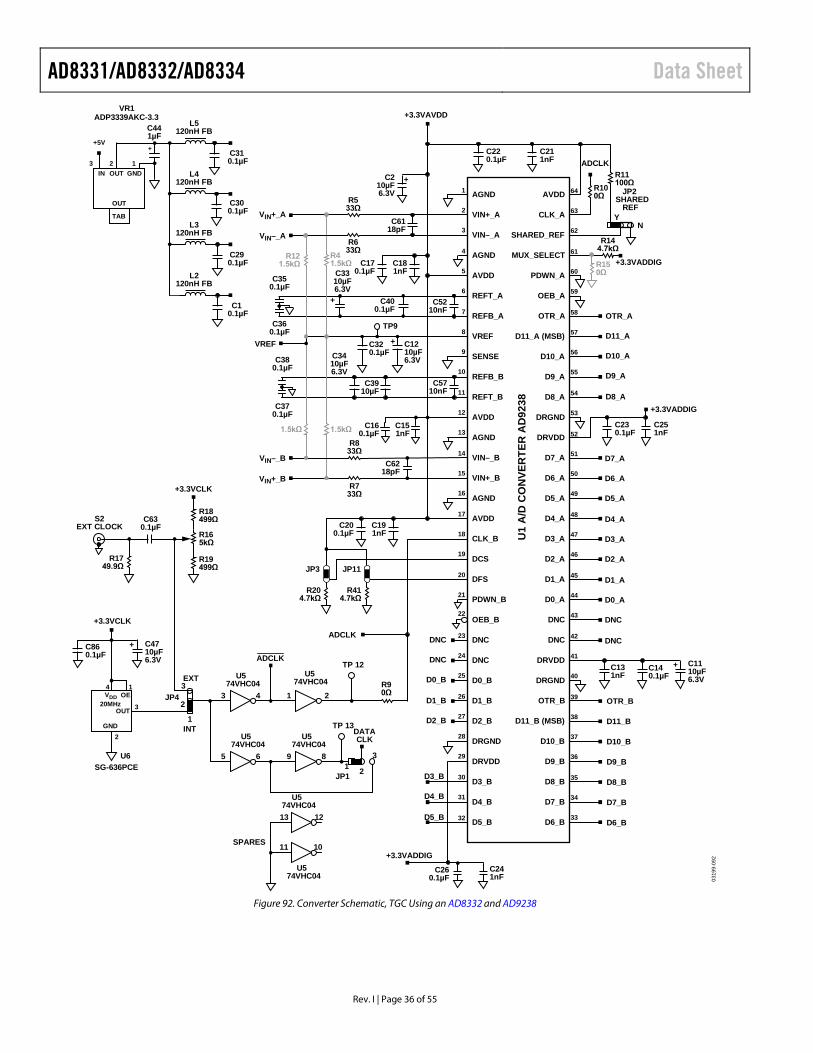
AD8331/AD8332/AD8334 Data Sheet
Rev. I | Page 36 of 55
1
2
3
17
62
6
7
11
10
14
15
18
63
19
20
60
21
22
16
4
13
64
12
5
8
9
52
51
50
49
48
47
46
45
44
43
42
41
40
39
38
37
36
35
34
3332
31
30
29
28
27
26
25
24
23
VREF
VIN+_A
VIN–_A
VIN–_B
VIN+_B
AVDD
REFT_A
REFB_A
SENSE
REFT_B
REFB_B
CLK_B
DCS
DFS
PDWN_B
OEB_B
AGND
AGND
AVDD
AVDD
AGND
AGND
D5_B
D4_B
D3_B
DRGND
D2_B
D1_B
D0_B
DNC
DNC
DRVDD
D10_A
D11_A
61
59
58
57
56
55
54
53
OTR_A
U1
A/D
CO
NVE
RTE
R A
D92
38
D9_A
D8_A
D6_A
D7_A
D5_A
D4_A
D3_A
D2_A
D1_A
D0_A
DNC
DNC
D4_B
D3_B
D2_B
D1_B
D0_B
DNC
DNC
OTR_B
D11_B
D10_B
D9_B
D8_B
D7_B
D6_BD5_B
20MHz
ADCLK+3.3VCLK
ADCLK
+3.3VAVDD
VIN–_B
VIN+_B
+
+3.3VADDIG
SG-636PCE
14
3
2 U574VHC04
+
+
TP9
TP 12
43 1 2
1213
1011
U574VHC04
U574VHC04
U574VHC04
U574VHC04
U574VHC04
SPARES
8965
TP 13
JP1
3
21
VDD
OUT
GND
OE JP4
S2EXT CLOCK
+
JP11JP3
JP2SHARED
REF
+3.3VADDIG
Y
MUX_SELECT
SHARED_REF
CLK_A
PDWN_A
AVDD
OTR_A
D11_A (MSB)
DRGND
D8_A
DRVDD
D7_A
D6_A
D5_A
D4_A
D3_A
D2_A
D1_A
D0_A
DRVDD
D10_A
DRGND
OTR_B
D9_A
D10_B
D9_B
D8_B
D7_B
D6_B
D11_B (MSB)
DNC
DNC
OEB_A
EXT
INT
VIN+_A
VIN–_AN
DATACLK
VREF
C1110µF6.3V
C140.1µF
C230.1µF
C251nF
R144.7kΩ
R11100ΩR10
0Ω
R150Ω
C220.1µF
C211nF
C860.1µF
C4710µF6.3V ADCLK
C210µF6.3V
C181nF
C170.1µF
C5210nF
C5710nF
C6118pF
C400.1µF
R533Ω
R633ΩR4
1.5kΩR12
1.5kΩ
1.5kΩ1.5kΩ
C1210µF6.3V
R90Ω
R833Ω
R733Ω
C191nF
C200.1µF
C630.1µF
C260.1µF
C241nF
C3310µF6.3V
C380.1µF
C160.1µF
C6218pF
C151nF
C350.1µF
C360.1µF
C370.1µF
R204.7kΩ
R1749.9Ω
R414.7kΩ
+3.3VCLK
R19499Ω
R165kΩ
R18499Ω
+
+3.3VADDIG
3
2
1
C320.1µF
C3910µF
C3410µF6.3V
C441µF
C310.1µF
C300.1µF
C290.1µF
C10.1µF
OUT
VR1ADP3339AKC-3.3
L2120nH FB
L3120nH FB
L4120nH FB
L5120nH FB
IN
OUT
GND3 12
TAB
++5V
0319
9-09
2
C131nF
U6
Figure 92. Converter Schematic, TGC Using an AD8332 and AD9238
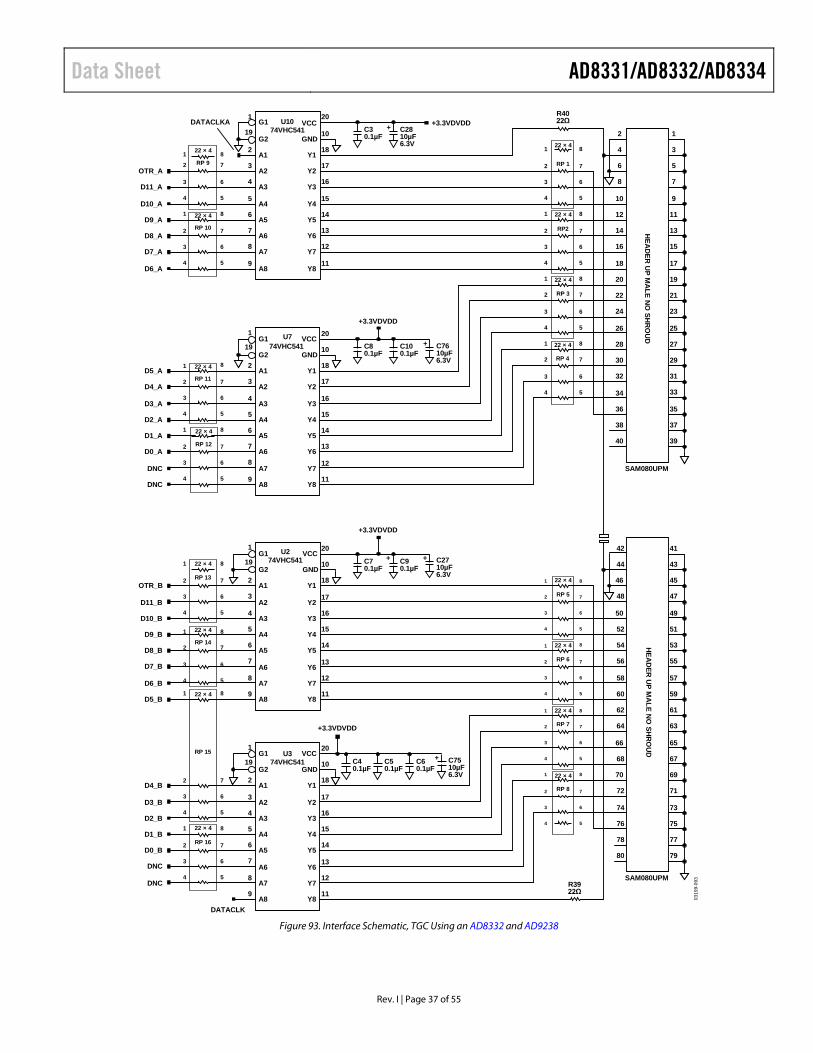
Data Sheet AD8331/AD8332/AD8334
Rev. I | Page 37 of 55
19
1
D10_A
D11_A
24
39
VCC
GND
Y1A1
G11
2
3
6
7
10
4
5
8
9
17
11
14
15
18
19
20+
16
13
12
G2
A8
A7
A6
A5
A4
A3
A2
Y8
Y7
Y6
Y5
Y4
Y3
Y2
VCC
GND
Y1A1
G11
2
3
6
7
10
4
5
8
9
17
11
14
15
18
19
20+
16
13
12
G2
A8
A7
A6
A5
A4
A3
A2
Y8
Y7
Y6
Y5
Y4
Y3
Y2
VCC
GND
Y1A1
G11
2
3
6
7
10
4
5
8
9
17
11
14
15
18
19
20+ +
16
13
12
G2
A8
A7
A6
A5
A4
A3
A2
Y8
Y7
Y6
Y5
Y4
Y3
Y2
VCC
GND
Y1A1
G11
2
3
6
7
10
4
5
8
9
17
11
14
15
18
19
20+
16
13
12
G2
A8
A7
A6
A5
A4
A3
A2
Y8
Y7
Y6
Y5
Y4
Y3
Y2
2
3
6
7
10
4
5
8
9
17
11
14
15
18
20
16
13
12
37
21
26 25
30
22
23
28 27
35
29
34 33
38
40
36
3132
R3922Ω
DATACLKA
OTR_A
D9_A
D8_A
D6_A
D7_A
D5_A
D4_A
D3_A
D2_A
D1_A
D0_A
DNC
DNC
OTR_B
D11_B
D10_B
D9_B
D8_B
D7_B
D6_B
D5_B
D4_B
D3_B
D2_B
D1_B
D0_B
DNC
DNC
+3.3VDVDD
+3.3VDVDD
+3.3VDVDD
DATACLK
U374VHC541
U1074VHC541
U774VHC541
U274VHC541
SAM080UPM
76
61
79
58
41
80
77
73
72
78
75
74
71
63
69
68
65
64
62
66
67
70
43
59
56 55
52
60
57
54 53
45
51
48 47
44
42
46
4950
SAM080UPM
RP 98
7
6
5
8
7
6
5
1
4
3
2
1
4
3
2
8
7
6
5
8
7
6
5
1
4
3
2
1
4
3
2
8
7
6
5
8
7
6
5
7
6
5
8
7
6
5
4
3
2
1
4
3
2
RP 11
RP 12
RP 13
RP 14
1
4
3
2
1
4
3
2
1 8
RP 15
RP 16
R4022Ω
1 8
7
6
54
3
2 RP 1
1 8
7
6
54
3
2 RP2
1 8
7
6
54
3
2 RP 3
1 8
7
6
54
3
2 RP 4
1 8
7
6
54
3
2 RP 5
1 8
7
6
54
3
2 RP 6
1 8
7
6
54
3
2 RP 7
1 8
7
6
54
3
2 RP 8
22 × 4
22 × 4
RP 10
22 × 4
22 × 4
22 × 4
22 × 4
22 × 4
22 × 4
HEA
DER
UP M
ALE N
O SH
RO
UD
HEA
DER
UP M
ALE N
O SH
RO
UD
C30.1µF
C2810µF6.3V
C80.1µF
C100.1µF
C7610µF6.3V
C70.1µF
C90.1µF
C2710µF6.3V
C40.1µF
C50.1µF
C60.1µF
C7510µF6.3V
+3.3VDVDD
22 × 4
22 × 4
22 × 4
22 × 4
22 × 4
22 × 4
22 × 4
22 × 4
0319
9-09
3
Figure 93. Interface Schematic, TGC Using an AD8332 and AD9238
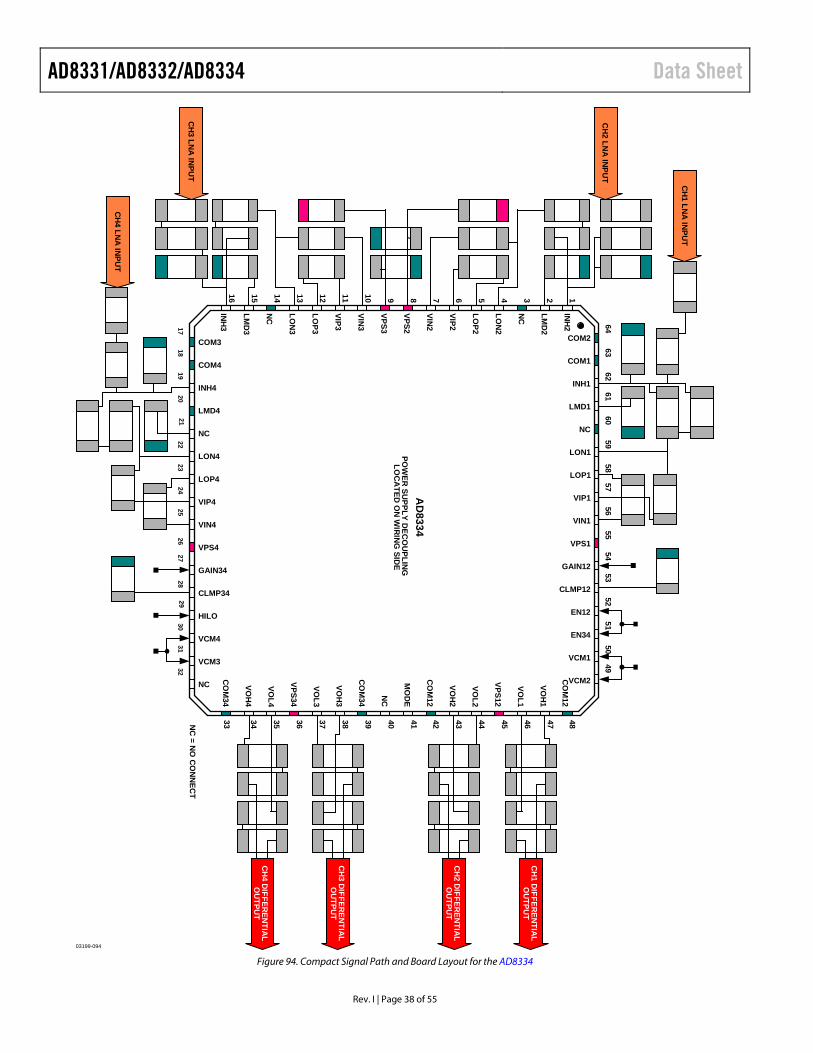
AD8331/AD8332/AD8334 Data Sheet
Rev. I | Page 38 of 55
2825
2627
1718
1921
2223
24
1516 8 7 6 5 14 3 214 13 912 11 10
5049
5655
5154
5352
35 36 37 38 4239 40 413433
2930
3132
484743 464544
5857
5962
6160
6364
20
POW
ER SU
PPLY DEC
OU
PLING
LOC
ATED
ON
WIR
ING
SIDE
AD
8334
INH
2
LMD
2
NC
LON
2
LOP2
VIP2
VIN2
VPS2
VPS3
VIN3
VIP3
LOP3
LON
3
NC
LMD
3
INH
3
NC
CO
M12
VOH
1
VOL1
VPS12
VOL2
VOH
2
CO
M12
MO
DE
CO
M34
VOH
3
VOL3
VPS34
VOL4
VOH
4
CO
M34
COM3
COM4
INH4
LMD4
NC
LON4
LOP4
VIP4
VIN4
VPS4
GAIN34
CLMP34
HILO
VCM4
VCM3
NC
COM2
COM1
INH1
LMD1
NC
LON1
LOP1
VIP1
VIN1
VPS1
GAIN12
CLMP12
EN12
EN34
VCM1
VCM2
CH
1 LNA
INPU
T
CH
2 LNA
INPU
T
CH
3 LNA
INPU
T
CH
4 LNA
INPU
T
CH
1 DIFFER
ENTIA
LO
UTPU
T
CH
2 DIFFER
ENTIA
LO
UTPU
T
CH
3 DIFFER
ENTIA
LO
UTPU
T
CH
4 DIFFER
ENTIA
LO
UTPU
T
03199-094
NC
= NO
CO
NN
ECT
Figure 94. Compact Signal Path and Board Layout for the AD8334
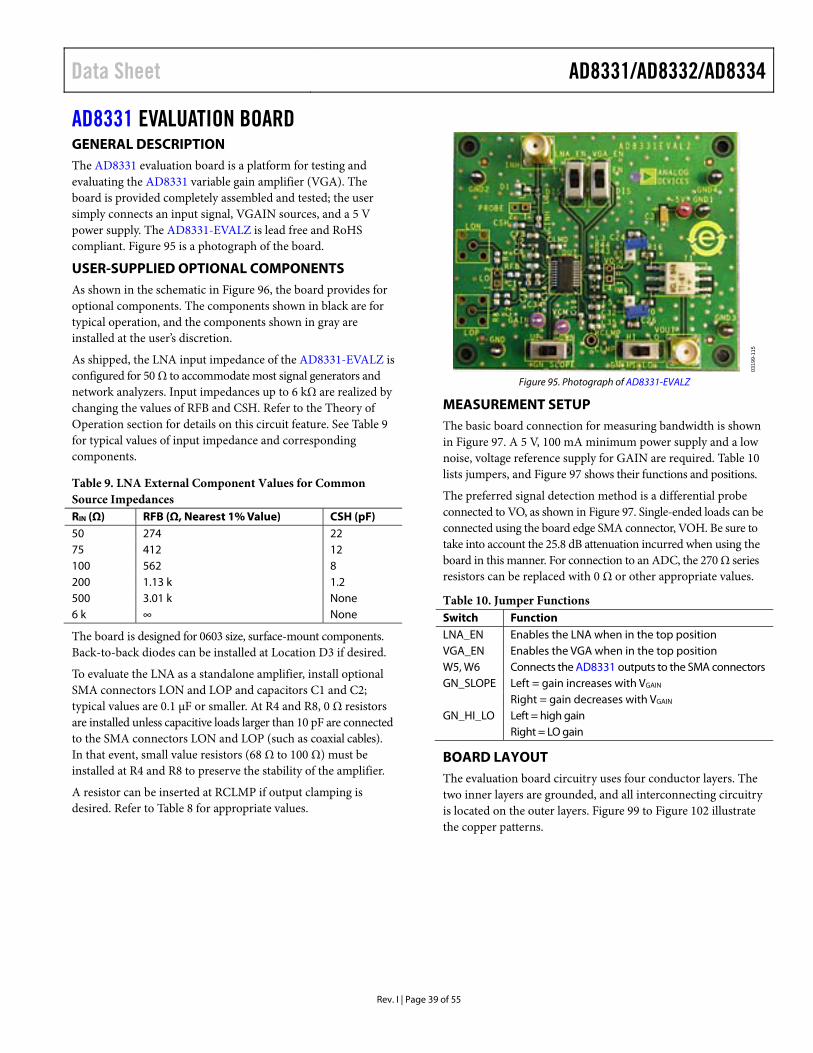
Data Sheet AD8331/AD8332/AD8334
Rev. I | Page 39 of 55
AD8331 EVALUATION BOARDGENERAL DESCRIPTION The AD8331 evaluation board is a platform for testing and evaluating the AD8331 variable gain amplifier (VGA). The board is provided completely assembled and tested; the user simply connects an input signal, VGAIN sources, and a 5 V power supply. The AD8331-EVALZ is lead free and RoHS compliant. Figure 95 is a photograph of the board.
USER-SUPPLIED OPTIONAL COMPONENTS As shown in the schematic in Figure 96, the board provides for optional components. The components shown in black are for typical operation, and the components shown in gray are installed at the user’s discretion.
As shipped, the LNA input impedance of the AD8331-EVALZ is configured for 50 Ω to accommodate most signal generators and network analyzers. Input impedances up to 6 kΩ are realized by changing the values of RFB and CSH. Refer to the Theory of Operation section for details on this circuit feature. See Table 9 for typical values of input impedance and corresponding components.
Table 9. LNA External Component Values for Common Source Impedances RIN (Ω) RFB (Ω, Nearest 1% Value) CSH (pF) 50 274 22 75 412 12 100 562 8 200 1.13 k 1.2 500 3.01 k None 6 k ∞ None
The board is designed for 0603 size, surface-mount components. Back-to-back diodes can be installed at Location D3 if desired.
To evaluate the LNA as a standalone amplifier, install optional SMA connectors LON and LOP and capacitors C1 and C2; typical values are 0.1 μF or smaller. At R4 and R8, 0 Ω resistors are installed unless capacitive loads larger than 10 pF are connected to the SMA connectors LON and LOP (such as coaxial cables). In that event, small value resistors (68 Ω to 100 Ω) must be installed at R4 and R8 to preserve the stability of the amplifier.
A resistor can be inserted at RCLMP if output clamping is desired. Refer to Table 8 for appropriate values.
0319
9-11
5
Figure 95. Photograph of AD8331-EVALZ
MEASUREMENT SETUP The basic board connection for measuring bandwidth is shown in Figure 97. A 5 V, 100 mA minimum power supply and a low noise, voltage reference supply for GAIN are required. Table 10 lists jumpers, and Figure 97 shows their functions and positions.
The preferred signal detection method is a differential probe connected to VO, as shown in Figure 97. Single-ended loads can be connected using the board edge SMA connector, VOH. Be sure to take into account the 25.8 dB attenuation incurred when using the board in this manner. For connection to an ADC, the 270 Ω series resistors can be replaced with 0 Ω or other appropriate values.
Table 10. Jumper Functions Switch Function LNA_EN Enables the LNA when in the top position VGA_EN Enables the VGA when in the top position W5, W6 Connects the AD8331 outputs to the SMA connectors GN_SLOPE Left = gain increases with VGAIN Right = gain decreases with VGAIN GN_HI_LO Left = high gain Right = LO gain
BOARD LAYOUT The evaluation board circuitry uses four conductor layers. The two inner layers are grounded, and all interconnecting circuitry is located on the outer layers. Figure 99 to Figure 102 illustrate the copper patterns.
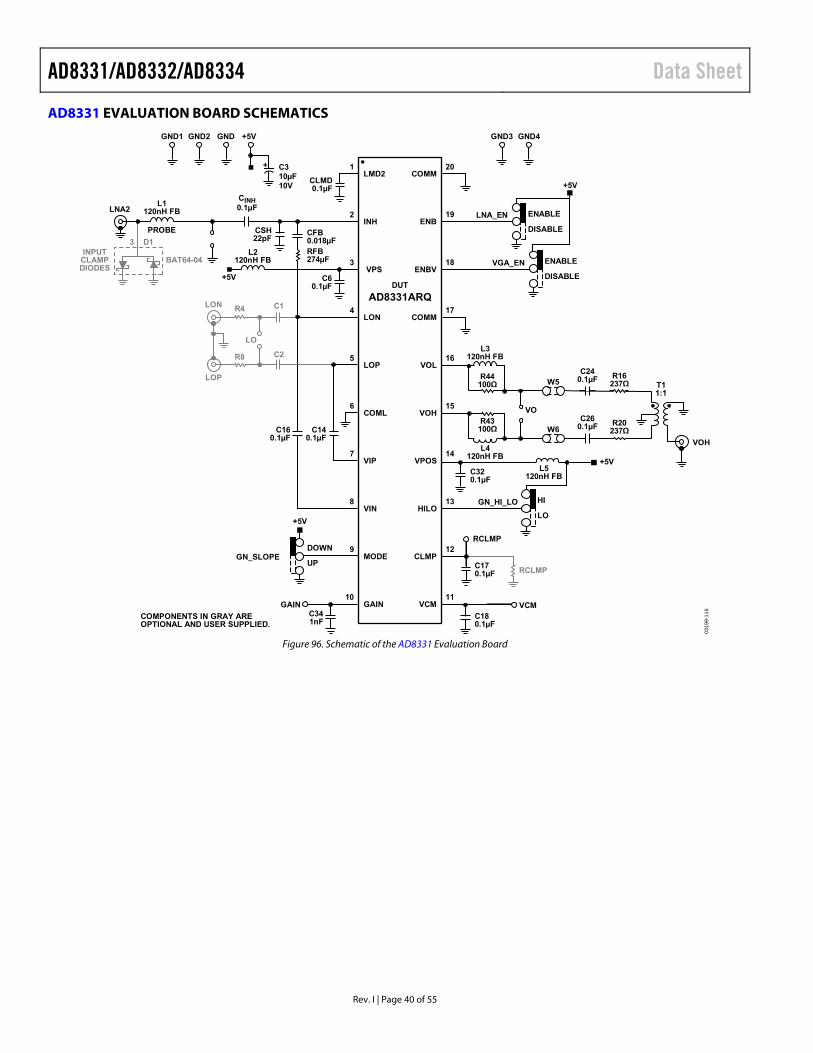
AD8331/AD8332/AD8334 Data Sheet
Rev. I | Page 40 of 55
AD8331 EVALUATION BOARD SCHEMATICS
0319
9-11
6
MODE
VIP
GAIN
VIN
LOP
COML
LMD2
LON
VPS
INH
VOH
VOL
COMM
COMM
ENBV
VPOS
CLMP
HILO
VCM
C2
C1R4
R8
LNA2
+5V
LO
+5V
+5V
GN_SLOPE
W5
W6
GNDGND2GND1
DUT
AD8331ARQ
GND4GND3
+ 1
2
3
4
5
6
7
8
9
10
20
18
17
16
15
14
13
12
11
C310µF10V
L1120nH FB
CINH0.1µF
CLMD0.1µF
L2120nH FB
CSH22pF
C60.1µF
LON
LOP
C160.1µF
C140.1µF
GAINC341nF
COMPONENTS IN GRAY AREOPTIONAL AND USER SUPPLIED.
L4120nH FB
VO
VOH
T11:1
R16237Ω
R20237Ω
C240.1µF
C260.1µF
R43100Ω
R44100Ω
L3120nH FB
C170.1µF
C320.1µF
C180.1µF
ENBLNA_EN19
GN_HI_LO
+5V
+5V
VGA_ENINPUT
CLAMPDIODES
3 D1
BAT64-04
CFB0.018µFRFB274µF
RCLMP
VCM
L5120nH FB
PROBE
RCLMP
ENABLE
DISABLE
ENABLE
DISABLE
HI
LO
DOWN
UP
Figure 96. Schematic of the AD8331 Evaluation Board

Data Sheet AD8331/AD8332/AD8334
Rev. I | Page 41 of 55
GN D
GND
DP8200 PRECISION VOLTAGE REFERENCE(FOR VGAIN)
4395A ANALYZER
1103 TEKPROBEPOWER SUPPLY
E3631APOWER SUPPLY
0319
9-11
7
+5V
DIFFERENTIAL PROBETO VO PINS
INSERT JUMPERS W5 AND W6TO USE OUTPUTTRANSFORMER AND VOH SMA
Figure 97. AD8331 Typical Board Test Connections
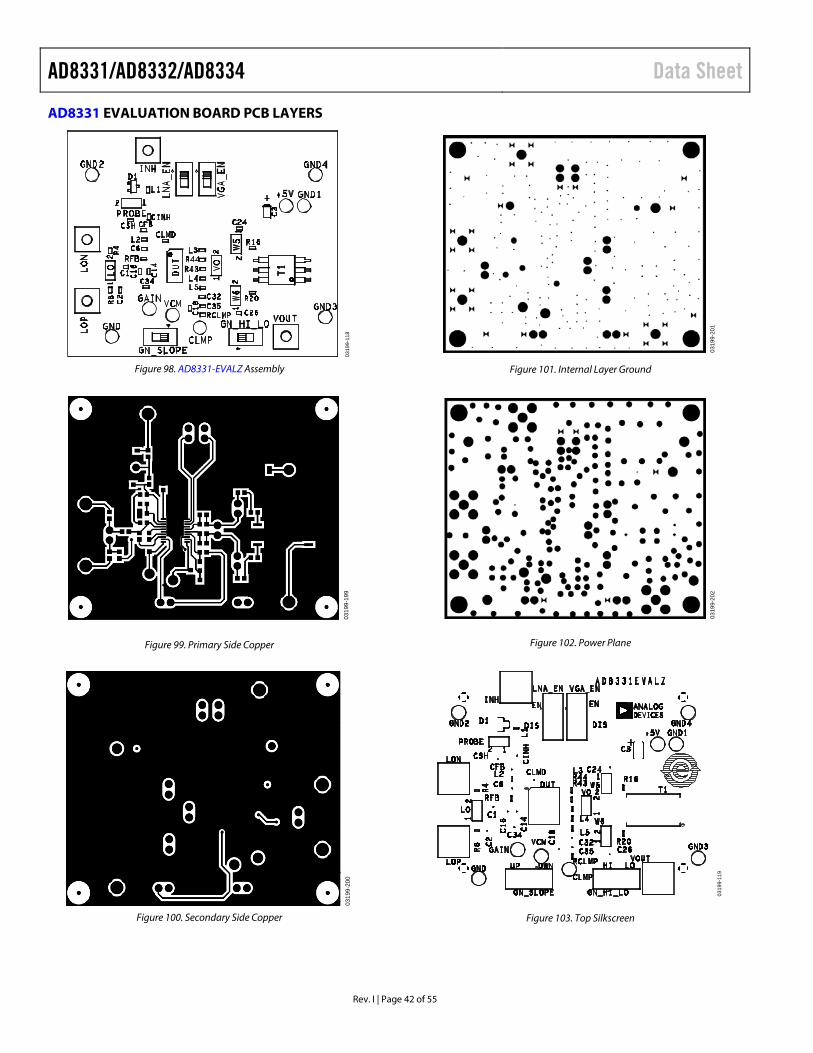
AD8331/AD8332/AD8334 Data Sheet
Rev. I | Page 42 of 55
AD8331 EVALUATION BOARD PCB LAYERS
0319
9-11
8
Figure 98. AD8331-EVALZ Assembly
0319
9-19
9
Figure 99. Primary Side Copper
0319
9-20
0
Figure 100. Secondary Side Copper
0319
9-20
1
Figure 101. Internal Layer Ground
0319
9-20
2
Figure 102. Power Plane
0319
9-11
9
Figure 103. Top Silkscreen
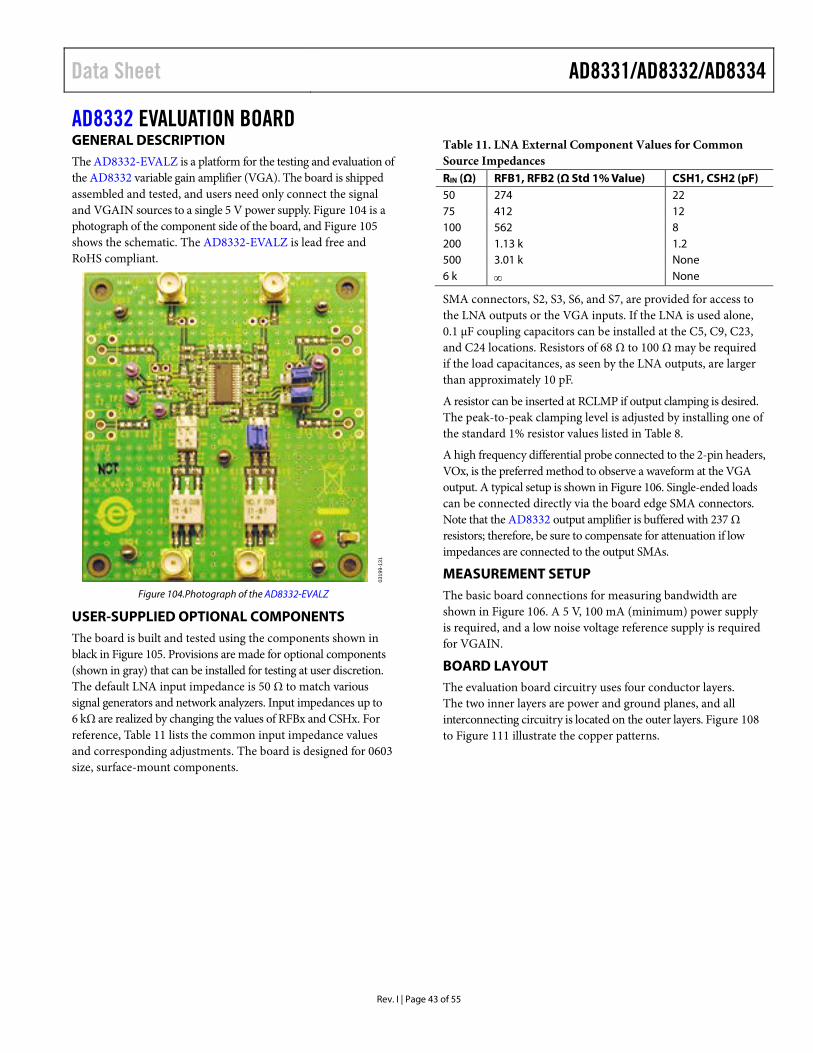
Data Sheet AD8331/AD8332/AD8334
Rev. I | Page 43 of 55
AD8332 EVALUATION BOARD GENERAL DESCRIPTION The AD8332-EVALZ is a platform for the testing and evaluation of the AD8332 variable gain amplifier (VGA). The board is shipped assembled and tested, and users need only connect the signal and VGAIN sources to a single 5 V power supply. Figure 104 is a photograph of the component side of the board, and Figure 105 shows the schematic. The AD8332-EVALZ is lead free and RoHS compliant.
0319
9-13
1
Figure 104.Photograph of the AD8332-EVALZ
USER-SUPPLIED OPTIONAL COMPONENTS The board is built and tested using the components shown in black in Figure 105. Provisions are made for optional components (shown in gray) that can be installed for testing at user discretion. The default LNA input impedance is 50 Ω to match various signal generators and network analyzers. Input impedances up to 6 kΩ are realized by changing the values of RFBx and CSHx. For reference, Table 11 lists the common input impedance values and corresponding adjustments. The board is designed for 0603 size, surface-mount components.
Table 11. LNA External Component Values for Common Source Impedances RIN (Ω) RFB1, RFB2 (Ω Std 1% Value) CSH1, CSH2 (pF) 50 274 22 75 412 12 100 562 8 200 1.13 k 1.2 500 3.01 k None 6 k ∞ None
SMA connectors, S2, S3, S6, and S7, are provided for access to the LNA outputs or the VGA inputs. If the LNA is used alone, 0.1 µF coupling capacitors can be installed at the C5, C9, C23, and C24 locations. Resistors of 68 Ω to 100 Ω may be required if the load capacitances, as seen by the LNA outputs, are larger than approximately 10 pF.
A resistor can be inserted at RCLMP if output clamping is desired. The peak-to-peak clamping level is adjusted by installing one of the standard 1% resistor values listed in Table 8.
A high frequency differential probe connected to the 2-pin headers, VOx, is the preferred method to observe a waveform at the VGA output. A typical setup is shown in Figure 106. Single-ended loads can be connected directly via the board edge SMA connectors. Note that the AD8332 output amplifier is buffered with 237 Ω resistors; therefore, be sure to compensate for attenuation if low impedances are connected to the output SMAs.
MEASUREMENT SETUP The basic board connections for measuring bandwidth are shown in Figure 106. A 5 V, 100 mA (minimum) power supply is required, and a low noise voltage reference supply is required for VGAIN.
BOARD LAYOUT The evaluation board circuitry uses four conductor layers. The two inner layers are power and ground planes, and all interconnecting circuitry is located on the outer layers. Figure 108 to Figure 111 illustrate the copper patterns.
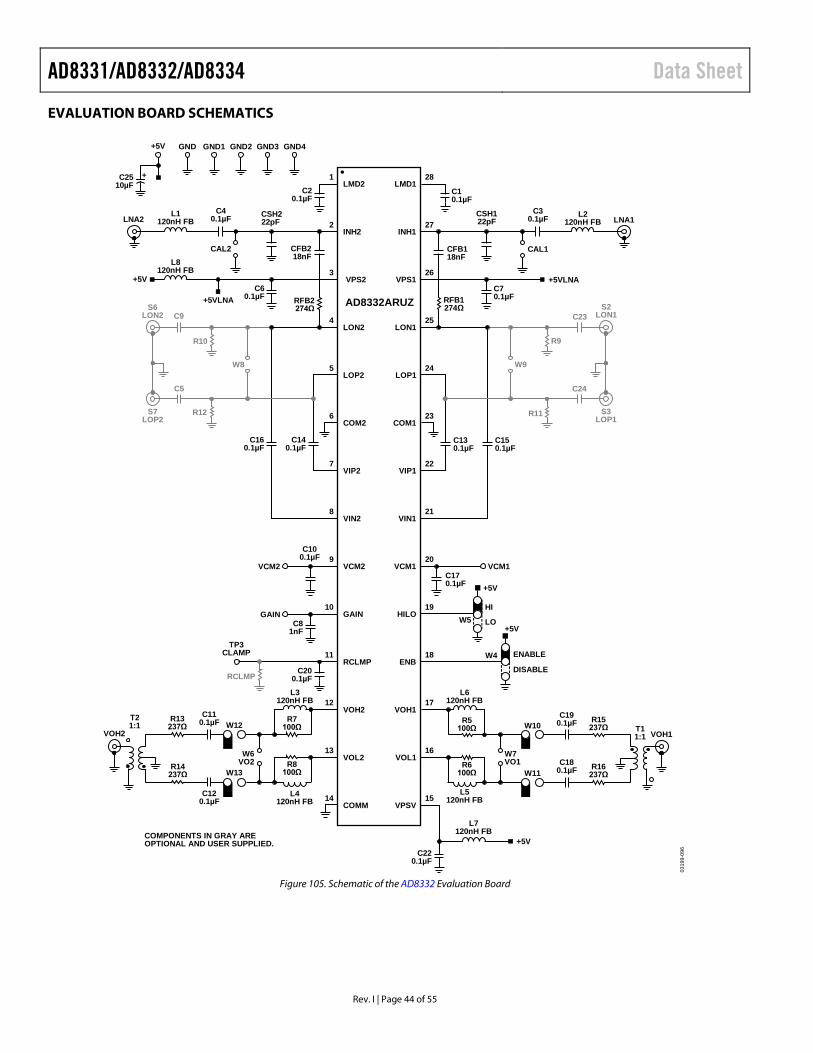
AD8331/AD8332/AD8334 Data Sheet
Rev. I | Page 44 of 55
EVALUATION BOARD SCHEMATICS
VCM2
RCLMP
COMM
VOL2
VOH2
VIP2
GAIN
VIN2
LOP2
COM2
LMD2
LON2
VPS2
INH2
COM1
LOP1
LMD1
LON1
VPS1
INH1
VOH1
ENB
VIP1
VCM1
VIN1
VPSV
VOL1
HILO
+5V
LO
W9
C24
C23
R9
R11R12
R10
C5
C9
+5VLNA
LNA2
+5V
W8
RCLMP
+5V
W4
+5V
HI
+5VLNA
W5
W12
W13
W10
W11
GND GND4GND3GND2GND1
AD8332ARUZ
+ 1
2
3
4
5
6
7
8
9
10
11
12
13
14 15
28
27
26
25
24
23
22
21
20
19
18
17
16
C2510µF
L1120nH FB
C40.1µF CSH2
22pF
C20.1µF
L8120nH FB
CAL2 CFB218nF
C60.1µF RFB2
274ΩS6LON2
S7LOP2
C160.1µF
C140.1µF
C100.1µF
VCM2
GAINC8
1nFTP3
CLAMP
C200.1µFL3
120nH FB
R7100Ω
R8100Ω
L4120nH FB
VOH2
T21:1
R13237Ω
C110.1µF
W6VO2R14
237Ω
C120.1µF
COMPONENTS IN GRAY AREOPTIONAL AND USER SUPPLIED.
C220.1µF
L7120nH FB
L5120nH FB
W7VO1
VOH1T11:1
R15237Ω
R16237Ω
C190.1µF
C180.1µFR6
100Ω
R5100Ω
L6120nH FB
ENABLE
DISABLE
C170.1µF
VCM1
C150.1µF
C130.1µF
S3LOP1
S2LON1
RFB1274Ω
C70.1µF
CAL1CFB118nF
LNA1L2
120nH FBC3
0.1µFCSH122pF
C10.1µF
0319
9-09
6
+5V
Figure 105. Schematic of the AD8332 Evaluation Board
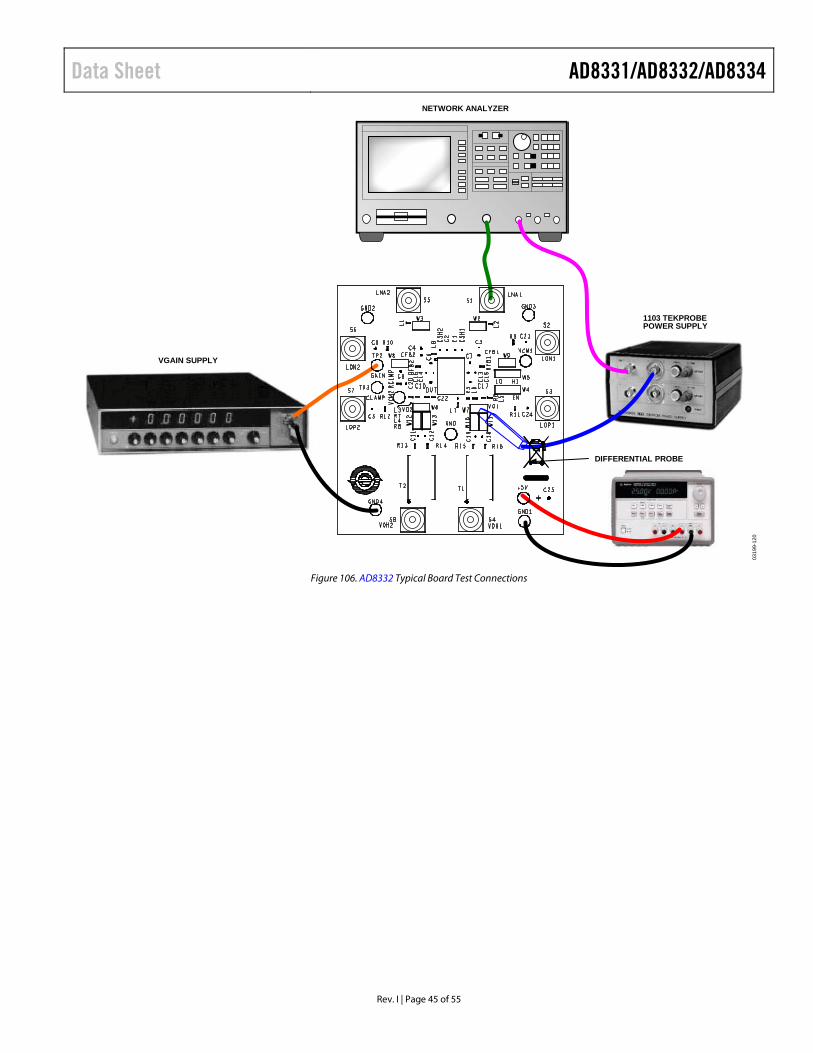
Data Sheet AD8331/AD8332/AD8334
Rev. I | Page 45 of 55
VGAIN SUPPLY
NETWORK ANALYZER
1103 TEKPROBEPOWER SUPPLY
DIFFERENTIAL PROBE
0319
9-12
0
Figure 106. AD8332 Typical Board Test Connections
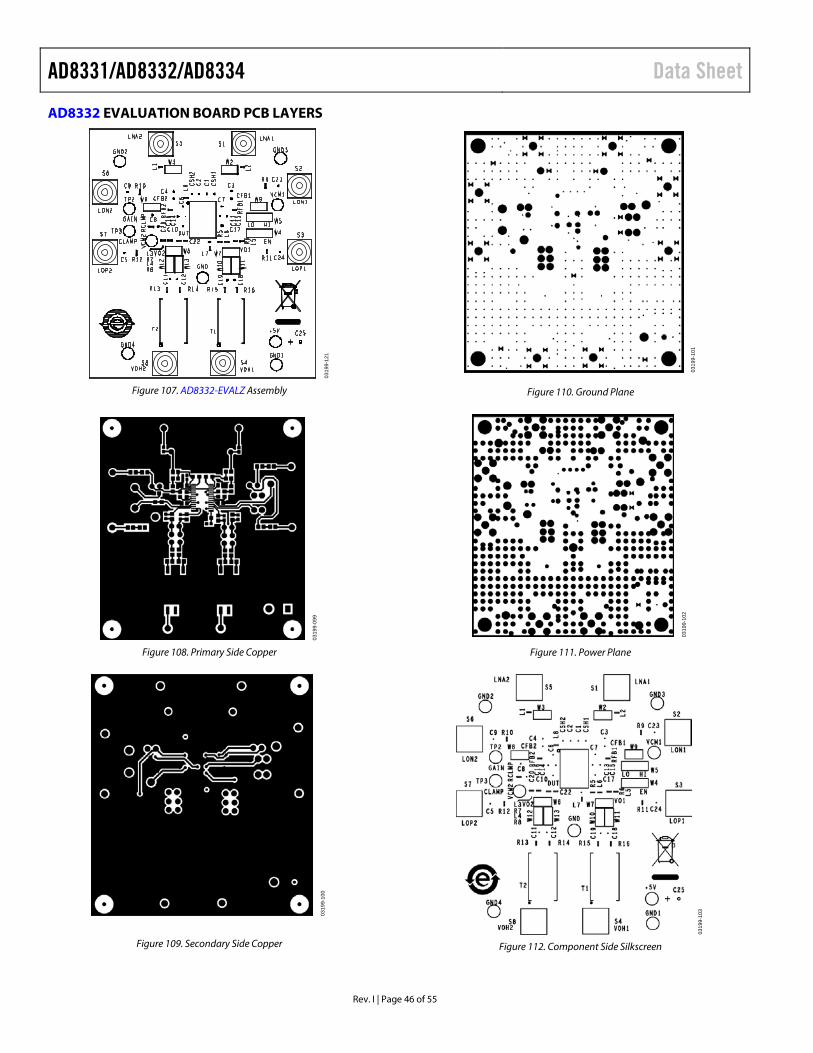
AD8331/AD8332/AD8334 Data Sheet
Rev. I | Page 46 of 55
AD8332 EVALUATION BOARD PCB LAYERS
0319
9-12
1
Figure 107. AD8332-EVALZ Assembly
0319
9-09
9
Figure 108. Primary Side Copper
0319
9-10
0
Figure 109. Secondary Side Copper
0319
9-10
1
Figure 110. Ground Plane
0319
9-10
2
Figure 111. Power Plane
0319
9-10
3
Figure 112. Component Side Silkscreen
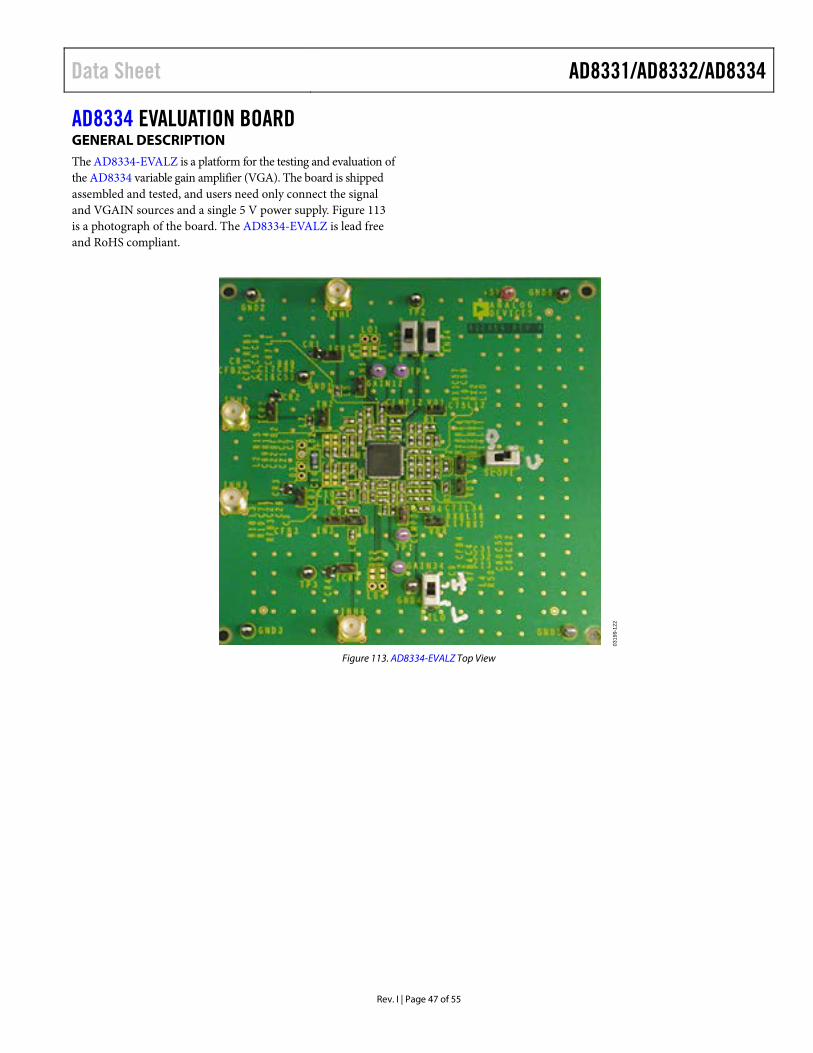
Data Sheet AD8331/AD8332/AD8334
Rev. I | Page 47 of 55
AD8334 EVALUATION BOARD GENERAL DESCRIPTION The AD8334-EVALZ is a platform for the testing and evaluation of the AD8334 variable gain amplifier (VGA). The board is shipped assembled and tested, and users need only connect the signal and VGAIN sources and a single 5 V power supply. Figure 113 is a photograph of the board. The AD8334-EVALZ is lead free and RoHS compliant.
0319
9-12
2
Figure 113. AD8334-EVALZ Top View
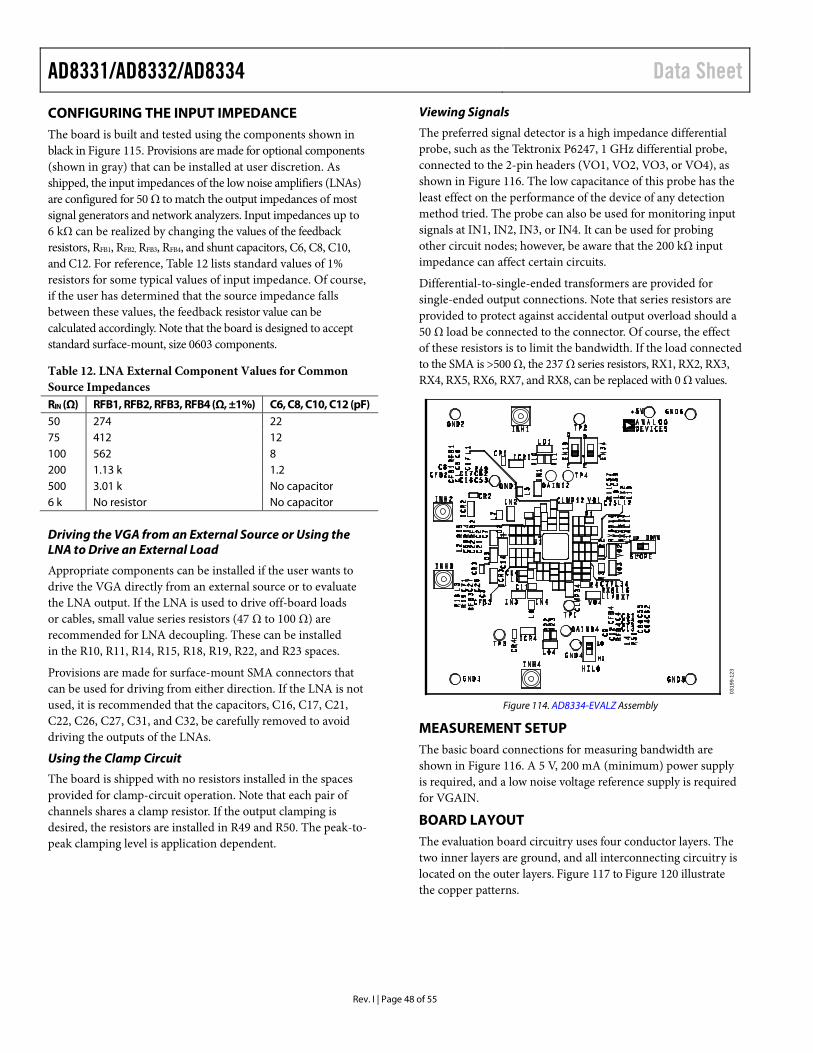
AD8331/AD8332/AD8334 Data Sheet
Rev. I | Page 48 of 55
CONFIGURING THE INPUT IMPEDANCE The board is built and tested using the components shown in black in Figure 115. Provisions are made for optional components (shown in gray) that can be installed at user discretion. As shipped, the input impedances of the low noise amplifiers (LNAs) are configured for 50 Ω to match the output impedances of most signal generators and network analyzers. Input impedances up to 6 kΩ can be realized by changing the values of the feedback resistors, RFB1, RFB2, RFB3, RFB4, and shunt capacitors, C6, C8, C10, and C12. For reference, Table 12 lists standard values of 1% resistors for some typical values of input impedance. Of course, if the user has determined that the source impedance falls between these values, the feedback resistor value can be calculated accordingly. Note that the board is designed to accept standard surface-mount, size 0603 components.
Table 12. LNA External Component Values for Common Source Impedances RIN (Ω) RFB1, RFB2, RFB3, RFB4 (Ω, ±1%) C6, C8, C10, C12 (pF) 50 274 22 75 412 12 100 562 8 200 1.13 k 1.2 500 3.01 k No capacitor 6 k No resistor No capacitor
Driving the VGA from an External Source or Using the LNA to Drive an External Load
Appropriate components can be installed if the user wants to drive the VGA directly from an external source or to evaluate the LNA output. If the LNA is used to drive off-board loads or cables, small value series resistors (47 Ω to 100 Ω) are recommended for LNA decoupling. These can be installed in the R10, R11, R14, R15, R18, R19, R22, and R23 spaces.
Provisions are made for surface-mount SMA connectors that can be used for driving from either direction. If the LNA is not used, it is recommended that the capacitors, C16, C17, C21, C22, C26, C27, C31, and C32, be carefully removed to avoid driving the outputs of the LNAs.
Using the Clamp Circuit
The board is shipped with no resistors installed in the spaces provided for clamp-circuit operation. Note that each pair of channels shares a clamp resistor. If the output clamping is desired, the resistors are installed in R49 and R50. The peak-to-peak clamping level is application dependent.
Viewing Signals
The preferred signal detector is a high impedance differential probe, such as the Tektronix P6247, 1 GHz differential probe, connected to the 2-pin headers (VO1, VO2, VO3, or VO4), as shown in Figure 116. The low capacitance of this probe has the least effect on the performance of the device of any detection method tried. The probe can also be used for monitoring input signals at IN1, IN2, IN3, or IN4. It can be used for probing other circuit nodes; however, be aware that the 200 kΩ input impedance can affect certain circuits.
Differential-to-single-ended transformers are provided for single-ended output connections. Note that series resistors are provided to protect against accidental output overload should a 50 Ω load be connected to the connector. Of course, the effect of these resistors is to limit the bandwidth. If the load connected to the SMA is >500 Ω, the 237 Ω series resistors, RX1, RX2, RX3, RX4, RX5, RX6, RX7, and RX8, can be replaced with 0 Ω values.
0319
9-12
3
Figure 114. AD8334-EVALZ Assembly
MEASUREMENT SETUP The basic board connections for measuring bandwidth are shown in Figure 116. A 5 V, 200 mA (minimum) power supply is required, and a low noise voltage reference supply is required for VGAIN.
BOARD LAYOUT The evaluation board circuitry uses four conductor layers. The two inner layers are ground, and all interconnecting circuitry is located on the outer layers. Figure 117 to Figure 120 illustrate the copper patterns.

Data Sheet AD8331/AD8332/AD8334
Rev. I | Page 49 of 55
EVALUATION BOARD SCHEMATICS
COM34
VOL2
VOH2
VOH1
VOL1
COM12
VPS34
COMM34
LMD2
LON2
INH2
VOH3
VOH4
VOL3
VOL4
VPSV2
COM12
25 26 2717 18 19 21 22 23 24
15
16
8
7
6
5
1
4
3
2
14
13
9
12
11
10
50 4956 55 5154 53 52
35
36
37
38
42
3940
41
34
33
30 31 32
48
47
43
46
45
44
58 575962 61 60
VPS2
VIP2
VIN2
LOP2
VPS3
VIP3
VIN3
LMD3
LON3
INH3
LOP3
NC
CO
M3
CO
M4
LM
D4
INH
4
VC
M4
VC
M3
HIL
O
CL
MP
34
LO
N4
VP
S 4
VI P
4
VI N
4
LO
P4
NC
NC3
NC3
MODE
LM
D1
LO
N1
VP
S1
INH
1
CO
M1
63
LO
P1
VIP
1
VIN
1
EN
12
VC
M1
CO
M2
GA
IN1 2
VC
M2
CL
MP 1
2
EN
3 4NC
64
20
C70.1 µFINH2
IN2
C822 pF
L7120 nH
CFB218 nF
C20.1 µF
LO21
R151
0Ω
R141
0Ω
RFB2274Ω
C690.1 µF
L2120 nH
C710.1 µF
L3120 nH
C30.1µF
C90.1 µFINH3
C1022 pF
L6120 nH
CFB318 nF
LO31R181
R191 RFB3274Ω
C260.1 µF
C270.1 µF
C210.1 µF
C220.1 µF
IN3
CFB418 nF
C110.1 µF
L8120 nH
C1222 pF
C40.1 µF
RFB4274Ω
C320.1 µF
C310.1 µF
LO41
R231R221
+5V
C1
30.
1µF
L4120 nH
C620.1 µFC
64
0.1
µF
R504.02kΩ
C55
0 .1
µF
+5V
VO2
L13120 nH
L11120 nH
RX4100Ω
RX3100Ω
VO1
L10120 nH
L9120 nH
RX2100Ω
RX1100Ω
C750.1 µF
L12120 nH FB
+5V
VO3
L14120 nH
L15120 nH
RX5100Ω
RX6100Ω
VO4
L16120 nH
L17120 nH
RX7100Ω
RX8100Ω
L34120 nH
+5VC770.1 µF
+5V
CFB118 nFC5
0.1 µF
INH1
L5120 nH
C622 pF C1
0.1 µF
RFB1274Ω
C170.1 µF
C160.1 µF
LO11
R111R101
+5V
L1120 nH
C67
0.1
µF
CL
MP1
2
R494.02kΩ
C53
0.1
µF
C 82
1n
F
C590.1 µF
C570.1 µF
IN4
IN1
HI
LO
SLOPED
U
E
D
E
D
C8
01
nF
+5V
+5V
28 29
GA
IN34
GA
IN34
+5V
EN34EN 12
HILO
+ 5V
+C14
10 µF
GND1 GND2 GND3 GND6GND5GND4
ICR4
CR4
1 2
3
ICR3
CR3
1 2
3
ICR2
CR2
1 2
3
ICR1
CR1
1 2
3
CLMP34
NOTES1 COMPONENTS IN GRAY ARE OPTIONAL USER SUPPLIED.2 NC = NO CONNECT.
0319
9-12
4
AD8334
NC
Figure 115. AD8334-EVALZ Schematic

AD8331/AD8332/AD8334 Data Sheet
Rev. I | Page 50 of 55
0319
9-12
5
NETWORK ANALYZER
PRECISION VOLTAGEREFERENCE (FOR VGAIN)
GND
GND
GAINCONTROLVOLTAGE
SIGNAL INPUT
DIFFERENTIAL PROBE
POWER SUPPLY
+5V
PROBEPOWERSUPPLY
Figure 116. AD8334 Typical Board Test Connections (One Channel Shown)

Data Sheet AD8331/AD8332/AD8334
Rev. I | Page 51 of 55
AD8334 EVALUATION BOARD PCB LAYERS
0319
9-12
6
Figure 117. AD8334-EVALZ Primary Side Copper
0319
9-12
7
Figure 118. AD8334-EVALZ Secondary Side Copper
0319
9-12
8
Figure 119. AD8334-EVALZ Inner Layer 1Copper
0319
9-12
9
Figure 120. AD8334-EVALZ Inner Layer 2 Copper
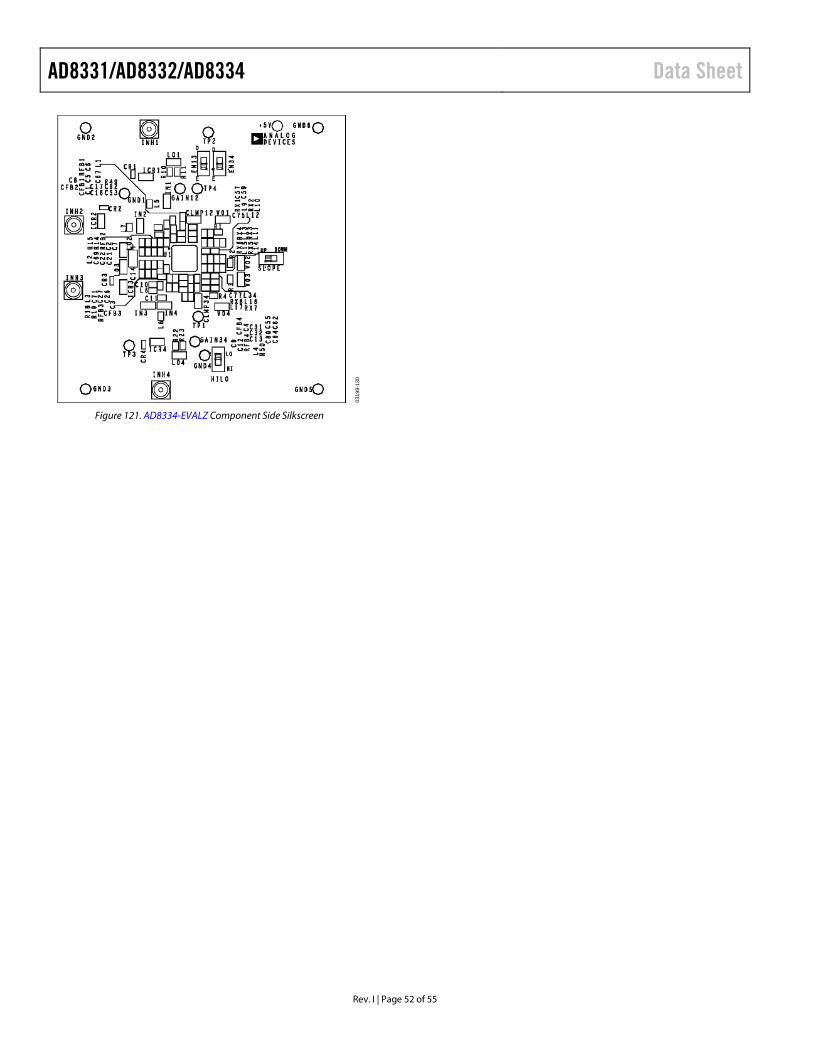
AD8331/AD8332/AD8334 Data Sheet
Rev. I | Page 52 of 55
0319
9-13
0
Figure 121. AD8334-EVALZ Component Side Silkscreen
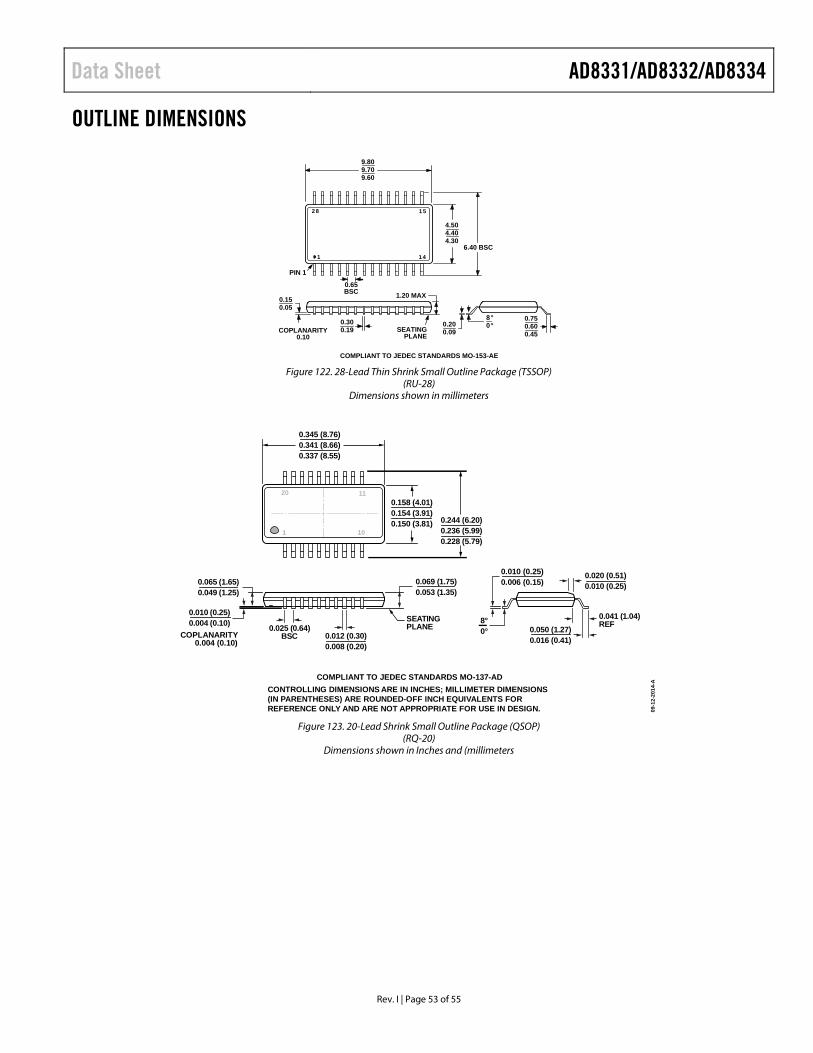
Data Sheet AD8331/AD8332/AD8334
Rev. I | Page 53 of 55
OUTLINE DIMENSIONS
COMPLIANT TO JEDEC STANDARDS MO-153-AE
2 8 1 5
1 41
8°0°SEATING
PLANECOPLANARITY
0.10
1.20 MAX
6.40 BSC
0.65BSC
PIN 1
0.300.19
0.200.09
4.504.404.30
0.750.600.45
9.809.709.60
0.150.05
Figure 122. 28-Lead Thin Shrink Small Outline Package (TSSOP)
(RU-28) Dimensions shown in millimeters
COMPLIANT TO JEDEC STANDARDS MO-137-ADCONTROLLING DIMENSIONS ARE IN INCHES; MILLIMETER DIMENSIONS(IN PARENTHESES) ARE ROUNDED-OFF INCH EQUIVALENTS FORREFERENCE ONLY AND ARE NOT APPROPRIATE FOR USE IN DESIGN.
20 11
101
SEATINGPLANE
0.010 (0.25)0.004 (0.10)
0.012 (0.30)0.008 (0.20)
0.025 (0.64)BSC
0.041 (1.04)REF
0.010 (0.25)0.006 (0.15)
0.050 (1.27)0.016 (0.41)
0.020 (0.51)0.010 (0.25)
8°0°COPLANARITY
0.004 (0.10)
0.065 (1.65)0.049 (1.25)
0.069 (1.75)0.053 (1.35)
0.345 (8.76)0.341 (8.66)0.337 (8.55)
0.158 (4.01)0.154 (3.91)0.150 (3.81) 0.244 (6.20)
0.236 (5.99)0.228 (5.79)
09-1
2-20
14-A
Figure 123. 20-Lead Shrink Small Outline Package (QSOP)
(RQ-20) Dimensions shown in Inches and (millimeters
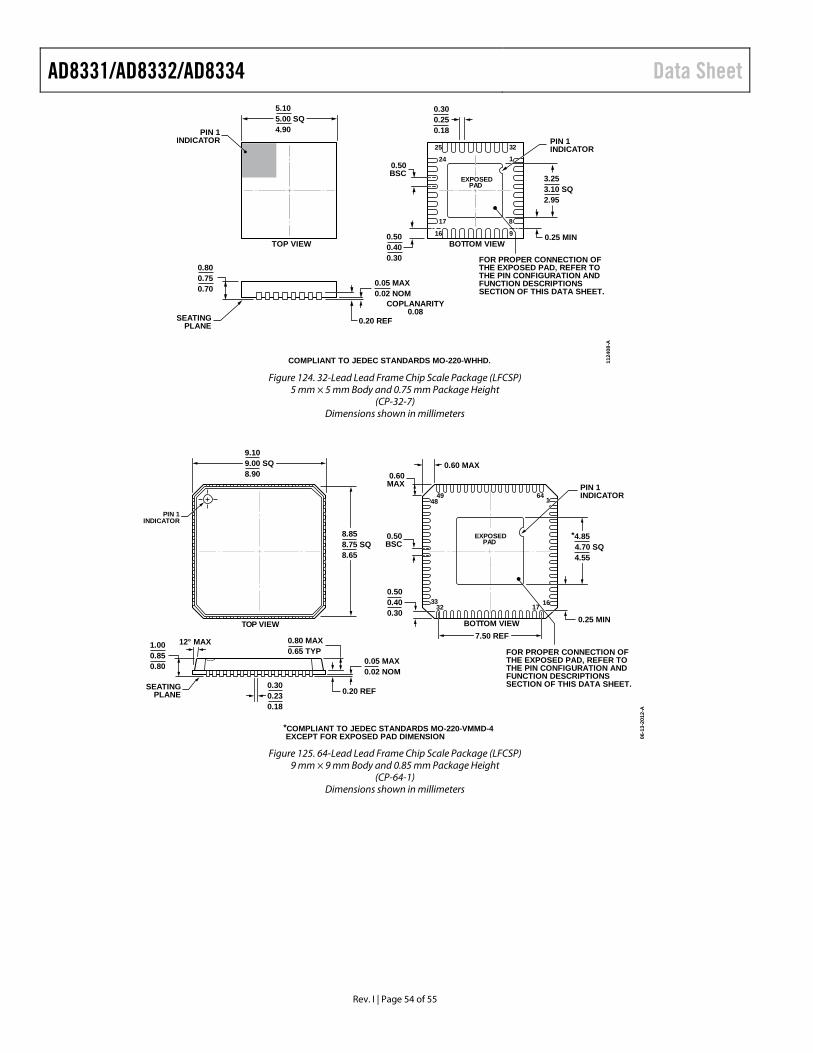
AD8331/AD8332/AD8334 Data Sheet
Rev. I | Page 54 of 55
COMPLIANT TO JEDEC STANDARDS MO-220-WHHD. 1124
08-A
10.50BSC
BOTTOM VIEWTOP VIEW
PIN 1INDICATOR
32
916
17
24
25
8
EXPOSEDPAD
PIN 1INDICATOR
3.253.10 SQ2.95
SEATINGPLANE
0.05 MAX0.02 NOM
0.20 REF
COPLANARITY0.08
0.300.250.18
5.105.00 SQ4.90
0.800.750.70
FOR PROPER CONNECTION OFTHE EXPOSED PAD, REFER TOTHE PIN CONFIGURATION ANDFUNCTION DESCRIPTIONSSECTION OF THIS DATA SHEET.
0.500.400.30
0.25 MIN
Figure 124. 32-Lead Lead Frame Chip Scale Package (LFCSP)
5 mm × 5 mm Body and 0.75 mm Package Height (CP-32-7)
Dimensions shown in millimeters
*COMPLIANT TO JEDEC STANDARDS MO-220-VMMD-4 EXCEPT FOR EXPOSED PAD DIMENSION
0.25 MIN
164
1617
4948
3233
0.500.400.30
0.50BSC
0.20 REF
12° MAX 0.80 MAX0.65 TYP
1.000.850.80
7.50 REF
0.05 MAX0.02 NOM
0.60 MAX0.60MAX
SEATINGPLANE
PIN 1INDICATOR
*4.854.70 SQ4.55
PIN 1INDICATOR
0.300.230.18
FOR PROPER CONNECTION OFTHE EXPOSED PAD, REFER TOTHE PIN CONFIGURATION ANDFUNCTION DESCRIPTIONSSECTION OF THIS DATA SHEET.
TOP VIEW
EXPOSEDPAD
BOTTOM VIEW
9.109.00 SQ8.90
8.858.75 SQ8.65
06-1
3-20
12-A
Figure 125. 64-Lead Lead Frame Chip Scale Package (LFCSP)
9 mm × 9 mm Body and 0.85 mm Package Height (CP-64-1)
Dimensions shown in millimeters
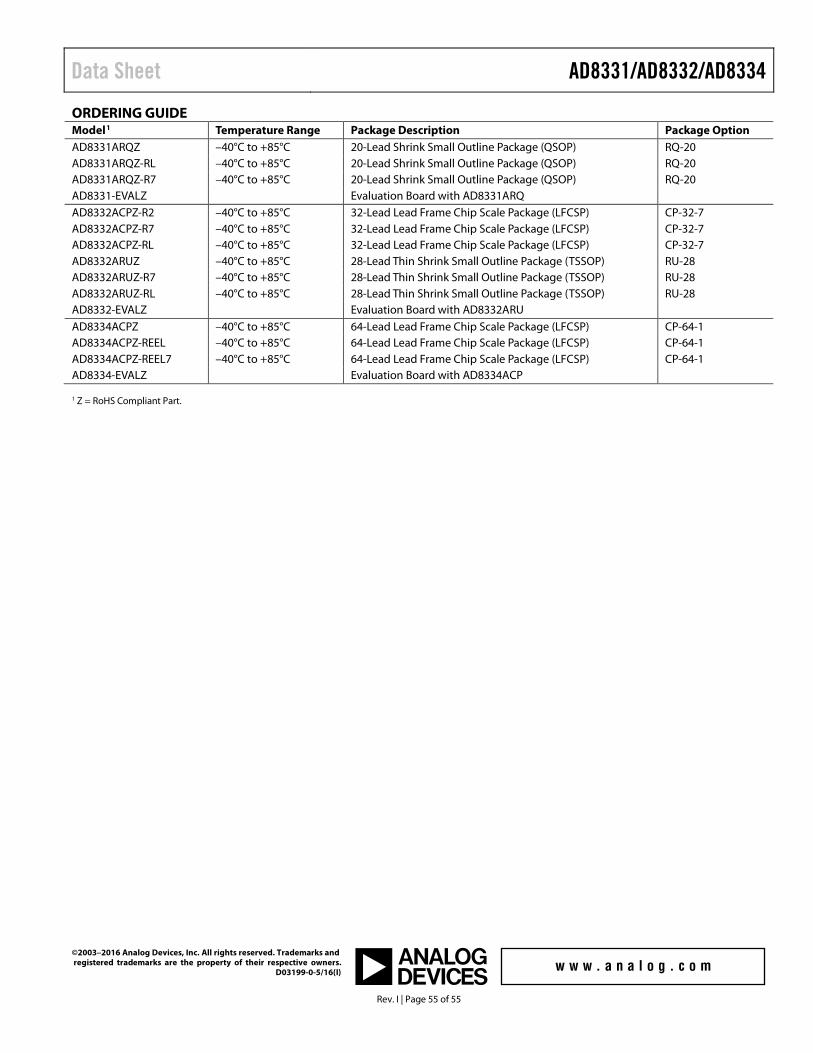
Data Sheet AD8331/AD8332/AD8334
Rev. I | Page 55 of 55
ORDERING GUIDE Model1 Temperature Range Package Description Package Option AD8331ARQZ –40°C to +85°C 20-Lead Shrink Small Outline Package (QSOP) RQ-20 AD8331ARQZ-RL –40°C to +85°C 20-Lead Shrink Small Outline Package (QSOP) RQ-20 AD8331ARQZ-R7 –40°C to +85°C 20-Lead Shrink Small Outline Package (QSOP) RQ-20 AD8331-EVALZ Evaluation Board with AD8331ARQ AD8332ACPZ-R2 –40°C to +85°C 32-Lead Lead Frame Chip Scale Package (LFCSP) CP-32-7 AD8332ACPZ-R7 –40°C to +85°C 32-Lead Lead Frame Chip Scale Package (LFCSP) CP-32-7 AD8332ACPZ-RL –40°C to +85°C 32-Lead Lead Frame Chip Scale Package (LFCSP) CP-32-7 AD8332ARUZ –40°C to +85°C 28-Lead Thin Shrink Small Outline Package (TSSOP) RU-28 AD8332ARUZ-R7 –40°C to +85°C 28-Lead Thin Shrink Small Outline Package (TSSOP) RU-28 AD8332ARUZ-RL –40°C to +85°C 28-Lead Thin Shrink Small Outline Package (TSSOP) RU-28 AD8332-EVALZ Evaluation Board with AD8332ARU AD8334ACPZ –40°C to +85°C 64-Lead Lead Frame Chip Scale Package (LFCSP) CP-64-1 AD8334ACPZ-REEL –40°C to +85°C 64-Lead Lead Frame Chip Scale Package (LFCSP) CP-64-1 AD8334ACPZ-REEL7 –40°C to +85°C 64-Lead Lead Frame Chip Scale Package (LFCSP) CP-64-1 AD8334-EVALZ Evaluation Board with AD8334ACP 1 Z = RoHS Compliant Part.
©2003–2016 Analog Devices, Inc. All rights reserved. Trademarks and registered trademarks are the property of their respective owners. D03199-0-5/16(I)
Recommended


![C22 Preamplifier Complete User Manual - Analog Metricanalogmetric.com/download/C22 Preamplifier Complete User Manual.pdf · [C22 VACUUM TUBE PREAMPLIFIER COMPLETE USER MANUAL ]](https://img.pdfslide.us/doc/110x75/5ad3f8607f8b9abd6c8eae98/c22-preamplifier-complete-user-manual-analog-preamplifier-complete-user-manualpdfc22.jpg)