Ultra Petroleum Corp.Michael D. WatfordChairman, President and CEO
May 2013
Ultra Petroleum Corp. is an independent exploration and production company focusedon developing its long-life natural gas reserves in the Green River Basin of Wyoming –Pinedale and Jonah fields and is in the ongoing exploration and early development stagein the Appalachian Basin of Pennsylvania.
Ultra Petroleum Corp. NYSE: UPL
A Unique Energy Company
Ultra Petroleum Corp. NYSE: UPL 2
2012Disciplined Capital Allocation Strategy
• Reduce capital investments in declining price environment• Monetize liquids gathering system• Focus on returns
2001 – 2011Focused on Profitable Growth• Production growth: 1,911%• 1P Reserve growth: 1,019%• ROE: 36% average• ROCE: 24% average
2013+On the Horizon…
• Invest within cash flow• Allocate project capital >20% IRR• No growth for growth’s sake• Preserve concentrated assets• Maintain low cost leadership

Strong Reserve Base
Wyoming Lance
9.6 Tcfe• 2,900 future net
wells• $13,600MM
future capital• $1.42/Mcfe
F&D cost
Pennsylvania Marcellus
7.4 Tcfe• 1,700 future net
wells• $11,300MM
future capital• $1.52/Mcfe
F&D cost
TotalReserves17.0 Tcfe
• 4,600 future net wells
• $24,900MM future capital
• $1.46/Mcfe F&D cost
Ultra Petroleum Corp. NYSE: UPL 3
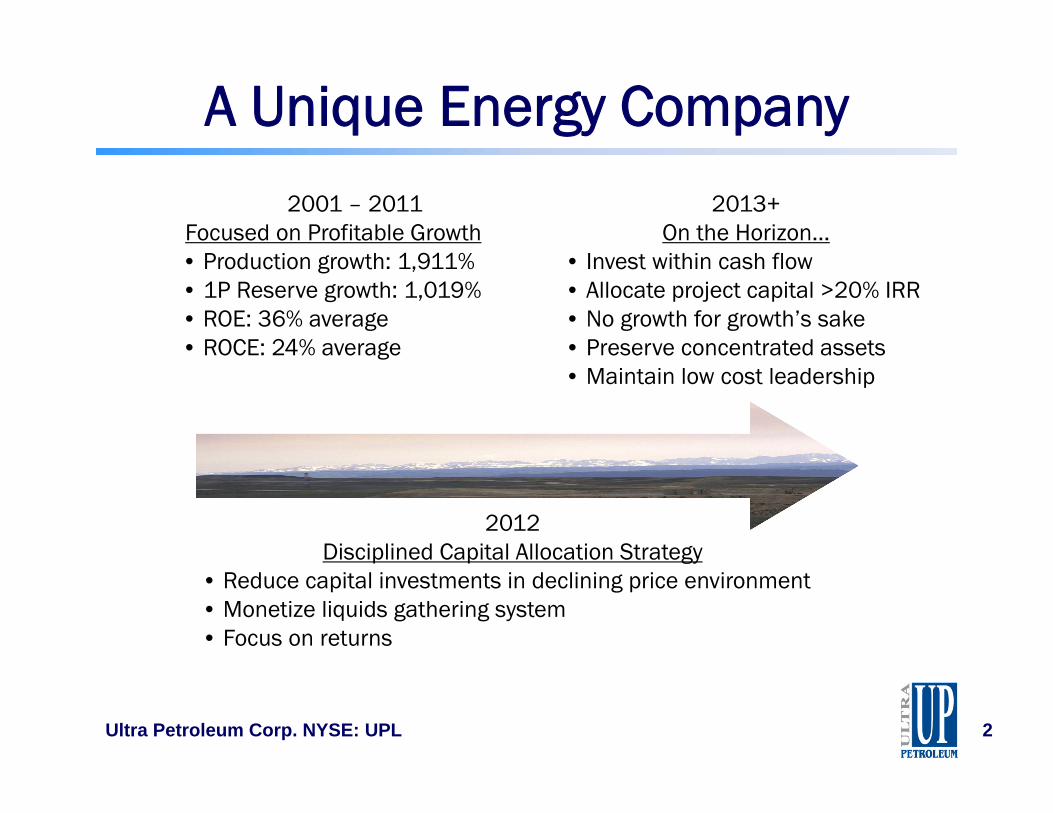
Long-Life, Low-Cost, Lance Tight Gas
Ultra Petroleum Corp. NYSE: UPL 4
Jonah Field21,000 acres
UPL: 2,150 gross (1,350 net)
1,760 wells / ~ 0.7 BcfdField OGIP = 15.0 Tcf
Recoverable = 10.5 TcfHBP Status: 100%
Pinedale Field53,440 acres
UPL: 40,160 gross (21,375 net)
2,200 wells / ~ 1.5 BcfdField OGIP = 58.7 Tcf
Recoverable = 38.2 TcfHBP Status: 100%

Pinedale’s Profitable Well Economics
Ultra Petroleum Corp. NYSE: UPL 5
4.00Bcfe
5.00 Bcfe
6.00 Bcfe
Vertical Depth 13,500’ 13,500’ 13,500’
Well Cost ($MM): $4.4 $4.4 $4.4
IRR*: 26% 44% 65%
F&D Cost/Mcfe: $1.35 $1.08 $0.90
Payout, months: 48 29 21
Reserve Life, yrs: 32 35 38
* Economics at $4.00/Mcf wellhead price0%
20%
40%
60%
80%
100%
120%
140%
160%
$3 $4 $5 $6
IRR
Wellhead Gas Price
6.0 Bcfe 5.0 Bcfe 4.0 Bcfe

0
10
20
30
40
50
60
70
2006 2007 2008 2009 2010 2011 2012 Q12013
Spud to TD (Days)
Pinedale Field
0
10
20
30
40
50
60
70
80
2006 2007 2008 2009 2010 2011 2012 Q12013
Rig Release to Rig Release
(Days)
Pinedale Field
Improving Operating Efficiencies…
Ultra Petroleum Corp. NYSE: UPL 6
RR-RRReduced by 71%
Spud to TDReduced by
67%

…Leads to Further Cost Reductions
Ultra Petroleum Corp. NYSE: UPL 7
$-
$1.0
$2.0
$3.0
$4.0
$5.0
$6.0
$7.0
$8.0
2006 2007 2008 2009 2010 2011 2012 Q12013
TotalWell Cost
($MM)
Pinedale Field
Total Well CostsReduced by 29%

Extensive Future Wyoming Development
Ultra Petroleum Corp. NYSE: UPL 8
1,850 producing wells YE2012
5,000+ remaining gross locations
<25% field developed

Abundant Marcellus Shale
Clinton-Lycoming Area90,000 net acresHBP Status: 85%
120 producing horizontal wellsYear-end 2012
Potter-Tioga Area170,000 net acresHBP Status: 70%
202 producing horizontal wellsYear-end 2012
Ultra Petroleum Corp. NYSE: UPL 9
Ultra-Interest Lands

Ultra Petroleum Corp. NYSE: UPL 10
Consistent Marcellus Performance
Sproul
Grugan
Bull Run
Marshlands
Texas Creek
WellsboroKrause
TiogaPotter
LycomingClinton
Grugan & Bull Run Areas114 wells
Avg. IP = 6.7 MMcf/d
Texas Creek Area30 wells
Avg. IP = 6.9 MMcf/d
Wellsboro Area85 wells
Avg. IP = 7.2 MMcf/dKrause Area
58 wells Avg. IP = 7.0 MMcf/d
Sproul Area17 wells
Avg. IP = 4.8 MMcf/d

Strong Marcellus Well Economics
Ultra Petroleum Corp. NYSE: UPL 11
* Economics at $4.00/Mcf wellhead price
0%
20%
40%
60%
80%
100%
120%
140%
160%
180%
200%
$3 $4 $5 $6
IRR
Wellhead Gas Price$7.2MM & 5.0 Bcfe $6.2MM & 7.0 Bcfe $6.2MM & 9.0 Bcfe
Vertical Depth 5,600’ 8,400’ 8400'
Well Cost: $7.2 MM $6.2 MM $6.2 MM
IRR*: 12% 47% 82%
F&D Cost/Mcfe: $1.69 $1.01 $0.79
Payout, months: 152 25 15
Reserve Life, yrs: 39 42 42
5.0Bcfe
7.0Bcfe
9.0Bcfe

Early Stages of Marcellus Development
Ultra Petroleum Corp. NYSE: UPL 12
204 producing wells YE2011
322 producing wells YE2012
3,340 future locations
<10% field developed

Geneseo Resource Upside
Ultra Petroleum Corp. NYSE: UPL 13
Geneseo
Marcellus
Tully
Hamilton
Upper Marcellus
~900’
Geneseo Horizontal Activity
UPL Participation Wells 3rd Party Wells
Geneseo AreaUltra has
dominant position
Net Risked Resource Potential = ~3.3 Tcfe• Play area delineated by 14 horizontal wells in Ultra leasehold• Higher total organic content in the West• Can leverage existing Marcellus pads and infrastructure

Restoring 2012 Reserves
PUD 1.19 Tcfe
PD 1.88 Tcfe
YE’12 Proved Reserves@ $2.63/Mcf
3.1 Tcfe
YE’12 Restored Proved Reserves Sensitivity@$4.04/Mcf
5.0 Tcfe
1.89 Tcfe
PUD 1.19 Tcfe
PD 1.88 Tcfe
Ultra Petroleum Corp. NYSE: UPL 14
Restore YE’11 PUD capital & gas price
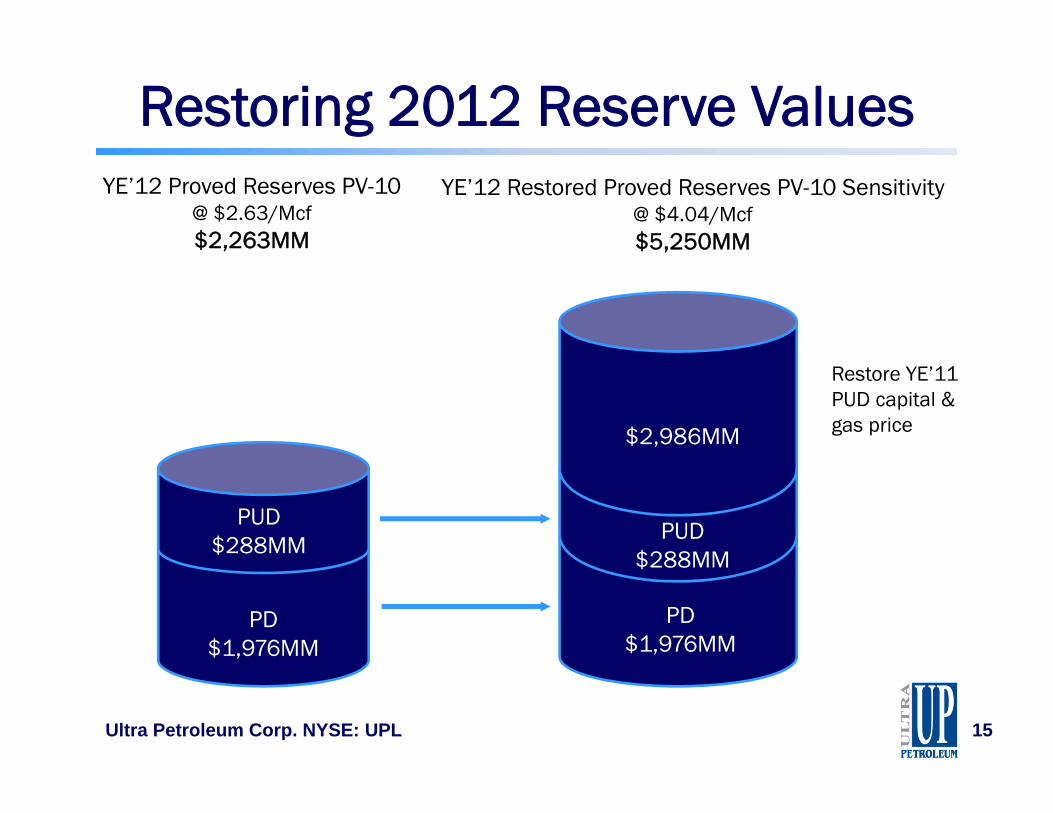
Restoring 2012 Reserve Values
PUD $288MM
PD $1,976MM
YE’12 Proved Reserves PV-10 @ $2.63/Mcf$2,263MM
YE’12 Restored Proved Reserves PV-10 Sensitivity @ $4.04/Mcf$5,250MM
$2,986MM
PUD$288MM
PD $1,976MM
Ultra Petroleum Corp. NYSE: UPL 15
Restore YE’11 PUD capital & gas price

Growing Resource Base
11.38 11.22
4.68 5.84
0
2
4
6
8
10
12
14
16
18
20
YE11 YE12
3P Reserves
16.0 Tcfe
17.1 TcfeYear-End 2012
Reserve CategoryReserves
(Bcfe)
$6/McfPV-10
($MM)
$5/McfPV-10
($MM)
Proved 3,202 $6,900 $5,520
Probable 8,022 6,763 4,373
2P: (PV + PR) 11,224 13,664 9,893
Possible 5,841 5,198 3,453
3P: (PV + PR + PS) 17,065 $18,862 $13,346
2P
Ultra Petroleum Corp. NYSE: UPL 16

Economic Fundamentals
Ultra Petroleum Corp. NYSE: UPL 17
F&DCost
$0.83Per
Mcfe
Full CycleReturns
335%
Reserve Replacement
Ratio
332%
Cash flow Per Mcfe
$2.78Per
Mcfe
2012

Industry’s Low-Cost Producer
$0.00
$2.00
$4.00
$6.00
$8.00
$10.00
$12.00
$14.00
All-in Costs per Mcfe
2012 All-In Costs per Mcfe
Source: Wells Fargo
Q12013 Costs Per McfeLOE $0.40 Production Tax 0.28 Gathering Fees 0.20 Transportation 0.34DD&A 1.04 G&A 0.10 Int. & Debt 0.43
$2.79
Mean -$7.31/Mcfe
Ultra Petroleum Corp. NYSE: UPL 18

Strong & Stable Margins
Ultra Petroleum Corp. NYSE: UPL 19
75%70% 70% 73%
64%
0%
10%
20%
30%
40%
50%
60%
70%
80%
90%
100%
2008 2009 2010 2011 2012
Cash Flow Margin
$1.35$1.15$1.18$1.20$1.20
Cash Flow Breakeven ($/Mcfe)
37%
31% 31% 30% 29%
0%
5%
10%
15%
20%
25%
30%
35%
40%
45%
50%
2008 2009 2010 2011 2012
Net Income Margin
$2.69 $2.54 $2.53 $2.82 $3.07
Net Income Breakeven ($/Mcfe)

Disciplined Capital Allocation
Ultra Petroleum Corp. NYSE: UPL 20
$1,560MM
$835MM
$415MM
Historical Capital Investment Programs
2011
2012
2013
Realized Natural Gas Prices ($/Mcf)
2011: $5.05
2012: $4.01
2013: $3.50-estimate

Prudently Investing Within Cash Flow
$0
$50,000
$100,000
$150,000
$200,000
$250,000
$300,000
$350,000
Q1 2012 Q2 2012 Q3 2012 Q4 2012 Q1 2013 Q2 2013E Q3 2013E Q4 2013E
Capex (000's) Cash Flow (000's)
Cash flow positive Q312
Ultra Petroleum Corp. NYSE: UPL 21

Total Debt Capacity $2.7B
March 31, 2013
Net Debt $1,919MM
Short-term Liquidity $627MM
Debt/EBITDA 2.5X
EBITDA/Interest 8.0X
Enhancing Financial Flexibility
Ultra Petroleum Corp. NYSE: UPL 22
$1,000,000
$1,200,000
$1,400,000
$1,600,000
$1,800,000
$2,000,000
$2,200,000
$2,400,000
Debt Balance

Decreasing Natural Gas Production
Source: GenscapeUltra Petroleum Corp. NYSE: UPL 23
52
54
56
58
60
62
64
66
68
Bcf/Day
Lower 48 Pipeline Data
Lower 48 production peak of 65.7 Bcf/d on 11/5/12
Current - 64.7 Bcf/d

Gas Price Sensitivities and Induced Coal-to-Gas Switching
$1.00
$1.50
$2.00
$2.50
$3.00
$3.50
$4.00
$4.50
$5.00
$5.50
$6.00
0.0 1.0 2.0 3.0 4.0 5.0
NYMEX Natural Gas ($/MMbtu)
Cumulative Coal-to-Gas Substitution(Bcf/Day)
2.0 Bcf/d
Goldman estimates 2.0 Bcf/d of coal-to-gas switching is required in 2013, which translates to an average natural gas price of $4.40/MMbtu for the balance of 2013
2013 Coal Prices:CAPP: $60/tonPRB: $10/tonGoldman Sachs new
2013 (balance) price forecast of $4.40/MMbtu
2012: 4.9 Bcf/d
Old forecast: $3.75/MMbtu = 2.4 Bcf/d of coal-to-gas switching
Source: Goldman SachsUltra Petroleum Corp. NYSE: UPL 24

West/Rockies Marketing Update
Rockies basis narrowing with additional pipeline
capacity •Average basis ‘07 – ’09:
68%HH•Average basis ‘10 – ’12:
93%HH•Winter ‘12-’13 Opal has
consistently traded above Henry Hub
REX flowing ~ 50% capacity
•Lower differentials West vs. East flows
•Minimal Opal, WY supply on REX
•REX volumes sourced by Meeker/White River Hub (ECA & COP)
Rockies and Western Canadian supply down
year over year •Rockies supply
2012/2013 down ~0.9Bcf/d
•Western Canadian supply into US 2012/2013 down ~ 0.35Bcf/d
Structural change and generation load
•San Onofre nuclear plant continued outage no time table for return
•0.5Bcf/d increased gas demand due to outage
Ultra Petroleum Corp. NYSE: UPL 25
Source: Bentek, Genscape, Company estimates

Ultra Petroleum Corp. NYSE: UPL 26Source: PIRA
Marcellus Gas Entering New Markets
• Rapid pace of development has caused a pursuit of “new” markets for Marcellus gas
– Eastern Canada: export capacity of 450MMcf/d as of 4Q12 (Niagra)
– NJ/NY: 800MMcf/d of new capacity delivered to NYC by late 4Q13
– NYC/Long Island: 2 projects underway to provide 350MMcf/d new capacity by 4Q13/2Q14
– New England: 1.5+Bcf/d new capacity by 4Q15/4Q16
• Southeast and Midwest market projects targeted for 2016+ adding 1+Bcf/d
• New market access for Marcellus will displace Canadian imports to the northeast region
• Improve regional basis differentials
Leidy Southeast
Nexus Gas Transmission
ANR LebanonLateral Reversal
NE Supply Link
TGP NE Upgrade
Marcellus Facilities Expansion
TETCO NJ/NY Exp.
A.I.M.
Constitution

Outlook for 2013
• Target drilling program– 114 gross (51 net) Wyoming wells– 28 gross (14 net) Pennsylvania wells
• Production goal 228 – 238 Bcfe– 135 gross (60 net) Wyoming wells online– 40 gross (20 net) Pennsylvania wells online
• Budgeted capex $415MM$260
$105
$5 $35 $10
2013Capital Investment Program
$415MM
Rockies
Appalachia
Land
Gathering and Facilities
Corporate
Ultra Petroleum Corp. NYSE: UPL 27

Growth Ahead
2013E 2014E 2015E 2016EOperations
Realized price ($/Mcf) 3.50$ 4.00$ 4.25$ 4.50$ Capex ($MM) 415$ 675$ 890$ 995$ Production (Bcfe) 233 245 285 330
Income Statement ($MM)
EBITDA 600$ 755$ 965$ 1,200$
Balance Sheet ($MM)
Ending debt balance 1,890$ 1,840$ 1,810$ 1,660$
Ultra Petroleum Corp. NYSE: UPL 28
42%
100%

The Ultra Petroleum Story
High asset quality
Disciplined capitalallocation strategy
Robust investment portfolio
Ultra Petroleum Corp. NYSE: UPL 29
• Highly concentrated asset• Domestic, onshore natural gas• Low all-in and F&D costs
• Invest within cash flow• No growth for growth’s sake• Allocate capital >20% IRR
• 4,600 future net drilling locations• $24.9B future development capital• 20+ years inventory

Appendix
Ultra Petroleum Corp. NYSE: UPL 30

Production and Financial Guidance
Q2 2013 Guidance
• Q2 2013 estimated production– 57.0 – 59.0 Bcfe
• Q2 2013 realized pricing– Natural gas: 2 - 4% discount to NYMEX– Condensate: $7.00 discount to NYMEX
• Q2 2013 expense guidance– Assumes $4.11 per Mmbtu and $91.00 per Bbl– Total operating costs per Mcfe $2.85 - $3.01
Ultra Petroleum Corp. NYSE: UPL 31

Providing Certainty to Cash Flow
Hedging Summary
NYMEX Q2 2013 Q3 2013 Q4 2013 Total 2013
Volume (Bcf) 33.4 35.9 12.1 81.4
$/Mmbtu $3.51 $3.54 $3.54 $3.53
$/Mcf $3.72 $3.75 $3.75 $3.74Note: Amounts may not total due to rounding
Ultra Petroleum Corp. NYSE: UPL 32

Profitable Reinvestment Opportunities
Ultra Petroleum Corp. NYSE: UPL 33Based on $4.4MM/ Pinedale well cost
4 Bcfe 5 Bcfe 6 Bcfe 7 Bcfe
$3/Mcf 13% 24% 37% 52%
$4/Mcf 26% 44% 65% 92%
$5/Mcf 43% 69% 104% 147%
$6/Mcf 63% 102% 154% 221%
$7/Mcf 87% 142% 218% 320%
$8/Mcf 116% 193% 301% 451%
Gas
Pric
eReserve Size - Pinedale Wells

Marcellus Technical Review Updates
• High-grading acreage to optimize returns– Utilizing seismic attributes to delineate resource sweet spots– Sweet spot EUR’s 2.5 times better than non-sweet spot– 944 sq-mi of UPL and partner 3D data (~70% of leasehold coverage)
• Studying correct well spacing – currently 110 acres per well– 6 increased density pilots completed and online– Development plan in one area downspaced to 750’
• Ongoing completion optimization– Evaluating stage count and frac volume reduction – Achieving comparable well performance with fewer stages
Ultra Petroleum Corp. NYSE: UPL 34

Conservative Type Curve Estimates
Ultra Petroleum Corp. NYSE: UPL 35
0.0
1.0
2.0
3.0
4.0
5.0
6.0
7.0
8.0
1 91 181 271 361 451 541 631 721
Gro
ss P
rodu
ctio
n(M
Mcf
e/D
)
Days
7 Bcfe
5 Bcfe
Clinton-Lycoming AreaPotter-Tioga Area

4 Bcfe 5 Bcfe 6 Bcfe 7 Bcfe 8 Bcfe 9 Bcfe$5.5MM 12% 24% 44% 62% 82% 107%
$6.0MM 9% 19% 36% 51% 68% 88%
$6.5MM 7% 16% 30% 43% 57% 74%
$7.0MM 5% 13% 25% 36% 48% 63%
$7.5MM 3% 10% 22% 31% 42% 54%
$8.0MM 2% 8% 19% 27% 36% 47%
Wel
l Cos
t
Reserve Size - Marcellus Wells
Marcellus Well Economics
Ultra Petroleum Corp. NYSE: UPL 36
* Economics at $4.00/Mcf wellhead price

Production Lags Capital Spend
Ultra Petroleum Corp. NYSE: UPL 37
0
10
20
30
40
50
60
70
80
90
$0
$50
$100
$150
$200
$250
$300
$350
$400
$450
Production(Bcfe)
Capex($MM)
Capital Budget vs. Production
Cap-Ex ($MM)Production (Bcfe)

Expanding Rockies Capacity
0.0
2.0
4.0
6.0
8.0
10.0
12.0
Average Daily Volume
(Bcf/D)
Actual Forecast Pipeline CapacitySource: Bentek Energy
Excess takeaway capacity ~4.3 Bcf/d
Ultra Petroleum Corp. NYSE: UPL 38

New Ventures Strategy
Ultra Petroleum Corp. NYSE: UPL 39
• Objectives:– Identify best geologic provinces and plays in North America– Develop detailed in-house familiarity with attractive plays– Identify entry points to plays of interest
• Focus on strategic / complementary fit– Targeting plays that leverage Ultra’s operational expertise– Prioritizing high ROR resource type plays– Focused on impact to existing returns in portfolio

Benefits of Using Natural Gas
• Domestic: Greater use of this clean, abundant, made–in-America energy source will create U.S. jobs and boost local economies, while advancing our national security
• Abundant: 2,543 Tcf of natural gas reserves and technically recoverable natural gas in the U.S. will power America for generations
• Clean: Represents the only clean energy option of adequate scale available today to start meaningful air quality improvements over the 10 years
• Jobs: Supported more than 2.8 million jobs in the U.S. in all 50 states
Ultra Petroleum Corp. NYSE: UPL 40

Innovative Employees • We value the multi-faceted skills and performance our talented
employees have to offer
• We have a unique, entrepreneurial, value-driven business culture
• We operate in a highly decentralized work environment where employees can see their projects come to fruition
• Responsibility and accountability go hand-in-hand for all employees at all levels; every employee is recognized for their contribution and performance
• All employees are challenged to deliver best-in-class results as normal everyday business practice
Ultra Petroleum Corp. NYSE: UPL 41

Safety and Environmental• We are committed to safe operations, and maintain high standards of
ethical conduct by employees, contractors and service providers
• We pursue our work with integrity and respect for the environment where we conduct our business
• We have established a leadership role in the development of industry best practices which is recognized by regulatory agencies
• We are active in incident management and response planning by working with local government and first responders to identify roles and responsibilities for a robust unified management approach to unique situations
• We are dedicated to maintain a safe and secure work environment for all our employees
Ultra Petroleum Corp. NYSE: UPL 42
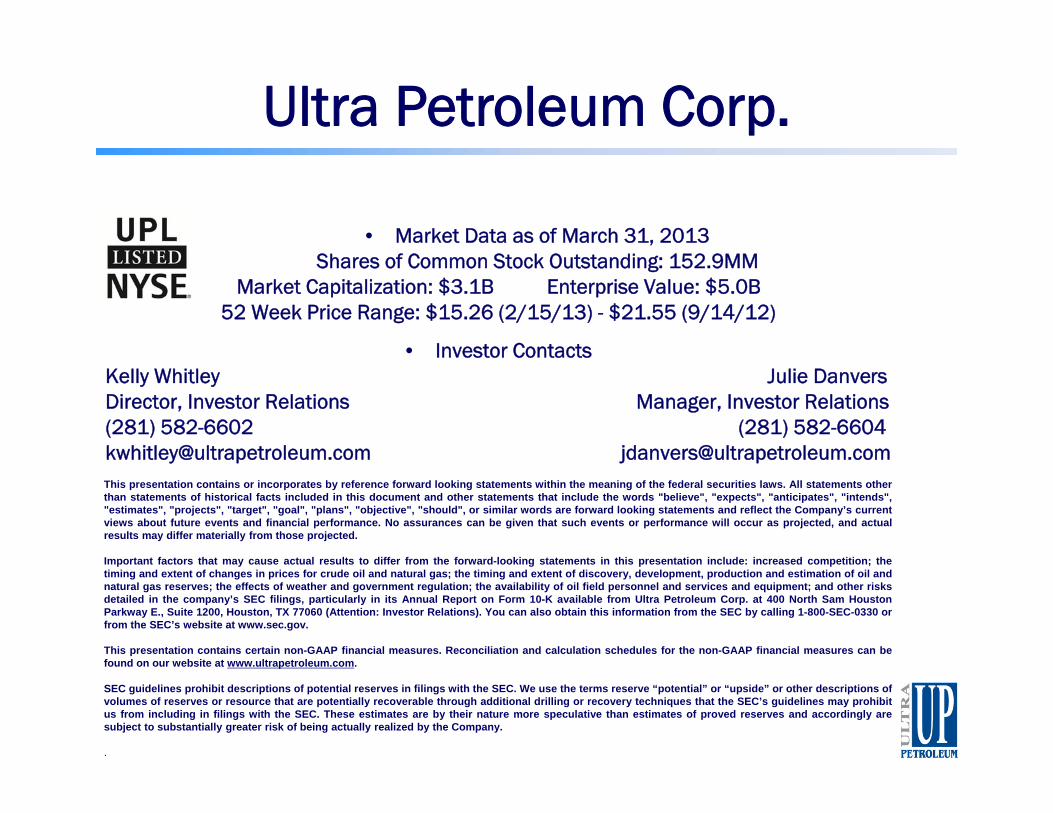
Ultra Petroleum Corp.
• Market Data as of March 31, 2013Shares of Common Stock Outstanding: 152.9MM
Market Capitalization: $3.1B Enterprise Value: $5.0B52 Week Price Range: $15.26 (2/15/13) - $21.55 (9/14/12)
• Investor ContactsKelly Whitley Julie DanversDirector, Investor Relations Manager, Investor Relations(281) 582-6602 (281) [email protected] [email protected] presentation contains or incorporates by reference forward looking statements within the meaning of the federal securities laws. All statements otherthan statements of historical facts included in this document and other statements that include the words "believe", "expects", "anticipates", "intends","estimates", "projects", "target", "goal", "plans", "objective", "should", or similar words are forward looking statements and reflect the Company’s currentviews about future events and financial performance. No assurances can be given that such events or performance will occur as projected, and actualresults may differ materially from those projected.
Important factors that may cause actual results to differ from the forward-looking statements in this presentation include: increased competition; thetiming and extent of changes in prices for crude oil and natural gas; the timing and extent of discovery, development, production and estimation of oil andnatural gas reserves; the effects of weather and government regulation; the availability of oil field personnel and services and equipment; and other risksdetailed in the company’s SEC filings, particularly in its Annual Report on Form 10-K available from Ultra Petroleum Corp. at 400 North Sam HoustonParkway E., Suite 1200, Houston, TX 77060 (Attention: Investor Relations). You can also obtain this information from the SEC by calling 1-800-SEC-0330 orfrom the SEC’s website at www.sec.gov.
This presentation contains certain non-GAAP financial measures. Reconciliation and calculation schedules for the non-GAAP financial measures can befound on our website at www.ultrapetroleum.com.
SEC guidelines prohibit descriptions of potential reserves in filings with the SEC. We use the terms reserve “potential” or “upside” or other descriptions ofvolumes of reserves or resource that are potentially recoverable through additional drilling or recovery techniques that the SEC’s guidelines may prohibitus from including in filings with the SEC. These estimates are by their nature more speculative than estimates of proved reserves and accordingly aresubject to substantially greater risk of being actually realized by the Company.
.
Recommended