ULI Real Estate
Consensus Forecast A Survey of Leading Real Estate Economists/Analysts
April 2015
Anita Kramer
Senior Vice President
Center for Capital Markets and Real Estate
ULI Real Estate Consensus Forecast
• Three-year forecast (‘15-’17) for 27 economic and real estate indicators
• A consensus forecast based on the median of the forecasts from 46
economists/analysts at 33 leading real estate organizations
• Respondents represent major real estate investment, advisory, and
research firms and organizations
• Survey undertaken from February 27- March 23 2015
• A semiannual survey; next release planned for October 2015
• Forecasts for:
– Broad economic indicators
– Real estate capital markets
– Property investment returns for four property types
– Vacancy rates and rents for five property types
– Housing starts and prices
2
ULI Real Estate Consensus Forecast
Overview
• The ULI Real Estate Consensus Forecast for April 2015 projects continued
economic expansion at healthy and steady levels over the next three years;
continued strength from real estate capital markets; above-average rent
growth in all commercial real estate sectors and improvement in
vacancy/occupancy rates (except for apartments); continued price
appreciation at above-average, but moderating, rates for existing single
family housing and below-average growth in starts for single family housing.
• All economic and real estate indicators are forecasted to be better than their
long-term average, with the exception of equity REIT returns, NCREIF retail
and apartment total returns, retail vacancy rates and single-family housing
starts.
• Compared to the previous forecast in October 2014, this forecast is more
optimistic for years 2015 and 2016 for all real estate indicators with the
exception of single family starts.
3
ULI Real Estate Consensus Forecast
Key Findings
• Commercial property transaction volume is expected to increase for another two years and then level off at a robust
$500 billion by 2017.
• CMBS issuance continues its strong comeback with steady growth over the next three years, increasing another
60% by 2017.
• Institutional real estate assets are expected to provide total returns across all sectors of 11.0% in 2015, moderating
to 10% in 2016 and 9.0% in 2017. By property type, returns are expected to be strongest for industrial and office,
followed by retail and apartments, in all three years.
• Vacancy rates are expected to decrease modestly for office and retail over all three forecast years. Industrial
availability rates and hotel occupancy rate are forecasted to improve modestly in 2015 and 2016 and plateau in
2017. Apartment vacancy rates are expected to rise slightly.
• Commercial property rents are expected to increase for the four major property types in 2015, ranging from 2.0% for
retail up to 4.0% for both office and industrial. Rent increases in 2017 in these four types will range from 2.7% to
3.5%. Hotel RevPAR is expected to increase by 7.0% in 2015 and 4.0% in 2017.
• Single-family housing starts are projected to increase from 647,400 units in 2014 to 900,000 units in 2017, remaining
below the 20-year annual average. This is the only indicator for which analysts lowered their forecasts for ‘15 and
’16, compared to 6 months ago.
4
ULI Real Estate Consensus Forecast
Economy
• The economists/analysts expect continued economic expansion at healthy and fairly
steady levels in the next three years.
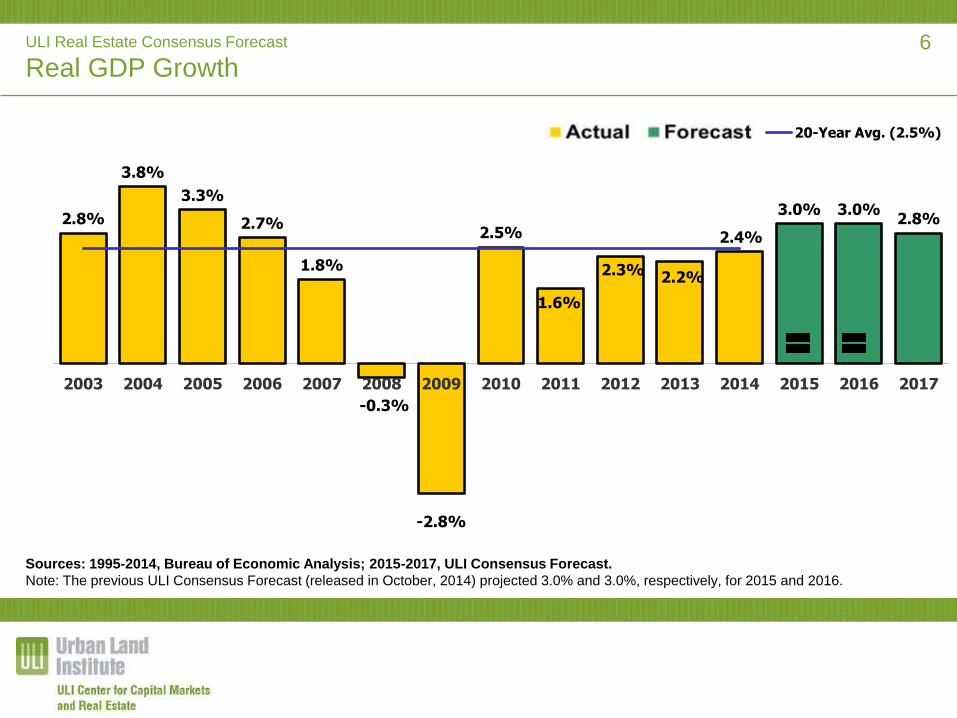
• GDP growth is expected to be healthy at a steady rate of 3.0% in both 2015 and
2016, with just a slightly lower rate of 2.8% 2017; these are all the highest annual
growth rates in nine years.
• The unemployment rate is expected to decline a bit further to 5.3% by the end of
2015, 5.0% by the end of 2016, and remain at 5% at the end of 2017.
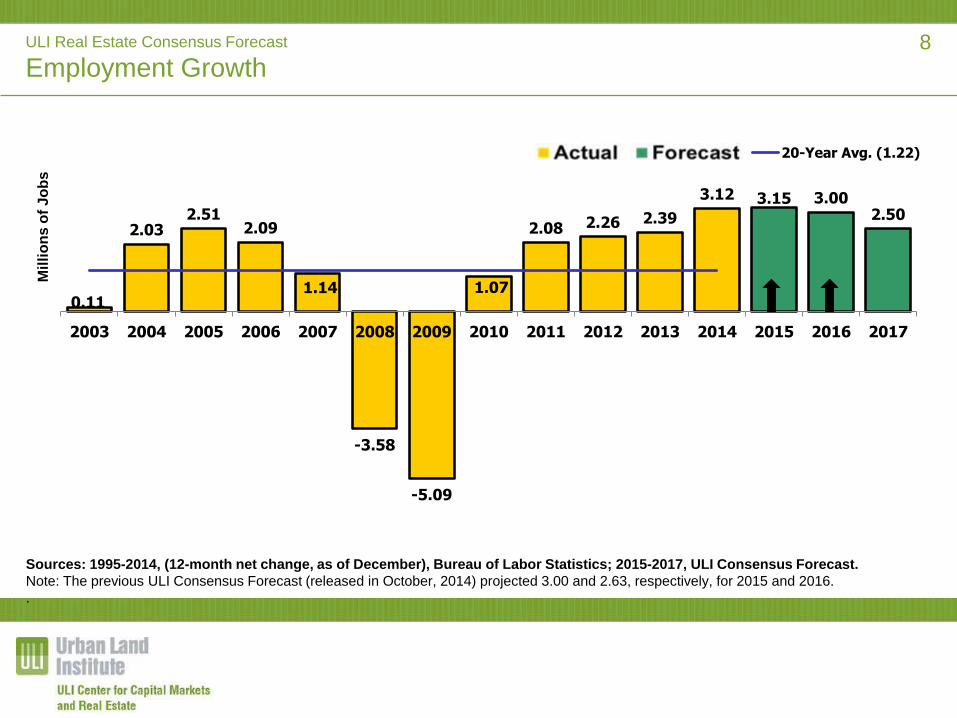
• Employment growth in 2015 and 2016 is expected to continue at about the same
level as in 2014 with 3.12 million jobs in 2015 and 3.00 million in 2016. Employment
growth is expected to continue at a somewhat slower but still strong pace of 2.50
million in 2017.
• Compared to forecasts of 6 month’s ago, employment forecasts for ‘15 and ‘16 are
somewhat more optimistic and GDP forecasts have remained the same.
5
ULI Real Estate Consensus Forecast
Real GDP Growth
2.8%
3.8%
3.3%
2.7%
1.8%
-0.3%
-2.8%
2.5%
1.6%
2.3% 2.2%
2.4%
3.0% 3.0%2.8%
2003 2004 2005 2006 2007 2008 2009 2010 2011 2012 2013 2014 2015 2016 2017
20-Year Avg. (2.5%)
Sources: 1995-2014, Bureau of Economic Analysis; 2015-2017, ULI Consensus Forecast.
Note: The previous ULI Consensus Forecast (released in October, 2014) projected 3.0% and 3.0%, respectively, for 2015 and 2016.
6
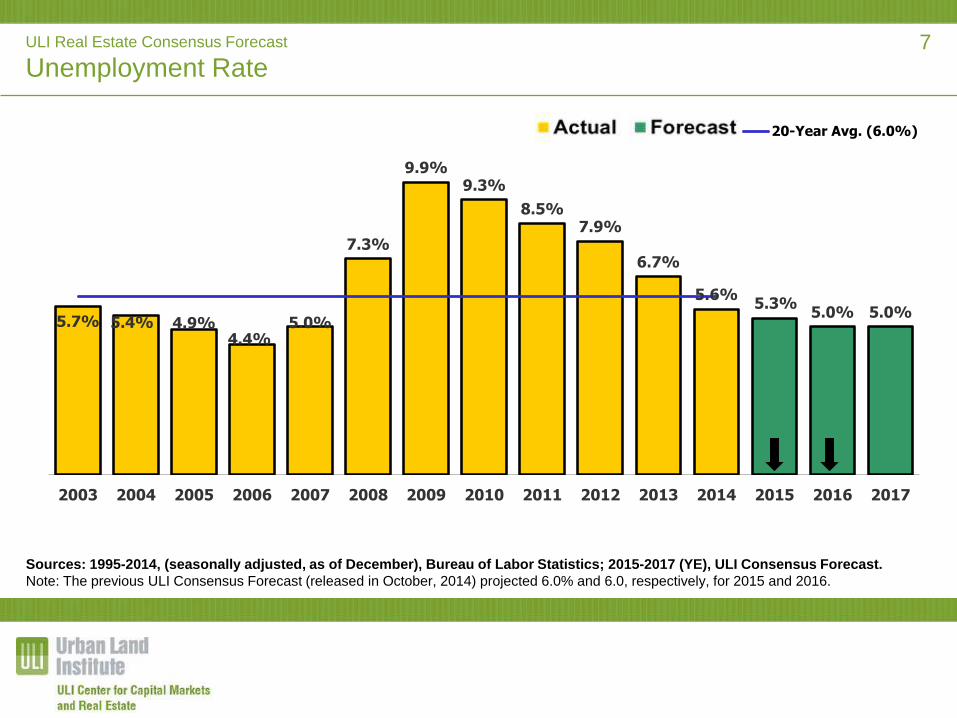
ULI Real Estate Consensus Forecast
Unemployment Rate
5.7% 5.4% 4.9%4.4%
5.0%
7.3%
9.9%9.3%
8.5%7.9%
6.7%
5.6%5.3%
5.0% 5.0%
2003 2004 2005 2006 2007 2008 2009 2010 2011 2012 2013 2014 2015 2016 2017
20-Year Avg. (6.0%)
Sources: 1995-2014, (seasonally adjusted, as of December), Bureau of Labor Statistics; 2015-2017 (YE), ULI Consensus Forecast.
Note: The previous ULI Consensus Forecast (released in October, 2014) projected 6.0% and 6.0, respectively, for 2015 and 2016.
7
ULI Real Estate Consensus Forecast
Employment Growth
Sources: 1995-2014, (12-month net change, as of December), Bureau of Labor Statistics; 2015-2017, ULI Consensus Forecast.
Note: The previous ULI Consensus Forecast (released in October, 2014) projected 3.00 and 2.63, respectively, for 2015 and 2016.
.
0.11
2.032.51
2.09
1.14
-3.58
-5.09
1.07
2.08 2.26 2.39
3.12 3.15 3.002.50
2003 2004 2005 2006 2007 2008 2009 2010 2011 2012 2013 2014 2015 2016 2017
Mil
lio
ns
of
Jo
bs
20-Year Avg. (1.22)
8
ULI Real Estate Consensus Forecast
Inflation, Interest Rates, and Cap Rates
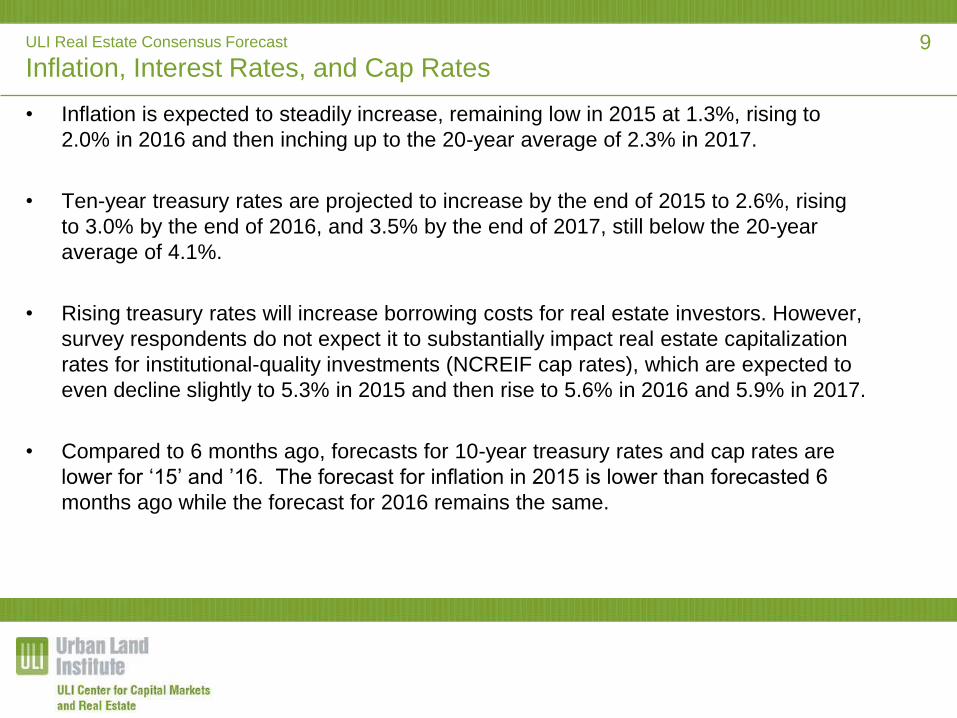
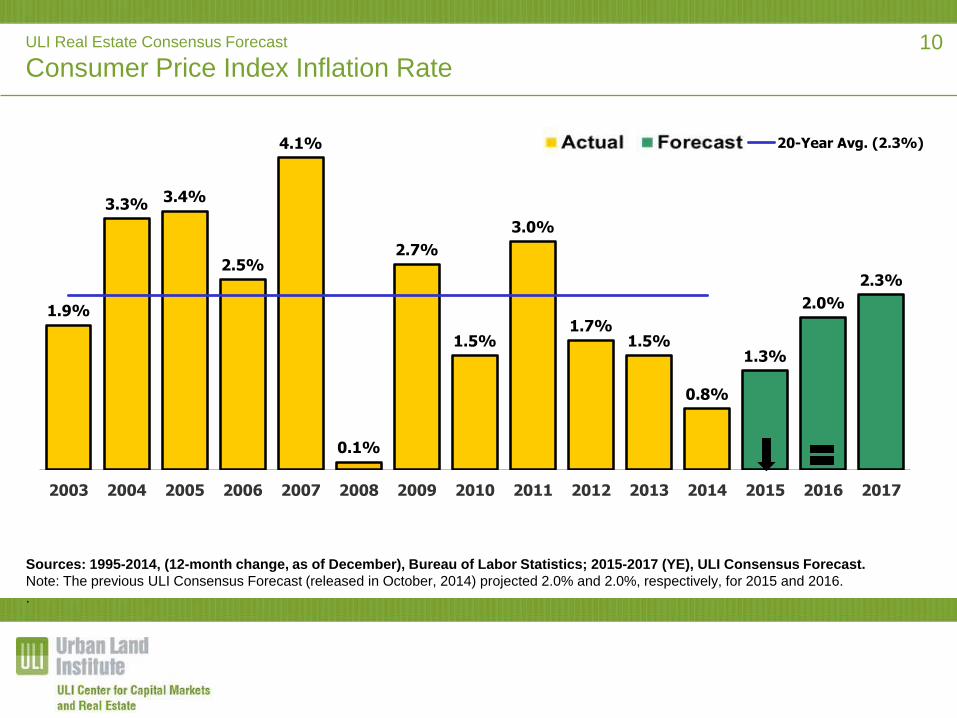
• Inflation is expected to steadily increase, remaining low in 2015 at 1.3%, rising to
2.0% in 2016 and then inching up to the 20-year average of 2.3% in 2017.
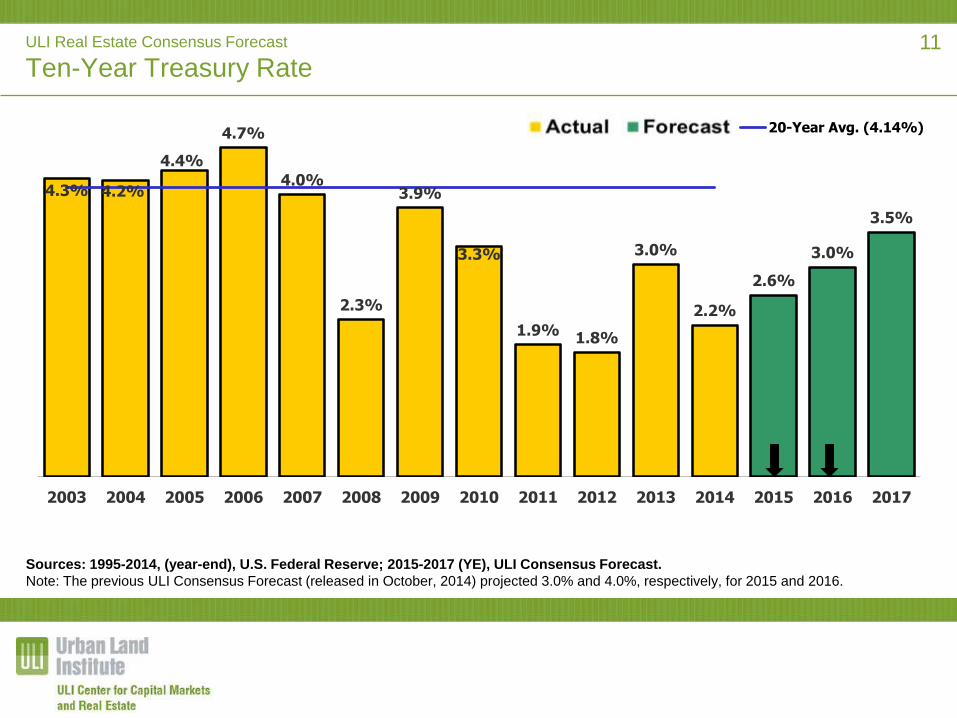
• Ten-year treasury rates are projected to increase by the end of 2015 to 2.6%, rising
to 3.0% by the end of 2016, and 3.5% by the end of 2017, still below the 20-year
average of 4.1%.
• Rising treasury rates will increase borrowing costs for real estate investors. However,
survey respondents do not expect it to substantially impact real estate capitalization
rates for institutional-quality investments (NCREIF cap rates), which are expected to
even decline slightly to 5.3% in 2015 and then rise to 5.6% in 2016 and 5.9% in 2017.
• Compared to 6 months ago, forecasts for 10-year treasury rates and cap rates are
lower for ‘15’ and ’16. The forecast for inflation in 2015 is lower than forecasted 6
months ago while the forecast for 2016 remains the same.
9
ULI Real Estate Consensus Forecast
Consumer Price Index Inflation Rate
1.9%
3.3%3.4%
2.5%
4.1%
0.1%
2.7%
1.5%
3.0%
1.7%1.5%
0.8%
1.3%
2.0%
2.3%
2003 2004 2005 2006 2007 2008 2009 2010 2011 2012 2013 2014 2015 2016 2017
20-Year Avg. (2.3%)
Sources: 1995-2014, (12-month change, as of December), Bureau of Labor Statistics; 2015-2017 (YE), ULI Consensus Forecast.
Note: The previous ULI Consensus Forecast (released in October, 2014) projected 2.0% and 2.0%, respectively, for 2015 and 2016.
.
10
ULI Real Estate Consensus Forecast
Ten-Year Treasury Rate
4.3% 4.2%
4.4%
4.7%
4.0%
2.3%
3.9%
3.3%
1.9%1.8%
3.0%
2.2%
2.6%
3.0%
3.5%
2003 2004 2005 2006 2007 2008 2009 2010 2011 2012 2013 2014 2015 2016 2017
20-Year Avg. (4.14%)
Sources: 1995-2014, (year-end), U.S. Federal Reserve; 2015-2017 (YE), ULI Consensus Forecast.
Note: The previous ULI Consensus Forecast (released in October, 2014) projected 3.0% and 4.0%, respectively, for 2015 and 2016.
11
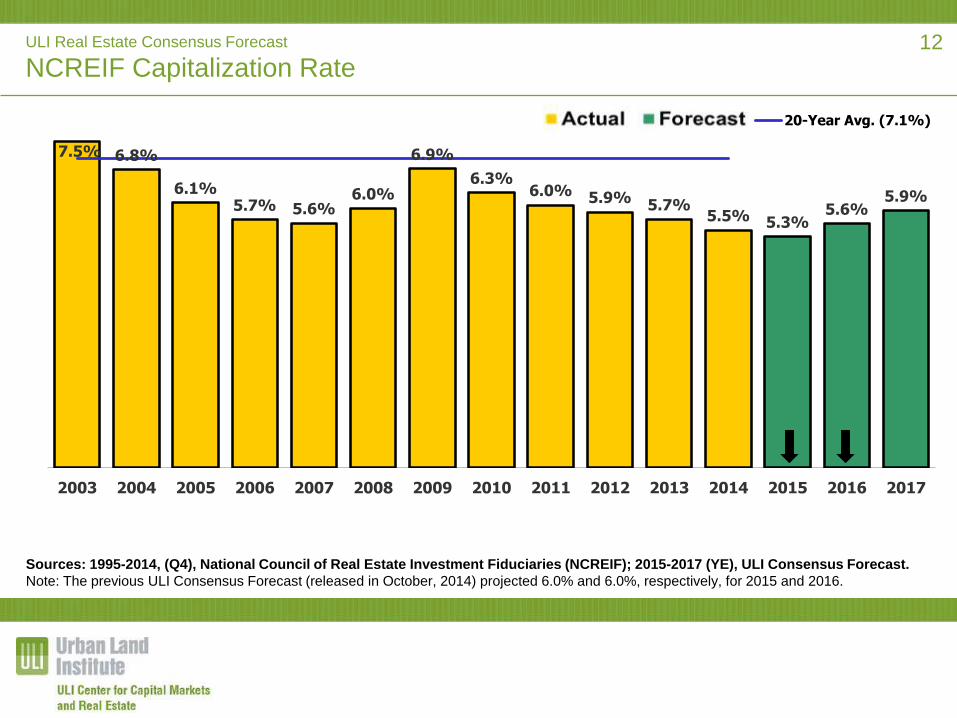
ULI Real Estate Consensus Forecast
NCREIF Capitalization Rate
7.5% 6.8%
6.1%5.7% 5.6%
6.0%
6.9%
6.3%6.0% 5.9% 5.7%
5.5% 5.3%5.6%
5.9%
2003 2004 2005 2006 2007 2008 2009 2010 2011 2012 2013 2014 2015 2016 2017
20-Year Avg. (7.1%)
Sources: 1995-2014, (Q4), National Council of Real Estate Investment Fiduciaries (NCREIF); 2015-2017 (YE), ULI Consensus Forecast.
Note: The previous ULI Consensus Forecast (released in October, 2014) projected 6.0% and 6.0%, respectively, for 2015 and 2016.
12
ULI Real Estate Consensus Forecast
Real Estate Capital Markets
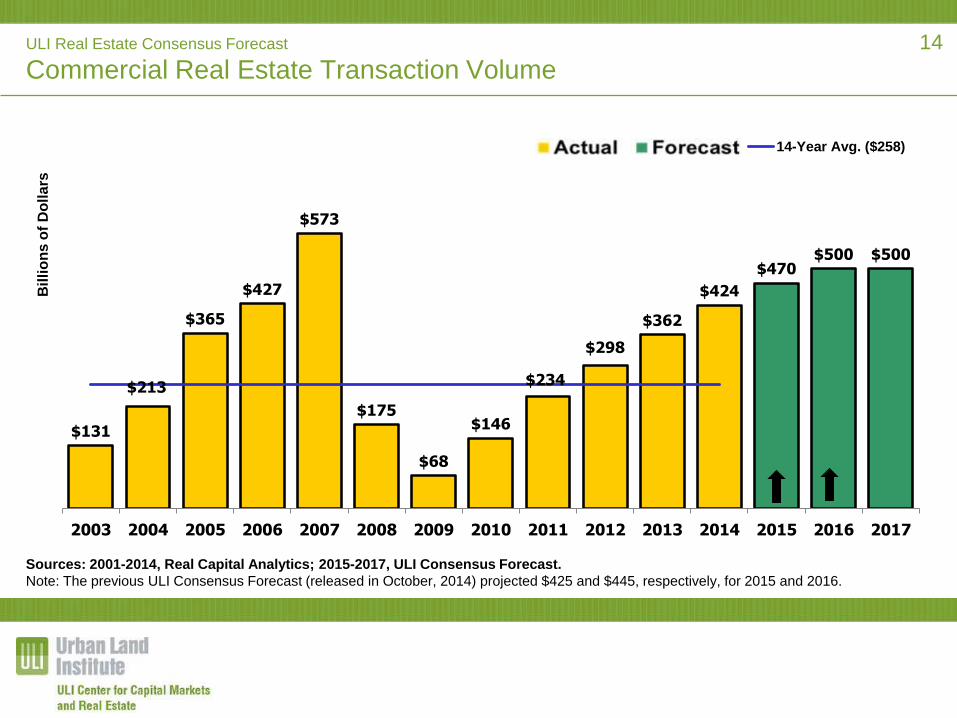
• Commercial real estate transaction has consistently increased for 5
years and should continue to be robust while leveling off in 2017 at a
level only surpassed by that in 2007. Volume is expected to increase
to $470 billion in 2015, $500 billion in 2016, and remain at $500
billion in 2017.
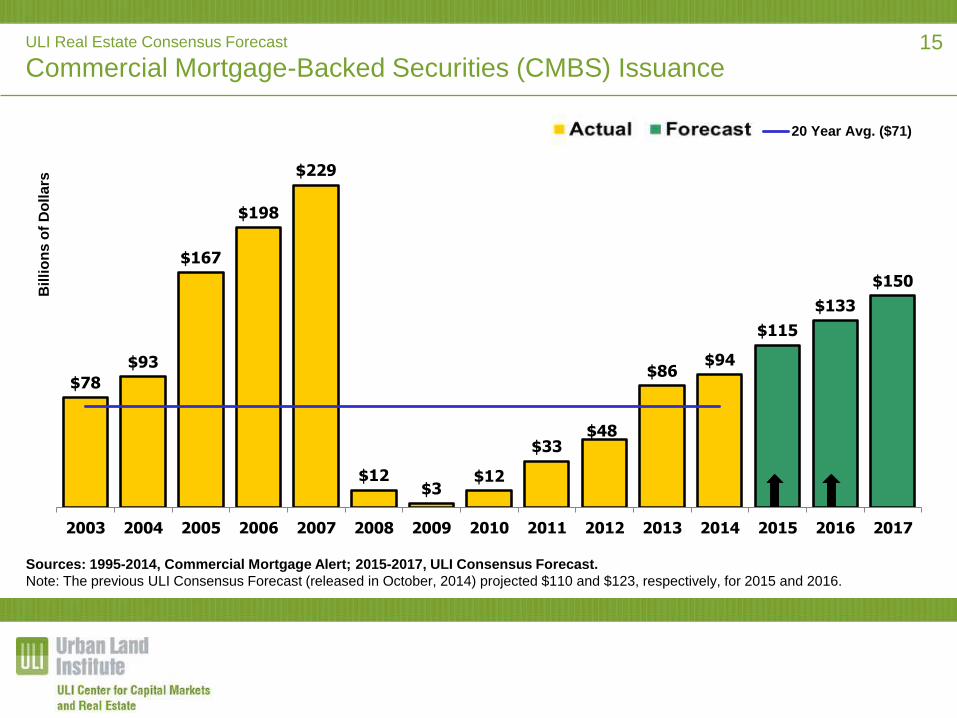
• Issuance of commercial mortgage-backed securities (CMBS), a key
source of financing for commercial real estate which has rebounded
nicely since 2009, is expected to continue to grow steadily through
2017. Issuance is projected to increase to $115 billion in 2015 and
grow steadily over the next two years to $133 billion in 2016 and
$150 billion in 2017.
• Compared to 6 months ago, the current forecasts for ‘15 and ‘16 for
both transactions and CMBS issuance are more optimistic.
13
ULI Real Estate Consensus Forecast
Commercial Real Estate Transaction Volume
$131
$213
$365
$427
$573
$175
$68
$146
$234
$298
$362
$424
$470$500 $500
2003 2004 2005 2006 2007 2008 2009 2010 2011 2012 2013 2014 2015 2016 2017
Bil
lio
ns
of
Do
lla
rs
14-Year Avg. ($258)
Sources: 2001-2014, Real Capital Analytics; 2015-2017, ULI Consensus Forecast.
Note: The previous ULI Consensus Forecast (released in October, 2014) projected $425 and $445, respectively, for 2015 and 2016.
14
ULI Real Estate Consensus Forecast
Commercial Mortgage-Backed Securities (CMBS) Issuance
Sources: 1995-2014, Commercial Mortgage Alert; 2015-2017, ULI Consensus Forecast.
Note: The previous ULI Consensus Forecast (released in October, 2014) projected $110 and $123, respectively, for 2015 and 2016.
15
$78
$93
$167
$198
$229
$12$3
$12
$33$48
$86$94
$115
$133
$150
2003 2004 2005 2006 2007 2008 2009 2010 2011 2012 2013 2014 2015 2016 2017
Bil
lio
ns
of
Do
lla
rs
20 Year Avg. ($71)
ULI Real Estate Consensus Forecast
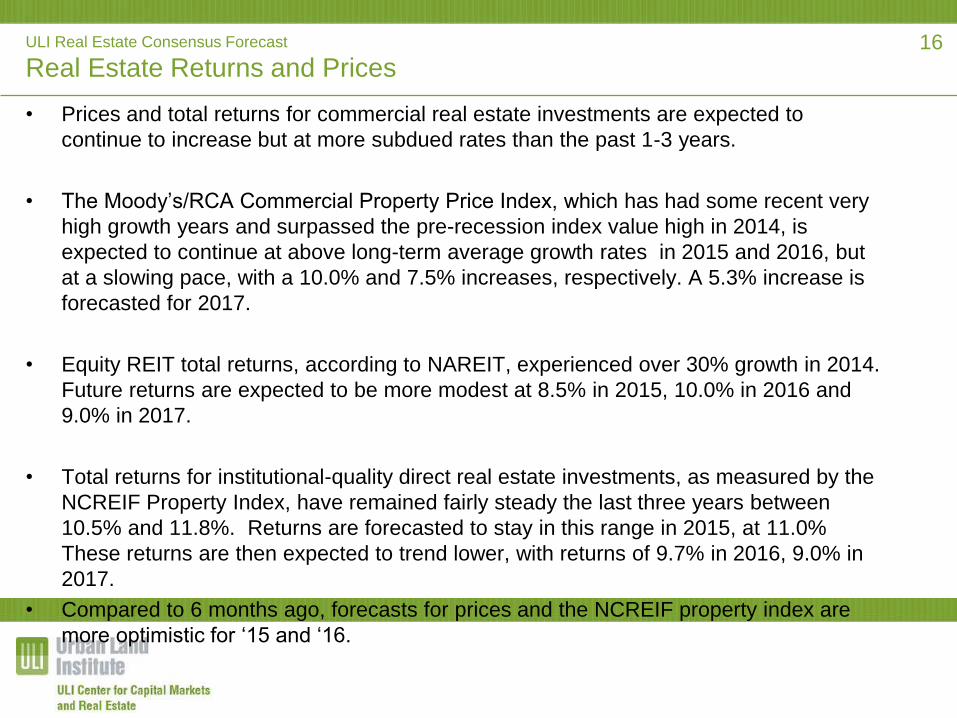
Real Estate Returns and Prices
• Prices and total returns for commercial real estate investments are expected to
continue to increase but at more subdued rates than the past 1-3 years.
• The Moody’s/RCA Commercial Property Price Index, which has had some recent very
high growth years and surpassed the pre-recession index value high in 2014, is
expected to continue at above long-term average growth rates in 2015 and 2016, but
at a slowing pace, with a 10.0% and 7.5% increases, respectively. A 5.3% increase is
forecasted for 2017.
• Equity REIT total returns, according to NAREIT, experienced over 30% growth in 2014.
Future returns are expected to be more modest at 8.5% in 2015, 10.0% in 2016 and
9.0% in 2017.
• Total returns for institutional-quality direct real estate investments, as measured by the
NCREIF Property Index, have remained fairly steady the last three years between
10.5% and 11.8%. Returns are forecasted to stay in this range in 2015, at 11.0%
These returns are then expected to trend lower, with returns of 9.7% in 2016, 9.0% in
2017.
• Compared to 6 months ago, forecasts for prices and the NCREIF property index are
more optimistic for ‘15 and ‘16.
16
ULI Real Estate Consensus Forecast
Moody’s/RCA Commercial Property Price Index (annual change)
7.5%
13.1%
18.2%
7.0%
10.0%
-19.2%
-26.0%
9.6% 9.6% 9.0%
16.8%
13.0%
10.0%7.5%
5.3%
2003 2004 2005 2006 2007 2008 2009 2010 2011 2012 2013 2014 2015 2016 2017
14-Year Avg. (5.3%)
Sources: 2003-2014, Moody’s and Real Capital Analytics; 2015-2017, ULI Consensus Forecast.
Note: The previous ULI Consensus Forecast (released in October, 2014) projected 6.0% and 5.0%, respectively, for 2015 and 2016.
17
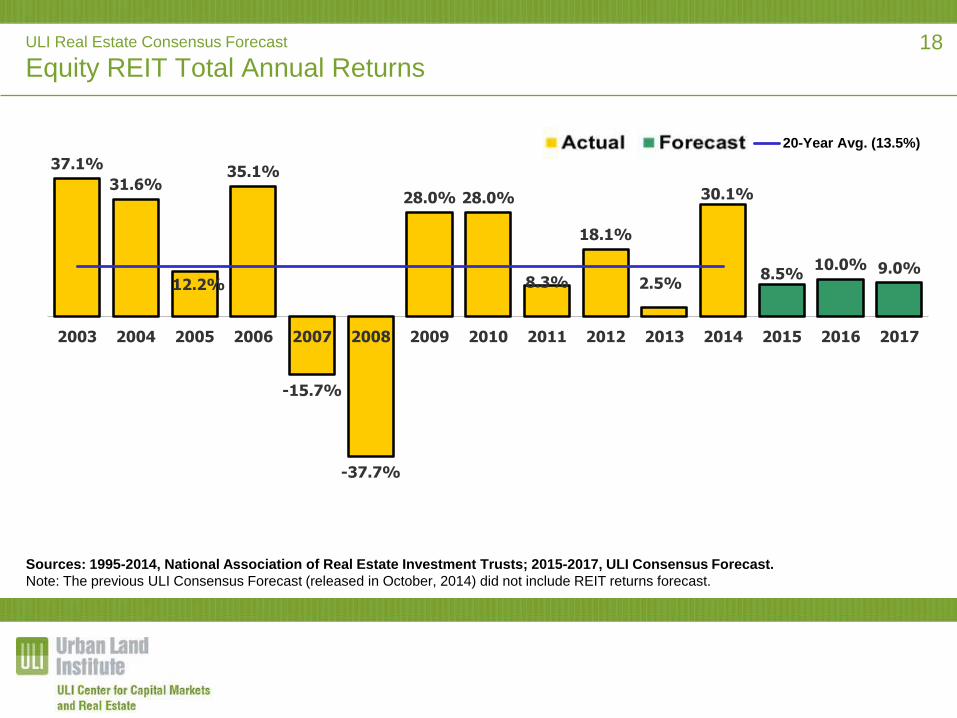
ULI Real Estate Consensus Forecast
Equity REIT Total Annual Returns
37.1%
31.6%
12.2%
35.1%
-15.7%
-37.7%
28.0% 28.0%
8.3%
18.1%
2.5%
30.1%
8.5%10.0% 9.0%
2003 2004 2005 2006 2007 2008 2009 2010 2011 2012 2013 2014 2015 2016 2017
20-Year Avg. (13.5%)
Sources: 1995-2014, National Association of Real Estate Investment Trusts; 2015-2017, ULI Consensus Forecast.
Note: The previous ULI Consensus Forecast (released in October, 2014) did not include REIT returns forecast.
18
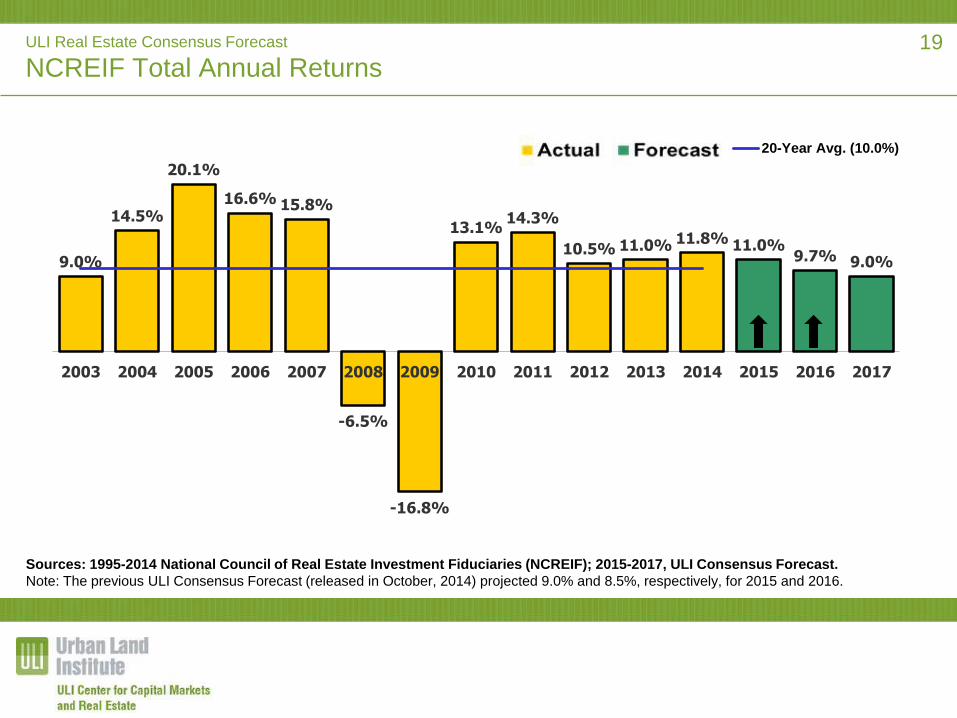
ULI Real Estate Consensus Forecast
NCREIF Total Annual Returns
9.0%
14.5%
20.1%
16.6% 15.8%
-6.5%
-16.8%
13.1%14.3%
10.5% 11.0% 11.8% 11.0%9.7% 9.0%
2003 2004 2005 2006 2007 2008 2009 2010 2011 2012 2013 2014 2015 2016 2017
20-Year Avg. (10.0%)
Sources: 1995-2014 National Council of Real Estate Investment Fiduciaries (NCREIF); 2015-2017, ULI Consensus Forecast.
Note: The previous ULI Consensus Forecast (released in October, 2014) projected 9.0% and 8.5%, respectively, for 2015 and 2016.
19
ULI Real Estate Consensus Forecast
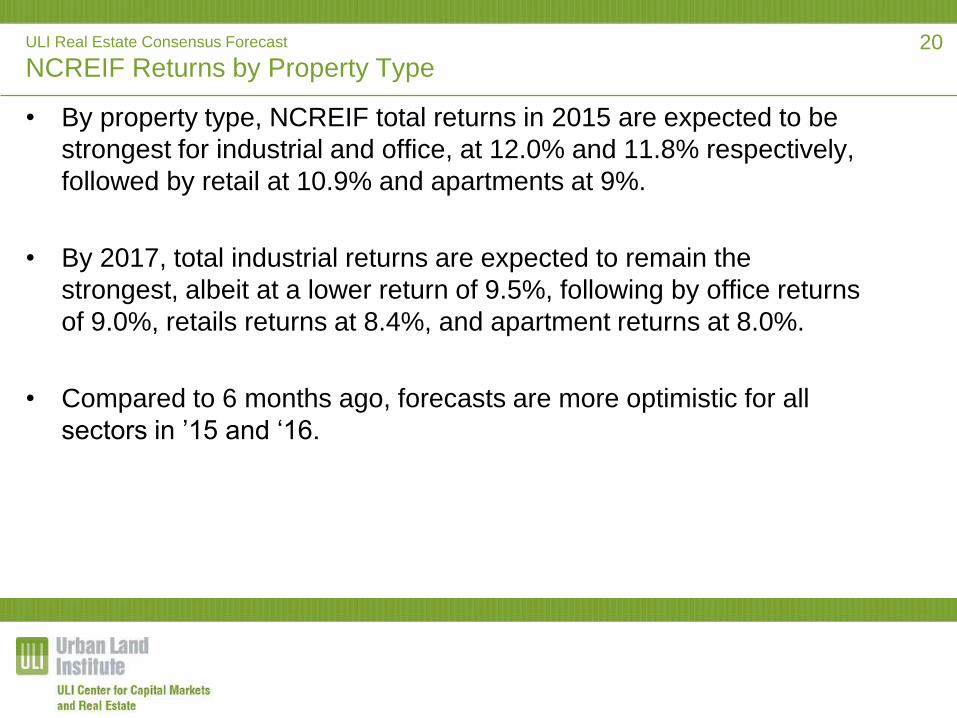
NCREIF Returns by Property Type
• By property type, NCREIF total returns in 2015 are expected to be
strongest for industrial and office, at 12.0% and 11.8% respectively,
followed by retail at 10.9% and apartments at 9%.
• By 2017, total industrial returns are expected to remain the
strongest, albeit at a lower return of 9.5%, following by office returns
of 9.0%, retails returns at 8.4%, and apartment returns at 8.0%.
• Compared to 6 months ago, forecasts are more optimistic for all
sectors in ’15 and ‘16.
20
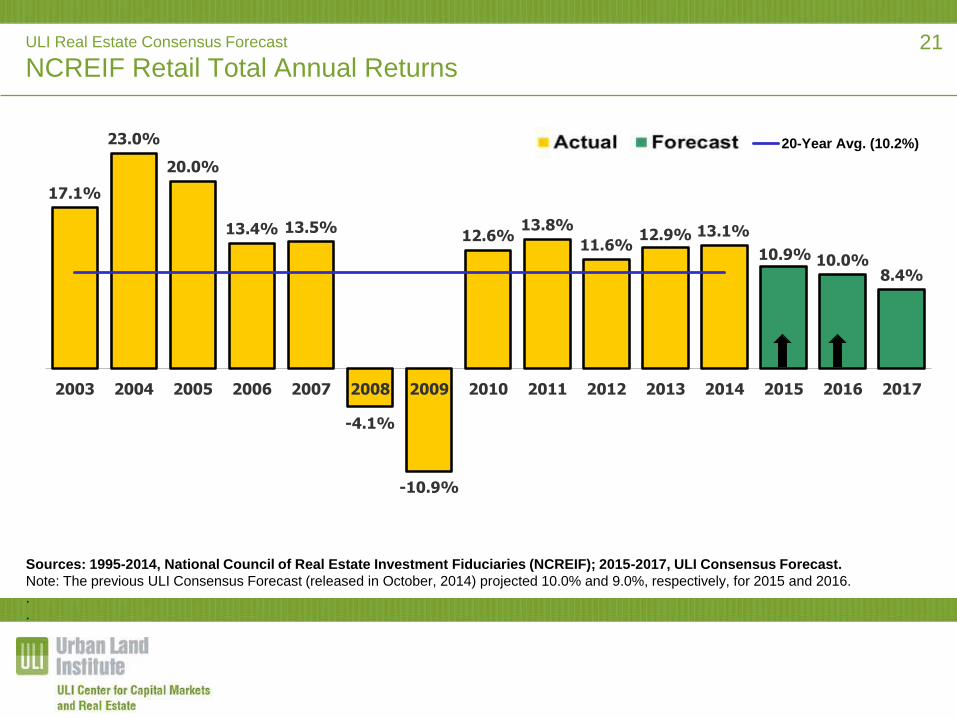
ULI Real Estate Consensus Forecast
NCREIF Retail Total Annual Returns
17.1%
23.0%
20.0%
13.4% 13.5%
-4.1%
-10.9%
12.6%13.8%
11.6%12.9% 13.1%
10.9% 10.0%8.4%
2003 2004 2005 2006 2007 2008 2009 2010 2011 2012 2013 2014 2015 2016 2017
20-Year Avg. (10.2%)
Sources: 1995-2014, National Council of Real Estate Investment Fiduciaries (NCREIF); 2015-2017, ULI Consensus Forecast.
Note: The previous ULI Consensus Forecast (released in October, 2014) projected 10.0% and 9.0%, respectively, for 2015 and 2016.
.
.
21
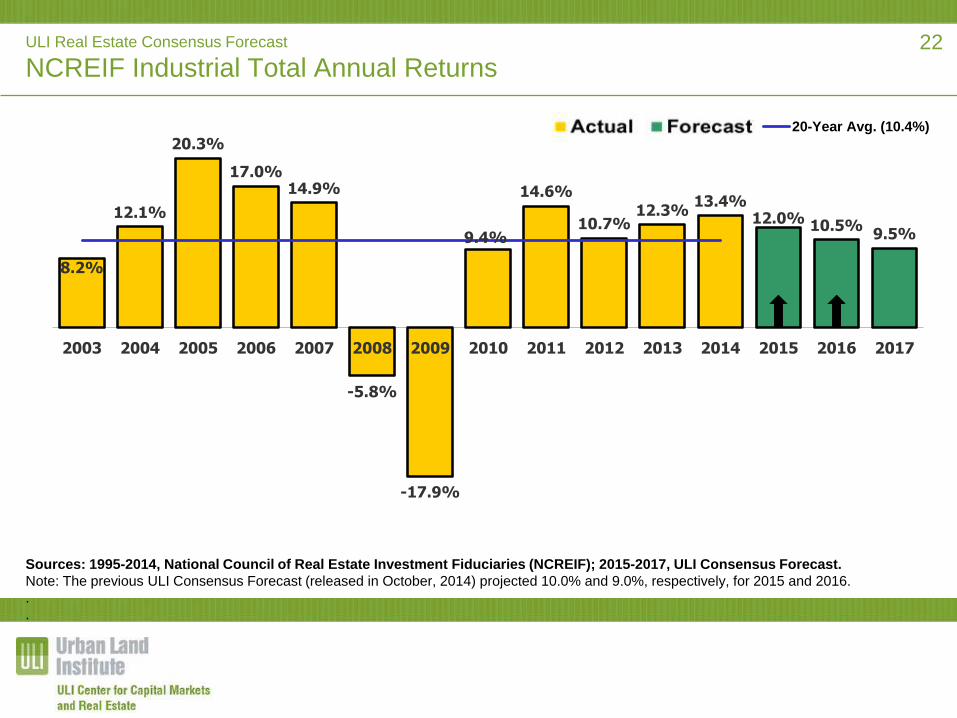
ULI Real Estate Consensus Forecast
NCREIF Industrial Total Annual Returns
8.2%
12.1%
20.3%
17.0%14.9%
-5.8%
-17.9%
9.4%
14.6%
10.7%12.3%
13.4%12.0% 10.5%
9.5%
2003 2004 2005 2006 2007 2008 2009 2010 2011 2012 2013 2014 2015 2016 2017
20-Year Avg. (10.4%)
Sources: 1995-2014, National Council of Real Estate Investment Fiduciaries (NCREIF); 2015-2017, ULI Consensus Forecast.
Note: The previous ULI Consensus Forecast (released in October, 2014) projected 10.0% and 9.0%, respectively, for 2015 and 2016.
.
.
22
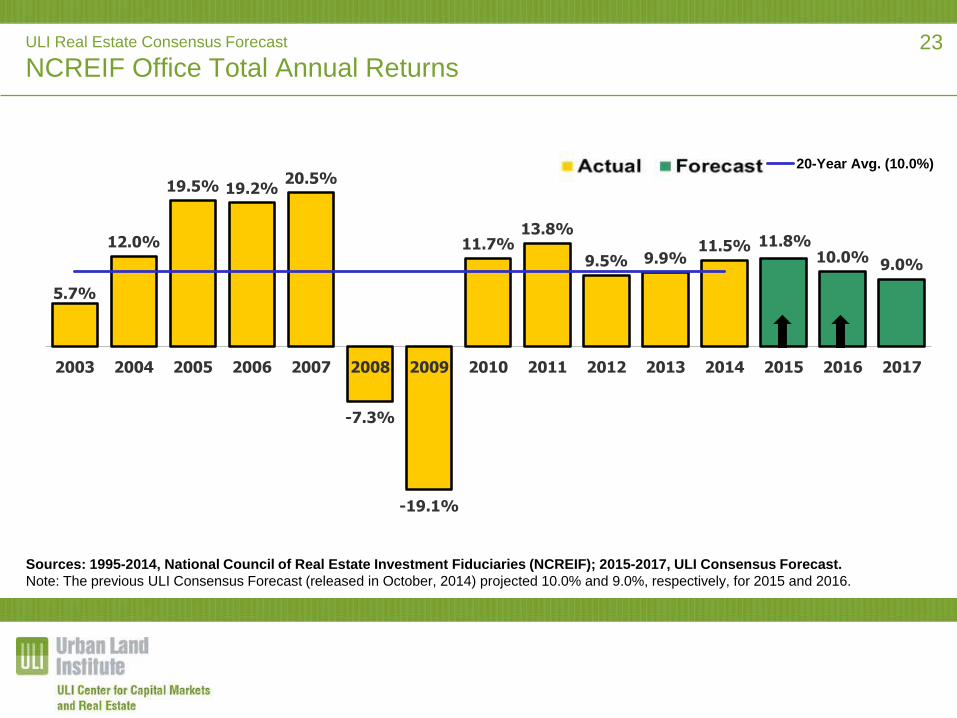
ULI Real Estate Consensus Forecast
NCREIF Office Total Annual Returns
5.7%
12.0%
19.5% 19.2%20.5%
-7.3%
-19.1%
11.7%13.8%
9.5% 9.9%11.5% 11.8%
10.0% 9.0%
2003 2004 2005 2006 2007 2008 2009 2010 2011 2012 2013 2014 2015 2016 2017
20-Year Avg. (10.0%)
Sources: 1995-2014, National Council of Real Estate Investment Fiduciaries (NCREIF); 2015-2017, ULI Consensus Forecast.
Note: The previous ULI Consensus Forecast (released in October, 2014) projected 10.0% and 9.0%, respectively, for 2015 and 2016.
23
ULI Real Estate Consensus Forecast
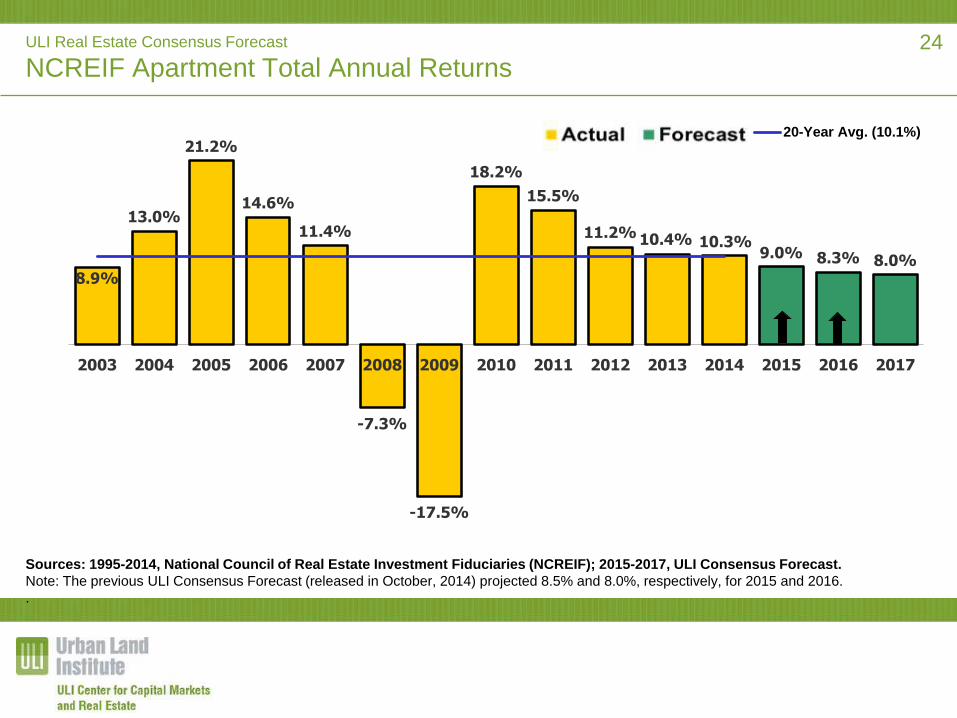
NCREIF Apartment Total Annual Returns
8.9%
13.0%
21.2%
14.6%
11.4%
-7.3%
-17.5%
18.2%
15.5%
11.2% 10.4% 10.3%9.0% 8.3% 8.0%
2003 2004 2005 2006 2007 2008 2009 2010 2011 2012 2013 2014 2015 2016 2017
20-Year Avg. (10.1%)
Sources: 1995-2014, National Council of Real Estate Investment Fiduciaries (NCREIF); 2015-2017, ULI Consensus Forecast.
Note: The previous ULI Consensus Forecast (released in October, 2014) projected 8.5% and 8.0%, respectively, for 2015 and 2016.
.
24
ULI Real Estate Consensus Forecast
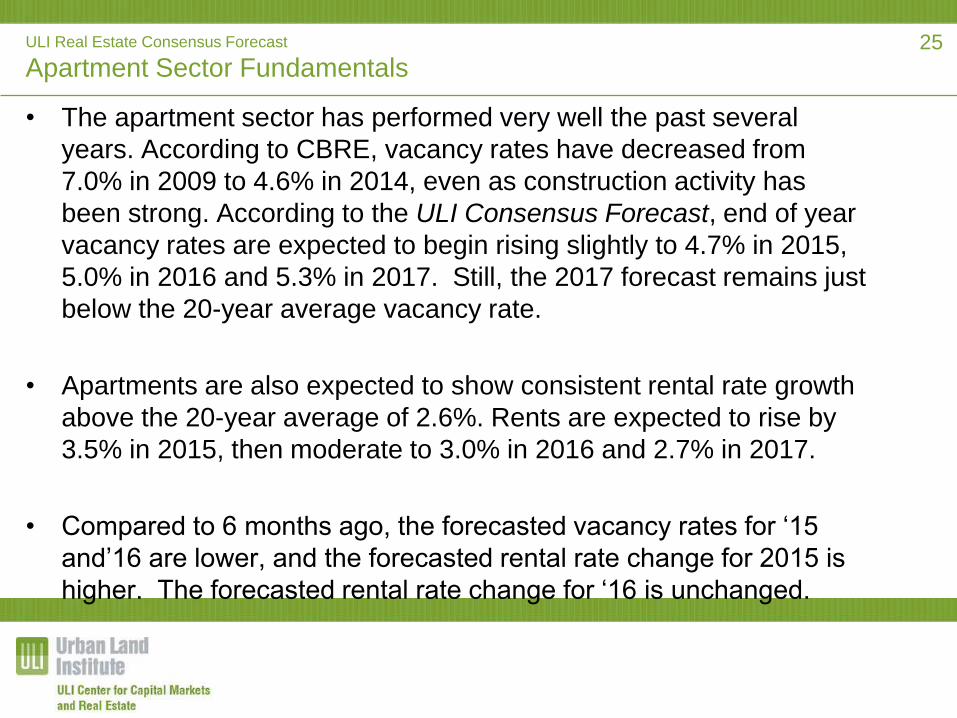
Apartment Sector Fundamentals
• The apartment sector has performed very well the past several
years. According to CBRE, vacancy rates have decreased from
7.0% in 2009 to 4.6% in 2014, even as construction activity has
been strong. According to the ULI Consensus Forecast, end of year
vacancy rates are expected to begin rising slightly to 4.7% in 2015,
5.0% in 2016 and 5.3% in 2017. Still, the 2017 forecast remains just
below the 20-year average vacancy rate.
• Apartments are also expected to show consistent rental rate growth
above the 20-year average of 2.6%. Rents are expected to rise by
3.5% in 2015, then moderate to 3.0% in 2016 and 2.7% in 2017.
• Compared to 6 months ago, the forecasted vacancy rates for ‘15
and’16 are lower, and the forecasted rental rate change for 2015 is
higher. The forecasted rental rate change for ‘16 is unchanged.
25
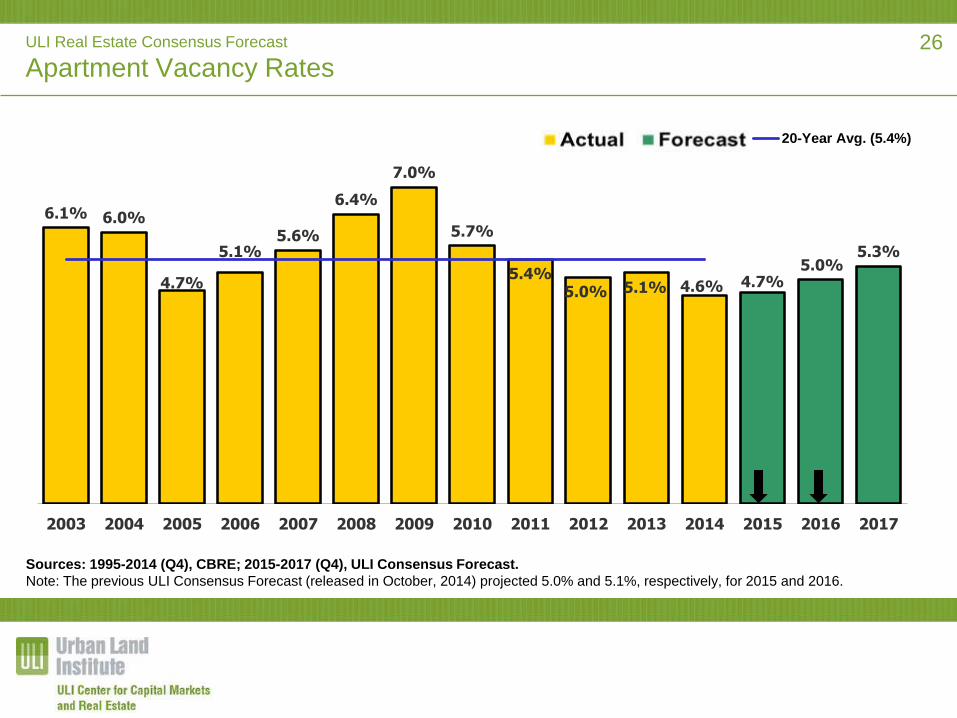
ULI Real Estate Consensus Forecast
Apartment Vacancy Rates
6.1% 6.0%
4.7%
5.1%5.6%
6.4%
7.0%
5.7%
5.4%5.0% 5.1% 4.6% 4.7%
5.0%5.3%
2003 2004 2005 2006 2007 2008 2009 2010 2011 2012 2013 2014 2015 2016 2017
20-Year Avg. (5.4%)
Sources: 1995-2014 (Q4), CBRE; 2015-2017 (Q4), ULI Consensus Forecast.
Note: The previous ULI Consensus Forecast (released in October, 2014) projected 5.0% and 5.1%, respectively, for 2015 and 2016.
26
ULI Real Estate Consensus Forecast
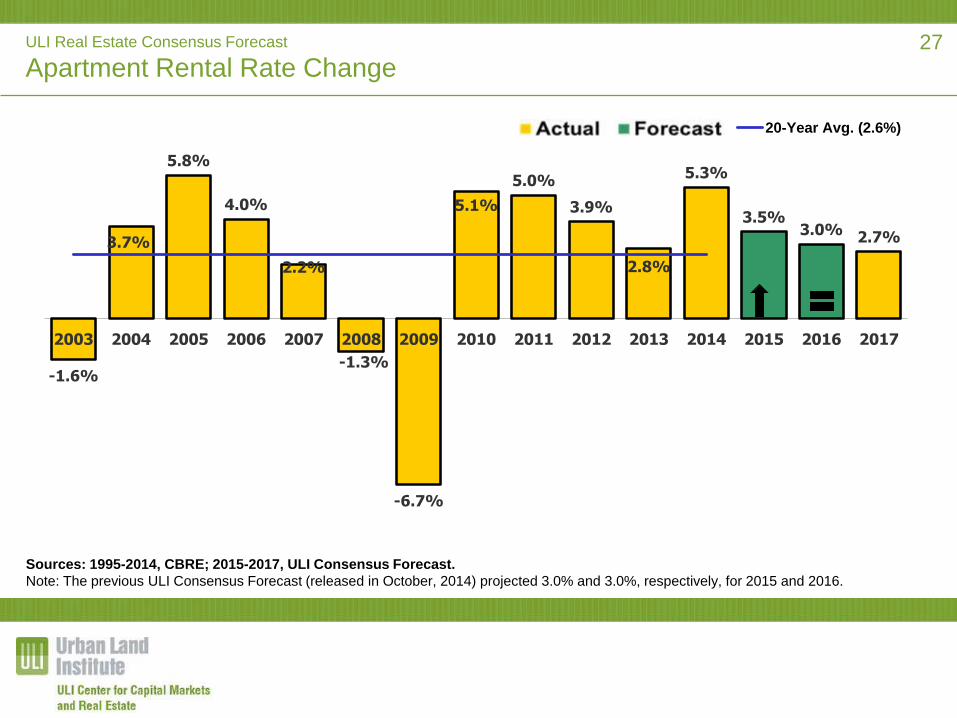
Apartment Rental Rate Change
-1.6%
3.7%
5.8%
4.0%
2.2%
-1.3%
-6.7%
5.1%
5.0%
3.9%
2.8%
5.3%
3.5%3.0% 2.7%
2003 2004 2005 2006 2007 2008 2009 2010 2011 2012 2013 2014 2015 2016 2017
20-Year Avg. (2.6%)
Sources: 1995-2014, CBRE; 2015-2017, ULI Consensus Forecast.
Note: The previous ULI Consensus Forecast (released in October, 2014) projected 3.0% and 3.0%, respectively, for 2015 and 2016.
27
ULI Real Estate Consensus Forecast
Industrial/Warehouse Sector Fundamentals
• The availability rate for the industrial/warehouse sector declined to 10.3% at the end
of 2014, according to CBRE, coming in just below the 20-year average for the first
time since 2007. According to the ULI Consensus Forecast, availability rates will
continue to decline in 2015 and 2016, with year-end vacancy rates at 9.8% and 9.6%,
respectively, and remain steady in 2017 at 9.6%.
• According to CBRE, warehouse rental rates have shown positive growth for the past
three years following a 3-year decline. The ULI Consensus Forecast expects healthy
rental rate growth to continue by 4.0% in 2015, 3.8% in 2016, and 3.1% in 2017.
These forecasts are all above the 20-year average growth rate.
• The forecasts for industrial/warehouse availability rates in ‘15 and ‘16 are more
optimistic than the Consensus Forecast of six months ago. The forecast for rental
rate growth in 2015 remains the same but is more optimistic for 2016.
28
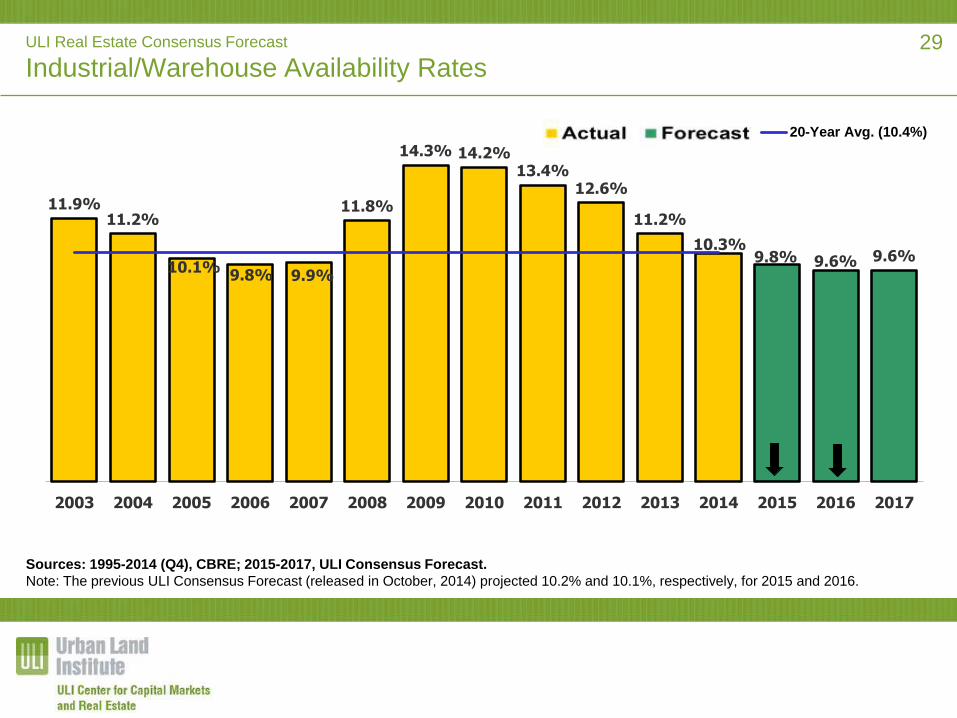
ULI Real Estate Consensus Forecast
Industrial/Warehouse Availability Rates
11.9%11.2%
10.1%9.8% 9.9%
11.8%
14.3% 14.2%13.4%
12.6%
11.2%
10.3%9.8% 9.6% 9.6%
2003 2004 2005 2006 2007 2008 2009 2010 2011 2012 2013 2014 2015 2016 2017
20-Year Avg. (10.4%)
Sources: 1995-2014 (Q4), CBRE; 2015-2017, ULI Consensus Forecast.
Note: The previous ULI Consensus Forecast (released in October, 2014) projected 10.2% and 10.1%, respectively, for 2015 and 2016.
29
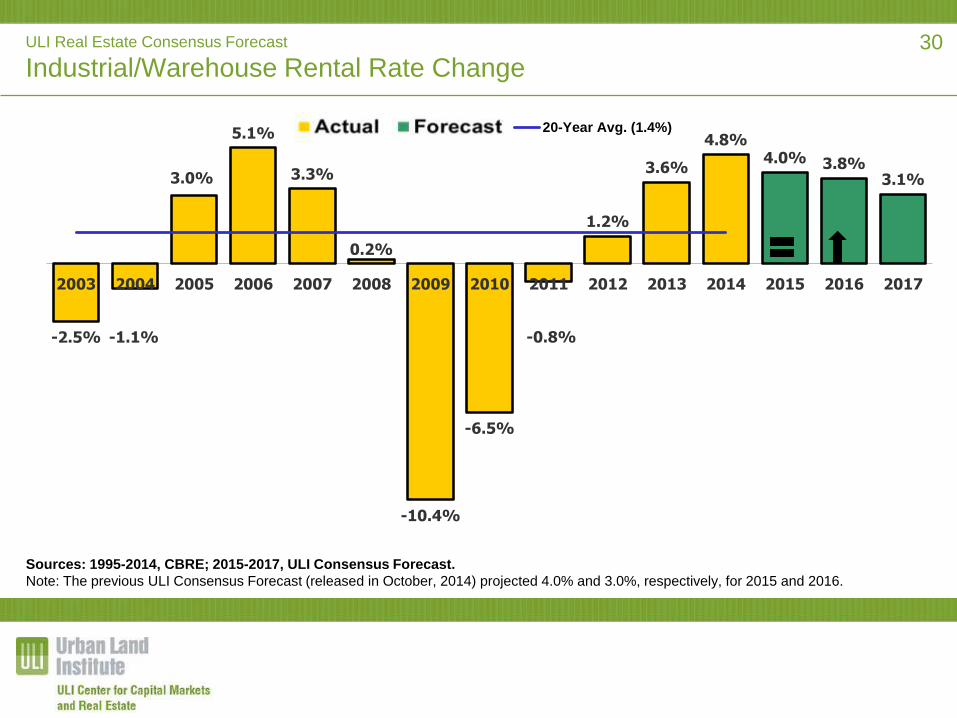
ULI Real Estate Consensus Forecast
Industrial/Warehouse Rental Rate Change
-2.5% -1.1%
3.0%
5.1%
3.3%
0.2%
-10.4%
-6.5%
-0.8%
1.2%
3.6%
4.8%4.0% 3.8%
3.1%
2003 2004 2005 2006 2007 2008 2009 2010 2011 2012 2013 2014 2015 2016 2017
20-Year Avg. (1.4%)
Sources: 1995-2014, CBRE; 2015-2017, ULI Consensus Forecast.
Note: The previous ULI Consensus Forecast (released in October, 2014) projected 4.0% and 3.0%, respectively, for 2015 and 2016.
30
ULI Real Estate Consensus Forecast
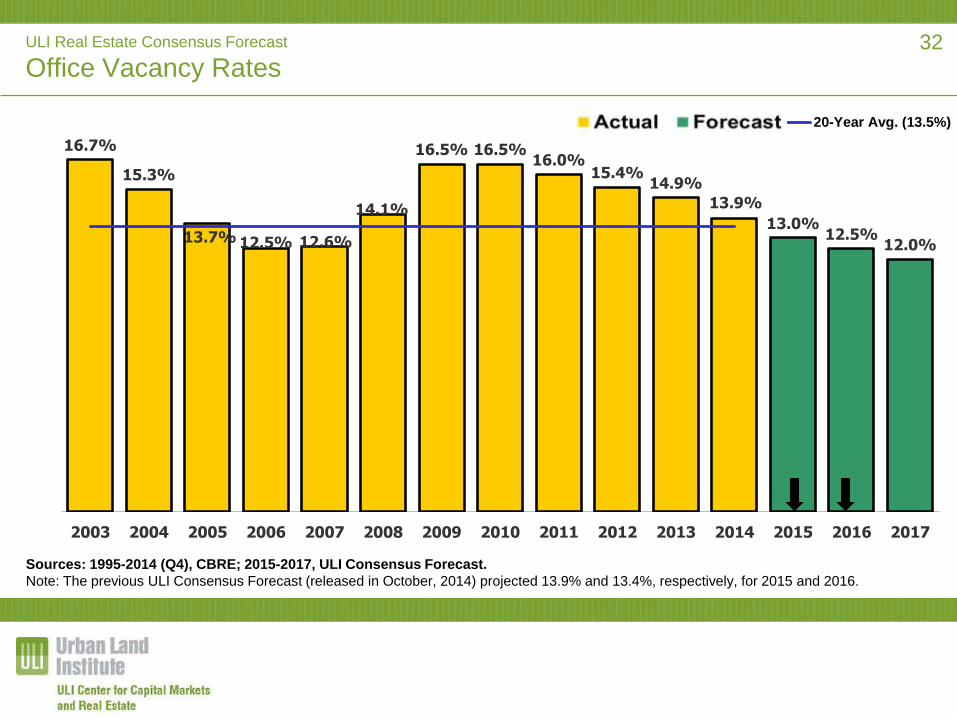
Office Sector Fundamentals
• Office vacancy rates declined for the fourth straight year to 13.9% in
2014. These declines are expected to continue decreasing, bringing
the vacancy rate below the 20-year average, to 13.0% in 2015,
12.5% in 2016, and 12.0% by the end of 2017.
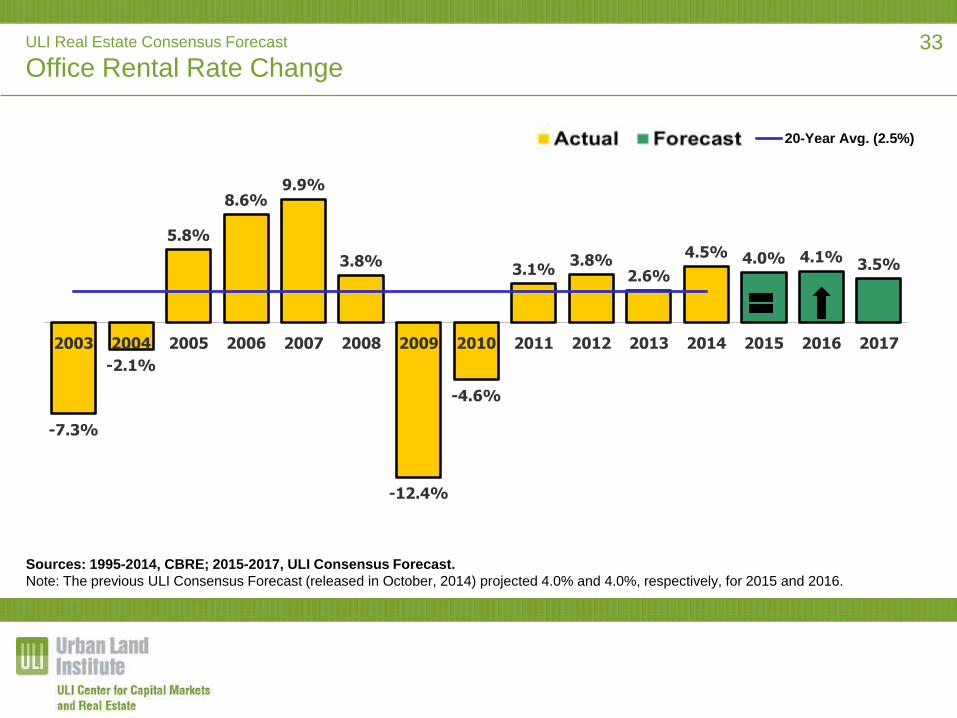
• Office rental rates, according to CBRE, increased 4.5% in 2014.
According to the Consensus Forecast, rental rate growth will
continue at a similar pace at 4.0% in 2015 and 4.1% in 2016. Rental
rage growth is expected to moderate slightly to 3.5% in 2017. All
forecasted rates are above the 20-year average.
• The forecasts for office vacancy rates in ‘15 and ‘16 are more
optimistic than the Consensus Forecast of six months ago. The
forecasts for rental rate growth in ‘15 and ‘16 remain about the
same.
31
ULI Real Estate Consensus Forecast
Office Vacancy Rates
16.7%
15.3%
13.7% 12.5% 12.6%
14.1%
16.5% 16.5%16.0%
15.4%14.9%
13.9%
13.0%12.5%
12.0%
2003 2004 2005 2006 2007 2008 2009 2010 2011 2012 2013 2014 2015 2016 2017
20-Year Avg. (13.5%)
Sources: 1995-2014 (Q4), CBRE; 2015-2017, ULI Consensus Forecast.
Note: The previous ULI Consensus Forecast (released in October, 2014) projected 13.9% and 13.4%, respectively, for 2015 and 2016.
32
ULI Real Estate Consensus Forecast
Office Rental Rate Change
-7.3%
-2.1%
5.8%
8.6%9.9%
3.8%
-12.4%
-4.6%
3.1%3.8%
2.6%
4.5% 4.0% 4.1% 3.5%
2003 2004 2005 2006 2007 2008 2009 2010 2011 2012 2013 2014 2015 2016 2017
20-Year Avg. (2.5%)
Sources: 1995-2014, CBRE; 2015-2017, ULI Consensus Forecast.
Note: The previous ULI Consensus Forecast (released in October, 2014) projected 4.0% and 4.0%, respectively, for 2015 and 2016.
33
ULI Real Estate Consensus Forecast
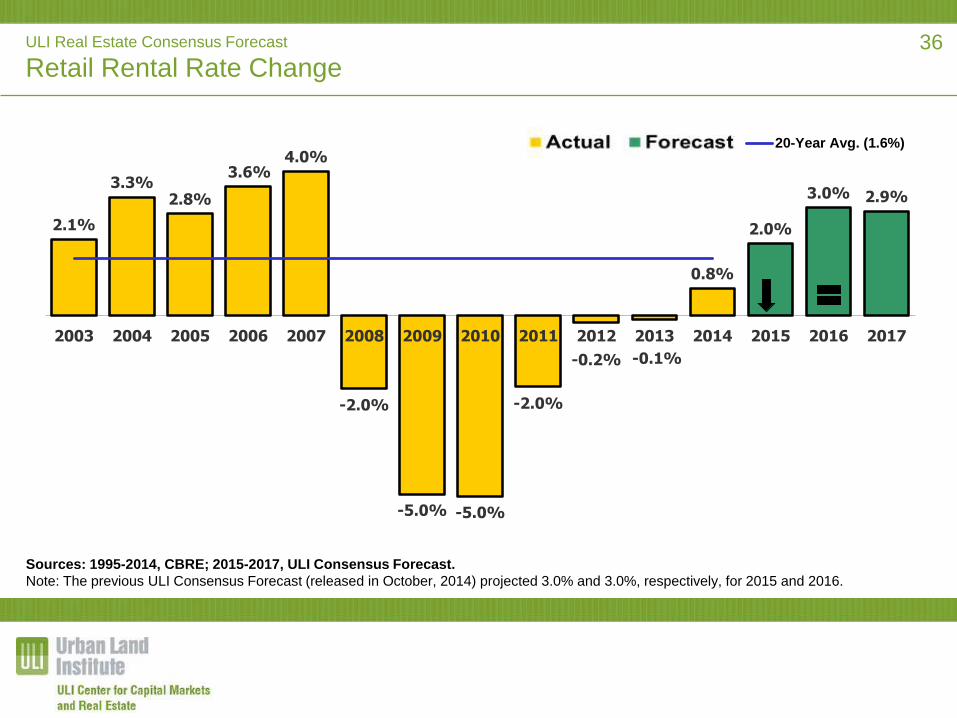
Retail Sector Fundamentals
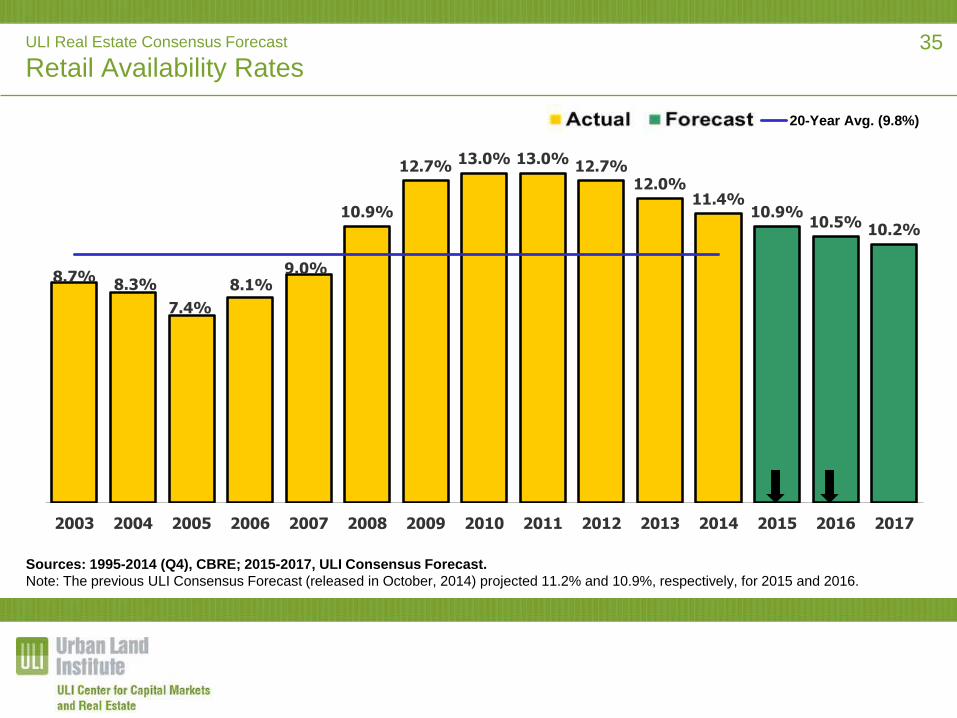
• Retail availability rates have been on a steady decline from peak of
13.0% in 2011, to 11.4% in 2014. The Consensus Forecast
anticipates on-going improvements over the next three years, with
availability rates expected to decline to 10.9% by 2015, 10.5% by
2016, and 10.2% by 2017. Still, these rates remain above the 20-
year average.
• According to CBRE retail rental rates increased for the first time in
six years in 2014. The Consensus Forecast expects rental rates to
sustain this growth, increasing by 2.0% in 2015, 3.0% in 2016, and
2.9% 2017.
• Compared to 6 months ago, the forecast of availability rates for ‘15
and ‘16 is modestly more optimistic, while forecast of rental rate
growth for ’15 is less optimistic and remains the same for ‘16.
34
ULI Real Estate Consensus Forecast
Retail Availability Rates
8.7%8.3%
7.4%
8.1%9.0%
10.9%
12.7%13.0% 13.0%
12.7%12.0%
11.4%10.9%
10.5%10.2%
2003 2004 2005 2006 2007 2008 2009 2010 2011 2012 2013 2014 2015 2016 2017
20-Year Avg. (9.8%)
Sources: 1995-2014 (Q4), CBRE; 2015-2017, ULI Consensus Forecast.
Note: The previous ULI Consensus Forecast (released in October, 2014) projected 11.2% and 10.9%, respectively, for 2015 and 2016.
35
ULI Real Estate Consensus Forecast
Retail Rental Rate Change
2.1%
3.3%2.8%
3.6%4.0%
-2.0%
-5.0% -5.0%
-2.0%
-0.2% -0.1%
0.8%
2.0%
3.0% 2.9%
2003 2004 2005 2006 2007 2008 2009 2010 2011 2012 2013 2014 2015 2016 2017
20-Year Avg. (1.6%)
Sources: 1995-2014, CBRE; 2015-2017, ULI Consensus Forecast.
Note: The previous ULI Consensus Forecast (released in October, 2014) projected 3.0% and 3.0%, respectively, for 2015 and 2016.
36
ULI Real Estate Consensus Forecast
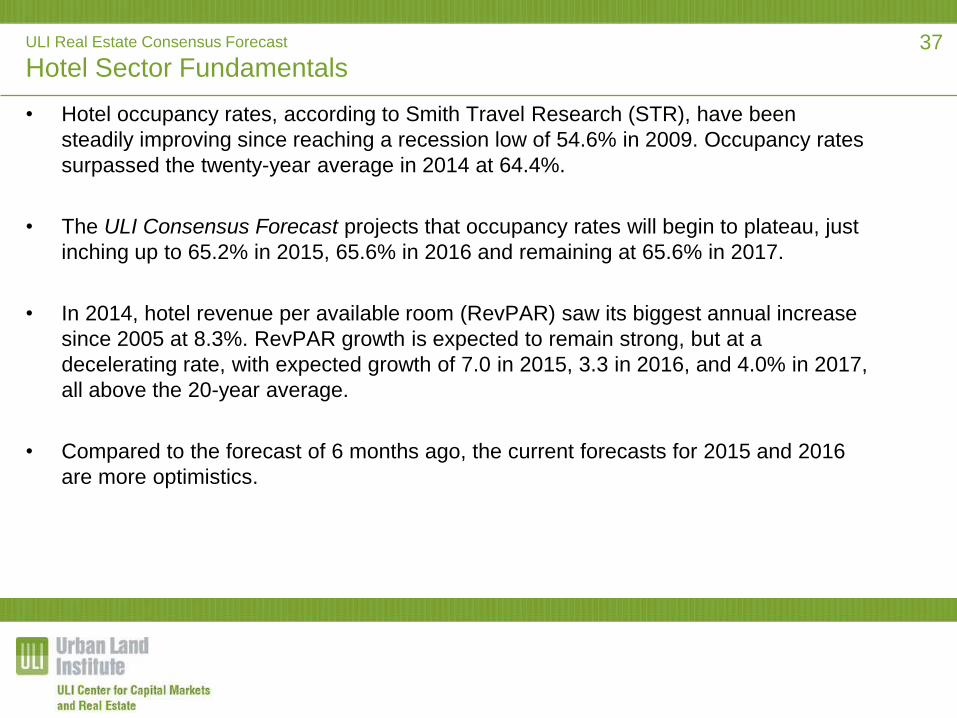
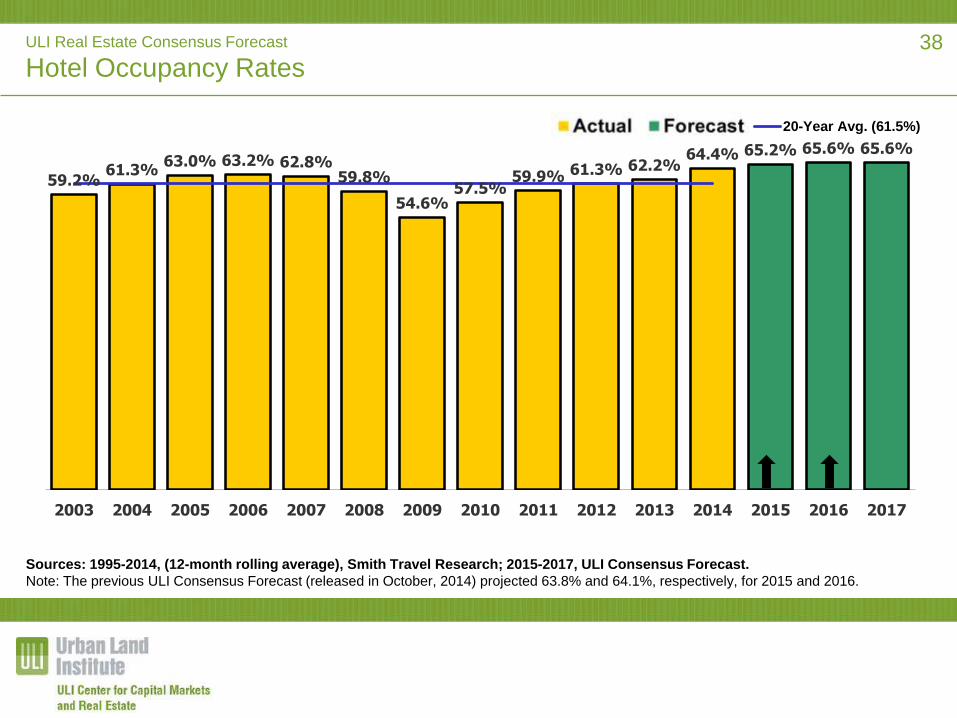
Hotel Sector Fundamentals
• Hotel occupancy rates, according to Smith Travel Research (STR), have been
steadily improving since reaching a recession low of 54.6% in 2009. Occupancy rates
surpassed the twenty-year average in 2014 at 64.4%.
• The ULI Consensus Forecast projects that occupancy rates will begin to plateau, just
inching up to 65.2% in 2015, 65.6% in 2016 and remaining at 65.6% in 2017.
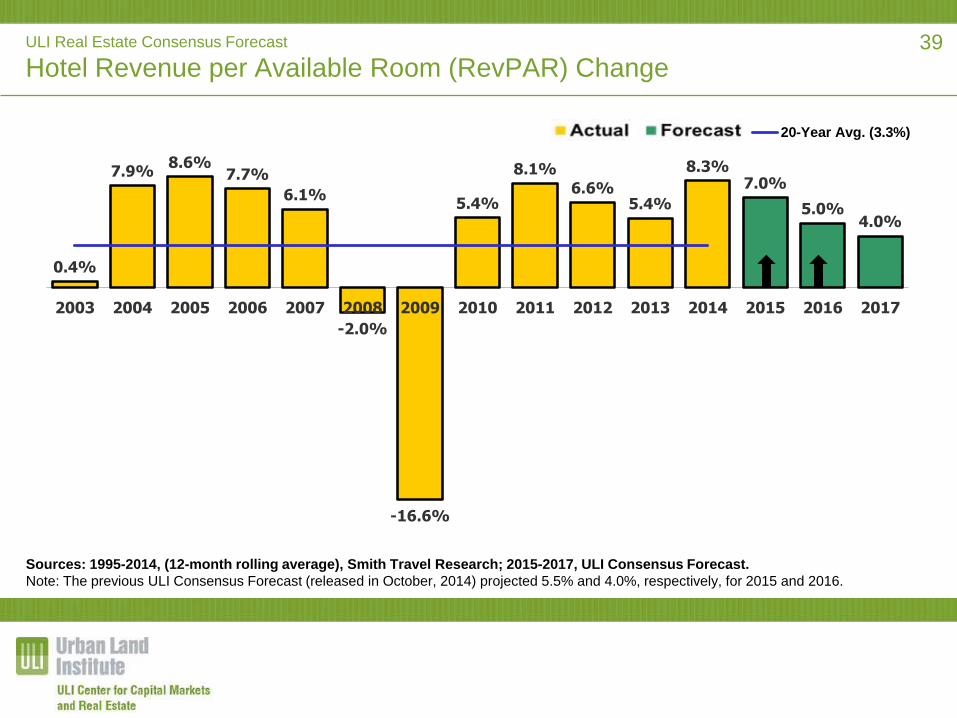
• In 2014, hotel revenue per available room (RevPAR) saw its biggest annual increase
since 2005 at 8.3%. RevPAR growth is expected to remain strong, but at a
decelerating rate, with expected growth of 7.0 in 2015, 3.3 in 2016, and 4.0% in 2017,
all above the 20-year average.
• Compared to the forecast of 6 months ago, the current forecasts for 2015 and 2016
are more optimistics.
37
ULI Real Estate Consensus Forecast
Hotel Occupancy Rates
59.2%61.3%
63.0% 63.2% 62.8%59.8%
54.6%57.5%
59.9% 61.3% 62.2%64.4% 65.2% 65.6% 65.6%
2003 2004 2005 2006 2007 2008 2009 2010 2011 2012 2013 2014 2015 2016 2017
20-Year Avg. (61.5%)
Sources: 1995-2014, (12-month rolling average), Smith Travel Research; 2015-2017, ULI Consensus Forecast.
Note: The previous ULI Consensus Forecast (released in October, 2014) projected 63.8% and 64.1%, respectively, for 2015 and 2016.
38
ULI Real Estate Consensus Forecast
Hotel Revenue per Available Room (RevPAR) Change
0.4%
7.9%8.6%
7.7%
6.1%
-2.0%
-16.6%
5.4%
8.1%
6.6%5.4%
8.3%7.0%
5.0%4.0%
2003 2004 2005 2006 2007 2008 2009 2010 2011 2012 2013 2014 2015 2016 2017
20-Year Avg. (3.3%)
Sources: 1995-2014, (12-month rolling average), Smith Travel Research; 2015-2017, ULI Consensus Forecast.
Note: The previous ULI Consensus Forecast (released in October, 2014) projected 5.5% and 4.0%, respectively, for 2015 and 2016.
39
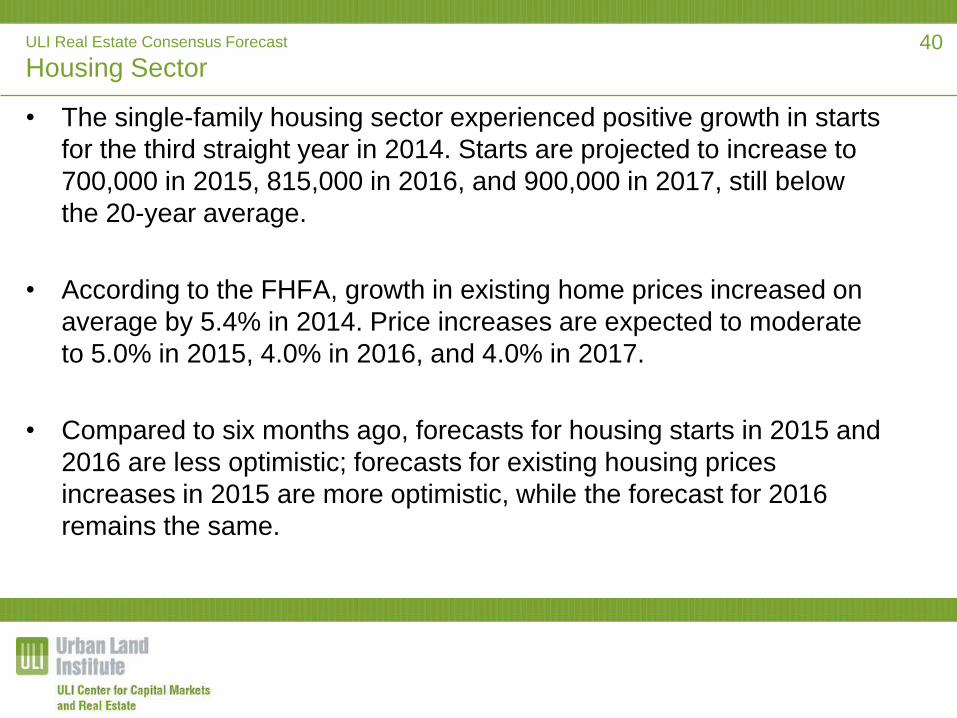
ULI Real Estate Consensus Forecast
Housing Sector
• The single-family housing sector experienced positive growth in starts
for the third straight year in 2014. Starts are projected to increase to
700,000 in 2015, 815,000 in 2016, and 900,000 in 2017, still below
the 20-year average.
• According to the FHFA, growth in existing home prices increased on
average by 5.4% in 2014. Price increases are expected to moderate
to 5.0% in 2015, 4.0% in 2016, and 4.0% in 2017.
• Compared to six months ago, forecasts for housing starts in 2015 and
2016 are less optimistic; forecasts for existing housing prices
increases in 2015 are more optimistic, while the forecast for 2016
remains the same.
40
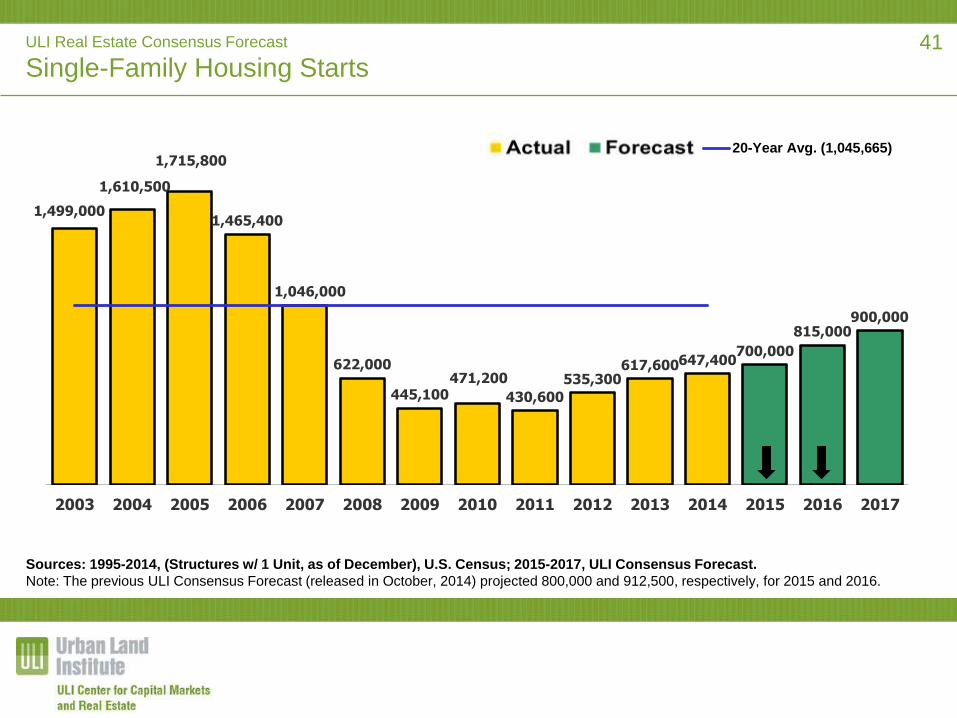
ULI Real Estate Consensus Forecast
Single-Family Housing Starts
1,499,000
1,610,500
1,715,800
1,465,400
1,046,000
622,000
445,100471,200
430,600
535,300617,600647,400
700,000
815,000900,000
2003 2004 2005 2006 2007 2008 2009 2010 2011 2012 2013 2014 2015 2016 2017
20-Year Avg. (1,045,665)
Sources: 1995-2014, (Structures w/ 1 Unit, as of December), U.S. Census; 2015-2017, ULI Consensus Forecast.
Note: The previous ULI Consensus Forecast (released in October, 2014) projected 800,000 and 912,500, respectively, for 2015 and 2016.
41
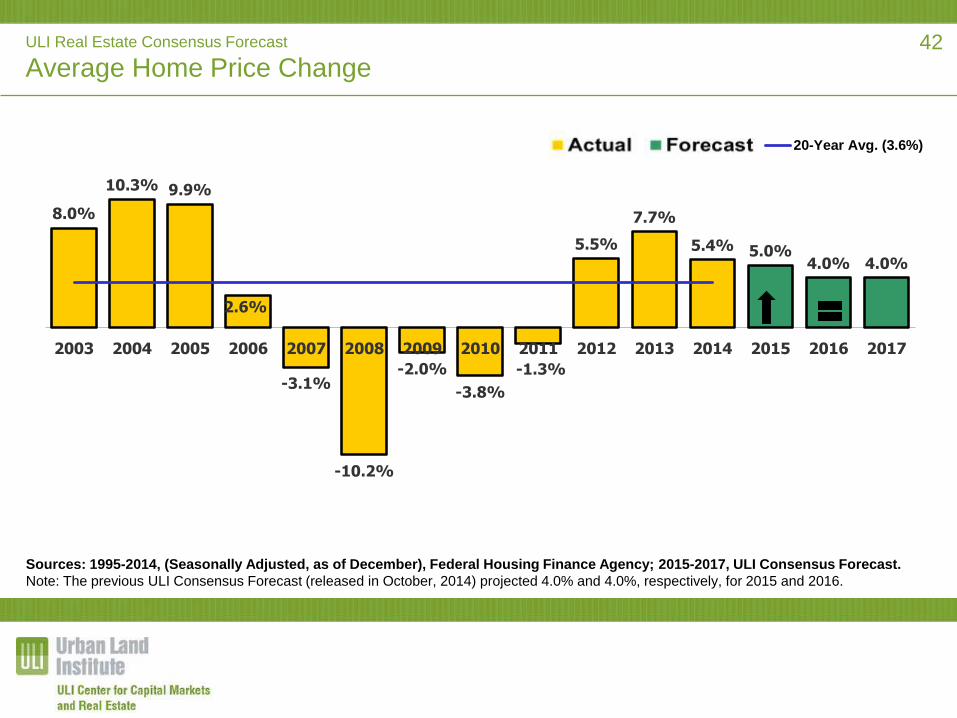
ULI Real Estate Consensus Forecast
Average Home Price Change
8.0%
10.3% 9.9%
2.6%
-3.1%
-10.2%
-2.0%
-3.8%
-1.3%
5.5%
7.7%
5.4% 5.0%4.0% 4.0%
2003 2004 2005 2006 2007 2008 2009 2010 2011 2012 2013 2014 2015 2016 2017
20-Year Avg. (3.6%)
Sources: 1995-2014, (Seasonally Adjusted, as of December), Federal Housing Finance Agency; 2015-2017, ULI Consensus Forecast.
Note: The previous ULI Consensus Forecast (released in October, 2014) projected 4.0% and 4.0%, respectively, for 2015 and 2016.
42
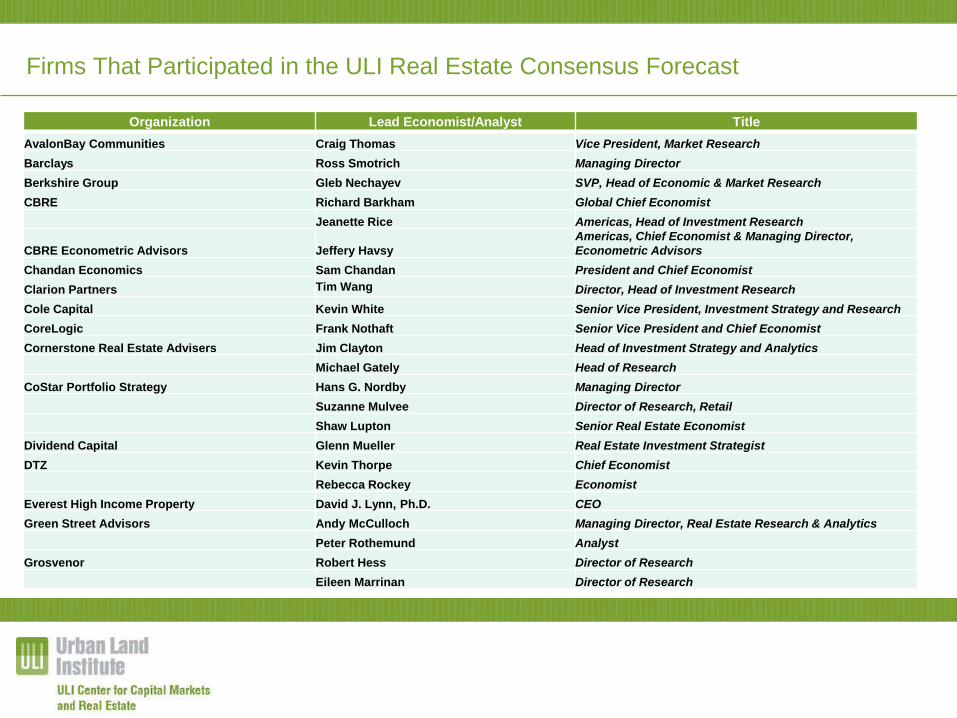
Firms That Participated in the ULI Real Estate Consensus Forecast
Organization Lead Economist/Analyst Title
AvalonBay Communities Craig Thomas Vice President, Market Research
Barclays Ross Smotrich Managing Director
Berkshire Group Gleb Nechayev SVP, Head of Economic & Market Research
CBRE Richard Barkham Global Chief Economist
Jeanette Rice Americas, Head of Investment Research
CBRE Econometric Advisors Jeffery Havsy
Americas, Chief Economist & Managing Director,
Econometric Advisors
Chandan Economics Sam Chandan President and Chief Economist
Clarion Partners Tim Wang Director, Head of Investment Research
Cole Capital Kevin White Senior Vice President, Investment Strategy and Research
CoreLogic Frank Nothaft Senior Vice President and Chief Economist
Cornerstone Real Estate Advisers Jim Clayton Head of Investment Strategy and Analytics
Michael Gately Head of Research
CoStar Portfolio Strategy Hans G. Nordby Managing Director
Suzanne Mulvee Director of Research, Retail
Shaw Lupton Senior Real Estate Economist
Dividend Capital Glenn Mueller Real Estate Investment Strategist
DTZ Kevin Thorpe Chief Economist
Rebecca Rockey Economist
Everest High Income Property David J. Lynn, Ph.D. CEO
Green Street Advisors Andy McCulloch Managing Director, Real Estate Research & Analytics
Peter Rothemund Analyst
Grosvenor Robert Hess Director of Research
Eileen Marrinan Director of Research
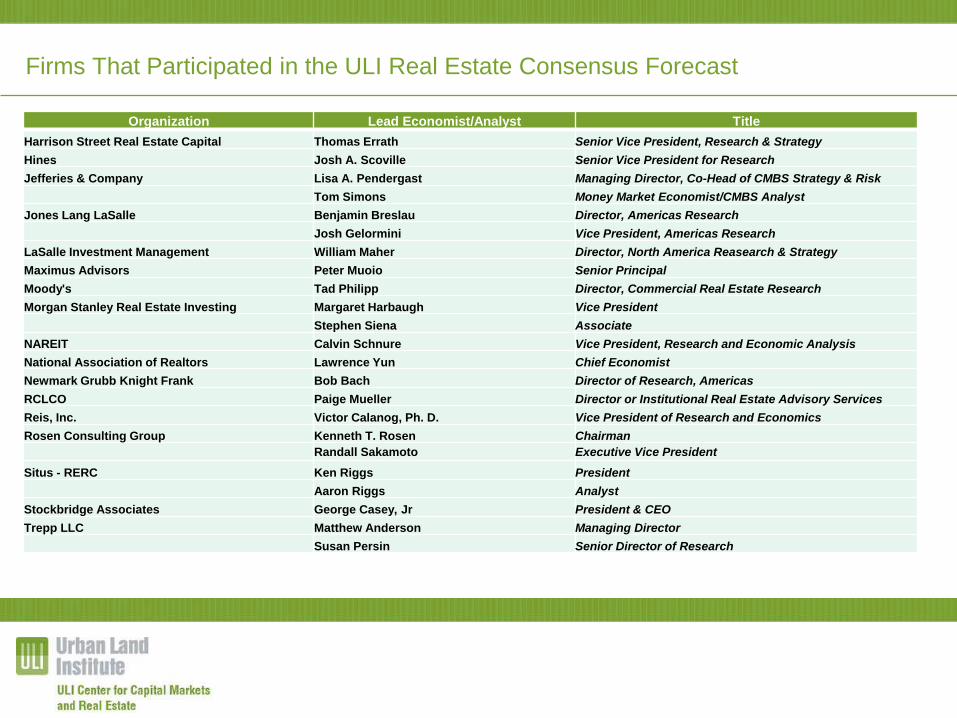
Firms That Participated in the ULI Real Estate Consensus Forecast
Organization Lead Economist/Analyst Title
Harrison Street Real Estate Capital Thomas Errath Senior Vice President, Research & Strategy
Hines Josh A. Scoville Senior Vice President for Research
Jefferies & Company Lisa A. Pendergast Managing Director, Co-Head of CMBS Strategy & Risk
Tom Simons Money Market Economist/CMBS Analyst
Jones Lang LaSalle Benjamin Breslau Director, Americas Research
Josh Gelormini Vice President, Americas Research
LaSalle Investment Management William Maher Director, North America Reasearch & Strategy
Maximus Advisors Peter Muoio Senior Principal
Moody's Tad Philipp Director, Commercial Real Estate Research
Morgan Stanley Real Estate Investing Margaret Harbaugh Vice President
Stephen Siena Associate
NAREIT Calvin Schnure Vice President, Research and Economic Analysis
National Association of Realtors Lawrence Yun Chief Economist
Newmark Grubb Knight Frank Bob Bach Director of Research, Americas
RCLCO Paige Mueller Director or Institutional Real Estate Advisory Services
Reis, Inc. Victor Calanog, Ph. D. Vice President of Research and Economics
Rosen Consulting Group Kenneth T. Rosen Chairman
Randall Sakamoto Executive Vice President
Situs - RERC Ken Riggs President
Aaron Riggs Analyst
Stockbridge Associates George Casey, Jr President & CEO
Trepp LLC Matthew Anderson Managing Director
Susan Persin Senior Director of Research
Urban Land Institute
About the Urban Land Institute
The Urban Land Institute is a nonprofit education and research institute supported by its members. Its mission is to
provide leadership in the responsible use of land and in sustaining and creating thriving communities worldwide.
Established in 1936, the Institute has nearly 30,000 members representing all aspects of land use and development
disciplines. For more information, please visit www.uli.org.
Patrick Phillips, Chief Executive Officer
Urban Land Institute
© April 2015 by the Urban Land Institute.
This publication contains information in summary form and is therefore intended for general guidance only. It is not
intended to be a substitute for detailed research or the exercise of professional judgment. The Urban Land Institute
cannot accept any responsibility for loss occasioned to any person acting or refraining from action as a result of any
material in this publication. On any specific matter, reference should be made to the appropriate advisor.
ULI Real Estate
Consensus Forecast A Survey of Leading Real Estate Economists/Analysts
April 2015
Anita Kramer
Senior Vice President
ULI Center for Capital Markets and Real Estate
Recommended