We create chemistry for a sustainable future
Ulf LoleitSenior Vice PresidentTreasury
Roadshow AsiaNovember 2017
BASF Creditor Story, November 2017 2
Cautionary note regarding forward-looking statements
This presentation contains forward-looking statements. These forward-looking statements are basedon current estimates and projections of the Board of Executive Directors and on currently availableinformation. These forward-looking statements are not guarantees of the future developments andresults outlined therein. Rather, they depend on a number of factors, involve various risks anduncertainties, and are based on assumptions that may not prove to be accurate. Such risk factorsparticularly include those discussed on pages 111 to 118 of the BASF Report 2016. The BASFReport is available online at basf.com/report. BASF does not assume any obligation to update theforward-looking statements contained in this presentation.
BASF Creditor Story, November 2017 3
Agenda
At a glance1
Strategic levers2
Financing highlights3
Segments4

BASF Creditor Story, November 2017 4
Growth above chemical industry average – driven by innovative and sustainable products and solutions
Unique Verbund concept – competitive advantage based on integrated sites, operational excellence and best-in-class technologies
Broad and resilient portfolio – with global market access and strong customer relationships
Earnings growth and strong cash flow generation – based on operational and financial strength
Long-term value creation with progressive dividend policy – grow or at least maintain dividend at the previous year’s level
BASF shares – an attractive investment
BASF Creditor Story, November 2017 5
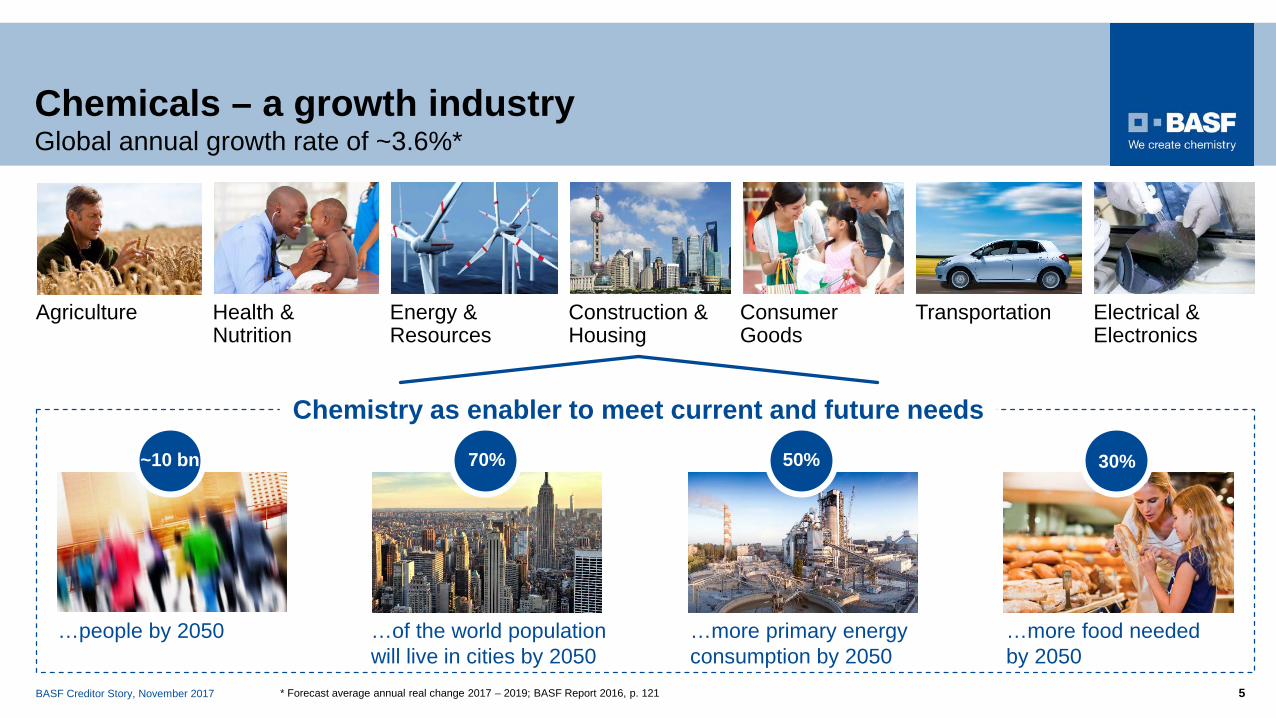
Chemicals – a growth industryGlobal annual growth rate of ~3.6%*
…more food needed by 2050
…more primary energy consumption by 2050
…of the world population will live in cities by 2050
Agriculture Health & Nutrition
Energy & Resources
TransportationConstruction &Housing
Consumer Goods
…people by 2050
Electrical & Electronics
Chemistry as enabler to meet current and future needs70% 50%~10 bn 30%
* Forecast average annual real change 2017 – 2019; BASF Report 2016, p. 121

BASF Creditor Story, November 2017 6
Broad and resilient portfolio2016: Sales of €57.6 billion; EBITDA of €10.5 billion
Percentage of sales 2016*
* Not depicted here: ‘Other’ 3% of Group sales and EBITDA €(1.0) billion

BASF Creditor Story, November 2017 7
Global market access through regional presence
Kuantan
Hong KongNanjing
Freeport
Florham Park
Geismar
LudwigshafenAntwerp
São Paulo
Regional centersSelected sitesVerbund sitesSelected research and development sites
Asia Pacific
Europe
South America, Africa, Middle East
North AmericaSales €14,042 millionEBIT €1,113 millionEmployees 17,583
Sales €26,039 millionEBIT €3,632 millionEmployees 70,784
Sales €12,165 millionEBIT €1,098 millionEmployees 18,156
Sales €5,304 millionEBIT €432 millionEmployees 7,307
2016: Sales by location of customer; EBIT by location of company

BASF Creditor Story, November 2017 8
Verbund – unique competitive advantageActively managed in line with market requirements
Annual cost savings of more than €1 billion through integrated production Verbund concept supports sustainability, reduces waste and avoids CO2 emissions of 6 million tons p.a.
Energy savings >€300 million p.a.
People, Customers, Technology, Production

BASF Creditor Story, November 2017 9
BASF Group Q3 2017Considerably higher sales and earnings
Financial figures Q3 2017 Q3 2016 Change
Sales €15.3 billion €14.0 billion 9%
EBITDA before special items €2.8 billion €2.5 billion 12%
EBITDA €3.0 billion €2.4 billion 23%
EBIT before special items €1.8 billion €1.5 billion 16%
EBIT €2.0 billion €1.5 billion 34%
Net income €1.3 billion €0.9 billion 50%
Reported EPS €1.45 €0.97 49%
Adjusted EPS €1.40 €1.10 27%
Operating cash flow €3.8 billion €2.5 billion 52%
Sales development Volumes Prices Portfolio CurrenciesQ3 2017 vs. Q3 2016 4% 7% 1% (3%)

BASF Creditor Story, November 2017 10
Stepwise increase of earnings levelEBIT and EBITDA*billion €, 2001–2016
3.7
4.7 4.6
7.0 7.28.4
8.9
7.76.5
9.9
11.2
10.010.4
11.0 10.6 10.59.7
0
2
4
6
8
10
12
2001 2002 2003 2004 2005 2006 2007 2008 2009 2010 2011 2012 2013 2014 2015 2016 Q1-Q32017
EBIT EBITDA
0.7
2.2 2.2
4.5 4.85.5
6.0
4.6
2.8
6.7
8.06.7 7.2
7.6
6.2 6.3 6.6
CAGREBITDA
7%CAGREBIT16%
* 2010, 2011 indicative, adjusted for IFRS 10 & 11; 2001–2009 as reported, without non-compensable foreign income taxes on oil production
Avg. EBITDA level in depicted years
9.7

BASF Creditor Story, November 2017 11
billion €, 2001–2016
2.3 2.3
4.9 4.65.3
5.9 5.85.0
5.76.5
7.16.6
8.1
7.0
9.4
7.7 7.6
0123456789
10
2001 2002 2003 2004 2005 2006 2007 2008 2009 2010 2011 2012 2013 2014 2015 2016 Q1-Q32017
Free cash flowOperating cash flow
-0.5 -0.1
2.8 2.63.3 3.5 3.2
2.53.2
3.9 3.7
2.63.2
1.7
3.6 3.6
5.0
6.3%
Strong cash flow development

BASF Creditor Story, November 2017 12
Sales growth – slightly faster than global chemical production
Deliver attractive returns – earn a significant premium on cost of capital
EBITDA growth – well above global chemical production
Remain a strong cash provider – continuously generate high levels of free cash flow
Progressive dividend policy – grow or at least maintain dividend at previous year’s level
Financial targets for the coming years
BASF Creditor Story, November 2017 13
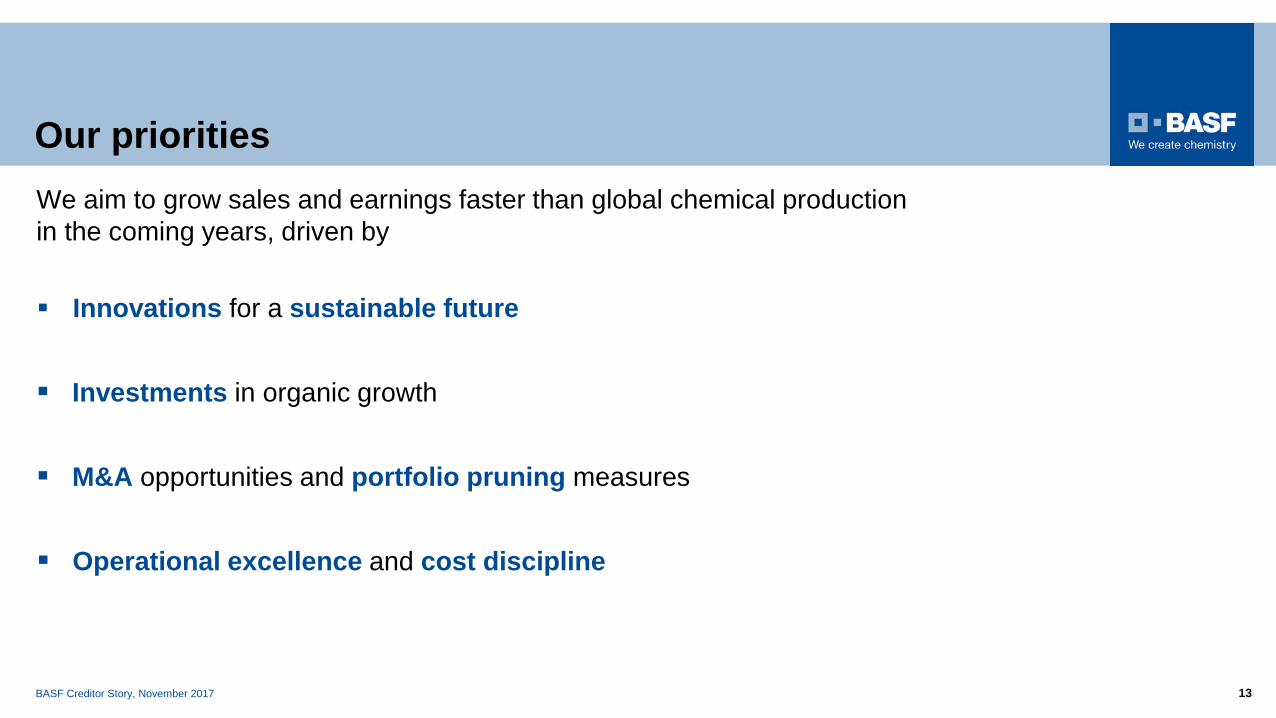
Innovations for a sustainable future
Investments in organic growth
M&A opportunities and portfolio pruning measures
Our priorities
Operational excellence and cost discipline
We aim to grow sales and earnings faster than global chemical productionin the coming years, driven by
BASF Creditor Story, November 2017 14
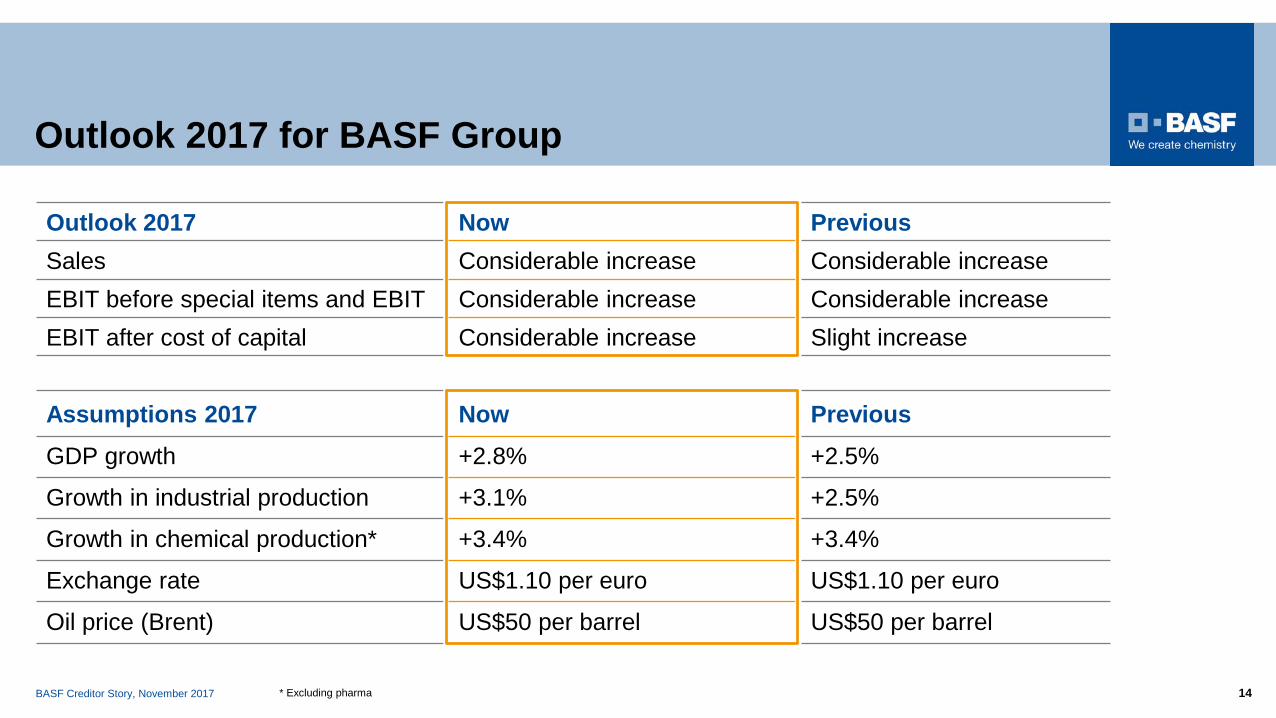
Outlook 2017 for BASF Group
Assumptions 2017 Now PreviousGDP growth +2.8% +2.5%
Growth in industrial production +3.1% +2.5%
Growth in chemical production* +3.4% +3.4%
Exchange rate US$1.10 per euro US$1.10 per euro
Oil price (Brent) US$50 per barrel US$50 per barrel
* Excluding pharma
Outlook 2017 Now PreviousSales Considerable increase Considerable increase EBIT before special items and EBIT Considerable increase Considerable increaseEBIT after cost of capital Considerable increase Slight increase

BASF Creditor Story, November 2017 15
Agenda
At a glance1
Strategic levers► Portfolio development► Investments► Innovation► Sustainability► Operational excellence
2
Financing highlights3
Segments4

BASF Creditor Story, November 2017 16
Continuous global portfolio development
target(in % of sales*)~50% ~50%
Maintaining a balanced portfolio
Divestment of businesses,e.g., due to loss of differentiation
Divestment of businesses,
e.g., due to lower market attractiveness
Commoditization leads to restructuring
Growth fields
Innovation pipeline
Acquisitions
Specialties and solutions Differentiated commodities
Attractive markets Differentiation by process
technologies and integration
Attractive markets Differentiation by customer
proximity and innovations
* Excluding Oil & Gas sales

BASF Creditor Story, November 2017 17
Portfolio development towards more market-driven and innovative businesses
Strong Partnerships Gazprom PETRONAS Sinopec Total
Selected transactions 2010−today
BASFcore business
~€5.5 billion salesin emerging and innovation-driven businesses
Acquisitions Functional crop care Personal care & food Omega-3 fatty acids Enzymes Battery materials Specialty plastics Selected assets in Oil & Gas Refinish coatings Surface treatment
Divestitures
~€21.0 billion salesin businesses with limited fit and differentiation potential
Styrenics Fertilizers Selected assets in Oil & Gas Natural gas trading & storage Custom synthesis business Textile chemicals Polyolefin catalysts Industrial coatings Leather chemicals

BASF Creditor Story, November 2017 18
Clear acquisition criteria
We want to acquire businesses which …
provide a return on investment above the WACC
are EPS accretive by year three at the latest
We want to acquire businesses which …
generate profitable growth above the industry average
are innovation-driven
offer a special value proposition to customers
reduce earnings cyclicality
Acquisitioncriteria
Strategic acquisition criteria Financial acquisition criteria

BASF Creditor Story, November 2017 19
Complementary acquisitions to strengthen the portfolio of BASF Group
Solvayʼs integrated global polyamide business
Purchase price: ~€1.6 billion Sales 2016: ~€1.3 billion EBITDA 2016: ~€200 million Market CAGR: >3.5% Closing expected in Q3 2018
Significant parts of Bayerʼs seed and non-selective herbicide businesses
Purchase price: ~€5.9 billion Sales 2016: ~€1.3 billion EBITDA 2016: ~€385 million Sales CAGR: ~15% (2014–2016) Closing expected in Q1 2018
ChemetallSurface treatment business
Purchase price: ~US$3.1 billion Sales 2015: ~US$845 million EBITDA 2015: ~US$200 million Sales CAGR: ~7% (2007–2015) Closed in December 2016

BASF Creditor Story, November 2017 20
BASF signed agreement to acquire significant parts of Bayer’s seed and non-selective herbicide businesses
Fully enabled seed and trait businesses Attractive and sizeable seed portfolio for canola/oilseed
rape, soybean and cotton in the Americas and Europe
Excellent trait research for canola, soybean and cotton
LibertyLink® technology for herbicide tolerance and related trademarks
Complementary crop protection business Global glufosinate-ammonium-based non-selective herbicide
business
State-of-the-art production facilities in the U.S., Canada and Germany

BASF Creditor Story, November 2017 21
BASF to acquire Solvay’s global polyamide business
* Application examples
Broader global scope Enhanced presence, especially in Asia and South America
Stronger capabilities to serve global and regional customers
Wider range of engineering plastics Technyl®, Ultramid®, Ultradur®, Ultraform®, Ultracom®
Broadening technical skills and innovation capabilities* Heat-resistant and high-voltage electrical and electronic parts
Tailor-made solutions for components in automotive
Mechanically strong and thermally stable consumer goods
Improved reliability of supply Backward integration into all key raw materials for polyamide 6.6
Fully integrated engineering plastics value chain

BASF Creditor Story, November 2017 22
Investments in organic growthInvestments of ~€3.9 billion planned for 2017
Performance Products
21%
Oil & Gas23% €19.0 billion
Capex budget 2017–2021 by segment
Other13%
Chemicals24%
Capex budget 2017–2021 by region
Asia Pacific16%
North America22%
Agricultural Solutions4%
Other**3%
Functional Materials& Solutions
15%
€19.0 billion
South America*10%
* Including Africa and Middle East, ** Alternative sites currently being investigated
Europe 49%
Oil & Gas Europe

BASF Creditor Story, November 2017 23
Investment projects with startup in 2017
Aroma ingredients complex Kuantan, Malaysia
BASF and PETRONAS further expand joint activities in Malaysia Investment: around €500 million
Ammonia plantFreeport, Texas
BASF and Yara are building world-scale ammonia plant in the U.S. 750,000 tons per year;
hydrogen-based process
Engineering plastics Schwarzheide, Germany
Expansion of annual capacity by 70,000 tons Increasing BASFʼs global compounding
capacity to more than 700,000 tons
BASF Creditor Story, November 2017 24
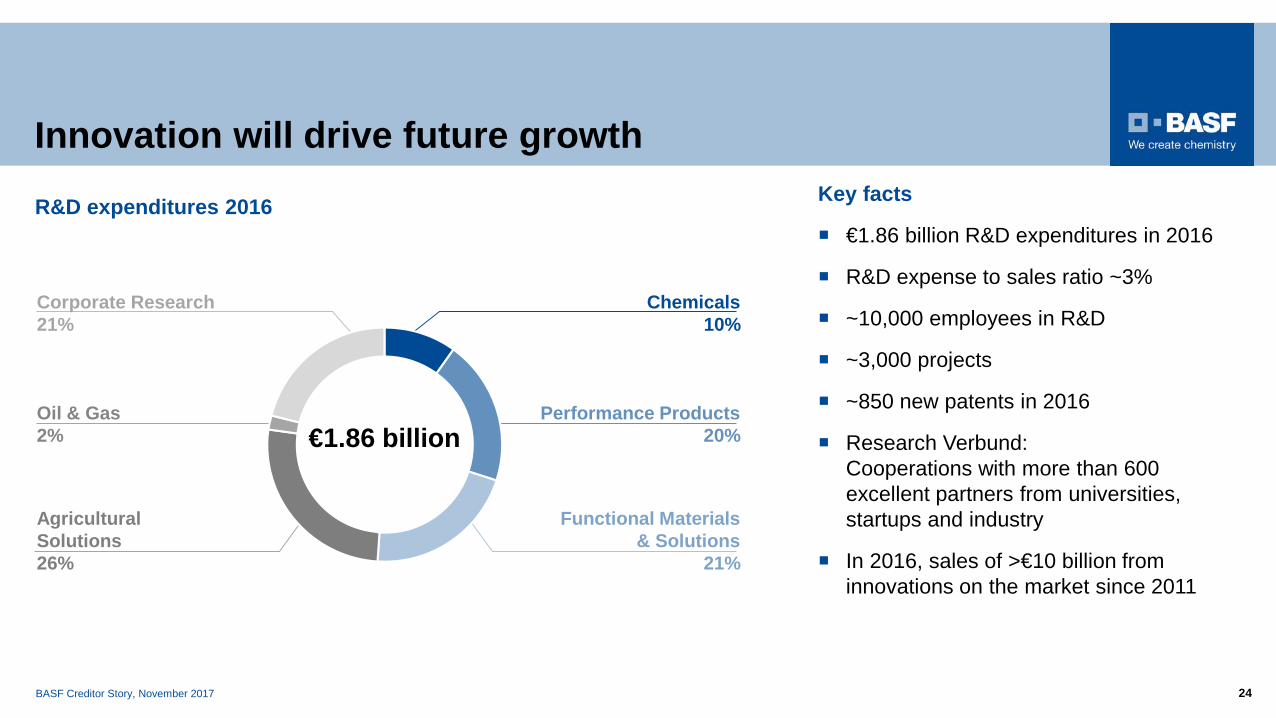
Oil & Gas2%
Innovation will drive future growth
Agricultural Solutions26%
Chemicals10%
Performance Products20%
Corporate Research21%
Key facts
€1.86 billion R&D expenditures in 2016
R&D expense to sales ratio ~3%
~10,000 employees in R&D
~3,000 projects
~850 new patents in 2016
Research Verbund: Cooperations with more than 600 excellent partners from universities, startups and industry
In 2016, sales of >€10 billion from innovations on the market since 2011
R&D expenditures 2016
€1.86 billion
Functional Materials & Solutions
21%

BASF Creditor Story, November 2017 25
Polymer Technologies
Biotechnology
Production Processes
Materials
Catalysis
Biodegradable & BiobasedMaterials
Enabling Methods
Corporate Research: BASF’s key technology capabilities are bundled in seven focus areas
Selected key technology capabilities reflect where BASF requires continued effort and resources to safeguard today’s and tomorrow’s excellence in innovation.
BASF Creditor Story, November 2017 26
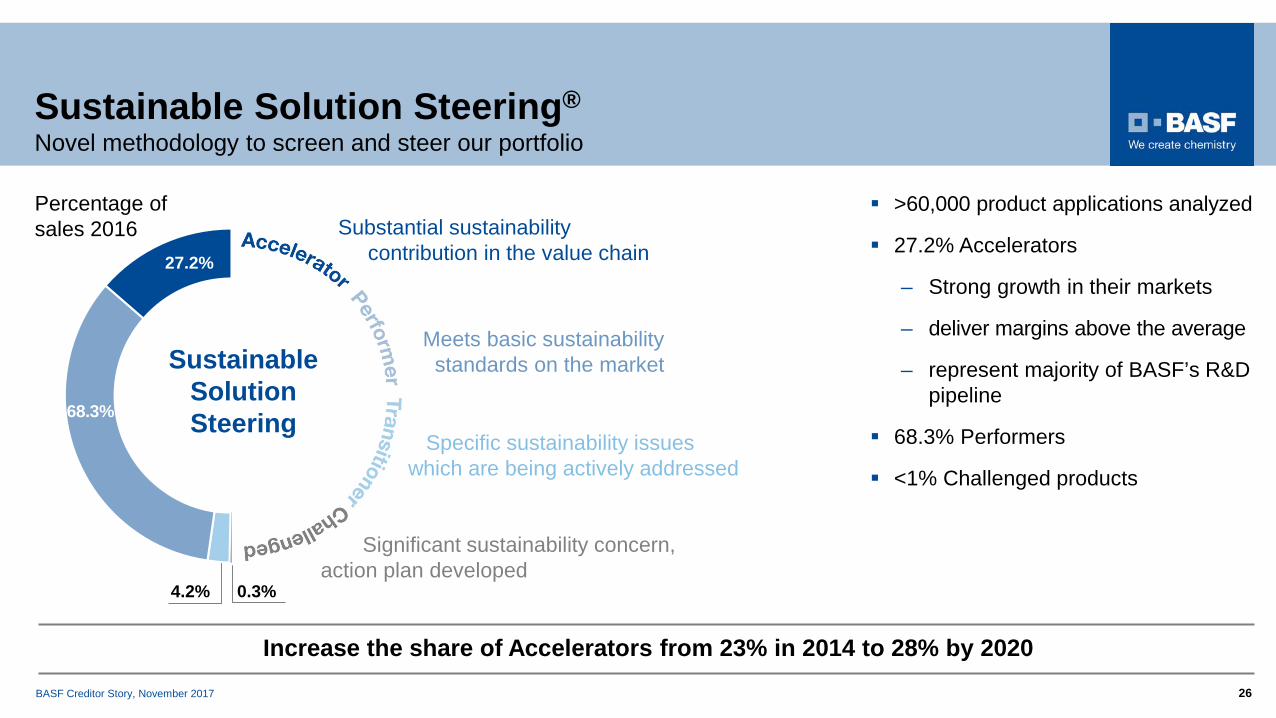
Sustainable Solution Steering®Novel methodology to screen and steer our portfolio
4.2% 0.3%
>60,000 product applications analyzed
27.2% Accelerators
– Strong growth in their markets
– deliver margins above the average
– represent majority of BASF’s R&D pipeline
68.3% Performers
<1% Challenged products
Increase the share of Accelerators from 23% in 2014 to 28% by 2020
27.2%
68.3%
Substantial sustainability contribution in the value chain
Meets basic sustainability standards on the market
Specific sustainability issues which are being actively addressed
Significant sustainability concern,action plan developed
SustainableSolutionSteering
Percentage of sales 2016
BASF Creditor Story, November 2017 27
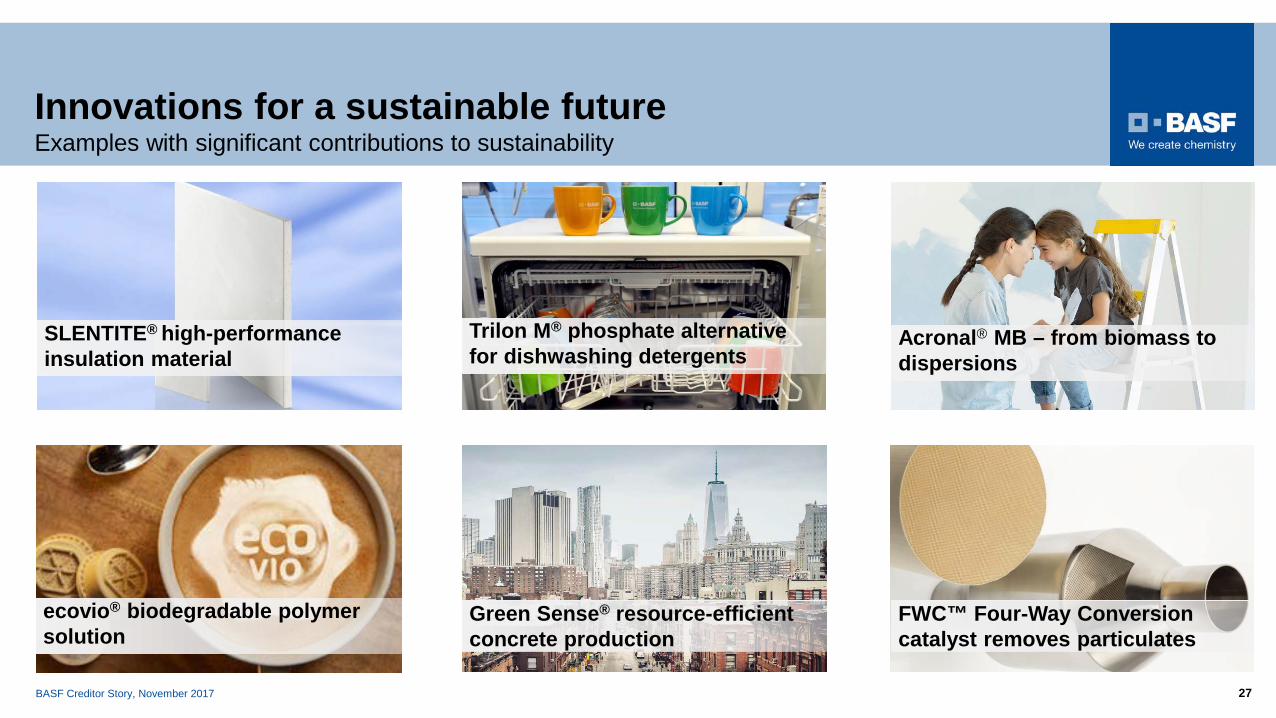
Innovations for a sustainable futureExamples with significant contributions to sustainability
FWC™ Four-Way Conversion catalyst removes particulates
Acronal® MB – from biomass to dispersions
Trilon M® phosphate alternative for dishwashing detergents
SLENTITE® high-performance insulation material
Green Sense® resource-efficient concrete production
ecovio® biodegradable polymer solution
BASF Creditor Story, November 2017 28
0
0,.001
Earnings contribution 2016 2017–2018 Total
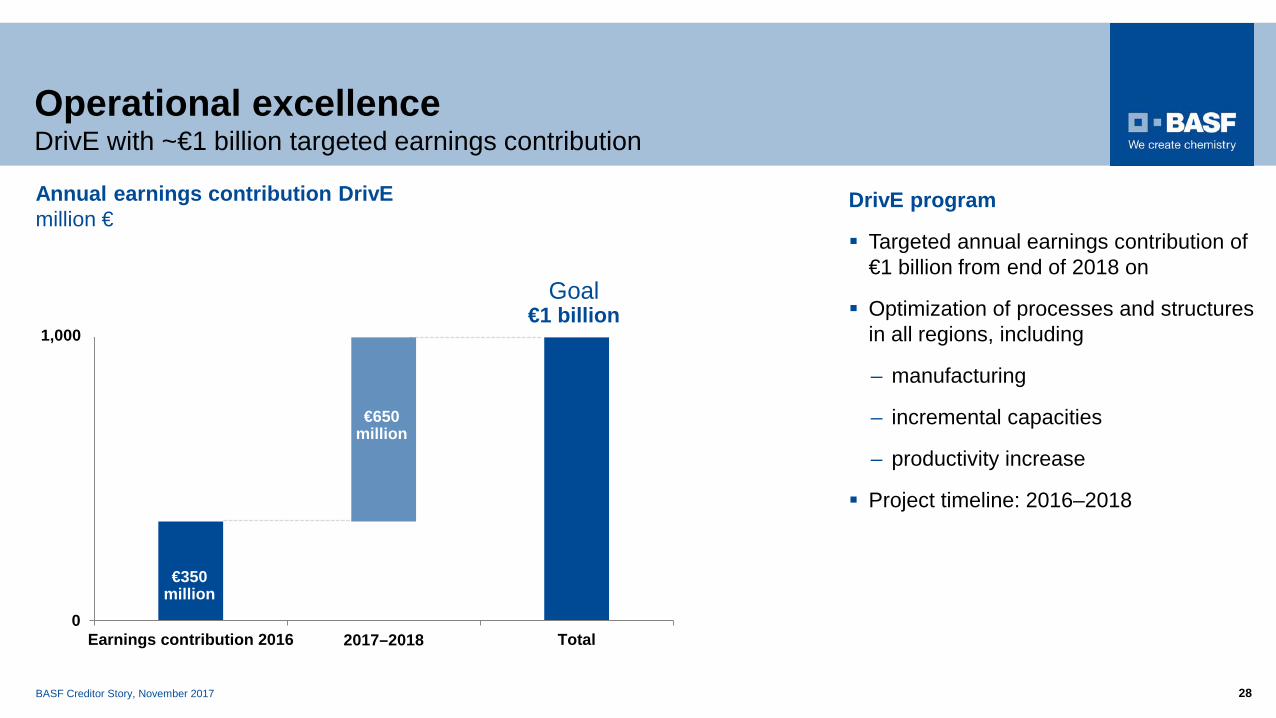
Operational excellenceDrivE with ~€1 billion targeted earnings contribution
DrivE program
Targeted annual earnings contribution of €1 billion from end of 2018 on
Optimization of processes and structures in all regions, including
– manufacturing
– incremental capacities
– productivity increase
Project timeline: 2016–2018
€350 million
€650 million
Goal €1 billion
Annual earnings contribution DrivEmillion €
1,000

BASF Creditor Story, November 2017 29
Strong track record in operational excellence
* Excl. companies with major IFRS 10/11 restatements, i.e. BASF YPC Nanjing, Libya onshore, other Oil & Gas and Catalysts companies
50
100
150
200
250
300
350
2001 2002 2003 2004 2005 2006 2007 2008 2009 2010 2011 2012 2013 2014 2015 2016
EBITDA
Sales
Fixed Costs
CAGREBITDA
8%
CAGRSales
4%
3%
CAGRFixed Costs
BASF Group* 2001–2016 indexed; CAGR 2001–2016

BASF Creditor Story, November 2017 30
Digitalization will support BASF’s growth and efficiencyDigital Business Models
Smart Innovation
Smart Supply Chain
Smart Manu-facturing
Growth
Digital business models Customer connectivity Digitalization in R&D
New revenue streams Increased supply share Higher innovation output
Predictive maintenance Augmented reality in production Smart supply chain
Increased capacity Increased work efficiency Reduced working capital
Efficiency
BASF Creditor Story, November 2017 31
Agenda
At a glance1
Strategic levers2
Financing highlights3
Segments4

BASF Creditor Story, November 2017 32
Earnings growth and strong cash flow generation – based on operational and financial strength
Financing highlights
Sound capital structure – with strong commitment to keep a solid A rating
Diversified financing strategy – with well-balanced bond profile in terms of maturity, investor base, and currencies

BASF Creditor Story, November 2017 33
Financing strategy
Diversified debt financing instrumentsas of September 30, 2017
€20 billion debt issuance program (for long-term debt financing)
US$12.5 billion commercial paper program (for short-term debt financing)
Two broadly syndicated backup lines of €3 billion each (maturing in 2020 and 2022)
Financing strategy highlights
€16.2 billion*
* As of September 30, 2017, no outstanding commercial papers** Last confirmation Moody’s: October 17, 2017, S&P: October 18, 2017, Scope: October 18, 2017.
Our target: Keep a solid A rating (current ratings**: S&P A / Moody’s A1 / Scope A)
Bank loans21%
Other bonds24%
€-denominated bonds55%
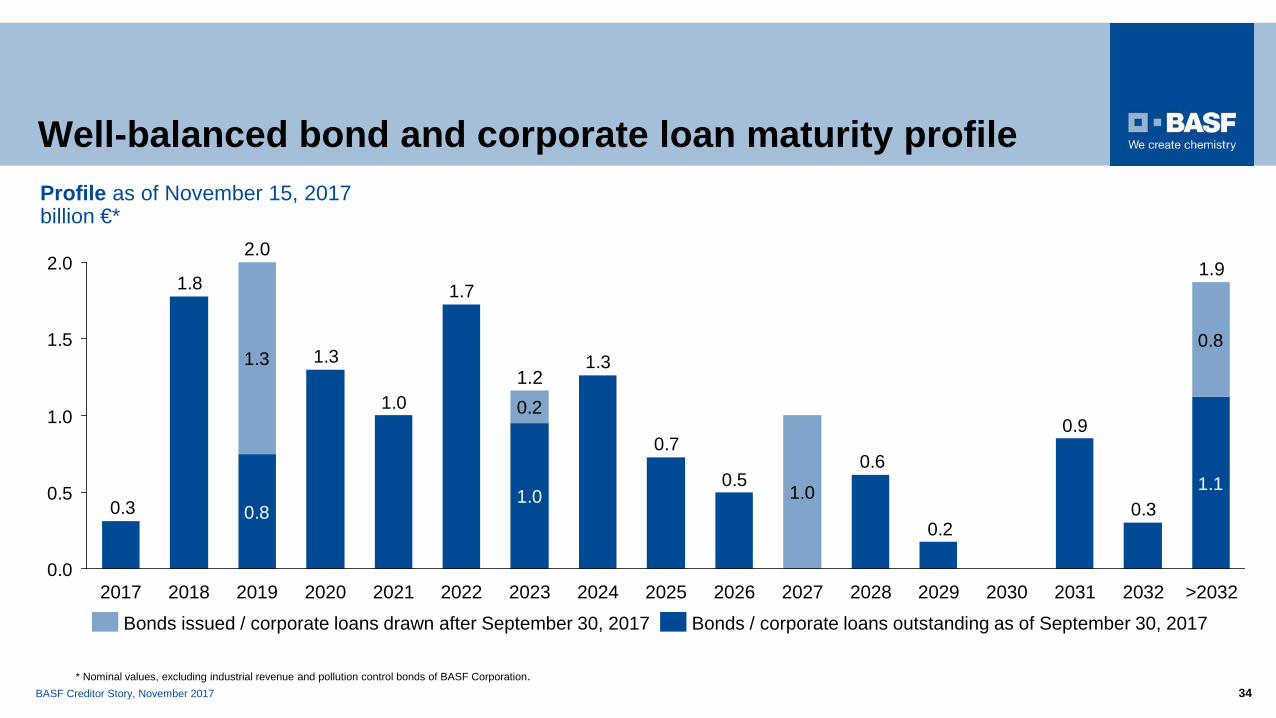
BASF Creditor Story, November 2017 34* Nominal values, excluding industrial revenue and pollution control bonds of BASF Corporation.
Profile as of November 15, 2017 billion €*
Well-balanced bond and corporate loan maturity profile
1.10.3
0.9
0.2
0.60.5
0.7
1.3
1.0
1.7
1.0
1.3
0.8
1.8
0.3
0.81.3
0.2
1.0
0.0
0.5
1.0
1.5
2.0
>2032
1.9
20262023 2032
1.2
2029 20302028 20312027202520242019
2.0
2020 2022202120182017Bonds / corporate loans outstanding as of September 30, 2017Bonds issued / corporate loans drawn after September 30, 2017

BASF Creditor Story, November 2017 35
Overview of bonds (1/3) as of November 15, 2017
Bond Term Issuer Volume ISIN CodeEUR Floating Rate Note 2017/2019 BASF SE EUR1.25 billion XS1718416586
0.875% EUR Bond 2017/2027 BASF SE EUR1.00 billion XS1718418103
1.625% EUR Bond 2017/2037 BASF SE EUR750 million XS1718417717
0.925% USD Bond with Warrant 2017/2023 BASF SE USD850 million
Bond with Warrant (DE000A2BPEU0)
Bond(DE000A2BPEV8)
Warrant(DE000A2BPEW6)
2.5% USD Bond 2017/2022 BASF SE USD500 million XS1551001768
1.75% GBP Bond 2017/2025 BASF SE GBP300 million XS1548422846
1.45% EUR Bond 2017/2032 BASF SE EUR300 million XS1551001768
2.67% NOK Bond 2017/2029 BASF SE NOK1.60 billion XS1539109790
0.0% EUR Bond 2016/2020 BFE* EUR1.00 billion DE000A188WV3
0.75% EUR Bond 2016/2026 BFE* EUR500 million DE000A188WW1
* BASF Finance Europe N.V.
BASF Creditor Story, November 2017 36
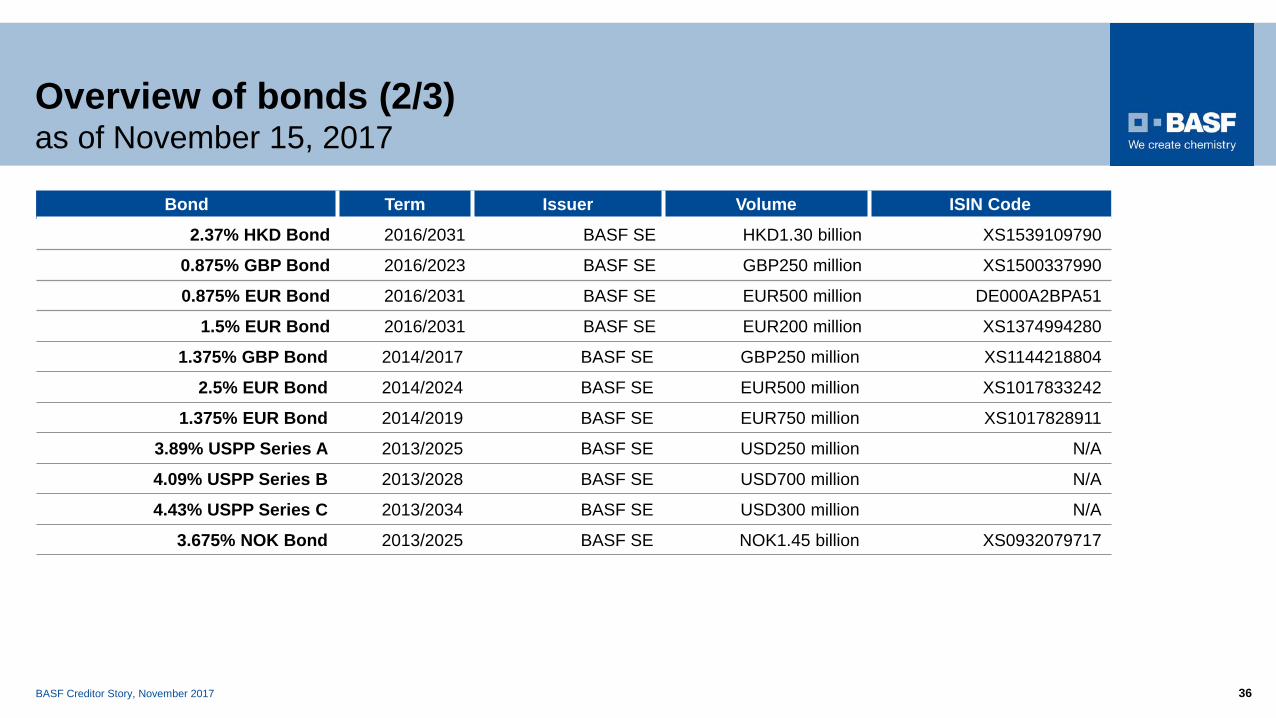
Bond Term Issuer Volume ISIN Code2.37% HKD Bond 2016/2031 BASF SE HKD1.30 billion XS1539109790
0.875% GBP Bond 2016/2023 BASF SE GBP250 million XS1500337990
0.875% EUR Bond 2016/2031 BASF SE EUR500 million DE000A2BPA51
1.5% EUR Bond 2016/2031 BASF SE EUR200 million XS1374994280
1.375% GBP Bond 2014/2017 BASF SE GBP250 million XS1144218804
2.5% EUR Bond 2014/2024 BASF SE EUR500 million XS1017833242
1.375% EUR Bond 2014/2019 BASF SE EUR750 million XS1017828911
3.89% USPP Series A 2013/2025 BASF SE USD250 million N/A
4.09% USPP Series B 2013/2028 BASF SE USD700 million N/A
4.43% USPP Series C 2013/2034 BASF SE USD300 million N/A
3.675% NOK Bond 2013/2025 BASF SE NOK1.45 billion XS0932079717
Overview of bonds (2/3) as of November 15, 2017

BASF Creditor Story, November 2017 37
Overview of bonds (3/3) as of November 15, 2017
Bond Term Issuer Volume ISIN CodeEUR Floating Rate Note 2013/2020 BASF SE EUR300 million XS0931272776
2.875% EUR Bond 2013/2033 BASF SE EUR200 million XS0932307100
EUR Floating Rate Note 2013/2018 BASF SE EUR300 million XS0903325206
3.25% EUR Bond 2013/2043 BASF SE EUR200 million XS0888667200
3% EUR Bond 2013/2033 BASF SE EUR500 million XS0885399583
1.875% EUR Bond 2013/2021 BASF SE EUR1.0 billion XS0883560715
2.0% EUR Bond 2012/2022 BASF SE EUR1.25 billion DE000A1R0XG3
1.5% EUR Bond 2012/2018 BASF SE EUR1.0 billion XS0836260975
4.875% EUR Bond 2003/2018 Ciba Specialty Chemicals Finance Luxembourg S.A. EUR500 million XS0170386998

BASF Creditor Story, November 2017 38
Balance sheet remains strong
Total assets decreased slightly to €76.0 billion
Provisions for pension obligations decreased by €1.4 billion to €6.8 billion
Net debt at €12.3 billion(December 31, 2016: €14.4 billion)
Equity ratio at 43.9% (December 31, 2016: 42.6%)
Balance sheet September 30, 2017 vs. December 31, 2016billion €
Liquid funds*
Accountsreceivable
Long-termassets
Inventories
Other assets
Otherliabilities
Financialdebt
Equity
27.6 26.5
16.3 16.2
32.6 33.3
Dec 31, 2016 Sep 30, 20171.9 3.93.0 3.911.0
10.6
10.0 10.0
50.6 47.6
Dec 31, 2016 Sep 30, 2017
76.5 76.0
* Including marketable securities
76.5 76.0
BASF Creditor Story, November 2017 39
BASF Creditor Relations TeamFrank WilhelmiHead of Corporate Finance Group
Dr. Lars BuddeSenior IR ManagerCreditor RelationsContact Details:Email: [email protected]: +49 621 60 91386Websites: www.basf.com/bonds
www.basf.com/anleihenThomas LangguthCorporate Finance Group
Niklas FrieseCorporate Finance Group

BASF Creditor Story, November 2017 40
Agenda
At a glance1
Strategic levers2
Financing highlights3
Segments4

BASF Creditor Story, November 2017 41
Intermediates728+10%
Monomers1,770+41%
Petrochemicals1,525+16%
€4,023+25%
Sales Q3 2017 vs. Q3 2016*million €
EBIT before special items* million €
488629
9581,120 1,102
0
400
800
1,200
Q3 Q4 Q1 Q2 Q3
Sales development Volumes Prices Portfolio CurrenciesQ3 2017 vs. Q3 2016 6% 22% 0% (3%)
2017
* Effective January 1, 2017, the Monomers and Dispersions & Pigments divisions’ activities for the electronics industry were combined into the global Electronic Materials business unit and allocated to the Dispersions & Pigments division in the Performance Products segment. The 2016 figures have been adjusted accordingly.
2016
ChemicalsHigher earnings driven by increased margins and higher volumes

BASF Creditor Story, November 2017 42
Performance ProductsEBIT before special items declined, EBIT increased due to special incomefrom transfer of leather chemicals business
Performance Chemicals980+4%
Nutrition & Health451(11%)
Care Chemicals1,213+3%
€3,983+2%
EBIT before special items* million €
Sales Q3 2017 vs. Q3 2016*million €
Dispersions & Pigments1,339+3%
Sales development Volumes Prices Portfolio CurrenciesQ3 2017 vs. Q3 2016 6% 0% (1%) (3%)
473
237
515405 385
0
200
400
600
800
Q3 Q4 Q1 Q2 Q320172016
* Effective January 1, 2017, the Monomers and Dispersions & Pigments divisions’ activities for the electronics industry were combined into the global Electronic Materials business unit and allocated to the Dispersions & Pigments division in the Performance Products segment. The 2016 figures have been adjusted accordingly.
BASF Creditor Story, November 2017 43
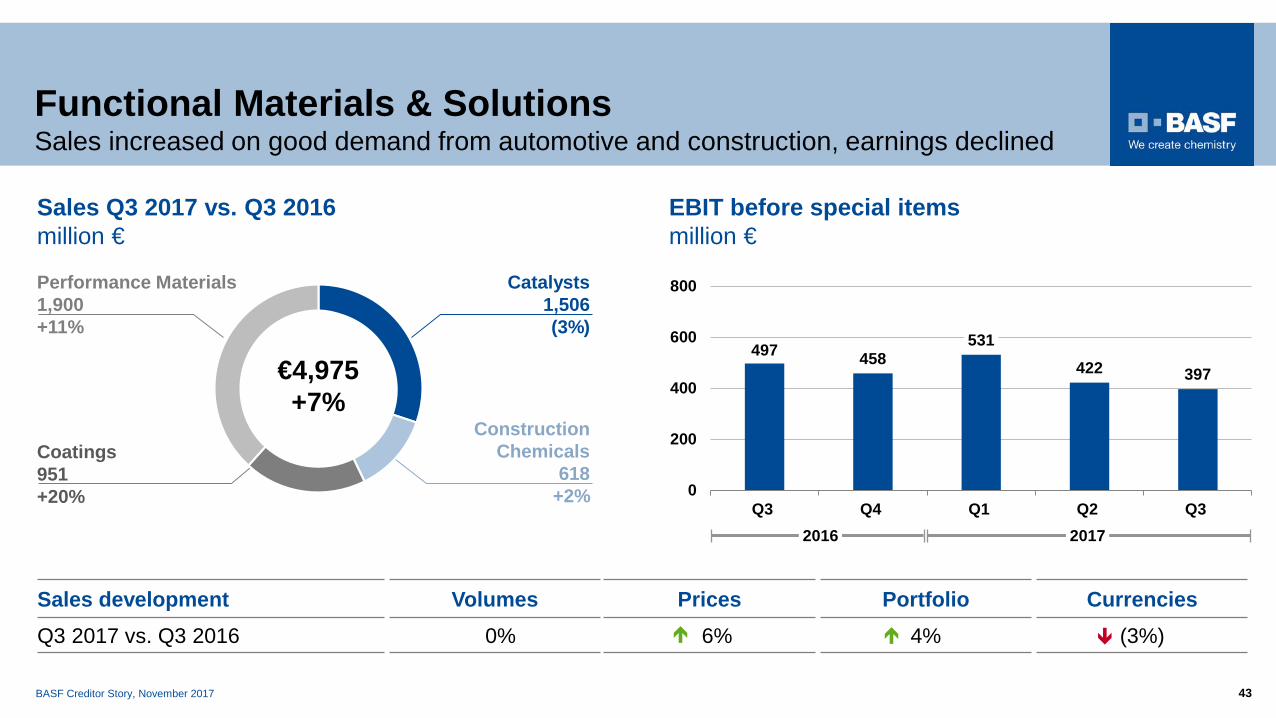
Functional Materials & Solutions Sales increased on good demand from automotive and construction, earnings declined
Coatings951+20%
Catalysts1,506 (3%)
ConstructionChemicals
618+2%
Performance Materials1,900+11%
€4,975+7%
497 458531
422 397
0
200
400
600
800
Q3 Q4 Q1 Q2 Q3
EBIT before special items million €
Sales Q3 2017 vs. Q3 2016million €
Sales development Volumes Prices Portfolio CurrenciesQ3 2017 vs. Q3 2016 0% 6% 4% (3%)
20172016

BASF Creditor Story, November 2017 44
Agricultural SolutionsEarnings decreased, primarily due to the difficult market situation in Brazil
1,049 987
0
1,000
2,000
Q3 2016 Q3 2017
Sales Q3 2017 vs. Q3 2016million €
Sales development Volumes Prices Portfolio CurrenciesQ3 2017 vs. Q3 2016 5% (8%) 0% (3%)
EBIT before special items million €
97
21
0
100
200
300
Q3 2016 Q3 2017
(6%)
(78%)

BASF Creditor Story, November 2017 45
Oil & GasHigher oil and gas prices and volumes, EBIT before special items lower due to one-time earnings effects in the prior-year quarter
Sales Q3 2017 vs. Q3 2016million €
194 180
33
139
0
100
200
300
Q3 2016 Q3 2017
Sales development Volumes Prices/Currencies PortfolioQ3 2017 vs. Q3 2016 9% 11% 0%
EBIT before special items Net income
618739
0
500
1,000
Q3 2016 Q3 2017
EBIT before special items, net income million €
+20%

BASF Creditor Story, November 2017 46
Review of “Other”
million € Q3 2017 Q3 2016
Sales 548 538
EBIT before special items (325) (233)
Thereof Costs of corporate research (93) (77)
Costs of corporate headquarters (57) (54)
Foreign currency results, hedging and other measurement effects (116) (101)
Other businesses 13 15
Special items (5) (23)
EBIT (330) (256)

BASF Creditor Story, November 2017 47
Cash flow development Q1 – Q3 2017
million € Q1 – Q3 2017 Q1 – Q3 2016
Cash provided by operating activities 7,597 5,840
Thereof Changes in net working capital 94 (393)
Miscellaneous items (190) (172)
Cash used in investing activities (3,413) (2,776)
Thereof Payments made for tangible / intangible assets (2,606) (2,915)
Acquisitions / divestitures (44) 212
Cash used in financing activities (1,546) (1,898)
Thereof Changes in financial liabilities 1,276 837
Dividends (2,841) (2,753)
Free cash flow 4,991 2,925

BASF Creditor Story, November 2017 48BASF Investor Day 2015 – Keynote speech 48
Recommended