• UIDAI & Govt. of India officials for generously making information public.
• Volunteer and sabbatical staff for analyzing and clarifying data.

• Presentation is based on public information.
• Opinions and interpretations are of the presenter.
• The presenter does not represent Unique Identification Authority of India (UIDAI).

• Transparency – Unprecedented level of
technical information of the system
– More to come • Risks
– Unchartered territory • Safety Net
– Collaboration with industry
Thank you, biometric community
• Context • PoC Setup & Protocol • Results • Conclusions

• Provide ID to the ID-less • To remove ghost identities • To improve government service delivery • Provide ubiquitous verifiable identity proof
– Banking & payment – Entitlements, pension – Mobile service – Access control
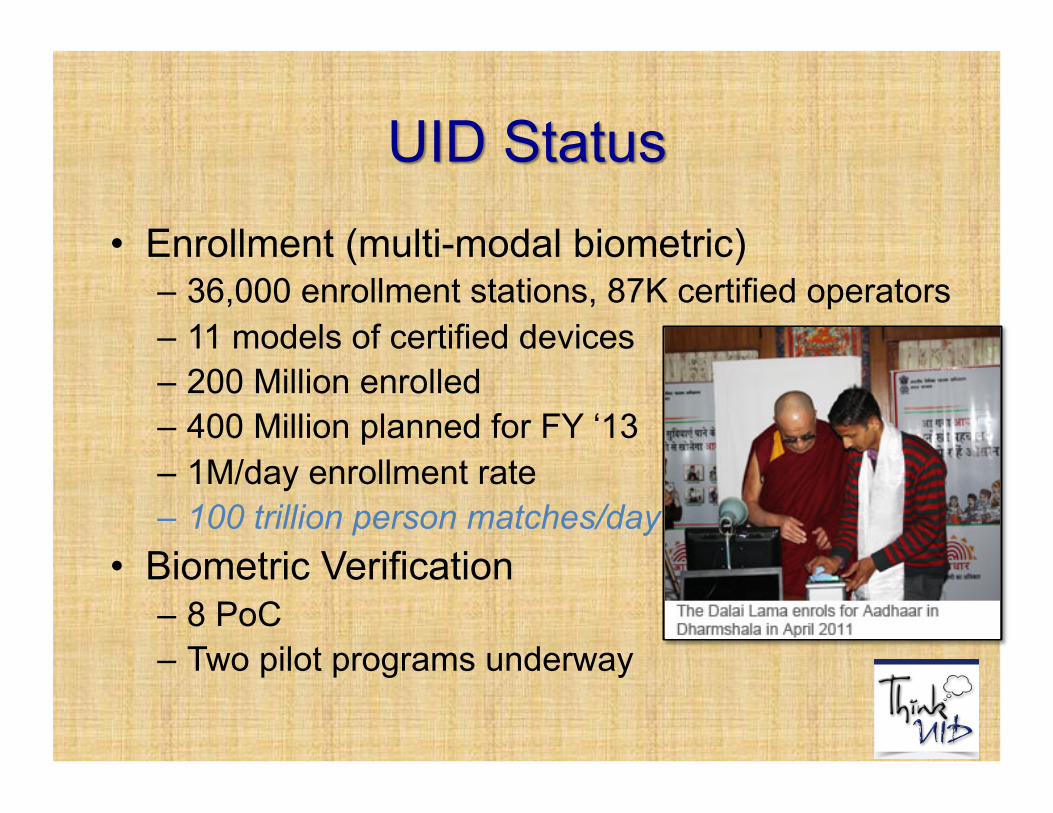
• Enrollment (multi-modal biometric) – 36,000 enrollment stations, 87K certified operators – 11 models of certified devices – 200 Million enrolled – 400 Million planned for FY ‘13 – 1M/day enrollment rate – 100 trillion person matches/day
• Biometric Verification – 8 PoC – Two pilot programs underway
Accuracy & Performance Testing

O n e m i l l i o n i n t e r o p e r a b l e m i c r o -A T M
Aa d h a a r B r i n g s P e n s i o n H o m e
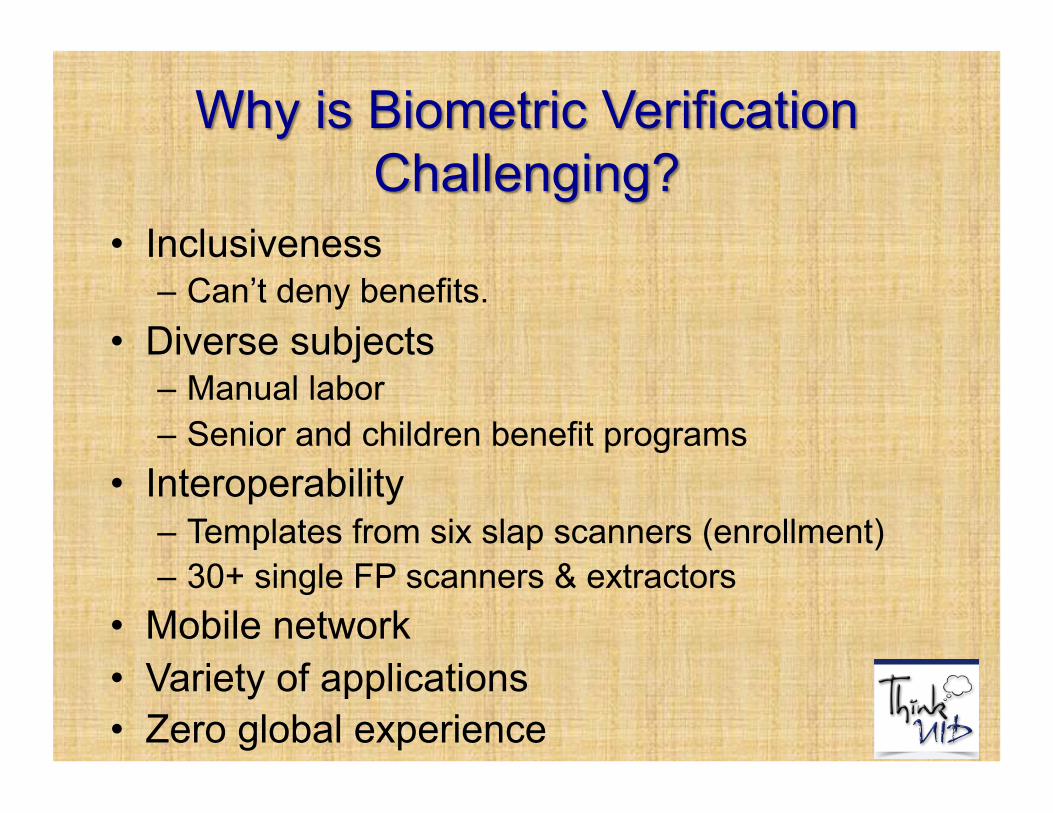
• Inclusiveness – Can’t deny benefits.
• Diverse subjects – Manual labor – Senior and children benefit programs
• Interoperability – Templates from six slap scanners (enrollment) – 30+ single FP scanners & extractors
• Mobile network • Variety of applications • Zero global experience
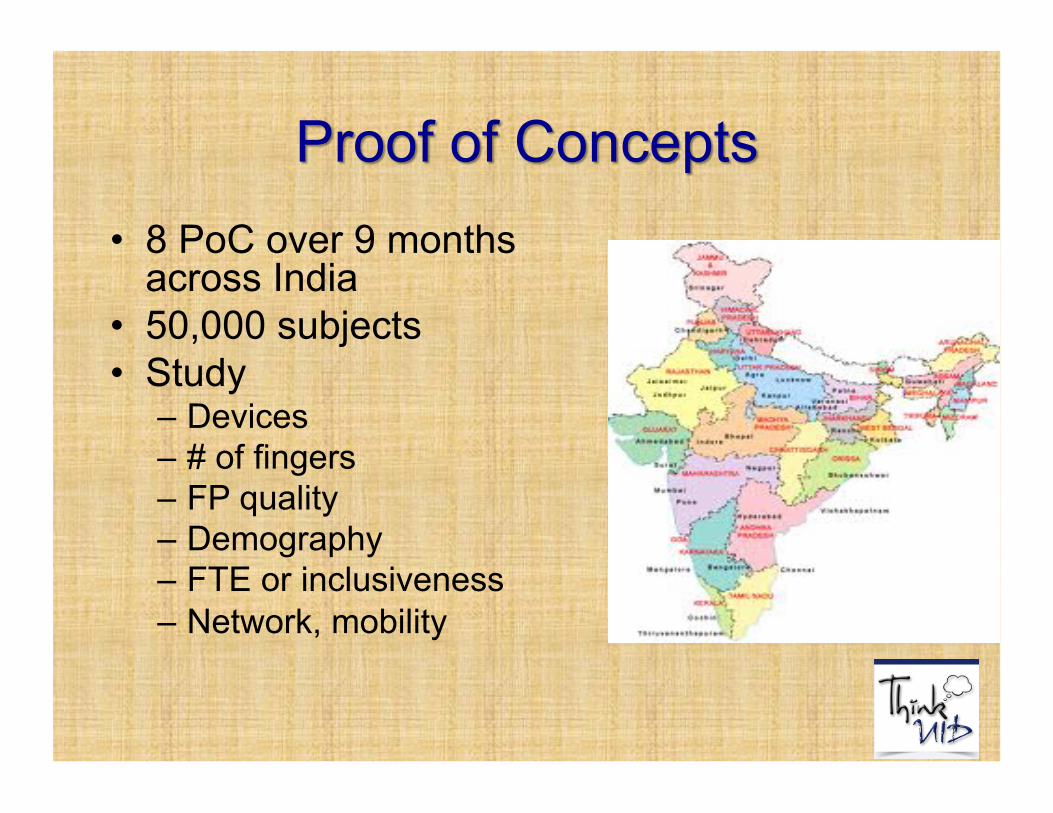
• 8 PoC over 9 months across India
• 50,000 subjects • Study
– Devices – # of fingers – FP quality – Demography – FTE or inclusiveness – Network, mobility
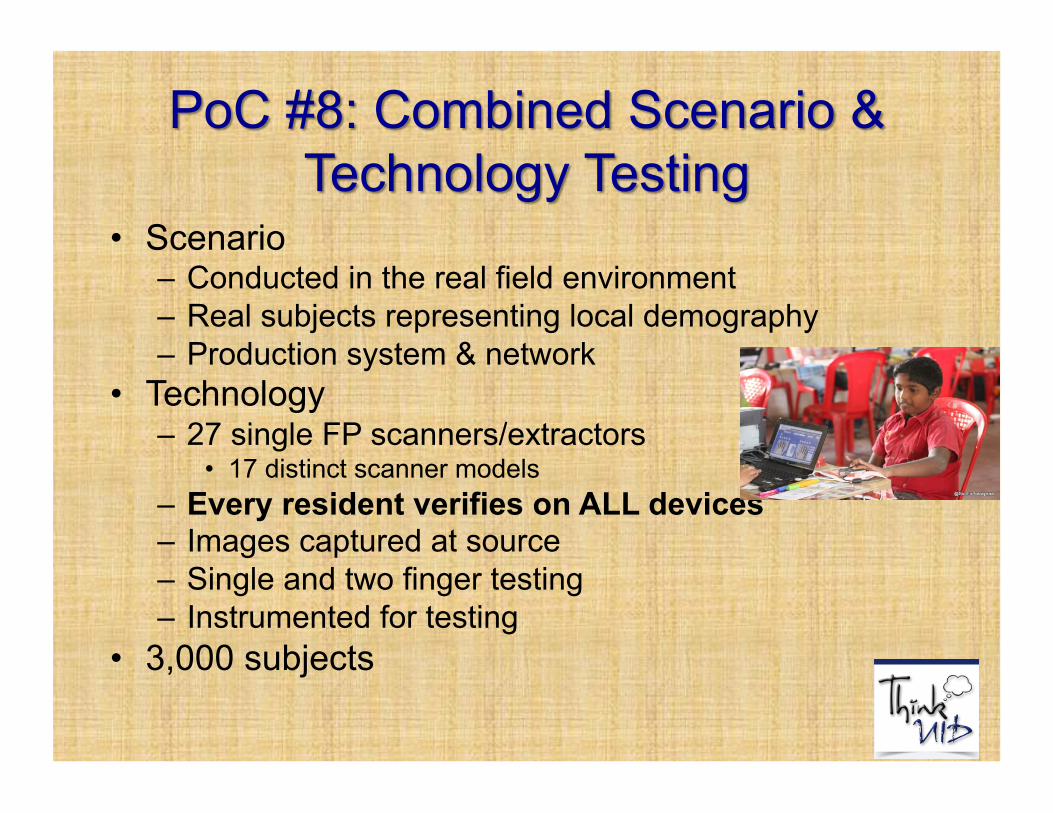
• Scenario – Conducted in the real field environment – Real subjects representing local demography – Production system & network
• Technology – 27 single FP scanners/extractors
• 17 distinct scanner models – Every resident verifies on ALL devices – Images captured at source – Single and two finger testing – Instrumented for testing
• 3,000 subjects
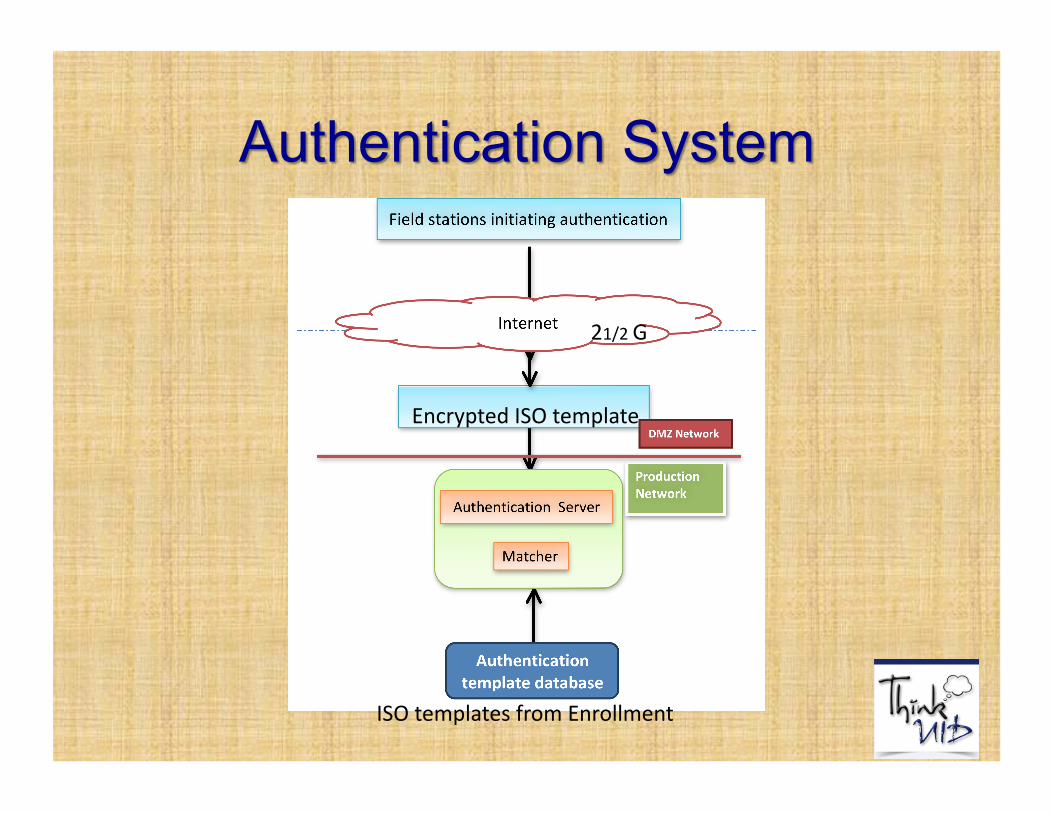
Encrypted ISO template
21/2G
ISO templates from Enrollment
Finger that has best matching score with corresponding enrolled
template
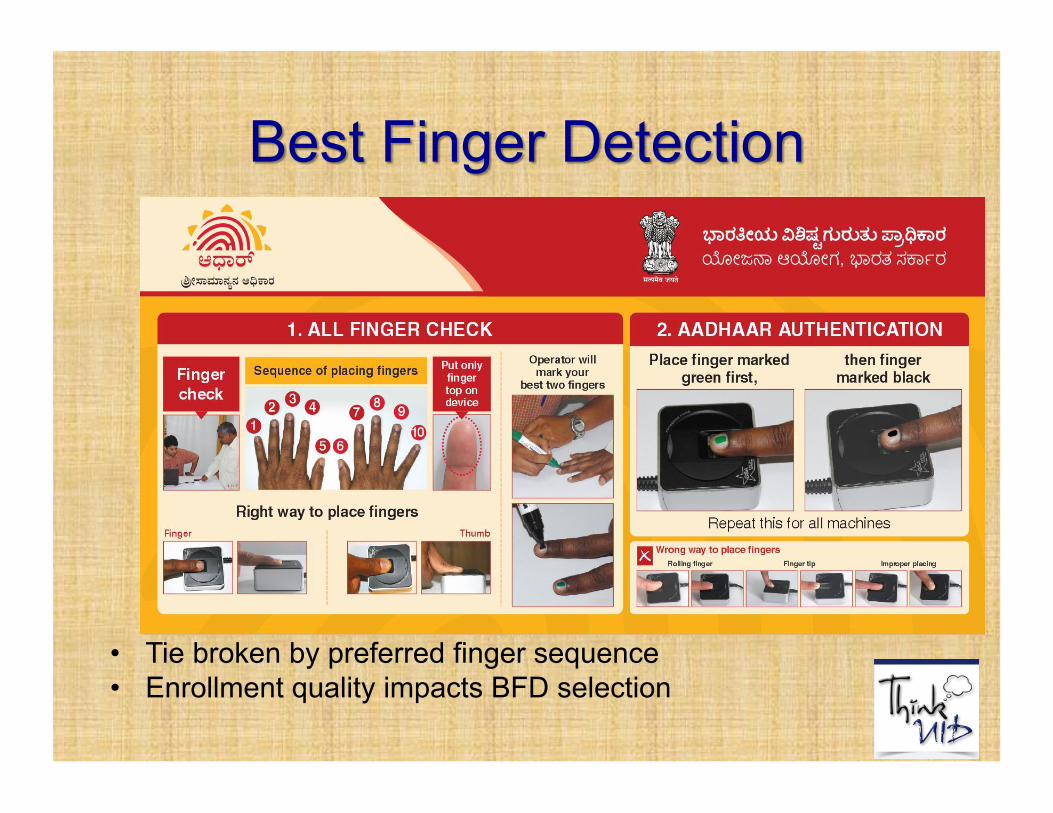
• Tie broken by preferred finger sequence • Enrollment quality impacts BFD selection

0%
5%
10%
15%
20%
25%
30%
Rank1
Rank2
LeD LeD LeD LeD LeD Right Right Right Right RightliEle Ring Middle Index Thumb Thumb Index Middle Ring LiEle
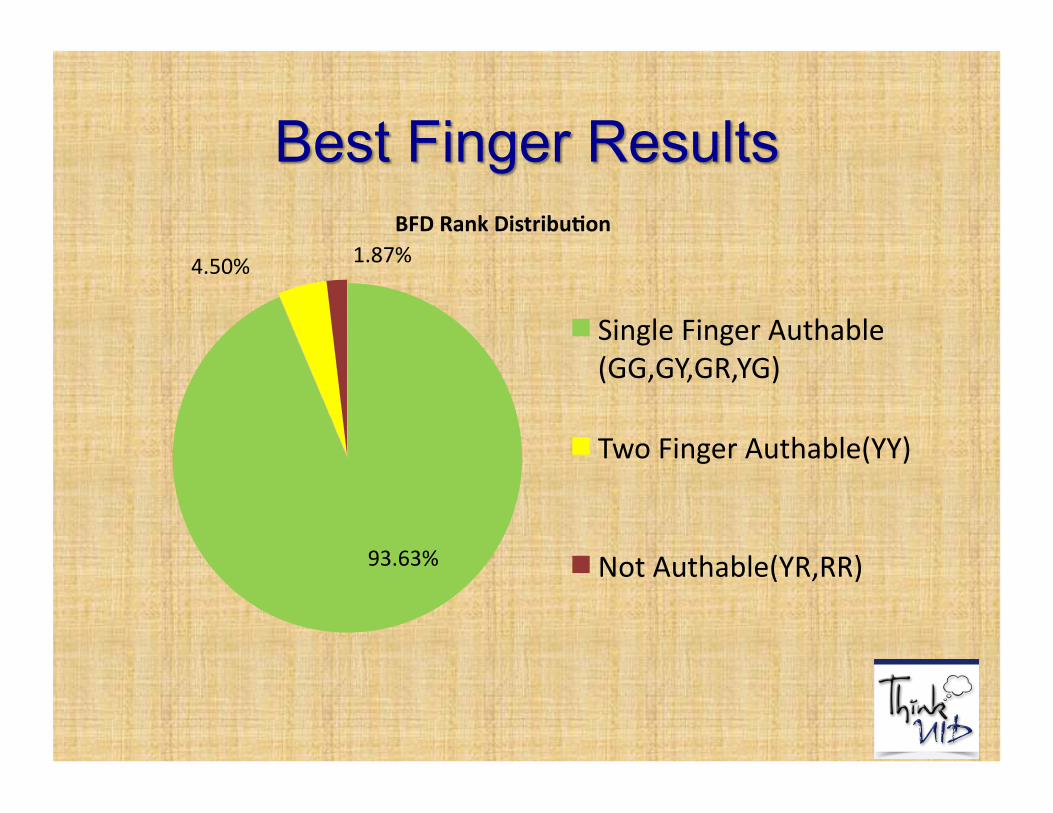
BFD RankDistribu?on 1.87%4.50%
93.63%
Single Finger Authable (GG,GY,GR,YG)
Two Finger Authable(YY)
NotAuthable(YR,RR)
• Position, attempts and number of fingers • Devices • Matcher algorithm • Demography • Paired vs. Unpaired matching


FRR@ FAR 10^-4 On onescanner
20
18 17.29
1613.314
12
10FRR
8
6
41.99
2
0
SGL FNGRRINDX SGL FNGRRTH SNGL BF 1 ATMPT
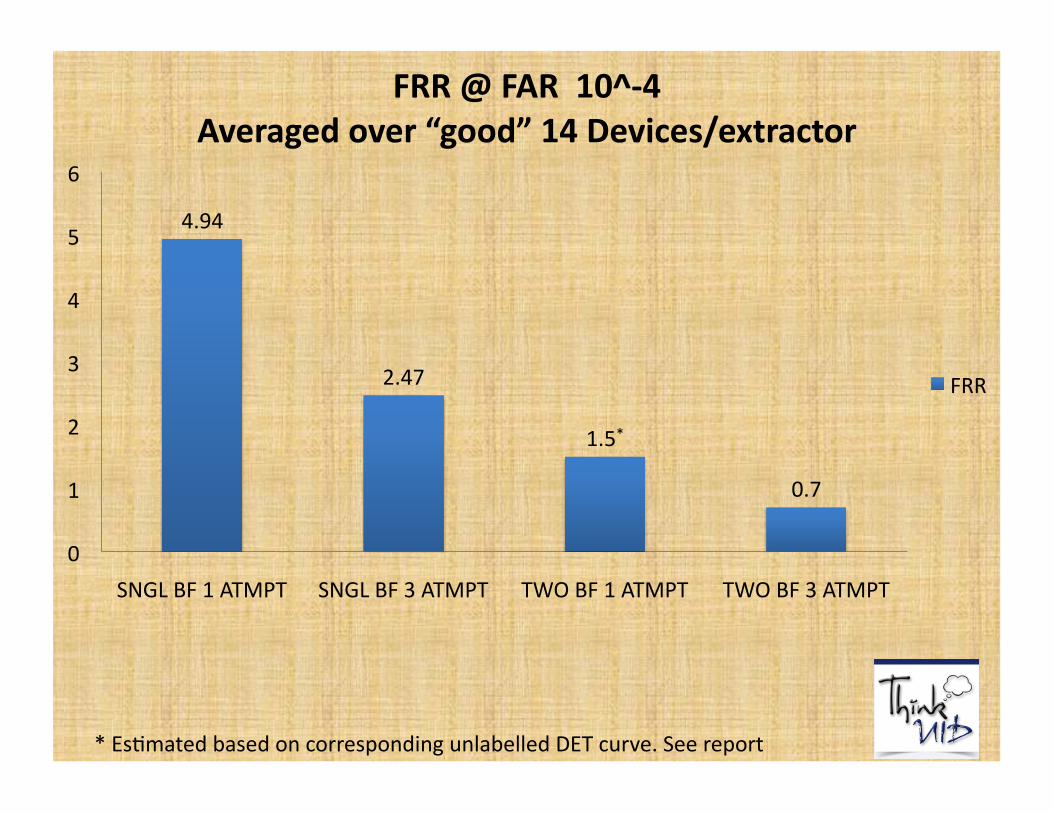
FRR@ FAR 10^-4 Averaged over “good” 14 Devices/extractor
6
4.945
4
3 2.47 FRR
2 1.5*
1 0.7
0
SNGL BF 1 ATMPT SNGL BF 3 ATMPT TWO BF 1 ATMPT TWO BF 3 ATMPT
*Es^mated based on corresponding unlabelled DET curve. See report

• Compare device single finger FRR to average FRR over all devices.
• Categories – Bad: Performed worse than average FRR – Good: Performed better than average FRR – Very Good: Performed better than average
FRR of Good
• Among 27 devices/extractor, significant variation in quality
• FRR results exclude “bad” devices • PIV compliance • FAP (SAP) • MINEX • Best devices were 2 X better than average
of “good”
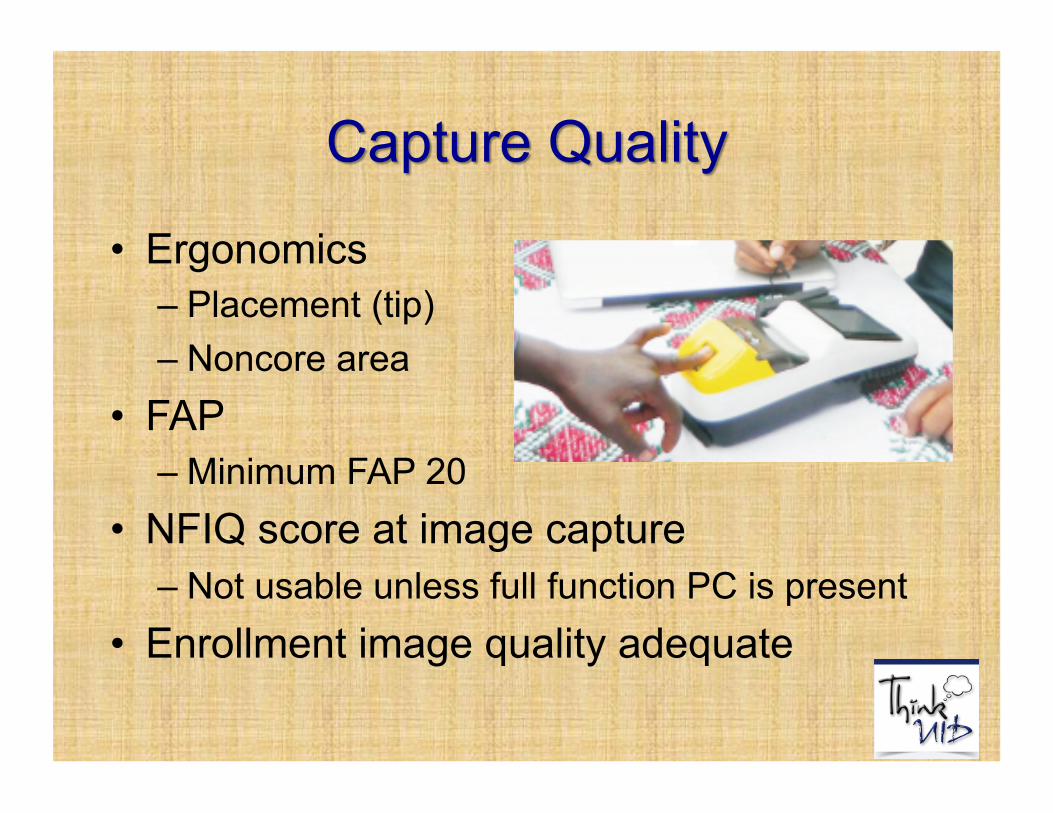
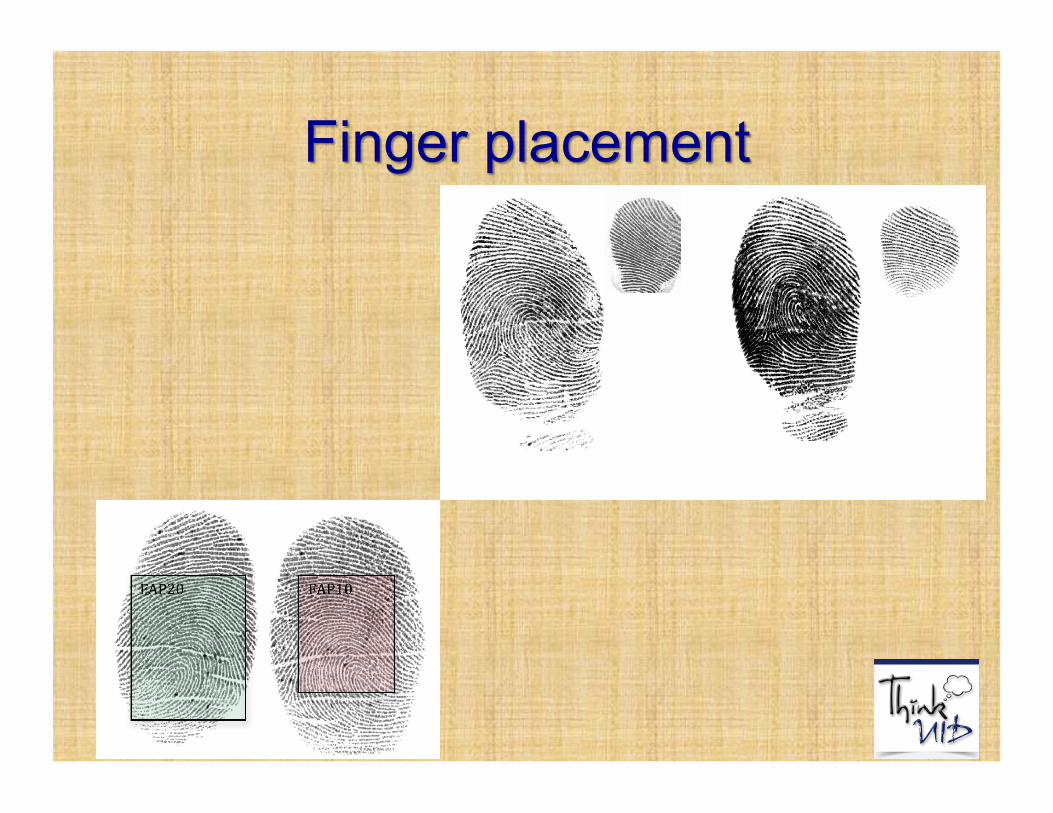
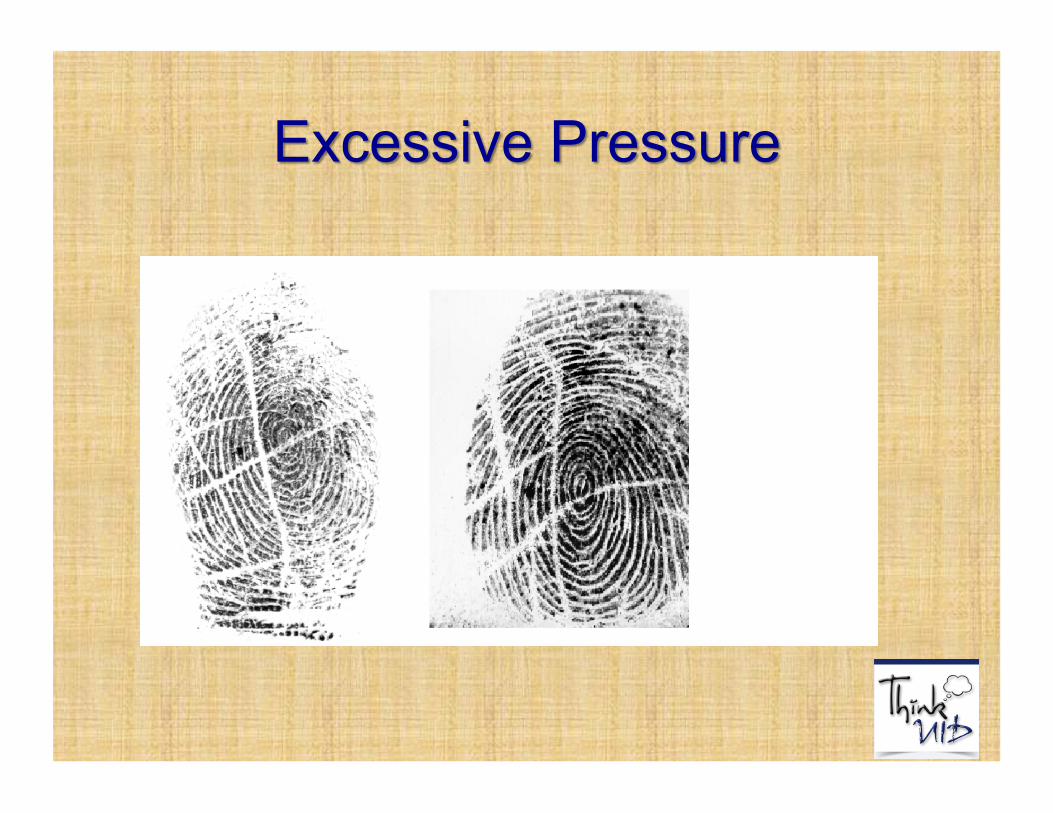
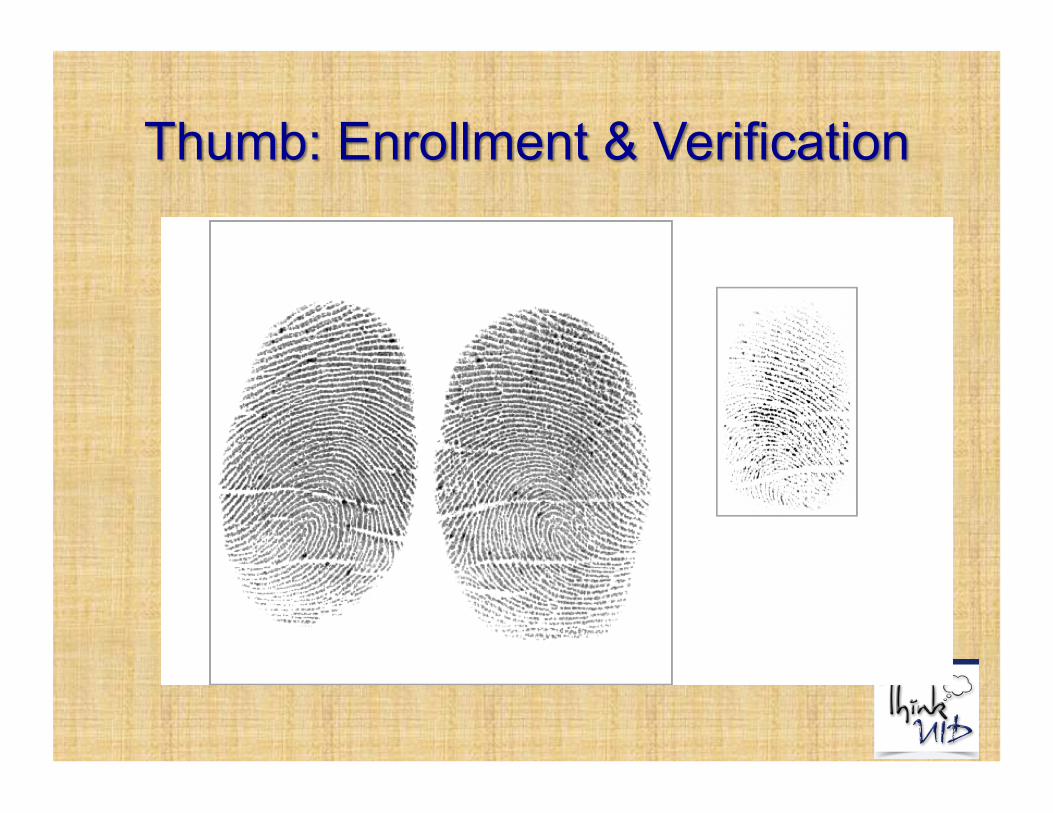
• Ergonomics – Placement (tip) – Noncore area
• FAP – Minimum FAP 20
• NFIQ score at image capture – Not usable unless full function PC is present
• Enrollment image quality adequate


• 10 million authentications in 10 hours • Average response time around 200
milliseconds or 295 concurrent requests/sec. • Performance test environment consisted of
– 15 blade servers including database servers, biometric matching servers, messaging server, caching servers, and audit logging servers.
– Configuration: x86 Linux dual CPU 6-core.
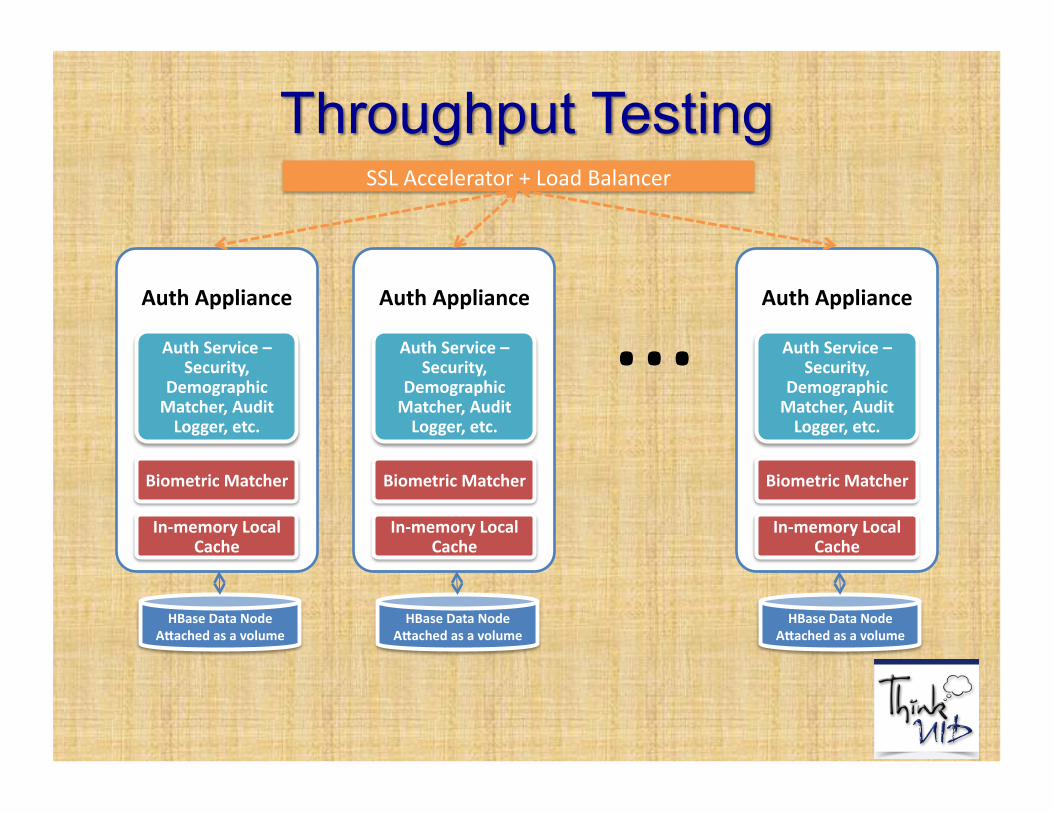
Auth Appliance
Auth Service – Security,
Demographic Matcher, Audit Logger, etc.
Biometric Matcher
In-‐memory Local Cache
HBase Data Node ASached as a volume
Auth Appliance
Auth Service – Security,
Demographic Matcher, Audit Logger, etc.
Biometric Matcher
In-‐memory Local Cache
HBase Data Node ASached as a volume
Auth Appliance
Auth Service – Security,
Demographic Matcher, Audit Logger, etc.
Biometric Matcher
In-‐memory Local Cache
HBase Data Node ASached as a volume
SSL Accelerator + Load Balancer
…
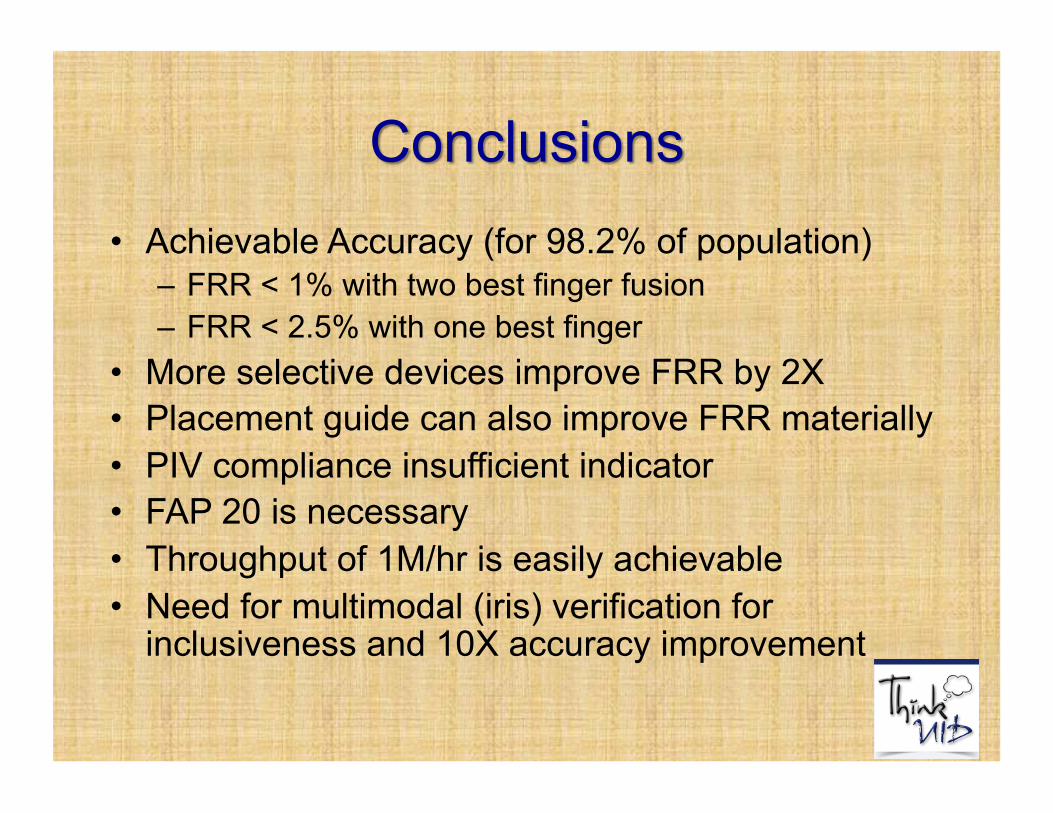
• Achievable Accuracy (for 98.2% of population) – FRR < 1% with two best finger fusion – FRR < 2.5% with one best finger
• More selective devices improve FRR by 2X • Placement guide can also improve FRR materially• PIV compliance insufficient indicator • FAP 20 is necessary • Throughput of 1M/hr is easily achievable • Need for multimodal (iris) verification for
inclusiveness and 10X accuracy improvement
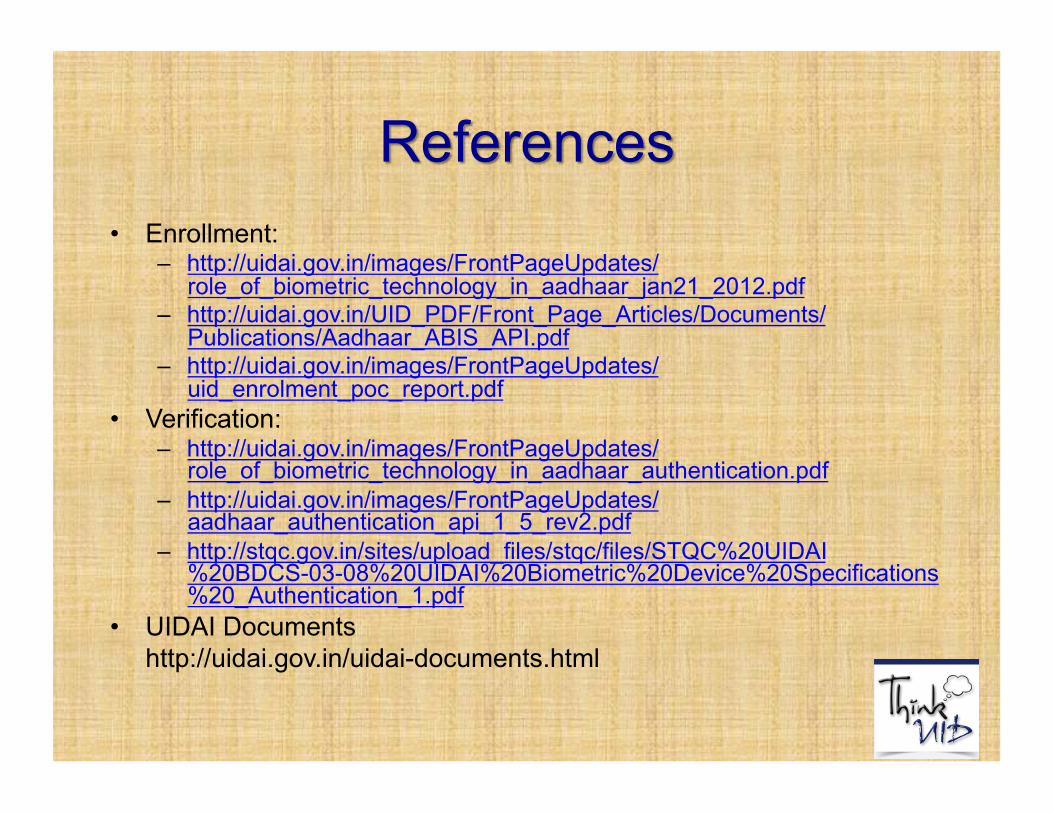
• Enrollment: – http://uidai.gov.in/images/FrontPageUpdates/
role_of_biometric_technology_in_aadhaar_jan21_2012.pdf – http://uidai.gov.in/UID_PDF/Front_Page_Articles/Documents/
Publications/Aadhaar_ABIS_API.pdf – http://uidai.gov.in/images/FrontPageUpdates/
uid_enrolment_poc_report.pdf • Verification:
– http://uidai.gov.in/images/FrontPageUpdates/role_of_biometric_technology_in_aadhaar_authentication.pdf
– http://uidai.gov.in/images/FrontPageUpdates/aadhaar_authentication_api_1_5_rev2.pdf
– http://stqc.gov.in/sites/upload_files/stqc/files/STQC%20UIDAI%20BDCS-03-08%20UIDAI%20Biometric%20Device%20Specifications%20_Authentication_1.pdf
• UIDAI Documents http://uidai.gov.in/uidai-documents.html
Recommended