UCSF Financial PlanFall 2013
10/30/2013
UCSF Financial PlanPresentation Overview
Strategic and Business Planning at UCSF
2013 Actual Financial Results
Operating Statement Projections• Combined Enterprise• Campus Segment• Medical Center Segment
Balance Sheet Projections• Cash • Capital• Debt
Core Financial Plan• Fall 2013 Summary
Summary2
3
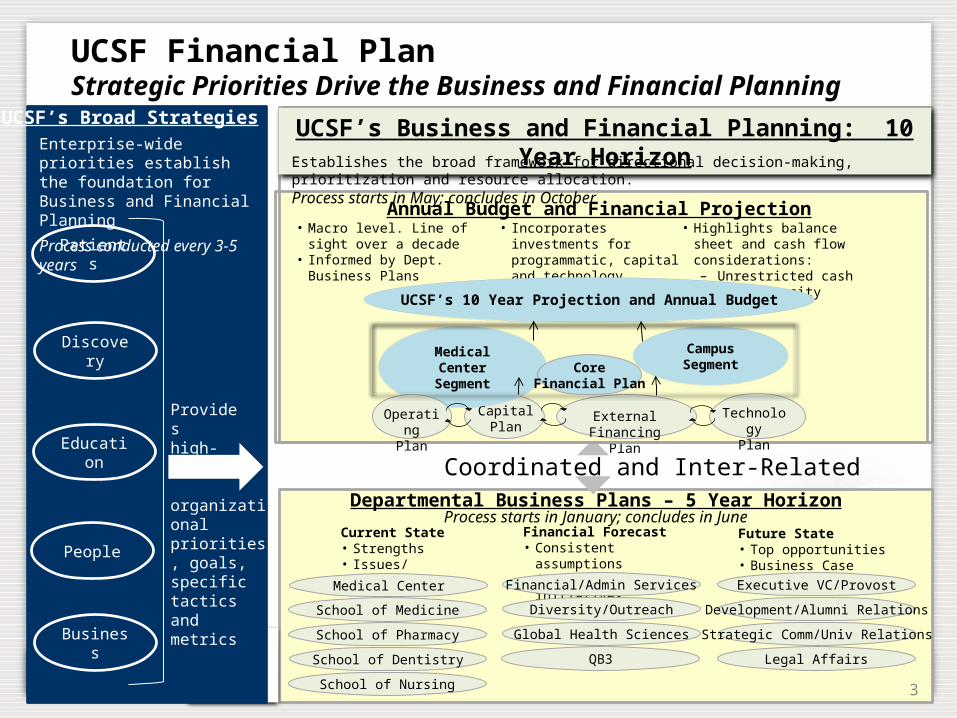
UCSF Financial PlanStrategic Priorities Drive the Business and Financial Planning
External FinancingPlan
CapitalPlan
UCSF’s Broad StrategiesEnterprise-wide priorities establish the foundation for Business and Financial Planning
Process conducted every 3-5 years
Patients
Discovery
Education
People
Business
Provideshigh-level
organizational priorities, goals, specific tactics and metrics
UCSF’s Business and Financial Planning: 10 Year HorizonEstablishes the broad framework for directional decision-making, prioritization and resource allocation.Process starts in May; concludes in October
Annual Budget and Financial Projection• Macro level. Line of sight over a
decade• Informed by Dept. Business Plans
• Incorporates investments for programmatic, capital and technology priorities
• Highlights balancesheet and cash flow considerations:– Unrestricted cash– Debt capacity
Medical Center Segment
CampusSegment
TechnologyPlan
OperatingPlan
Departmental Business Plans – 5 Year Horizon
Current State• Strengths• Issues/Concerns
Financial Forecast• Consistent assumptions• Current initiatives
Future State• Top opportunities• Business Case Analysis
Coordinated and Inter-Related
School of Medicine
UCSF’s 10 Year Projection and Annual Budget
Executive VC/Provost
School of Pharmacy
Diversity/Outreach Development/Alumni Relations
School of Dentistry
Global Health Sciences Strategic Comm/Univ Relations
School of Nursing
QB3 Legal Affairs
Medical Center Financial/Admin Services
CoreFinancial Plan
Process starts in January; concludes in June
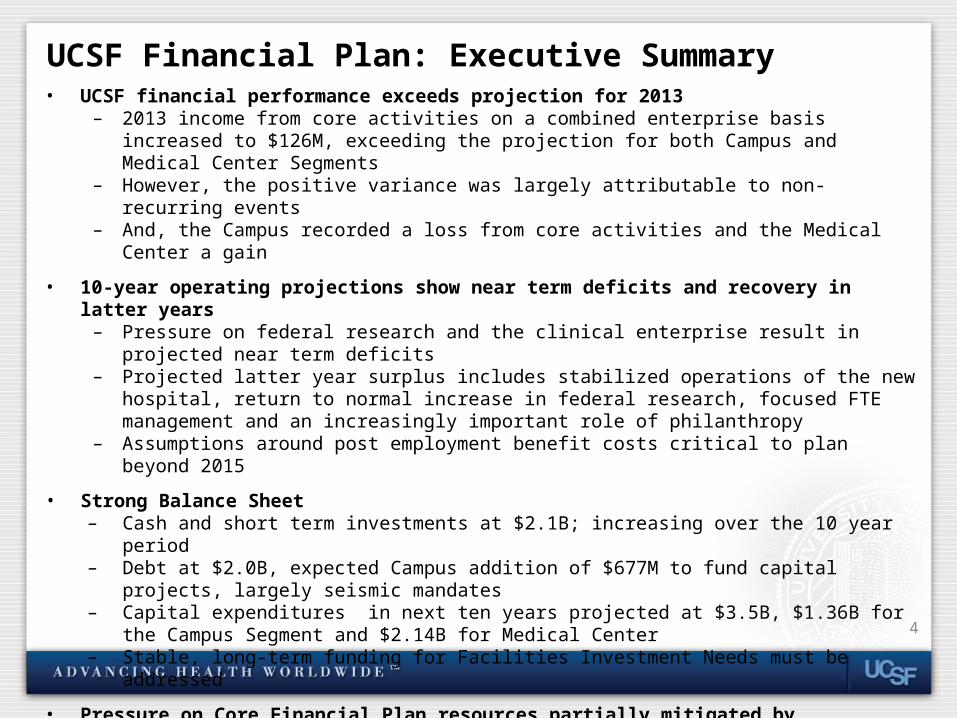
UCSF Financial Plan: Executive Summary• UCSF financial performance exceeds projection for 2013
– 2013 income from core activities on a combined enterprise basis increased to $126M, exceeding the projection for both Campus and Medical Center Segments
– However, the positive variance was largely attributable to non-recurring events– And, the Campus recorded a loss from core activities and the Medical Center a gain
• 10-year operating projections show near term deficits and recovery in latter years– Pressure on federal research and the clinical enterprise result in projected near term deficits– Projected latter year surplus includes stabilized operations of the new hospital, return to normal increase
in federal research, focused FTE management and an increasingly important role of philanthropy– Assumptions around post employment benefit costs critical to plan beyond 2015
• Strong Balance Sheet – Cash and short term investments at $2.1B; increasing over the 10 year period– Debt at $2.0B, expected Campus addition of $677M to fund capital projects, largely seismic mandates– Capital expenditures in next ten years projected at $3.5B, $1.36B for the Campus Segment and $2.14B
for Medical Center– Stable, long-term funding for Facilities Investment Needs must be addressed
• Pressure on Core Financial Plan resources partially mitigated by Infrastructure and Operations Funding Plan – Expected reduction in Core Financial Plan resources from $368M in 2013 to $173M by 2023– Priority investments in seismic remediation are mandatory– Challenge is to continue to focus on ensuring sufficient funding for strategic investments, IT investments
and long term facilities investment needs
• UCSF is positioned to manage through challenges, yet requires constant vigilance4
5
UCSF Financial PlanFall 2013
2013 Actual Results andComparison to Projection
6
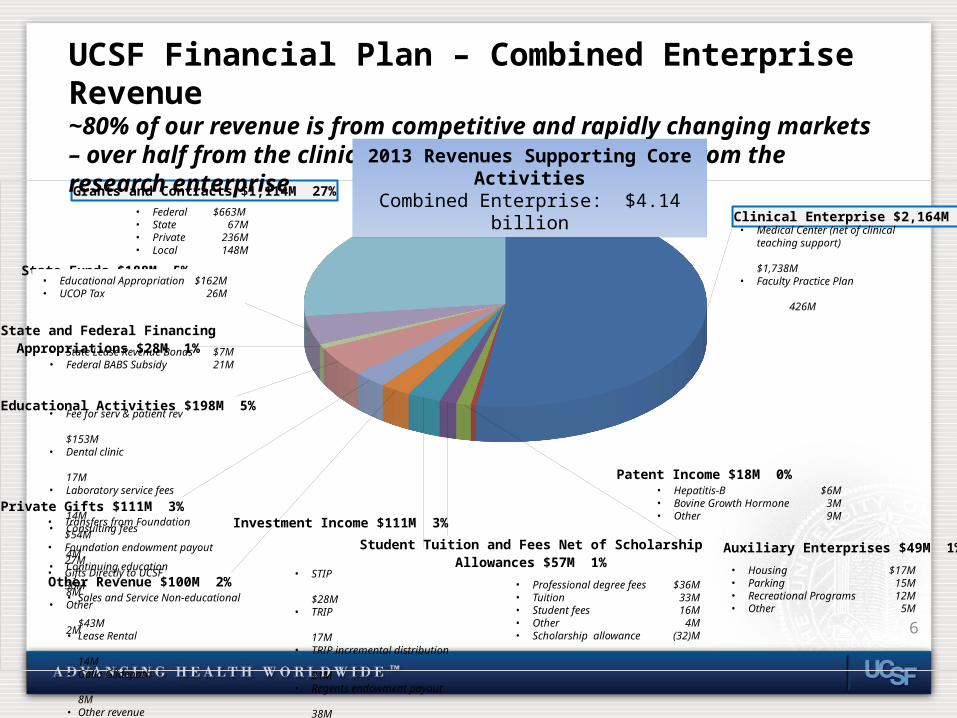
Clinical Enterprise $2,164M 52%
Patent Income $18M 0%
Auxiliary Enterprises $49M 1%Student Tuition and Fees Net of Scholarship Allowances $57M 1%
Investment Income $111M 3%
Other Revenue $100M 2%
Private Gifts $111M 3%
Educational Activities $198M 5%
State and Federal Financing Appropriations $28M 1%
State Funds $188M 5%
Grants and Contracts $1,114M 27%
UCSF Financial Plan – Combined Enterprise Revenue~80% of our revenue is from competitive and rapidly changing markets – over half from the clinical enterprise and nearly 30% from the research enterprise
• Federal $663M • State 67M• Private 236M• Local 148M
• Housing $17M• Parking 15M• Recreational Programs 12M• Other 5M
• STIP
$28M• TRIP
17M• TRIP incremental distribution
21M• Regents endowment payout
38M• Bond escrow and other
7M
• Fee for serv & patient rev
$153M• Dental clinic
17M• Laboratory service fees
14M• Consulting fees
4M• Continuing education
8M• Other
2M
• Professional degree fees $36M• Tuition 33M• Student fees 16M• Other 4M• Scholarship allowance (32)M
• Sales and Service Non-educational
$43M• Lease Rental
14M• Gallo Glidepath
8M• Other revenue
35M
• Hepatitis-B $6M• Bovine Growth Hormone 3M• Other 9M
• State Lease Revenue Bonds $7M• Federal BABS Subsidy 21M
• Transfers from Foundation$54M
• Foundation endowment payout 27M
• Gifts Directly to UCSF 30M
• Medical Center (net of clinical teaching support)
$1,738M• Faculty Practice Plan
426M
• Educational Appropriation $162M• UCOP Tax 26M
2013 Revenues Supporting Core ActivitiesCombined Enterprise: $4.14 billion
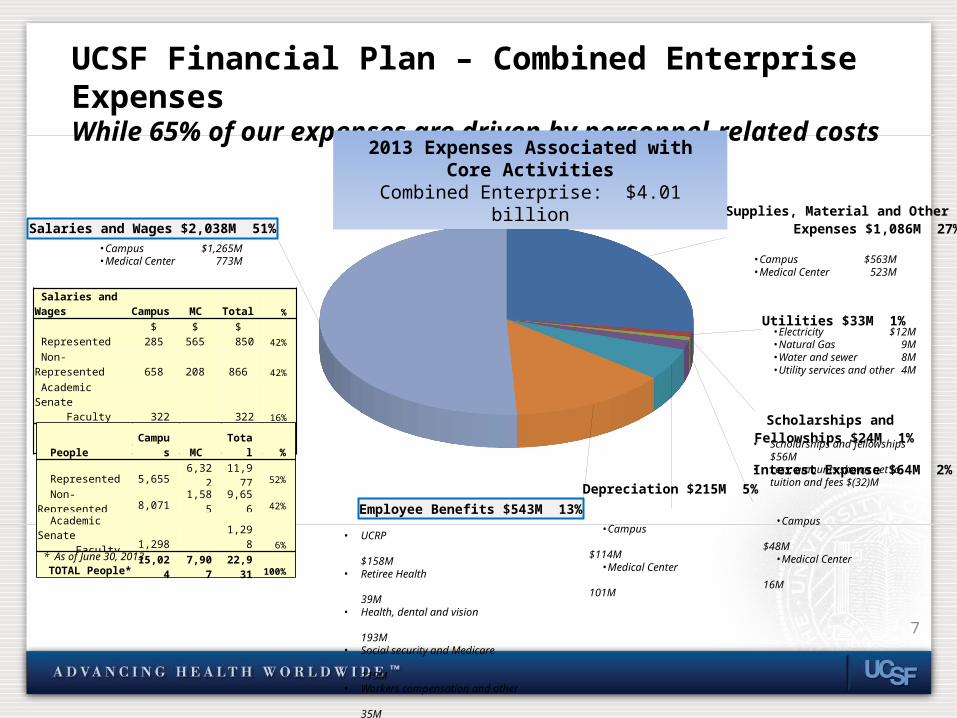
Supplies, Material and Other Operating Expenses $1,086M 27%
Utilities $33M 1%
Scholarships and Fellowships $24M 1%
Interest Expense $64M 2%Depreciation $215M 5%Employee Benefits $543M 13%
Salaries and Wages $2,038M 51%
Salaries and Wages Campus MC Total %
Represented $ 285 $ 565 $ 850 42%
Non-Represented 658 208 866 42%
Academic Senate Faculty 322 322 16%
TOTAL SALARIES $ 1,265 $773 $2,038 100%
• UCRP
$158M• Retiree Health
39M• Health, dental and vision
193M• Social security and Medicare
119M• Workers compensation and other
35M
•Campus $1,265M•Medical Center 773M
• Scholarships and fellowships $56M• Less: amounts shown net to tuition
and fees $(32)M
•Electricity $12M•Natural Gas 9M•Water and sewer 8M•Utility services and other 4M
•Campus $563M•Medical Center 523M
UCSF Financial Plan – Combined Enterprise ExpensesWhile 65% of our expenses are driven by personnel-related costs
People Campus MC Total %
Represented 5,655 6,322 11,977 52%
Non-Represented 8,071 1,585 9,656 42%
Academic Senate Faculty 1,298 1,298 6%
TOTAL People* 15,024 7,907 22,931 100%
* As of June 30, 2013
7
•Campus
$114M•Medical Center
101M
•Campus
$48M•Medical Center
16M
2013 Expenses Associated with Core ActivitiesCombined Enterprise: $4.01 billion
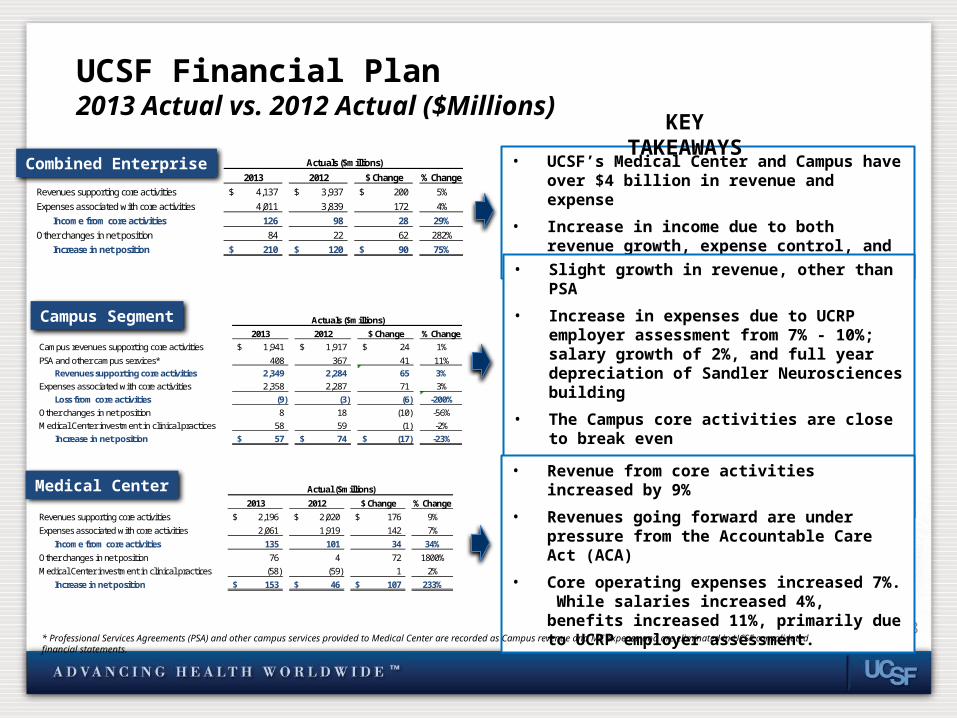
UCSF Financial Plan 2013 Actual vs. 2012 Actual ($Millions)
Combined Enterprise
Campus Segment
Medical Center
8
• UCSF’s Medical Center and Campus have over $4 billion in revenue and expense
• Increase in income due to both revenue growth, expense control, and one time expense reductions
KEY TAKEAWAYS
• Slight growth in revenue, other than PSA
• Increase in expenses due to UCRP employer assessment from 7% - 10%; salary growth of 2%, and full year depreciation of Sandler Neurosciences building
• The Campus core activities are close to break even
• The Medical Center provides investment in clinical practices and strategic support
• Revenue from core activities increased by 9%
• Revenues going forward are under pressure from the Accountable Care Act (ACA)
• Core operating expenses increased 7%. While salaries increased 4%, benefits increased 11%, primarily due to UCRP employer assessment.
2013 2012 $ Change % ChangeRevenues supporting core activities 4,137$ 3,937$ 200$ 5%Expenses associated with core activities 4,011 3,839 172 4%
Income from core activities 126 98 28 29%Other changes in net position 84 22 62 282%
Increase in net position 210$ 120$ 90$ 75%
Actuals ($millions)
2013 2012 $ Change % ChangeCampus revenues supporting core activities 1,941$ 1,917$ 24$ 1%
PSA and other campus services* 408 367 41 11%Revenues supporting core activities 2,349 2,284 65 3%
Expenses associated with core activities 2,358 2,287 71 3%Loss from core activities (9) (3) (6) -200%
Other changes in net position 8 18 (10) -56%Medical Center investment in clinical practices 58 59 (1) -2%
Increase in net position 57$ 74$ (17)$ -23%
Actuals ($millions)
2013 2012 $ Change % ChangeRevenues supporting core activities 2,196$ 2,020$ 176$ 9%Expenses associated with core activities 2,061 1,919 142 7%
Income from core activities 135 101 34 34%Other changes in net position 76 4 72 1800%Medical Center investment in clinical practices (58) (59) 1 2%
Increase in net position 153$ 46$ 107$ 233%
Actual ($millions)
* Professional Services Agreements (PSA) and other campus services provided to Medical Center are recorded as Campus revenue and MC expense and are eliminated in UCSF consolidated financial statements.
Actual Projection
2013 2013 $ Change % Change
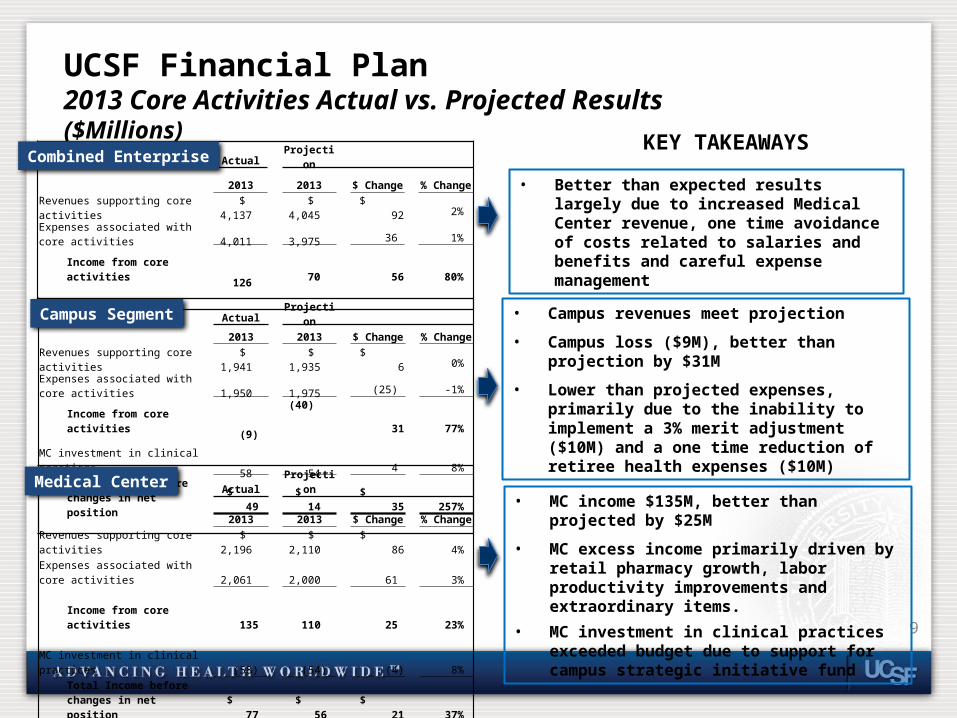
Revenues supporting core activities $ 2,196 $ 2,110 $ 86 4%
Expenses associated with core activities 2,061 2,000 61 3%
Income from core activities 135
110 25 23%
MC investment in clinical practices (58) (54) (4) 8%Total Income before changes in net position $ 77 $ 56 $ 21 37%
UCSF Financial Plan2013 Core Activities Actual vs. Projected Results ($Millions)
Actual Projection
2013 2013 $ Change % Change
Revenues supporting core activities $ 4,137 $ 4,045 $ 92 2%
Expenses associated with core activities 4,011 3,975 36 1%
Income from core activities
126 70 56 80%
Actual Projection
2013 2013 $ Change % Change
Revenues supporting core activities $ 1,941 $ 1,935 $ 6 0%
Expenses associated with core activities 1,950 1,975 (25) -1%
Income from core activities (9)(40)
31 77%
MC investment in clinical practices 58 54 4 8%Total Income before changes in net position $ 49 $ 14 $ 35 257%
Combined Enterprise
Campus Segment
Medical Center
9
• Better than expected results largely due to increased Medical Center revenue, one time avoidance of costs related to salaries and benefits and careful expense management
KEY TAKEAWAYS
• Campus revenues meet projection
• Campus loss ($9M), better than projection by $31M
• Lower than projected expenses, primarily due to the inability to implement a 3% merit adjustment ($10M) and a one time reduction of retiree health expenses ($10M)
• MC income $135M, better than projected by $25M
• MC excess income primarily driven by retail pharmacy growth, labor productivity improvements and extraordinary items.
• MC investment in clinical practices exceeded budget due to support for campus strategic initiative fund
10
UCSF Financial Plan: Base CaseRevenues, Expenses and Income
over the next 10 years
Combined Enterprise (Campus + Medical Center)
2010 2011 2012 2013 2014 2015 2016 2017 2018 2019 2020 2021 2022 2023$0
$1,000
$2,000
$3,000
$4,000
$5,000
$6,000
$7,000
-$200
-$100
$0
$100
$200
$300
$400
$500
3,5103,858
3,937 4,137 4,220
4,3484,547 4,735 4,915
5,091
5,2855,502 5,700
5,911
3,302 3,485
3,839 4,011 4,166
4,418 4,670
4,806 4,957 5,110
5,273 5,434 5,599
5,770
96
209
98
126
54
(71)
(123)(71)
(42) (19)12
69 102
141
Total Revenue Supporting Core Activities Total Expenses Associated with Core ActivitiesIncome Before Other Changes in Net Position, (operating income/(loss)) 2012 Projection - Income Before Other Changes in Net Position
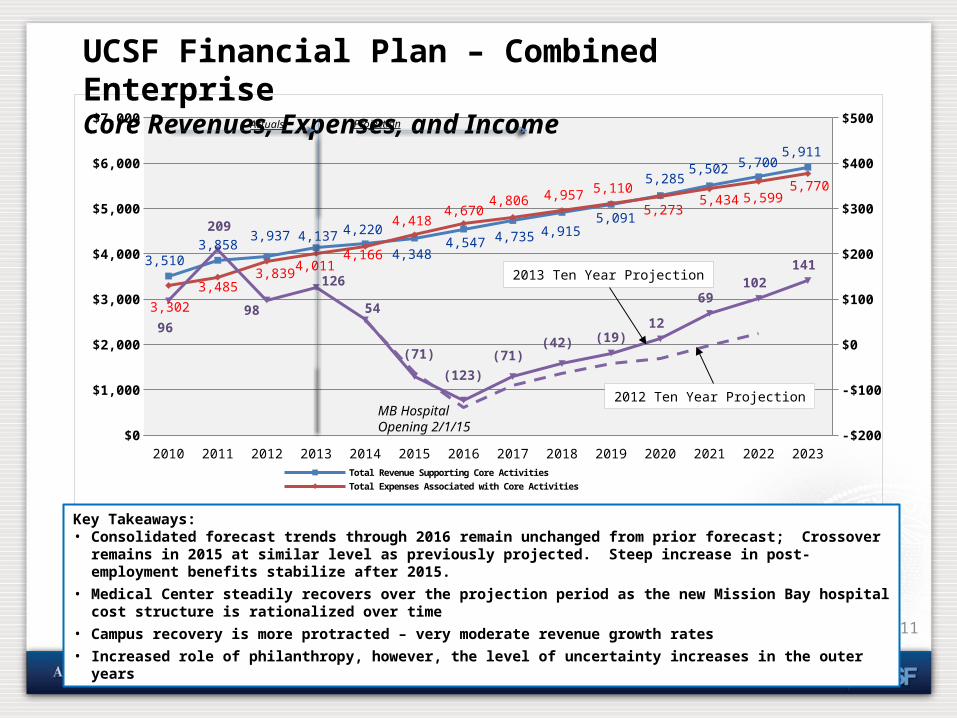
Key Takeaways: • Consolidated forecast trends through 2016 remain unchanged from prior forecast; Crossover remains in 2015 at similar level as
previously projected. Steep increase in post-employment benefits stabilize after 2015.• Medical Center steadily recovers over the projection period as the new Mission Bay hospital cost structure is rationalized over time• Campus recovery is more protracted – very moderate revenue growth rates• Increased role of philanthropy, however, the level of uncertainty increases in the outer years
UCSF Financial Plan – Combined EnterpriseCore Revenues, Expenses, and Income
11
2012 Ten Year Projection
2013 Ten Year Projection
ProjectionActuals
MB Hospital Opening 2/1/15
Total Expense Salaries and Wages
Employee Benefits
Supplies and Other OpEx
Interest Depreciation All Other0%
2%
4%
6%
8%
10%
4%3%
6%
3%
6%
4%
2%
Total Revenue
Medical Center
Federal Contracts
and Grants
State Contracts
and Grants
Private Contracts
and Grants
State Support
Private Gifts Other Revenue
0%
2%
4%
6%
8%
10%
12%
4% 4%3%
2% 1% 2%
9%
2%
Total Revenue
Medical Center
Federal Contracts
and Grants
State Contracts
and Grants
Private Contracts
and Grants
State Support
Private Gifts Other Revenue
0%
2%
4%
6%
8%
10%
12%
3%
4%
2%1% 1%
0%
13%
1%
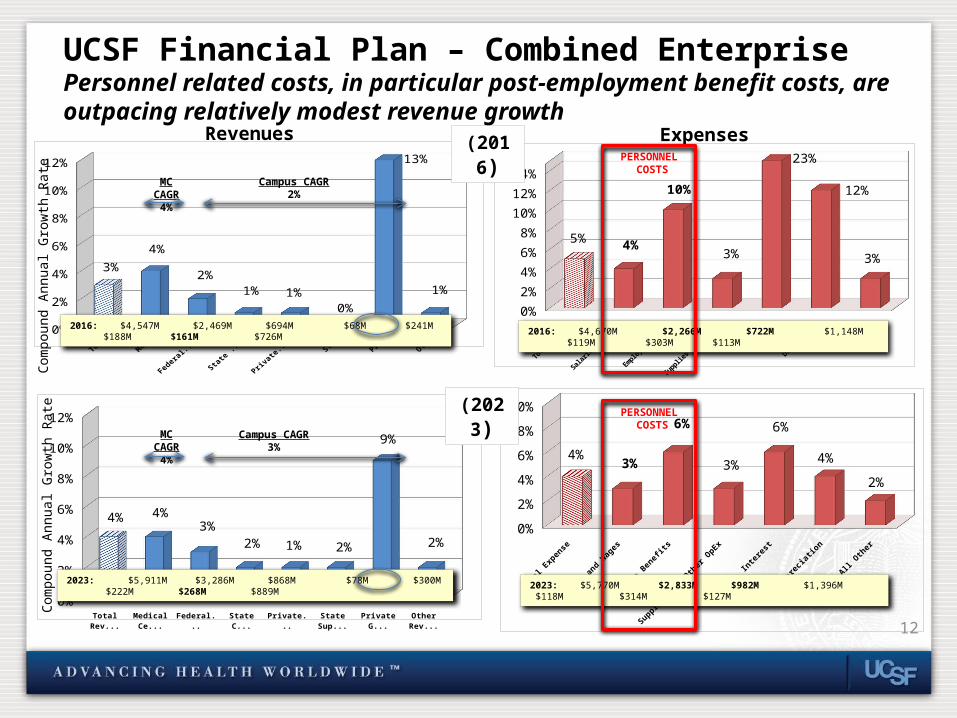
2016: $4,547M $2,469M $694M $68M $241M $188M $161M $726MTotal Expense Salaries and
WagesEmployee Benefits
Supplies and Other OpEx
Interest Depreciation All Other0%
2%
4%
6%
8%
10%
12%
14%
5% 4%
10%
3%
23%
12%
3%
UCSF Financial Plan – Combined EnterprisePersonnel related costs, in particular post-employment benefit costs, are outpacing relatively modest revenue growth
Revenues Expenses(2016)
Com
poun
d An
nual
Gro
wth
Rat
eCo
mpo
und
Annu
al G
row
th R
ate
2023: $5,911M $3,286M $868M $78M $300M $222M $268M $889M
2016: $4,670M $2,266M $722M $1,148M $119M $303M $113M
12
MC CAGR4%
Campus CAGR2%
MC CAGR4%
Campus CAGR3%
(2023)
2023: $5,770M $2,833M $982M $1,396M $118M $314M $127M
PERSONNEL COSTS
PERSONNEL COSTS
13
UCSF Financial Plan: Base CaseRevenues, Expenses and Income
over the next 10 years
Campus Segment
UCSF Financial PlanExecutive Summary – Campus Segment
• Research Revenue – Long-term Federal research funding uncertainties, including sequestration– Private research funding not expected to outpace Federal funding in the near term– Continued program growth expected in several programs including Cancer Center, Cardiovascular
Research Institute, and Neurosciences– Opportunity to grow other strategic programs while protecting critical existing programs
• Investment in Development and focus on the role of philanthropy is critical
• Significant Focus on Personnel and Expense Management Required– Must contain personnel related costs – refined compensation strategies and level of FTE– Assumptions around post employment benefit costs are critical to this plan– Leverage strategic sourcing efforts – Continue to leverage administrative talent, expertise and cost structure. We need both effectiveness
and efficiency.
• Strong Balance Sheet (excludes effect of Pension and Retiree Health liabilities)– Seismic mandates are significant factor in the capital plan– Stable, long-term funding for Facilities Investment Needs must be addressed– Information technology and strategic initiatives will require increased capital investment– Need to be thoughtful about debt capacity for programmatic aspirations beyond the 10 year period
14
2010 2011 2012 2013 2014 2015 2016 2017 2018 2019 2020 2021 2022 2023-$2,000
-$1,500
-$1,000
-$500
$0
$500
$1,000
$1,500
$2,000
$2,500
$3,000
-$200
-$150
-$100
-$50
$0
$50
$100
$150
$200
$250
$300
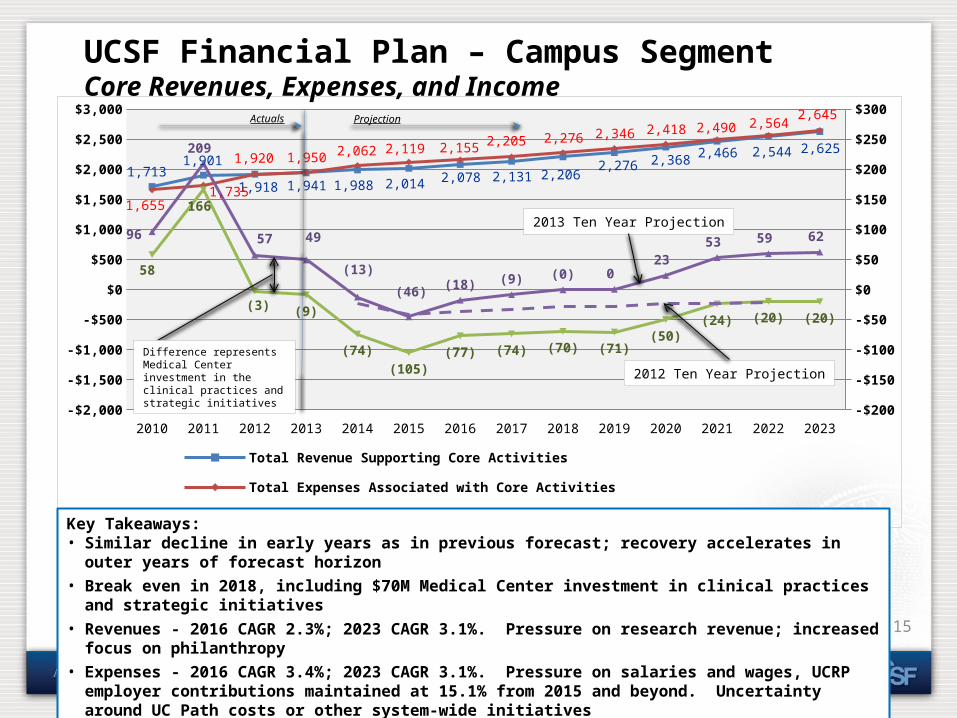
1,7131,901
1,918 1,941 1,988 2,014 2,078 2,131 2,2062,276 2,368 2,466 2,544 2,625
1,6551,735
1,920 1,950 2,062 2,119 2,155 2,205 2,276 2,346 2,418 2,490 2,5642,645
58
166
(3) (9)
(74)(105)
(77) (74) (70) (71)(50)
(24) (20) (20)
96
209
57 49
(13)
(46) (18) (9) (0) 0 23
53 59 62
Total Revenue Supporting Core ActivitiesTotal Expenses Associated with Core ActivitiesIncome Before Other Changes in Net Position (before Medical Center investment in the clinical practices)Total Income Before Changes in Net Position (after the Medical Center investment in the clinical practices)
Key Takeaways: • Similar decline in early years as in previous forecast; recovery accelerates in outer years of forecast horizon• Break even in 2018, including $70M Medical Center investment in clinical practices and strategic initiatives• Revenues - 2016 CAGR 2.3%; 2023 CAGR 3.1%. Pressure on research revenue; increased focus on philanthropy• Expenses - 2016 CAGR 3.4%; 2023 CAGR 3.1%. Pressure on salaries and wages, UCRP employer contributions
maintained at 15.1% from 2015 and beyond. Uncertainty around UC Path costs or other system-wide initiatives
UCSF Financial Plan – Campus SegmentCore Revenues, Expenses, and Income
2012 Ten Year Projection
2013 Ten Year Projection
15
Actuals Projection
Difference represents Medical Center investment in the clinical practices and strategic initiatives
Total R
evenue
Federal C
ontracts
and Gra
nts
Private
Contracts
and Gra
nts
Loca
l Contra
cts and G
rants
State
Education A
pprop.
Private
Gift
s
Other R
evenue
0.0%
2.0%
4.0%
6.0%
8.0%
10.0%
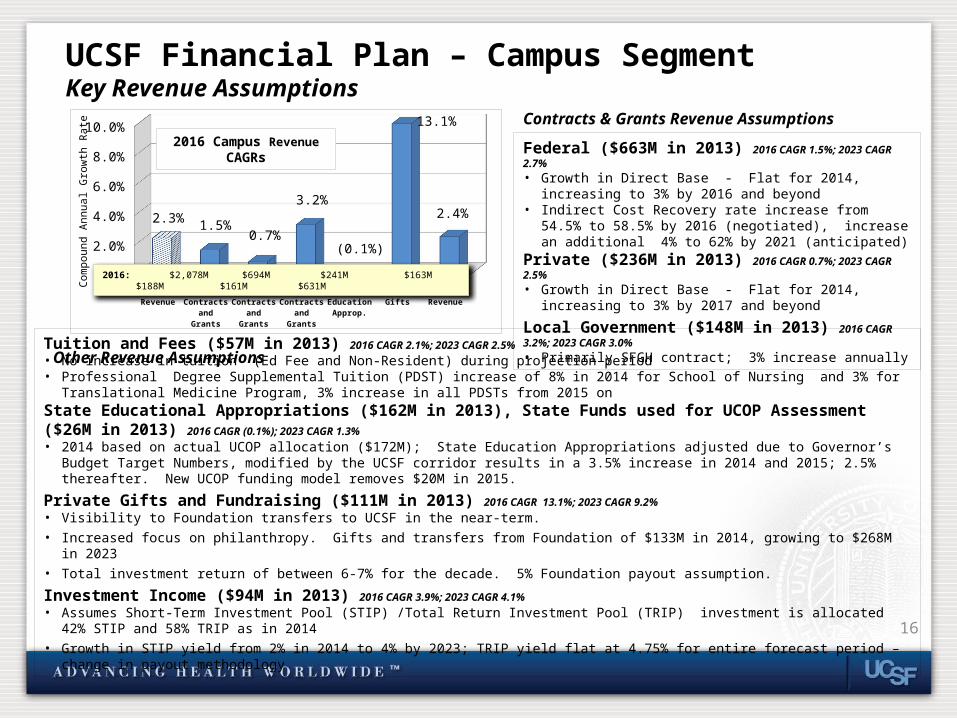
2.3% 1.5% 0.7%
3.2%
(0.1%)
13.1%
2.4%
Tuition and Fees ($57M in 2013) 2016 CAGR 2.1%; 2023 CAGR 2.5%• No increase in tuition (Ed Fee and Non-Resident) during projection period• Professional Degree Supplemental Tuition (PDST) increase of 8% in 2014 for School of Nursing and 3% for Translational Medicine Program, 3% increase in all
PDSTs from 2015 onState Educational Appropriations ($162M in 2013), State Funds used for UCOP Assessment ($26M in 2013) 2016 CAGR (0.1%); 2023 CAGR 1.3%• 2014 based on actual UCOP allocation ($172M); State Education Appropriations adjusted due to Governor’s Budget Target Numbers, modified by the UCSF
corridor results in a 3.5% increase in 2014 and 2015; 2.5% thereafter. New UCOP funding model removes $20M in 2015.
Private Gifts and Fundraising ($111M in 2013) 2016 CAGR 13.1%; 2023 CAGR 9.2%• Visibility to Foundation transfers to UCSF in the near-term.• Increased focus on philanthropy. Gifts and transfers from Foundation of $133M in 2014, growing to $268M in 2023• Total investment return of between 6-7% for the decade. 5% Foundation payout assumption.
Investment Income ($94M in 2013) 2016 CAGR 3.9%; 2023 CAGR 4.1%• Assumes Short-Term Investment Pool (STIP) /Total Return Investment Pool (TRIP) investment is allocated 42% STIP and 58% TRIP as in 2014• Growth in STIP yield from 2% in 2014 to 4% by 2023; TRIP yield flat at 4.75% for entire forecast period – change in payout methodology
2016: $2,078M $694M $241M $163M $188M $161M $631M
UCSF Financial Plan – Campus SegmentKey Revenue Assumptions
Com
poun
d An
nual
Gro
wth
Rat
e
16
Federal ($663M in 2013) 2016 CAGR 1.5%; 2023 CAGR 2.7%• Growth in Direct Base - Flat for 2014, increasing to 3% by 2016 and
beyond• Indirect Cost Recovery rate increase from 54.5% to 58.5% by 2016
(negotiated), increase an additional 4% to 62% by 2021 (anticipated)
Private ($236M in 2013) 2016 CAGR 0.7%; 2023 CAGR 2.5%• Growth in Direct Base - Flat for 2014, increasing to 3% by 2017 and
beyond
Local Government ($148M in 2013) 2016 CAGR 3.2%; 2023 CAGR 3.0%• Primarily SFGH contract; 3% increase annually
2016 Campus Revenue CAGRs
Contracts & Grants Revenue Assumptions
Other Revenue Assumptions
Total Expense Salaries and Wages
Employee Benefits
Supplies Interest Depreciation Other-2.0%
0.0%
2.0%
4.0%
6.0%
8.0%
10.0%
12.0%
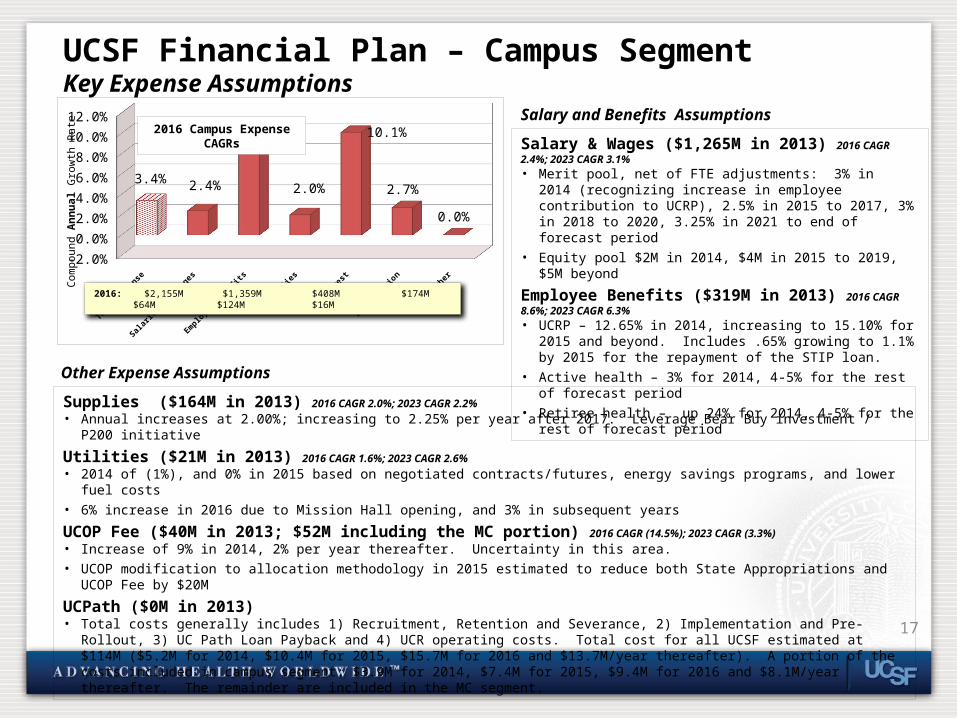
3.4%2.4%
8.6%
2.0%
10.1%
2.7%
0.0%
2016: $2,155M $1,359M $408M $174M $64M $124M $16M
UCSF Financial Plan – Campus SegmentKey Expense Assumptions
17
Salary & Wages ($1,265M in 2013) 2016 CAGR 2.4%; 2023 CAGR 3.1%• Merit pool, net of FTE adjustments: 3% in 2014 (recognizing increase
in employee contribution to UCRP), 2.5% in 2015 to 2017, 3% in 2018 to 2020, 3.25% in 2021 to end of forecast period
• Equity pool $2M in 2014, $4M in 2015 to 2019, $5M beyond
Employee Benefits ($319M in 2013) 2016 CAGR 8.6%; 2023 CAGR 6.3%• UCRP – 12.65% in 2014, increasing to 15.10% for 2015 and beyond.
Includes .65% growing to 1.1% by 2015 for the repayment of the STIP loan.
• Active health – 3% for 2014, 4-5% for the rest of forecast period • Retiree health – up 24% for 2014, 4-5% for the rest of forecast period
Supplies ($164M in 2013) 2016 CAGR 2.0%; 2023 CAGR 2.2%• Annual increases at 2.00%; increasing to 2.25% per year after 2017. Leverage Bear Buy investment / P200 initiative
Utilities ($21M in 2013) 2016 CAGR 1.6%; 2023 CAGR 2.6%• 2014 of (1%), and 0% in 2015 based on negotiated contracts/futures, energy savings programs, and lower fuel costs• 6% increase in 2016 due to Mission Hall opening, and 3% in subsequent years
UCOP Fee ($40M in 2013; $52M including the MC portion) 2016 CAGR (14.5%); 2023 CAGR (3.3%)• Increase of 9% in 2014, 2% per year thereafter. Uncertainty in this area. • UCOP modification to allocation methodology in 2015 estimated to reduce both State Appropriations and UCOP Fee by $20M
UCPath ($0M in 2013)• Total costs generally includes 1) Recruitment, Retention and Severance, 2) Implementation and Pre-Rollout, 3) UC Path Loan Payback and 4) UCR
operating costs. Total cost for all UCSF estimated at $114M ($5.2M for 2014, $10.4M for 2015, $15.7M for 2016 and $13.7M/year thereafter). A portion of the costs included in campus segment: $3.9M for 2014, $7.4M for 2015, $9.4M for 2016 and $8.1M/year thereafter. The remainder are included in the MC segment.
Salary and Benefits Assumptions
Other Expense Assumptions
2016 Campus Expense CAGRs
Com
poun
d A
nnua
l Gro
wth
Rat
e
Multiple Efforts Underway to Manage the Decade
Potential Upside and Downside to the Campus Segment Base Case
(captures many but not all possibilities)
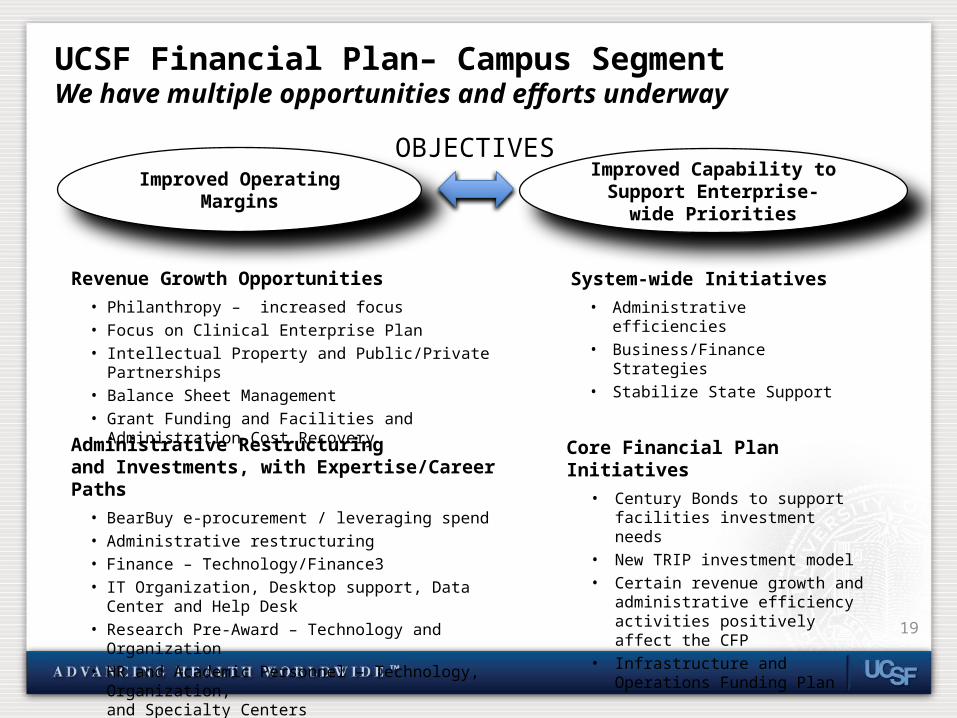
Revenue Growth Opportunities• Philanthropy – increased focus• Focus on Clinical Enterprise Plan• Intellectual Property and Public/Private Partnerships• Balance Sheet Management• Grant Funding and Facilities and Administration Cost Recovery
System-wide Initiatives• Administrative efficiencies• Business/Finance Strategies• Stabilize State Support
Administrative Restructuring and Investments, with Expertise/Career Paths
• BearBuy e-procurement / leveraging spend• Administrative restructuring • Finance – Technology/Finance3• IT Organization, Desktop support, Data Center and Help Desk• Research Pre-Award – Technology and Organization• HR and Academic Personnel – Technology, Organization,
and Specialty Centers
Core Financial Plan Initiatives• Century Bonds to support facilities
investment needs• New TRIP investment model• Certain revenue growth and
administrative efficiency activities positively affect the CFP
• Infrastructure and Operations Funding Plan
Improved Capability to Support Enterprise-wide Priorities
OBJECTIVES
19
UCSF Financial Plan– Campus SegmentWe have multiple opportunities and efforts underway
Improved Operating Margins
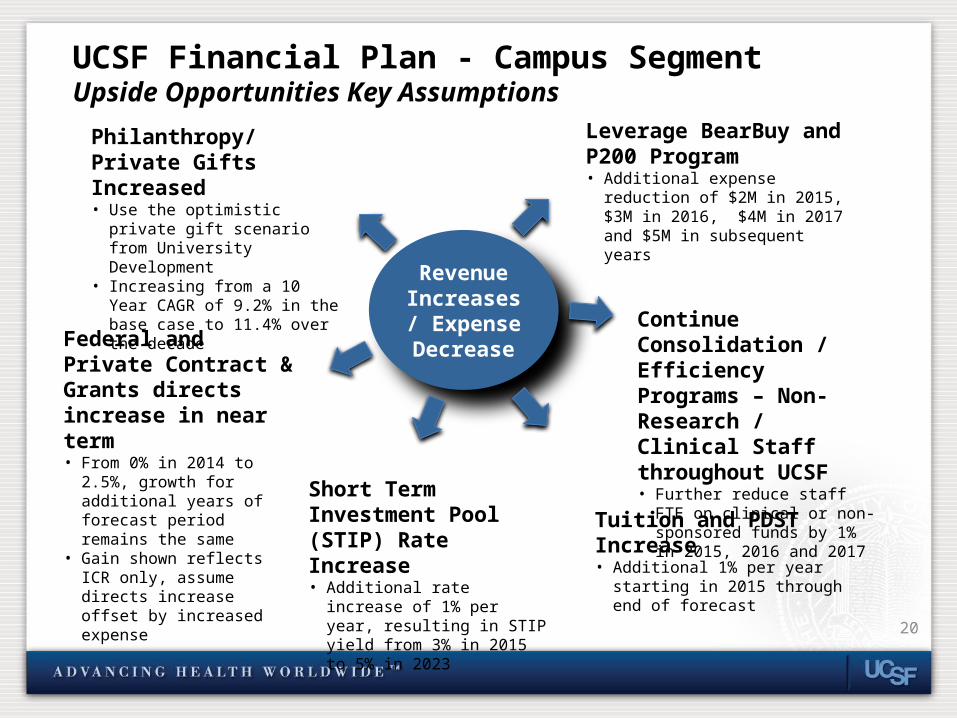
Philanthropy/Private Gifts Increased• Use the optimistic private gift
scenario from University Development
• Increasing from a 10 Year CAGR of 9.2% in the base case to 11.4% over the decade
UCSF Financial Plan - Campus SegmentUpside Opportunities Key Assumptions
Revenue Increases /
Expense Decrease
Short Term Investment Pool (STIP) Rate Increase• Additional rate increase of 1% per
year, resulting in STIP yield from 3% in 2015 to 5% in 2023
20
Tuition and PDST Increase• Additional 1% per year starting in
2015 through end of forecast
Federal and Private Contract & Grants directs increase in near term• From 0% in 2014 to 2.5%,
growth for additional years of forecast period remains the same
• Gain shown reflects ICR only, assume directs increase offset by increased expense
Continue Consolidation / Efficiency Programs – Non-Research / Clinical Staff throughout UCSF• Further reduce staff FTE on
clinical or non-sponsored funds by 1% in 2015, 2016 and 2017
Leverage BearBuy and P200 Program• Additional expense reduction of $2M in
2015, $3M in 2016, $4M in 2017 and $5M in subsequent years
2013 2014 2015 2016 2017 2018 2019 2020 2021 2022 2023-$50
$0
$50
$100
$150
$200
Base Case = Campus after MC investment Philanthropy Increased from Base CaseFederal and Private C&G Increase STIP Rate Increase of 1%Tuition and PDST Increase of 1% Non-Research Staff Expense ReductionLeverage BearBuy Implementation
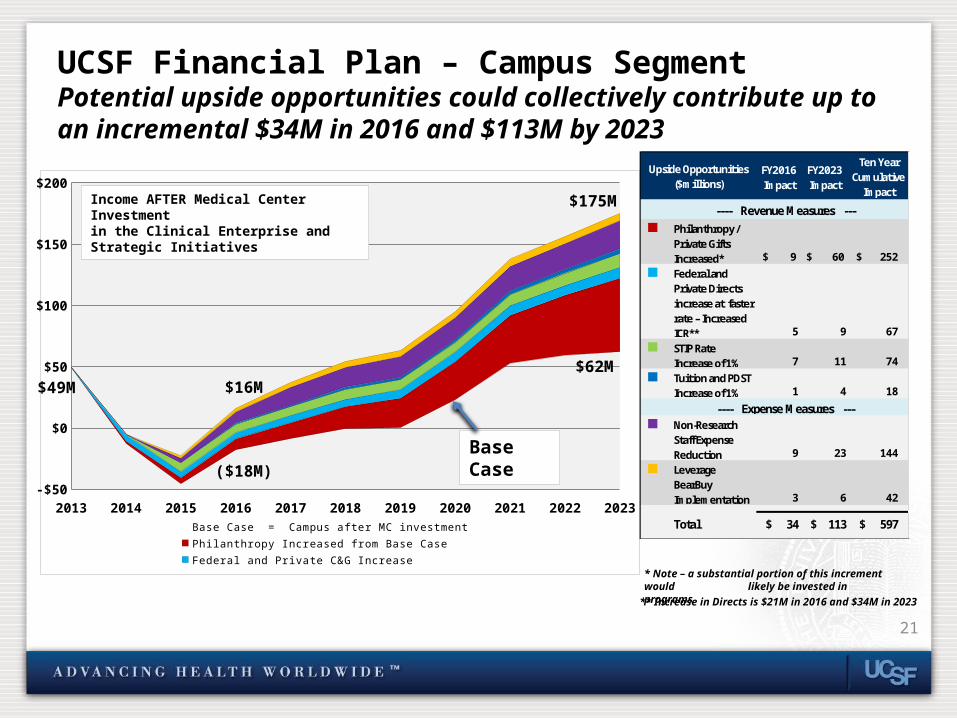
UCSF Financial Plan – Campus Segment Potential upside opportunities could collectively contribute up to an incremental $34M in 2016 and $113M by 2023
Income AFTER Medical Center Investmentin the Clinical Enterprise and Strategic Initiatives
$16M
$175M
($18M)
$62M
Base Case
21
** Increase in Directs is $21M in 2016 and $34M in 2023
$49M
FY2016 Impact
FY2023 Impact
n Philanthropy / Private Gifts Increased* $ 9 $ 60 $ 252
n Federal and Private Directs increase at faster rate – Increased ICR** 5 9 67
n STIP Rate Increase of 1% 7 11 74
n Tuition and PDST Increase of 1% 1 4 18
n Non-Research Staff Expense Reduction 9 23 144
n Leverage BearBuy Implementation 3 6 42
Total $ 34 $ 113 $ 597
---- Expense Measures ---
Upside Opportunities ($millions)
---- Revenue Measures ---
Ten Year Cumulative
Impact
* Note – a substantial portion of this increment would likely be invested in programs
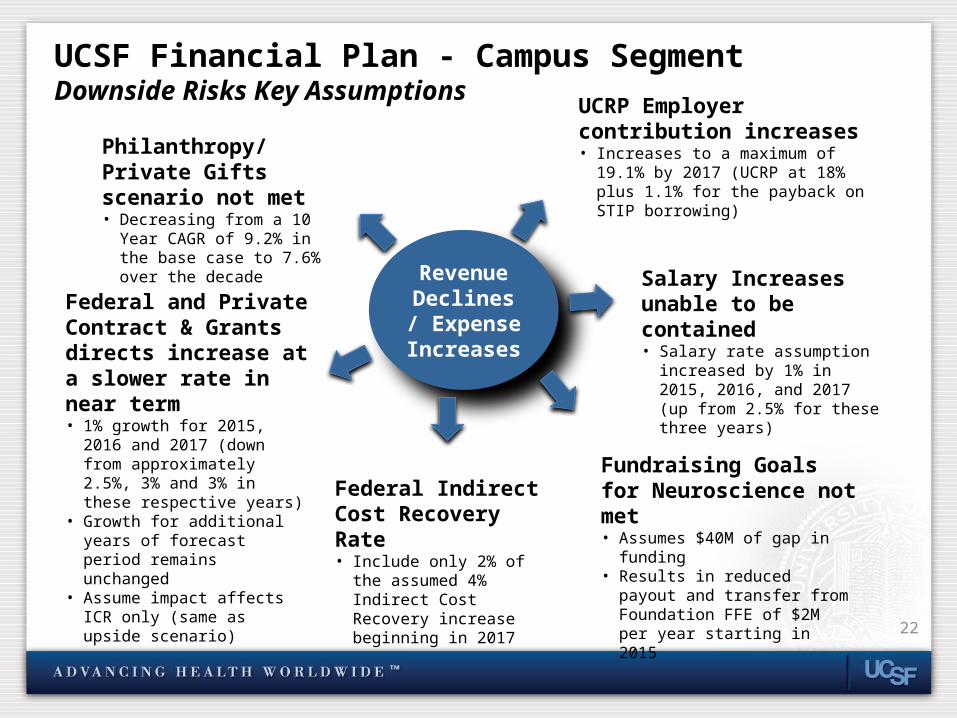
Philanthropy/Private Gifts scenario not met• Decreasing from a 10 Year CAGR
of 9.2% in the base case to 7.6% over the decade
UCSF Financial Plan - Campus SegmentDownside Risks Key Assumptions
Revenue Declines / Expense Increases
Federal Indirect Cost Recovery Rate• Include only 2% of the
assumed 4% Indirect Cost Recovery increase beginning in 2017
22
Fundraising Goals for Neuroscience not met• Assumes $40M of gap in funding• Results in reduced payout and
transfer from Foundation FFE of $2M per year starting in 2015
Federal and Private Contract & Grants directs increase at a slower rate in near term• 1% growth for 2015, 2016 and
2017 (down from approximately 2.5%, 3% and 3% in these respective years)
• Growth for additional years of forecast period remains unchanged
• Assume impact affects ICR only (same as upside scenario)
Salary Increases unable to be contained• Salary rate assumption increased
by 1% in 2015, 2016, and 2017 (up from 2.5% for these three years)
UCRP Employer contribution increases• Increases to a maximum of 19.1% by
2017 (UCRP at 18% plus 1.1% for the payback on STIP borrowing)
2013 2014 2015 2016 2017 2018 2019 2020 2021 2022 2023-$200
-$150
-$100
-$50
$0
$50
$100
$150
Base Case = Campus after MC investment Philanthropy Increase not met Federal and Private C&G DecreaseFederal ICR Rate Increase only 2% Fundraising Goals for Neuroscience not met Salary Increases not containedUCRP Employer Contribution Increases
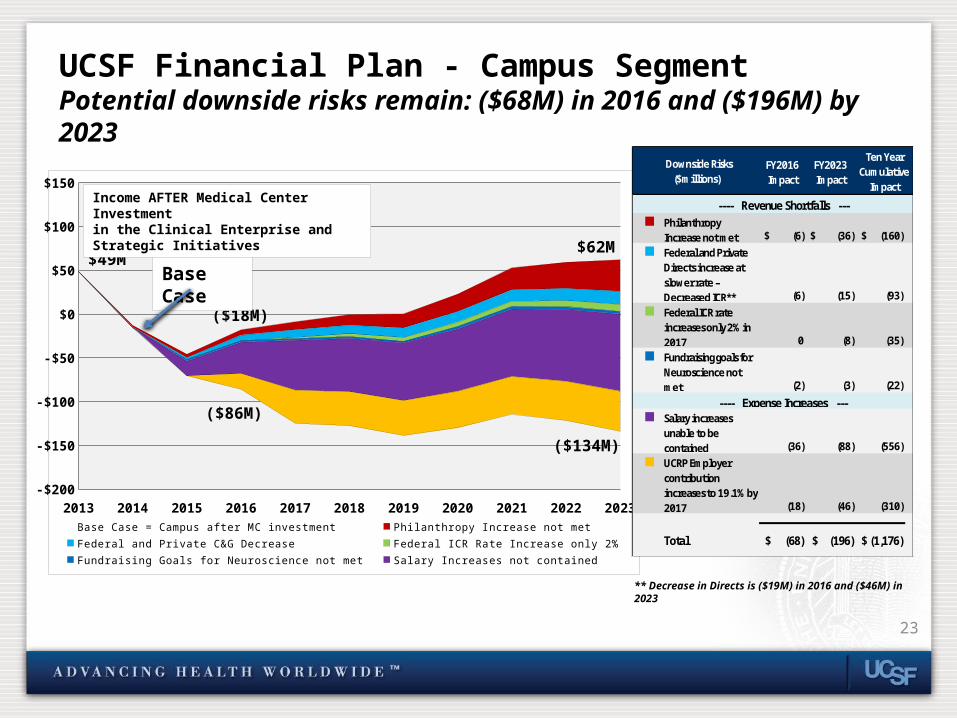
UCSF Financial Plan - Campus Segment Potential downside risks remain: ($68M) in 2016 and ($196M) by 2023
($18M)
$62M
Base Case
23
** Decrease in Directs is ($19M) in 2016 and ($46M) in 2023
$49M
($86M)
($134M)
Income AFTER Medical Center Investmentin the Clinical Enterprise and Strategic Initiatives
FY2016 Impact
FY2023 Impact
n Philanthropy Increase not met $ (6) $ (36) $ (160)
n Federal and Private Directs increase at slower rate – Decreased ICR** (6) (15) (93)
n Federal ICR rate increases only 2% in 2017 0 (8) (35)
n Fundraising goals for Neuroscience not met (2) (3) (22)
n Salary increases unable to be contained (36) (88) (556)
n UCRP Employer contribution increases to 19.1% by 2017 (18) (46) (310)
Total $ (68) $ (196) $ (1,176)
Downside Risks ($millions)
Ten Year Cumulative
Impact
---- Revenue Shortfalls ---
---- Expense Increases ---
24
24
UCSF Financial Plan
Medical Center
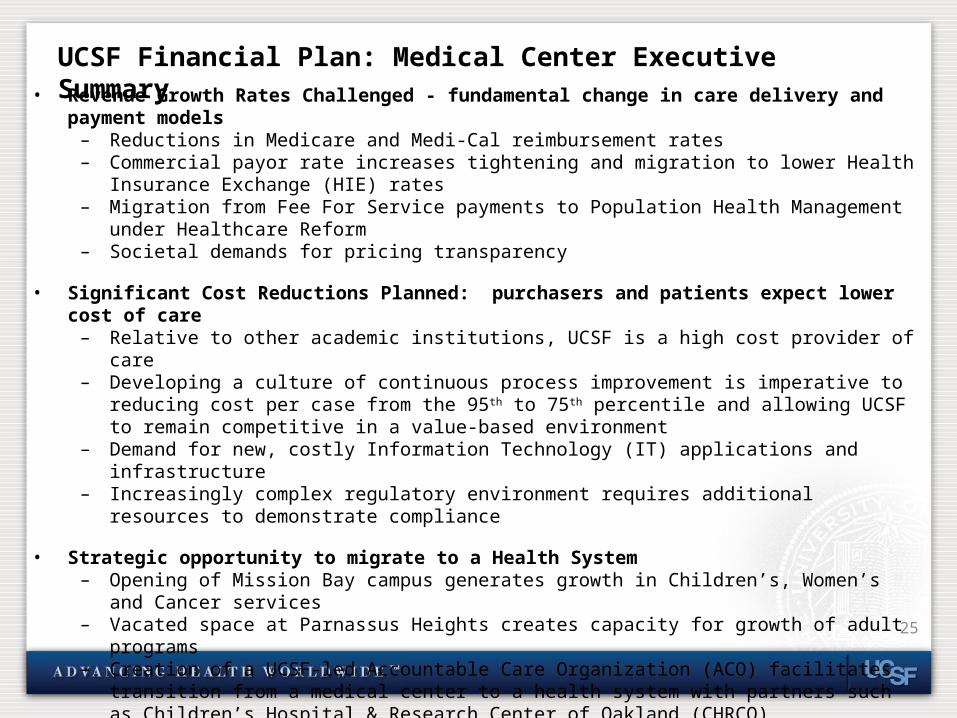
UCSF Financial Plan: Medical Center Executive Summary• Revenue Growth Rates Challenged - fundamental change in care delivery and payment models
– Reductions in Medicare and Medi-Cal reimbursement rates– Commercial payor rate increases tightening and migration to lower Health Insurance Exchange (HIE) rates– Migration from Fee For Service payments to Population Health Management under Healthcare Reform– Societal demands for pricing transparency
• Significant Cost Reductions Planned: purchasers and patients expect lower cost of care – Relative to other academic institutions, UCSF is a high cost provider of care– Developing a culture of continuous process improvement is imperative to reducing cost per case from the
95th to 75th percentile and allowing UCSF to remain competitive in a value-based environment– Demand for new, costly Information Technology (IT) applications and infrastructure – Increasingly complex regulatory environment requires additional resources to demonstrate compliance
• Strategic opportunity to migrate to a Health System – Opening of Mission Bay campus generates growth in Children’s, Women’s and Cancer services– Vacated space at Parnassus Heights creates capacity for growth of adult programs– Creation of a UCSF-led Accountable Care Organization (ACO) facilitates transition from a medical center to a
health system with partners such as Children’s Hospital & Research Center of Oakland (CHRCO) – Restructured Funds Flow aligns incentives and increases access to care across the clinical enterprise
• Balance Sheet has limited borrowing capacity and low days cash on hand – Strategic opportunities will require increased level of capital investment– Current philanthropy targets not met requiring interim financing to complete Mission Bay project– Demand for capital to fund strategic initiatives and IT, coupled with a lack of alternative funding sources,
decreases funds available for routine renewal and replacement of equipment and facilities 25
2010 2011 2012 2013 2014 2015 2016 2017 2018 2019 2020 2021 2022 2023-$2,000
-$1,000
$0
$1,000
$2,000
$3,000
$4,000
-$200
-$150
-$100
-$50
$0
$50
$100
$150
$200
$250
$300
1,797
1,957
2,020
2,1962,232 2,334 2,469 2,604 2,709 2,816 2,918 3,036 3,156 3,286
1,6471,750
1,919 2,061 2,1042,299
2,515 2,601 2,681 2,764 2,855 2,944 3,035 3,125
150
207
101
135 128
35
(46)
3 27
52 62 93
121 161
112
165
41
77 67
(25)
(105)
(62)(42)
(19) (11)16
42
79
Total Revenue Supporting Core Activities
Total Expenses Associated with Core Activities
Income Before Other Changes in Net Position (before Medical Center investment in the clinical practices)
Total Income Before Changes in Net Position (after the Medical Center investment in the clinical practices)
2012 Projection of Total Income before changes in Net Position (with Medical Center investment in the clinical practices)
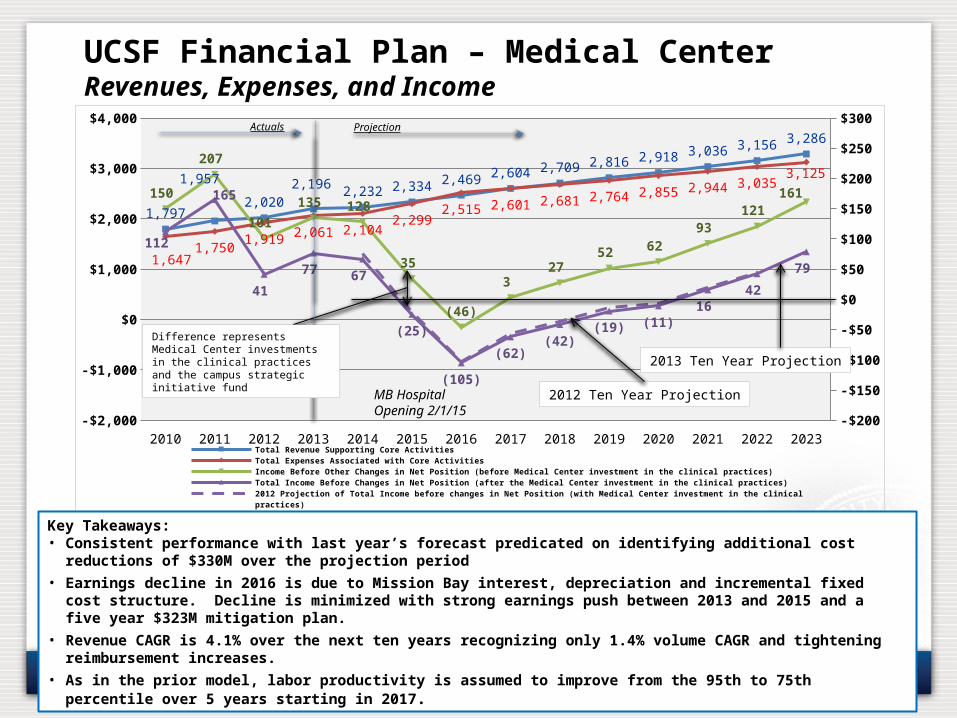
UCSF Financial Plan – Medical CenterRevenues, Expenses, and Income
2012 Ten Year Projection
2013 Ten Year Projection
26
Actuals Projection
MB Hospital Opening 2/1/15
Key Takeaways: • Consistent performance with last year’s forecast predicated on identifying additional cost reductions of $330M over the projection period• Earnings decline in 2016 is due to Mission Bay interest, depreciation and incremental fixed cost structure. Decline is minimized with
strong earnings push between 2013 and 2015 and a five year $323M mitigation plan.• Revenue CAGR is 4.1% over the next ten years recognizing only 1.4% volume CAGR and tightening reimbursement increases.• As in the prior model, labor productivity is assumed to improve from the 95th to 75th percentile over 5 years starting in 2017 .
Difference represents Medical Center investments in the clinical practices and the campus strategic initiative fund
-5.0%
0.0%
5.0%
10.0%
4.0% 3.6%5.0%
3.5%
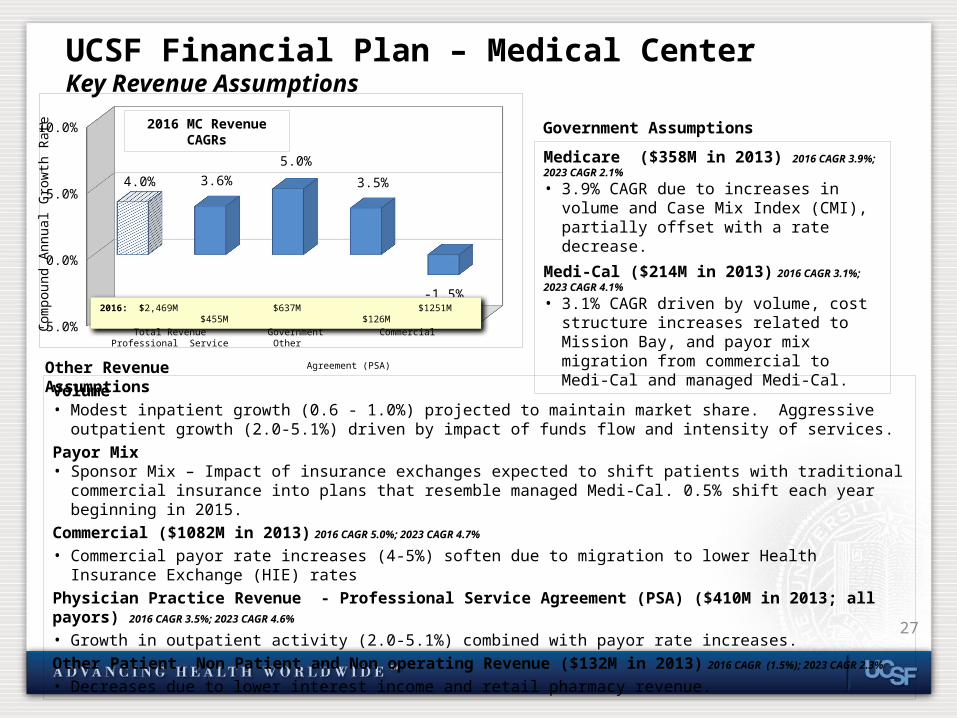
-1.5%2016: $2,469M $637M $1251M $455M $126M
UCSF Financial Plan – Medical CenterKey Revenue Assumptions
Com
poun
d An
nual
Gro
wth
Rat
e
27
Other Revenue Assumptions
Government Assumptions
Medicare ($358M in 2013) 2016 CAGR 3.9%; 2023 CAGR 2.1%
• 3.9% CAGR due to increases in volume and Case Mix Index (CMI), partially offset with a rate decrease.
Medi-Cal ($214M in 2013) 2016 CAGR 3.1%; 2023 CAGR 4.1%
• 3.1% CAGR driven by volume, cost structure increases related to Mission Bay, and payor mix migration from commercial to Medi-Cal and managed Medi-Cal.
Volume• Modest inpatient growth (0.6 - 1.0%) projected to maintain market share. Aggressive outpatient growth (2.0-5.1%) driven by
impact of funds flow and intensity of services. Payor Mix• Sponsor Mix – Impact of insurance exchanges expected to shift patients with traditional commercial insurance into plans that
resemble managed Medi-Cal. 0.5% shift each year beginning in 2015. Commercial ($1082M in 2013) 2016 CAGR 5.0%; 2023 CAGR 4.7%
• Commercial payor rate increases (4-5%) soften due to migration to lower Health Insurance Exchange (HIE) ratesPhysician Practice Revenue - Professional Service Agreement (PSA) ($410M in 2013; all payors) 2016 CAGR 3.5%; 2023 CAGR 4.6%
• Growth in outpatient activity (2.0-5.1%) combined with payor rate increases. Other Patient, Non Patient and Non operating Revenue ($132M in 2013) 2016 CAGR (1.5%); 2023 CAGR 2.3%
• Decreases due to lower interest income and retail pharmacy revenue.
Total Revenue Government Commercial Professional Service Other Agreement (PSA)
2016 MC Revenue CAGRs
0.0%
10.0%
20.0%
30.0%
6.9% 5.5%
11.9%
4.9%
25.6%
3.4%
Total Expense Salaries and Benefits Supplies Interest and Other Wages Depreciation
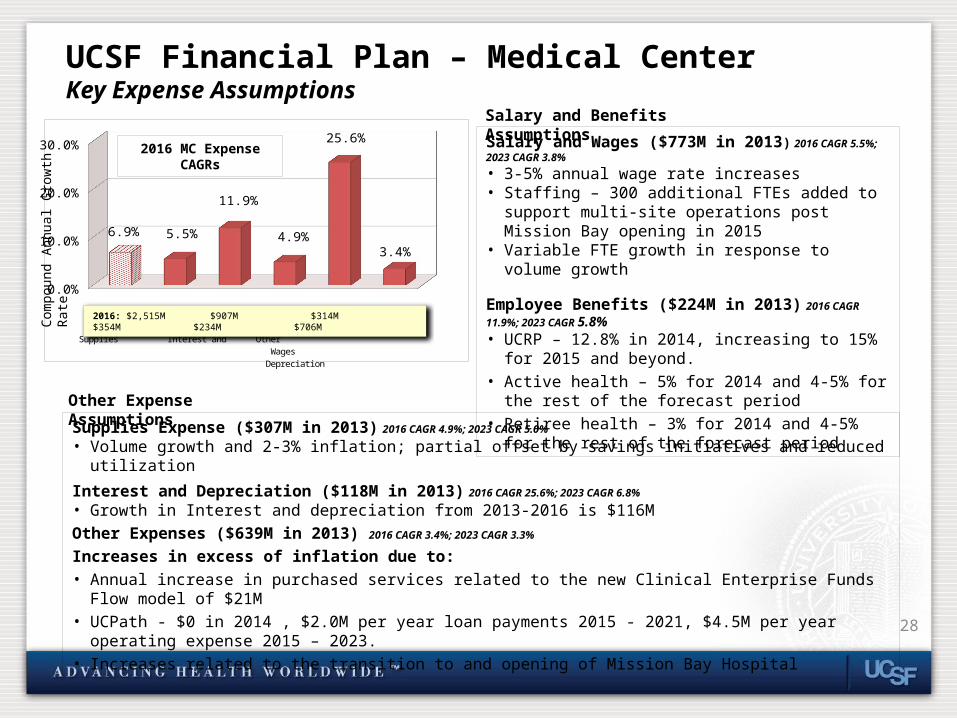
2016: $2,515M $907M $314M $354M $234M $706M
UCSF Financial Plan – Medical CenterKey Expense Assumptions
Com
poun
d An
nual
Gro
wth
Rat
e
28
2016 MC Expense CAGRs
Salary and Benefits Assumptions
Other Expense Assumptions
Salary and Wages ($773M in 2013) 2016 CAGR 5.5%; 2023 CAGR 3.8%
• 3-5% annual wage rate increases• Staffing – 300 additional FTEs added to support multi-site
operations post Mission Bay opening in 2015• Variable FTE growth in response to volume growth
Employee Benefits ($224M in 2013) 2016 CAGR 11.9%; 2023 CAGR 5.8%• UCRP – 12.8% in 2014, increasing to 15% for 2015 and
beyond. • Active health – 5% for 2014 and 4-5% for the rest of the
forecast period• Retiree health – 3% for 2014 and 4-5% for the rest of the
forecast period
Supplies Expense ($307M in 2013) 2016 CAGR 4.9%; 2023 CAGR 5.0%
• Volume growth and 2-3% inflation; partial offset by savings initiatives and reduced utilization
Interest and Depreciation ($118M in 2013) 2016 CAGR 25.6%; 2023 CAGR 6.8%
• Growth in Interest and depreciation from 2013-2016 is $116MOther Expenses ($639M in 2013) 2016 CAGR 3.4%; 2023 CAGR 3.3%
Increases in excess of inflation due to:• Annual increase in purchased services related to the new Clinical Enterprise Funds Flow model of $21M• UCPath - $0 in 2014 , $2.0M per year loan payments 2015 - 2021, $4.5M per year operating expense 2015 – 2023. • Increases related to the transition to and opening of Mission Bay Hospital
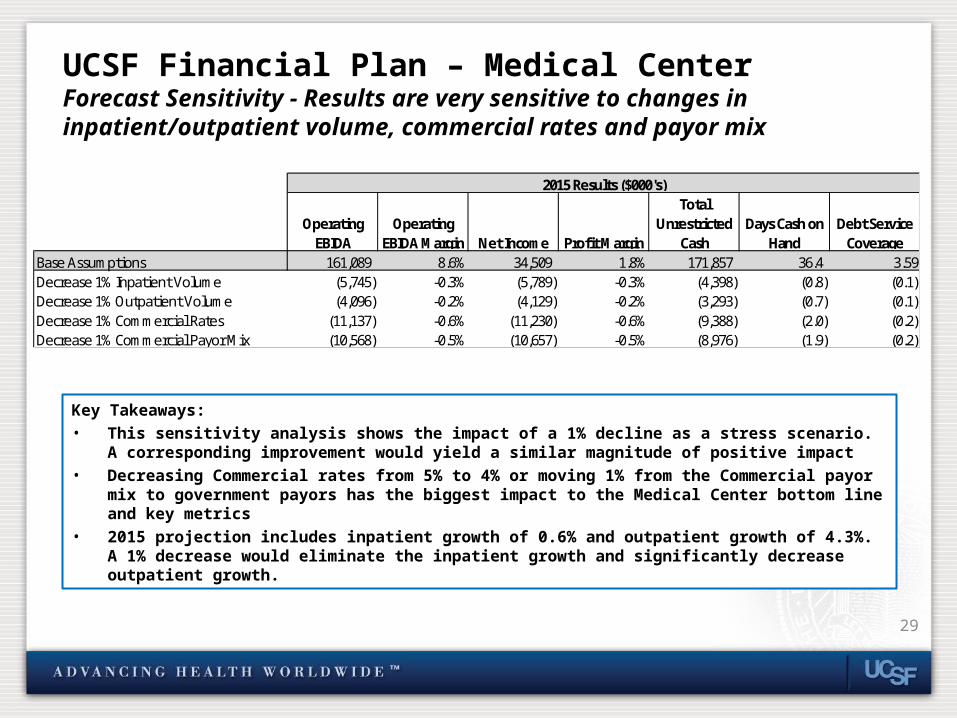
UCSF Financial Plan – Medical CenterForecast Sensitivity - Results are very sensitive to changes in inpatient/outpatient volume, commercial rates and payor mix
Key Takeaways:• This sensitivity analysis shows the impact of a 1% decline as a stress scenario. A corresponding improvement would
yield a similar magnitude of positive impact • Decreasing Commercial rates from 5% to 4% or moving 1% from the Commercial payor mix to government payors has
the biggest impact to the Medical Center bottom line and key metrics• 2015 projection includes inpatient growth of 0.6% and outpatient growth of 4.3%. A 1% decrease would eliminate
the inpatient growth and significantly decrease outpatient growth.
Operating EBIDA
Operating EBIDA Margin Net Income Profit Margin
Total Unrestricted
CashDays Cash on
HandDebt Service
CoverageBase Assumptions 161,089 8.6% 34,509 1.8% 171,857 36.4 3.59Decrease 1% Inpatient Volume (5,745) -0.3% (5,789) -0.3% (4,398) (0.8) (0.1) Decrease 1% Outpatient Volume (4,096) -0.2% (4,129) -0.2% (3,293) (0.7) (0.1) Decrease 1% Commercial Rates (11,137) -0.6% (11,230) -0.6% (9,388) (2.0) (0.2) Decrease 1% Commercial Payor Mix (10,568) -0.5% (10,657) -0.5% (8,976) (1.9) (0.2)
2015 Results ($000's)
29
30
30
UCSF Financial Plan
Balance Sheet: Cash, Capital and Debt
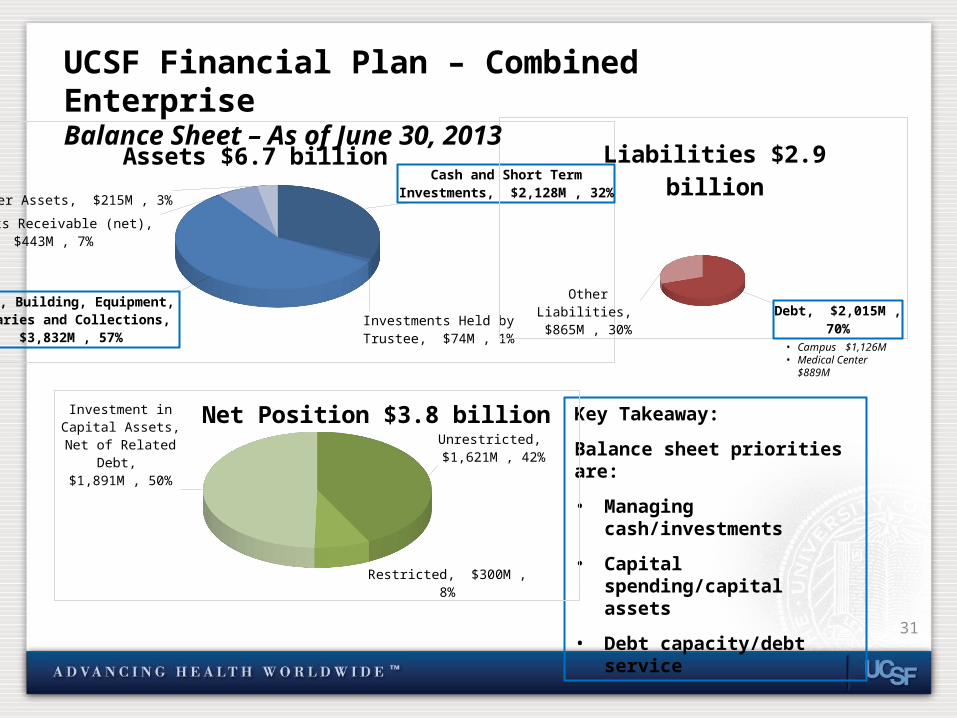
Cash and Short Term Investments, $2,128M , 32%
Investments Held by Trustee, $74M , 1%Land, Building, Equipment, Libraries and
Collections, $3,832M , 57%
Accounts Receivable (net), $443M , 7%
Other Assets, $215M , 3%
Assets $6.7 billion
Debt, $2,015M ,
70%
Other Liabili-ties, $865M
, 30%
Liabilities $2.9 billion
UCSF Financial Plan – Combined EnterpriseBalance Sheet – As of June 30, 2013
31
• Campus$1,126M
• Medical Center $889M
Key Takeaway:
Balance sheet priorities are:
• Managing cash/investments
• Capital spending/capital assets
• Debt capacity/debt service
Unrestricted, $1,621M , 42%
Restricted, $300M , 8%
Investment in Capital Assets, Net of Related Debt, $1,891M , 50%
Net Position $3.8 billion
2011 2012 2013 2014 2015 2016 2017 2018 2019 2020 2021 2022 2023$0
$500
$1,000
$1,500
$2,000
$2,500
$3,000
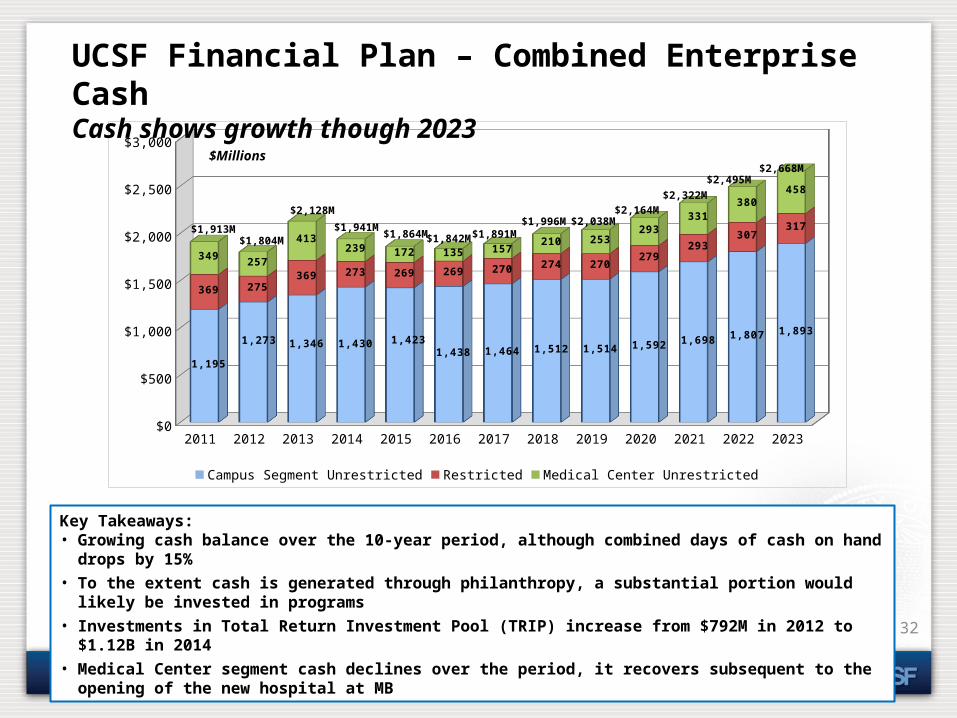
1,195
1,273 1,346 1,430 1,4231,438 1,464 1,512 1,514 1,592 1,698 1,807 1,893
369 275369 273 269 269 270 274 270
279293
307317
349 257
413239 172 135 157
210 253293
331380
458
Campus Segment Unrestricted Restricted Medical Center Unrestricted
UCSF Financial Plan – Combined Enterprise CashCash shows growth though 2023
$1,913M$1,804M
$2,128M
$1,941M$1,864M $1,842M $1,891M
$1,996M $2,038M$2,164M
$2,322M$2,495M
32
$2,668M
Key Takeaways: • Growing cash balance over the 10-year period, although combined days of cash on hand drops by 15%• To the extent cash is generated through philanthropy, a substantial portion would likely be invested in programs• Investments in Total Return Investment Pool (TRIP) increase from $792M in 2012 to $1.12B in 2014• Medical Center segment cash declines over the period, it recovers subsequent to the opening of the new hospital at MB
$Millions
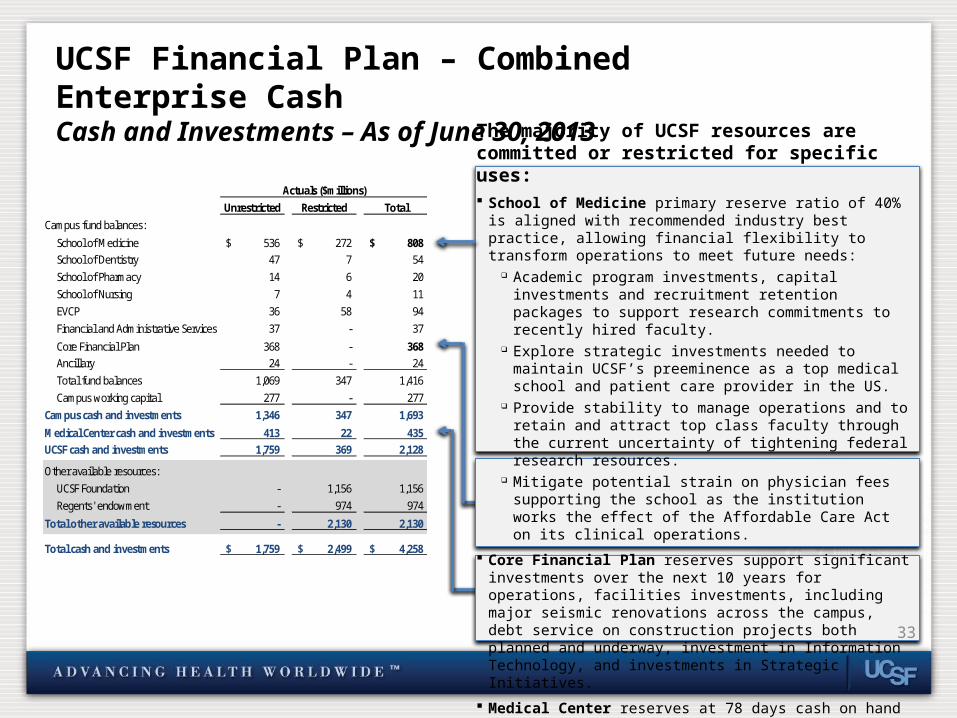
The majority of UCSF resources are committed or restricted for specific uses: School of Medicine primary reserve ratio of 40% is aligned with
recommended industry best practice, allowing financial flexibility to transform operations to meet future needs:
Academic program investments, capital investments and recruitment retention packages to support research commitments to recently hired faculty.
Explore strategic investments needed to maintain UCSF’s preeminence as a top medical school and patient care provider in the US.
Provide stability to manage operations and to retain and attract top class faculty through the current uncertainty of tightening federal research resources.
Mitigate potential strain on physician fees supporting the school as the institution works the effect of the Affordable Care Act on its clinical operations.
Core Financial Plan reserves support significant investments over the next 10 years for operations, facilities investments, including major seismic renovations across the campus, debt service on construction projects both planned and underway, investment in Information Technology, and investments in Strategic Initiatives.
Medical Center reserves at 78 days cash on hand is low in relation to industry ratios (AA rated hospital median ratio is 432 days). Cash reserves are needed to meet debt service on the Mission Bay Hospital construction, related startup costs in 2015 – 2017 and daily operational needs. 33
Unrestricted Restricted TotalCampus fund balances:
School of Medicine 536$ 272$ 808$ School of Dentistry 47 7 54 School of Pharmacy 14 6 20 School of Nursing 7 4 11 EVCP 36 58 94 Financial and Administrative Services 37 - 37
Core Financial Plan 368 - 368 Ancillary 24 - 24 Total fund balances 1,069 347 1,416 Campus working capital 277 - 277
Campus cash and investments 1,346 347 1,693
Medical Center cash and investments 413 22 435 UCSF cash and investments 1,759 369 2,128
Other available resources:UCSF Foundation - 1,156 1,156 Regents' endowment - 974 974
Total other available resources - 2,130 2,130
Total cash and investments 1,759$ 2,499$ 4,258$
Actuals ($millions)
UCSF Financial Plan – Combined Enterprise CashCash and Investments – As of June 30, 2013
2014 2015 2016 2017 2018 2019 2020 2021 2022 2023 $-
$100
$200
$300
$400
$500
$600
$700
$800
255 204139 149
206145
41 36125
64
455504
135 110102
137
158 177
184
179
Campus Segment Medical Center
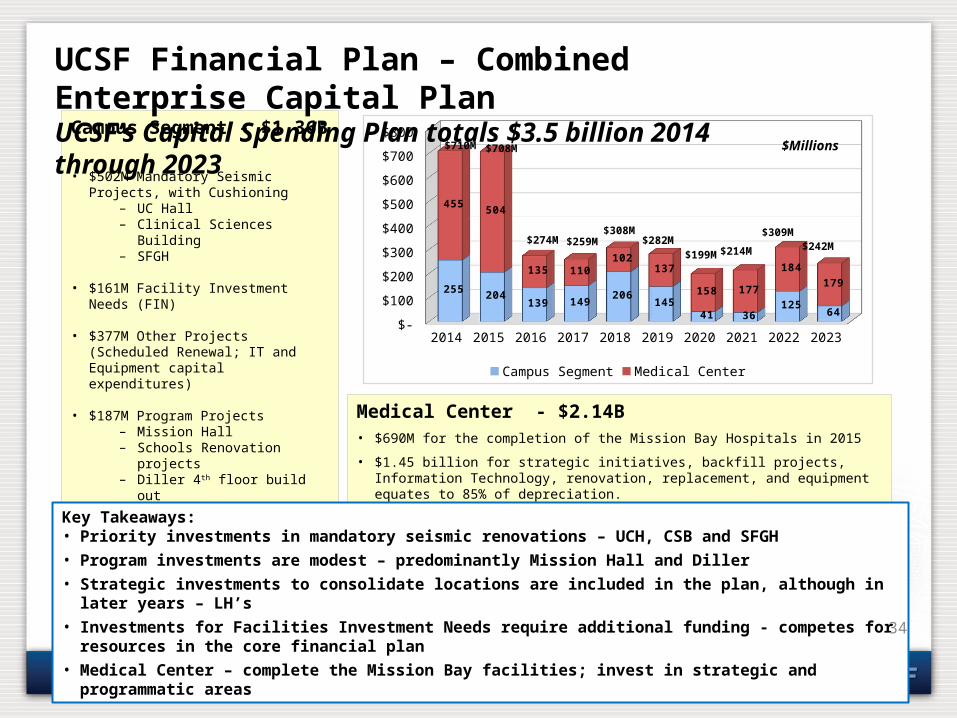
Campus Segment - $1.36B • $502M Mandatory Seismic Projects, with
Cushioning– UC Hall– Clinical Sciences Building– SFGH
• $161M Facility Investment Needs (FIN)
• $377M Other Projects (Scheduled Renewal; IT and Equipment capital expenditures)
• $187M Program Projects – Mission Hall– Schools Renovation projects– Diller 4th floor build out
• $100M Laurel Heights Replacement
• $36M Auxiliary/Parking/Housing – Parnassus Housing– Millberry Union Garage Repairs– Mission Bay Surface Parking
Medical Center - $2.14B• $690M for the completion of the Mission Bay Hospitals in 2015
• $1.45 billion for strategic initiatives, backfill projects, Information Technology, renovation, replacement, and equipment equates to 85% of depreciation.
Key Takeaways:• Priority investments in mandatory seismic renovations – UCH, CSB and SFGH• Program investments are modest – predominantly Mission Hall and Diller• Strategic investments to consolidate locations are included in the plan, although in later years – LH’s• Investments for Facilities Investment Needs require additional funding - competes for resources in the core financial plan• Medical Center – complete the Mission Bay facilities; invest in strategic and programmatic areas
$Millions
UCSF Financial Plan – Combined Enterprise Capital PlanUCSF’s Capital Spending Plan totals $3.5 billion 2014 through 2023
$710M
$282M$199M $214M
$309M$242M
$708M
$274M $259M$308M
34
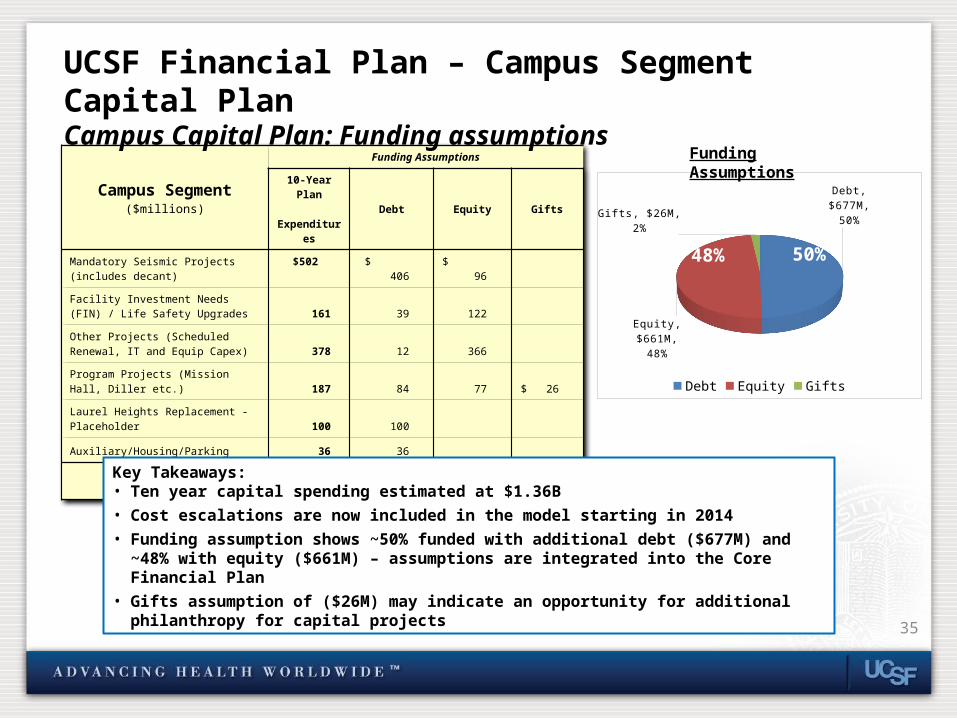
Campus Segment($millions)
Funding Assumptions
10-Year Plan Expenditures Debt Equity Gifts
Mandatory Seismic Projects (includes decant) $502 $ 406 $ 96
Facility Investment Needs (FIN) / Life Safety Upgrades 161 39 122
Other Projects (Scheduled Renewal, IT and Equip Capex) 378 12 366
Program Projects (Mission Hall, Diller etc.) 187 84 77 $ 26
Laurel Heights Replacement - Placeholder 100 100
Auxiliary/Housing/Parking 36 36
Total $ 1,364 $ 677 $ 661 $ 26
35
Key Takeaways:• Ten year capital spending estimated at $1.36B• Cost escalations are now included in the model starting in 2014• Funding assumption shows ~50% funded with additional debt ($677M) and ~48% with equity ($661M) –
assumptions are integrated into the Core Financial Plan• Gifts assumption of ($26M) may indicate an opportunity for additional philanthropy for capital projects
UCSF Financial Plan – Campus Segment Capital PlanCampus Capital Plan: Funding assumptions
Debt, $677M, 50%
Equity, $661M, 48%
Gifts, $26M, 2%
Debt Equity Gifts
48% 50%
Funding Assumptions
2011 2012 2013 2014 2015 2016 2017 2018 2019 2020 2021 2022 2023 $-
$500
$1,000
$1,500
$2,000
$2,500
$3,000
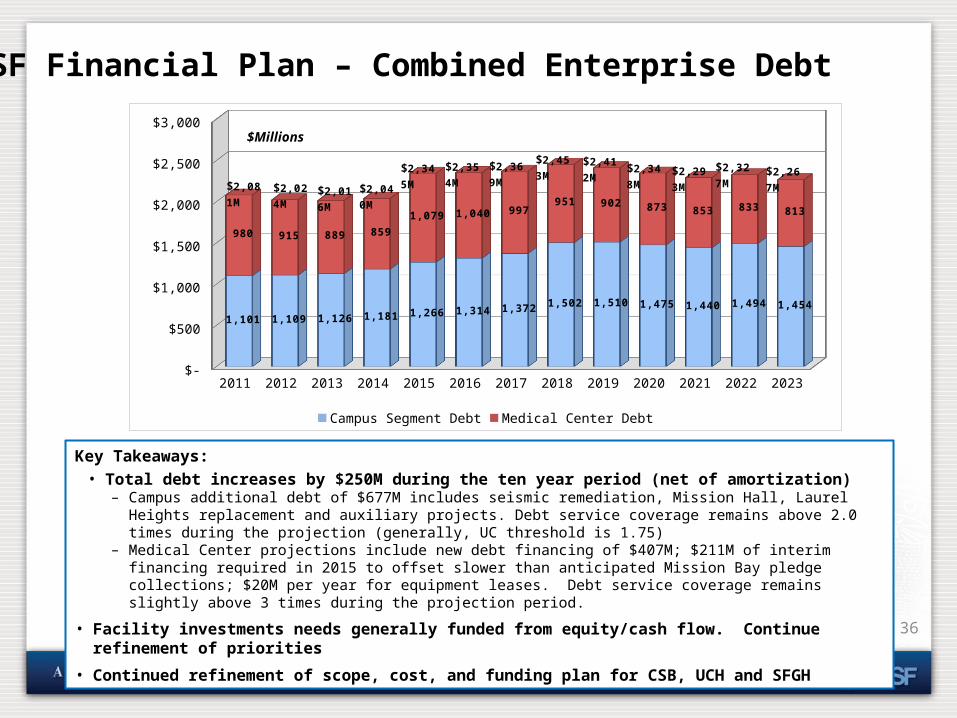
1,101 1,109 1,126 1,181 1,266 1,314 1,372 1,502 1,510 1,475 1,440 1,494 1,454
980 915 889 859
1,079 1,040 997951 902 873 853 833 813
Campus Segment Debt Medical Center Debt
$2,016M
$2,345M
$2,040M
$2,024M
$2,267M
$2,327M
$2,293M
$2,348M
$2,412M
$2,453M$2,369
M$2,354M
$2,081M
UCSF Financial Plan – Combined Enterprise Debt
36
Key Takeaways:• Total debt increases by $250M during the ten year period (net of amortization)
– Campus additional debt of $677M includes seismic remediation, Mission Hall, Laurel Heights replacement and auxiliary projects. Debt service coverage remains above 2.0 times during the projection (generally, UC threshold is 1.75)
– Medical Center projections include new debt financing of $407M; $211M of interim financing required in 2015 to offset slower than anticipated Mission Bay pledge collections; $20M per year for equipment leases. Debt service coverage remains slightly above 3 times during the projection period.
• Facility investments needs generally funded from equity/cash flow. Continue refinement of priorities
• Continued refinement of scope, cost, and funding plan for CSB, UCH and SFGH
$Millions
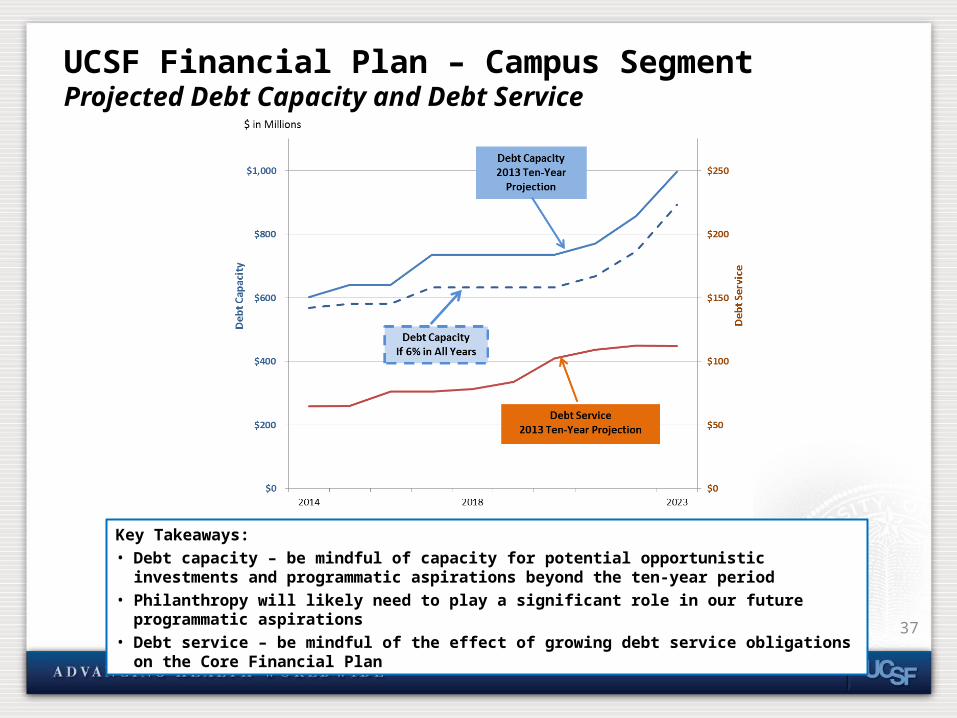
37
Key Takeaways: • Debt capacity – be mindful of capacity for potential opportunistic investments and programmatic aspirations
beyond the ten-year period• Philanthropy will likely need to play a significant role in our future programmatic aspirations• Debt service – be mindful of the effect of growing debt service obligations on the Core Financial Plan
UCSF Financial Plan – Campus SegmentProjected Debt Capacity and Debt Service
38
38
Summary ofCore Financial Plan
Fall 2013
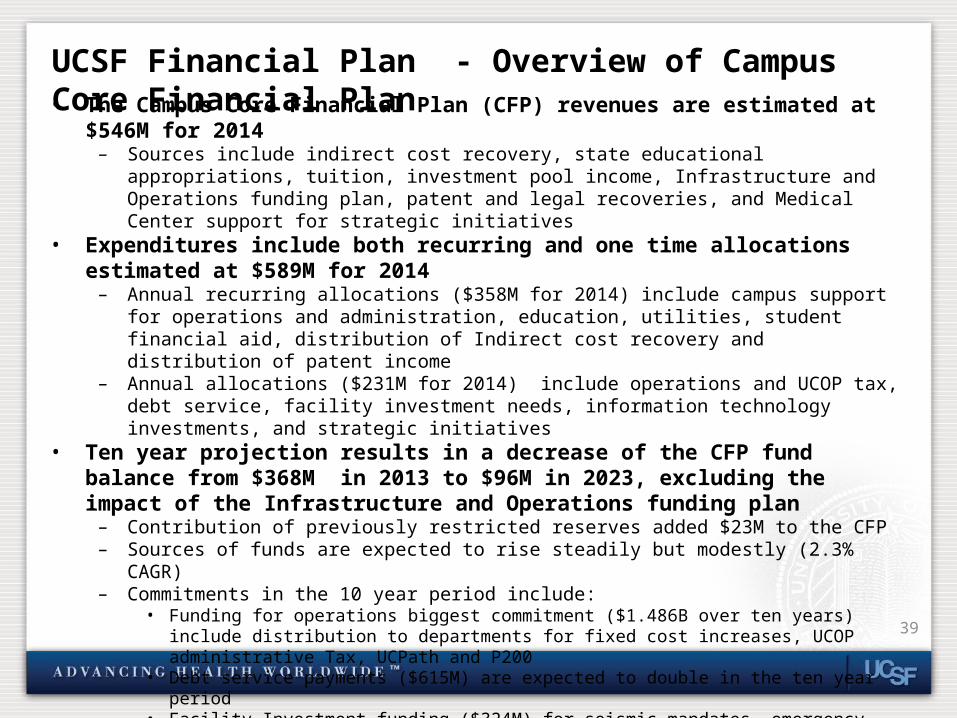
UCSF Financial Plan - Overview of Campus Core Financial Plan• The Campus Core Financial Plan (CFP) revenues are estimated at $546M for 2014
– Sources include indirect cost recovery, state educational appropriations, tuition, investment pool income, Infrastructure and Operations funding plan, patent and legal recoveries, and Medical Center support for strategic initiatives
• Expenditures include both recurring and one time allocations estimated at $589M for 2014– Annual recurring allocations ($358M for 2014) include campus support for operations and
administration, education, utilities, student financial aid, distribution of Indirect cost recovery and distribution of patent income
– Annual allocations ($231M for 2014) include operations and UCOP tax, debt service, facility investment needs, information technology investments, and strategic initiatives
• Ten year projection results in a decrease of the CFP fund balance from $368M in 2013 to $96M in 2023, excluding the impact of the Infrastructure and Operations funding plan
– Contribution of previously restricted reserves added $23M to the CFP– Sources of funds are expected to rise steadily but modestly (2.3% CAGR)– Commitments in the 10 year period include:
• Funding for operations biggest commitment ($1.486B over ten years) include distribution to departments for fixed cost increases, UCOP administrative Tax, UCPath and P200
• Debt service payments ($615M) are expected to double in the ten year period• Facility Investment funding ($324M) for seismic mandates, emergency remediation, and capital renewal
insufficient to fund all unfunded renewal facility investment needs• Technology commitment remains steady but does not cover total needs ($66M)• Strategic Initiatives ($99M) are primarily funded with Medical Center support
• Infrastructure and Operations funding plan estimates increase the fund balance from $96M to $173M – consequential decision 39
40
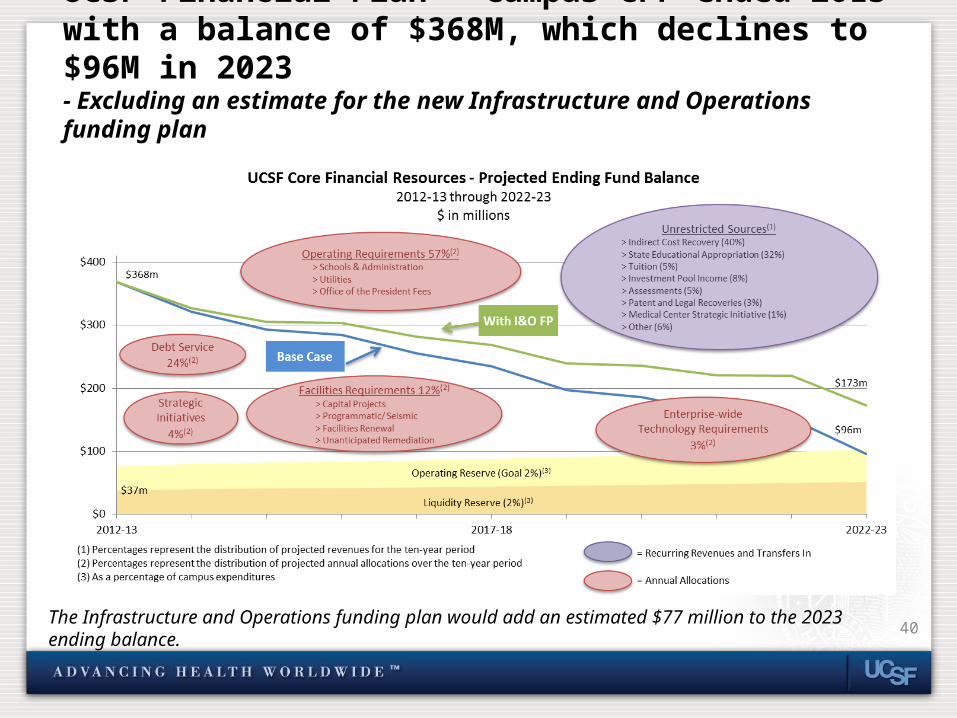
UCSF Financial Plan – Campus CFP ended 2013 with a balance of $368M, which declines to $96M in 2023- Excluding an estimate for the new Infrastructure and Operations funding plan
The Infrastructure and Operations funding plan would add an estimated $77 million to the 2023 ending balance.
41
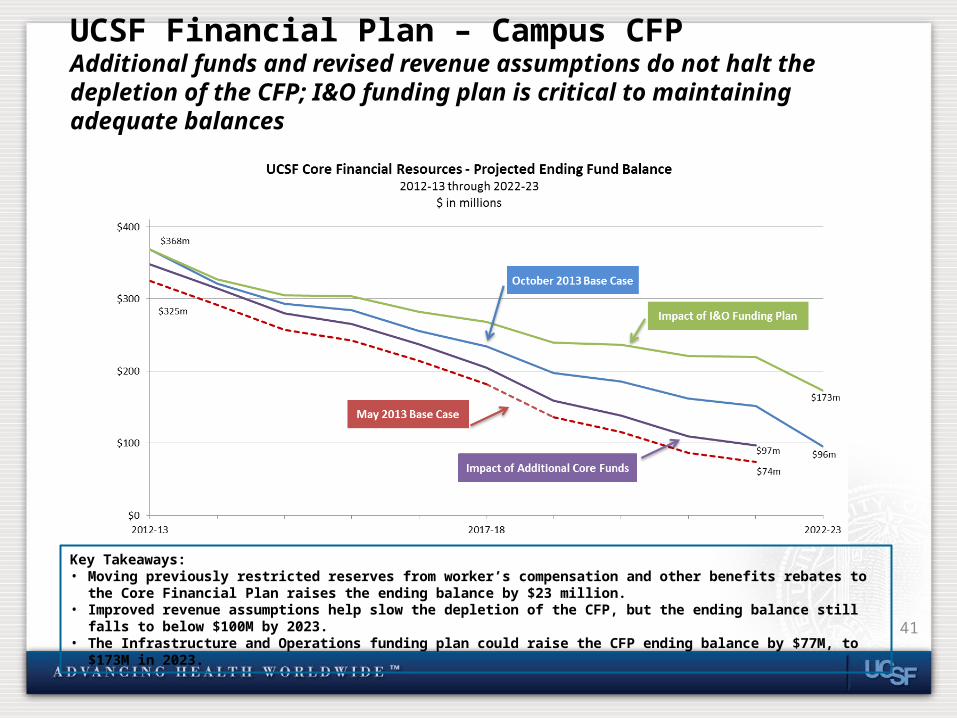
UCSF Financial Plan – Campus CFPAdditional funds and revised revenue assumptions do not halt the depletion of the CFP; I&O funding plan is critical to maintaining adequate balances
Key Takeaways:• Moving previously restricted reserves from worker’s compensation and other benefits rebates to the Core Financial Plan raises the ending
balance by $23 million.• Improved revenue assumptions help slow the depletion of the CFP, but the ending balance still falls to below $100M by 2023.• The Infrastructure and Operations funding plan could raise the CFP ending balance by $77M, to $173M in 2023.
42
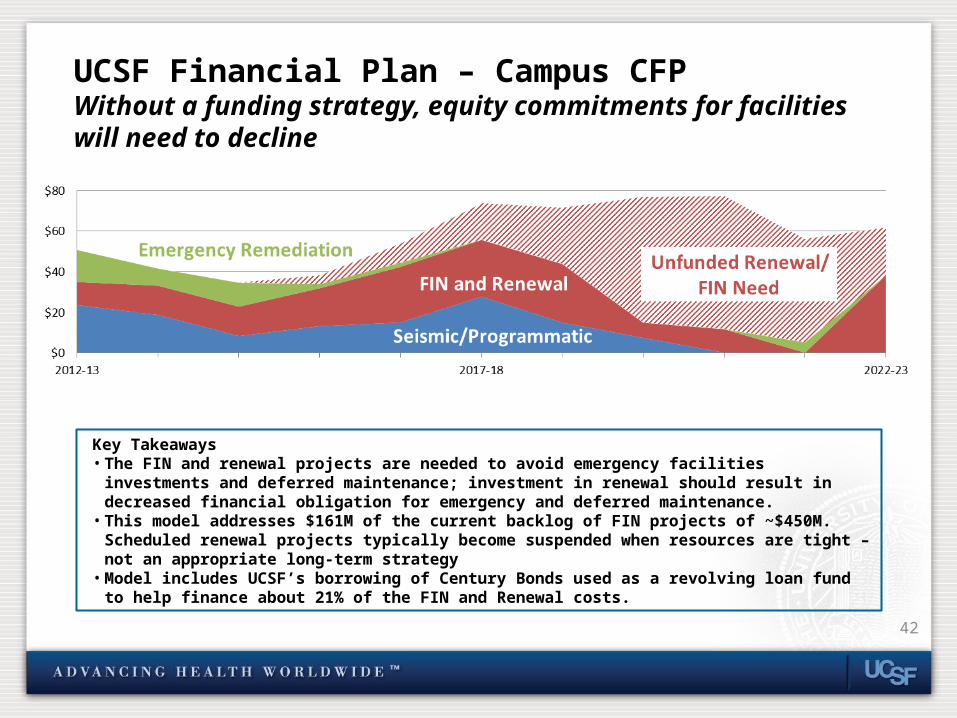
UCSF Financial Plan – Campus CFPWithout a funding strategy, equity commitments for facilities will need to decline
Key Takeaways• The FIN and renewal projects are needed to avoid emergency facilities investments and deferred maintenance;
investment in renewal should result in decreased financial obligation for emergency and deferred maintenance.• This model addresses $161M of the current backlog of FIN projects of ~$450M. Scheduled renewal projects typically
become suspended when resources are tight – not an appropriate long-term strategy• Model includes UCSF’s borrowing of Century Bonds used as a revolving loan fund to help finance about 21% of the
FIN and Renewal costs.
FIN and Renewal
Capital Projects
Summary
43
What this means for UCSF . . .
44
• Excellent progress and we are assertively planning for what is ahead• Competitive landscape is changing rapidly. Strategically ….
• Maintain the ability to continue to make strategic capital and programmatic investments
• Make required cultural and organizational changes to support effective, nimble decisions
• Align strategy with operations• Enable people to execute strategies – focus on employee engagement• Adapt to a dynamic and uncertain marketplace
• Financially … solutions will continue to require a comprehensive focus on: • Revenue growth, or protection of cost-effective revenue-generating programs• Continued expense control – aggressively remove structural costs• Enterprise-wide solutions that leverage talent, capital, space, etc.
• What is best for UCSF is paramount – we cannot let our attention be diverted from our priorities and execution
Appendix A
UCSF Financial PlanBase Case
45
46
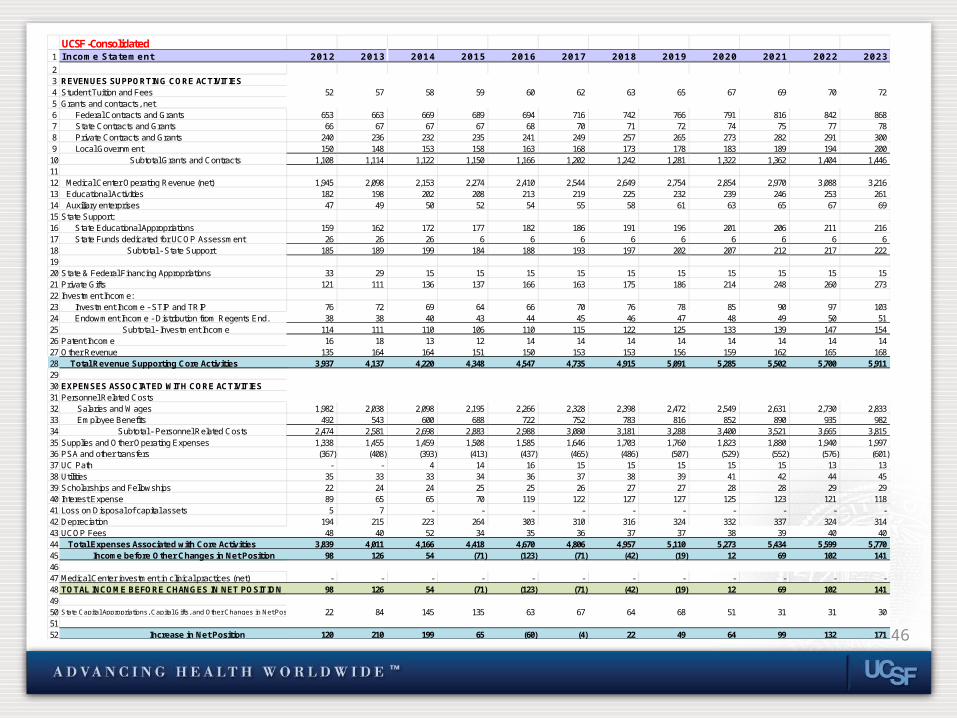
UCSF -Consolidated1 Income Statement 2012 2013 2014 2015 2016 2017 2018 2019 2020 2021 2022 202323 REVENUES SUPPORTING CORE ACTIVITIES4 Student Tuition and Fees 52 57 58 59 60 62 63 65 67 69 70 72 5 Grants and contracts, net6 Federal Contracts and Grants 653 663 669 689 694 716 742 766 791 816 842 868 7 State Contracts and Grants 66 67 67 67 68 70 71 72 74 75 77 78 8 Private Contracts and Grants 240 236 232 235 241 249 257 265 273 282 291 300 9 Local Government 150 148 153 158 163 168 173 178 183 189 194 200
10 Subtotal Grants and Contracts 1,108 1,114 1,122 1,150 1,166 1,202 1,242 1,281 1,322 1,362 1,404 1,446 1112 Medical Center Operating Revenue (net) 1,945 2,098 2,153 2,274 2,410 2,544 2,649 2,754 2,854 2,970 3,088 3,216 13 Educational Activities 182 198 202 208 213 219 225 232 239 246 253 261 14 Auxiliary enterprises 47 49 50 52 54 55 58 61 63 65 67 69 15 State Support:16 State Educational Appropriations 159 162 172 177 182 186 191 196 201 206 211 216 17 State Funds dedicated for UCOP Assessment 26 26 26 6 6 6 6 6 6 6 6 6 18 Subtotal - State Support 185 189 199 184 188 193 197 202 207 212 217 222 1920 State & Federal Financing Appropriations 33 29 15 15 15 15 15 15 15 15 15 15 21 Private Gifts 121 111 136 137 166 163 175 186 214 248 260 273 22 Investment Income:23 Investment Income - STIP and TRIP 76 72 69 64 66 70 76 78 85 90 97 103 24 Endowment Income - Distribution from Regents End. 38 38 40 43 44 45 46 47 48 49 50 51 25 Subtotal - Investment Income 114 111 110 106 110 115 122 125 133 139 147 154 26 Patent Income 16 18 13 12 14 14 14 14 14 14 14 14 27 Other Revenue 135 164 164 151 150 153 153 156 159 162 165 168 28 Total Revenue Supporting Core Activities 3,937 4,137 4,220 4,348 4,547 4,735 4,915 5,091 5,285 5,502 5,700 5,911 2930 EXPENSES ASSOCIATED WITH CORE ACTIVITIES31 Personnel Related Costs32 Salaries and Wages 1,982 2,038 2,098 2,195 2,266 2,328 2,398 2,472 2,549 2,631 2,730 2,833 33 Employee Benefits 492 543 600 688 722 752 783 816 852 890 935 982 34 Subtotal - Personnel Related Costs 2,474 2,581 2,698 2,883 2,988 3,080 3,181 3,288 3,400 3,521 3,665 3,815 35 Supplies and Other Operating Expenses 1,338 1,455 1,459 1,508 1,585 1,646 1,703 1,760 1,823 1,880 1,940 1,997 36 PSA and other transfers (367) (408) (393) (413) (437) (465) (486) (507) (529) (552) (576) (601) 37 UC Path - - 4 14 16 15 15 15 15 15 13 13 38 Utilities 35 33 33 34 36 37 38 39 41 42 44 45 39 Scholarships and Fellowships 22 24 24 25 25 26 27 27 28 28 29 29 40 Interest Expense 89 65 65 70 119 122 127 127 125 123 121 118 41 Loss on Disposal of capital assets 5 7 - - - - - - - - - - 42 Depreciation 194 215 223 264 303 310 316 324 332 337 324 314 43 UCOP Fees 48 40 52 34 35 36 37 37 38 39 40 40 44 Total Expenses Associated with Core Activities 3,839 4,011 4,166 4,418 4,670 4,806 4,957 5,110 5,273 5,434 5,599 5,770 45 Income before Other Changes in Net Position 98 126 54 (71) (123) (71) (42) (19) 12 69 102 141 4647 Medical Center investment in clinical practices (net) - - - - - - - - - - - - 48 TOTAL INCOME BEFORE CHANGES IN NET POSITION 98 126 54 (71) (123) (71) (42) (19) 12 69 102 141 4950 State Capital Appropriations, Capital Gifts, and Other Changes in Net Position 22 84 145 135 63 67 64 68 51 31 31 30 5152 Increase in Net Position 120 210 199 65 (60) (4) 22 49 64 99 132 171
47
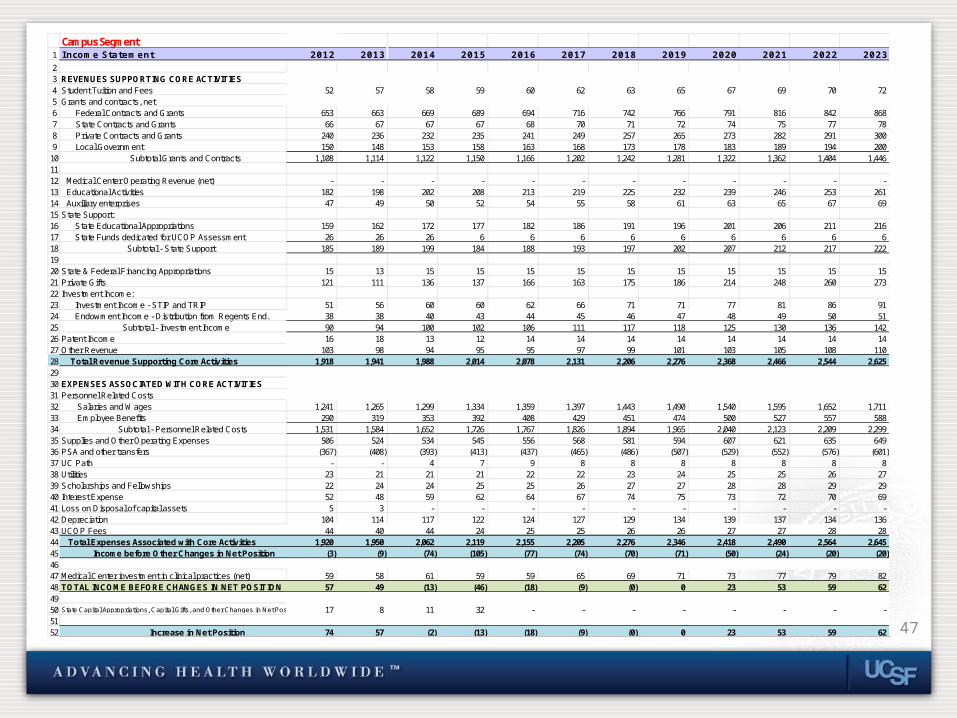
Campus Segment1 Income Statement 2012 2013 2014 2015 2016 2017 2018 2019 2020 2021 2022 202323 REVENUES SUPPORTING CORE ACTIVITIES4 Student Tuition and Fees 52 57 58 59 60 62 63 65 67 69 70 72 5 Grants and contracts, net6 Federal Contracts and Grants 653 663 669 689 694 716 742 766 791 816 842 868 7 State Contracts and Grants 66 67 67 67 68 70 71 72 74 75 77 78 8 Private Contracts and Grants 240 236 232 235 241 249 257 265 273 282 291 300 9 Local Government 150 148 153 158 163 168 173 178 183 189 194 200
10 Subtotal Grants and Contracts 1,108 1,114 1,122 1,150 1,166 1,202 1,242 1,281 1,322 1,362 1,404 1,446 1112 Medical Center Operating Revenue (net) - - - - - - - - - - - - 13 Educational Activities 182 198 202 208 213 219 225 232 239 246 253 261 14 Auxiliary enterprises 47 49 50 52 54 55 58 61 63 65 67 69 15 State Support:16 State Educational Appropriations 159 162 172 177 182 186 191 196 201 206 211 216 17 State Funds dedicated for UCOP Assessment 26 26 26 6 6 6 6 6 6 6 6 6 18 Subtotal - State Support 185 189 199 184 188 193 197 202 207 212 217 222 1920 State & Federal Financing Appropriations 15 13 15 15 15 15 15 15 15 15 15 15 21 Private Gifts 121 111 136 137 166 163 175 186 214 248 260 273 22 Investment Income:23 Investment Income - STIP and TRIP 51 56 60 60 62 66 71 71 77 81 86 91 24 Endowment Income - Distribution from Regents End. 38 38 40 43 44 45 46 47 48 49 50 51 25 Subtotal - Investment Income 90 94 100 102 106 111 117 118 125 130 136 142 26 Patent Income 16 18 13 12 14 14 14 14 14 14 14 14 27 Other Revenue 103 98 94 95 95 97 99 101 103 105 108 110 28 Total Revenue Supporting Core Activities 1,918 1,941 1,988 2,014 2,078 2,131 2,206 2,276 2,368 2,466 2,544 2,625 2930 EXPENSES ASSOCIATED WITH CORE ACTIVITIES31 Personnel Related Costs32 Salaries and Wages 1,241 1,265 1,299 1,334 1,359 1,397 1,443 1,490 1,540 1,595 1,652 1,711 33 Employee Benefits 290 319 353 392 408 429 451 474 500 527 557 588 34 Subtotal - Personnel Related Costs 1,531 1,584 1,652 1,726 1,767 1,826 1,894 1,965 2,040 2,123 2,209 2,299 35 Supplies and Other Operating Expenses 506 524 534 545 556 568 581 594 607 621 635 649 36 PSA and other transfers (367) (408) (393) (413) (437) (465) (486) (507) (529) (552) (576) (601) 37 UC Path - - 4 7 9 8 8 8 8 8 8 8 38 Utilities 23 21 21 21 22 22 23 24 25 25 26 27 39 Scholarships and Fellowships 22 24 24 25 25 26 27 27 28 28 29 29 40 Interest Expense 52 48 59 62 64 67 74 75 73 72 70 69 41 Loss on Disposal of capital assets 5 3 - - - - - - - - - - 42 Depreciation 104 114 117 122 124 127 129 134 139 137 134 136 43 UCOP Fees 44 40 44 24 25 25 26 26 27 27 28 28 44 Total Expenses Associated with Core Activities 1,920 1,950 2,062 2,119 2,155 2,205 2,276 2,346 2,418 2,490 2,564 2,645 45 Income before Other Changes in Net Position (3) (9) (74) (105) (77) (74) (70) (71) (50) (24) (20) (20) 4647 Medical Center investment in clinical practices (net) 59 58 61 59 59 65 69 71 73 77 79 82 48 TOTAL INCOME BEFORE CHANGES IN NET POSITION 57 49 (13) (46) (18) (9) (0) 0 23 53 59 62 4950 State Capital Appropriations, Capital Gifts, and Other Changes in Net Position 17 8 11 32 - - - - - - - - 5152 Increase in Net Position 74 57 (2) (13) (18) (9) (0) 0 23 53 59 62
48
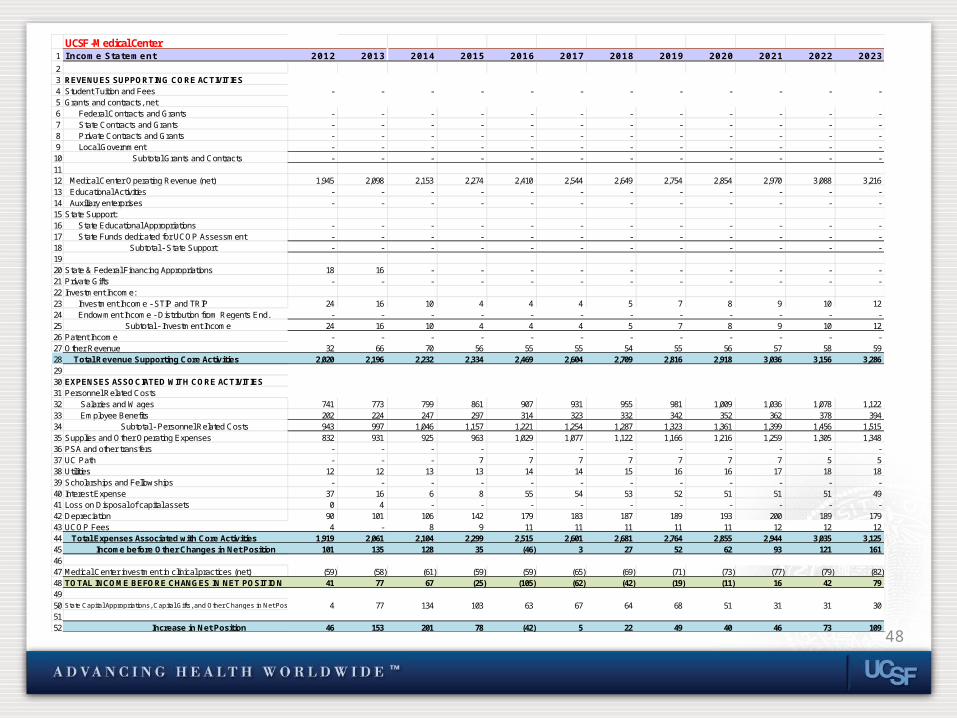
UCSF -Medical Center1 Income Statement 2012 2013 2014 2015 2016 2017 2018 2019 2020 2021 2022 202323 REVENUES SUPPORTING CORE ACTIVITIES4 Student Tuition and Fees - - - - - - - - - - - - 5 Grants and contracts, net6 Federal Contracts and Grants - - - - - - - - - - - - 7 State Contracts and Grants - - - - - - - - - - - - 8 Private Contracts and Grants - - - - - - - - - - - - 9 Local Government - - - - - - - - - - - -
10 Subtotal Grants and Contracts - - - - - - - - - - - - 1112 Medical Center Operating Revenue (net) 1,945 2,098 2,153 2,274 2,410 2,544 2,649 2,754 2,854 2,970 3,088 3,216 13 Educational Activities - - - - - - - - - - - - 14 Auxiliary enterprises - - - - - - - - - - - - 15 State Support:16 State Educational Appropriations - - - - - - - - - - - - 17 State Funds dedicated for UCOP Assessment - - - - - - - - - - - - 18 Subtotal - State Support - - - - - - - - - - - - 1920 State & Federal Financing Appropriations 18 16 - - - - - - - - - - 21 Private Gifts - - - - - - - - - - - - 22 Investment Income:23 Investment Income - STIP and TRIP 24 16 10 4 4 4 5 7 8 9 10 12 24 Endowment Income - Distribution from Regents End. - - - - - - - - - - - - 25 Subtotal - Investment Income 24 16 10 4 4 4 5 7 8 9 10 12 26 Patent Income - - - - - - - - - - - - 27 Other Revenue 32 66 70 56 55 55 54 55 56 57 58 59 28 Total Revenue Supporting Core Activities 2,020 2,196 2,232 2,334 2,469 2,604 2,709 2,816 2,918 3,036 3,156 3,286 2930 EXPENSES ASSOCIATED WITH CORE ACTIVITIES31 Personnel Related Costs32 Salaries and Wages 741 773 799 861 907 931 955 981 1,009 1,036 1,078 1,122 33 Employee Benefits 202 224 247 297 314 323 332 342 352 362 378 394 34 Subtotal - Personnel Related Costs 943 997 1,046 1,157 1,221 1,254 1,287 1,323 1,361 1,399 1,456 1,515 35 Supplies and Other Operating Expenses 832 931 925 963 1,029 1,077 1,122 1,166 1,216 1,259 1,305 1,348 36 PSA and other transfers - - - - - - - - - - - - 37 UC Path - - - 7 7 7 7 7 7 7 5 5 38 Utilities 12 12 13 13 14 14 15 16 16 17 18 18 39 Scholarships and Fellowships - - - - - - - - - - - - 40 Interest Expense 37 16 6 8 55 54 53 52 51 51 51 49 41 Loss on Disposal of capital assets 0 4 - - - - - - - - - - 42 Depreciation 90 101 106 142 179 183 187 189 193 200 189 179 43 UCOP Fees 4 - 8 9 11 11 11 11 11 12 12 12 44 Total Expenses Associated with Core Activities 1,919 2,061 2,104 2,299 2,515 2,601 2,681 2,764 2,855 2,944 3,035 3,125 45 Income before Other Changes in Net Position 101 135 128 35 (46) 3 27 52 62 93 121 161 4647 Medical Center investment in clinical practices (net) (59) (58) (61) (59) (59) (65) (69) (71) (73) (77) (79) (82) 48 TOTAL INCOME BEFORE CHANGES IN NET POSITION 41 77 67 (25) (105) (62) (42) (19) (11) 16 42 79 4950 State Capital Appropriations, Capital Gifts, and Other Changes in Net Position 4 77 134 103 63 67 64 68 51 31 31 30 5152 Increase in Net Position 46 153 201 78 (42) 5 22 49 40 46 73 109
49
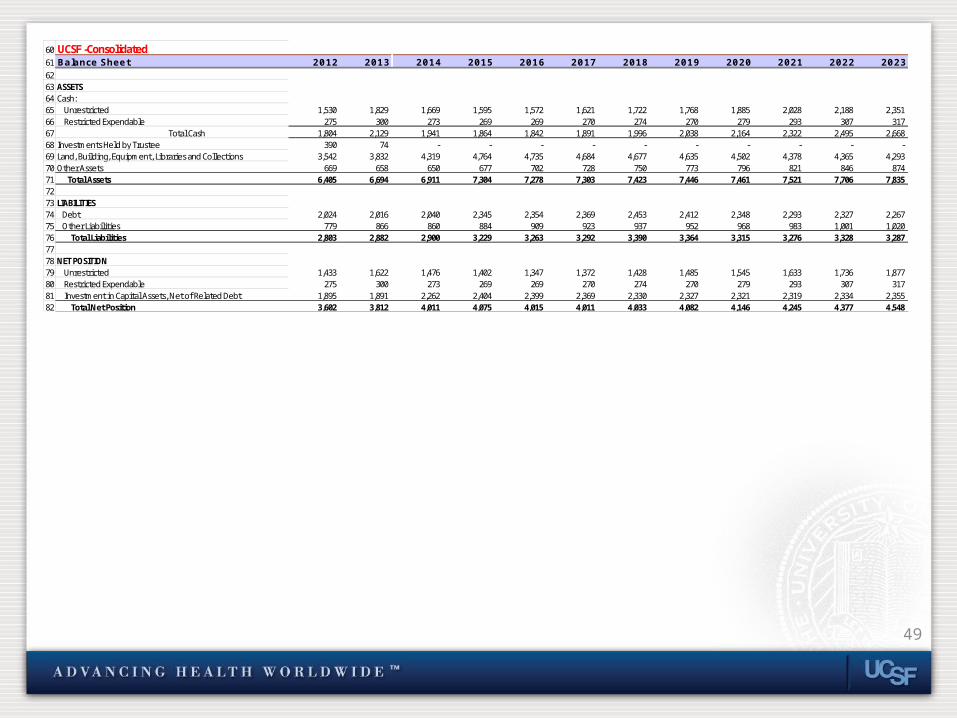
60 UCSF -Consolidated61 Balance Sheet 2012 2013 2014 2015 2016 2017 2018 2019 2020 2021 2022 20236263 ASSETS64 Cash:65 Unrestricted 1,530 1,829 1,669 1,595 1,572 1,621 1,722 1,768 1,885 2,028 2,188 2,351 66 Restricted Expendable 275 300 273 269 269 270 274 270 279 293 307 317 67 Total Cash 1,804 2,129 1,941 1,864 1,842 1,891 1,996 2,038 2,164 2,322 2,495 2,668 68 Investments Held by Trustee 390 74 - - - - - - - - - - 69 Land, Building, Equipment, Libraries and Collections 3,542 3,832 4,319 4,764 4,735 4,684 4,677 4,635 4,502 4,378 4,365 4,293 70 Other Assets 669 658 650 677 702 728 750 773 796 821 846 874 71 Total Assets 6,405 6,694 6,911 7,304 7,278 7,303 7,423 7,446 7,461 7,521 7,706 7,835 7273 LIABILITIES74 Debt 2,024 2,016 2,040 2,345 2,354 2,369 2,453 2,412 2,348 2,293 2,327 2,267 75 Other Liabilities 779 866 860 884 909 923 937 952 968 983 1,001 1,020 76 Total Liabilities 2,803 2,882 2,900 3,229 3,263 3,292 3,390 3,364 3,315 3,276 3,328 3,287 7778 NET POSITION79 Unrestricted 1,433 1,622 1,476 1,402 1,347 1,372 1,428 1,485 1,545 1,633 1,736 1,877 80 Restricted Expendable 275 300 273 269 269 270 274 270 279 293 307 317 81 Investment in Capital Assets, Net of Related Debt 1,895 1,891 2,262 2,404 2,399 2,369 2,330 2,327 2,321 2,319 2,334 2,355 82 Total Net Position 3,602 3,812 4,011 4,075 4,015 4,011 4,033 4,082 4,146 4,245 4,377 4,548
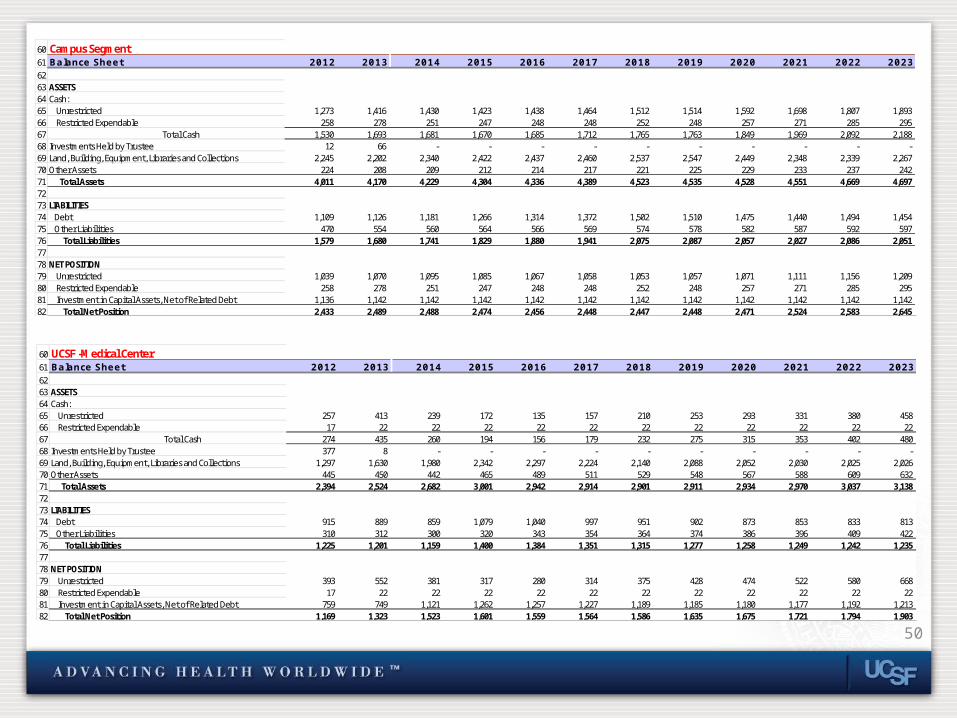
50
60 Campus Segment61 Balance Sheet 2012 2013 2014 2015 2016 2017 2018 2019 2020 2021 2022 20236263 ASSETS64 Cash:65 Unrestricted 1,273 1,416 1,430 1,423 1,438 1,464 1,512 1,514 1,592 1,698 1,807 1,893 66 Restricted Expendable 258 278 251 247 248 248 252 248 257 271 285 295 67 Total Cash 1,530 1,693 1,681 1,670 1,685 1,712 1,765 1,763 1,849 1,969 2,092 2,188 68 Investments Held by Trustee 12 66 - - - - - - - - - - 69 Land, Building, Equipment, Libraries and Collections 2,245 2,202 2,340 2,422 2,437 2,460 2,537 2,547 2,449 2,348 2,339 2,267 70 Other Assets 224 208 209 212 214 217 221 225 229 233 237 242 71 Total Assets 4,011 4,170 4,229 4,304 4,336 4,389 4,523 4,535 4,528 4,551 4,669 4,697 7273 LIABILITIES74 Debt 1,109 1,126 1,181 1,266 1,314 1,372 1,502 1,510 1,475 1,440 1,494 1,454 75 Other Liabilities 470 554 560 564 566 569 574 578 582 587 592 597 76 Total Liabilities 1,579 1,680 1,741 1,829 1,880 1,941 2,075 2,087 2,057 2,027 2,086 2,051 7778 NET POSITION79 Unrestricted 1,039 1,070 1,095 1,085 1,067 1,058 1,053 1,057 1,071 1,111 1,156 1,209 80 Restricted Expendable 258 278 251 247 248 248 252 248 257 271 285 295 81 Investment in Capital Assets, Net of Related Debt 1,136 1,142 1,142 1,142 1,142 1,142 1,142 1,142 1,142 1,142 1,142 1,142 82 Total Net Position 2,433 2,489 2,488 2,474 2,456 2,448 2,447 2,448 2,471 2,524 2,583 2,645
60 UCSF -Medical Center61 Balance Sheet 2012 2013 2014 2015 2016 2017 2018 2019 2020 2021 2022 20236263 ASSETS64 Cash:65 Unrestricted 257 413 239 172 135 157 210 253 293 331 380 458 66 Restricted Expendable 17 22 22 22 22 22 22 22 22 22 22 22 67 Total Cash 274 435 260 194 156 179 232 275 315 353 402 480 68 Investments Held by Trustee 377 8 - - - - - - - - - - 69 Land, Building, Equipment, Libraries and Collections 1,297 1,630 1,980 2,342 2,297 2,224 2,140 2,088 2,052 2,030 2,025 2,026 70 Other Assets 445 450 442 465 489 511 529 548 567 588 609 632 71 Total Assets 2,394 2,524 2,682 3,001 2,942 2,914 2,901 2,911 2,934 2,970 3,037 3,138 7273 LIABILITIES74 Debt 915 889 859 1,079 1,040 997 951 902 873 853 833 813 75 Other Liabilities 310 312 300 320 343 354 364 374 386 396 409 422 76 Total Liabilities 1,225 1,201 1,159 1,400 1,384 1,351 1,315 1,277 1,258 1,249 1,242 1,235 7778 NET POSITION79 Unrestricted 393 552 381 317 280 314 375 428 474 522 580 668 80 Restricted Expendable 17 22 22 22 22 22 22 22 22 22 22 22 81 Investment in Capital Assets, Net of Related Debt 759 749 1,121 1,262 1,257 1,227 1,189 1,185 1,180 1,177 1,192 1,213 82 Total Net Position 1,169 1,323 1,523 1,601 1,559 1,564 1,586 1,635 1,675 1,721 1,794 1,903
51
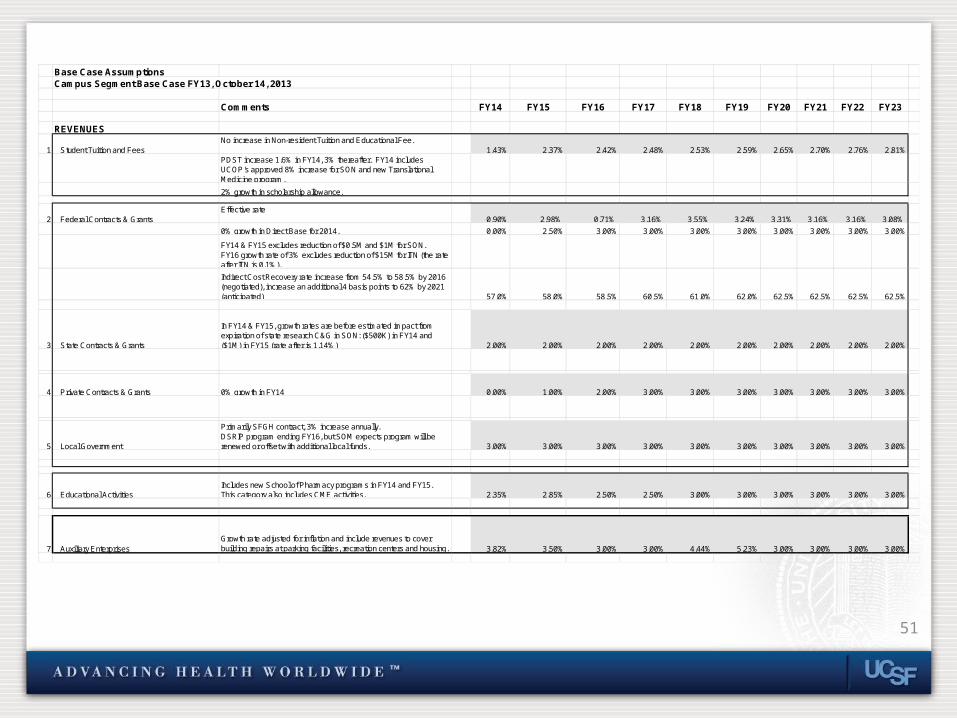
Base Case Assumptions Campus Segment Base Case FY13, October 14, 2013
Comments FY14 FY15 FY16 FY17 FY18 FY19 FY20 FY21 FY22 FY23
REVENUES
1 Student Tuition and FeesNo increase in Non-resident Tuition and Educational Fee.
1.43% 2.37% 2.42% 2.48% 2.53% 2.59% 2.65% 2.70% 2.76% 2.81%PDST increase 1.6% in FY14, 3% thereafter. FY14 includes UCOP's approved 8% increase for SON and new Translational Medicine program.
2% growth in scholarship allowance.
2 Federal Contracts & GrantsEffective rate
0.90% 2.98% 0.71% 3.16% 3.55% 3.24% 3.31% 3.16% 3.16% 3.08%
0% growth in Direct Base for 2014. 0.00% 2.50% 3.00% 3.00% 3.00% 3.00% 3.00% 3.00% 3.00% 3.00%
FY14 & FY15 excludes reduction of $0.5M and $1M for SON. FY16 growth rate of 3% excludes reduction of $15M for ITN (the rate after ITN is 0.1%).
Indirect Cost Recovery rate increase from 54.5% to 58.5% by 2016 (negotiated), increase an additional 4 basis points to 62% by 2021 (anticipated) 57.0% 58.0% 58.5% 60.5% 61.0% 62.0% 62.5% 62.5% 62.5% 62.5%
3 State Contracts & Grants
In FY14 & FY15, growth rates are before estimated impact from expiration of state research C&G in SON: ($500K) in FY14 and ($1M) in FY15 (rate after is 1.14%) 2.00% 2.00% 2.00% 2.00% 2.00% 2.00% 2.00% 2.00% 2.00% 2.00%
4 Private Contracts & Grants 0% growth in FY14 0.00% 1.00% 2.00% 3.00% 3.00% 3.00% 3.00% 3.00% 3.00% 3.00%
5 Local Government
Primarily SFGH contract, 3% increase annually.DSRIP program ending FY16, but SOM expects program will be renewed or offset with additional local funds. 3.00% 3.00% 3.00% 3.00% 3.00% 3.00% 3.00% 3.00% 3.00% 3.00%
6 Educational ActivitiesIncludes new School of Pharmacy programs in FY14 and FY15. This category also includes CME activities. 2.35% 2.85% 2.50% 2.50% 3.00% 3.00% 3.00% 3.00% 3.00% 3.00%
7 Auxiliary EnterprisesGrowth rate adjusted for inflation and include revenues to cover building repairs at parking facilities, recreation centers and housing. 3.82% 3.50% 3.00% 3.00% 4.44% 5.23% 3.00% 3.00% 3.00% 3.00%
52
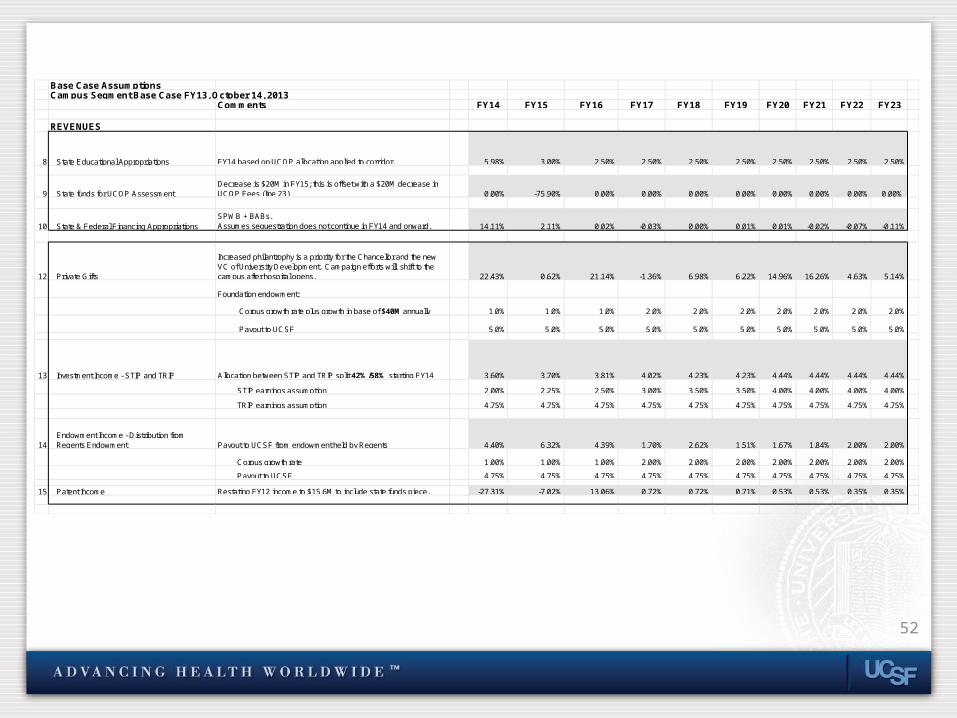
Base Case Assumptions Campus Segment Base Case FY13, October 14, 2013
Comments FY14 FY15 FY16 FY17 FY18 FY19 FY20 FY21 FY22 FY23
REVENUES
8 State Educational Appropriations FY14 based on UCOP allocation applied to corridor. 5.98% 3.00% 2.50% 2.50% 2.50% 2.50% 2.50% 2.50% 2.50% 2.50%
9 State funds for UCOP AssessmentDecrease is $20M in FY15; this is offset with a $20M decrease in UCOP Fees (line 23) 0.00% -75.90% 0.00% 0.00% 0.00% 0.00% 0.00% 0.00% 0.00% 0.00%
10 State & Federal Financing AppropriationsSPWB + BABs.Assumes sequestration does not continue in FY14 and onward. 14.11% 2.11% 0.02% -0.03% 0.00% 0.01% 0.01% -0.02% -0.07% -0.11%
12 Private Gifts
Increased philantrophy is a priority for the Chancellor and the new VC of University Development. Campaign efforts will shift to the campus after hospital opens. 22.43% 0.62% 21.14% -1.36% 6.98% 6.22% 14.96% 16.26% 4.63% 5.14%
Foundation endowment:
Corpus growth rate plus growth in base of $40M annually 1.0% 1.0% 1.0% 2.0% 2.0% 2.0% 2.0% 2.0% 2.0% 2.0%
Payout to UCSF 5.0% 5.0% 5.0% 5.0% 5.0% 5.0% 5.0% 5.0% 5.0% 5.0%
13 Investment Income - STIP and TRIP Allocation between STIP and TRIP split 42%/58% starting FY14 3.60% 3.70% 3.81% 4.02% 4.23% 4.23% 4.44% 4.44% 4.44% 4.44%
STIP earnings assumption 2.00% 2.25% 2.50% 3.00% 3.50% 3.50% 4.00% 4.00% 4.00% 4.00%
TRIP earnings assumption 4.75% 4.75% 4.75% 4.75% 4.75% 4.75% 4.75% 4.75% 4.75% 4.75%
14Endowment Income - Distribution from Regents Endowment Payout to UCSF from endowment held by Regents 4.40% 6.32% 4.39% 1.70% 2.62% 1.51% 1.67% 1.84% 2.00% 2.00%
Corpus growth rate 1.00% 1.00% 1.00% 2.00% 2.00% 2.00% 2.00% 2.00% 2.00% 2.00%
Payout to UCSF 4.75% 4.75% 4.75% 4.75% 4.75% 4.75% 4.75% 4.75% 4.75% 4.75%
15 Patent Income Restating FY12 income to $15.6M to include state funds piece. -27.31% -7.02% 13.06% 0.72% 0.72% 0.71% 0.53% 0.53% 0.35% 0.35%
53
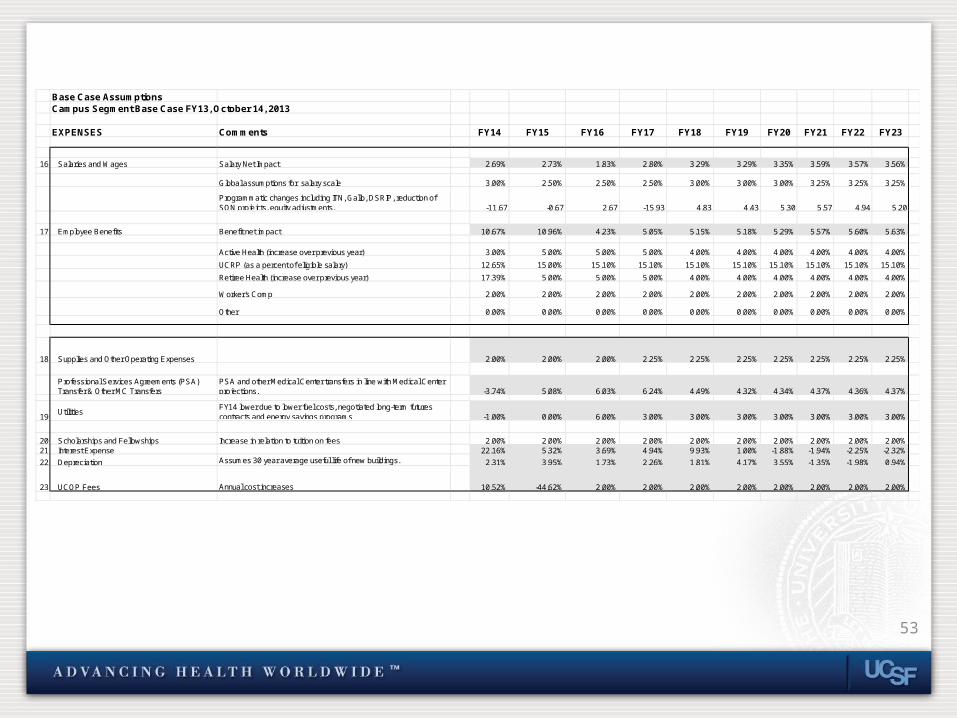
Base Case AssumptionsCampus Segment Base Case FY13, October 14, 2013
EXPENSES Comments FY14 FY15 FY16 FY17 FY18 FY19 FY20 FY21 FY22 FY23
16 Salaries and Wages Salary Net Impact 2.69% 2.73% 1.83% 2.80% 3.29% 3.29% 3.35% 3.59% 3.57% 3.56%
Global assumptions for salary scale 3.00% 2.50% 2.50% 2.50% 3.00% 3.00% 3.00% 3.25% 3.25% 3.25%
Programmatic changes including ITN, Gallo, DSRIP, reduction of SON projejcts, equity adjustments. -11.67 -0.67 2.67 -15.93 4.83 4.43 5.30 5.57 4.94 5.20
17 Employee Benefits Benefit net impact 10.67% 10.96% 4.23% 5.05% 5.15% 5.18% 5.29% 5.57% 5.60% 5.63%
Active Health (increase over previous year) 3.00% 5.00% 5.00% 5.00% 4.00% 4.00% 4.00% 4.00% 4.00% 4.00%
UCRP (as a percent of eligible salary) 12.65% 15.00% 15.10% 15.10% 15.10% 15.10% 15.10% 15.10% 15.10% 15.10%
Retiree Health (increase over previous year) 17.39% 5.00% 5.00% 5.00% 4.00% 4.00% 4.00% 4.00% 4.00% 4.00%
Worker's Comp 2.00% 2.00% 2.00% 2.00% 2.00% 2.00% 2.00% 2.00% 2.00% 2.00%
Other 0.00% 0.00% 0.00% 0.00% 0.00% 0.00% 0.00% 0.00% 0.00% 0.00%
18 Supplies and Other Operating Expenses 2.00% 2.00% 2.00% 2.25% 2.25% 2.25% 2.25% 2.25% 2.25% 2.25%
Professional Services Agreements (PSA) Transfer & Other MC Transfers
PSA and other Medical Center transfers in line with Medical Center projections. -3.74% 5.08% 6.03% 6.24% 4.49% 4.32% 4.34% 4.37% 4.36% 4.37%
19Utilities
FY14 lower due to lower fuel costs, negotiated long-term futures contracts and energy savings programs -1.00% 0.00% 6.00% 3.00% 3.00% 3.00% 3.00% 3.00% 3.00% 3.00%
20 Scholarships and Fellowships Increase in relation to tuition on fees 2.00% 2.00% 2.00% 2.00% 2.00% 2.00% 2.00% 2.00% 2.00% 2.00%21 Interest Expense 22.16% 5.32% 3.69% 4.94% 9.93% 1.00% -1.88% -1.94% -2.25% -2.32%
22 Depreciation Assumes 30 year average useful life of new buildings. 2.31% 3.95% 1.73% 2.26% 1.81% 4.17% 3.55% -1.35% -1.98% 0.94%
23 UCOP Fees Annual cost increases 10.52% -44.62% 2.00% 2.00% 2.00% 2.00% 2.00% 2.00% 2.00% 2.00%
54
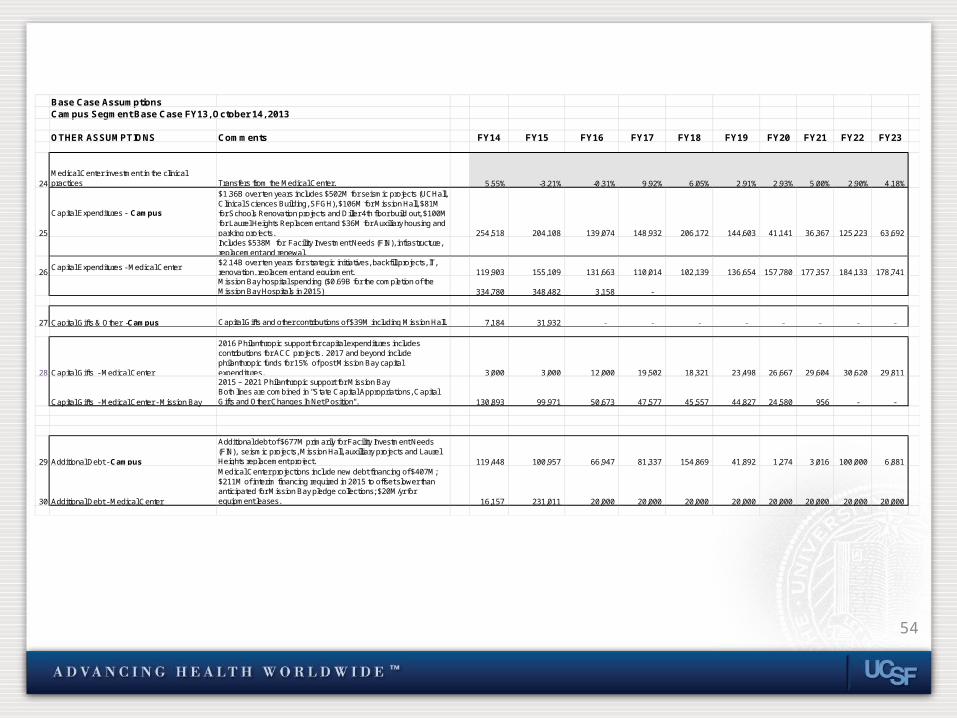
Base Case AssumptionsCampus Segment Base Case FY13, October 14, 2013
OTHER ASSUMPTIONS Comments FY14 FY15 FY16 FY17 FY18 FY19 FY20 FY21 FY22 FY23
24Medical Center investment in the clinical practices Transfers from the Medical Center. 5.55% -3.21% -0.31% 9.92% 6.05% 2.91% 2.93% 5.00% 2.90% 4.18%
25
Capital Expenditures - Campus
$1.36B over ten years includes $502M for seismic projects (UCHall, Clinical Sciences Building, SFGH), $106M for Mission Hall, $81M for Schools Renovation projects and Diller 4th floor build out, $100M for Laurel Heights Replacement and $36M for Auxiliary housing and parking projects. 254,518 204,108 139,074 148,932 206,172 144,603 41,141 36,367 125,223 63,692 Includes $538M for Facility Investment Needs (FIN), infrastructure, replacement and renewal.
26Capital Expenditures - Medical Center
$2.14B over ten years for strategic initiatives, backfill projects, IT, renovation, replacement and equipment. 119,903 155,109 131,663 110,014 102,139 136,654 157,780 177,357 184,133 178,741 Mission Bay hospital spending ($0.69B for the completion of the Mission Bay Hospitals in 2015) 334,780 348,482 3,158 -
27 Capital Gifts & Other -Campus Capital Gifts and other contributions of $39M including Mission Hall. 7,184 31,932 - - - - - - - -
28 Capital Gifts - Medical Center
2016 Philanthropic support for capital expenditures includes contributions for ACC projects. 2017 and beyond include philanthropic funds for 15% of post Mission Bay capital expenditures. 3,000 3,000 12,000 19,502 18,321 23,498 26,667 29,604 30,620 29,811
Capital Gifts - Medical Center - Mission Bay
2015 – 2021 Philanthropic support for Mission BayBoth lines are combined in "State Capital Appropriations, Capital Gifts and Other Changes In Net Position". 130,893 99,971 50,673 47,577 45,557 44,827 24,580 956 - -
29 Additional Debt - Campus
Additional debt of $677M primarily for Facility Investment Needs (FIN), seismic projects, Mission Hall, auxilliary projects and Laurel Heights replacement project. 119,448 100,957 66,947 81,337 154,869 41,892 1,274 3,016 100,000 6,881
30 Additional Debt - Medical Center
Medical Center projections include new debt financing of $407M; $211M of interim financing required in 2015 to offset slower than anticipated for Mission Bay pledge collections; $20M/yr for equipment leases. 16,157 231,011 20,000 20,000 20,000 20,000 20,000 20,000 20,000 20,000
Recommended