THIS REPORT CONTAINS ASSESSMENTS OF COMMODITY AND TRADE ISSUES MADE BY
USDA STAFF AND NOT NECESSARILY STATEMENTS OF OFFICIAL U.S. GOVERNMENT
POLICY
Date:
GAIN Report Number:
Approved By:
Prepared By:
Report Highlights:
Lifestyle changes due to urbanization and the increase in income levels have affected the consumption
patterns of Turkish consumers towards pre-processed and ready to eat products. This reflects positively
in the packaged food sector. The shift towards organized retailing has also opened the way for
imported brands. There is a growing demand for specialized products such as diabetic and diet
products, functional and frozen foods.
Meliha Atalaysun, Ag Marketing Assistant
Jess K. Paulson, Agricultural Attaché
2012 Food Processing Ingredients Report
Food Processing Ingredients
Turkey
12/31/2012
Required Report - public distribution
Post:
Table of Contents
I. MARKET SUMMARY .............................................................................................. 2 A. Economic Outlook .......................................................................................... 2 B. Consumer Trends .......................................................................................... 5
C. Advantages and Challenges Facing U.S. Exports ............................................ 6
II. MARKET STRUCTURE AND SUBSECTOR PROFILES ........................................... 8 A. Market Structure and Entry Strategy ............................................................ 8
B. Food Laws and Regulatory System ............................................................. 10
C. Import and Customs ................................................................................... 11
D. Company Profiles of Leading Processors ..................................................... 12
E. Sector Trends ............................................................................................. 17
F. Subsector Profiles ....................................................................................... 19
1. Red meat: ................................................................................................. 19 2. Packaged Food ........................................................................................... 20 3. Canned and Preserved Food ......................................................................... 22 4. Pultry
5. Fish and Seafood: ....................................................................................... 24 6. Processed Fruit and Vegetables: ................................................................... 24 7. Dairy products: .......................................................................................... 27 8. Flour and Flour based products: .................................................................... 28 9. Sugar and Confectionary: ............................................................................ 29 10. Beverages: .............................................................................................. 30 11. Specialized food ingredients: ...................................................................... 33
III. COMPETITION ................................................................................................ 33 IV. BEST MARKET PROSPECTS .............................................................................. 34 V. POST CONTACT AND FURTHER INFORMATION ................................................. 37
I. MARKET SUMMARY
A. Economic Outlook
Turkey managed to survive the global economic crisis of 2009 with only minor bruises. After the
economy shrank 5 percent economic in 2009, the economy grew by 8.9 percent in 2010. To control
the rate of growth, in 2011, the government took some steps to cool off the economy and bring it to a
‘soft landing’. As a result, after growing well above global trends in 2010 and 2011, the Turkish
economy has slowed to a more sustainable 3 percent growth rate in 2012. The International
Monetary Fund (IMF) has predicted in its latest review that Turkey’s economy will grow 3.5 percent
in 2013.
Growth has become more balanced, as domestic demand and imports decelerated on the back of
Ankara
tighter
monetary
and
macro-
prudential policies implemented in 2011. On the other hand, exports increased thanks to successful
diversification toward new markets. As decline in growth hit the demand for imports, and gold
exports increased, Turkey's trade deficit narrowed for the 11th consecutive month in September
2012. The gap (between imports and exports) declined to $6.8 billion from a record $10.5 billion for
the same period in 2011. The current account deficit shrank by 33 percent year-on-year in the 12
months to August. The ratio of the current account deficit - a soft spot of the Turkish economy - to
gross domestic product will be 7.5 percent this year and will drop to 7.2 percent in 2013, according
to IMF estimates.
In addition, Turkey's inflation rate fell in October 2012 to the lowest in 11 months as a slowing
economy outweighed the impact of government price increases on gas and electricity. Inflation
slowed to 7.8 percent from 9.2 percent the month before. The IMF expects inflation to fall to 6.2
percent in 2013 from an estimated rate of 7.5 percent this year, and the government targets a rate of 5
percent in 2015.
With a population of 75 million, Turkey’s Gross Domestic Product (GDP) reached US$ 761.9 billion
in 2011. The agriculture sector makes up 9 percent of Turkey’s GDP and 25 percent of its labor
force. In 2011, Turkish per capita income reached US$ 14,400.
A major economic development for Turkey in year 2012 has been the grade increase by Fitch
Ratings. As a result of all the above stated positive developments in the economy, Fitch upgraded
Turkey's grade to the investment grade (BBB-) in November, 2012. The outlooks on the long-term
ratings are stable as well. This presents the combination of an ease in short-term macro-financial
risks as the economy heads for a soft landing, and the underlying credit strengths including a
moderate and declining government debt burden, a sound banking system, favorable medium-term
growth prospects and a relatively wealthy and diverse economy.
This primarily means easier financing options for Turkish companies, but it is particularly important
to attract foreign investment as well.
Foreign capital inflow has already been increasing since 2004, partly due to the adaptation of a new
foreign direct investment law which abolishes permits granted by the General Directorate of Foreign
Investment. The law abolished additional regulations and bureaucratic procedures to establish a
foreign company, and the procedures are equal to those for local companies. The table below shows
the amount of FDI in the food sector since the enforcement of this law. The figures are in US
million dollars.
Sectors 2005 2006 2007 2008 2009 2010 2011

Agriculture, Hunting
and Forestry 5 5 6 23 48 77 31
Fisheries 2 1 3 18 1 5 0
Source: Turkish Central Bank
However, total foreign direct investment (FDI) inflow to Turkey contracted by 29.3 percent in the
first eight months of 2012 (January to August) over the same period in 2011, and came to $7.71
billion. Still, the food sector has been the second largest sector that foreign investors preferred in
Turkey. The food industry received $2.04 billion in FDI between January and August, which is a
drastic increase of 251 percent over the same period in 2011. There are currently 30 thousand
foreign capital companies in Turkey and 1224 of them are US companies.
Generally, the international capital inflow is through mergers and acquisitions with Turkish
companies. Entering the Turkish market with a local company is usually preferred because of the
complex nature of the country, both geographically and culturally. Distribution channels are of
crucial importance in Turkey, as the country is much larger in area than most other European
countries.
Also, geographical areas show different consumption trends. The three biggest cities, Istanbul,
Izmir and Ankara, -- especially Istanbul with a population of 17 million-- comprise the largest
portions of consumption. This trend changes in the summer, however, as tourists flood Southern and
Western Turkey. Moreover, due to severe income disparity among the regions, investors must
carefully analyze where to sell and to promote their. The economically disadvantaged and the
prosperous can live very close to each other, yet their lifestyles, purchasing, and consumption
patterns are sharply different. It is crucial to understand the Turkish market and internal dynamics
before entering.
Major Foreign Investors Operating in the Processed Food Sector in Turkey
Name of Company Food Sector Origin
Food, Beverage and Tobacco Production 68 608 766 1.252 196 123 649
Hotels and Restaurants 42 23 33 24 54 113 47
Coca-Cola Beverages U.S.A.
Pepsi Co. Beverages U.S.A.
Unilever Margarine, Veg. Oil, Ice Cream Netherlands
Cargill HFS U.S.A.
Nestlé Confectionary, Coffee, Cereals, Water, Baby Food Switzerland
Danone Dairy, Water, Mineral Water France
Cadbury Schweppes Confectionary, Chocolate and beverages UK
Kraft Snack food, Coffee, Chocolate, Vegetable oil U.S.A.
Carlsberg Beer Netherlands
Frito-Lay Snack food Netherlands
Haribo Confectionary Germany
CP Poultry Thailand
Perfetti van Melle Chewing gum and candy Italy
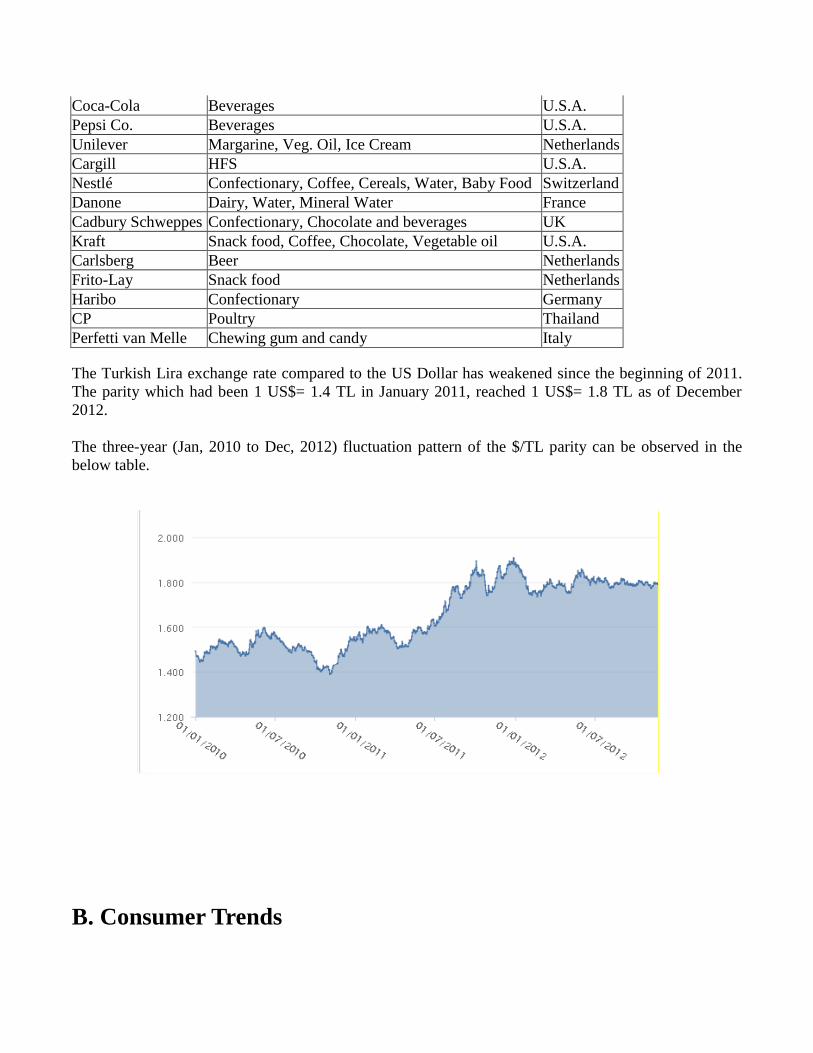
The Turkish Lira exchange rate compared to the US Dollar has weakened since the beginning of 2011.
The parity which had been 1 US$= 1.4 TL in January 2011, reached 1 US$= 1.8 TL as of December
2012.
The three-year (Jan, 2010 to Dec, 2012) fluctuation pattern of the $/TL parity can be observed in the
below table.
B. Consumer Trends
Food expenditures in Turkey account for about 20 percent of household consumption, compared to 10
percent in developed countries. Therefore, the fast moving consumer goods (FMCG - products that are
sold quickly and at relatively low cost, i.e., non-durable goods such as soft drinks, toiletries, and grocery
items) sector was one of the least affected sectors by the economic crisis of 2009.
Turkey’s population is 75 million, and half of the population is below the age of 30. A young
population is an important advantage for the processed food sector, and represents great consumption
growth potential as the economy improves. The rate of urbanization continued its increase and reached
77 percent in 2012. 58 million Turks live in cities. Meanwhile, household size has decreased
substantially from 5.5 to 4.5 individuals per household between 1978 and 2000 in big cities like Istanbul
(population 14 million), Ankara (5 million), Izmir (4 million), Bursa (2.7 million) and Adana, Antalya
and Konya (each have a population of about 2 million).
Major changes in the lifestyles, income, and consumption patterns of Turks in the last decade have
increased the tendency to dine and socialize over food outside of the home. A new and faster pace of
life has led people to find quicker meal solutions for their shortened lunch hours. An increasing number
of fast food chains and restaurants in newly established shopping centers and hypermarket complexes
are growing evidence of newly emerging demand which positively affects the processed food market.
Food manufacturers are now using sophisticated marketing methods in order to rapidly take advantage
of changing consumption patterns.
The share of working women has increased to 30 percent of the total workforce and as a result cooking
at home has decreased, and recreational and social dining has increased. More working women also
increase the demand for pre-packed, easy to cook meals.
Turkey is expected to have a reduced household size in the future. Young Turks and rapid urbanization
in major cities positively affect the processed food market as shopping habits shift from open farmers’
markets to packaged and processed food sold in supermarkets.
Urbanization and increased income coupled with higher education levels in large cities also created a
new demand for the health-products market. Manufacturers of packaged and processed food answered
this demand with new product lines aimed specifically at this group of health conscious customers.
Turkey also has a strong and growing tourism industry. The number of foreign tourists (mostly
European) visiting Turkey in the first 8 months of 2012 reached 21.8 million. This number is predicted
to exceed 30 million by the end of the year.
C. Advantages and Challenges Facing U.S. Exports
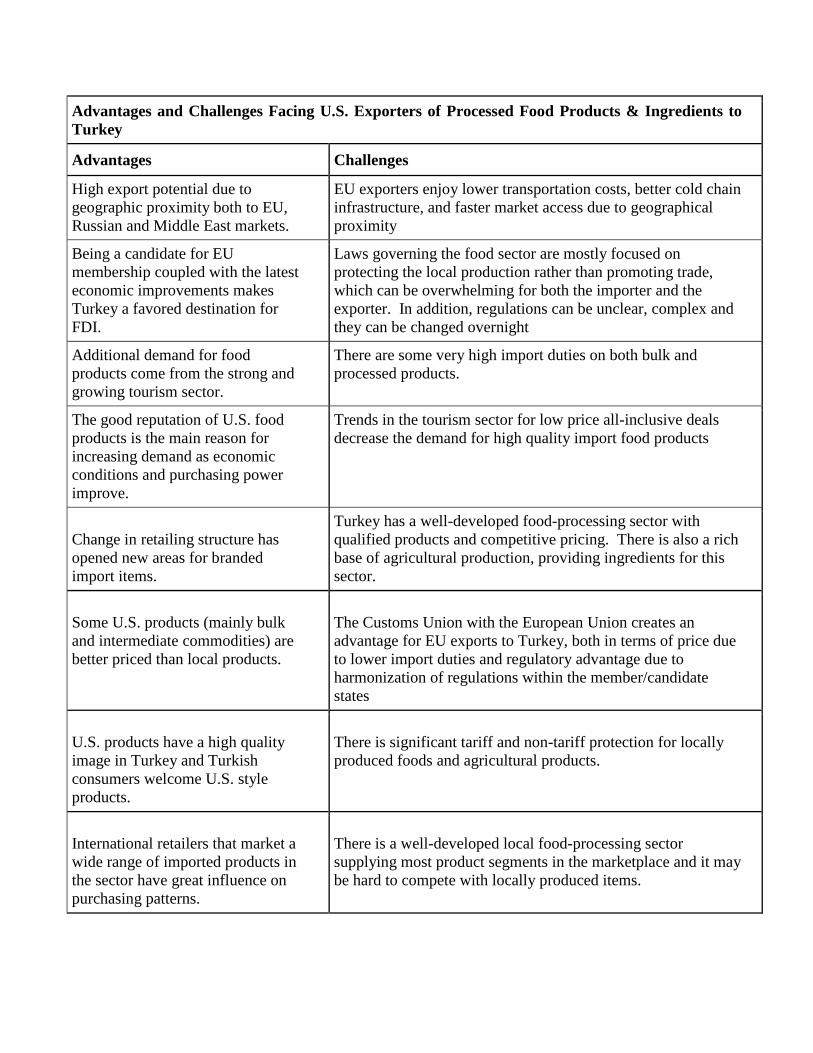
Advantages and Challenges Facing U.S. Exporters of Processed Food Products & Ingredients to
Turkey
Advantages Challenges
High export potential due to
geographic proximity both to EU,
Russian and Middle East markets.
EU exporters enjoy lower transportation costs, better cold chain
infrastructure, and faster market access due to geographical
proximity
Being a candidate for EU
membership coupled with the latest
economic improvements makes
Turkey a favored destination for
FDI.
Laws governing the food sector are mostly focused on
protecting the local production rather than promoting trade,
which can be overwhelming for both the importer and the
exporter. In addition, regulations can be unclear, complex and
they can be changed overnight
Additional demand for food
products come from the strong and
growing tourism sector.
There are some very high import duties on both bulk and
processed products.
The good reputation of U.S. food
products is the main reason for
increasing demand as economic
conditions and purchasing power
improve.
Trends in the tourism sector for low price all-inclusive deals
decrease the demand for high quality import food products
Change in retailing structure has
opened new areas for branded
import items.
Turkey has a well-developed food-processing sector with
qualified products and competitive pricing. There is also a rich
base of agricultural production, providing ingredients for this
sector.
Some U.S. products (mainly bulk
and intermediate commodities) are
better priced than local products.
The Customs Union with the European Union creates an
advantage for EU exports to Turkey, both in terms of price due
to lower import duties and regulatory advantage due to
harmonization of regulations within the member/candidate
states
U.S. products have a high quality
image in Turkey and Turkish
consumers welcome U.S. style
products.
There is significant tariff and non-tariff protection for locally
produced foods and agricultural products.
International retailers that market a
wide range of imported products in
the sector have great influence on
purchasing patterns.
There is a well-developed local food-processing sector
supplying most product segments in the marketplace and it may
be hard to compete with locally produced items.
As the processed food market
continues to grow, so does the
demand for food ingredients and
they are mostly imported.
In the retail stores, competition for shelf space has led to high
costs for introducing new products.
II. MARKET STRUCTURE AND SUBSECTOR PROFILES
A. Market Structure and Entry Strategy
There are over 40 thousand companies operating in the Turkish food sector, generating TL 64.6 billion
in 2011.
Retail is one of the fastest developing sectors in the Turkish economy. Industry sources estimate the
retail food market to be USD 100 billion. The share of traditional food sellers (that are mainly open-air
bazaars and mom-pop stores) decreased to 46 percent and the share of modern supermarkets increased to
54 percent.
50 percent of the fast moving consumer goods (FMCG) are sold through supermarkets. There are
currently 135 supermarket chains with 13,127 stores throughout Turkey as of November 2012. The
increased popularity of large-scale supermarkets allow greater variety of products at lower prices for the
consumers and thus drives the processed food market forward. For a more detailed description of the
retail sector, please refer to “Turkey Retail Sector Market” report TU7013 available on the FAS website:
http://gain.fas.usda.gov/Recent%20GAIN%20Publications/Retail%20Foods_Ankara_Turkey_1-3-
2012.pdf
Large food processors have direct access to ingredient suppliers, and they are generally direct importers.
On the other hand, small and medium sized processors, as well as the service sector (i.e. hotels,
restaurants, catering companies), supply their products/ingredients from importers who are also
wholesalers, and international company representatives or agents.
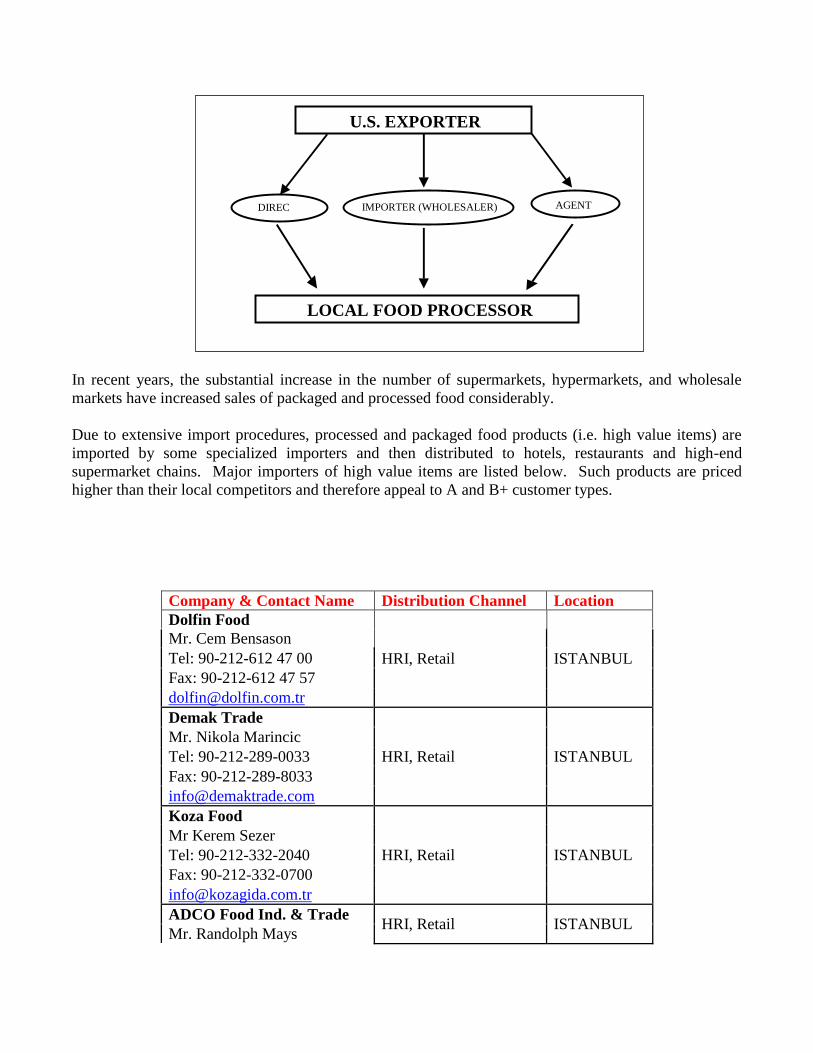
In recent years, the substantial increase in the number of supermarkets, hypermarkets, and wholesale
markets have increased sales of packaged and processed food considerably.
Due to extensive import procedures, processed and packaged food products (i.e. high value items) are
imported by some specialized importers and then distributed to hotels, restaurants and high-end
supermarket chains. Major importers of high value items are listed below. Such products are priced
higher than their local competitors and therefore appeal to A and B+ customer types.
Company & Contact Name Distribution Channel Location
Dolfin Food
HRI, Retail ISTANBUL
Mr. Cem Bensason
Tel: 90-212-612 47 00
Fax: 90-212-612 47 57
Demak Trade
HRI, Retail ISTANBUL
Mr. Nikola Marincic
Tel: 90-212-289-0033
Fax: 90-212-289-8033
Koza Food
HRI, Retail ISTANBUL
Mr Kerem Sezer
Tel: 90-212-332-2040
Fax: 90-212-332-0700
ADCO Food Ind. & Trade HRI, Retail ISTANBUL
Mr. Randolph Mays
U.S. EXPORTER
DIREC
T IMPORTER (WHOLESALER)
AGENT
LOCAL FOOD PROCESSOR

Tel: 90-212-322-0400
Fax: 90-212-322-0419
Impeks Food
HRI, Retail IZMIR
Mr. Ogunc Yuncu
Tel: 90-232-422-2622
Fax: 90-232-463-3370
Ekol Food
HRI, Retail ISTANBUL
Mr Onder Bilen
Tel: 90-212-321-3171
Fax: 90-212-321-4977
B. Food Laws and Regulatory System
The Ministry of Agriculture and Rural Affairs changed its name to Ministry of Food, Agriculture and
Livestock in 2011. Under this ministry, the Food and Control Directorate (FCD) has primary
responsibility for regulating imports of food and beverages, and their packaging materials. The
nutritional and dietary supplements are also regulated by FCD.
The legal infrastructure of agriculture is mainly based on communiqués rather than on laws. The reason
for this is that laws outline the general principles initially and later communiqués define the application
procedures of the relevant law. Turkish agriculture-related regulations are available in English on the
following Ministry website: http://www.tarim.gov.tr/en/plants-and-plant-products.
Currently Turkey’s principle law governing food is the, “Production, Consumption and Inspection of
Food” law (No. 5179) which has been in force since May 27, 2004. The purpose of this law is to
provide food safety, to assure the hygienic production of all food products and food packaging materials,
to protect public health, to establish the minimum technical and hygienic criteria for food producers, and
to set forth the principles of monitoring production and distribution. This law has resulted in the
creation of the National Food Codex Commission, the responsibility of which is to prepare, review and
approve all changes to the Turkish Food Codex, including those changes that take place through EU
harmonization.
The communiqué on the regulation of food ingredients can be found at:
http://www.gkgm.gov.tr/mevzuat/kodeks/kodeks_yonetmelik/gida_katki_maddeleri_yonetmelik.html.
This link is to the official FCD web site, therefore the communiqué is in Turkish.
One of the most important regulations that U.S. exporters should watch is the bio-safety regulation. As
per the bio-safety regulation, imported food items for human consumption cannot have any genetically
engineered (GE) content. Import of GE soy and some GE corn genes are currently allowed only for feed
use. No GE traits are approved for food use or cultivation in Turkey. For more information about the
bio-safety situation in Turkey, please refer to the relative GAIN report is available at:
http://gain.fas.usda.gov/Recent%20GAIN%20Publications/Agricultural%20Biotechnology%20Annual_
Ankara_Turkey_7-13-2012.pdf.
Another important regulation is the labeling regulation. Current legislation in Turkey prohibits
statements on packages that would imply a health benefit of the product. Also, there cannot be any
wording which would state superiority over the competition. This restriction sometimes forces the
importer to ask for different packaging from the producer, or if that is not possible, the importer covers
the unpermitted phrases with a sticker.
Requirements and standards for some imported foods may be more strict than those currently applied in
the EU (biotechnology legislation for instance). For instance, the EU threshold for GE contamination is
defined as 0.1 percent, whereas it is not defined (i.e. 0 percent) for unapproved events in Turkey.
C. Import and Customs
Until 2012, the majority of food items required a “control certificate”. This is, in essence, an import
license that states whether the product is eligible for importing. As of 2012, however, with an attempt to
simplify and speed-up customs procedures, this process was replaced by an electronic system called the
Food Safety Information System (FSIS). As a result the control certificate is now required only for
animal products (such as butter, milk powder, lactose, etc.).
A further step towards this goal is expected to go into effect in 2013, and that is the specialization of
ports on certain types of products. This is expected to begin with plant based products (such as herbal
teas) and such products will be allowed to be imported through designated ports.
Currently the import procedure is as follows: the importer makes an online application at the FSIS
system before the products arrive. After the goods arrive at the port, the importer then applies to the
Provincial Agricultural Directorate (PAD) with hard copies of the health certificate, invoice and
ingredients list, and depending on the type of the product, the PAD decides whether the goods should be
sent for analysis or inspected from the label.
The label should bear the country of origin, production and expiration dates, importing and exporting
companies, ingredients and its gross and net weight. Depending on the type of product, the application
package might also include:
- An Analysis Report from a government agency or on the exporting company’s letterhead; providing
physical, chemical, microbiological and heavy metal specifications of the product imported. Frozen
seafood is exempt from this requirement.
- A sanitary or phytosanitary certificate from the public food inspection agency of the origin country for
consumer-ready products; stating that the product meets the phytosanitary requirements of the importing
country. This is normally a “Certificate of Free Sale” issued by a State authority which must indicate
that “the product was produced in accordance with local laws and regulations and is fit for human
consumption and is freely marketed in the country of origin”;
- For alcohol products, a “distribution certificate” provided by the producer’s company to the importer
and/or distributor indicating that the Turkish company is authorized to market and deliver the product in
Turkey;
Aromas are generally not subject to analysis. Packaging materials that are in contact with the food are
sent for analysis only for the first shipment, but products like modified starch and other products that
could include GE are always sent for analysis at each shipment.
For such analysis, Turkish Ministry of Agriculture officials take samples of the imported product and
send these to government accredited laboratories for physical, chemical and microbiological analysis
and confirm it matches the information supplied by the exporter.
In addition, if the foodstuff is a bulk or semi-processed commodity, it is checked by plant quarantine
specialists or veterinarians for consistency with the Plant Quarantine Law and Animal Health Law.
Results of the analysis usually take 3 to 5 working days, and the whole process is completed within 1 or
2 weeks, depending on the workload of the arrival port.
Import of foodstuff is allowed if the results of the analysis are found to be acceptable and consistent with
Turkish regulations. For a more detailed description of Turkey’s food regulatory system and import
process, please refer to the Food and Agricultural Import Regulations (FAIRS) report and Exporter
Guide report available o n the FAS website at:
http://gain.fas.usda.gov/Recent20GAIN%20Publications/Food%20and%20Agricultural%20Import%20
Regulations%20and%20Standards%20-%20Narrative_Ankara_Turkey_3-22-2012.pdf.
D. Company Profiles of Leading Processors
TURKEY: COMPANY PROFILES OF LEADING PROCESSORS
Sector and Company Name
End-use
Channel (Retail,
HRI, Wholesale)
Plant/Company
Location
Procurement
Channels
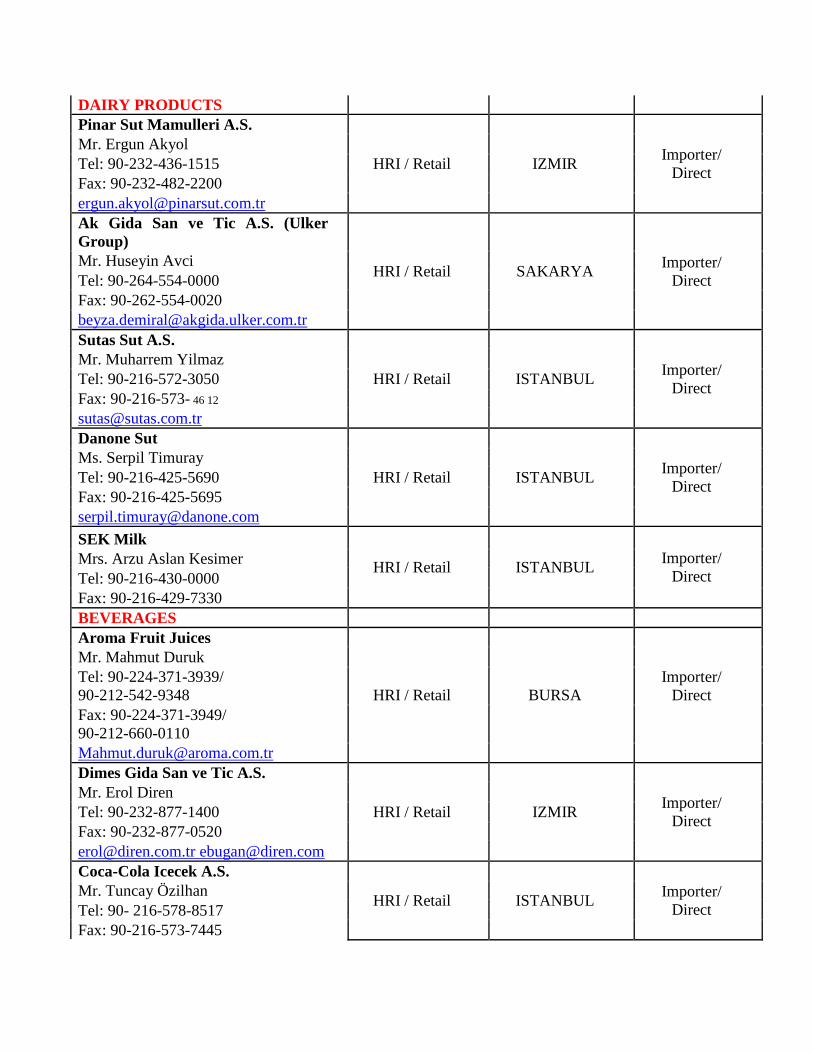
DAIRY PRODUCTS
Pinar Sut Mamulleri A.S.
HRI / Retail IZMIR Importer/
Direct
Mr. Ergun Akyol
Tel: 90-232-436-1515
Fax: 90-232-482-2200
Ak Gida San ve Tic A.S. (Ulker
Group)
HRI / Retail SAKARYA Importer/
Direct
Mr. Huseyin Avci
Tel: 90-264-554-0000
Fax: 90-262-554-0020
Sutas Sut A.S.
HRI / Retail ISTANBUL Importer/
Direct
Mr. Muharrem Yilmaz
Tel: 90-216-572-3050
Fax: 90-216-573- 46 12
Danone Sut
HRI / Retail ISTANBUL Importer/
Direct
Ms. Serpil Timuray
Tel: 90-216-425-5690
Fax: 90-216-425-5695
SEK Milk
HRI / Retail ISTANBUL Importer/
Direct Mrs. Arzu Aslan Kesimer
Tel: 90-216-430-0000
Fax: 90-216-429-7330
BEVERAGES
Aroma Fruit Juices
HRI / Retail BURSA
Importer/
Direct
Mr. Mahmut Duruk
Tel: 90-224-371-3939/
90-212-542-9348
Fax: 90-224-371-3949/
90-212-660-0110
Dimes Gida San ve Tic A.S.
HRI / Retail IZMIR Importer/
Direct
Mr. Erol Diren
Tel: 90-232-877-1400
Fax: 90-232-877-0520
[email protected] [email protected]
Coca-Cola Icecek A.S.
HRI / Retail ISTANBUL Importer/
Direct
Mr. Tuncay Özilhan
Tel: 90- 216-578-8517
Fax: 90-216-573-7445
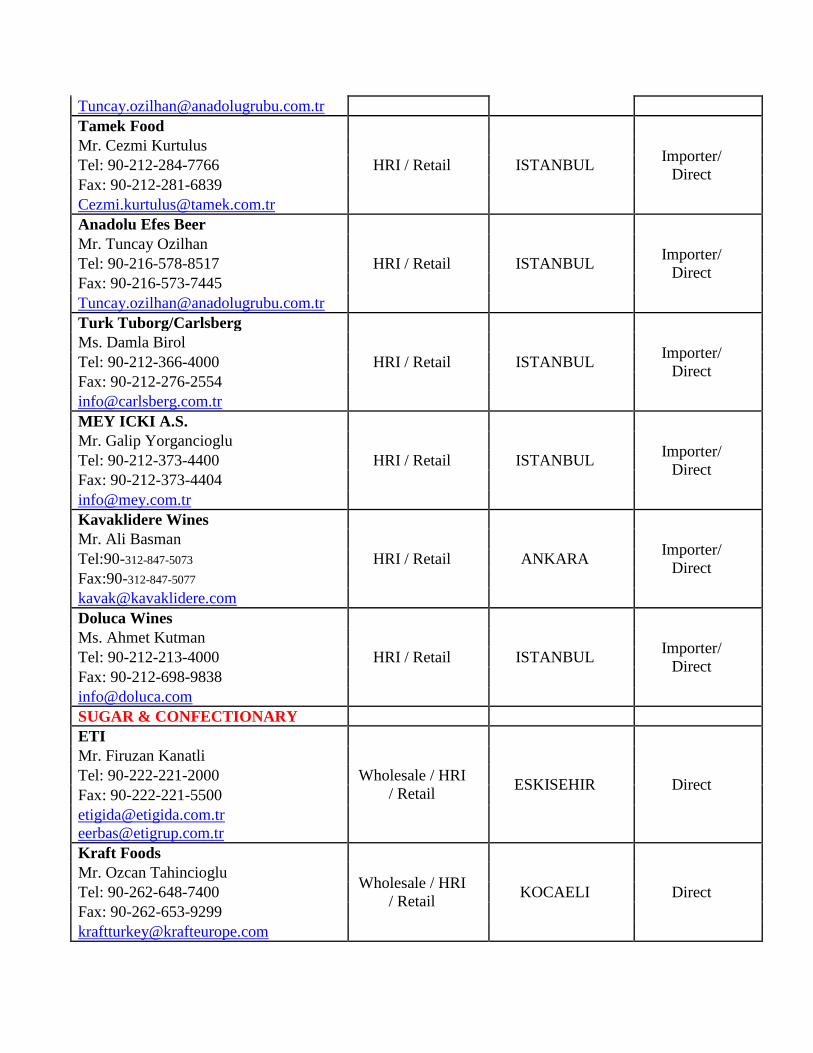
Tamek Food
HRI / Retail ISTANBUL Importer/
Direct
Mr. Cezmi Kurtulus
Tel: 90-212-284-7766
Fax: 90-212-281-6839
Anadolu Efes Beer
HRI / Retail ISTANBUL Importer/
Direct
Mr. Tuncay Ozilhan
Tel: 90-216-578-8517
Fax: 90-216-573-7445
Turk Tuborg/Carlsberg
HRI / Retail ISTANBUL Importer/
Direct
Ms. Damla Birol
Tel: 90-212-366-4000
Fax: 90-212-276-2554
MEY ICKI A.S.
HRI / Retail ISTANBUL Importer/
Direct
Mr. Galip Yorgancioglu
Tel: 90-212-373-4400
Fax: 90-212-373-4404
Kavaklidere Wines
HRI / Retail ANKARA Importer/
Direct
Mr. Ali Basman
Tel:90-312-847-5073
Fax:90-312-847-5077
Doluca Wines
HRI / Retail ISTANBUL Importer/
Direct
Ms. Ahmet Kutman
Tel: 90-212-213-4000
Fax: 90-212-698-9838
SUGAR & CONFECTIONARY
ETI
Wholesale / HRI
/ Retail ESKISEHIR Direct
Mr. Firuzan Kanatli
Tel: 90-222-221-2000
Fax: 90-222-221-5500
Kraft Foods
Wholesale / HRI
/ Retail KOCAELI Direct
Mr. Ozcan Tahincioglu
Tel: 90-262-648-7400
Fax: 90-262-653-9299

Ulker Gida San ve Tic A.S.
Wholesale / HRI
/ Retail ISTANBUL Direct
Mr. Murat Ulker
Tel: 90-216-524-2489
Fax: 90-212-481-2883
Nestle
Wholesale / HRI
/ Retail ISTANBUL Direct
Mr. Reinhold Jakobi
Tel:90-212-329-6000
Fax:90-212-329-6043
SEA FOOD
Dardanel Gida San A.S.
HRI, Retail ISTANBUL Direct
Mr. Niyazi Oren
Tel: 90-286-263-6666
Fax: 90-286-263-6686
Kerevitas
HRI, Retail ISTANBUL Direct
Mr. Ceyhun Caglar
Tel: 90-224-600-2000
Fax: 90-224-488-5208
Pinar Sea Food
HRI, Retail IZMIR Direct
Mr. Engin Ozturk
Tel: 90-232-726-0265
Fax: 90-232-726-0260
CANNED FOOD
Penguen Gida A.S.
Wholesale / HRI
/ Retail BURSA
Importer/
Direct
Mr.Aykan Sozucetin
Tel: 90-224-324-2424
Fax: 90-224-324-2425
Tamek Gida
Wholesale / HRI
/ Retail ISTANBUL
Importer/
Direct
Mr. Cezmi Kurtulus
Tel: 90-212-284-7766
Fax: 90-212-281-6839
Tukas
Wholesale / HRI
/ Retail IZMIR
Importer/
Direct
Mr. Semih Karadeniz
Tel: 90- 232 865 15 55
Fax: 90- 232 865 11 45
Tat Cannery Wholesale / HRI ISTANBUL Importer/

Mrs. Arzu Aslan Kesimer / Retail Direct
Tel: 90- 216-430-0000
Fax: 90-216-429-7330
Kerevitas
Wholesale / HRI
/ Retail ISTANBUL
Importer/
Direct
Mr. Ceyhun Caglar
Tel: 90-224-600-2000
Fax: 90-212-488-5208
EDIBLE OILS
Edirne Yag Sanayi (Olin)
Wholesale / HRI
/ Retail EDIRNE
Importer/
Direct
Mr. Okyar Yayalar
Tel: 90-284- 235- 0630
90-212-325-4580
Fax: 90-284- 235-0620
90212-325-4579
Marsa Yag Sanayi A.S.
Wholesale / HRI
/ Retail ISTANBUL
Importer/
Direct
Mr. Adnan Ozsahin
Tel: 90-(0216) 570-1400
Fax: 90-0216) 577-4200
Trakya Birlik
Wholesale / HRI
/ Retail EDIRNE
Importer/
Direct
Mr. Rafet Sezen
Tel: 90-284-214-5522
Fax: 90-284-225-30 60
Orucoglu Yag San ve Tic A.S.
Wholesale / HRI
/ Retail AFYON
Importer/
Direct
Mr. Ercan Kara
Tel: 90-272-221-1133
Fax: 90-272-221-1132
MEAT & POULTRY PRODUCTS
Pinar (Red Meat & Turkey)
HRI, Retail IZMIR Direct
Mr. Zeki Ilgaz
Tel: 90-232-877-0900
Fax: 90-232-877-0930
Maret
HRI, Retail ISTANBUL Direct Mrs. Arzu Aslan Kesimer
Tel: 90-216-593-0270
Fax: 90-216-593-0291
Banvit (Poultry & Red Meat) HRI, Retail BALIKESIR Direct
Mr. Omer Gorener
Tel: 90-266-733-8600
Fax: 90-266-733-8618
Seker Poultry
HRI, Retail BALIKESIR Direct
Mr. Osman Bor
Tel: 90-266-733-8420
Fax: 90-266-733-8423
Keskinoglu Poultry
HRI, Retail MANISA Direct
Mr. Mehmet Keskinoglu
Tel: 90-236-427-2572
Fax: 90-236-427-2565
E. Sector Trends
Turkey is the world’s 7th
largest agriculture economy following China, U.S., India, Brazil, Japan and
Indonesia. According to FAO (Food and Agriculture Organization of the United Nations) data,
Turkey is the world’s leading producer of hazelnuts, apricots, figs, cherries, sour cherries, quinces,
raisins and poppy seeds. Turkey is also the second largest producer of melons, watermelons,
strawberries and leek; and the third largest producer of lentils, apples, cucumbers, green beans, green
peppers, chestnuts and pistachios.
Local agricultural products are the main input for the food-processing sector. Turkey has a developed
food processing industry and a rich agricultural base with diversified agricultural production. However,
when it comes to food ingredients, even though Turkey has the biggest sector in its region, it is very
import dependent.
According to the Turkish Federation of Food and Beverage Industry Associations, there are over 40
thousand registered operations in the food and beverage industry, producing TL 64.6 billion in food and
TL 5 billion in the beverage sectors. Turkish imports and exports of agricultural products were US$ 4.9
billion and US$ 8.9 billion in 2011 respectively.
Annual Import and Export figures of sub sectors in the F&B Sector (million US Dollars)
Imports Exports
2010 2011 2010 2011
Meat and Meat Products 592 1,038 243 436
Fish and fish products 185 194 192 242
Processed fruits and vegetables 167 250 2,446 2,729
Vegetable & animal fats and oils 1,113 1,843 457 1,011
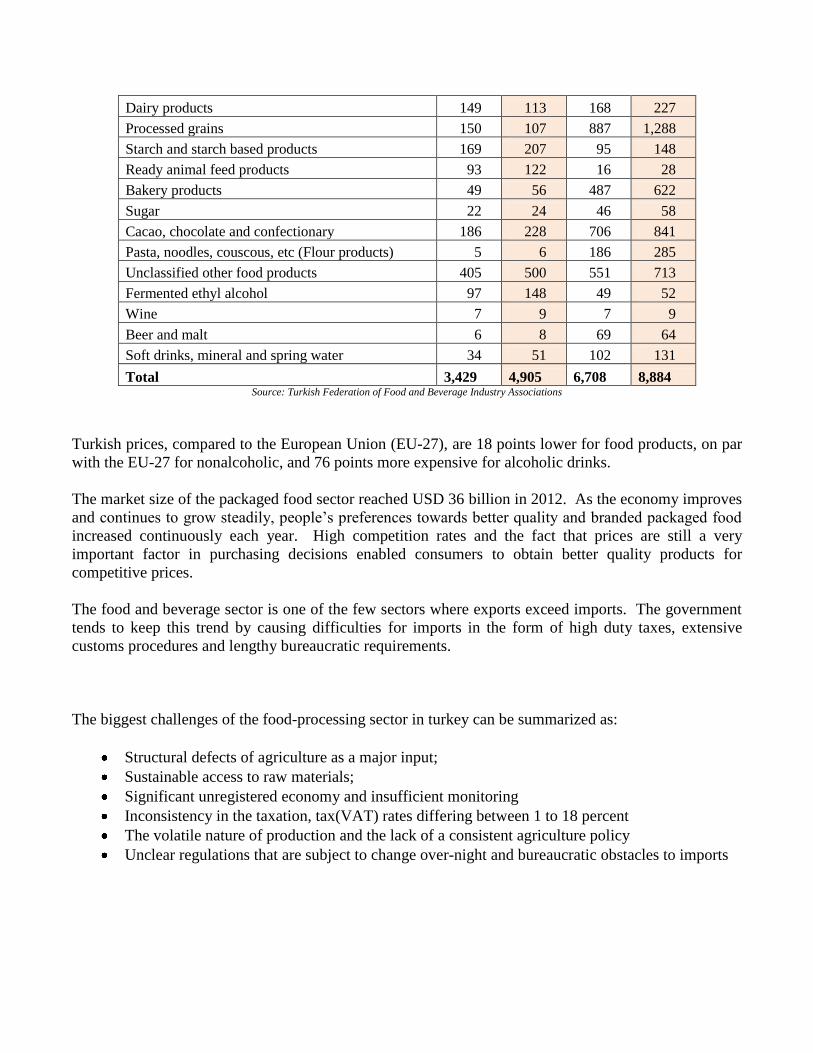
Dairy products 149 113 168 227
Processed grains 150 107 887 1,288
Starch and starch based products 169 207 95 148
Ready animal feed products 93 122 16 28
Bakery products 49 56 487 622
Sugar 22 24 46 58
Cacao, chocolate and confectionary 186 228 706 841
Pasta, noodles, couscous, etc (Flour products) 5 6 186 285
Unclassified other food products 405 500 551 713
Fermented ethyl alcohol 97 148 49 52
Wine 7 9 7 9
Beer and malt 6 8 69 64
Soft drinks, mineral and spring water 34 51 102 131
Total 3,429 4,905 6,708 8,884 Source: Turkish Federation of Food and Beverage Industry Associations
Turkish prices, compared to the European Union (EU-27), are 18 points lower for food products, on par
with the EU-27 for nonalcoholic, and 76 points more expensive for alcoholic drinks.
The market size of the packaged food sector reached USD 36 billion in 2012. As the economy improves
and continues to grow steadily, people’s preferences towards better quality and branded packaged food
increased continuously each year. High competition rates and the fact that prices are still a very
important factor in purchasing decisions enabled consumers to obtain better quality products for
competitive prices.
The food and beverage sector is one of the few sectors where exports exceed imports. The government
tends to keep this trend by causing difficulties for imports in the form of high duty taxes, extensive
customs procedures and lengthy bureaucratic requirements.
The biggest challenges of the food-processing sector in turkey can be summarized as:
Structural defects of agriculture as a major input;
Sustainable access to raw materials;
Significant unregistered economy and insufficient monitoring
Inconsistency in the taxation, tax(VAT) rates differing between 1 to 18 percent
The volatile nature of production and the lack of a consistent agriculture policy
Unclear regulations that are subject to change over-night and bureaucratic obstacles to imports
F. Subsector Profiles
1. Red meat:
Meat products in the Turkish market are fresh meat (beef, veal and sheep meat – pork consumption is
limited to tourism due to religion), frozen meat, processed meat products (smoked, canned, ready to eat),
prepared meatballs, and cured meats (sausages, salami). Pork is not consumed much due to religious
reasons, but is available at big supermarkets and some restaurants.
The number of livestock declined considerably in the past decade due to increased feed prices and
terrorism in the eastern regions of Turkey (where the mainstay of the population is husbandry). This
decline in the meat supply led to significant increases in meat prices (16.5 TL/kg) in the first months of
2010. In response to high red meat prices, the Turkish Council of Ministers announced an import quota
for 100,000 MT of live slaughter cattle and beef in 2010.
When this effort did not reduce meat prices, the customs duty for imported live fattening and
slaughtering cattle was decreased from 135 percent to 40 percent. The customs duty on live
slaughtering cattle was further reduced to 30 percent, and the import duty for live lamb (less than one
year old) was reduced from 135 percent to 20 percent. On the same day, the duty on red carcass meat
was reduced from 225 percent to 30 percent.
As a result, the carcass meat price dropped to 11-12 TL/kg in the first months of 2011 but it began to
increase again in June 2011, and reached a peak of 15 TL/kg in July 2011 due to high feed prices. A
major development that affected the feed sector was the enactment of the Biosafety Law in 2011. Due
to the new Biosafety Law, corn and soybean imports had intermittent access throughout 2011. Soybean
imports resumed in 2011, but biotech corn imports did not resume until 2012, and are hindered by
several prohibited GE traits.
On the other hand, high market prices also attracted local investors to enter the business. Combined
with a government incentive of 300 TL/head premium, many new actors from all sectors ranging from
textiles to construction started building livestock facilities. This process also helped to improve the
quality of breeding stocks.
In 2011, the increased number of domestic producers asked the government to either ban further meat
imports or increase the customs tax to 70 percent in order to protect their investments from competition
from imported meat. Eventually, the customs tax on carcass meat increased from 30 percent to 60
percent in the first half of 2011.
The 300 TL/head premium was then removed in July 2011 and the customs tax on carcass meat was
increased from 60 percent to 75 percent.
Turkish red meat consumption is 13 kg per person compared to 31 kg in the U.S. Turkish consumption
is expected to reach 20 kg in year 2023, and there is rising demand for high quality beef, particularly
from the tourism industry.
For a more detailed description of Turkey’s Livestock sector, please refer to the annual Livestock and
Products report TU7049 available at:
www.fas.usda.gov/gainfiles/200708/146292012.doc.
2. Packaged Food
The packaged food market has shown steady growth over recent years. The market size (in terms of
retail value) increased 27 percent from TL 51 billion in 2009 to TL 65 billion in 2012. Factors that
contributed to the growth in market size have been:
Development of functional foods aimed at health conscious consumers and new products
launches for this market.
Growth of organized retail sector like supermarkets, hypermarkets, wholesale markets, and
discount supermarkets and improvements in the distribution sector, accordingly.
Sophisticated marketing activities of packaged food manufacturers.
Consumers remain price sensitive, forcing manufacturers to keep their price increases at a minimum,
forcing them to keep their focus on offers and discounting in order to maintain retail volume sales.
The share of artisanal products constitute more than 50 percent of the total sales value, although this
stems from the dominant retail value share of artisanal bread, pastries, cakes and yoghurt. On the other
hand, a large number of new products have been launched in the past 2 years to boost consumer demand.
The highest number of new launches has been in chocolate confectionery, biscuits, packaged cakes and
ice cream. These products were not only targeted at children, as they had been earlier, but also towards
adults. They are increasingly considered as snacks and are in demand from office workers and students
in particular.
In line with the increased health and wellness trend, the number of products designed to cater to this
trend continued to increase during the last several years. Such products include organic milk and dairy
products by Pinar, probiotic yoghurts by Danone, Kalbim brand line of functional spreadable oils, and
fats by Yildiz Holding.
Yildiz Holding is the leader in packaged food with their major brand line Ulker. Having a presence in
most sectors and a vertically integrated distribution system spread throughout the country, this Turkish
company enjoys the highest level of brand recognition among consumers. Unilever follows Yildiz
Holding in terms of market share.
The share of private labels also witnessed an increase since 2010 as a result of the rapidly increasing
number of retail stores, as well as the affordable products that made an appearance in response to the
economic crisis.
The packaged food sector is expected to see considerable growth in value and volume. The market has
considerable potential for growth as the penetration of artisanal products as well as unpackaged goods is
still quite high. As the economy continues to grow, consumers will opt for the convenience of packaged
food. Urbanization will be an important determinant of growth since consumers tend to use unpackaged

products in rural areas, while in cities consumers tend to use packaged products. Furthermore,
urbanization means more hectic lifestyles, which translate into demand for convenient food products.
Moreover, Turkey’s young population will facilitate growth as young consumers tend to respond well to
innovation, which is predicted to fuel constant retail value and volume growth.
In the past decade, the leading distribution channel of independent small grocers - comprising mainly of
bakkals, lost their share to supermarkets/hypermarkets and discount stores due to the advantage of “one-
stop” shopping, competitive prices and the greater variety of products found in these channels. Such
outlets, referred to as “organized retailers” offer attractive in-store promotions and an increased number
of private label products at low prices, and their number of new outlets is rapidly increasing. This
growth trend of the organized retail sector shows that the packaged food market is bound to grow
steadily.
In the past few years, functional foods aimed at health conscious consumers have been increasing their
market share. Manufacturers mostly focused on fortified and vitamin enhanced dairy and infant
products, as well as pasta, cereals, and snacks.
In addition to the pro-biotic dairy products, mineral and vitamin enriched products, and omega-3
fortified products have been appearing in market. Enriched breakfast cereals aimed at children and
increased pro-biotic foods targeted at females with digestive problems are among the most popular
products.
Sales of Packaged Food by Category
(million TL)
2008 2009 2010 2011
Nutrition/Staples 36,771 39,556 43,611 46,946
Bakery 26,156 28,565 31,841 34,193
Impulse and Indulgence Products 8,765 9,294 10,231 11,379
Dairy 5,843 6,000 6,334 6,859
Oils and Fats 4,985 5,274 5,838 6,415
Meal Solutions 2,544 3,045 3,279 3,524
Confectionery 2,544 2,735 2,943 3,199
Dried Processed Food 1,935 1,985 2,070 2,179
Sweet and Savoury Snacks 1,681 1,785 1,899 2,097
Ice Cream 1,426 1,529 1,900 2,314
Chilled Processed Food 1,079 1,454 1,585 1,688
Sauces, Dressings and Condiments 846 916 965 1,039
Spreads 752 783 832 882
Baby Food 453 479 511 562
Pasta 488 479 474 473
Soup 141 166 190 222
Canned/Preserved Food 203 211 217 229
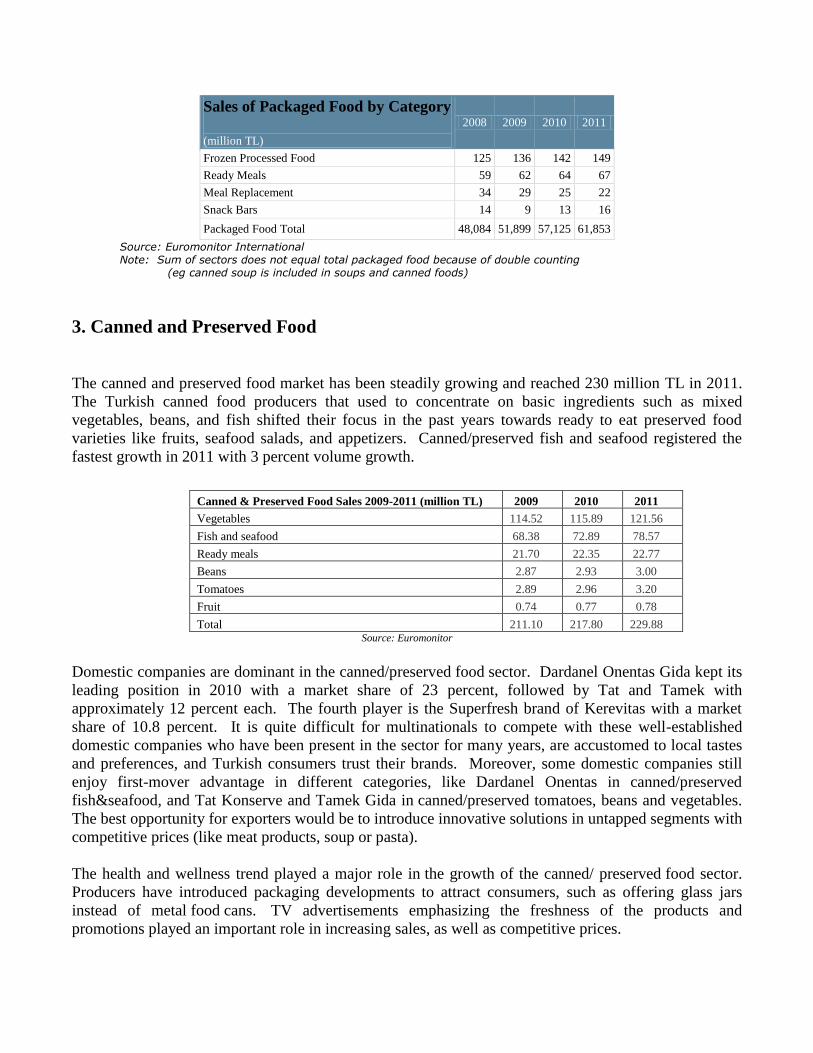
Sales of Packaged Food by Category
(million TL)
2008 2009 2010 2011
Frozen Processed Food 125 136 142 149
Ready Meals 59 62 64 67
Meal Replacement 34 29 25 22
Snack Bars 14 9 13 16
Packaged Food Total 48,084 51,899 57,125 61,853
Source: Euromonitor International Note: Sum of sectors does not equal total packaged food because of double counting
(eg canned soup is included in soups and canned foods)
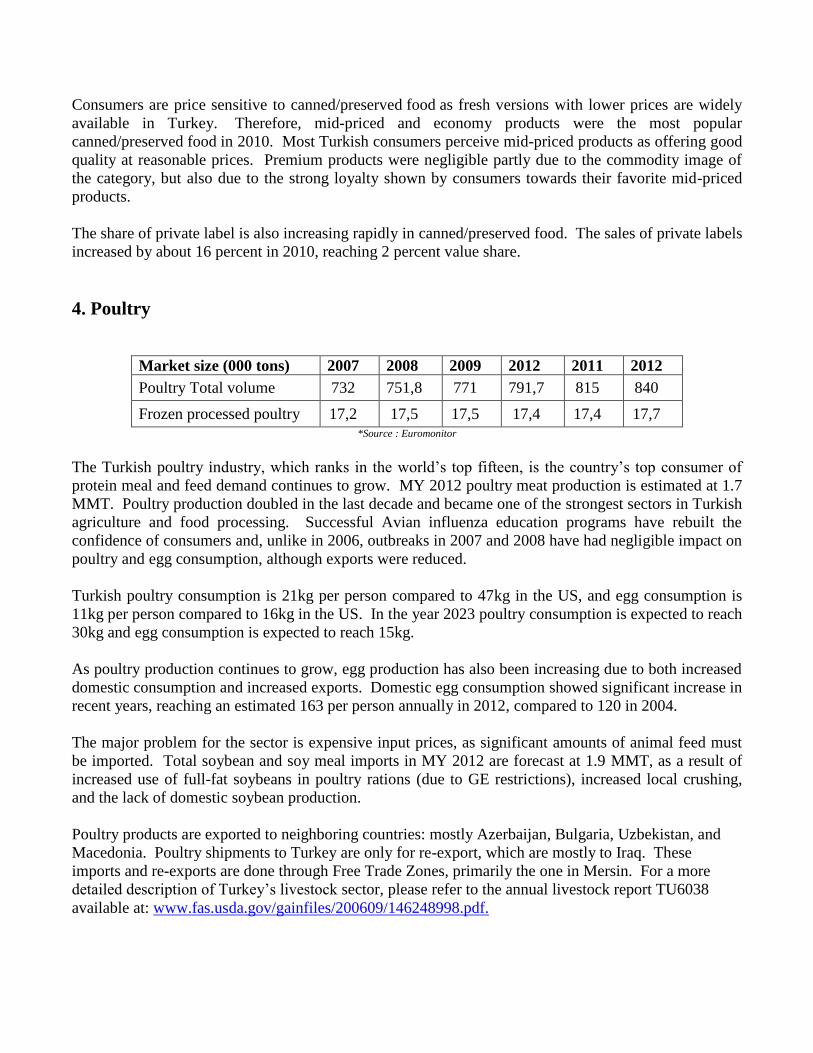
3. Canned and Preserved Food
The canned and preserved food market has been steadily growing and reached 230 million TL in 2011.
The Turkish canned food producers that used to concentrate on basic ingredients such as mixed
vegetables, beans, and fish shifted their focus in the past years towards ready to eat preserved food
varieties like fruits, seafood salads, and appetizers. Canned/preserved fish and seafood registered the
fastest growth in 2011 with 3 percent volume growth.
Canned & Preserved Food Sales 2009-2011 (million TL) 2009 2010 2011
Vegetables 114.52 115.89 121.56
Fish and seafood 68.38 72.89 78.57
Ready meals 21.70 22.35 22.77
Beans 2.87 2.93 3.00
Tomatoes 2.89 2.96 3.20
Fruit 0.74 0.77 0.78
Total 211.10 217.80 229.88 Source: Euromonitor
Domestic companies are dominant in the canned/preserved food sector. Dardanel Onentas Gida kept its
leading position in 2010 with a market share of 23 percent, followed by Tat and Tamek with
approximately 12 percent each. The fourth player is the Superfresh brand of Kerevitas with a market
share of 10.8 percent. It is quite difficult for multinationals to compete with these well-established
domestic companies who have been present in the sector for many years, are accustomed to local tastes
and preferences, and Turkish consumers trust their brands. Moreover, some domestic companies still
enjoy first-mover advantage in different categories, like Dardanel Onentas in canned/preserved
fish&seafood, and Tat Konserve and Tamek Gida in canned/preserved tomatoes, beans and vegetables.
The best opportunity for exporters would be to introduce innovative solutions in untapped segments with
competitive prices (like meat products, soup or pasta).
The health and wellness trend played a major role in the growth of the canned/ preserved food sector.
Producers have introduced packaging developments to attract consumers, such as offering glass jars
instead of metal food cans. TV advertisements emphasizing the freshness of the products and
promotions played an important role in increasing sales, as well as competitive prices.
Consumers are price sensitive to canned/preserved food as fresh versions with lower prices are widely
available in Turkey. Therefore, mid-priced and economy products were the most popular
canned/preserved food in 2010. Most Turkish consumers perceive mid-priced products as offering good
quality at reasonable prices. Premium products were negligible partly due to the commodity image of
the category, but also due to the strong loyalty shown by consumers towards their favorite mid-priced
products.
The share of private label is also increasing rapidly in canned/preserved food. The sales of private labels
increased by about 16 percent in 2010, reaching 2 percent value share.
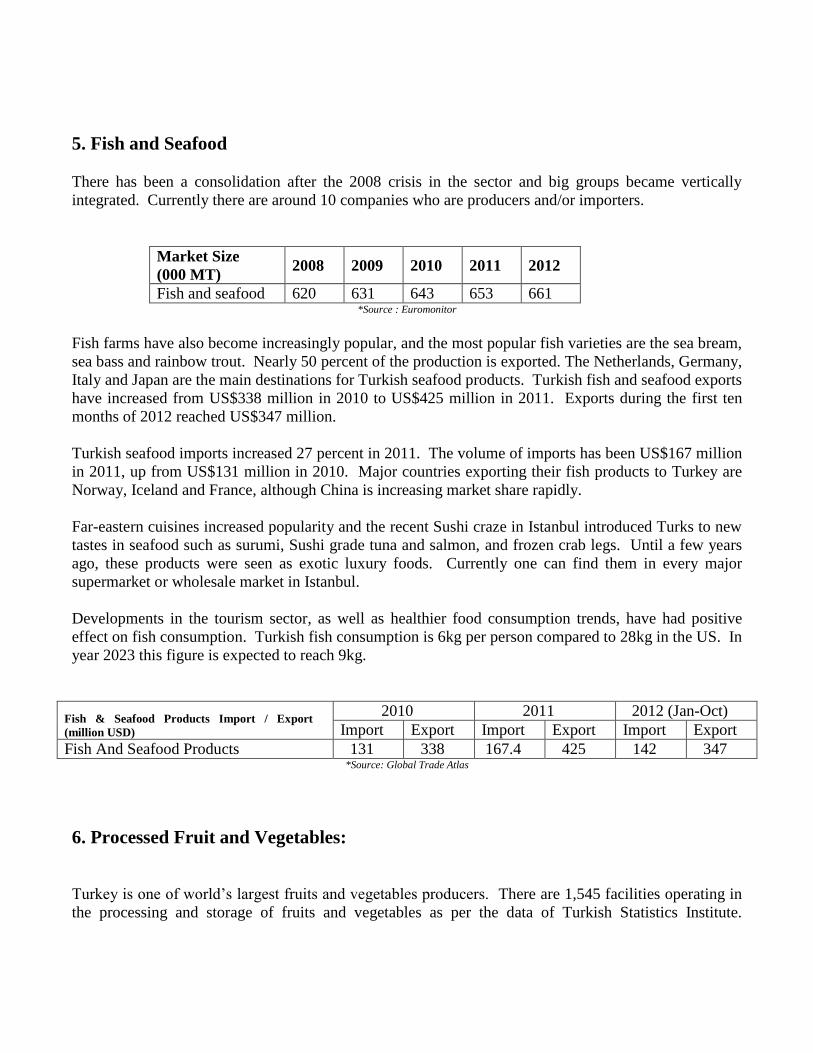
4. Poultry
Market size (000 tons) 2007 2008 2009 2012 2011 2012
Poultry Total volume 732 751,8 771 791,7 815 840
Frozen processed poultry 17,2 17,5 17,5 17,4 17,4 17,7 *Source : Euromonitor
The Turkish poultry industry, which ranks in the world’s top fifteen, is the country’s top consumer of
protein meal and feed demand continues to grow. MY 2012 poultry meat production is estimated at 1.7
MMT. Poultry production doubled in the last decade and became one of the strongest sectors in Turkish
agriculture and food processing. Successful Avian influenza education programs have rebuilt the
confidence of consumers and, unlike in 2006, outbreaks in 2007 and 2008 have had negligible impact on
poultry and egg consumption, although exports were reduced.
Turkish poultry consumption is 21kg per person compared to 47kg in the US, and egg consumption is
11kg per person compared to 16kg in the US. In the year 2023 poultry consumption is expected to reach
30kg and egg consumption is expected to reach 15kg.
As poultry production continues to grow, egg production has also been increasing due to both increased
domestic consumption and increased exports. Domestic egg consumption showed significant increase in
recent years, reaching an estimated 163 per person annually in 2012, compared to 120 in 2004.
The major problem for the sector is expensive input prices, as significant amounts of animal feed must
be imported. Total soybean and soy meal imports in MY 2012 are forecast at 1.9 MMT, as a result of
increased use of full-fat soybeans in poultry rations (due to GE restrictions), increased local crushing,
and the lack of domestic soybean production.
Poultry products are exported to neighboring countries: mostly Azerbaijan, Bulgaria, Uzbekistan, and
Macedonia. Poultry shipments to Turkey are only for re-export, which are mostly to Iraq. These
imports and re-exports are done through Free Trade Zones, primarily the one in Mersin. For a more
detailed description of Turkey’s livestock sector, please refer to the annual livestock report TU6038
available at: www.fas.usda.gov/gainfiles/200609/146248998.pdf.
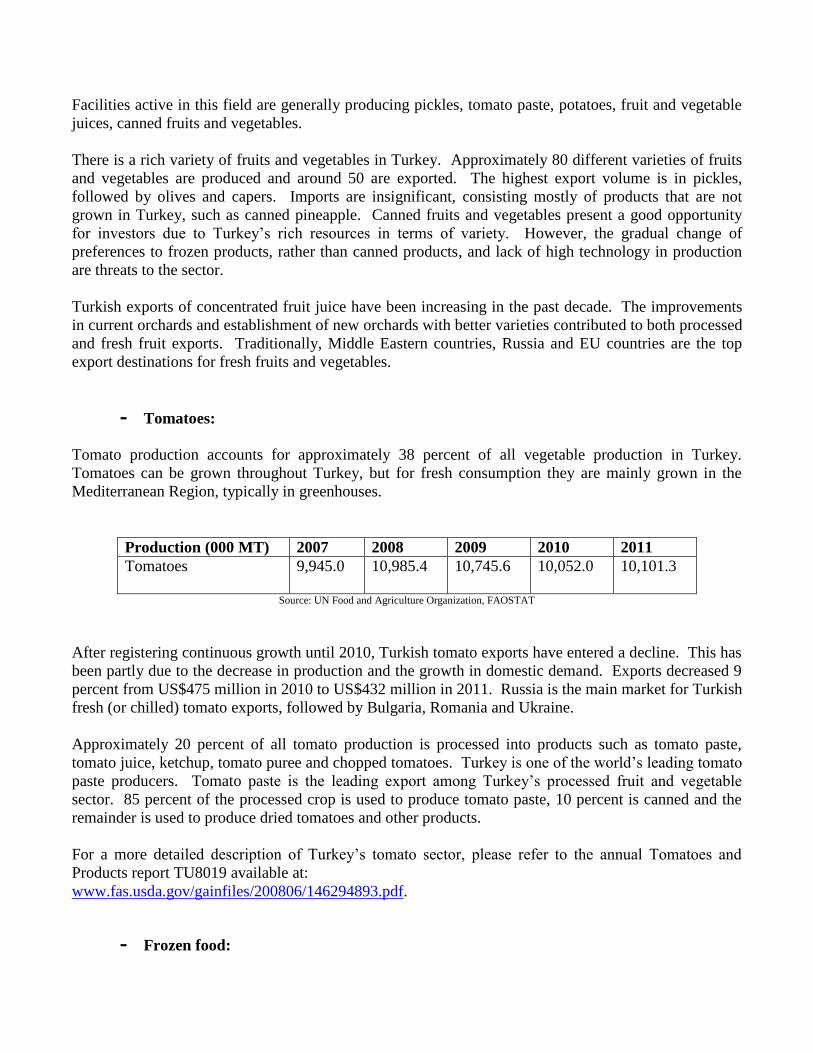
5. Fish and Seafood
There has been a consolidation after the 2008 crisis in the sector and big groups became vertically
integrated. Currently there are around 10 companies who are producers and/or importers.
Market Size
(000 MT) 2008 2009 2010 2011 2012
Fish and seafood 620 631 643 653 661 *Source : Euromonitor
Fish farms have also become increasingly popular, and the most popular fish varieties are the sea bream,
sea bass and rainbow trout. Nearly 50 percent of the production is exported. The Netherlands, Germany,
Italy and Japan are the main destinations for Turkish seafood products. Turkish fish and seafood exports
have increased from US$338 million in 2010 to US$425 million in 2011. Exports during the first ten
months of 2012 reached US$347 million.
Turkish seafood imports increased 27 percent in 2011. The volume of imports has been US$167 million
in 2011, up from US$131 million in 2010. Major countries exporting their fish products to Turkey are
Norway, Iceland and France, although China is increasing market share rapidly.
Far-eastern cuisines increased popularity and the recent Sushi craze in Istanbul introduced Turks to new
tastes in seafood such as surumi, Sushi grade tuna and salmon, and frozen crab legs. Until a few years
ago, these products were seen as exotic luxury foods. Currently one can find them in every major
supermarket or wholesale market in Istanbul.
Developments in the tourism sector, as well as healthier food consumption trends, have had positive
effect on fish consumption. Turkish fish consumption is 6kg per person compared to 28kg in the US. In
year 2023 this figure is expected to reach 9kg.
Fish & Seafood Products Import / Export
(million USD)
2010 2011 2012 (Jan-Oct)
Import Export Import Export Import Export
Fish And Seafood Products 131 338 167.4 425 142 347 *Source: Global Trade Atlas
6. Processed Fruit and Vegetables:
Turkey is one of world’s largest fruits and vegetables producers. There are 1,545 facilities operating in
the processing and storage of fruits and vegetables as per the data of Turkish Statistics Institute.
Facilities active in this field are generally producing pickles, tomato paste, potatoes, fruit and vegetable
juices, canned fruits and vegetables.
There is a rich variety of fruits and vegetables in Turkey. Approximately 80 different varieties of fruits
and vegetables are produced and around 50 are exported. The highest export volume is in pickles,
followed by olives and capers. Imports are insignificant, consisting mostly of products that are not
grown in Turkey, such as canned pineapple. Canned fruits and vegetables present a good opportunity
for investors due to Turkey’s rich resources in terms of variety. However, the gradual change of
preferences to frozen products, rather than canned products, and lack of high technology in production
are threats to the sector.
Turkish exports of concentrated fruit juice have been increasing in the past decade. The improvements
in current orchards and establishment of new orchards with better varieties contributed to both processed
and fresh fruit exports. Traditionally, Middle Eastern countries, Russia and EU countries are the top
export destinations for fresh fruits and vegetables.
- Tomatoes:
Tomato production accounts for approximately 38 percent of all vegetable production in Turkey.
Tomatoes can be grown throughout Turkey, but for fresh consumption they are mainly grown in the
Mediterranean Region, typically in greenhouses.
Production (000 MT) 2007 2008 2009 2010 2011
Tomatoes
9,945.0 10,985.4 10,745.6 10,052.0 10,101.3
Source: UN Food and Agriculture Organization, FAOSTAT
After registering continuous growth until 2010, Turkish tomato exports have entered a decline. This has
been partly due to the decrease in production and the growth in domestic demand. Exports decreased 9
percent from US$475 million in 2010 to US$432 million in 2011. Russia is the main market for Turkish
fresh (or chilled) tomato exports, followed by Bulgaria, Romania and Ukraine.
Approximately 20 percent of all tomato production is processed into products such as tomato paste,
tomato juice, ketchup, tomato puree and chopped tomatoes. Turkey is one of the world’s leading tomato
paste producers. Tomato paste is the leading export among Turkey’s processed fruit and vegetable
sector. 85 percent of the processed crop is used to produce tomato paste, 10 percent is canned and the
remainder is used to produce dried tomatoes and other products.
For a more detailed description of Turkey’s tomato sector, please refer to the annual Tomatoes and
Products report TU8019 available at:
www.fas.usda.gov/gainfiles/200806/146294893.pdf.
- Frozen food:
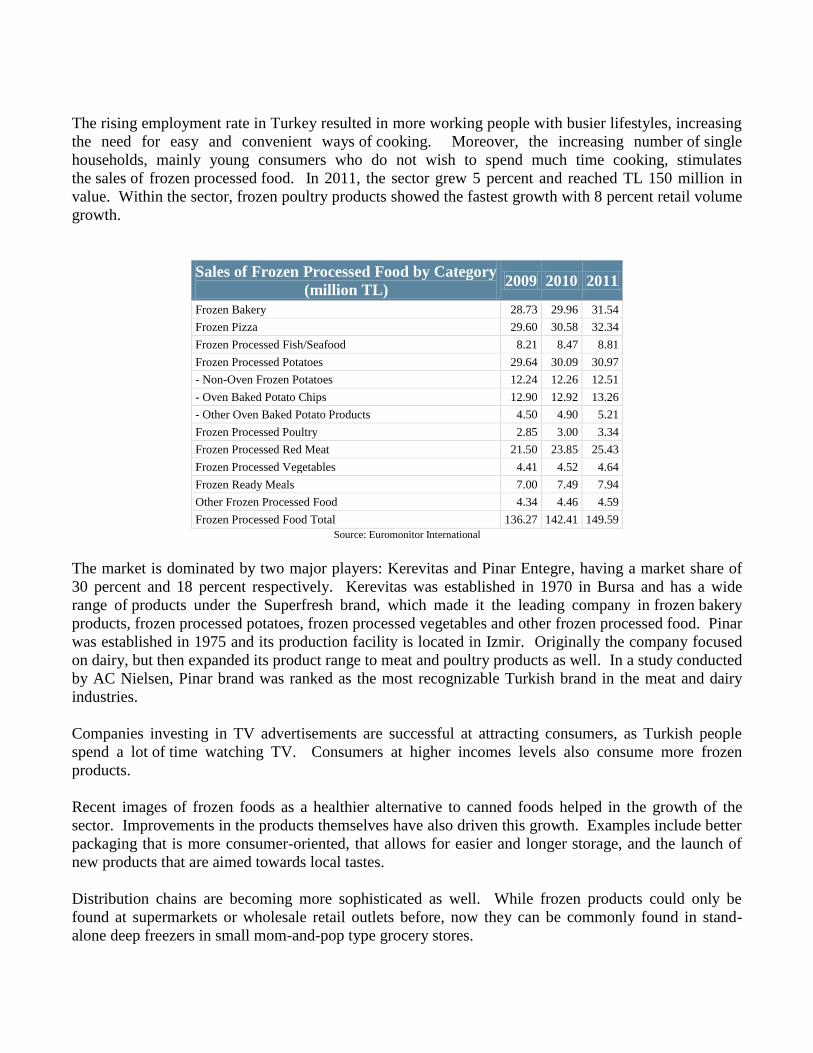
The rising employment rate in Turkey resulted in more working people with busier lifestyles, increasing
the need for easy and convenient ways of cooking. Moreover, the increasing number of single
households, mainly young consumers who do not wish to spend much time cooking, stimulates
the sales of frozen processed food. In 2011, the sector grew 5 percent and reached TL 150 million in
value. Within the sector, frozen poultry products showed the fastest growth with 8 percent retail volume
growth.
Sales of Frozen Processed Food by Category
(million TL) 2009 2010 2011
Frozen Bakery 28.73 29.96 31.54
Frozen Pizza 29.60 30.58 32.34
Frozen Processed Fish/Seafood 8.21 8.47 8.81
Frozen Processed Potatoes 29.64 30.09 30.97
- Non-Oven Frozen Potatoes 12.24 12.26 12.51
- Oven Baked Potato Chips 12.90 12.92 13.26
- Other Oven Baked Potato Products 4.50 4.90 5.21
Frozen Processed Poultry 2.85 3.00 3.34
Frozen Processed Red Meat 21.50 23.85 25.43
Frozen Processed Vegetables 4.41 4.52 4.64
Frozen Ready Meals 7.00 7.49 7.94
Other Frozen Processed Food 4.34 4.46 4.59
Frozen Processed Food Total 136.27 142.41 149.59
Source: Euromonitor International
The market is dominated by two major players: Kerevitas and Pinar Entegre, having a market share of
30 percent and 18 percent respectively. Kerevitas was established in 1970 in Bursa and has a wide
range of products under the Superfresh brand, which made it the leading company in frozen bakery
products, frozen processed potatoes, frozen processed vegetables and other frozen processed food. Pinar
was established in 1975 and its production facility is located in Izmir. Originally the company focused
on dairy, but then expanded its product range to meat and poultry products as well. In a study conducted
by AC Nielsen, Pinar brand was ranked as the most recognizable Turkish brand in the meat and dairy
industries.
Companies investing in TV advertisements are successful at attracting consumers, as Turkish people
spend a lot of time watching TV. Consumers at higher incomes levels also consume more frozen
products.
Recent images of frozen foods as a healthier alternative to canned foods helped in the growth of the
sector. Improvements in the products themselves have also driven this growth. Examples include better
packaging that is more consumer-oriented, that allows for easier and longer storage, and the launch of
new products that are aimed towards local tastes.
Distribution chains are becoming more sophisticated as well. While frozen products could only be
found at supermarkets or wholesale retail outlets before, now they can be commonly found in stand-
alone deep freezers in small mom-and-pop type grocery stores.
7. Dairy products
Turkey invested heavily on imports of live dairy breeding cattle in the last three years, especially from
U.S. Increased amount of new livestock farms increased the production of milk. Currently Turkey has a
surplus stock in milk. In order to reduce the build-up of stocks the Government began a school milk
project on May 2012. The project has two components: one is to purchase milk from the market to
stabilize milk prices, and second is to help child development.
The state owned Turkish Milk Institute (“SEK”) was privatized in 1996. Since then, some
conglomerates have entered this industry either alone or together with foreign investment, so the
industry has grown, albeit in a slow pace. Today, the major companies in this field are: Danone, Pinar,
Ulker, Sutas and SEK. Approximately 3 million tons of total production is processed. The balance is
either sold as “street milk” or processed in unregistered facilities. The final products of the industry are
packaged milk, yogurt, traditional yogurt drink “ayran,” cheese, creams, butter, milk powder, and
flavored dairy products. A majority of finished product imports are in cheese; some imported varieties
are cheddar, mozzarella, ricotta, edam, gouda, roquefort, and parmesan.
The Turkish dairy sector has significant growth potential. First, per capita consumption is increasing
and there is significant room for continued growth. Second, European Union accession talks are
reducing the unregistered economy. The volume to be replaced by modern facilities is significant
considering the very high ratio of unregistered economy in the dairy product sales.
The introduction of new dairy products is quite new in the Turkish dairy industry. The production and
sale of functional products such as organic milk, probiotic milks, special products for pregnant and
nursing women and for babies are increasing. Also traditional dairy products such as a hot drink called
“sahlep” and cold drink called “ayran”, together with international products such as fruit yogurts and
mozzarella cheese, are new factors in the industry. Considering Turkey’s tourism numbers, there is a
huge potential for manufacturing functional and flavored goods in this subsector.
According to industry sources, milk production in Turkey reached 13 MMT in 2012. Industrial milk
production is 700,000 MT and ultra-high temperature (UHT) milk has a 90 percent market share. The
majority of milk is processed as cheese which is 7 MMT in 2012. Only 1.7 MMT of the milk is
consumed as liquid milk. Yogurt consumption traditionally is very high at 2.5 MMT, butter is 1.5
MMT, the growing ice cream consumption is 90,000 MT, and milk powder consumption is 90,000 MT.
Dairy product (excluding cheese) imports decreased to US$82 million in 2011 after reaching US$121
million in 2010. Exports on the other hand showed the opposite trend and increased from US$70
million in 2010 to US$118 million in 2011. This is a result of the increase in livestock inventory.
However in cheeses, imports increased from US$26 million in 2010 to US$28 million in 2011, and
exports increased from US$101 million to US$114 million.
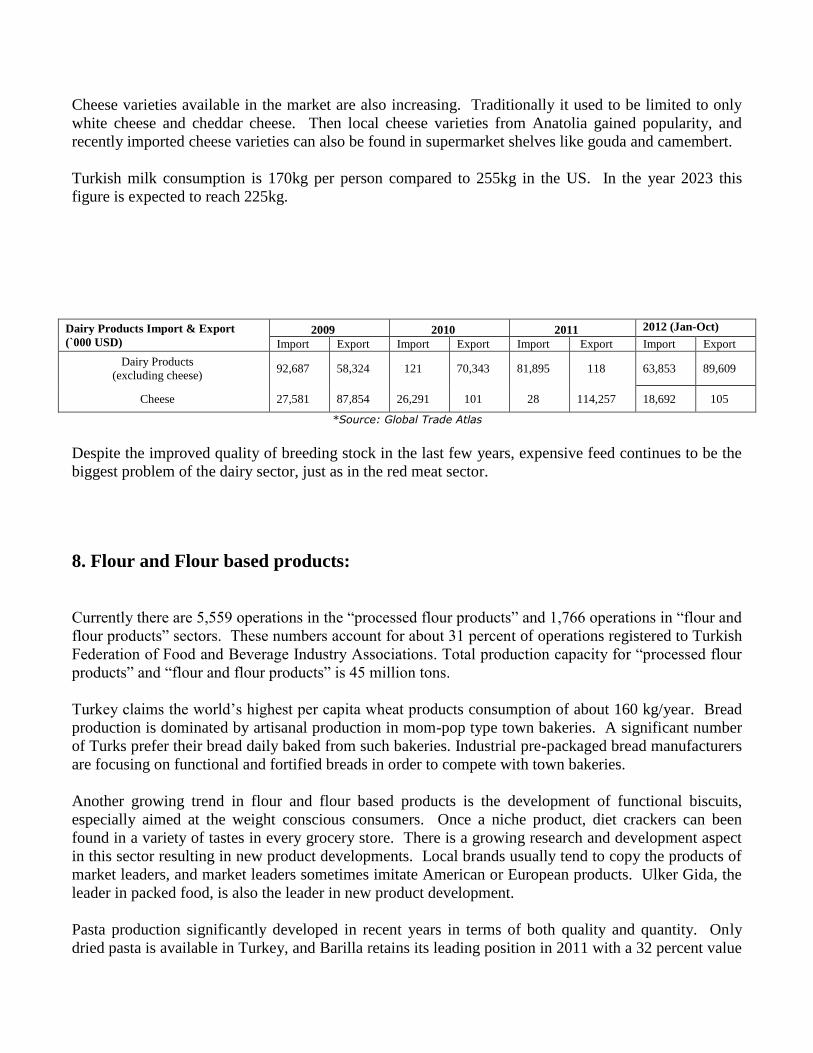
Cheese varieties available in the market are also increasing. Traditionally it used to be limited to only
white cheese and cheddar cheese. Then local cheese varieties from Anatolia gained popularity, and
recently imported cheese varieties can also be found in supermarket shelves like gouda and camembert.
Turkish milk consumption is 170kg per person compared to 255kg in the US. In the year 2023 this
figure is expected to reach 225kg.
Dairy Products Import & Export
(`000 USD) 2009 2010 2011 2012 (Jan-Oct)
Import Export Import Export Import Export Import Export
Dairy Products
(excluding cheese) 92,687 58,324 121 70,343 81,895 118 63,853 89,609
Cheese 27,581 87,854 26,291 101 28 114,257 18,692 105
*Source: Global Trade Atlas
Despite the improved quality of breeding stock in the last few years, expensive feed continues to be the
biggest problem of the dairy sector, just as in the red meat sector.
8. Flour and Flour based products:
Currently there are 5,559 operations in the “processed flour products” and 1,766 operations in “flour and
flour products” sectors. These numbers account for about 31 percent of operations registered to Turkish
Federation of Food and Beverage Industry Associations. Total production capacity for “processed flour
products” and “flour and flour products” is 45 million tons.
Turkey claims the world’s highest per capita wheat products consumption of about 160 kg/year. Bread
production is dominated by artisanal production in mom-pop type town bakeries. A significant number
of Turks prefer their bread daily baked from such bakeries. Industrial pre-packaged bread manufacturers
are focusing on functional and fortified breads in order to compete with town bakeries.
Another growing trend in flour and flour based products is the development of functional biscuits,
especially aimed at the weight conscious consumers. Once a niche product, diet crackers can been
found in a variety of tastes in every grocery store. There is a growing research and development aspect
in this sector resulting in new product developments. Local brands usually tend to copy the products of
market leaders, and market leaders sometimes imitate American or European products. Ulker Gida, the
leader in packed food, is also the leader in new product development.
Pasta production significantly developed in recent years in terms of both quality and quantity. Only
dried pasta is available in Turkey, and Barilla retains its leading position in 2011 with a 32 percent value
share. Other categories, such as frozen or canned/preserved pasta have not been introduced to the
country yet, while sales of chilled/fresh pasta are negligible. As consumers are familiar with dried pasta,
manufacturers have been reluctant to invest in other types. Turkish consumers are generally traditional
in their tastes and tend to hesitate before trying something new. The market size was TL 473 million in
2011.
Over capacity is a problem in the flour sector due to state incentive programs. Flour production in
Turkey is more than sufficient in quantity; however quality can be a problem.
For a more detailed description of Turkey’s grain sector, please refer to the annual grain report at:
http://gain.fas.usda.gov/Recent20GAIN20Publications/Grain20and20Feed20Annual_Ankara_Turkey_5-
11-2012.pdf.
9. Sugar and Confectionary
The market size of sweets and chocolate sector increased from US$250 million in 1998 to US$3.1
billion in 2012. From a demographic perspective, chocolate consumption is higher in regions where
income levels are relatively higher. In recent years the increase of chain retail stores affected chocolate
consumption in developing regions as well and a 70 percent increase is observed in the East and
Southeast Anatolia regions. Current consumption shares of Turkey’s 7 regions are as follows: Marmara
region – 52 percent, Mediterranean and Aegean Regions 17 percent, Central Anatolia – 12 percent, East
and Southeast Regions – 12 percent, and Black Sea Region – 7 percent.
Despite high input costs in sugar, cacao powder and cacao oil, the relatively lower labor costs in Turkey
give the local producers an edge in the global competition.
Currently there are approximately 1,616 companies active in the confectionary sugar, cacao and
chocolate sector with a production capacity of 2.5 million tons. There are business activities of foreign
and local high-technology corporations, small and medium sized corporations, and regional companies
in this area. Smaller companies generally produce traditional products like Turkish delight and “helva”,
while larger-scale companies produce more value-added products.
The chewing gum, chocolate and cookies industry is well developed in Turkey, with modern facilities.
The production of confectionary, chocolates, and cocoa products show great dynamism and potential
considering the young population, increasing incomes, current low consumptions and tourism.
Turkey produces its sugar from sugar beets and there are also starch based sugar producers. Sugar
production is regulated and limited to quotas allocated each year to every producer in the country. This
maintains Turkish self sufficiency in sugar production and only excess sugar is exported, and that is
mainly to the Middle East. For imports in to Turkey, the import duty is 135 percent.
For a more detailed description of Turkey’s sugar sector, please refer to the annual sugar report available
at:
http://gain.fas.usda.gov/Recent%20GAIN%20Publications/Sugar%20Semi-annual_Ankara_Turkey_9-
26-2012.pdf.
10. Beverages
Average annual fruit juice consumption per person is 8 lt in Turkey compared to 45 lt in the US. This
promises a significant growth opportunity. Even though the sector classifies fruit juice in 4 categories as
100% fruit juice, fruit nectar, fruit drinks and flavored drinks, most consumers regard them all as fruit
juice.
Alcoholic drinks are mainly consumed by the young generation in Turkey with a median age of 28.
Many young consumers go to urban areas for university education or better job opportunities. People in
urban areas, where religious and conservative attitudes are less observed, are influenced by Western
trends. Therefore, as a result of rising urbanization and Westernization, young people are driving sales
of alcoholic drinks in Turkey.
The major factor that affects the price of alcoholic beverages is the high rate of Special Consumption
Tax (OTV) applied on such drinks. The OTV on beer for instance increased by 737 percent between
2002 and 2009 (since the current government came into power). This reflects in the prices as follows:
The traditional drink raki (a traditional Turkish grape spirit aromatized with aniseed) retailed at an
average price of TL 9.15 in 2002 and TL 36 in 2011.
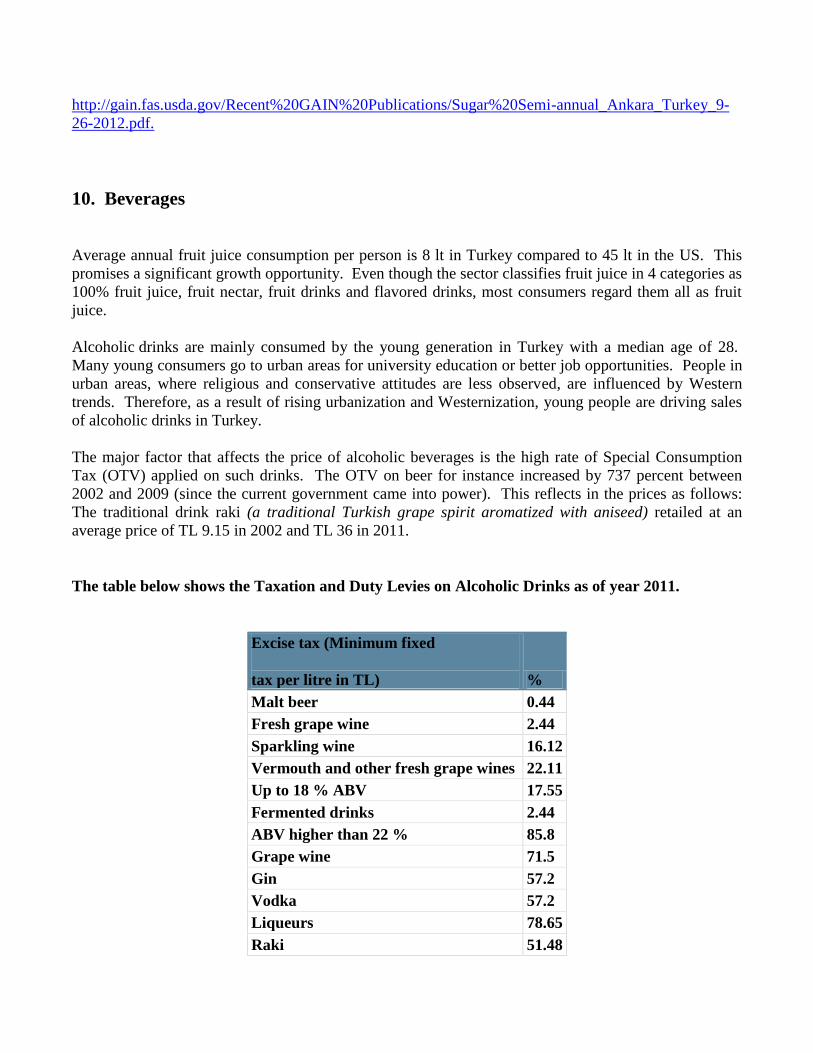
The table below shows the Taxation and Duty Levies on Alcoholic Drinks as of year 2011.
Excise tax (Minimum fixed
tax per litre in TL) %
Malt beer 0.44
Fresh grape wine 2.44
Sparkling wine 16.12
Vermouth and other fresh grape wines 22.11
Up to 18 % ABV 17.55
Fermented drinks 2.44
ABV higher than 22 % 85.8
Grape wine 71.5
Gin 57.2
Vodka 57.2
Liqueurs 78.65
Raki 51.48
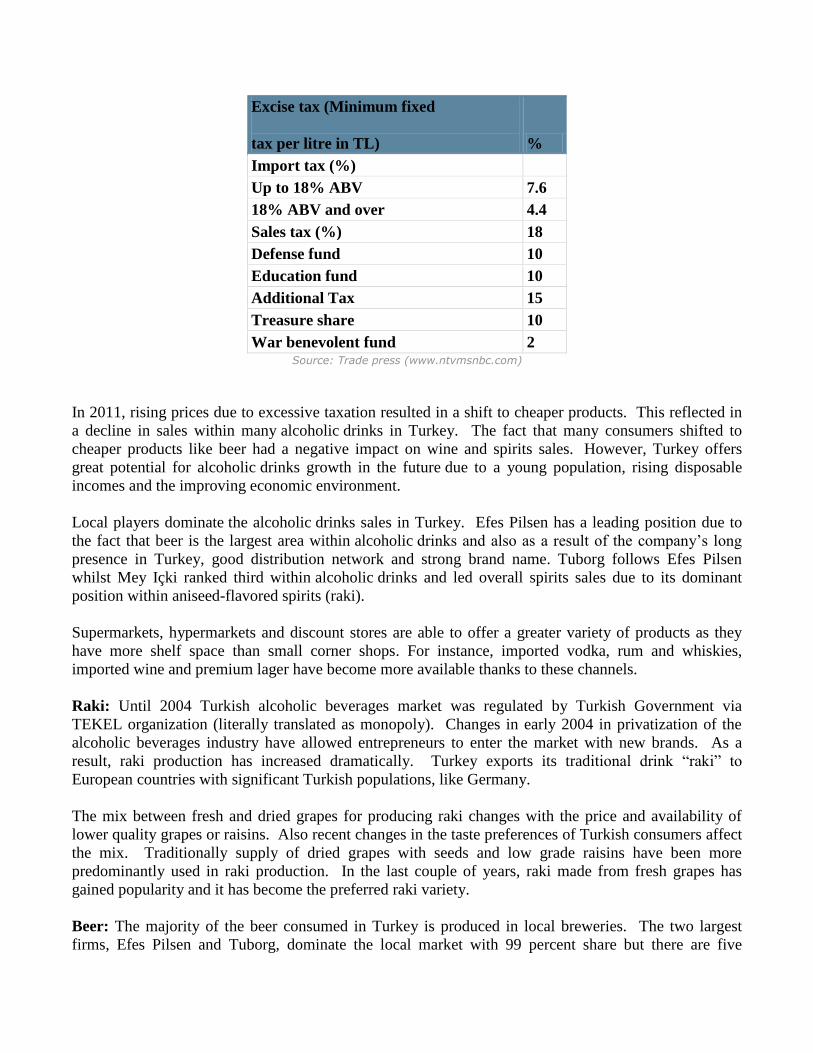
Excise tax (Minimum fixed
tax per litre in TL) %
Import tax (%)
Up to 18% ABV 7.6
18% ABV and over 4.4
Sales tax (%) 18
Defense fund 10
Education fund 10
Additional Tax 15
Treasure share 10
War benevolent fund 2 Source: Trade press (www.ntvmsnbc.com)
In 2011, rising prices due to excessive taxation resulted in a shift to cheaper products. This reflected in
a decline in sales within many alcoholic drinks in Turkey. The fact that many consumers shifted to
cheaper products like beer had a negative impact on wine and spirits sales. However, Turkey offers
great potential for alcoholic drinks growth in the future due to a young population, rising disposable
incomes and the improving economic environment.
Local players dominate the alcoholic drinks sales in Turkey. Efes Pilsen has a leading position due to
the fact that beer is the largest area within alcoholic drinks and also as a result of the company’s long
presence in Turkey, good distribution network and strong brand name. Tuborg follows Efes Pilsen
whilst Mey Içki ranked third within alcoholic drinks and led overall spirits sales due to its dominant
position within aniseed-flavored spirits (raki).
Supermarkets, hypermarkets and discount stores are able to offer a greater variety of products as they
have more shelf space than small corner shops. For instance, imported vodka, rum and whiskies,
imported wine and premium lager have become more available thanks to these channels.
Raki: Until 2004 Turkish alcoholic beverages market was regulated by Turkish Government via
TEKEL organization (literally translated as monopoly). Changes in early 2004 in privatization of the
alcoholic beverages industry have allowed entrepreneurs to enter the market with new brands. As a
result, raki production has increased dramatically. Turkey exports its traditional drink “raki” to
European countries with significant Turkish populations, like Germany.
The mix between fresh and dried grapes for producing raki changes with the price and availability of
lower quality grapes or raisins. Also recent changes in the taste preferences of Turkish consumers affect
the mix. Traditionally supply of dried grapes with seeds and low grade raisins have been more
predominantly used in raki production. In the last couple of years, raki made from fresh grapes has
gained popularity and it has become the preferred raki variety.
Beer: The majority of the beer consumed in Turkey is produced in local breweries. The two largest
firms, Efes Pilsen and Tuborg, dominate the local market with 99 percent share but there are five
additional small beer producing companies as well. The dominance of Turkish companies is due to
years of protectionist trade policies and regulations. Even though privatization of the alcoholic
beverages industry has allowed import beers to enter the market since 2003, they are still very few in
number. Total size of the Turkish beer market is estimated at 900,000MT and per capita consumption is
about 12 liters.
The amount of imported beer on supermarket shelves is increasing by the year. European beer such as
German, Italian, Dutch and Czech beer and a Mexican brand are the most popular imported beer in
Turkey. Import beers (as with their wine counterparts) are competing in the premium sector with high
prices. Turkey’s younger population prefers either lower priced Turkish brands or premium offerings of
the Turkish brands.
Micro breweries are still at their infancy. Micro breweries first started in 2002 by Taps Micro Brewery
in Istanbul, yet imported micro brews and exotic beers are still rarely found in the market. Due to their
premium prices and Turkish taste preferences, their demand remains quite low. The dominating beer
varieties in the market are Lager and Pilsner.
Wine: Popularity of wine as an alcoholic beverage has increased in recent years. Local consumption has
doubled during the last four years and Turkish consumers are willing to try new varieties. Increased
income, a growing young population and tourism all contributed to the wine consumption increase in
Turkey. However due to high import taxes, premium wines of Europe and USA are marketed at
astronomical prices and appeal only to a very niche market. Lower-end foreign wine brands are sold at
relatively competitive prices and are slowly establishing themselves as alternatives to Turkish brands.
Domestic production of wine is about 70,000MT. Along with well established local wine houses, now
there are many boutique type wine houses producing good quality wine from local grapes.
The wine culture is also growing in Turkey and the number of educational courses/events about wine
varieties, manufacture, and culture are growing. The US, French, Chilean, Italian and Spanish wine
brands are the most popular imported brands. Some low cost wine brands from Eastern Europe are also
imported. Despite the price advantage of domestic wines and protection of the local industry via high
import taxes, imported wines have increased their market share to 3 percent compared to 1.2 percent four
years ago.
Whiskey: Single malt scotch is rarely found in the Turkish market and blended scotch is the whisky of
choice. Since whisky is viewed as a higher-end drink, its popularity among the young population is
increasing at a very slow pace, and the established taste and brand preferences of the middle & older aged
market is very difficult to change. Having realized this, some American producers in the market are
targeting the younger generation through rock concerts and motor-rally sponsorships, but recent changes
in regulations put age limits for participation to these promotion programs.
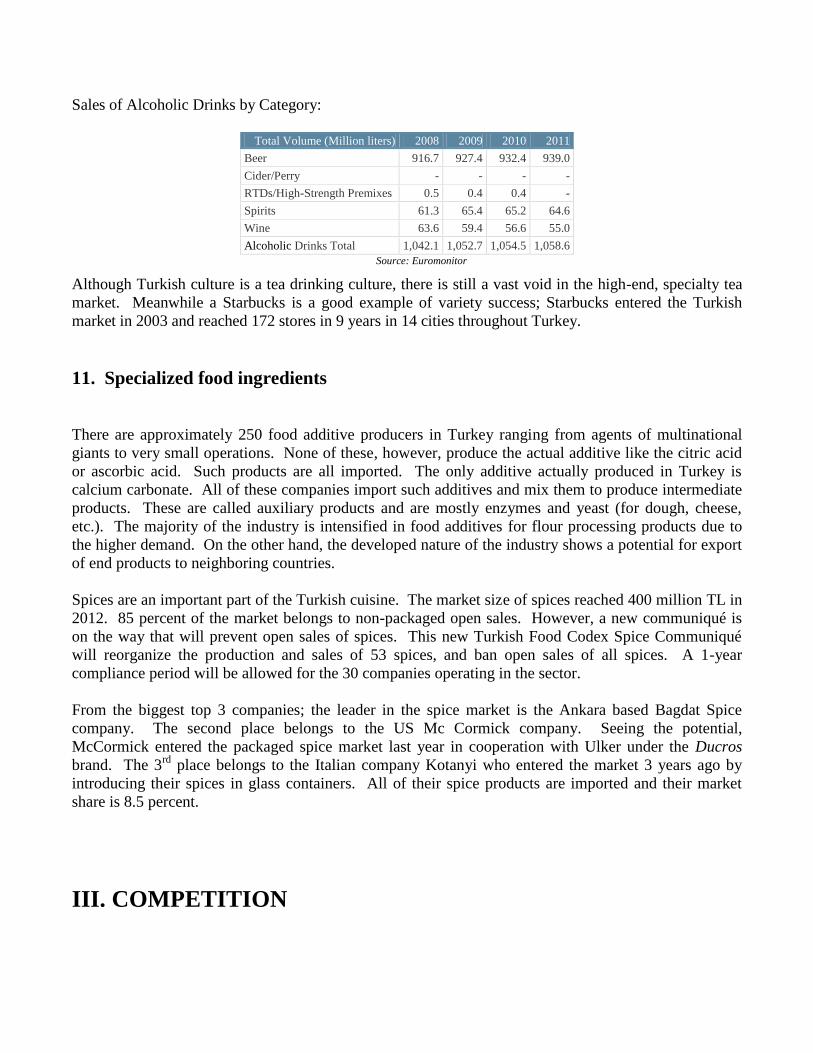
Sales of Alcoholic Drinks by Category:
Total Volume (Million liters) 2008 2009 2010 2011
Beer 916.7 927.4 932.4 939.0
Cider/Perry - - - -
RTDs/High-Strength Premixes 0.5 0.4 0.4 -
Spirits 61.3 65.4 65.2 64.6
Wine 63.6 59.4 56.6 55.0
Alcoholic Drinks Total 1,042.1 1,052.7 1,054.5 1,058.6
Source: Euromonitor
Although Turkish culture is a tea drinking culture, there is still a vast void in the high-end, specialty tea
market. Meanwhile a Starbucks is a good example of variety success; Starbucks entered the Turkish
market in 2003 and reached 172 stores in 9 years in 14 cities throughout Turkey.
11. Specialized food ingredients
There are approximately 250 food additive producers in Turkey ranging from agents of multinational
giants to very small operations. None of these, however, produce the actual additive like the citric acid
or ascorbic acid. Such products are all imported. The only additive actually produced in Turkey is
calcium carbonate. All of these companies import such additives and mix them to produce intermediate
products. These are called auxiliary products and are mostly enzymes and yeast (for dough, cheese,
etc.). The majority of the industry is intensified in food additives for flour processing products due to
the higher demand. On the other hand, the developed nature of the industry shows a potential for export
of end products to neighboring countries.
Spices are an important part of the Turkish cuisine. The market size of spices reached 400 million TL in
2012. 85 percent of the market belongs to non-packaged open sales. However, a new communiqué is
on the way that will prevent open sales of spices. This new Turkish Food Codex Spice Communiqué
will reorganize the production and sales of 53 spices, and ban open sales of all spices. A 1-year
compliance period will be allowed for the 30 companies operating in the sector.
From the biggest top 3 companies; the leader in the spice market is the Ankara based Bagdat Spice
company. The second place belongs to the US Mc Cormick company. Seeing the potential,
McCormick entered the packaged spice market last year in cooperation with Ulker under the Ducros
brand. The 3rd
place belongs to the Italian company Kotanyi who entered the market 3 years ago by
introducing their spices in glass containers. All of their spice products are imported and their market
share is 8.5 percent.
III. COMPETITION
US exporters are facing two main competitors in the Turkish market: European Union exporters and
domestic companies.
European exporters’ competitive advantages are:
Lower transportation costs due to their geographical proximity.
Turkey's engagement in a customs union with the EU gives EU suppliers price advantage due to
lower import duties and regulatory advantage due to harmonization of regulations.
Turks are also very familiar with European palate due to white-collar workers living in major
European countries for more than three generations. These workers and their families frequently
come to Turkey for holidays regularly infusing the market with European trends.
Local producers’ competitive advantages:
Turkey has a well-developed food-processing sector with quality products manufactured for
local taste at competitive prices.
This sophisticated food processing sector is supported with a rich base of agricultural production,
providing ingredients for this sector.
In addition there is significant tariff and non-tariff protection for locally produced foods and
agricultural products.
US exporters’ competitive Advantages and disadvantages:
Changes in the retailing structure have opened new areas for branded import items.
There is a growing demand for specialized products such as diabetic and diet foods, ready-to-eat
and frozen foods, which are mostly imported.
Some U.S. products (mainly bulk and intermediate commodities) are better priced than local
products.
U.S. products have a good image in Turkey and Turkish consumers welcome U.S. style products.
International retailers that market a wide range of imported products in the sector have
considerable influence on purchasing patterns.
Specialized fancy food companies operate in niche markets to overcome these difficulties.
U.S. food products are weakly promoted in Turkey.
Competition for shelf space at supermarkets has led to high costs for introducing new products.
IV. BEST MARKET PROSPECTS
Adopting products popular in the west is a large part of the modern Turkish life. Internationally known
brand names are well placed for this. Exporters should be particularly sensitive to brand positioning and
be ready to invest in the necessary research and marketing support to assist their local partners for a
successful entry.
The best products for the imported food market are internationally recognized branded food products.
These types of products in general account for 30 percent of overall imported food items. These include
cocoa and instant coffee, chocolate and confectionary goods, cookies and crackers, breakfast cereal,
cheese, alcoholic beverages, sauces, seafood and pet foods. The change in wine and beer import and
distribution regulations now allows imported products to be sold in the retail market, which have created
new opportunities for U.S. wine and beer to be sold in the Turkish market, although taxes still remain
high. Functional food items such as food supplements and “sports drinks” also represents a new
opportunity for U.S. exports since it is a relatively new sub-sector with a rapid growth.
Major products that have market potential are:
Health and beauty promoting soft drinks: The types of non-alcoholic beverages in Turkey are
limited to fruit juices, sodas and mineral waters. There is a vast void in health promoting
beverage types such as digestive health, bone and joint health, brain and memory, cardiovascular
health, etc. There are also no products in the market for the ‘beauty from within’ type. The
consumers are ready for such products, so the demand is there, and there is a tremendous
untapped potential in this segment.
Functional food awareness is increasing in Turkey, as in most other countries. Functional
chocolate and sugar confectionary products, baby and toddler food, gums and biscuits offer a
good market opportunity. Diabetes is a widely seen problem in the Turkish population and
specialized products for diabetics also provides a good market potential.
Wine: Popularity of wine as an alcoholic beverage has increased in recent years. French and
Californian wine brands are held in high esteem.
Whiskey: Blended scotch is the whisky of choice. Some American brands in the market are
targeting the younger generation through rock concerts and motor-rally sponsorships.
Seafood: Turkey is a promising market for various seafood products. In addition to the local
fresh fish, frozen, preserved and ready to eat seafood products are welcomed by Turkish
consumers.
Dairy products: Specialty cheeses and butter have good market potential for US suppliers.
Currently EU countries dominate the market.
Breakfast cereals: Consumption of breakfast cereals is increasing Chocolate cereals, corn flakes,
bran fiber flakes with raisins and mixed fruit and chocolate cereals are becoming popular among
the Turkish consumers.
Sauces and syrups: Various brands of sauces for salads, meat and international cuisines are
popular in Turkey. Especially the increasing popularity of Asian cuisine is promoting the
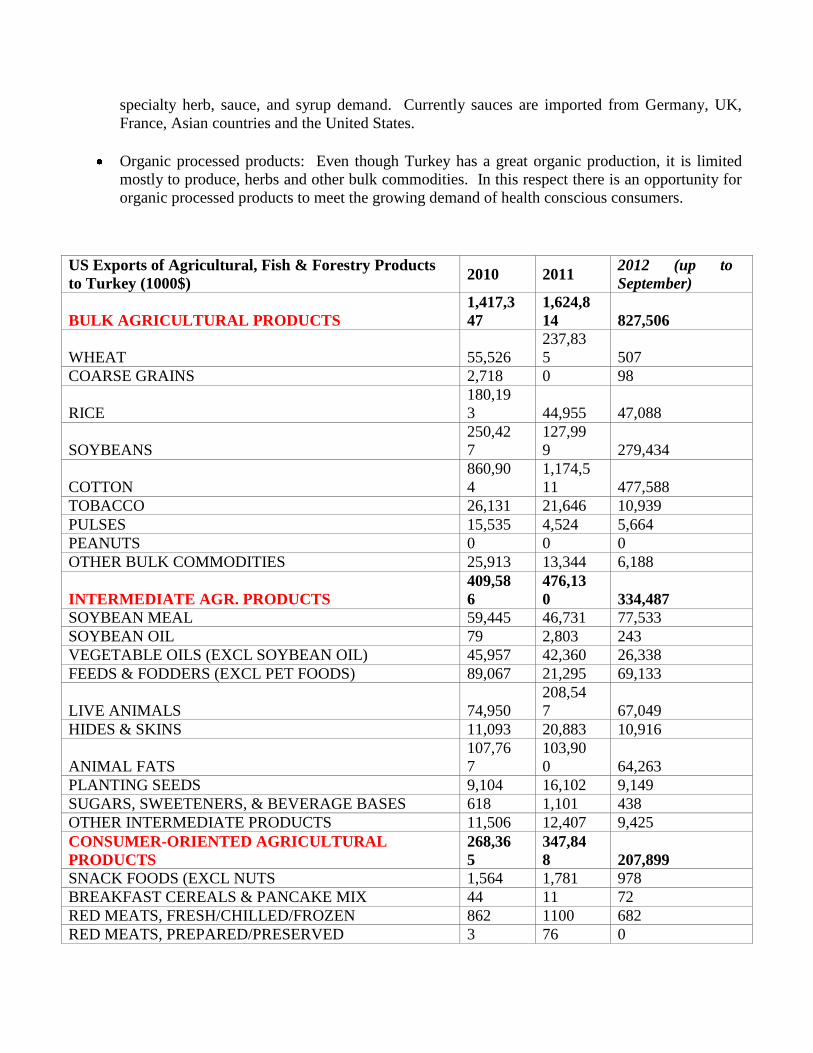
specialty herb, sauce, and syrup demand. Currently sauces are imported from Germany, UK,
France, Asian countries and the United States.
Organic processed products: Even though Turkey has a great organic production, it is limited
mostly to produce, herbs and other bulk commodities. In this respect there is an opportunity for
organic processed products to meet the growing demand of health conscious consumers.
US Exports of Agricultural, Fish & Forestry Products
to Turkey (1000$) 2010 2011
2012 (up to
September)
BULK AGRICULTURAL PRODUCTS
1,417,3
47
1,624,8
14 827,506
WHEAT 55,526
237,83
5 507
COARSE GRAINS 2,718 0 98
RICE
180,19
3 44,955 47,088
SOYBEANS
250,42
7
127,99
9 279,434
COTTON
860,90
4
1,174,5
11 477,588
TOBACCO 26,131 21,646 10,939
PULSES 15,535 4,524 5,664
PEANUTS 0 0 0
OTHER BULK COMMODITIES 25,913 13,344 6,188
INTERMEDIATE AGR. PRODUCTS
409,58
6
476,13
0 334,487
SOYBEAN MEAL 59,445 46,731 77,533
SOYBEAN OIL 79 2,803 243
VEGETABLE OILS (EXCL SOYBEAN OIL) 45,957 42,360 26,338
FEEDS & FODDERS (EXCL PET FOODS) 89,067 21,295 69,133
LIVE ANIMALS 74,950
208,54
7 67,049
HIDES & SKINS 11,093 20,883 10,916
ANIMAL FATS
107,76
7
103,90
0 64,263
PLANTING SEEDS 9,104 16,102 9,149
SUGARS, SWEETENERS, & BEVERAGE BASES 618 1,101 438
OTHER INTERMEDIATE PRODUCTS 11,506 12,407 9,425
CONSUMER-ORIENTED AGRICULTURAL
PRODUCTS
268,36
5
347,84
8 207,899
SNACK FOODS (EXCL NUTS 1,564 1,781 978
BREAKFAST CEREALS & PANCAKE MIX 44 11 72
RED MEATS, FRESH/CHILLED/FROZEN 862 1100 682
RED MEATS, PREPARED/PRESERVED 3 76 0
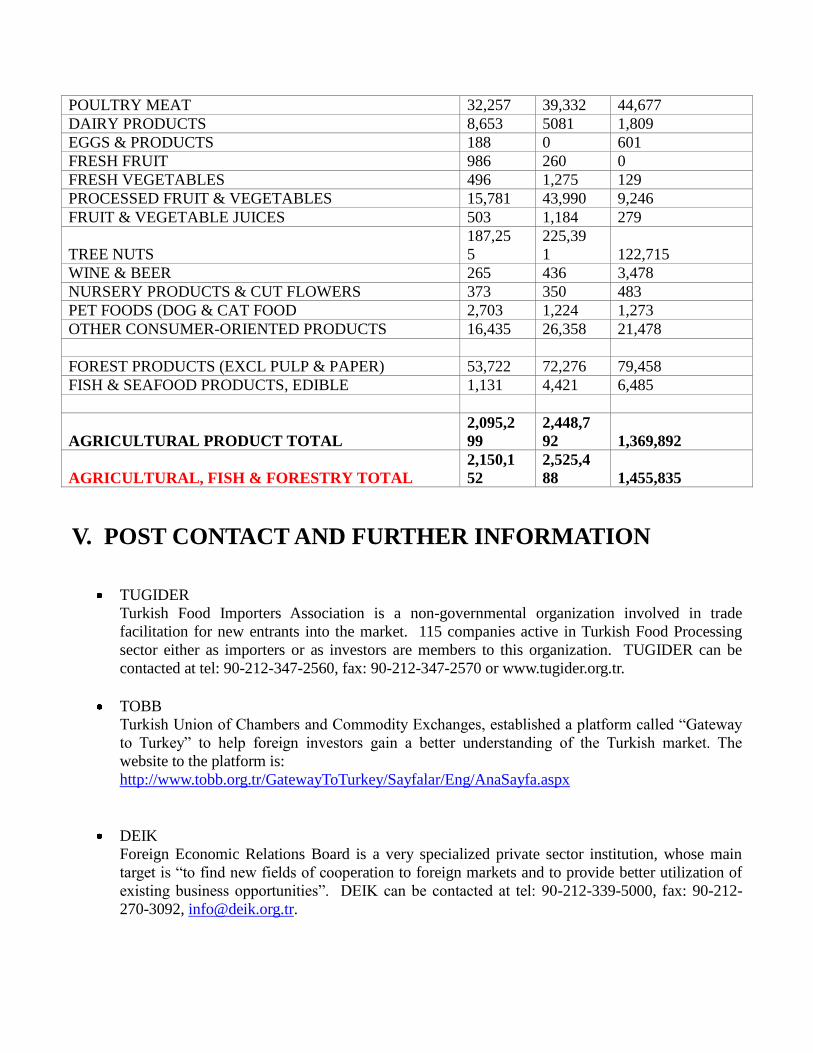
POULTRY MEAT 32,257 39,332 44,677
DAIRY PRODUCTS 8,653 5081 1,809
EGGS & PRODUCTS 188 0 601
FRESH FRUIT 986 260 0
FRESH VEGETABLES 496 1,275 129
PROCESSED FRUIT & VEGETABLES 15,781 43,990 9,246
FRUIT & VEGETABLE JUICES 503 1,184 279
TREE NUTS
187,25
5
225,39
1 122,715
WINE & BEER 265 436 3,478
NURSERY PRODUCTS & CUT FLOWERS 373 350 483
PET FOODS (DOG & CAT FOOD 2,703 1,224 1,273
OTHER CONSUMER-ORIENTED PRODUCTS 16,435 26,358 21,478
FOREST PRODUCTS (EXCL PULP & PAPER) 53,722 72,276 79,458
FISH & SEAFOOD PRODUCTS, EDIBLE 1,131 4,421 6,485
AGRICULTURAL PRODUCT TOTAL
2,095,2
99
2,448,7
92 1,369,892
AGRICULTURAL, FISH & FORESTRY TOTAL
2,150,1
52
2,525,4
88 1,455,835
V. POST CONTACT AND FURTHER INFORMATION
TUGIDER
Turkish Food Importers Association is a non-governmental organization involved in trade
facilitation for new entrants into the market. 115 companies active in Turkish Food Processing
sector either as importers or as investors are members to this organization. TUGIDER can be
contacted at tel: 90-212-347-2560, fax: 90-212-347-2570 or www.tugider.org.tr.
TOBB
Turkish Union of Chambers and Commodity Exchanges, established a platform called “Gateway
to Turkey” to help foreign investors gain a better understanding of the Turkish market. The
website to the platform is:
http://www.tobb.org.tr/GatewayToTurkey/Sayfalar/Eng/AnaSayfa.aspx
DEIK
Foreign Economic Relations Board is a very specialized private sector institution, whose main
target is “to find new fields of cooperation to foreign markets and to provide better utilization of
existing business opportunities”. DEIK can be contacted at tel: 90-212-339-5000, fax: 90-212-
270-3092, [email protected].
USDA’s Foreign Agricultural Service has two offices in Turkey; the Ankara Embassy and the Consulate
General in Istanbul.
FAS Ankara:
Foreign Agricultural Service
Embassy of the United States
110 Ataturk Bulvari
Ankara, Turkey
U.S. mailing address:
Foreign Agricultural Service
U.S. Embassy Ankara
PSC 93 Box 5000
APO AE 09823
Tel: 90-312-455-5555 Ext: 2406
Direct: 90-312-468-6129
Fax: 90-312-467-0056
FAS Istanbul:
Foreign Agricultural Service
Consulate General of the United States
Istinye Mah. Kaplicalar Mevkii No: 2
Istinye, Istanbul, Turkey
U.S. (APO) Address:
PSC 97, Box 0002
APO AE 09827-0002
For more information on high value food items, commodity and other reports for Turkey and other
countries, please refer to FAS homepage, http://www.fas.usda.gov.
Recommended