USER GUIDE
v1.1 Release
2 TURBO CHART USER GUIDE
Table of Contents TIME LOCATION CHARTS ........................................................................................................................................... 3
TURBO-CHART OVERVIEW ......................................................................................................................................... 4
TURBO-CHART SAMPLE DATA ................................................................................................................................... 5
PREPARING PRIMAVERA P6 SCHEDULE DATA .......................................................................................................... 6
Creating Additional Data Fields ...................................................................................................................................................................................... 6
Populate Additional Data Fields ...................................................................................................................................................................................... 6
Preparing P6 Layout for Spreadsheet Import .............................................................................................................................................................. 7
P6 Schedule Data Preparation Tips ................................................................................................................................................................................ 7
IMPORTING SCHEDULE DATA INTO TURBO-CHART .................................................................................................. 8
Connecting to a local P6 Database ................................................................................................................................................................................. 8
Importing from P6 XER file ................................................................................................................................................................................................. 9
Importing from Spreadsheet Data ................................................................................................................................................................................. 10
Post Importing ..................................................................................................................................................................................................................... 11
Managing Datasets ........................................................................................................................................................................................................... 12
Tips on Importing and Managing Datasets .................................................................................................................................................................. 12
NAVIGATING AROUND TURBO-CHART................................................................................................................... 13
Turbo-Chart Release and Filename ............................................................................................................................................................................... 13
Menu ...................................................................................................................................................................................................................................... 13
Top Image Area ................................................................................................................................................................................................................. 14
Chart Area ........................................................................................................................................................................................................................... 14
Status Bar ............................................................................................................................................................................................................................. 17
Chart Shape Library Pane ............................................................................................................................................................................................... 18
Active Task Pane ................................................................................................................................................................................................................ 19
Active Shape Pane ............................................................................................................................................................................................................. 20
Chart View Zoom ............................................................................................................................................................................................................... 21
CUSTOMISING CHARTS ............................................................................................................................................ 22
Customising Shape Library .............................................................................................................................................................................................. 22
Top Image ............................................................................................................................................................................................................................ 24
Highlighters .......................................................................................................................................................................................................................... 25
Annotations .......................................................................................................................................................................................................................... 26
Time Location Chart Reporting with Turbo-Chart ...................................................................................................... 28
Synching data to a P6 database when connected .................................................................................................................................................... 28
Adding datasets from updated spreadsheet/XER files ............................................................................................................................................ 29
Duplicating Charts .............................................................................................................................................................................................................. 29
Displaying Multiple Datasets ........................................................................................................................................................................................... 30
Page Layouts and Print Previews ................................................................................................................................................................................... 30
Saving/Exchanging Turbo-Chart files ........................................................................................................................................................................... 35
FURTHER HELP.......................................................................................................................................................... 36
Updates to Turbo-Chart are listed on our website: http://www.turbo-chart.com/changelog
TURBO CHART USER GUIDE
3
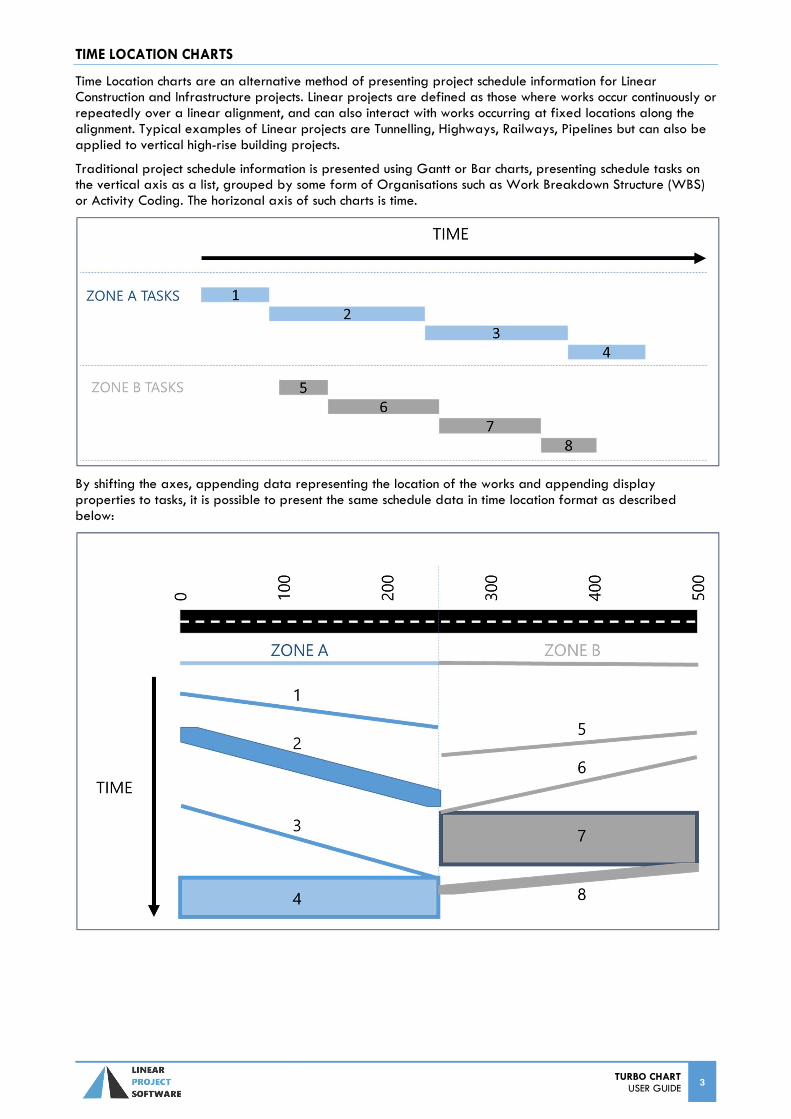
TIME LOCATION CHARTS
Time Location charts are an alternative method of presenting project schedule information for Linear Construction and Infrastructure projects. Linear projects are defined as those where works occur continuously or repeatedly over a linear alignment, and can also interact with works occurring at fixed locations along the alignment. Typical examples of Linear projects are Tunnelling, Highways, Railways, Pipelines but can also be applied to vertical high-rise building projects.
Traditional project schedule information is presented using Gantt or Bar charts, presenting schedule tasks on the vertical axis as a list, grouped by some form of Organisations such as Work Breakdown Structure (WBS) or Activity Coding. The horizonal axis of such charts is time.
By shifting the axes, appending data representing the location of the works and appending display properties to tasks, it is possible to present the same schedule data in time location format as described below:
4 TURBO CHART USER GUIDE
TURBO-CHART OVERVIEW
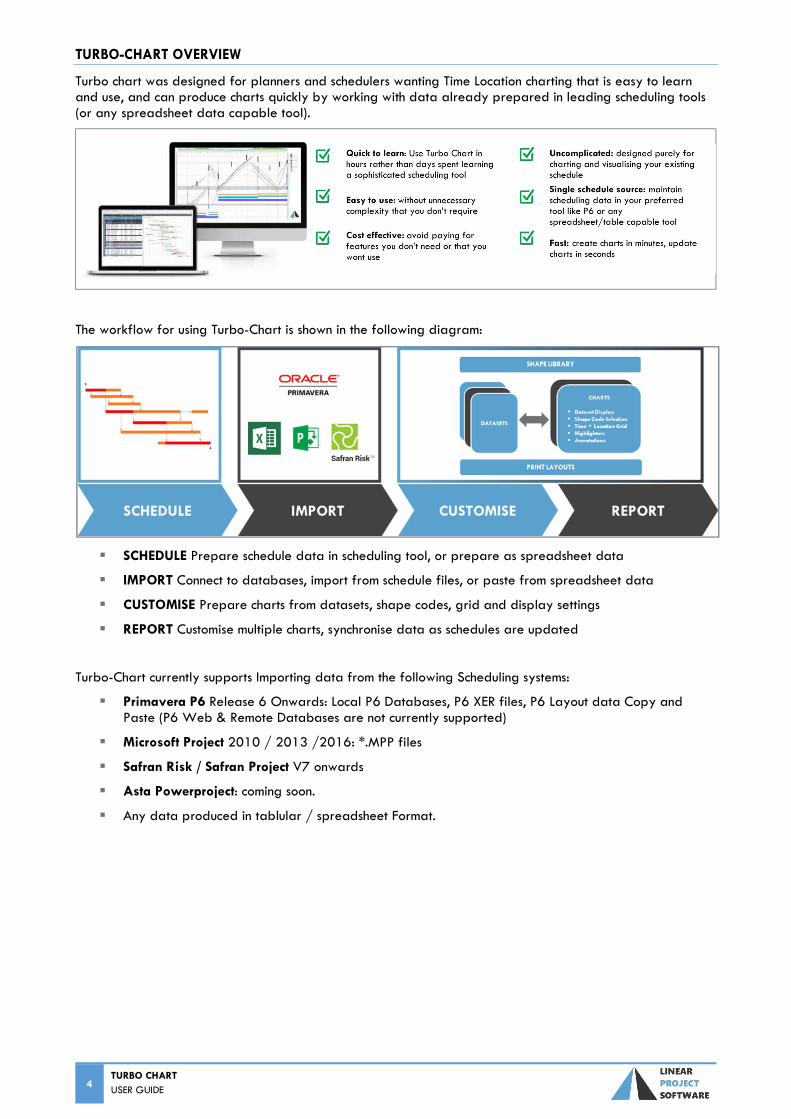
Turbo chart was designed for planners and schedulers wanting Time Location charting that is easy to learn and use, and can produce charts quickly by working with data already prepared in leading scheduling tools (or any spreadsheet data capable tool).
The workflow for using Turbo-Chart is shown in the following diagram:
SCHEDULE Prepare schedule data in scheduling tool, or prepare as spreadsheet data
IMPORT Connect to databases, import from schedule files, or paste from spreadsheet data
CUSTOMISE Prepare charts from datasets, shape codes, grid and display settings
REPORT Customise multiple charts, synchronise data as schedules are updated
Turbo-Chart currently supports Importing data from the following Scheduling systems:
Primavera P6 Release 6 Onwards: Local P6 Databases, P6 XER files, P6 Layout data Copy and Paste (P6 Web & Remote Databases are not currently supported)
Microsoft Project 2010 / 2013 /2016: *.MPP files
Safran Risk / Safran Project V7 onwards
Asta Powerproject: coming soon.
Any data produced in tablular / spreadsheet Format.
TURBO CHART USER GUIDE
5
TURBO-CHART SAMPLE DATA
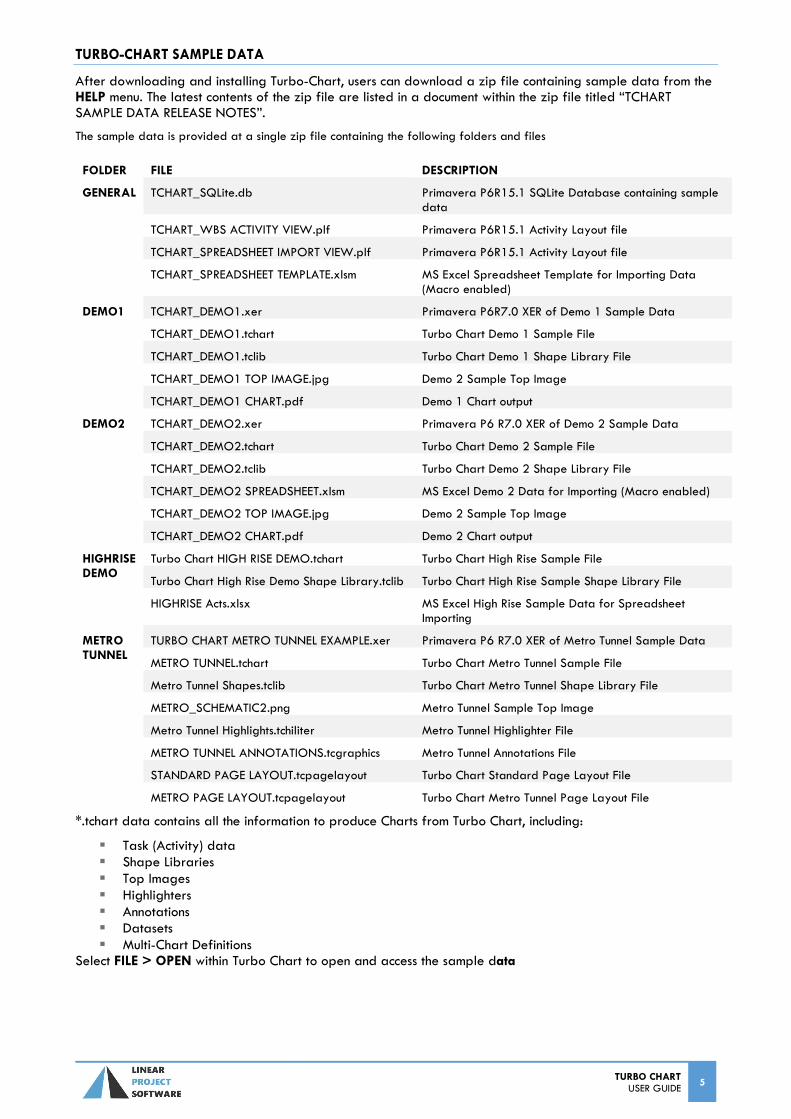
After downloading and installing Turbo-Chart, users can download a zip file containing sample data from the HELP menu. The latest contents of the zip file are listed in a document within the zip file titled “TCHART SAMPLE DATA RELEASE NOTES”.
The sample data is provided at a single zip file containing the following folders and files
FOLDER FILE DESCRIPTION
GENERAL TCHART_SQLite.db Primavera P6R15.1 SQLite Database containing sample data
TCHART_WBS ACTIVITY VIEW.plf Primavera P6R15.1 Activity Layout file
TCHART_SPREADSHEET IMPORT VIEW.plf Primavera P6R15.1 Activity Layout file
TCHART_SPREADSHEET TEMPLATE.xlsm MS Excel Spreadsheet Template for Importing Data (Macro enabled)
DEMO1 TCHART_DEMO1.xer Primavera P6R7.0 XER of Demo 1 Sample Data
TCHART_DEMO1.tchart Turbo Chart Demo 1 Sample File
TCHART_DEMO1.tclib Turbo Chart Demo 1 Shape Library File
TCHART_DEMO1 TOP IMAGE.jpg Demo 2 Sample Top Image
TCHART_DEMO1 CHART.pdf Demo 1 Chart output
DEMO2 TCHART_DEMO2.xer Primavera P6 R7.0 XER of Demo 2 Sample Data
TCHART_DEMO2.tchart Turbo Chart Demo 2 Sample File
TCHART_DEMO2.tclib Turbo Chart Demo 2 Shape Library File
TCHART_DEMO2 SPREADSHEET.xlsm MS Excel Demo 2 Data for Importing (Macro enabled)
TCHART_DEMO2 TOP IMAGE.jpg Demo 2 Sample Top Image
TCHART_DEMO2 CHART.pdf Demo 2 Chart output
HIGHRISE DEMO
Turbo Chart HIGH RISE DEMO.tchart Turbo Chart High Rise Sample File
Turbo Chart High Rise Demo Shape Library.tclib Turbo Chart High Rise Sample Shape Library File
HIGHRISE Acts.xlsx MS Excel High Rise Sample Data for Spreadsheet Importing
METRO TUNNEL
TURBO CHART METRO TUNNEL EXAMPLE.xer Primavera P6 R7.0 XER of Metro Tunnel Sample Data
METRO TUNNEL.tchart Turbo Chart Metro Tunnel Sample File
Metro Tunnel Shapes.tclib Turbo Chart Metro Tunnel Shape Library File
METRO_SCHEMATIC2.png Metro Tunnel Sample Top Image
Metro Tunnel Highlights.tchiliter Metro Tunnel Highlighter File
METRO TUNNEL ANNOTATIONS.tcgraphics Metro Tunnel Annotations File
STANDARD PAGE LAYOUT.tcpagelayout Turbo Chart Standard Page Layout File
METRO PAGE LAYOUT.tcpagelayout Turbo Chart Metro Tunnel Page Layout File
*.tchart data contains all the information to produce Charts from Turbo Chart, including:
Task (Activity) data Shape Libraries Top Images Highlighters Annotations Datasets Multi-Chart Definitions
Select FILE > OPEN within Turbo Chart to open and access the sample data
6 TURBO CHART USER GUIDE
PREPARING PRIMAVERA P6 SCHEDULE DATA
Creating Additional Data Fields
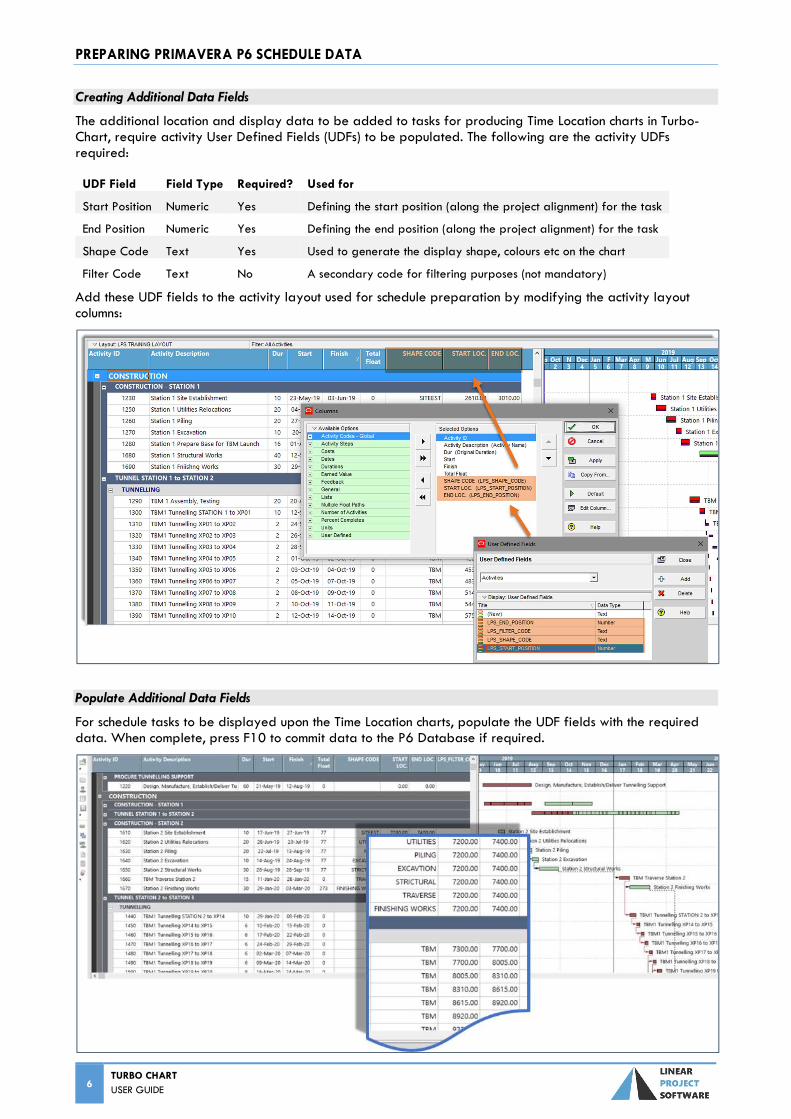
The additional location and display data to be added to tasks for producing Time Location charts in Turbo-Chart, require activity User Defined Fields (UDFs) to be populated. The following are the activity UDFs required:
UDF Field Field Type Required? Used for
Start Position Numeric Yes Defining the start position (along the project alignment) for the task
End Position Numeric Yes Defining the end position (along the project alignment) for the task
Shape Code Text Yes Used to generate the display shape, colours etc on the chart
Filter Code Text No A secondary code for filtering purposes (not mandatory)
Add these UDF fields to the activity layout used for schedule preparation by modifying the activity layout columns:
Populate Additional Data Fields
For schedule tasks to be displayed upon the Time Location charts, populate the UDF fields with the required data. When complete, press F10 to commit data to the P6 Database if required.
TURBO CHART USER GUIDE
7
Preparing P6 Layout for Spreadsheet Import
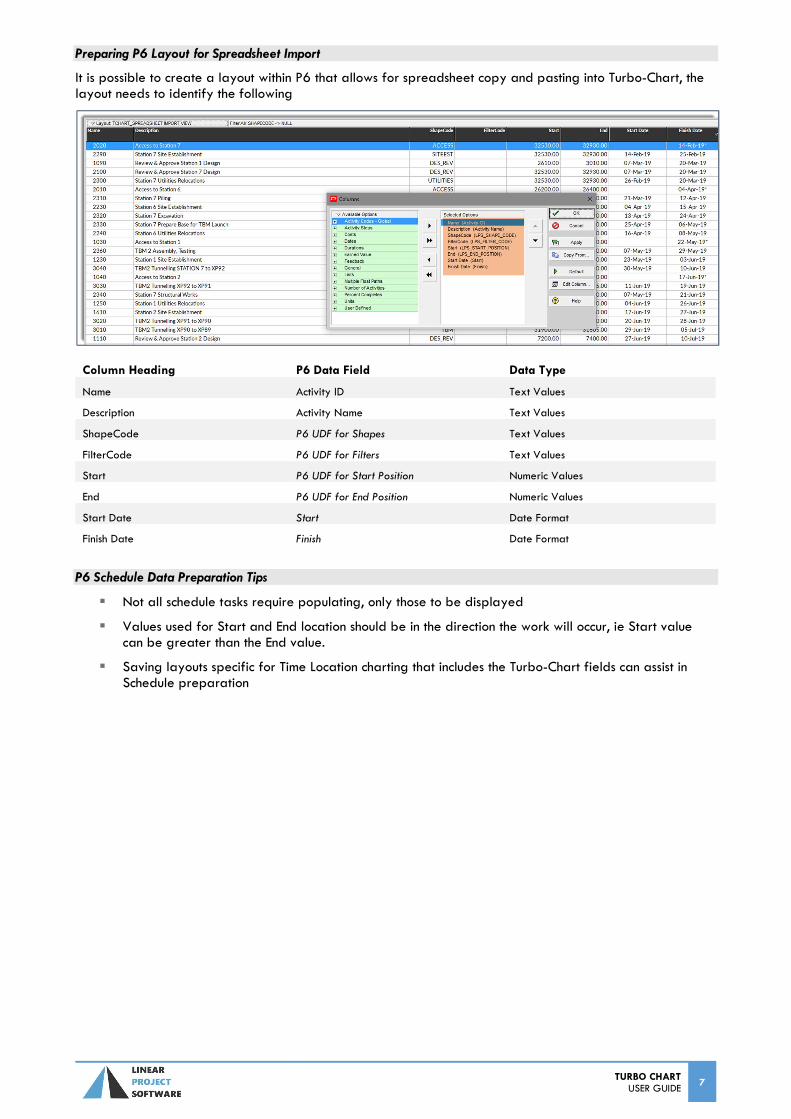
It is possible to create a layout within P6 that allows for spreadsheet copy and pasting into Turbo-Chart, the layout needs to identify the following
Column Heading P6 Data Field Data Type
Name Activity ID Text Values
Description Activity Name Text Values
ShapeCode P6 UDF for Shapes Text Values
FilterCode P6 UDF for Filters Text Values
Start P6 UDF for Start Position Numeric Values
End P6 UDF for End Position Numeric Values
Start Date Start Date Format
Finish Date Finish Date Format
P6 Schedule Data Preparation Tips
Not all schedule tasks require populating, only those to be displayed
Values used for Start and End location should be in the direction the work will occur, ie Start value can be greater than the End value.
Saving layouts specific for Time Location charting that includes the Turbo-Chart fields can assist in Schedule preparation
8 TURBO CHART USER GUIDE
IMPORTING SCHEDULE DATA INTO TURBO-CHART
Once schedule data is prepared, it can be imported into Turbo-Chart as a dataset, note that Turbo-Chart can contain multiple datasets. Data can be imported by either:
Connecting directly to the scheduling system (eg Primavera P6 Database)
Connecting to Data exported form the scheduling System (eg. Primavera P6 XER file)
Connecting to via Web Services (Eg. Primavera P6 Cloud Databases)
Pasting Spreadsheet data into a Turbo-Chart Dataset.
Connecting to a local P6 Database
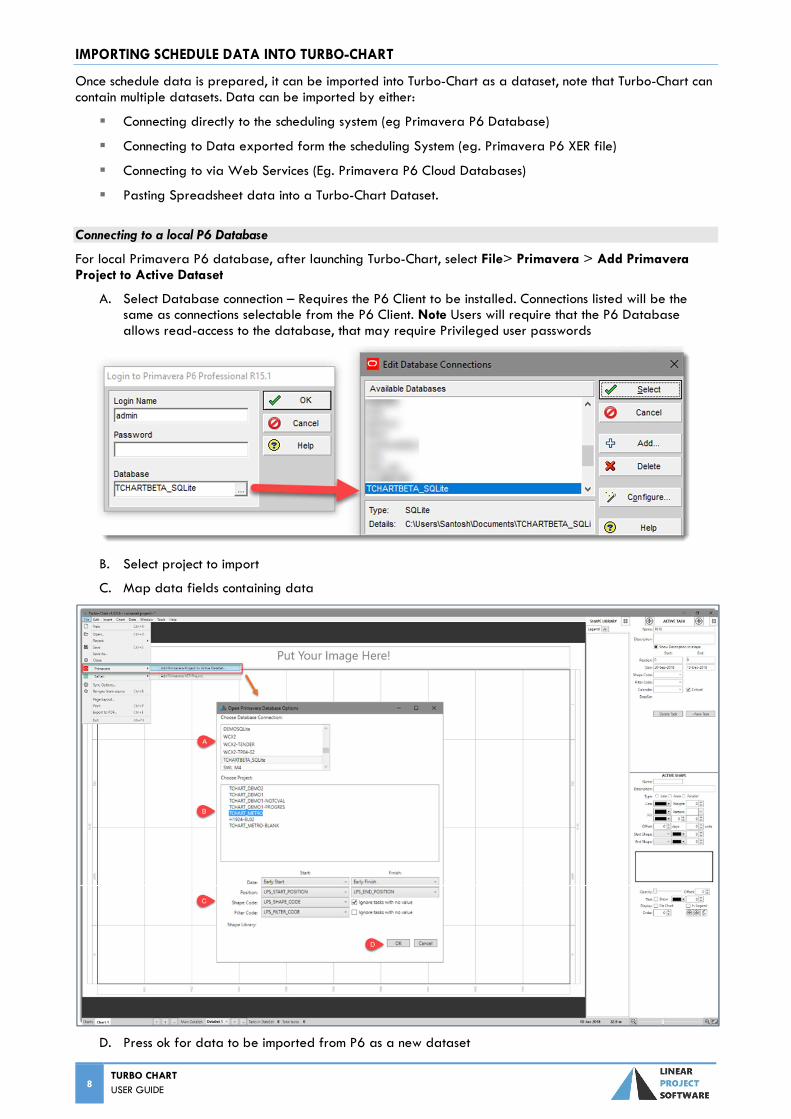
For local Primavera P6 database, after launching Turbo-Chart, select File> Primavera > Add Primavera Project to Active Dataset
A. Select Database connection – Requires the P6 Client to be installed. Connections listed will be the same as connections selectable from the P6 Client. Note Users will require that the P6 Database allows read-access to the database, that may require Privileged user passwords
B. Select project to import
C. Map data fields containing data
D. Press ok for data to be imported from P6 as a new dataset
TURBO CHART USER GUIDE
9
Importing from P6 XER file
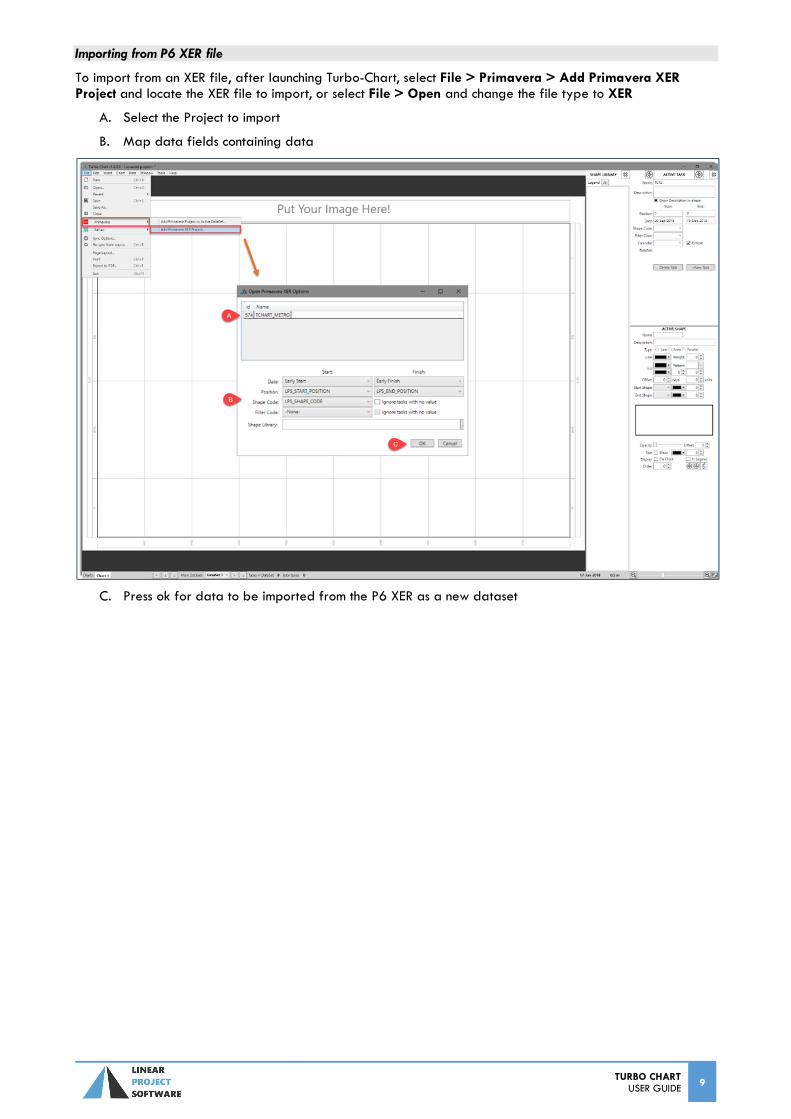
To import from an XER file, after launching Turbo-Chart, select File > Primavera > Add Primavera XER Project and locate the XER file to import, or select File > Open and change the file type to XER
A. Select the Project to import
B. Map data fields containing data
C. Press ok for data to be imported from the P6 XER as a new dataset
10 TURBO CHART USER GUIDE
Importing from Spreadsheet Data
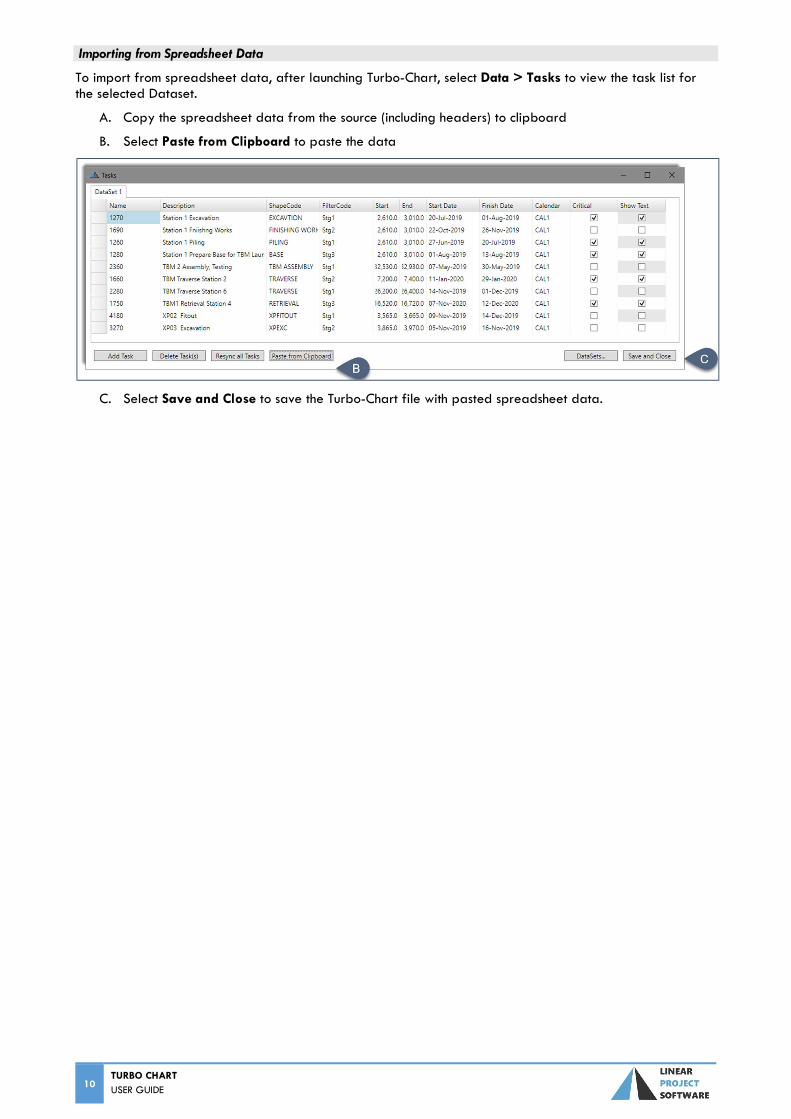
To import from spreadsheet data, after launching Turbo-Chart, select Data > Tasks to view the task list for the selected Dataset.
A. Copy the spreadsheet data from the source (including headers) to clipboard
B. Select Paste from Clipboard to paste the data
C. Select Save and Close to save the Turbo-Chart file with pasted spreadsheet data.
TURBO CHART USER GUIDE
11
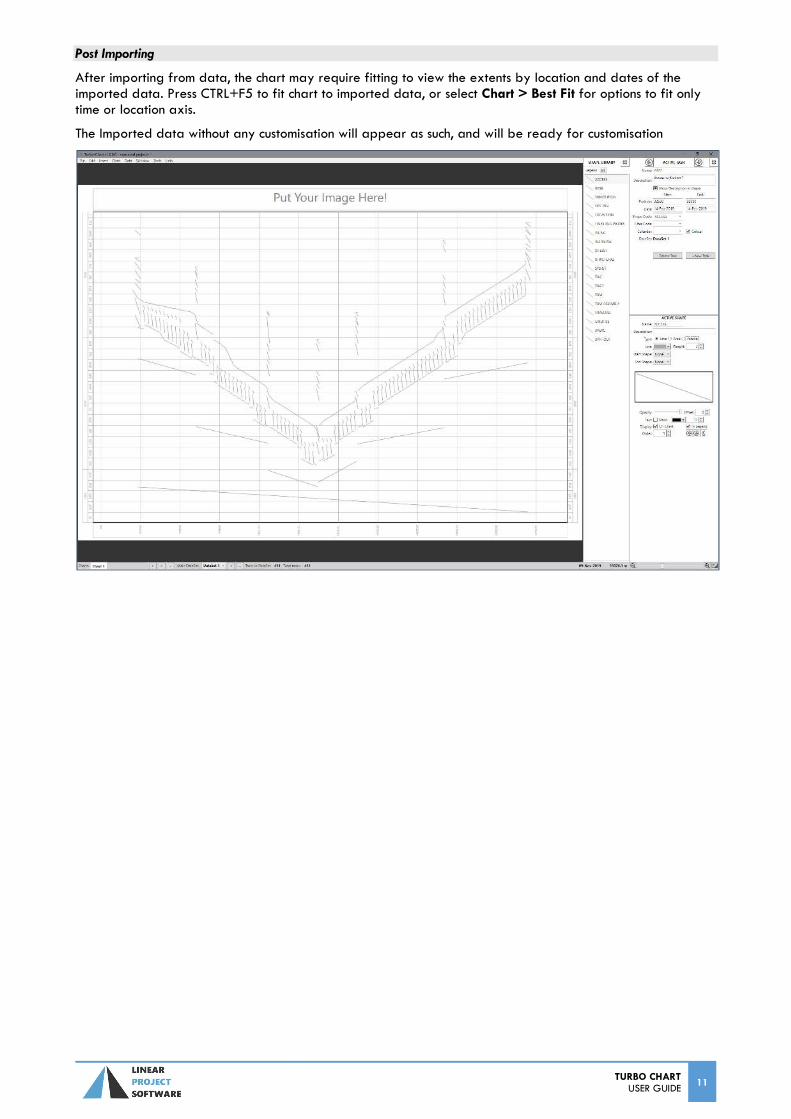
Post Importing
After importing from data, the chart may require fitting to view the extents by location and dates of the imported data. Press CTRL+F5 to fit chart to imported data, or select Chart > Best Fit for options to fit only time or location axis.
The Imported data without any customisation will appear as such, and will be ready for customisation
12 TURBO CHART USER GUIDE
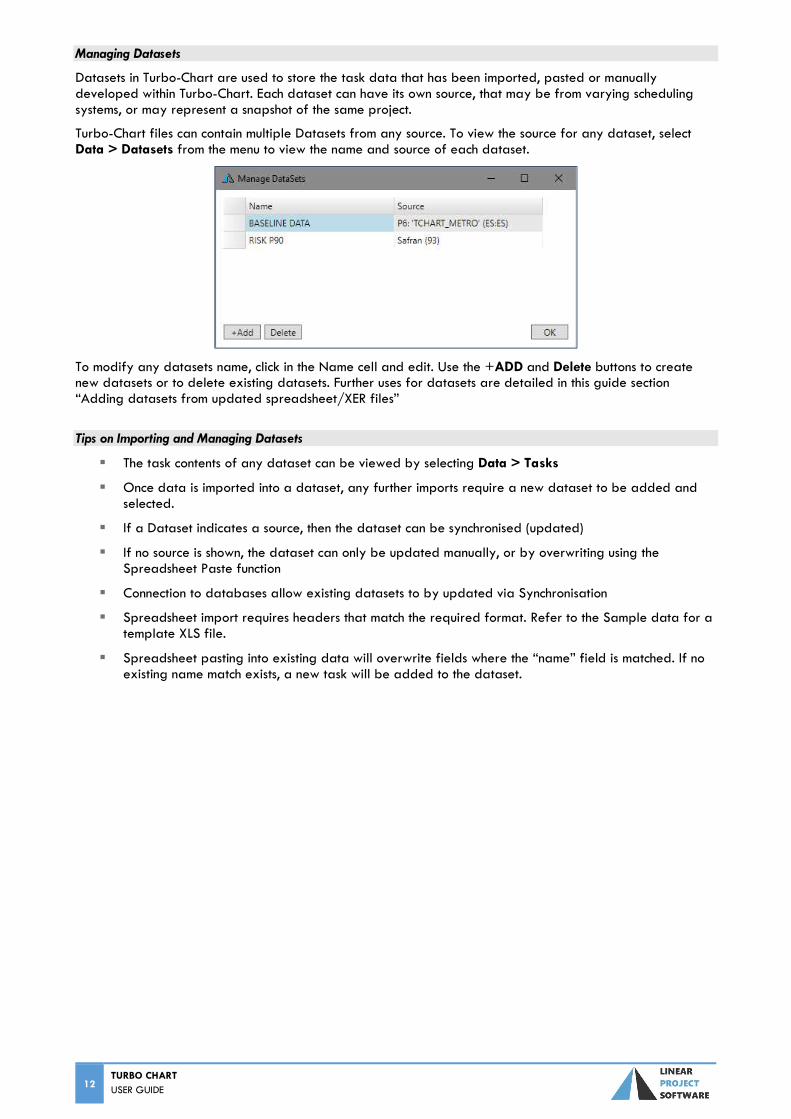
Managing Datasets
Datasets in Turbo-Chart are used to store the task data that has been imported, pasted or manually developed within Turbo-Chart. Each dataset can have its own source, that may be from varying scheduling systems, or may represent a snapshot of the same project.
Turbo-Chart files can contain multiple Datasets from any source. To view the source for any dataset, select Data > Datasets from the menu to view the name and source of each dataset.
To modify any datasets name, click in the Name cell and edit. Use the +ADD and Delete buttons to create new datasets or to delete existing datasets. Further uses for datasets are detailed in this guide section “Adding datasets from updated spreadsheet/XER files”
Tips on Importing and Managing Datasets
The task contents of any dataset can be viewed by selecting Data > Tasks
Once data is imported into a dataset, any further imports require a new dataset to be added and selected.
If a Dataset indicates a source, then the dataset can be synchronised (updated)
If no source is shown, the dataset can only be updated manually, or by overwriting using the Spreadsheet Paste function
Connection to databases allow existing datasets to by updated via Synchronisation
Spreadsheet import requires headers that match the required format. Refer to the Sample data for a template XLS file.
Spreadsheet pasting into existing data will overwrite fields where the “name” field is matched. If no existing name match exists, a new task will be added to the dataset.
TURBO CHART USER GUIDE
13
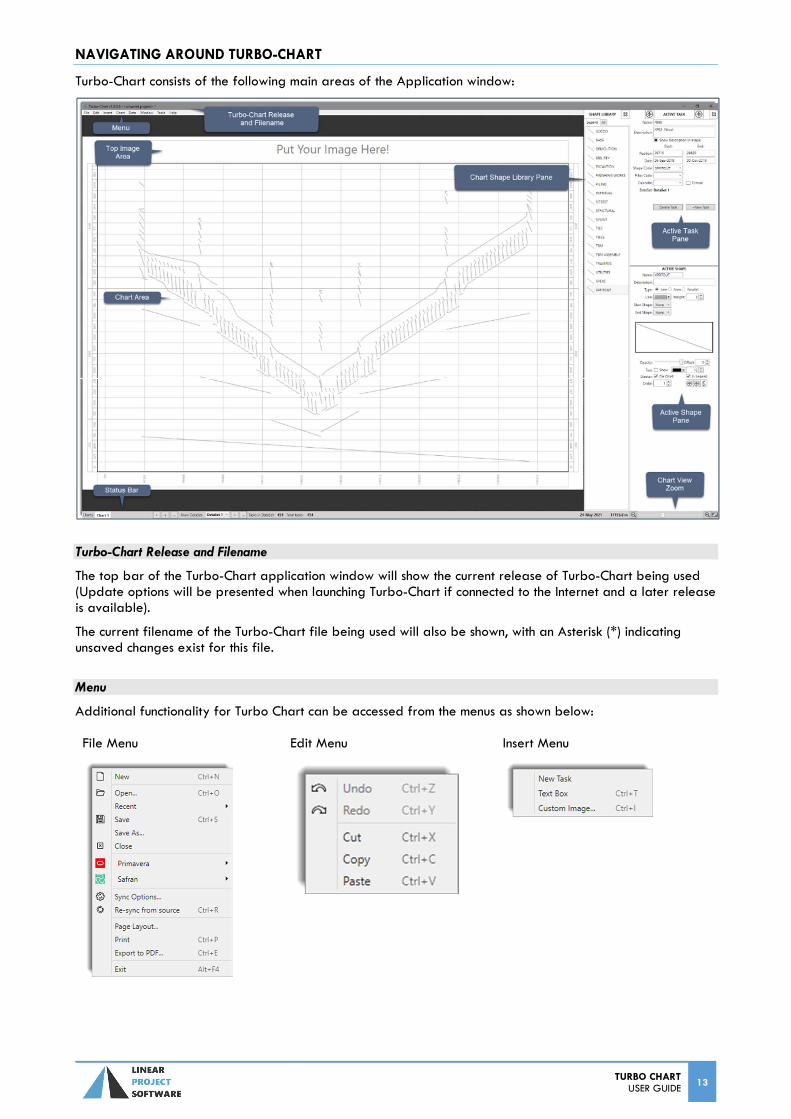
NAVIGATING AROUND TURBO-CHART
Turbo-Chart consists of the following main areas of the Application window:
Turbo-Chart Release and Filename
The top bar of the Turbo-Chart application window will show the current release of Turbo-Chart being used (Update options will be presented when launching Turbo-Chart if connected to the Internet and a later release is available).
The current filename of the Turbo-Chart file being used will also be shown, with an Asterisk (*) indicating unsaved changes exist for this file.
Menu
Additional functionality for Turbo Chart can be accessed from the menus as shown below:
File Menu
Edit Menu
Insert Menu
14 TURBO CHART USER GUIDE
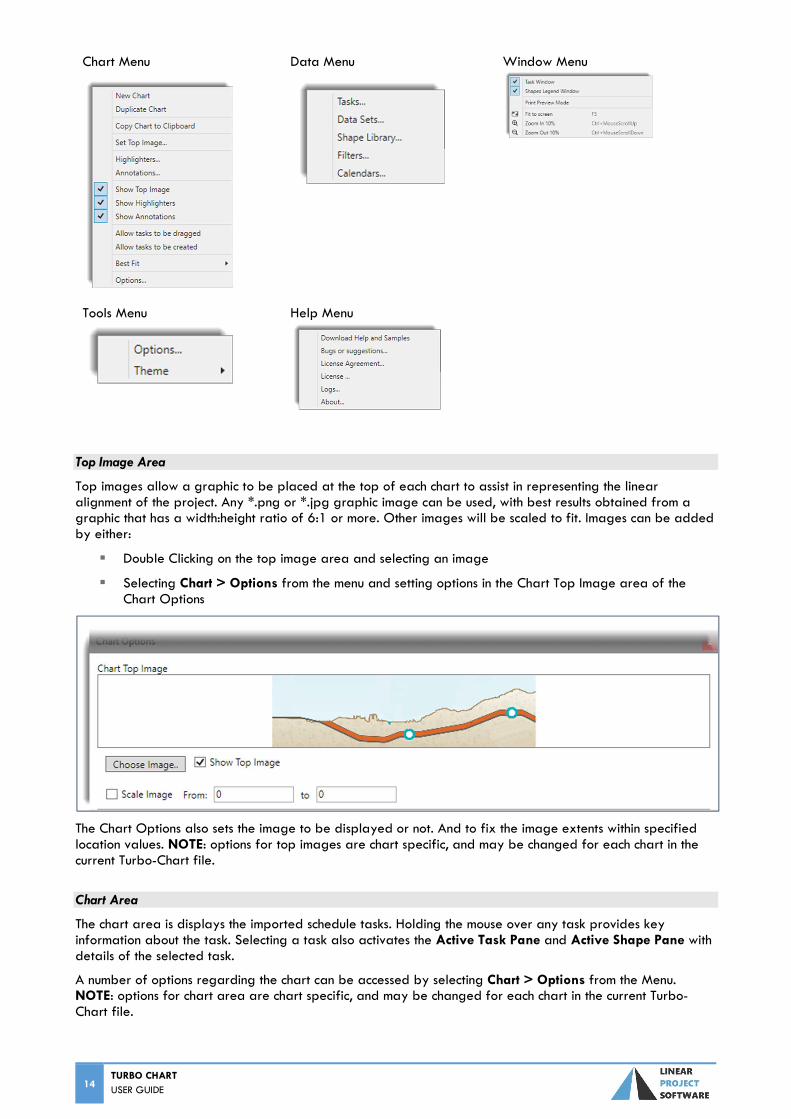
Chart Menu
Data Menu
Window Menu
Tools Menu
Help Menu
Top Image Area
Top images allow a graphic to be placed at the top of each chart to assist in representing the linear alignment of the project. Any *.png or *.jpg graphic image can be used, with best results obtained from a graphic that has a width:height ratio of 6:1 or more. Other images will be scaled to fit. Images can be added by either:
Double Clicking on the top image area and selecting an image
Selecting Chart > Options from the menu and setting options in the Chart Top Image area of the Chart Options
The Chart Options also sets the image to be displayed or not. And to fix the image extents within specified location values. NOTE: options for top images are chart specific, and may be changed for each chart in the current Turbo-Chart file.
Chart Area
The chart area is displays the imported schedule tasks. Holding the mouse over any task provides key information about the task. Selecting a task also activates the Active Task Pane and Active Shape Pane with details of the selected task.
A number of options regarding the chart can be accessed by selecting Chart > Options from the Menu. NOTE: options for chart area are chart specific, and may be changed for each chart in the current Turbo-Chart file.
TURBO CHART USER GUIDE
15
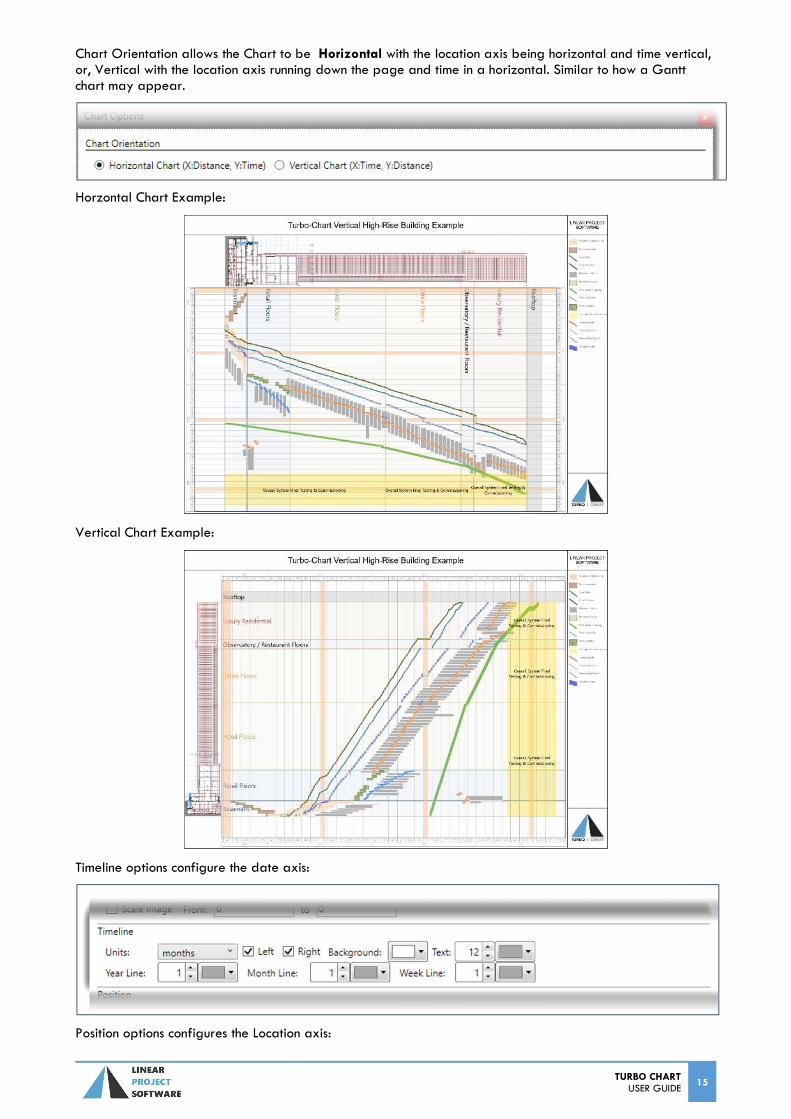
Chart Orientation allows the Chart to be Horizontal with the location axis being horizontal and time vertical, or, Vertical with the location axis running down the page and time in a horizontal. Similar to how a Gantt chart may appear.
Horzontal Chart Example:
Vertical Chart Example:
Timeline options configure the date axis:
Position options configures the Location axis:
16 TURBO CHART USER GUIDE
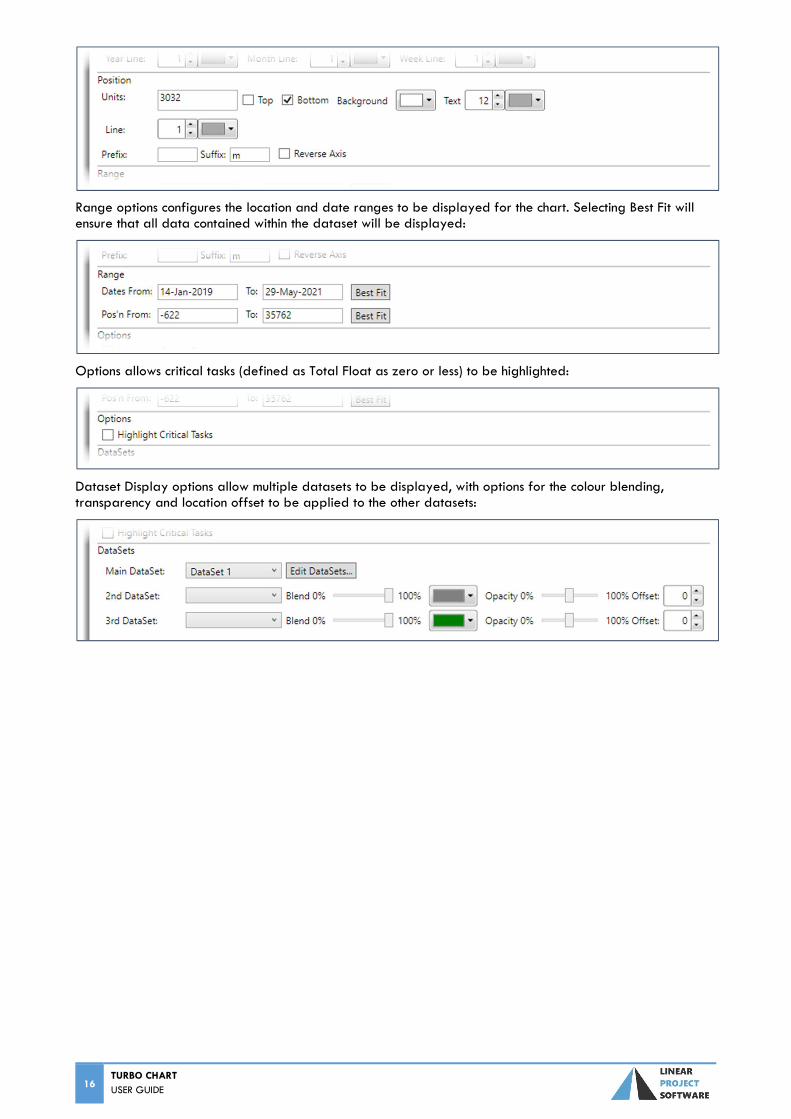
Range options configures the location and date ranges to be displayed for the chart. Selecting Best Fit will ensure that all data contained within the dataset will be displayed:
Options allows critical tasks (defined as Total Float as zero or less) to be highlighted:
Dataset Display options allow multiple datasets to be displayed, with options for the colour blending, transparency and location offset to be applied to the other datasets:
TURBO CHART USER GUIDE
17
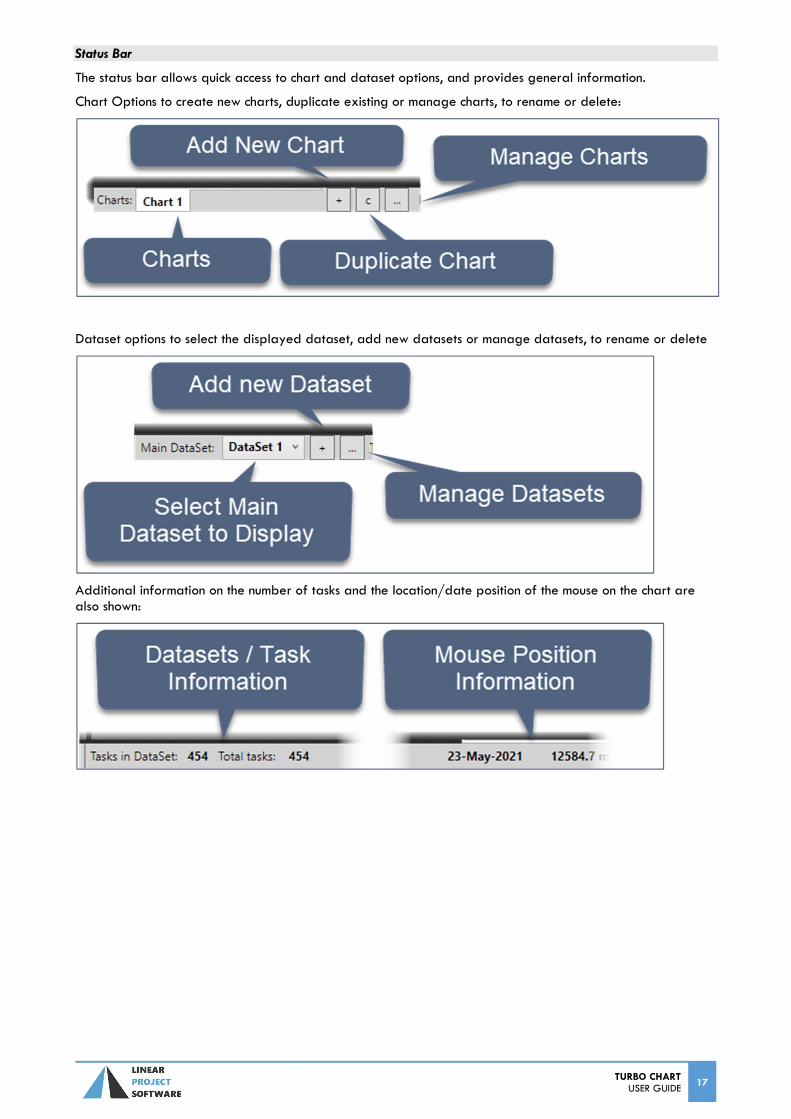
Status Bar
The status bar allows quick access to chart and dataset options, and provides general information.
Chart Options to create new charts, duplicate existing or manage charts, to rename or delete:
Dataset options to select the displayed dataset, add new datasets or manage datasets, to rename or delete
Additional information on the number of tasks and the location/date position of the mouse on the chart are also shown:
18 TURBO CHART USER GUIDE
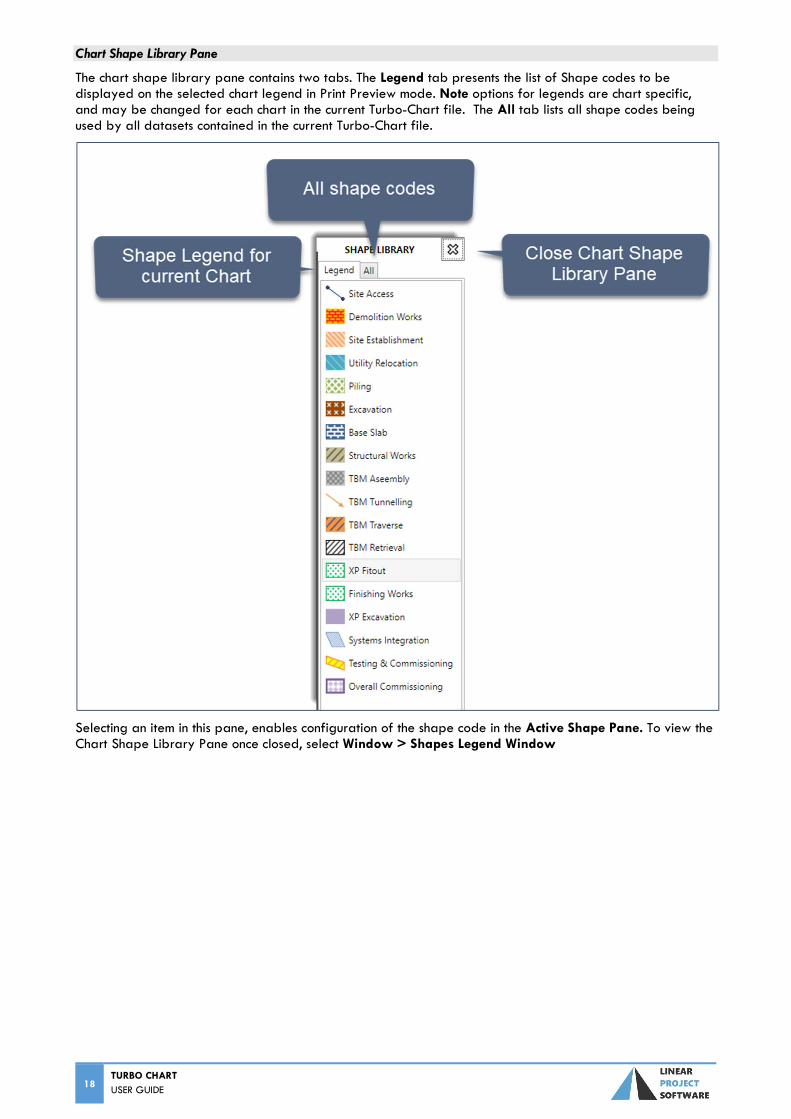
Chart Shape Library Pane
The chart shape library pane contains two tabs. The Legend tab presents the list of Shape codes to be displayed on the selected chart legend in Print Preview mode. Note options for legends are chart specific, and may be changed for each chart in the current Turbo-Chart file. The All tab lists all shape codes being used by all datasets contained in the current Turbo-Chart file.
Selecting an item in this pane, enables configuration of the shape code in the Active Shape Pane. To view the Chart Shape Library Pane once closed, select Window > Shapes Legend Window
TURBO CHART USER GUIDE
19
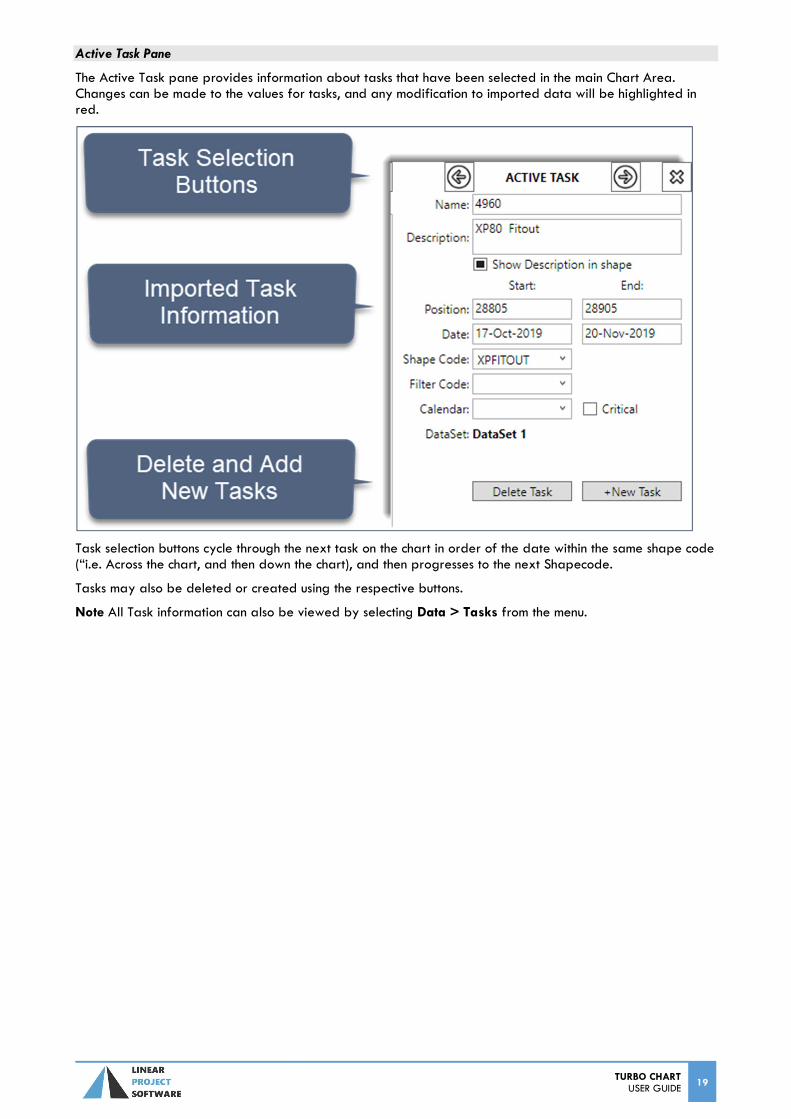
Active Task Pane
The Active Task pane provides information about tasks that have been selected in the main Chart Area. Changes can be made to the values for tasks, and any modification to imported data will be highlighted in red.
Task selection buttons cycle through the next task on the chart in order of the date within the same shape code (“i.e. Across the chart, and then down the chart), and then progresses to the next Shapecode.
Tasks may also be deleted or created using the respective buttons.
Note All Task information can also be viewed by selecting Data > Tasks from the menu.
20 TURBO CHART USER GUIDE
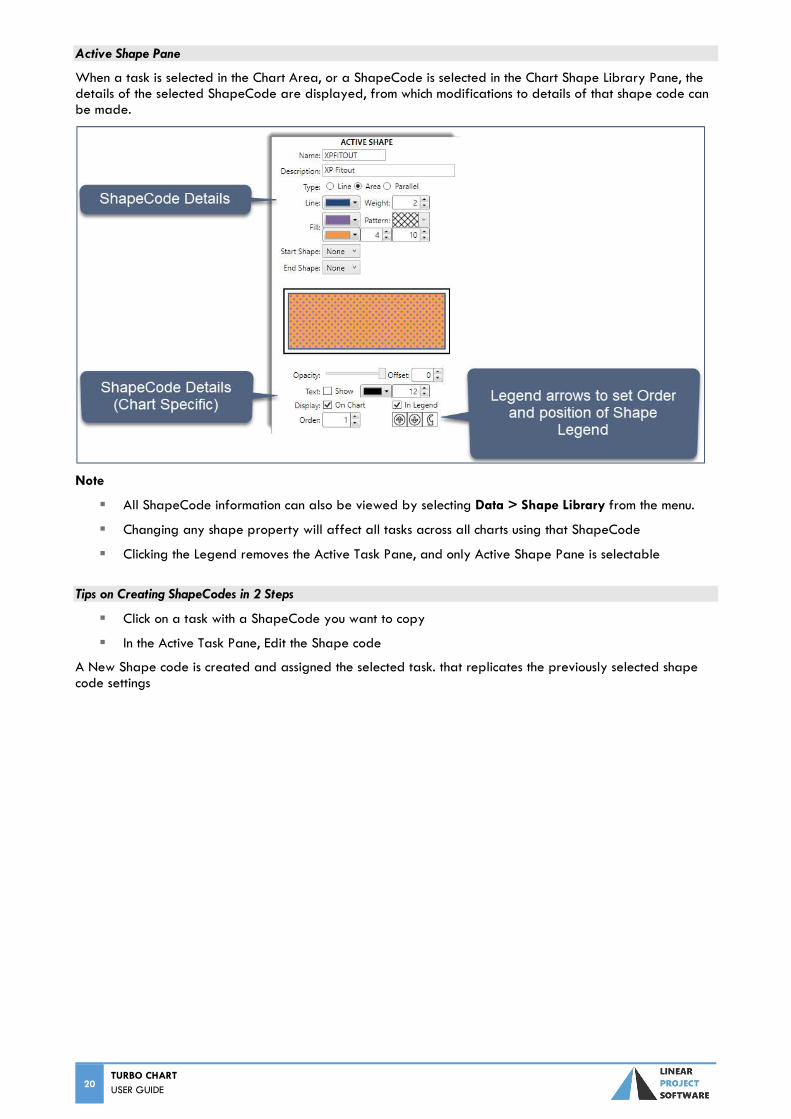
Active Shape Pane
When a task is selected in the Chart Area, or a ShapeCode is selected in the Chart Shape Library Pane, the details of the selected ShapeCode are displayed, from which modifications to details of that shape code can be made.
Note
All ShapeCode information can also be viewed by selecting Data > Shape Library from the menu.
Changing any shape property will affect all tasks across all charts using that ShapeCode
Clicking the Legend removes the Active Task Pane, and only Active Shape Pane is selectable
Tips on Creating ShapeCodes in 2 Steps
Click on a task with a ShapeCode you want to copy
In the Active Task Pane, Edit the Shape code
A New Shape code is created and assigned the selected task. that replicates the previously selected shape code settings
TURBO CHART USER GUIDE
21
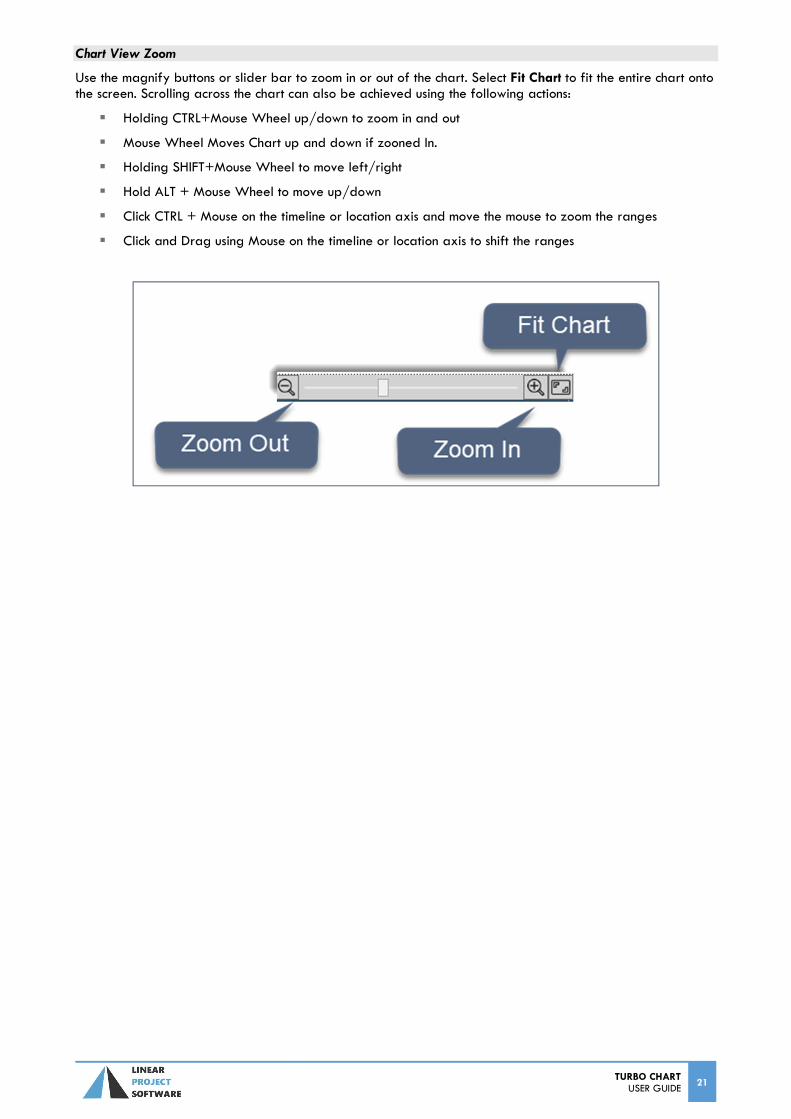
Chart View Zoom
Use the magnify buttons or slider bar to zoom in or out of the chart. Select Fit Chart to fit the entire chart onto the screen. Scrolling across the chart can also be achieved using the following actions:
Holding CTRL+Mouse Wheel up/down to zoom in and out
Mouse Wheel Moves Chart up and down if zooned In.
Holding SHIFT+Mouse Wheel to move left/right
Hold ALT + Mouse Wheel to move up/down
Click CTRL + Mouse on the timeline or location axis and move the mouse to zoom the ranges
Click and Drag using Mouse on the timeline or location axis to shift the ranges
22 TURBO CHART USER GUIDE
CUSTOMISING CHARTS
After importing data into Turbo-Chart, Time Location charts can be prepared by customising the following elements:
Shape Library: display definitions for Shape Codes and to assigned tasks
Top Image: insert a graphic used as reference against the location axis
Highlighters: add text or shaded areas within set location and date ranges
Annotations: add text or graphic annotations to the chart
Customising Shape Library
The shape library defines the properties applied for each ShapeCode in the dataset and to the tasks that are assigned to the respective ShapeCodes. These properties include:
Shape description: text used in the chart legend (default is the shape code value)
The shape type: Line, area or parallel
Shape display settings for colour, line weight, fill patterns and start/end shapes
After importing data, there are three methods of customising the shape library
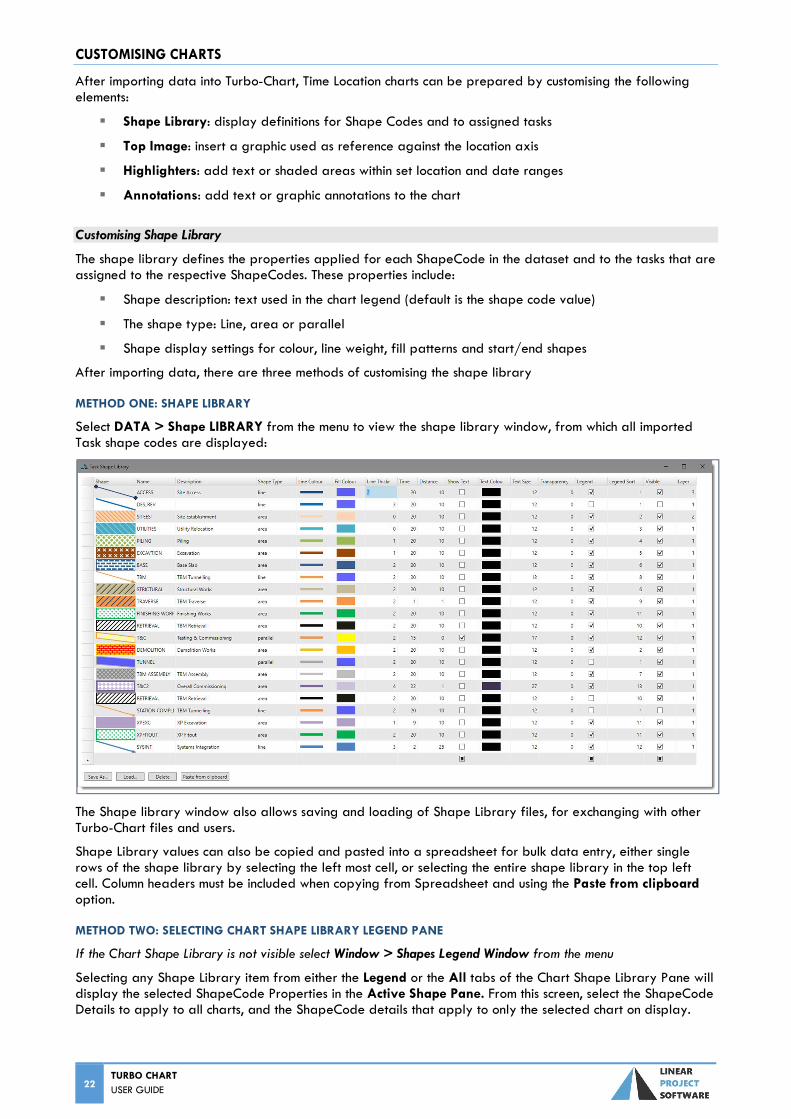
METHOD ONE: SHAPE LIBRARY
Select DATA > Shape LIBRARY from the menu to view the shape library window, from which all imported Task shape codes are displayed:
The Shape library window also allows saving and loading of Shape Library files, for exchanging with other Turbo-Chart files and users.
Shape Library values can also be copied and pasted into a spreadsheet for bulk data entry, either single rows of the shape library by selecting the left most cell, or selecting the entire shape library in the top left cell. Column headers must be included when copying from Spreadsheet and using the Paste from clipboard option.
METHOD TWO: SELECTING CHART SHAPE LIBRARY LEGEND PANE
If the Chart Shape Library is not visible select Window > Shapes Legend Window from the menu
Selecting any Shape Library item from either the Legend or the All tabs of the Chart Shape Library Pane will display the selected ShapeCode Properties in the Active Shape Pane. From this screen, select the ShapeCode Details to apply to all charts, and the ShapeCode details that apply to only the selected chart on display.
TURBO CHART USER GUIDE
23
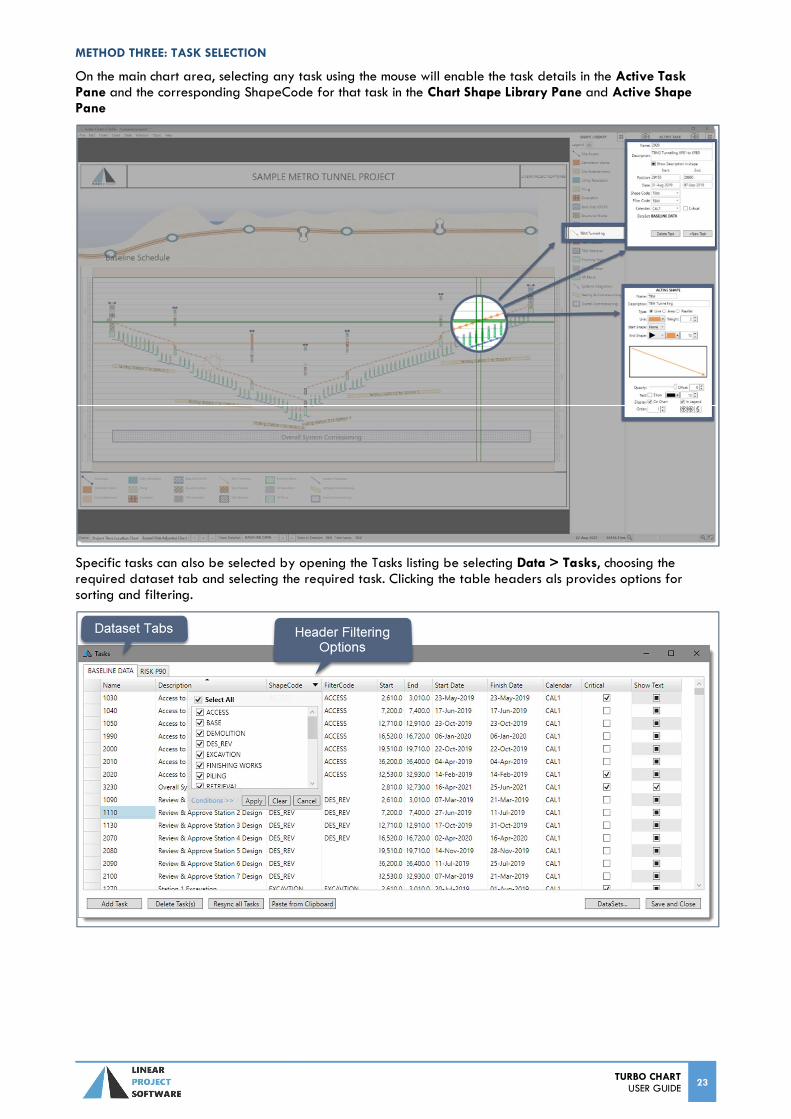
METHOD THREE: TASK SELECTION
On the main chart area, selecting any task using the mouse will enable the task details in the Active Task Pane and the corresponding ShapeCode for that task in the Chart Shape Library Pane and Active Shape Pane
Specific tasks can also be selected by opening the Tasks listing be selecting Data > Tasks, choosing the required dataset tab and selecting the required task. Clicking the table headers als provides options for sorting and filtering.
24 TURBO CHART USER GUIDE
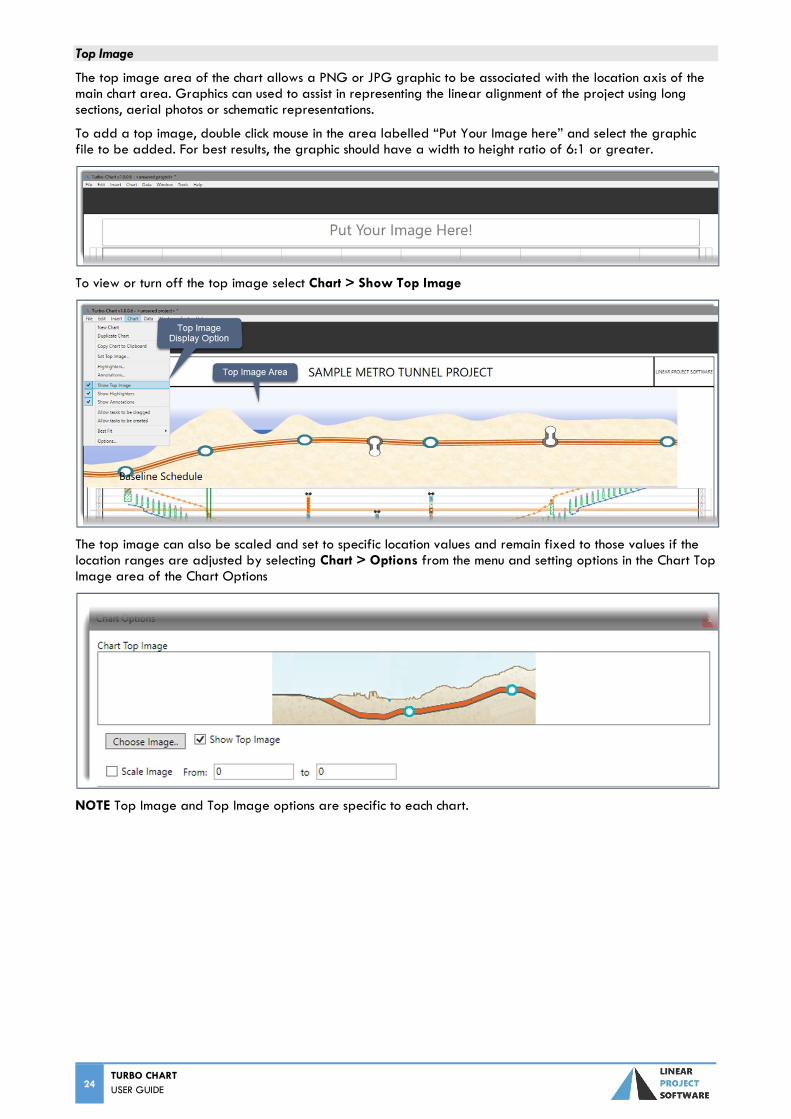
Top Image
The top image area of the chart allows a PNG or JPG graphic to be associated with the location axis of the main chart area. Graphics can used to assist in representing the linear alignment of the project using long sections, aerial photos or schematic representations.
To add a top image, double click mouse in the area labelled “Put Your Image here” and select the graphic file to be added. For best results, the graphic should have a width to height ratio of 6:1 or greater.
To view or turn off the top image select Chart > Show Top Image
The top image can also be scaled and set to specific location values and remain fixed to those values if the location ranges are adjusted by selecting Chart > Options from the menu and setting options in the Chart Top Image area of the Chart Options
NOTE Top Image and Top Image options are specific to each chart.
TURBO CHART USER GUIDE
25
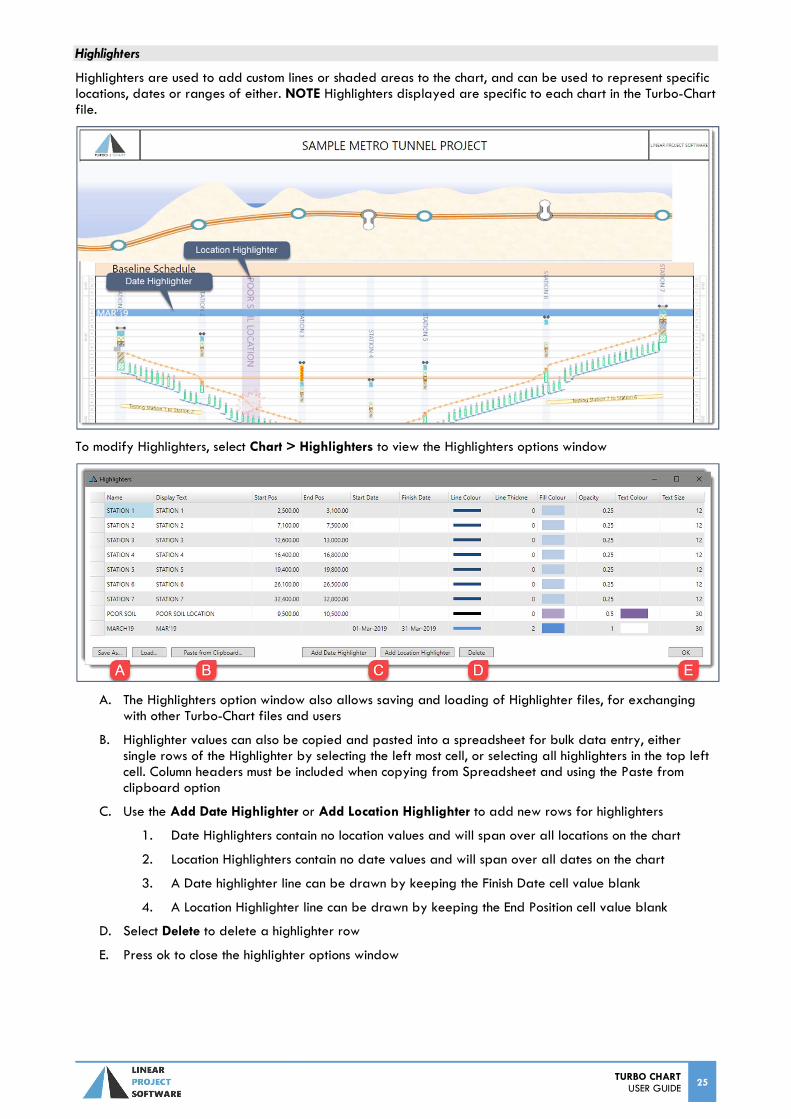
Highlighters
Highlighters are used to add custom lines or shaded areas to the chart, and can be used to represent specific locations, dates or ranges of either. NOTE Highlighters displayed are specific to each chart in the Turbo-Chart file.
To modify Highlighters, select Chart > Highlighters to view the Highlighters options window
A. The Highlighters option window also allows saving and loading of Highlighter files, for exchanging with other Turbo-Chart files and users
B. Highlighter values can also be copied and pasted into a spreadsheet for bulk data entry, either single rows of the Highlighter by selecting the left most cell, or selecting all highlighters in the top left cell. Column headers must be included when copying from Spreadsheet and using the Paste from clipboard option
C. Use the Add Date Highlighter or Add Location Highlighter to add new rows for highlighters
1. Date Highlighters contain no location values and will span over all locations on the chart
2. Location Highlighters contain no date values and will span over all dates on the chart
3. A Date highlighter line can be drawn by keeping the Finish Date cell value blank
4. A Location Highlighter line can be drawn by keeping the End Position cell value blank
D. Select Delete to delete a highlighter row
E. Press ok to close the highlighter options window
26 TURBO CHART USER GUIDE
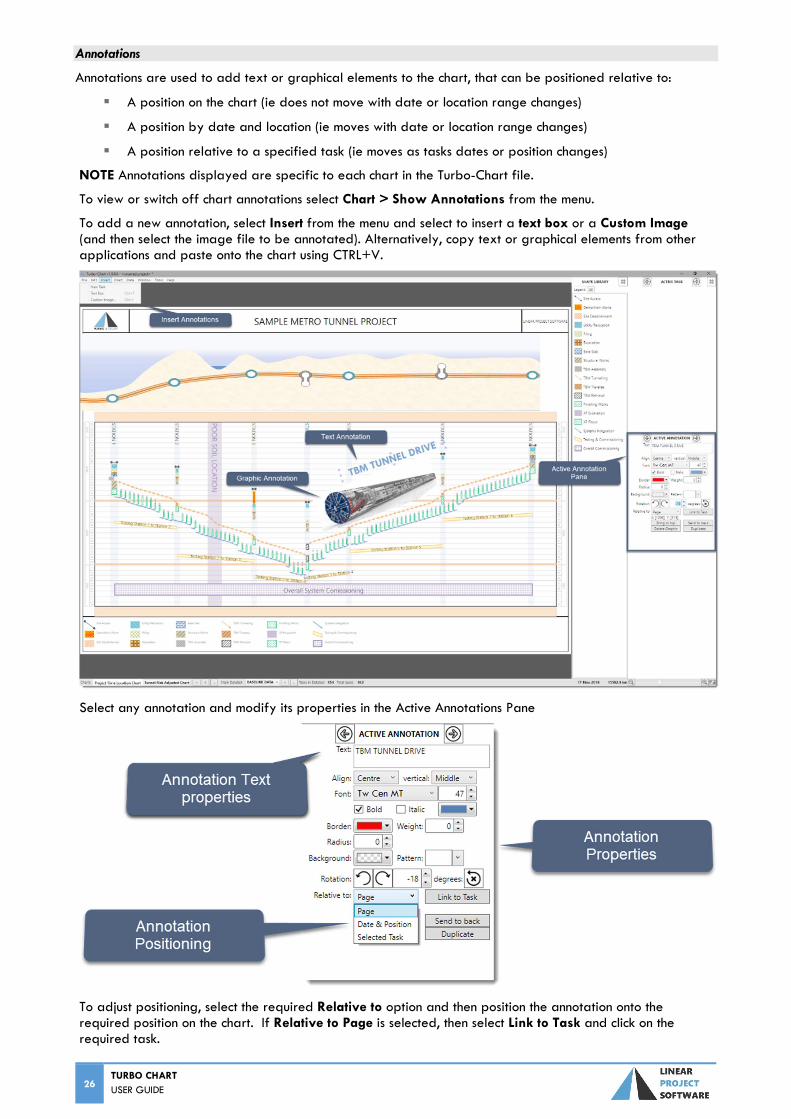
Annotations
Annotations are used to add text or graphical elements to the chart, that can be positioned relative to:
A position on the chart (ie does not move with date or location range changes)
A position by date and location (ie moves with date or location range changes)
A position relative to a specified task (ie moves as tasks dates or position changes)
NOTE Annotations displayed are specific to each chart in the Turbo-Chart file.
To view or switch off chart annotations select Chart > Show Annotations from the menu.
To add a new annotation, select Insert from the menu and select to insert a text box or a Custom Image (and then select the image file to be annotated). Alternatively, copy text or graphical elements from other applications and paste onto the chart using CTRL+V.
Select any annotation and modify its properties in the Active Annotations Pane
To adjust positioning, select the required Relative to option and then position the annotation onto the required position on the chart. If Relative to Page is selected, then select Link to Task and click on the required task.
TURBO CHART USER GUIDE
27
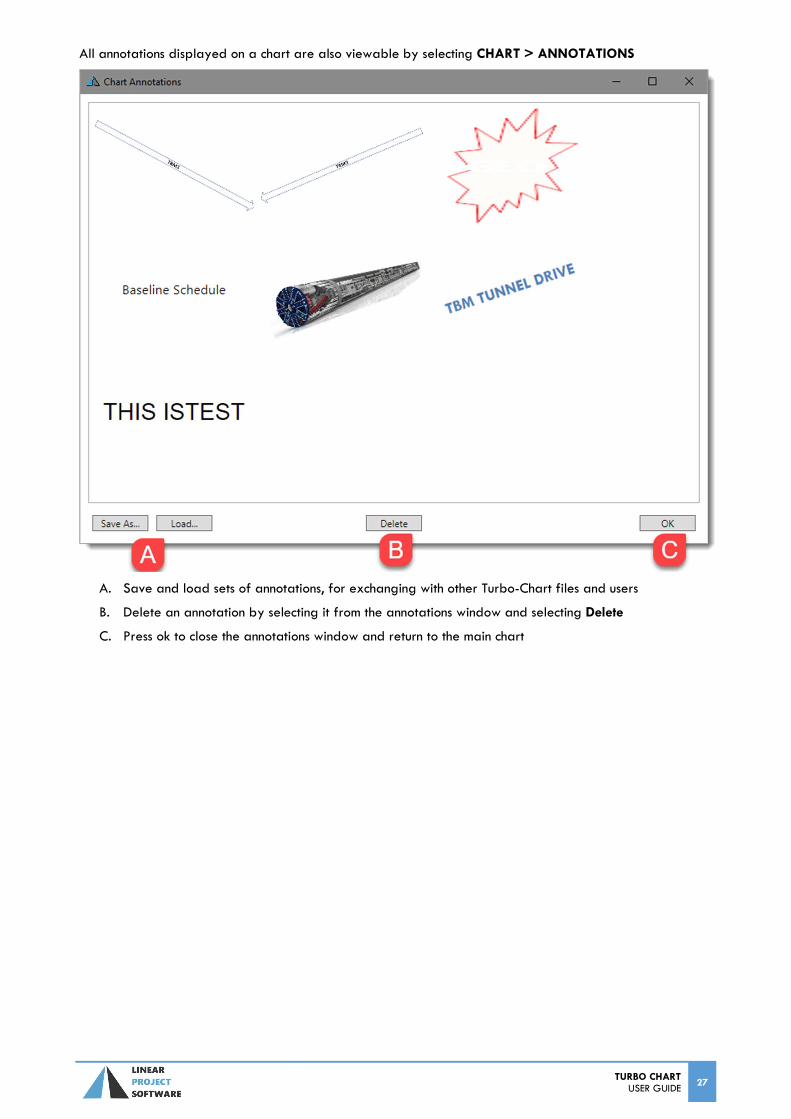
All annotations displayed on a chart are also viewable by selecting CHART > ANNOTATIONS
A. Save and load sets of annotations, for exchanging with other Turbo-Chart files and users
B. Delete an annotation by selecting it from the annotations window and selecting Delete
C. Press ok to close the annotations window and return to the main chart
28 TURBO CHART USER GUIDE
Time Location Chart Reporting with Turbo-Chart
Once Data has been imported and a chart has been customised. Turbo-Chart includes a number of Time Location chart reporting features.
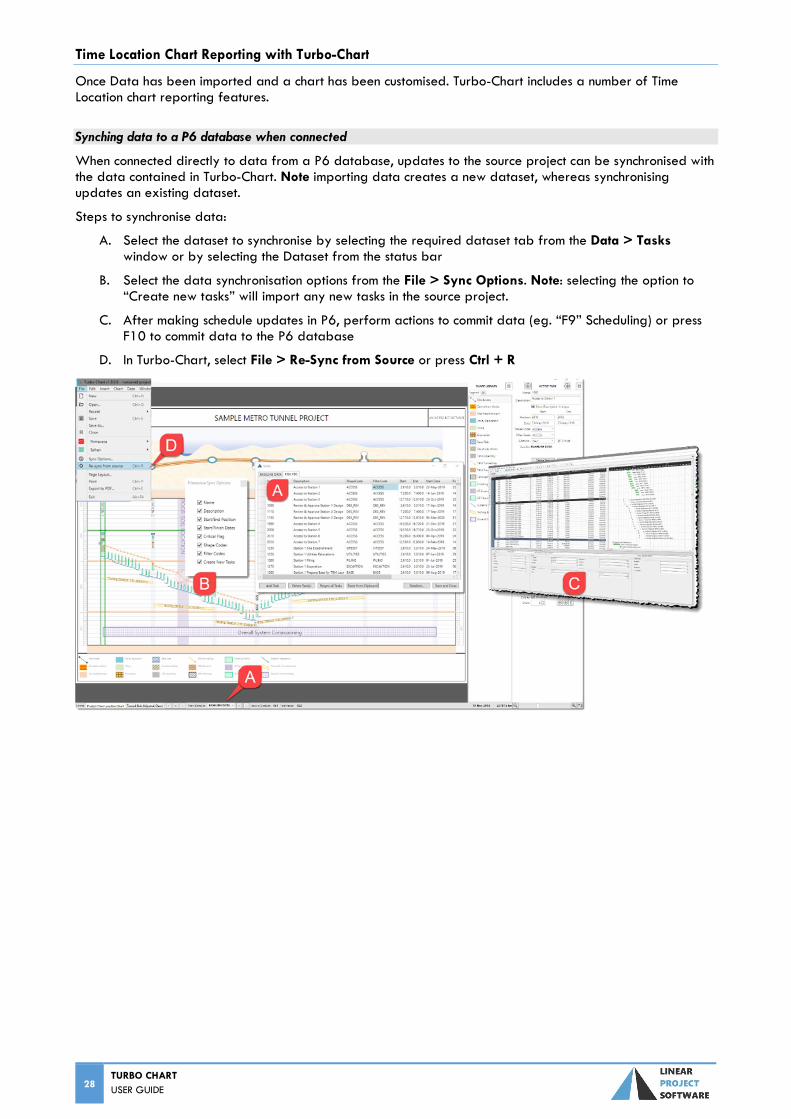
Synching data to a P6 database when connected
When connected directly to data from a P6 database, updates to the source project can be synchronised with the data contained in Turbo-Chart. Note importing data creates a new dataset, whereas synchronising updates an existing dataset.
Steps to synchronise data:
A. Select the dataset to synchronise by selecting the required dataset tab from the Data > Tasks window or by selecting the Dataset from the status bar
B. Select the data synchronisation options from the File > Sync Options. Note: selecting the option to “Create new tasks” will import any new tasks in the source project.
C. After making schedule updates in P6, perform actions to commit data (eg. “F9” Scheduling) or press F10 to commit data to the P6 database
D. In Turbo-Chart, select File > Re-Sync from Source or press Ctrl + R
TURBO CHART USER GUIDE
29
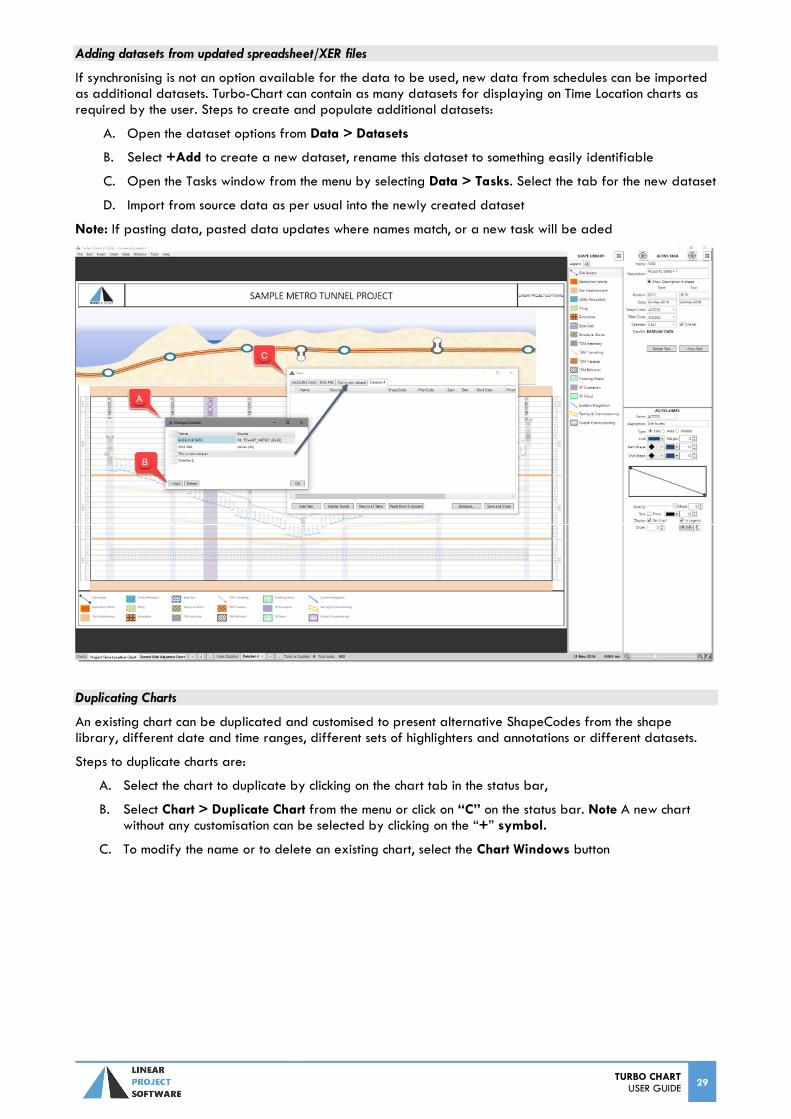
Adding datasets from updated spreadsheet/XER files
If synchronising is not an option available for the data to be used, new data from schedules can be imported as additional datasets. Turbo-Chart can contain as many datasets for displaying on Time Location charts as required by the user. Steps to create and populate additional datasets:
A. Open the dataset options from Data > Datasets
B. Select +Add to create a new dataset, rename this dataset to something easily identifiable
C. Open the Tasks window from the menu by selecting Data > Tasks. Select the tab for the new dataset
D. Import from source data as per usual into the newly created dataset
Note: If pasting data, pasted data updates where names match, or a new task will be aded
Duplicating Charts
An existing chart can be duplicated and customised to present alternative ShapeCodes from the shape library, different date and time ranges, different sets of highlighters and annotations or different datasets.
Steps to duplicate charts are:
A. Select the chart to duplicate by clicking on the chart tab in the status bar,
B. Select Chart > Duplicate Chart from the menu or click on “C” on the status bar. Note A new chart without any customisation can be selected by clicking on the “+” symbol.
C. To modify the name or to delete an existing chart, select the Chart Windows button
30 TURBO CHART USER GUIDE
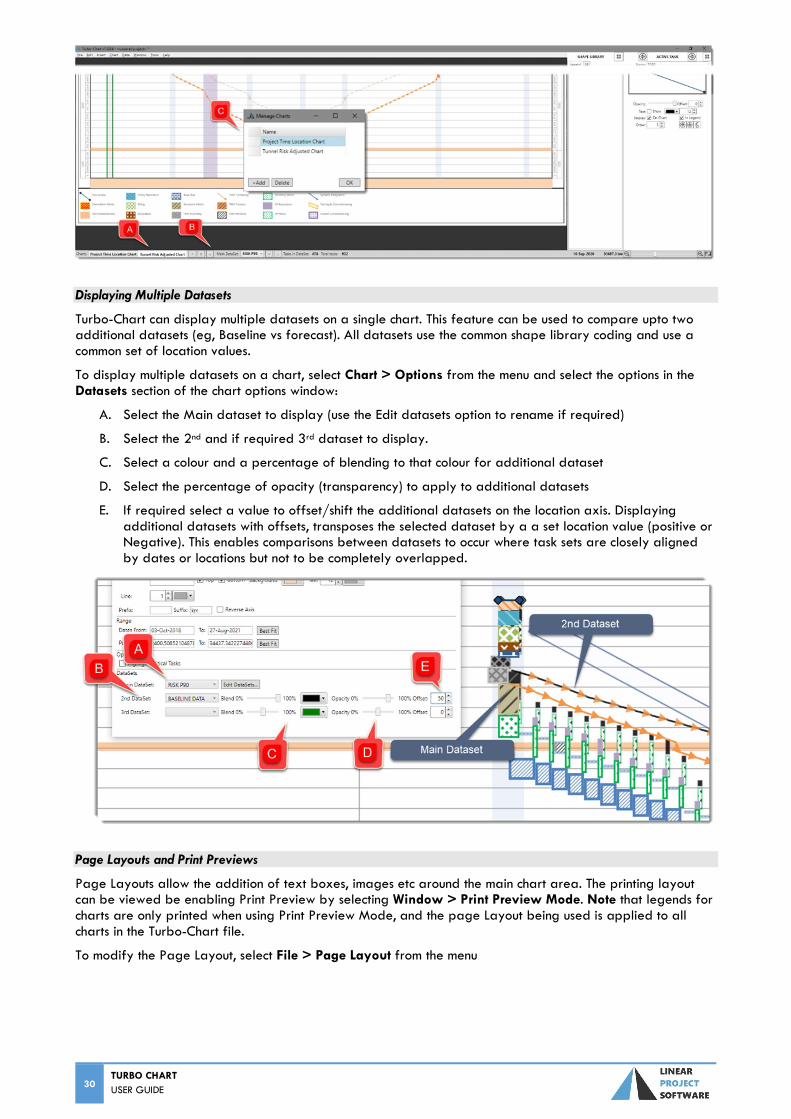
Displaying Multiple Datasets
Turbo-Chart can display multiple datasets on a single chart. This feature can be used to compare upto two additional datasets (eg, Baseline vs forecast). All datasets use the common shape library coding and use a common set of location values.
To display multiple datasets on a chart, select Chart > Options from the menu and select the options in the Datasets section of the chart options window:
A. Select the Main dataset to display (use the Edit datasets option to rename if required)
B. Select the 2nd and if required 3rd dataset to display.
C. Select a colour and a percentage of blending to that colour for additional dataset
D. Select the percentage of opacity (transparency) to apply to additional datasets
E. If required select a value to offset/shift the additional datasets on the location axis. Displaying additional datasets with offsets, transposes the selected dataset by a a set location value (positive or Negative). This enables comparisons between datasets to occur where task sets are closely aligned by dates or locations but not to be completely overlapped.
Page Layouts and Print Previews
Page Layouts allow the addition of text boxes, images etc around the main chart area. The printing layout can be viewed be enabling Print Preview by selecting Window > Print Preview Mode. Note that legends for charts are only printed when using Print Preview Mode, and the page Layout being used is applied to all charts in the Turbo-Chart file.
To modify the Page Layout, select File > Page Layout from the menu
TURBO CHART USER GUIDE
31
SET PAGE SIZE AND ORIENTATION
From the page layout menu select Paper > Paper Size or from the Layout Pane Select Paper Size
From the page layout menu select Paper > Orientation or from the Layout Pane Select Paper Orientation
All Margins and Positions of annotations for page layouts are based on values set from the Left/Right and Top/Bottom margins of the page, to ensure the page layout remains acceptable if page size or orientation is modified.
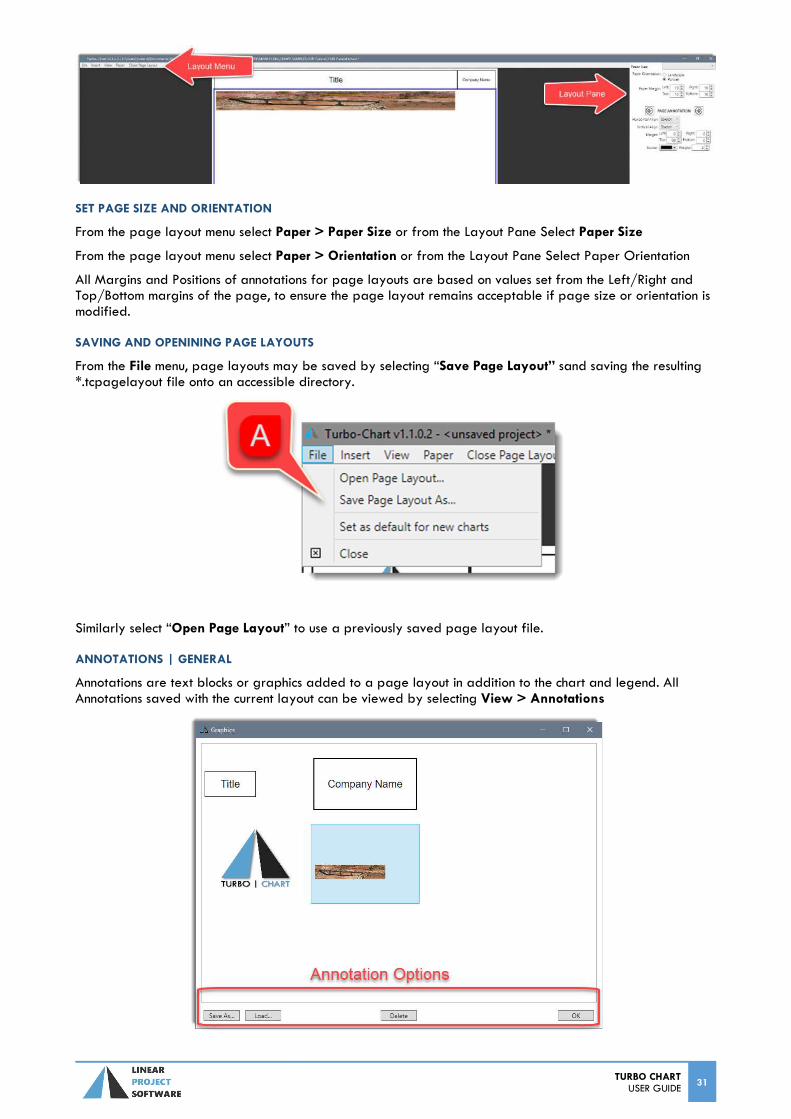
SAVING AND OPENINING PAGE LAYOUTS
From the File menu, page layouts may be saved by selecting “Save Page Layout” sand saving the resulting *.tcpagelayout file onto an accessible directory.
Similarly select “Open Page Layout” to use a previously saved page layout file.
ANNOTATIONS | GENERAL
Annotations are text blocks or graphics added to a page layout in addition to the chart and legend. All Annotations saved with the current layout can be viewed by selecting View > Annotations
32 TURBO CHART USER GUIDE
Any annotation (except the Legend and Main Chart) can be deleted by selecting the text block or graphic and then clicking on Delete. Press OK to close.
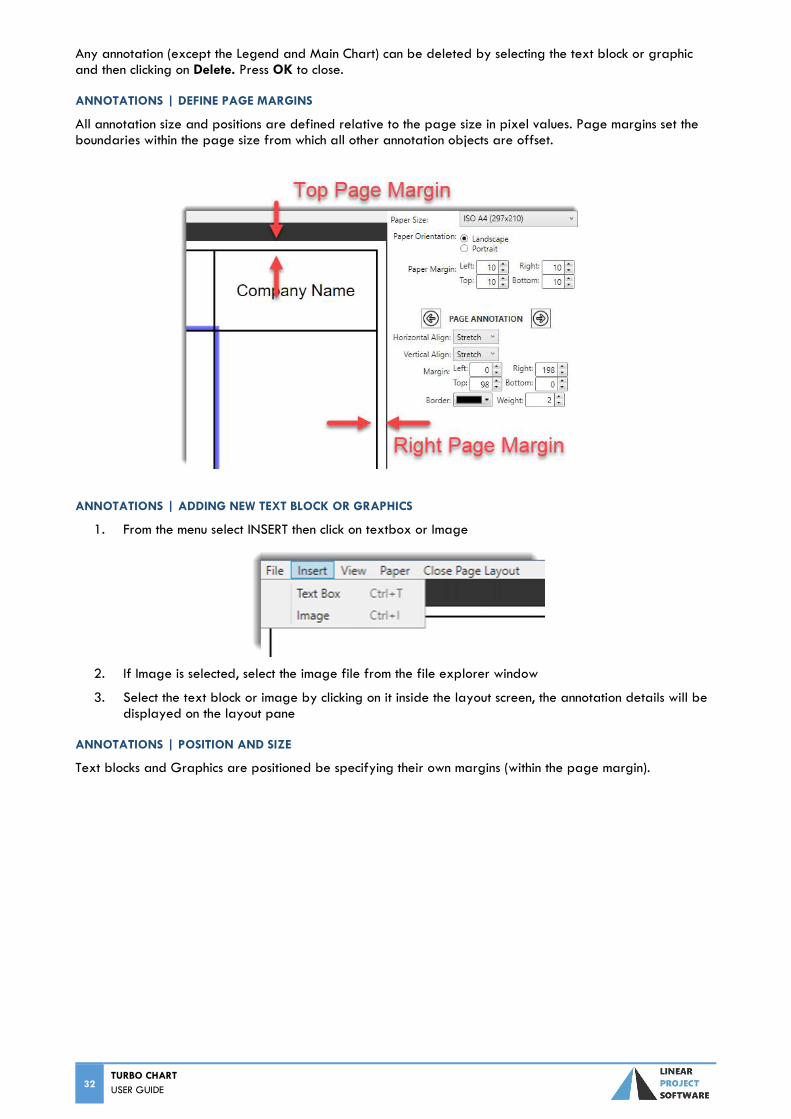
ANNOTATIONS | DEFINE PAGE MARGINS
All annotation size and positions are defined relative to the page size in pixel values. Page margins set the boundaries within the page size from which all other annotation objects are offset.
ANNOTATIONS | ADDING NEW TEXT BLOCK OR GRAPHICS
1. From the menu select INSERT then click on textbox or Image
2. If Image is selected, select the image file from the file explorer window
3. Select the text block or image by clicking on it inside the layout screen, the annotation details will be displayed on the layout pane
ANNOTATIONS | POSITION AND SIZE
Text blocks and Graphics are positioned be specifying their own margins (within the page margin).
TURBO CHART USER GUIDE
33
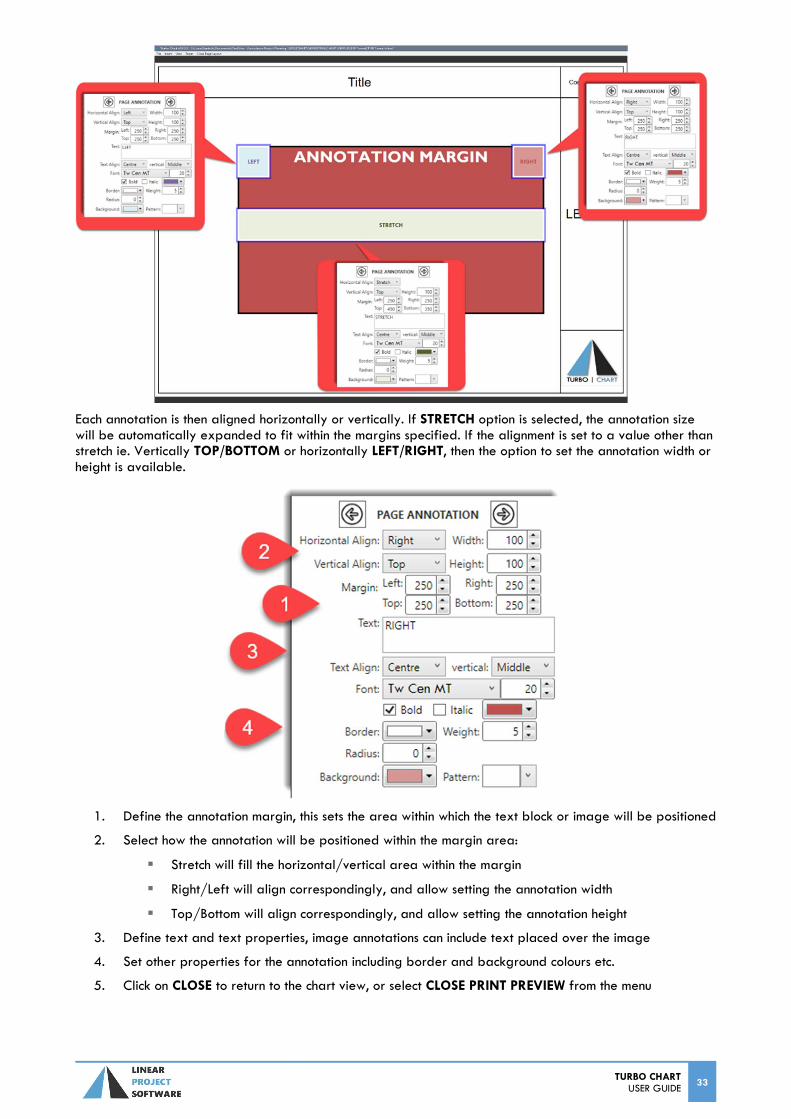
Each annotation is then aligned horizontally or vertically. If STRETCH option is selected, the annotation size will be automatically expanded to fit within the margins specified. If the alignment is set to a value other than stretch ie. Vertically TOP/BOTTOM or horizontally LEFT/RIGHT, then the option to set the annotation width or height is available.
1. Define the annotation margin, this sets the area within which the text block or image will be positioned
2. Select how the annotation will be positioned within the margin area:
Stretch will fill the horizontal/vertical area within the margin
Right/Left will align correspondingly, and allow setting the annotation width
Top/Bottom will align correspondingly, and allow setting the annotation height
3. Define text and text properties, image annotations can include text placed over the image
4. Set other properties for the annotation including border and background colours etc.
5. Click on CLOSE to return to the chart view, or select CLOSE PRINT PREVIEW from the menu
34 TURBO CHART USER GUIDE
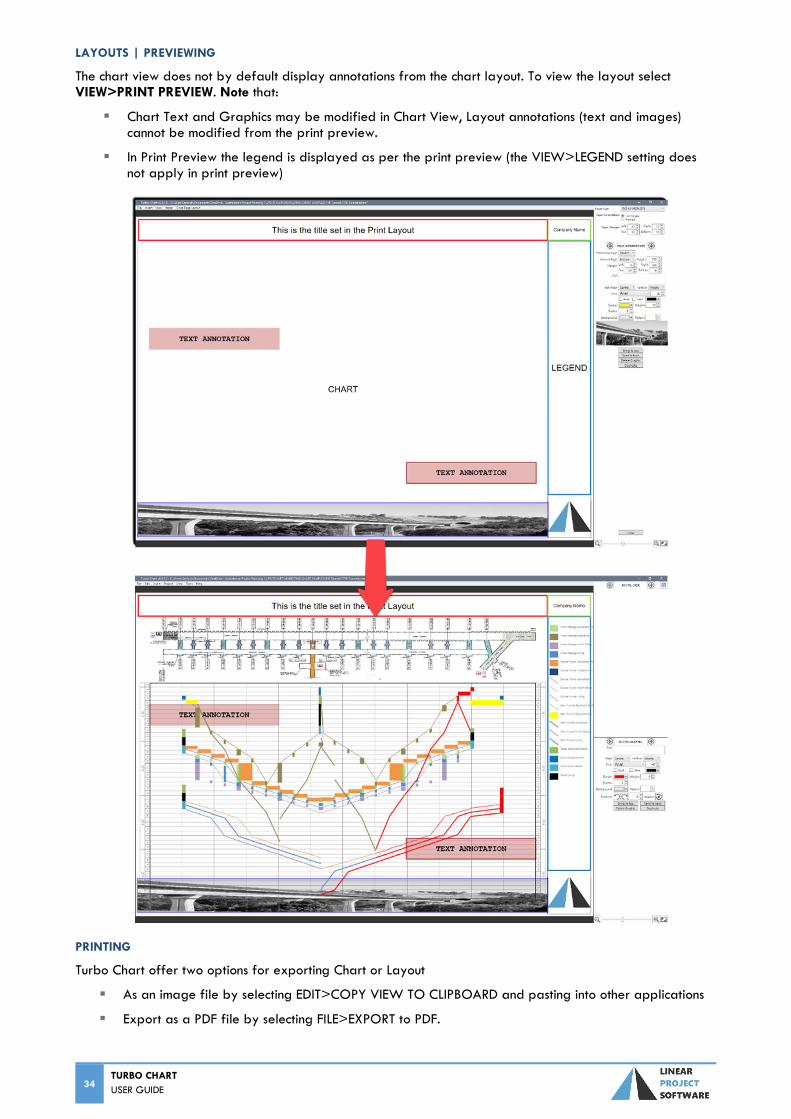
LAYOUTS | PREVIEWING
The chart view does not by default display annotations from the chart layout. To view the layout select VIEW>PRINT PREVIEW. Note that:
Chart Text and Graphics may be modified in Chart View, Layout annotations (text and images) cannot be modified from the print preview.
In Print Preview the legend is displayed as per the print preview (the VIEW>LEGEND setting does not apply in print preview)
PRINTING
Turbo Chart offer two options for exporting Chart or Layout
As an image file by selecting EDIT>COPY VIEW TO CLIPBOARD and pasting into other applications
Export as a PDF file by selecting FILE>EXPORT to PDF.
TURBO CHART USER GUIDE
35
Saving/Exchanging Turbo-Chart files
Turbo-Chart files are saved as *.tchart files and contain all the information to produce Charts from Turbo-Chart, including:
Task (Activity) data Shape Libraries Top Images Highlighters Annotations Datasets Multi-Chart Definitions
In addition to the whole Turbo-Chart file, individual elements of Turbo-Chart can also be exchanged via files:
*.tchart Turbo-Chart Data file *.tclib Turbo-Chart Shape Library file *.tchiliter Turbo-Chart Highlighter file *.tcgraphics Turbo-Chart Annotations File *.tcpagelayout Turbo-Chart Page Layout File

36 TURBO CHART USER GUIDE
FURTHER HELP
The Latest release of Turbo-Chart and Changes to releases are listed on:
http://www.turbo-chart.com/changelog
The Turbo-Chart website contains a knowledgebase containing articles, guides and videos that provide additional reference material:
http://www.turbo-chart.com/knowledgebase/
Any further queries can be addressed via email to:
Recommended
![RWNM OXZ XZUM RMN ][N3 - IRC :: Home · dxujz hj\nz 8r[rwonl\rxw #da8j[\ anjz"[ y]kurlj\rxw xo cxk cnnm"[](https://img.pdfslide.us/doc/110x75/5e1e9d7b506c0300b055f280/rwnm-oxz-xzum-rmn-n3-irc-home-dxujz-hjnz-8rrwonlrxw-da8j-anjz.jpg)