TREATED WASTEWATER EFFLUENT AS A POTENTIAL
SOURCE OF EMERGING BACTERIAL PATHOGENS
IN SURFACE WATER
SIPHEPHILE B. T. NZIMANDE
Submitted in fulfilment of academic requirements for the degree of Master of Science
(MSc) in the Discipline of Microbiology; School of Life Sciences; College of Agriculture,
Engineering and Science, University of KwaZulu-Natal (Westville Campus), Durban.
As the candidate’s supervisor, I have approved this dissertation for submission.
Signed: Name: Date:
PREFACE
The experimental work describe in this dissertation was carried out in the School of Life Sciences,
University of KwaZulu-Natal (Westville Campus), Durban, South Africa from March 2012-
December 2013, under the supervision of Professor A. O. Olaniran.
These studies represent the original work by the author and have not otherwise been submitted in any
form for any degree or diploma to any tertiary institution. Where use has been made of the work of
others, it has been duly acknowledged in the text.
COLLEGE OF AGRICULTURE, ENGINEERING AND SCIENCE
DECLARATION 1– PLAGIARISM
I……………………………………………………………………………………. declare that
1. The research reported in this dissertation except where otherwise indicated, is my
original research.
2. This dissertation has not been submitted for any degree or examination at any other
University.
3. This dissertation does not contain other person’s data, pictures, graphs or other
information, unless specifically acknowledged as being sourced or adapted from other
persons.
4. This dissertation does not contain other person’s writing, unless specifically
acknowledged as being sourced from other researchers. Where other written sources
have been quoted, then:
a. Their words have been re-written but the general information attributed to them has
been referenced.
b. Where their exact words have been used, then their writing has been placed in italics
and inside quotation marks, and referenced.
5. This dissertation does not contain text, graphics or tables copied and pasted from the
internet, unless specifically acknowledged, and the source being detailed in the
dissertation and in the reference sections.
Signed
………………………………………………………………………
CMC Feb 2012

COLLEGE OF AGRICULTURE, ENGINEERING AND SCIENCE
DECLARATION 2– PUBLICATIONS
Details of contribution to publications that form part and/or include research presented in this
dissertation (include publications in preparation, submitted, in press and published and give
details of the contributions of each authors to the experimental work and writing of each
publication).
Publication 1: Siphephile B. T. Nzimande and Ademola O. Olaniran (2014). Adaptation and
survival mechanisms of emerging bacterial pathogens in surface waters. African Journal of
Microbiology Research (Submitted).
Signed:
………………………………………………………………………………
CMC Feb 2012

Siphephile B. T. Nzimande
208522918
March 2014
Table of Contents
Page
Acknowledgements i
List of Figures ii
List of Tables iv
Abstract ix
CHAPTER ONE: INTRODUCTION AND LITERATURE REVIEW
1. Introduction 1 1.1 Important emerging water-borne bacterial pathogens 3
1.1.1 Aeromonas spp. 3 1.1.2 Pseudomonas spp. 4 1.1.3 Listeria spp. 4 1.1.4 Yersinia spp. 5 1.1.5 Legionella spp. 6
1.2 Possible sources of emerging bacterial pathogens in surface water 6
1.2.1 Improper sanitation, illegal dumping, floods and overpopulation 7 1.2.2 Untreated Sewage discharge 8 1.2.3 Wastewater effluent 8 1.2.4 Hospital effluent 9 1.2.5 Wastewater treatment processes and emerging bacterial pathogen
removal 10 1.2.5.1 Wastewater treatment process 10
1.2.5.1.1 Primary treatment 11 1.2.5.1.2 Secondary treatment 12 1.2.5.1.3 Tertiary treatment 13
1.2.5.2 Ineffective removal of emerging bacterial pathogens 14
1.3 Prevalence of emerging bacterial pathogens in the environment 15 1.4 Implications of emerging bacterial pathogens in human health 18
1.4.1 Epidemiology and Disease Outbreaks 18 1.4.2 Prevention and Treatment 22 1.4.3 Public health control 23 1.4.4 Potential implications on the growing immuno-compromised
Populations 24 1.5 Pathogenesis and virulence determinants 24
1.5.1 Virulence markers aiding in pathogenesis 26

1.5.2 Resistance to Antibiotic treatment 27 1.5.3 Resistance to chlorine and other treatment technologies 31
1.6. Survival mechanisms of emerging bacterial pathogens 34
1.6.1 Symbiotic associations 37 1.6.2 Cell membrane alterations 38 1.6.3 The presence of efflux pumps 40 1.6.4 Changes in cell physiology 41
1.6.4.1 Physiology and Metabolism 41 1.6.4.2 Neutralization of disinfectant 42 1.6.4.3 Alginate production 43
1.6.5 Changes in gene expression 45
1.7 Wastewater guidelines for surface water protection 47
1.7.1 Current guidelines: Review and reliability 47 1.7.2 Indicator microorganisms 50
1.7.2.1 Current indicator organisms 50 1.7.2.2 Indicator-pathogen relationship with respect to human
Health 51 1.7.2.3 Alternative Indicators 51
1.8 Scope of the present study 53
1.8.1 Hypothesis 55 1.8.2 Objectives 55 1.8.3 Aims 56
CHAPTER TWO: EMERGING BACTERIAL PATHOGEN ENUMERATION AND PHYSICOCHEMICAL ANALYSIS OF TREATED WASTEWATER EFFLUENT AND THE RECEIVING RIVERS
2.1 Introduction 57
2.2 Materials and methods 59
2.2.1 Description of study site 59 2.2.2 Collection of Water samples 61 2.2.3 Bacterial analyses 61 2.2.4 Physicochemical analysis 62
2.3 Results 63
2.3.1 Bacterial analysis of wastewater effluent and receiving surface waters.63 2.3.2 Physico-chemical parameters of the collected water samples 68
2.4 DISCUSSION 78
CHAPTER THREE: ANTIMICROBIAL RESISTANCE AND VIRULENCE SIGNATURES OF LISTERIA SPECIES RECOVERED FROM TREATED EFFLUENT AND RECEIVING SURFACE WATER
3.1 Introduction 87
3.2 Materials and methods 90
3.2.1 Biochemical analyses 90 3.2.2 Molecular analyses 90
3.2.2.1 DNA isolation 90 3.2.2.2 PCR identification of Listeria species isolates 91 3.2.2.3 Virulence gene characterization 92
3.2.3 Antimicrobial resistance profile analyses 93 3.2.4 Protease, gelatinase and haemolysin assay 95
3.3 Results 95
3.3.1 Identification of the presumptive Listeria spp. isolates 95 3.3.2 Virulence gene signatures of the Listeria species isolates 96
3.3.3 Antimicrobial resistance profiles of Listeria species 97 3.3.4 Protease, gelatinase and haemolysin production 100 3.4 Discussions 100
CHAPTER FOUR: ANTIMICROBIAL RESISTANCE AND VIRULENCE SIGNATURES OF AEROMONAS SPECIES RECOVERED FROM TREATED WASTEWATER EFFLUENT AND RECEIVING SURFACE WATER
4.1 Introduction 107
4.2 Materials and methods 109
4.2.1 Biochemical analyses 109
4.2.2 Molecular analyses 110
4.2.2.1 DNA isolation 110 4.2.2.2 PCR amplification of gyrB of Aeromonas species 110 4.2.2.3 Virulence gene characterization 111
4.2.3 Antimicrobial resistance profile analyses 112 4.2.4 Protease, gelatinase and haemolysin assay 112
4.3 RESULTS 113
4.3.1 Identification of the presumptive Aeromonas spp. isolates 113 4.3.2 Virulence gene signatures of the Aeromonas species isolates 114 4.3.3 Antimicrobial resistance profiles of Aeromonas species 115
4.3.4 Protease, gelatinase and haemolysin production 118
4.4 Discussions 118
CHAPTER FIVE: CONCLUSIONS 122
5.1 Research in perspective 122
5.1 Potential for future development of the study 127 6.0 References 128 7.0 Appendices 158

i
ACKNOWLEDGEMENTS
With great honour and thankfulness to God, it is my wish to express my most sincere
gratitude to my supervisor Professor A. O. Olaniran, who has with the greatest patience seen
me through this degree, providing support and sound guidance for the last two years.
The National Research foundation and Medical research council for their financial support.
The Erasmus Mundus EMA2SA scholarship and Vrije Universiteit Amsterdam for allowing
me to achieve one of my greatest dreams and to study abroad.
To my friends and colleagues Shalinee Naidoo, Deseree Rajpal, Ashmita Arjoon and
Ejovwokoghene Collins Odjadjare, thank you for embracing me and becoming my family
away from home your overall support and for effortlessly providing a pleasant working
environment throughout the duration of my study..
To my hardworking research group and laboratory 4 members, the staff and postgraduate
students of UKZN (Discipline of Microbiology, University of KwaZulu-Natal, Westville
Campus), every bit of assistance did not go unnoticed, and contributed to the completion of
this study.
To my His People Christian Church and family for loving, surrounding and always
encouraging me to be the light I have been created to be. May the fire in your hearts eternally
shine.
Special thanks to my friends, Qondiswa Zweni, Candice Padayachee, Nomfundo Xolo,
Thabisile Shabalala and Nomalungelo majola for their words of encouragement, support and
amazing presence during my study period. Thank you for being my sisters at times when I
need you most. Every tear, conversation and laughter shared was of major support.
Finally I would like to thank my parents Mr and Mrs Nzimande, my grandmother and the rest
of my friends and family for their continued support, love, prayers and encouragement
throughout my time away from home.
-I never knew the strength in my wings until the day I decided to jump and immediately felt the wind
carry me. The endless support, love and encouragement has been that undying wind-
ii
List of Figures
Page
Figure 2.1: Map showing the location of the Sewage Treatment Plants investigated in this
study, in the Durban area (www.googlemaps.com)………………….....……………........…60
Figure 3.1: Representative agarose gel showing PCR amplicons of the iap gene of Listeria
spp. isolates (lanes 2- 9), M: molecular marker and lane 1: negative control.………......…...96
Figure 3.2: Representative agarose gel showing PCR amplicons of three virulence associated
genes for Listeria monocytogenes (ATCC 19115). M: DNA marker (100 to 3000 bp), Lane 1-
3: amplified products of three genes (plcA, actA, and iap), lane 4: negative
control……………………………………………………………………...……………...….97
Figure 4.1: Representative agarose gel showing PCR amplicons of the gyrB gene of
Aeromonas spp isolates (lanes 2- 17), M: 100 pb molecular marker and lane 1: negative
control.…………………………………………………….………………………………...113
Figure 4.2: Representative agarose gel showing PCR amplicons of the Aerolysin (aer)
virulence associated gene of Aeromonas spp., M: DNA Marker (100 bp), lane 1-7: amplified
PCR products, Lane 8: negative control.…………………………....………….114
iii
Figure 4.3: Representative agarose gel showing PCR amplicons of the Lipase (lip) virulence
associated gene of Aeromonas spp., M: DNA Marker (100 bp), lane 1-17: amplified PCR
products.…………………………………………………………………….…...………….114
iv
List of Tables
Page
Table 1.1: The concentrations of some emerging bacterial pathogens found in surface water,
drinking water and treated wastewater effluent……..………………………….……………17
Table 1.2: Acute and chronic health effect associated with microbial pathogens commonly
found in water………………………………………...………………………………………19
Table 1.3: The comparison of drinking water quality guidelines............................................49
Table 2.1: Cardinal points for wastewater and river water samples collected at the Northern
and New Germany WWTPs………………………………………………………………….61
Table 2.2: Selective media and incubation temperatures for the cultivation of the emerging
bacterial pathogens…………………………………………………………………………...62
Table 2.3: Presumptive counts of selected emerging bacterial pathogens in wastewater
effluents and the receiving water bodies
(NWWTP)……..………………………………………………..……………………………65
Table 2.4: Presumptive counts of selected emerging bacterial pathogens in wastewater
effluents and the receiving water bodies (NGWWTP)…………………………………........67
v
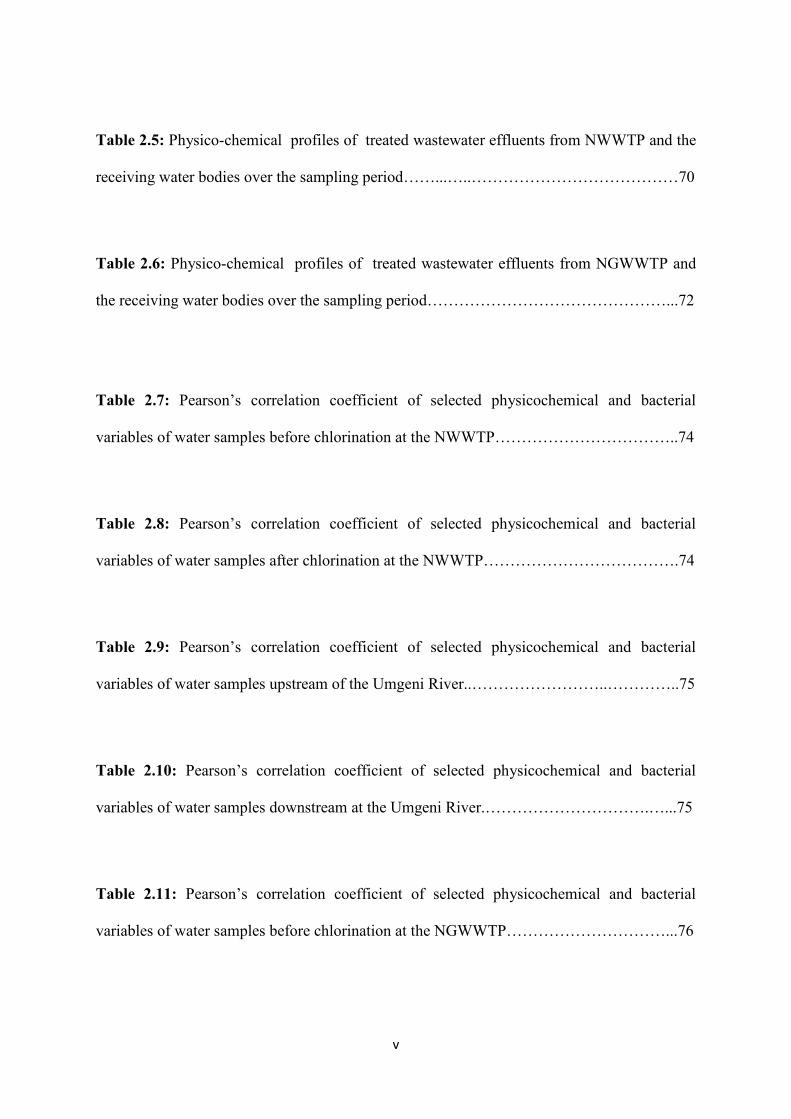
Table 2.5: Physico-chemical profiles of treated wastewater effluents from NWWTP and the
receiving water bodies over the sampling period……...…..…………………………………70
Table 2.6: Physico-chemical profiles of treated wastewater effluents from NGWWTP and
the receiving water bodies over the sampling period………………………………………...72
Table 2.7: Pearson’s correlation coefficient of selected physicochemical and bacterial
variables of water samples before chlorination at the NWWTP……………………………..74
Table 2.8: Pearson’s correlation coefficient of selected physicochemical and bacterial
variables of water samples after chlorination at the NWWTP……………………………….74
Table 2.9: Pearson’s correlation coefficient of selected physicochemical and bacterial
variables of water samples upstream of the Umgeni River..……………………..…………..75
Table 2.10: Pearson’s correlation coefficient of selected physicochemical and bacterial
variables of water samples downstream at the Umgeni River.………………………….…...75
Table 2.11: Pearson’s correlation coefficient of selected physicochemical and bacterial
variables of water samples before chlorination at the NGWWTP…………………………...76

vi
Table 2.12: Pearson’s correlation coefficient of selected physicochemical and bacterial
variables of water samples after chlorination at the NGWWTP...…………………………...76
Table 2.13: Pearson’s correlation coefficient of selected physicochemical and bacterial
variables of water samples downstream at the Aller River..………………………………....77
Table 2.14: Pearson’s correlation coefficient of selected physicochemical and bacterial
variables of water samples downstream at the Aller River..………………………………....77
Table 3.1: Characteristics of primers used for PCR amplification of iap gene……………...91
Table 3.2: Primers used for PCR amplification of Listeria virulence genes………………...92
Table 3.3: Antimicrobials and the concentration levels used………………………………..94
Table 3.4: Antimicrobial resistance/susceptibility profile of Listeria species
isolates……....……………………………………………………………...………...............99
Table 3.5: Multidrug resistance pattern in the Listeria spp………………………………...100
Table 4.1 Primers used for PCR amplification of Aeromonas virulence genes……………111
vii
Table 4.2: Antimicrobial resistance/susceptibility profile of Aeromonas species isolates
recovered from treated effluent and receiving rivers…..…………...………………………116
Table 4.3: Multidrug resistance patterns of Aeromonas spp….......................................117
viii
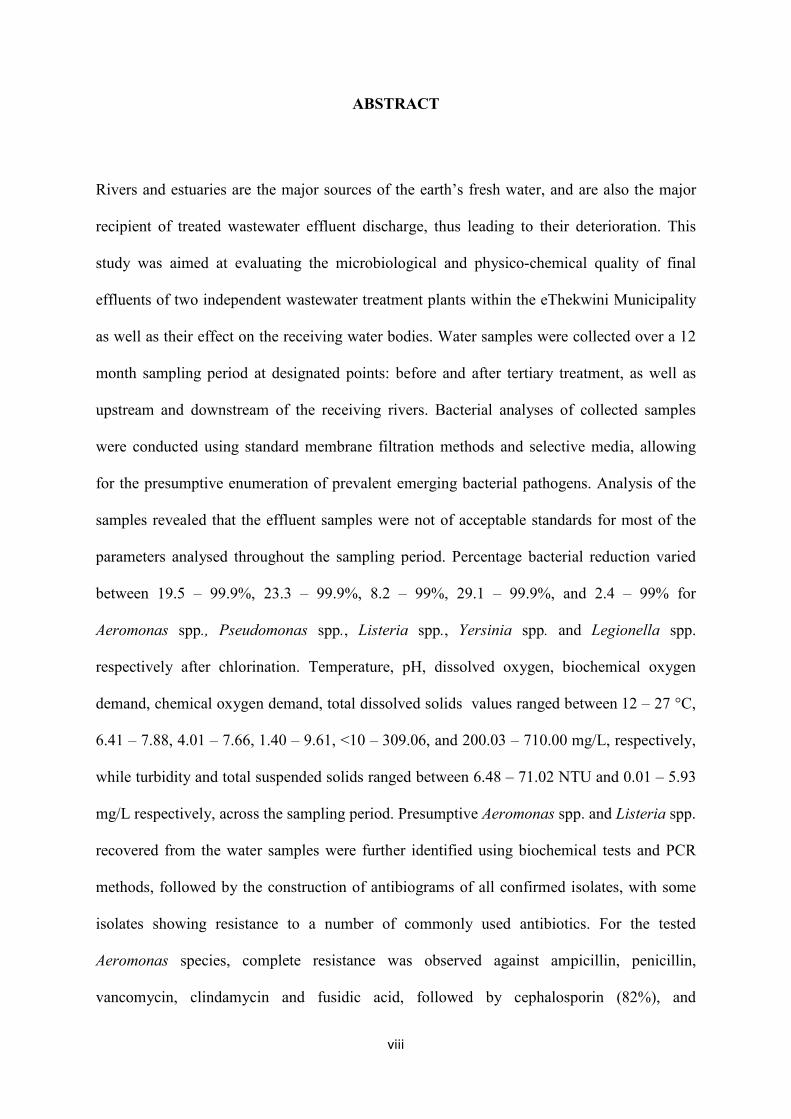
ABSTRACT
Rivers and estuaries are the major sources of the earth’s fresh water, and are also the major
recipient of treated wastewater effluent discharge, thus leading to their deterioration. This
study was aimed at evaluating the microbiological and physico-chemical quality of final
effluents of two independent wastewater treatment plants within the eThekwini Municipality
as well as their effect on the receiving water bodies. Water samples were collected over a 12
month sampling period at designated points: before and after tertiary treatment, as well as
upstream and downstream of the receiving rivers. Bacterial analyses of collected samples
were conducted using standard membrane filtration methods and selective media, allowing
for the presumptive enumeration of prevalent emerging bacterial pathogens. Analysis of the
samples revealed that the effluent samples were not of acceptable standards for most of the
parameters analysed throughout the sampling period. Percentage bacterial reduction varied
between 19.5 – 99.9%, 23.3 – 99.9%, 8.2 – 99%, 29.1 – 99.9%, and 2.4 – 99% for
Aeromonas spp., Pseudomonas spp., Listeria spp., Yersinia spp. and Legionella spp.
respectively after chlorination. Temperature, pH, dissolved oxygen, biochemical oxygen
demand, chemical oxygen demand, total dissolved solids values ranged between 12 – 27 °C,
6.41 – 7.88, 4.01 – 7.66, 1.40 – 9.61, <10 – 309.06, and 200.03 – 710.00 mg/L, respectively,
while turbidity and total suspended solids ranged between 6.48 – 71.02 NTU and 0.01 – 5.93
mg/L respectively, across the sampling period. Presumptive Aeromonas spp. and Listeria spp.
recovered from the water samples were further identified using biochemical tests and PCR
methods, followed by the construction of antibiograms of all confirmed isolates, with some
isolates showing resistance to a number of commonly used antibiotics. For the tested
Aeromonas species, complete resistance was observed against ampicillin, penicillin,
vancomycin, clindamycin and fusidic acid, followed by cephalosporin (82%), and
ix
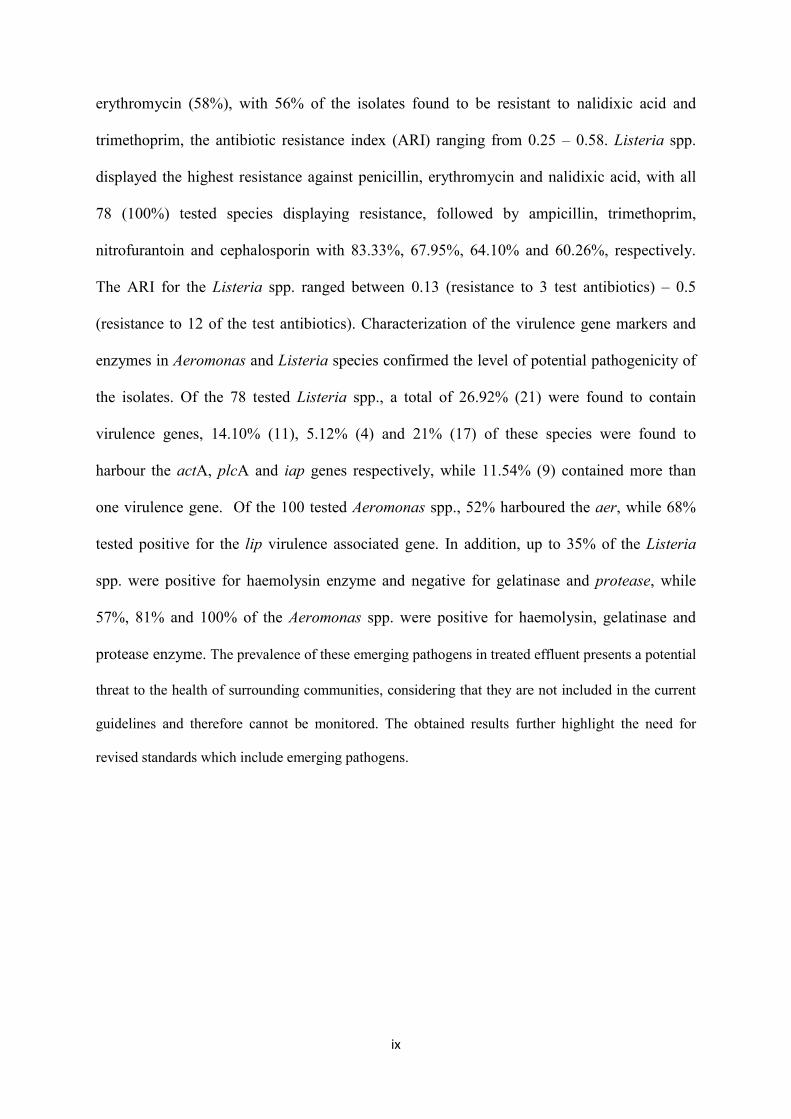
erythromycin (58%), with 56% of the isolates found to be resistant to nalidixic acid and
trimethoprim, the antibiotic resistance index (ARI) ranging from 0.25 – 0.58. Listeria spp.
displayed the highest resistance against penicillin, erythromycin and nalidixic acid, with all
78 (100%) tested species displaying resistance, followed by ampicillin, trimethoprim,
nitrofurantoin and cephalosporin with 83.33%, 67.95%, 64.10% and 60.26%, respectively.
The ARI for the Listeria spp. ranged between 0.13 (resistance to 3 test antibiotics) – 0.5
(resistance to 12 of the test antibiotics). Characterization of the virulence gene markers and
enzymes in Aeromonas and Listeria species confirmed the level of potential pathogenicity of
the isolates. Of the 78 tested Listeria spp., a total of 26.92% (21) were found to contain
virulence genes, 14.10% (11), 5.12% (4) and 21% (17) of these species were found to
harbour the actA, plcA and iap genes respectively, while 11.54% (9) contained more than
one virulence gene. Of the 100 tested Aeromonas spp., 52% harboured the aer, while 68%
tested positive for the lip virulence associated gene. In addition, up to 35% of the Listeria
spp. were positive for haemolysin enzyme and negative for gelatinase and protease, while
57%, 81% and 100% of the Aeromonas spp. were positive for haemolysin, gelatinase and
protease enzyme. The prevalence of these emerging pathogens in treated effluent presents a potential
threat to the health of surrounding communities, considering that they are not included in the current
guidelines and therefore cannot be monitored. The obtained results further highlight the need for
revised standards which include emerging pathogens.
1
CHAPTER ONE
INTRODUCTION AND LITERATURE REVIEW
1. Introduction
Water paucity and increasing human populations in developing countries, have applied
additional pressure on available water resources, consequently leading to an increased
dependence on river and estuary waters. This is of increasing human and public health
concerns considering that the majority of the available water sources are often polluted,
harbouring copious levels of contaminants. The commonly found contaminants range broadly
from pathogenic microorganisms to highly toxic chemical substances, which have a negative
impact not only on humans, but also on animals and other ecological and chemical pathways
in water ecosystems (Egun, 2010; Luger and Brown, 2010; UNEP 2012). Furthermore,
numerous studies have shown that fresh water sources are of poor microbial and physico-
chemical quality, thus posing a greater threat than previously thought (Crockett, 2007).
Freshwater pollution is frequently related to the continued discharge of improperly treated
effluent from wastewater treatment plants into freshwater sources (Hoogeboezem, 2007;
Odjadjare and Okoh, 2010). This has been linked with inadequately operated treatment
plants, ineffective and outdated treatment processes, as well as improper pathogen monitoring
techniques. Wastewater treatment processes therefore continues to be amongst the main
concerns all over the world, since water is a primary need for survival, thus requiring that
great measures be taken to ensure hazard-free reuse and redistribution of the treated
wastewater effluent.
2
Inadequately treated wastewater consists of vast quantities of bacteria, some of which are
harmless to man, however, some emerging bacterial pathogens have been documented to
cause serious diseases, some which may result in serious infections and at worst, death if
untreated (Rollins et al., 2003). Exposure to pathogen contaminated water also increases
infection probability as well as cases of disease outbreak, especially in poorer communities
with suppressed or compromised immune systems, more so in underdeveloped regions in
South Africa (Egun, 2010; Luger and Brown, 2010; Momba and Kaleni, 2002; Philippaeux,
1998; UNEP 2010; Venter et al., 2007; WHO, 2008; WSSCC, 2008).
Pathogens have been in existence for centuries, dating back to the biblical ages where plagues
and pandemics were on the rise and spreading, resulting in the death of millions of people
(Morens et al., 2004). Black Death, measles, small pox, and HIV/AIDS are some of the few
pandemics that caused worldwide confusion for ages, since most of the causatives had not
been identified or characterised then (WHO, 2008). Treatment became available before the
1950’s, with these years being widely known as the breakthrough years in infections and
diseases with the discovery of penicillin, drugs and vaccines (Morens et al., 2004). In spite of
these new discoveries and developments, the sudden occurrence of emerging infections did
not cease to result in massive deaths all around the world, as microbes evolved with the times
(Morato et al., 2003). Till this day and age the fight between microbes and the human race
continues as the discovery of emerging infections reveals that they are multiple steps ahead of
common human understanding (Abraham, 2011; Crockett et al., 2007).
The prevalence of emerging bacterial pathogens in treated wastewater effluent is of concern,
since presence of these organisms cannot be tracked during normal treatment processes. this
is due to the fact that South Africa currently has no set guidelines for emerging bacterial
3
pathogens, leading to their release and dissemination into the environment unmonitored
(Bartie et al., 2002). Some of these microorganisms also display high microbial or antibiotic
resistance trend, which can be linked to the acquisition of resistance genes due to increased
usage of these agents in the medical, agricultural and veterinary applications (Goni-Urriza et
al., 2000; Huddleston et al., 2006). Their adaptation to their environment and acquisition of
resistance and virulence genes further aid in their ability to escape conventional treatment
processes (Almuzara et al., 2007). Eze et al. (2009) suggested that even highly vigorous
conventional water treatment will struggle to remove more that 99% of emerging bacterial
pathogens on a routine basis. Reports of emerging bacterial pathogens which have become
resistant to disinfection process of conventional water and wastewater treatment systems are
common (Cabral, 2010; Fischbach et al., 2009). Some of these pathogens have been shown to
thrive in the presence of common disinfectant agents, such as chlorine and ozone used for the
treatment of wastewater (Odjadjare et al., 2012). The frequent occurrence of these pathogens
in the environment and the continuous battle to eradicate them in water sources reveals that
these microorganisms have developed survival strategies that promote their exponential
growth and reproduction (Morens et al., 2004).
1.1 Important emerging water-borne bacterial pathogens
1.1.1 Aeromonas spp.
Aeromonas species are Gram-negative, rod-shaped organisms, which in the recent years have
gained recognition in the public health sector as opportunistic organisms (Cabral, 2010).
Infections caused by this organism result in primary or secondary septicaemia, red sore
disease and other water associated wound infections (skin and soft tissue infections), eye
infection, meningitis and pneumonia as well as bone and joint enteritis among other
4
infections (Sartory et al., 1996). Aeromonas spp. is the main causative agent of childhood
diarrhoea, fatal gastric variceal and clinical syndromes inevitably arise in immune
compromised patients. Aeromonas spp. have previously been isolated from patients with
diarrhoea in the presence or absence of other enteropathogens, but its involvement in gastro
enteritis remains unknown (Obi et al., 2007; Vila et al., 2003).
1.1.2 Pseudomonas spp.
Pseudomonas species are Gram-negative, rod shaped and the most vigorous, fast-swimming
bacteria responsible for causing urinary tract infections, dermatitis, bone and joint infections,
gastrointestinal infections and systemic infections and are known to evade host defences.
Pseudomonas spp. infections cause death in cystic fibrosis (CF) disease patients. They are
responsible for the production of Toxin A, which is a potential cytotoxin, lethal to a variety of
DNA chimas and also have the ability to cause disease by inhibiting protein synthesis, direct
cytopathic effects and interferes with the immune function of the host which ultimately leads
to death (Picardo and Giroux, 2004). Pseudomonas aeruginosa is one of the most resistant
emerging pathogens and has been found to contain intrinsic resistance factors (Langsrud et
al., 2003a; Dreeszen, 2003).
1.1.3 Listeria spp.
Listeria species were for a while only known to be associated with food and were therefore
classified as food pathogens, until their discovery in water in recent years (Paillard et al.,
2005). L. monocytogenes, the common human pathogen can cause meningitis, encephalitis,
septicaemia, abortion, premature birth, stillbirth and abscesses. It may also give rise to
gastroenteritis or an influenza-like disease. The worldwide case fatality rate for listeriosis is
5
estimated to be as high as 36%, among the risk groups, which include neonates, elderly
people, pregnant women, and immuno-compromised individuals. Listeriosis has flu-like
symptoms (muscle ache, fever) and gastroenteritis which may spread to the nervous system
(invasive infection) and may lead to headache, confusion, loss of balance and convulsions
(Arslan and özdemir, 2008). Listeria monocytogenes is tolerant to extreme pH, temperature
and salt concentration, and causes major problems in pregnant women, neonates, the elderly,
cancer and diabetic patients and immuno-compromised individuals (Paillard et al., 2005).
Without antibiotic treatment, septicaemia, meningitis, encephalitis, abortion and ultimately
death can occur. About 2400 cases of listeriosis are reported annually in the US alone (Mead
et al., 1999). One of the biggest listeriosis outbreaks in history was reported in the 1980’s in
Los Angeles resulting in a 63% fatality rate in neonatal foetal infections and 37% in pregnant
women with immune-compromised among the infected (Linnan et al, 1988).
1.1.4 Yersinia spp.
Yersinia species are mainly associated with food-borne illnesses but have lately been
discovered in sewage and faecal polluted waters (Rollins et al., 2003). These are invasive
pathogens with the ability to penetrate the stomach lining and gain entry into the lymphatic
system and blood, resulting in Yersinosis. This results in intestinal inflammation due to the
release of toxins which prevent electron transport chain function (Sinha et al., 2000).
Symptoms include watery diarrhoea, abdominal pain, fever and arthritis. Swelling of lymph
nodes results in death within a week of initial infection. Yersinia species survive for longer
periods of time in aquatic environments and at low temperatures such as 4 °C for as long as
18 months at both alkaline and neutral pH (Perdek et al., 2002). Yersinosis plagues have a
40% - 60% fatality rate with untreated septicaemia and pneumonia cases resulting in 100%
mortality while treated cases have a 30% - 50% mortality rate (Rollins et al., 2003). These
6
organisms have the ability to survive in different domestic animals including dogs, cats, pigs,
rodents, rabbits, sheep, cattle, horses, and cats.
1.1.5 Legionella spp.
Legionella pneumophila is a motile, rod-shaped, Gram-negative, aerobic bacterium.
Legionella grows in warm aquatic environments with rust, algae, and organic particles. The
organism can survive in tap water at room temperature for over a year, with some Legionella
species also found to survive for as long as 2.5 years in low and nutrient limiting
environments, after being released into the environment (Palmer et al., 1995). Waterborne
associated outbreaks of some of these organisms have been recorded in history; however the
link between their occurrence in the environment and the actual cause is vague (Crittenden et
al., 2005).
1.2 Possible sources of emerging bacterial pathogens in surface water
Rivers and estuaries are the major sources of the earth’s fresh water and at the same time the
recipients of wastewater effluent. These fresh water sources are highly impacted by the
amount of pollution they are exposed to, including pollution from surrounding communities,
floods, illegal waste discharge from hospitals, industrial companies as well as wastewater
effluent discharge which is not up to the expected standards (UNEP, 2010).
1.2.1 Improper sanitation, illegal dumping, floods and overpopulation
7
The increasing numbers and complex dynamics in human populations is a huge contributing
factor to the global water crisis and developing countries seem to be the most affected
(Frederiksen, 1996). Urbanization and industrialisation are also major contributing factors to
the pressure placed on all water sources, as well as the pollution thereof (UNEP, 2010). The
United Nations Environmental Programme has predicted that the world population is bound
to exceed 9 billion people with urban populations expected to double by the year 2050, and
one fifth of the population will be living near the coast by the year 2015. Currently almost
900 million people do not have access to safe water worldwide, while 2.6 million lack
adequate sanitation. On the 21st March 2012, the South African Human Rights Commission
highlighted that 16 million South Africans still do not have adequate access to safe water and
sanitation, compounding the problem of waterborne disease (NICD, 2012).
Urbanisation has resulted in the observable population rise in most cities and urban areas
worldwide. Poorer communities living in undeveloped areas therefore flock to the cities
which are already highly populated in pursuit of civilisation which promises life of improved
living and higher rates of employment. Over population and limited land space has inevitably
led to the building and increase of sprawling informal settlements which are overpopulated,
and mostly lack any form of basic sanitation and drinking water facilities as well as waste
dumping or collection systems (UNEP, 2010). This answers why most informal settlements
are usually established around or in the vicinity of rivers, which are then utilised and
exploited to suit the multiple needs of the surrounding communities such as dumping,
sanitation and the use of the same water for basic housekeeping needs such as bathing,
cooking and laundry (Odjadjare et al., 2010). Storm water runoff into rivers can contribute to
faecal pollution not only from surrounding human populations, but also from diverse sources
such as domestic animals and wildlife (Santo Domingo and Edge, 2010).
8
1.2.2 Untreated sewage discharge
Two million tons of sewage wastes enter the world’s waterways on a daily basis in
developing countries , 90% of these sewage wastes are not treated and are discharged directly
into nearby rivers (UNEP, 2010). Waterborne pathogens of faecal origin continue to
contribute largely to the world wide outbreaks of infectious disease in many areas around the
world. While developed countries have placed importance on the monitoring and protection
of surface water and also made much progress in municipal wastewater treatment and
management of agricultural wastes, faecal contamination of drinking and recreational water
sorces still contribute to outbreaks of infectious diseases (Santo Domingo and Edge, 2010).
1.2.3 Wastewater effluent
The discharge of inadequately treated sewage effluent into rivers and estuaries has a huge
impact on the health of surrounding human populations and ecosystems (Luger and Brown,
2010). The poor quality of raw and treated wastewater has customarily been considered as a
source of pathogenic microorganisms. Sewage and wastewater treatment plants have shown
to be rich reservoirs of antibiotics because the antibiotics that are utilised for treatment of
infections are not all processed by human bodies. Some of them are expelled as waste and
end up in wastewater treatment plants (Adetunji and Isola 2011; Jury et al., 2010). Not only
are wastewater treatment plants great sources of emerging bacterial pathogens, they are also
responsible for the harbouring and later release of multidrug resistant microorganisms. The
prevalence and survival of pathogens after treatment processes poses a major threat to both
the receiving environment and ecosystems, most importantly to the receiving communities
primarily dependant on these waters (Luger and Brown, 2010).
9
It was traditionally believed that discharge of 200 cfu/ 100 mL faecal coliforms in wastewater
effluent had none or limited downstream microbial effects, due to the dilution effect that the
water source has on the incoming effluent (Crockett, 2007). This was closely linked to the
belief that infection of human beings occurred only when large microbial doses were
ingested. However, the increasing resistance to standard water and wastewater treatment
processes further challenges the traditional methods and beliefs. Emerging pathogens exhibit
extended survival periods in these adverse environments, proving to affect sensitive
subpopulations (immuno-compromised, elderly, pregnant and children), and require
extremely low doses for human infection (Crockett, 2007). Traditional methods are
progressively moving into the irrelevant and ineffective phase, as the emerging bacterial
pathogens become more resilient, gain resistance and adapting to the most adverse
environments (Cabral, 2010).
1.2.4 Hospital effluent
Hospital effluent has a major effect on microbial population dynamics and is known to
contain microbiological contaminants including important microbial pathogens
(Hoogeboezem, 2007). Bacteria can develop resistance to certain antibiotics, based on the
frequency of exposure and therefore survive treatment with antibiotics which is an increasing
problem in hospitals. They cause infections which are often difficult to treat with the
common drugs, as multidrug resistance is developed. Bendt et al. (2002) studied the
behaviour of antimicrobial resistant bacteria in sewage treatment plants and observed varying
concentrations of these resistant microorganisms, with the highest numbers of multidrug
resistant groups obtained from hospital sewage. These resistant organisms portrayed the
ability to genetically transmit their antibiotic resistance genes via horizontal transmission,
10
transmission occurring more frequently between organisms or hospital effluent origin and
other sources (Hoogeboezem, 2007).
1.2.5 Wastewater treatment processes and emerging bacterial pathogen removal
1.2.5.1 Wastewater treatment processes
Wastewater treatment facilities were established with the aim of protecting freshwater
sources, the environment and the public (surrounding human population) against any harmful
substances which are transported by a plethora of contaminants present in wastewater
(Crockett 2007, Shatanawi et al., 2006). Conventional treatment is therefore accomplished by
the removal of substances that have a high oxygen demand from the system through the
metabolic reactions of microorganisms, the separation and settling of solids to create an
acceptable quality of wastewater effluents, and the collection and recycling of
microorganisms back into the system, or removal of excess microorganisms from the system
(Abraham et al., 2011). The main function of wastewater treatment is to remove solid,
organic and microbiological components that may result in the pollution of the receiving
water body. All wastewater treatment facilities have set standards and guidelines to ensure
that the treated effluent is safe for release (Scott et al., 2003). Additional consideration is
given to chemical components such as ammonia, nitrate, and phosphorus, microorganisms,
specific organic pollutants and metals depending on the size of the treatment facilities, the
different treatment steps and the nature of the discharge.
Processes which are commonly applied in wastewater treatment include: screening, coarse
solids reduction, grit removal, sedimentation, biological treatment as well as filtration
(MWSF, 2011; Okoh, et al., 2007). The majority of the processes work through the
11
application of a physical force and are collectively known as physical processes. A biological
reaction coupled to an adsorption step allows micro-organisms to make use of components as
part of their growth cycle by converting dissolved organic components to solids for further
removal in downstream physical processes (Ashbolt, 2003).
1.2.5.1.1 Primary treatment
The primary treatment step which is the second step in treatment involves the separation of
suspended solid matter and grease (USEPA, 2004). Influent is subjected to primary and
secondary treatments steps which are commonly combined as a single basic treatment step,
after it has been passed through a number of pre-treatment steps. Following the screening and
grit removal process, the dissolved organic and inorganic constituents along with suspended
solids are then removed. Suspended solids are the small particulate matter removed by;
sedimentation, gravity settling, chemical coagulation, or filtration. The wastewater is
channelled into a sedimentation tank, slowing down the water flow as the dissolved pollutants
and suspended solids which could not be removed in the previous step gradually sink to the
bottom. The settled particles collectively form a slurry of collective matter known as primary
sludge which can then be removed from the tank by various methods (Environmental Canada,
2003).
1.2.5.1.2 Secondary treatment
Secondary treatment is a biological treatment process involving the addition of
microorganisms which utilise the organic matter present as food supply and energy source,
resulting in the removal of 90% dissolved organic matter from the wastewater (USEPA,
2004). Attached growth processes, suspended growth processes and lagoon systems are the
three most common conventional methods used during secondary treatment (Upadhyay et al.,
12
2007). Attached growth process units include trickling filter, bio-towers and rotating
biological contactors and involves microbial growth on surfaces. Wastewater passes over the
media along with air to provide oxygen required for growth of the microorganisms, which are
responsible for removing biodegradable organic material from the wastewater
(Environmental Canada, 2003). Suspended growth processes remove biodegradable organic
material and organic nitrogen-containing material by converting ammonia nitrogen to nitrate.
In this growth processes, microbial growth is suspended in an aerated water mixture where
air is pumped in, or the water is agitated sufficiently to allow oxygen transfer. Suspended
growth process unit include variations of activated sludge, oxidation ditches and sequencing
batch reactor (Mbwele et al., 2003). A wastewater lagoon or treatment pond is a scientifically
constructed pond, three to five feet deep, that allows sunlight, algae, bacteria and oxygen to
interact. Biological and physical treatment processes occur in the lagoon to improve water
quality. The quality of water leaving the lagoon, when constructed and operated properly, is
considered equivalent to the effluent from a conventional secondary treatment system.
Lagoons remove biodegradable organic material and some of the nitrogen from wastewater
(Larsdotter et al., 2003).
1.2.5.1.3 Tertiary treatment
Tertiary treatment is the additional treatment required to remove suspended and dissolved
substances remaining after secondary treatment. This is accomplished using a variety of
physical, chemical or biological treatment processes to remove the target pollutants
(Environment Canada, 2003). Tertiary treatment include: Filtration, removal of ammonia and
other specific contaminants and disinfection to destroy pathogens (MWSF, 2011; Okoh et al.,
2007). After the treatment, wastewater effluent may contain pathogens, due to the variability
in the treatment processes and constantly changing state of microorganisms. Processes used
to kill or deactivate these harmful organisms are called disinfection. Chlorine is the most
13
widely used with ozone and ultraviolet radiation also frequently used for wastewater effluent
disinfection (Hijnen et al., 2006). Chlorine kills microorganisms by attacking the cell
membrane structure and in turn affecting internal cellular materials and can be applied to
wastewater as a gas, liquid or in a solid form. However, any free chlorine remaining in the
water, even at low concentrations, is highly toxic to beneficial aquatic life (Hijnen et al.,
2006). Therefore, removal of even trace amounts of free chlorine by dechlorination is often
needed to protect fish and aquatic life. Ozone is another disinfectant normally used, and it is
produced from oxygen exposed to a high voltage current. Ozone is very effective at
destroying and killing viruses, bacteria and decomposes back to oxygen rapidly without
leaving harmful by-products. Ultraviolet (UV) radiation disinfection is a physical treatment
process that leaves no chemical traces. Organisms can sometimes repair and reverse the
destructive effects of UV when applied at low doses. Furthermore, UV can only be applied
on small scale basis (Hoyer, 2004).
1.2.5.2 Ineffectiveness of wastewater treatment plants for removal of emerging bacterial
pathogens
Pathogens have evolved and adapted with their environment, resulting in decreasing
treatment quality and an increase in the prevalence of infectious and viable pathogens
(Abraham, 2011). Recent data suggests that even highly vigorous conventional water
treatment will struggle to remove more that 99% of emerging bacterial pathogens on a routine
basis (Eze et al., 2009). This is of great concern since the prevalence of pathogens in treated
wastewater effluent discharged into surrounding water bodies is determined by the treatment
efficiency. The occurrence of these pathogens in the environment and the continuous struggle
to eradicate them in water sources reveals that these microorganisms have developed survival
strategies that promote their growth and reproduction (Morens et al., 2004).
14
These adaptive and survival mechanisms can be expressed in a number of ways within the
cell which has become resistant to disinfection (Morato et al., 2003). With this knowledge,
one cannot ignore how these emerging bacterial pathogens have gained resistance to
conventional wastewater treatment processes. Genetic changes and defence mechanisms have
been acquired to make them more resistant, and in turn more prevalent in wastewater effluent
and the environment in which they are discharged (Poole, 2005). Most of these
microorganisms have been discovered to be highly resistant to a broad range of antibiotics,
including other antimicrobial agents. This has been linked to the increased usage of these
agents in the medical, agricultural and veterinary sectors, and has resulted in these
microorganisms obtaining resistance genes (Goni-Urriza et al., 2000; Huddleston et al.,
2006). The mechanisms of resistance against commonly used disinfectants include: Limited
diffusion of antimicrobial agents through the biofilm matrix, interaction of the antimicrobial
agents with the bioflm matrix (cells and polymer), enzyme mediated resistance, level of
metabolic activity within the biofilm, genetic adaptation, efflux pumps and outer membrane
structure. This further support and highlights the need for revision of the currently used
wastewater treatment guidelines (Eze et al., 2009; Grobe et al., 2002; Langsrud et al., 2003a;
Purkrtová et al., 2010; Sarme et al., 2010).
1.3 Prevalence of emerging bacterial pathogens in treated waters
The main concern in water and wastewater treatment processes is that many water-borne
pathogens have adapted to their environment and have acquired resistance and virulence
genes which are widely expressed in these stressful environments. As a result they now have
the ability to escape conventional treatment processes (Almuzara et al., 2007). Emerging
bacterial pathogens have become more resistant to disinfectants and other antimicrobial
15
agents when compared to coliform microorganisms which are commonly used as the
indicators of water quality (Eze et al., 2009). This also implies that even in the absence of
coliform indicators, emerging bacterial pathogens are still present in their numbers. Their
presence in the absence of indicator microorganisms is common and in most cases they are
even found dominating drinking water systems (Eze et al., 2009; Toze, 1997). The fact that
these pathogens are also found to be present in drinking tap water which is meant to be safe
and pathogen free, further supports that pathogens have become tougher and are difficult to
eradicate. According to the safe water act, the maximum contamination levels for safe
drinking water should be zero for all pathogens: “no tolerable lower limit” (Ashbolt, 2004;
Bressler et al., 2009; WHO, 2008). This however remains as a mere standard which is not
met, with the increasing occurrence and discovery of pathogens in many conducted studies
(Khabo-Mmekoa, 2010).
A study conducted by Momba et al. (2006) showed that the quality of drinking water in
South Africa is generally poor and therefore unfit for human consumption, especially in peri-
urban, rural and remote areas with inadequate water supply services. Another study
conducted by Khabo-Mmekoa et al. (2010) revealed that all drinking water samples collected
from: Gamalakhe, Boboyi, Margate, Portshepstone, Bomela, Annelin, and Hibberdene in
South Africa were predominantly contaminated with Pseudomonas aeruginosa and
Enterobacter species. These microbial populations were also found to be dominant in the
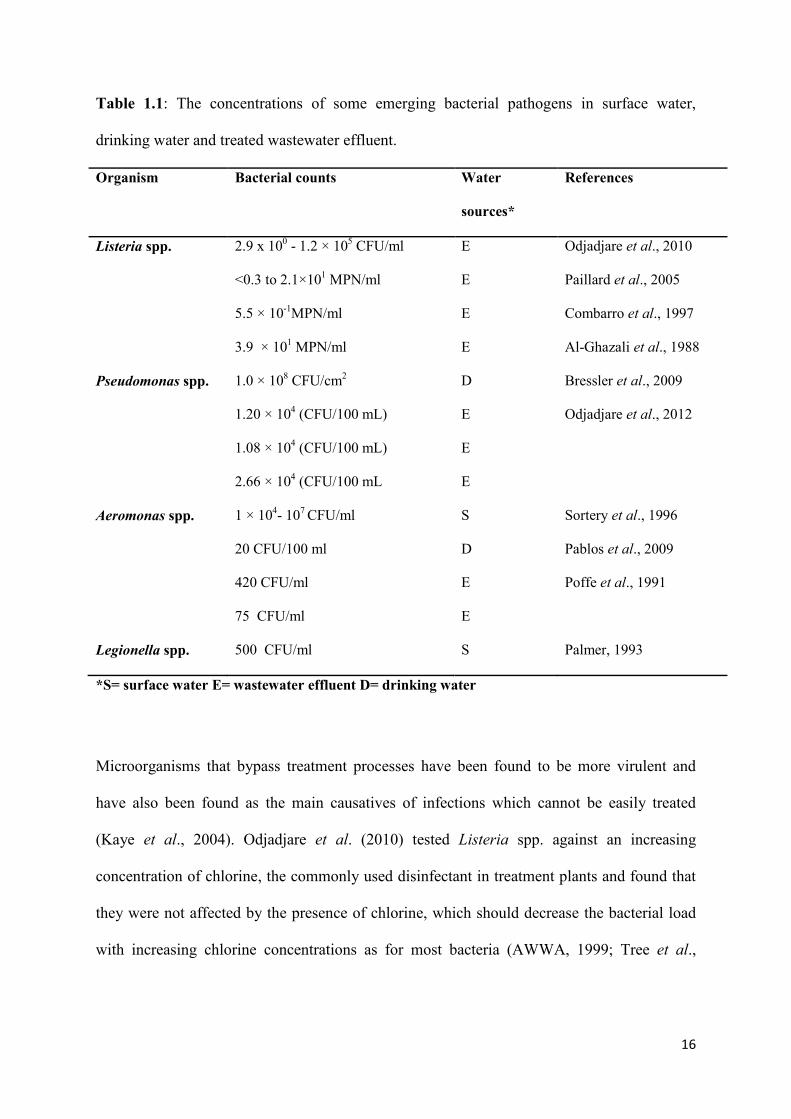
stools of residents of the above mentioned communities. Table 1.1 shows the population of
some emerging bacterial pathogens in treated effluent and in some cases in drinking water
sources, further reiterating the inefficiency of the treatment or disinfection processes.
16
Table 1.1: The concentrations of some emerging bacterial pathogens in surface water,
drinking water and treated wastewater effluent.
Organism Bacterial counts Water
sources*
References
Listeria spp. 2.9 x 100 - 1.2 × 10⁵ CFU/ml E Odjadjare et al., 2010
<0.3 to 2.1×101 MPN/ml E Paillard et al., 2005
5.5 × 10⁻¹MPN/ml E Combarro et al., 1997
3.9 × 101 MPN/ml E Al-Ghazali et al., 1988
Pseudomonas spp. 1.0 × 10⁸ CFU/cm2 D Bressler et al., 2009
1.20 × 10⁴ (CFU/100 mL) E Odjadjare et al., 2012
1.08 × 10⁴ (CFU/100 mL) E
2.66 × 10⁴ (CFU/100 mL E
Aeromonas spp. 1 × 10⁴- 107 CFU/ml S Sortery et al., 1996
20 CFU/100 ml D Pablos et al., 2009
420 CFU/ml
75 CFU/ml
E
E
Poffe et al., 1991
Legionella spp. 500 CFU/ml S Palmer, 1993
*S= surface water E= wastewater effluent D= drinking water
Microorganisms that bypass treatment processes have been found to be more virulent and
have also been found as the main causatives of infections which cannot be easily treated
(Kaye et al., 2004). Odjadjare et al. (2010) tested Listeria spp. against an increasing
concentration of chlorine, the commonly used disinfectant in treatment plants and found that
they were not affected by the presence of chlorine, which should decrease the bacterial load
with increasing chlorine concentrations as for most bacteria (AWWA, 1999; Tree et al.,
17
2003). It is therefore evident that the ineffectiveness of these established processes poses and
presents a health threat worldwide (Obi et al., 2002).
1.4 Implications of emerging bacterial pathogens in human health
1.4.1 Epidemiology and disease outbreaks
Diseases caused by bacteria are some of the most common health hazards associated with
untreated drinking and recreational waters. Many microbial pathogens in wastewater can
cause chronic diseases (Table 1.2) with costly long-term effects, such as degenerative heart
disease and stomach ulcer (Toze, 1997). In South Africa, the incidence of diarrhoeal disease
doubled from 128.7 children below the age of 5 per 1000 in 2004 to 268.7 per 1000 in 2005.
In addition, the 2006 South African Health Report attributed 15% of mortality in children
below the age of 5 to gastroenteritis, second only to lower respiratory tract infections (NICD,
2012).
18
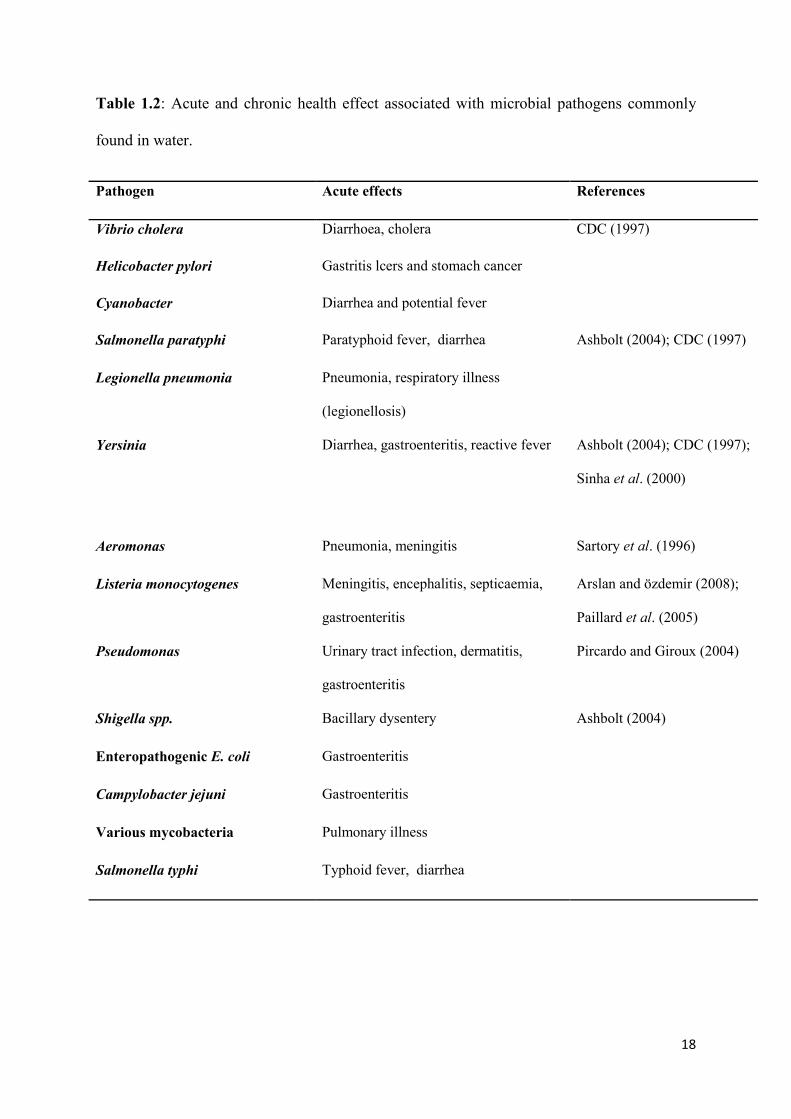
Table 1.2: Acute and chronic health effect associated with microbial pathogens commonly
found in water.
Pathogen Acute effects References
Vibrio cholera Diarrhoea, cholera CDC (1997)
Helicobacter pylori Gastritis lcers and stomach cancer
Cyanobacter Diarrhea and potential fever
Salmonella paratyphi Paratyphoid fever, diarrhea Ashbolt (2004); CDC (1997)
Legionella pneumonia Pneumonia, respiratory illness
(legionellosis)
Yersinia Diarrhea, gastroenteritis, reactive fever Ashbolt (2004); CDC (1997);
Sinha et al. (2000)
Aeromonas Pneumonia, meningitis Sartory et al. (1996)
Listeria monocytogenes Meningitis, encephalitis, septicaemia,
gastroenteritis
Arslan and özdemir (2008);
Paillard et al. (2005)
Pseudomonas Urinary tract infection, dermatitis,
gastroenteritis
Pircardo and Giroux (2004)
Shigella spp. Bacillary dysentery Ashbolt (2004)
Enteropathogenic E. coli Gastroenteritis
Campylobacter jejuni Gastroenteritis
Various mycobacteria Pulmonary illness
Salmonella typhi Typhoid fever, diarrhea
19
A study conducted by Obi et al. (2007) presented the percentage of Aeromonas species
isolated from patients with diarrhea in the Vhembe district of South Africa. Although the
source of infection was unclear, the most common source of infection results from the
consumption of contaminated water. Wastewater consists of vast quantities of bacteria, most
of which are harmless to man. Some of these emerging bacterial pathogens have been
documented to cause serious diseases, some which may result in death if ignored and
untreated e.g. Yersinia species infections cause septicaemia and pneumonia resulting in 100%
mortality if untreated (Rollins et al., 2003). Certain strains of Pseudomonas have been
reported as the main causatives of gastroenteritis and other gastrointestinal disease outbreaks
in immuno-compromised individuals (Metcalf and Eddy, 2003). The potential severity of
listeriosis outbreak on the public health is disquieting since there is absence of information on
the prevalence of this pathogen in South Africa. The fact that Listeria is not considered a
waterborne pathogen globally in spite of reports in the literature suggesting that the pathogen
is well established in the water supply chain is also of grave concern (Odjadjare et al., 2010).
Nutrients which may be contained in wastewater, especially nitrogen and phosphorus,
stimulate the growth of toxic species of phytoplankton in both fresh and marine waters and
the consumption of toxic algae or organisms that feed on these nutrients can cause serious
harm to humans and other terrestrial animals (Akpor and Muchie, 2011). The toxins arising
from these chemical compounds also have the ability to cause gastroenteritis, liver damage,
nervous system impairment and skin irritation. Health problems associated with cyanotoxins
have been reported in numerous countries, including Australia, Brazil, Canada, China, United
Kingdom, United States of America and Zimbabwe (Department of Natural Science, 2006;
WHO, 2006). Nitrate has not been found to be harmful, however its derivatives are
potentially toxic. A quarter of ingested nitrate is converted to nitrite by microorganisms in the
20
saliva of animals. Once it reaches the bloodstream, the ability of blood to carry oxygen by
converting haemoglobin into methemoglobin is impaired by nitrite. Ingestion of large
amounts of nitrate or nitrite can result in methemoglobinemia in infants and susceptible
individuals (WHO, 1997; Wigle 1992). Nitrites react with amino acids in the stomach to form
nitrosamines, which have been found to be extremely harmful carcinogens in animals and
humans (Fraser, 1995; El-Bahri et al., 1997; Runion, 2008).
Wastewater effluents have been shown to contain a variety of anthropogenic compounds,
many of which have endocrine-disrupting properties. Reports have shown that exposure to
wastewater treatment effluents containing estrogenic chemicals can disrupt the endocrine
functioning of aquatic life, thus can cause permanent alterations in the structure and function
of the reproductive system (Hoogenboezem, 2007). Individuals can be exposed to chemicals
in wastewater in various ways. They may ingest small amounts of pollutants in their drinking
water or absorb contaminants through their skin while bathing or swimming, or through
inhalation of airborne droplets while showering (Perez Guzzi et al., 2000). They may also
ingest food, such as fish that has been contaminated by waterborne pollutants. Although
ammonia is not a hazard to human health at levels that ordinarily occur in the environment,
exposure to it, especially in aquatic environments, can have several human health impacts.
The most dangerous consequence of exposure to ammonia is pulmonary edema, followed by
severe irritation to moist tissue surfaces (WHO, 1997; WHO, 2006). Eutrophication of water
sources may also create environmental conditions that favour the growth of toxin producing
cyanobacteria. Chronic exposure to such toxins produced by these organisms can cause
gastroenteritis, liver damage, nervous system impairment, skin irritation and liver cancer in
animals (Akpor and Muchie, 2011; EPA, 2009; WHO, 2006).
21
1.4.2 Prevention and treatment
Prevention of emerging waterborne bacterial diseases or outbreaks is mostly dependant on the
infectious cycle of a particular organism. For example: person-to-person transmission may
be minimised or inhibited by the improvement of hygiene and sanitary conditions as well as
the education of the public, more importantly the rural communities in developing countries.
The presence of microorganisms in natural water sources due to the discharge of inadequately
treated wastewater effluent may be minimised by the reviewing of guidelines and
implementation of stricter surface water protection policies (NICD, 2012). The problem
encountered in under-developed or developing countries is that many poor communities are
without proper sanitation facilities and in most cases do not have access to safe water sources.
Instead of decreasing, these problems seem to be rising with the increases seen in population
masses flocking to urban cities and towns.
The diversity of microorganisms and the on-going changes and adaptations to environments
seen in microbial populations continues to pose a threat to human health, challenging many
efforts aimed at prevention and treatment of diseases. In 2012, Center for Disease Control
and Prevention reported on their focus and aims to ensure that disease outbreaks are
prevented by improving on the following: The strengthening of public health fundamentals,
including infectious disease surveillance, laboratory detection, and epidemiologic
investigation, the identification and implementation of high-impact public health
interventions to reduce infectious diseases and the development and advancement of policies
to prevent, detect, and control infectious diseases (NICD, 2012). The above mentioned foci
would include the modernization of infectious disease surveillance, and an increase in clinical
laboratories for disease control and prevention, including human resource and trained staff
workers. This would result in the development of high- impact equipment or tools, and
vaccines both for disease detection and treatment as well as updated databases. The increase
22
in community and individual efforts and engagement in the prevention of disease would
result in the strengthening of public awareness on a global scale.
1.4.3 Public health control
Wastewater contains a wide variety of microbial pathogens most of which have shown to be
of no harm to human populations, however some of these bacteria, protozoa and viruses have
shown to be a health threats to populations and communities, who rely on water highly
polluted by such pathogenic contaminants. The contaminants in wastewater have the ability
to cause a wide range of infections and diseases, such as typhoid, dysentery, diarrhoea, skin
and tissue infections and other intestinal disorders (APHA, 2001; EPA, 1996; DWAF, 1996;
Obi et al., 2002). Microbial agents responsible for all the above are the most common
wastewater contaminants, thus their widespread study and research around the world. E. coli,
Listeria, Salmonella, Vibrio, Campylobacter are some of the microorganisms usually found
in wastewater polluted waters (CDC, 1997; Absar, 2005).
In South Africa, the Centre for Enteric Diseases was officially established in 2002 and tasked
with developing new and relevant strategies for prevention and combating enteric diseaseS,
as well as providing information to combat diarrhoeal diseases in South Africa. In addition,
the centre monitors trends in diarrhoeal pathogen incidence and identifies areas for the
introduction of additional interventions (NICD, 2012). Mortality from waterborne diseases
could be prevented with the implementation of good sanitation, hygiene, vaccination,
antibiotic treatment and oral rehydration therapy either through outbreaks or following
disasters. In developing countries, many waterborne diseases or outbreaks cannot be
prevented either due to lack of public health infrastructure or the complications arising from
other factors such as malnutrition and decreased immunity (Woodall, 2008, Igbinosa et al.,
23
2012). Improvement in public health diagnostic and detection procedures is essential in the
protection of the public, including infants, as well as the continuous monitoring of surface
water bodies to identify potential water-borne pathogens (Igbinosa et al., 2012).
1.4.4 Potential implications on the growing immuno-compromised populations
Listeria infections are reported to have the highest (up to 50%) mortality rate amongst
emerging bacterial pathogens. This is of grave concern to South Africa, with a high number
of HIV/AIDS infected people, coupled with a high level of drug and alcohol abuse, which has
led to many immune-compromised people in the country. If a new type of Listeria had to
break out, majority of South Africans’ lives would be at risk. Obi and Bessong (2002)
reported the isolation of Aeromonas species from 13.3% HIV patients with chronic diarrhoea
in rural communities in the Limpopo Province of South Africa, highlighting that immuno-
compromised populations can also suffer from Aeromonas-associated chronic diarrhoea. This
is especially worrisome in a province with a high number of immune-compromised
individuals due to the extremely high HIV and TB.
1.5 Pathogenesis and virulence determinants
Investigating the resistance mechanisms and pathways that emerging bacterial pathogens
choose to utilise when exposed to stressful conditions is of utmost importance. This will not
only reveal the utilised defence systems, but will also shed light on how these pathogens
acquire such resistance (Grobe et al., 2001). Resistance within microorganisms may range
from great specificity to very low specificity levels, posing a great challenge in determining
which mechanisms are responsible for which type of resistance (Chapman, 2003b; Morato et
al., 2003). Bacteria may use one or multiple mechanisms against a single agent or class of
agents and a single change may result in resistance to several different agents or even
24
multiple unrelated drug classes (Kaye et al., 2004; Langsrud et al., 2003a). It was found that
heavy metals, chlorine and antimicrobial resistance are closely related since microorganisms
that were resistant to one showed resistance to another to a certain degree (Cloete, 2003).
This phenomenon, known as cross resistance plays a significant role in the disinfection
process, particularly chlorination (Chapman, 2003b; Langsrud et al., 2003b). The disinfection
step in wastewater treatment is aimed at inactivating any pathogenic components that might
still be present in the wastewater effluent (Ford, 2006). Disinfection time and concentration
varies within different facilities, resulting in different results and varying residual disinfectant
and pathogen concentrations. Other factors such as temperature, pH, and turbidity can also
affect this process (Koo et al., 2008). It has been recorded that the enhanced sensitivity of
progeny of chlorine exposed cells might be caused by chlorine-induced mutations that result
in the loss of some factor influential in preventing the lethal activity of chlorine, such as the
ability to repair nucleic acid damage or cell envelope damage (Poole, 2005). The processes
used in water treatment (coagulation, flocculation, sedimentation and filtration) are very
effective in achieving high levels of particle removal when conducted appropriately,
including the removal of the pathogens. Failure to remove particulate matter makes the
disinfection process unreliable (Grobe et al., 2002).
Multidrug resistance and metal tolerance are the most studied topics in microbiology, due to
their importance in the clinical or medical sectors as well as industrial application sector
(Tirodimos et al., 2011). Antibiotic resistance is the most widely spread resistance trait of
many emerging bacterial pathogens especially Pseudomonas spp. (Langsrud et al., 2003a).
Studies revealed that the acquisition of antibiotic resistance is sometimes not at all affected
by their presence in an environment as previously thought, but may also be reliant on other
factors and chemical compositions (Eze et al., 2009; Sarme et al., 2010). Eze et al. (2009)
25
revealed that the genes coding for both heavy metal resistance and antibiotic resistance are
located on the same structure, meaning that metal tolerant microorganisms were also
multidrug resistant (Grobe at al., 2002). Substances such as heavy metals and biocides
resulting from industrial waste discharge are the most influential factors for this acquired
resistance in microorganisms. Recent studies conducted on microbes inhabiting metal rich
environment and those in minimum metal concentrations, proved that metal exposed
microorganisms portrayed greater resistance than those in metal poor conditions (Eze et al.,
2009).
1.5.1 Virulence markers aiding in pathogenesis
Bacterial pathogens which have been found as the main causative agents in many of the
water-borne diseases such as diarrhoea, septicaemia and skin infections have been studied
broadly over the past years. In these pathogens, multiple virulence genes and markers aiding
in pathogenesis have been discovered, explaining their resistance against the body’s defence
mechanisms and persistence in infections. Virulence markers such as extracellular toxins
(cytotoxins and enterotoxins), adhesins, and haemolysins have been discovered (Igbinosa et
al., 2012). No definite link has been established between virulence factors and the
development of infections; however a study conducted by Sechi et al. (2002) suggested a
possible link. In the study, Aeromonas species were investigated for haemolysis and protease
and gelatinase production which have been attributed to increasing the rate of infection. The
study found a greater prevalence of the above mentioned virulence genes among strains
isolated from patients with diarrhoea, which correlated with similar studies conducted by
other authors (Wang et al., 1996, Sechi et al., 2002). De Oliveira Scoaris et al. (2008)
reported on the necessity for organisms to contain more than a single extracellular enzyme to
ensure virulence. Although these enzymes undoubtedly play a role in pathogenicity, however
26
no specific extracellular enzyme has been proven to be solely responsible for the virulence of
a particular organism. The AHCYTOEN gene which codes for the cytolytic enterotoxin gene
has also been found in environmental samples obtained in aquatic environments but not from
clinical isolates suggesting that aquatic environments may act as reservoirs of potentially
virulent Aeromonas species (Sechi et al., 2002). The presence and expression of these
virulence genes has been found to be dependent on environmental conditions such as
temperature (Gonzalez-Serrano et al., 2002; Igbinosa et al., 2012). The diversity of microbes
and their mechanisms and properties of virulence and pathogenicity are too great to reliably
predict emergence and future human health impacts.
1.5.2 Resistance to antibiotic treatment
Antibiotics are one of the great discoveries of the 20th century; however, resistance began to
spread even in the earliest years of the budding antibiotic era (Stokes and Gillings, 2011).
Exposure to lowered concentrations of antimicrobials, as well as the constant evolution and
adaptations of the bacterial genome contributed largely to the resistance phenomena (Zhang
et al., 2009). Antibiotic resistance continues to be the main challenge in microbial infections
and treatment studies, as infectious microbes continue to gain resistance against treatment
and therefore becoming worse, despite the ever-increasing resources devoted to combat these
problems (Zhang et al., 2009).
Microorganisms pose a major health threat to humans, due to their disease causing ability
(Ashbolt, 2004; Samie et al., 2009). The occurrence of microorganisms and widespread
occurrence of disease outbreaks has led to the extensive use of disinfectants and antibacterial
agents found in common soaps, detergents, sanitizers and disinfectants. This has resulted in
major changes in environmental microorganisms which have evidently become tougher and
27
more resistant to treatment (Stokes and Gillings, 2011). The increasing rate of antibiotics and
antibacterial agents usage, has resulted in microorganisms which are highly resistant to
killing or treatment, even affecting those which are beneficial to man (Silva, 2006). There are
numerous routes of antimicrobial agent entry into the environment, and studies have shown
that introduction by these routes has changed the antibiotic susceptibility of the microbes in
those environments or changed the predominant microbial populations (Stokes and Gillings,
2011).
Medical and pharmaceutical discharge from hospitals has contributed largely to the increase
in antibiotic concentration and therefore has led to the rise of highly resistant bacterial
populations (Naviner et al., 2011). There are over 700 antibacterial household products
manufactured over the past 5 years, in the form of toothpastes, paints, cement, sprays as well
as common kitchen products, these products have been found to contain alcohols, bleaches
such as chlorine as well as ammonium compounds and many human pathogens have been
documented to be resistant to these products (Silva, 2006; Zhang et al., 2011). Agricultural
and crop industries increased use of antimicrobials also has a huge effect on microbial
populations in the environment, since these waters usually run off into nearby rivers and
estuaries (Adetunji and Isola, 2011; Zhang et al., 2011). Antimicrobials are being used in
animal feed production and subtherapeutic levels as growth promoters.
Sewage and wastewater treatment plants may be a rich reservoir of antibiotics because the
antibiotics taken in are not all processed by the bodies. Sludge remaining after wastewater
treatment at most treatment plants have been discovered to contain microorganisms (above
40%) which are resistant to multiple antibiotics (Jury et al., 2010; Silva, 2006). Rivers
contaminated with urban and agricultural effluent have shown bacterial populations with

28
greater antibiotic resistance than areas upstream of the contamination source (Falcão et al.,
2004).
One of the most significant factors contributing to antibiotic resistance is the common and
most notable ability of bacteria to share genetic resources via horizontal or lateral gene
transfer (HGT/LGT) (Munir et al., 2011). HGT has increased the spread of resistance
between different microbial populations, while also increasing their survival and
reproduction. Antibiotics are not responsible for causing resistance, instead, they allow
naturally resistant variants within a population to survive and reproduce while those
individuals without the resistance factor die and are eliminated (Stokes and Gillings, 2011).
Once in a bacterial population, antibiotic resistance can spread rapidly among related as well
as unrelated bacteria which acquire resistance from their neighbours via the HGT
phenomenon (Adetunji and Isola, 2011; Stokes and Gillings, 2011). Antibiotic resistance is
encoded in DNA, and bacteria have the ability to exchange DNA, especially in the form of
plasmids which are circular, small and self-replicating DNA components with the ability to
pass resistance very rapidly (Charpentier and Courvalin, 1999; Stokes and Gillings, 2011).
Some diseases are no longer treatable with antibiotics and some diseases that were previously
susceptible to a variety of antibiotics are now untreatable. The Centre for Disease Control
(CDC) approximated that 70% of infections that people get while hospitalized are now
resistant to at least one antibiotic. Resistance to antibiotics is rapidly outpacing the ability to
synthesize new drugs (Zhang et al., 2009). Considering the minority of bacteria which can
potentially be of great harm to human beings, treatment for these rare infections seems to be
an increasing obstacle. Wastewater treatment plants are the principal recipients of enteric
29
bacteria with multiple antibiotic resistances (Jury et al., 2010; Munir et al., 2011; Silva,
2006).
A number of mechanisms are responsible for antibiotic resistance; these may include
enzymatic inactivation of antibiotics, the alterations of the target sites of antimicrobial agents,
the development of bypass pathways around antimicrobial targets, presence of multidrug-
efflux pumps, as well as reductions in bacterial cell-wall permeability (Cloete, 2003; Eze et
al, 2009; Sarme et al., 2010; Zeng, 2004). Resistance mechanisms are usually specific for a
particular antibiotic, with membrane-impermeability-mediated resistance usually resulting in
a multidrug-resistance phenotype. Although the mechanisms of resistance to specific
antibiotics are well known, the molecular mechanism of multidrug resistance is poorly
understood (Zeng, 2004).
Bacteria have significant ability to develop resistance to every antibiotic they are exposed to;
it can be anticipated that even bacterial species such as Listeria, which are still considered to
be susceptible to almost all antibiotics, will evolve toward multi-resistance (Adetunji and
Isola, 2011; Arslan and özdemir, 2008; Charpentier and Courvalin, 1999). Listeria species are
opportunistic pathogens with non-specific clinical symptoms (NHS, 2009). Infection results
in a disease known as listeriosis. Despite efficient antibiotic therapy, listeriosis represents a
public health problem since it is fatal in multiple cases (Arslan and özdemir, 2008). In
general, isolates of L. monocytogenes, as well as strains of other Listeria spp., are susceptible
to a wide range of antibiotics except cephalosporins and fosfomycin (Adetunji and Isola,
2011). Studies have described the transfer of enterococcal and streptococcal plasmids and
transposons carrying antibiotic resistance genes by conjugation from Enterococcus-
Streptococcus to Listeria and between species of Listeria (Charpentier and Courvalin, 1999).
30
Pseudomonas aeruginosa contains the multidrug efflux pumps whose expression is linked to
that of outer membrane proteins, such as the MexAB-OprM system (mainly involved in
antibiotic resistance) (Sagripanti and Bonifacino, 2000; Simoês et al., 2009; Tirodimos et al.,
2011). Pseudomonas spp. also has the ability to easily pick up resistance genes via uptake of
DNA and mutations in adverse conditions (Picardo and Giroux, 2004). Adaptation and
resistance acquisition may even result from a slight genetic change, altering functional target
and in turn reducing the affinity of the used antimicrobial (Kaye et al., 2004). Inactivation of
enzymes remains the predominant mechanism of resistance to several major classes of
antimicrobial agents. The occurrence of phenotypic variation leading to increased
agglutination and biofilm formation has been consistently linked to resistance to chlorine,
acid, osmotic and oxidative stresses in a number of bacteria, indicating that changes in
phenotypic characteristics associated with increased biofilm formation are important at
increasing resistance to environmental stress (Drenkard, 2003).
1.5.3 Resistance to chlorine and other treatment technologies
Chlorine and chlorine containing chemical solvents are commonly used for disinfection due
to their killing effect on most pathogenic microorganisms (Dreeszen, 2003). Free chlorine is
most effective at a pH of 5 to 7, where HOCl is the predominant form and the effectiveness
declines with increased pH. Higher chlorine concentrations may be required to ensure
adequate disinfection when the pH of water is high (Koo et al., 2008). Five part per million is
the recommended residual chlorine concentration for the killing of pathogenic bacteria for a
5-10 minute contact time at pH 7-8.5 (Dreeszen, 2003). The major disadvantages of chlorine
are that it is not stable in water and the concentration decreases rapidly. Exposure to sunlight
or other strong light including agitation will accelerate the reduction of chlorine (Ibusquiza,
31
2011). Chlorine may also react with organic matter and other oxidizable contaminants in the
supply water and within the piping distribution systems (Grobe et al., 2001).
Resistance mechanisms vary within different microorganisms, with most of the phenotypic
adaptations being genetically expressed before being manifested physically. These
mechanisms include: limiting the intracellular concentration of the antimicrobial agent by
decreased influx or increased efflux, neutralization of the antimicrobial agent by enzymes
that reversibly or irreversibly inactivate the drug, alteration of the target so that the agent no
longer interferes with it as well as the elimination of the target altogether by the creation of
new metabolic pathways (Kaye et al., 2004). Of the resistance mechanisms, altered outer
cellular layers, stress response factors and the presence of efflux pumps are the most studied
(Cooper et al., 2010; Simoês et al., 2009; Tirodimos et al., 2011). Different biocides have
specific and specialized modes of action, including the differences in the reaction sites
located on the cell’s outer cell structure (Chapman, 2003b). The effect of these biocides
(chlorine, monochloramine etc.) on pathogens may also be reliant on several important
factors such as contact time, concentration of disinfectant, temperature and pH (Russell,
2003). The difference in outer cellular membranes of different microorganisms is another
factor affecting the action and degree of biocide effect.
Compared to Gram-positive bacteria, Gram negative bacteria are found to be more resistant
to numerous biocides due to the presence of the outer membrane which decreases
permeability (Cloete, 2003). Also the outer membrane of Gram-negative bacteria may
provide an additional intrinsic barrier that prevents drugs from reaching these targets (Cloete,
2003; Kaye et al., 2004). Lowered permeability decreases the movement of molecules across
the cell membrane, creating a permeability barrier and reducing the uptake of foreign
32
particles (Loughlin et al., 2002). This may result in decreased uptake of disinfectants which
act against microorganisms which are widely used in wastewater and drinking water
treatment processes. The modifications in outer membrane permeability by both alterations in
porin protein channels and by the up-regulation of intrinsic multidrug efflux pumps may
comprise a component of the mechanisms contributing to resistance in many Gram-negative
organisms (Grobe et al., 2002; Kaye et al., 2004). Aeromonas and Pseudomonas spp. have
the ability to transform toxic compounds into non-toxic compounds, rigidify the cell
membrane via alteration of the cell membrane including altering the phospholipid
composition, altering the cell surface to make the cells less permeable, form vesicles that
remove the solvent from the cell surface and efflux of the toxic compounds via efflux pumps
in an energy dependent process (Loughlin et al., 2002; Lăzăroaie, 2009). The targets of most
antimicrobial agents are located either in the cell wall, cytoplasmic membrane, or within the
cytoplasm (Ghosh et al., 2011). Resistant P. aeruginosa down-regulated genes encoding
membrane proteins, particularly genes related to permeases and transporters of carbohydrates
and catabolites (Small et al., 2006).
Another factor which contributes to antimicrobial resistance is encapsulation, a process
whereby microbial cells secrete an extracellular capsule layer (Grobe et al., 2001). Resistance
in Pseudomonas aeruginosa and Legionella spp. results from a physical change in the cell
membrane, affecting permeability. Studies where the capsular material of Pseudomonas was
isolated to measure various components such as hexose sugar and proteins, revealed that a
structural change does occur in resistant microorganisms (Kim et al., 2009). Free chlorine
reacts with extracellular capsular materials and the extracellular material can accumulate to a
great concentration. The reaction between chlorine and the extracellular material can be slow
due to the increase in free chlorine demand (Shrivastava et al., 2004). Studies have shown
33
that the maintenance of residual chlorine cannot guarantee total prevention of bacterial
prevalence in turn not resulting in further microbial reduction. A link between chlorine and
antibiotic resistance was made, but the mechanism of chlorine-induced antibiotic resistance in
bacteria still remains unknown. It is possible that chlorine can increase expression of the
multidrug efflux pumps, leading to resistance to disinfection by-products as well as
antibiotics (Xi et al., 2009).
The discovery of Listeria dates back to the 1920’s, initially in animals, and was finally
known as an animal pathogen, until the 1980’s where it was discovered as a human pathogen,
firstly discovered as a food borne pathogen and later as a water-borne pathogen (Ibusquiza,
2011). Listeria shows an increase in doubling time as well as the ability to withstand 100
times more biocide concentration; they also contain multidrug efflux pumps which have very
low specificity (Kim et al., 2009). This further confirms that no single mechanism can
account for the general observation of resistance, and that all act in concert (Sagripanti and
Bonifacino, 2000).
1.6 Survival mechanisms of emerging bacterial pathogens
Investigating the resistance mechanisms and pathways that emerging bacterial pathogens
choose to utilise when they are exposed to stressful conditions is of utmost importance. This
does not only reveal the utilised defence systems, but could also shed some light on how
these pathogens acquire such resistance (Grobe et al., 2001). The mechanisms of resistance
against commonly used disinfectants include: limited diffusion of antimicrobial agents
through the biofilm matrix, interaction of the antimicrobial agents with the biofilm matrix
(cells and polymer), enzyme mediated resistance, level of metabolic activity within the
34
biofilm, genetic adaptation, efflux pumps and outer membrane structure (Eze et al., 2009;
Grobe et al., 2002; Langsrud et al., 2003a; Purkrtová et al., 2010; Sarme et al., 2010).
Multidrug resistance has been mainly responsible for the emergence or re-emergence of
several pathogens, especially Pseudomonas aeruginosa (Sharma, 2003). Resistance within
microorganisms may range from great specificity to very low specificity levels; posing a
great challenge in determining which mechanisms are responsible for which type of
resistance (Chapman, 2003b; Morato et al., 2003). Literature reveals that bacteria may use
one or multiple mechanisms against a single agent or class of agents, with a single change
resulting in resistance to several different agents or even multiple unrelated drug classes
(Kaye et al., 2004; Langsrud et al., 2003a). It was found that heavy metal, chlorine and
antimicrobial resistance is closely related since microorganisms that were resistant to one
showed resistance to another to a certain degree (Cloete, 2003). This phenomenon is known
as cross resistance and plays a significant role in the disinfection process, particularly
chlorination (Chapman, 2003a; Langsrud et al., 2003a). The disinfection step in wastewater
treatment is aimed at inactivating any pathogenic components that might still be present in
the wastewater effluent (Ford, 2006). Disinfection time and concentration varies within
different facilities, resulting in different outcomes and varying residual chlorine and pathogen
concentrations. Other factors such as temperature, pH, and turbidity can also affect this
process (Koo et al., 2008). The particle removal processes used in water treatment
(coagulation, flocculation, sedimentation and filtration) when conducted appropriately are
very effective in achieving high levels of particle removal, including the removal of the
pathogens. Failure to remove particulate matter makes the disinfection process unreliable
(Grobe et al., 2002).
35
Multidrug resistance and metal tolerance are the most studied topics in microbiology, due to
their importance in the clinical or medical sectors as well as industrial application sector,
respectively (Baker-Austin et al., 2006). Antibiotic resistance is the most widely spread
resistance trait in emerging bacterial pathogens especially in some enteropathogens, such as
Pseudomonas species (Langsrud et al., 2003a). Studies revealed that the acquisition of
antibiotic resistance is sometimes not at all affected by their presence in an environment as
previously thought, but may also be reliant on other factors and chemical compositions (Eze
et al., 2009; Sarme et al., 2010). Eze et al. (2009) revealed that the genes coding for both
heavy metal resistance and antibiotic resistance are located on the same structure, meaning
that metal tolerant microorganisms were also multidrug resistant (Grobe et al., 2002).
Substances such as heavy metals and biocides resulting from industrial waste discharge are
the most influential factors for this acquired resistance in microorganisms. Recent studies
conducted on microbes inhabiting a metal rich environment and those in minimum metal
concentrations, proved that metal-exposed microorganisms portrayed greater resistance than
those in metal poor conditions (Eze et al., 2009). Tests were performed to determine the
degree of resistance to antibiotics, antimicrobial agents and metals. Of the tested microbial
genera, Pseudomonas showed the highest resistance to all the tested parameters (Shrivastava
et al., 2004). Jydegaard-Axelson et al. (2005) observed an increase in the expression of genes
encoding for glutamate decarboxylase, which is essential for survival in strong acid, as well
as increased amounts of branched fatty acids in the membranes were observed in an acid
tolerant strain of L. monocytogenes under elevated CO2 and anaerobiosis. However, an acid
sensitive strain responded differently to CO2 and N2 under the same conditions. The various
survival and adaptation strategies employed by emerging bacterial pathogens include;
symbiotic associations, cell membrane alterations, use of efflux pumps, changes in cell
physiology and gene expression as discussed in section 1.6.1 to 1.6.5.

36
1.6.1 Symbiotic associations
A bacterial biofilm is a community of bacterial cells enclosed or surrounded in a self-
produced polymeric matrix that is adherent to an inert or living surface (Morris and Hagr,
2005). It is estimated that only 1% of bacteria exist in the familiar, free-floating, or
planktonic form, with the remaining 99% existing in protective biofilms (Morris and Hagr,
2005). Biofilm structures develop when planktonic bacteria become sessile and adhere to a
surface in the presence of water. Different stages of attachment, colonization, and growth
lead to the establishment of a mature biofilm colony (Sagripanti and Bonifacino, 2000).
These structures are protective layers with protein and polysaccharides which surround the
microorganism, in turn offering maximum protection (Purkrtová et al., 2010). Once the
biofilm becomes established, it is then considered as a fortress from which bacteria exhibit
spectacular defence mechanisms against antimicrobial agents (Kim et al., 2009). Bacterial
cells making up a biofilm have a more complex behavioural system than that of suspended
cells. Colonies show altered characteristics involving complicated intercellular
communication systems, enabling them to exploit their environment (Kim et al., 2009).
Within the biofilm population, there appears to be a division of labour which also adds to the
overall resistance of the biofilm body (Morris and Hagr, 2005). Biofilm structures reduce or
eliminate particle associated contact between the disinfectants and microbial cell (Poole,
2005).
Aeromonas, Pseudomonas, Listeria, Yersinia and Legionella species have all been associated
with robust biofilm structure formation, as a stress response and protective measure. Studies
on Listeria species have shown the existence of these organisms in biofilm structures.
Pseudomonas cells have also been shown to exist in a biofilm structure. The biofilm structure
acts as a shield for the microorganisms, preventing the diffusion of chlorine into the
37
microbial cells, thus requiring a longer time to be killed or eliminated compared to the
planktonic free living cells which require a much shorter time (Grobe et al., 2002).
Legionella species have shown the rare ability to propagate and form biofilm structures with
free living amoebae such as; Acanthamoeba, Naegleria and Hartmanella. These amoebae
have the ability to support Legionella growth within their cells, thus shielding the cells and
enabling them to survive and become resistant to inappropriate environmental conditions.
These sheltered cells have the ability to withstand temperatures as high as 45-53 ºC, including
lower pH levels as well as free chlorine levels of 0.3-0.5 ppm (Burak and Zeybek, 2009).
1.6.2 Cell membrane alterations
Chlorine and chlorine containing chemical solvents are commonly used for disinfection due
to their killing effect on most pathogenic microorganisms (Dreeszen, 2003). Free chlorine is
most effective at a pH of 5 to 7, where HOCl is the predominant form, with a decline in
effectiveness with increased pH. Higher chlorine concentration may be required to ensure
adequate disinfection when the pH of water is high (Koo et al., 2008). Five ppm for a 5-10
minute contact time is the recommended residual chlorine concentration for killing off
pathogenic bacteria at pH 7 - 8.5 (Dreeszen, 2003). The major disadvantage of chlorine is that
it is not stable in water and the concentration decreases rapidly. Exposure to sunlight or other
strong light including agitation will accelerate the reduction of chlorine (Ibusquiza, 2011).
Chlorine may also be used up by reacting with organic matter and other oxidizable
contaminants in the water supply and within the piping distribution systems (Grobe et al.,
2001). Chlorine and associated compounds interact with the cell wall, forming openings and
pores and therefore allowing for uncontrolled entry into the cell (Cloete, 2003).
38
Pseudomonas aeruginosa is one of the most resistant emerging bacterial pathogen and has
been found to contain intrinsic resistance factors (Langsrud et al., 2003a; Dreeszen, 2003). It
is the most resistant non-spore forming bacteria to most bacteriocides, due to the superior
barrier properties of its outer membrane. An increase in the unsaturated fatty acid ratio was
observed in disinfectant resistant P. aeruginosa cells and similar results were observed in the
membrane lipid profiles (Cloete, 2003). Their biofilms are found to be metabolically active,
leading to an increase in cell biomass, cell density and extracellular proteins and
polysaccharide. Pseudomonas contained 29% of the total proteins and 61% of the total
polysaccharide (Simoês et al., 2009). Biofilm surfaces are responsible for the absorption and
catalytic destruction of disinfectant agent (Simoês et al., 2009). Pseudomonas aeruginosa
contain a low permeable outer membrane which prevents or blocks entry of many agents to
their site of action. Analysis of the outer membrane proteins of adapted cells revealed an
increase in certain proteins and a sudden appearance of some proteins not found in cells
which were not adapted (Langsrud et al., 2003a). The outer membrane protein increase from
4% to 14% can be found in the most resistant cells, depending on the strain (Loughlin et al.,
2002). During the same study, an unknown fatty acid was detected using mass spectroscopy,
indicating that there is a reasonable increase in structural components. Resistant cells showed
a decrease in phosphotidylcholine concentration (20%- 6 %), with the lipid concentrations
were as follows: 10% diphosphotidylglycerol, 50% phosphatidylethanolamine, 20%
phosphatidylglycerol and 10% phosphatidylcholine (Loughlin et al., 2002). A decrease in
hydrophobicity and surface charge leads to an increase in the negative charge with increasing
resistance (Kim et al., 2009).

39
1.6.3 The presence of efflux pumps
Gram-negative bacteria including Pseudomonas spp., Aeromonas spp., Legionella spp. and
Yersinia spp. contain multidrug transporters characterized by a common three component
organization: a membrane fusion protein that is associated with the cytoplasmic membrane, a
transporter protein that exports the substrate across the inner membrane, and an outer
membrane protein (OMP) that facilitates the passage of the substrate across the outer
membrane (Drenkard, 2003). Pseudomonas aeruginosa contains the multidrug efflux pumps
whose expression is linked to that of outer membrane proteins, such as the MexAB-OprM
system (mainly involved in antibiotic resistance) (Sagripanti and Bonifacino, 2000; Simoês et
al., 2009; Tirodimos et al., 2011). The lack of specificity observed in MexAB–OprM system
is very interesting and its natural physiological role indistinct (Ghosh et al., 2011). The OprM
subunit is the outer membrane-anchored lipoprotein that is assumed to form the antibiotic
discharge duct across the outer membrane. The MexA subunit anchors to an inner membrane
via N-terminal fatty acid. Removal of fatty acids liberates a protein from the membrane and
the protein becomes freely soluble in aqueous solutions. Therefore, MexA is assumed to link
MexB and OprM, helping the assembly of the functional pump unit.
Pseudomonas spp. also has the ability to easily pick up resistance genes via uptake of DNA
and mutations in adverse conditions (Picardo and Giroux, 2004). Adaptation and resistance
acquisition may even result from a slight genetic change, altering functional target and in turn
reducing the affinity of the used antimicrobial (Kaye et al., 2004). Inactivating enzymes
remain the predominant mechanism of resistance to several major classes of antimicrobial
agents. The occurrence of phenotypic variation leading to increased agglutination and biofilm
formation has been consistently linked to resistance to chlorine, acid, osmotic and oxidative
stresses in a number of bacteria, indicating that changes in phenotypic characteristics

40
associated with increased biofilm formation are important at increasing resistance to
environmental stress (Drenkard, 2003).
1.6.4 Changes in cell physiology
Resistance mechanisms vary within different microorganisms, with most of the phenotypic
adaptations being genetically expressed before manifesting. These mechanisms include:
limiting the intracellular concentration of the antimicrobial agent by decreased influx or
increased efflux, neutralization of the antimicrobial agent by enzymes that reversibly or
irreversibly inactivate the drug, alteration of the target so that the agent no longer interferes
with it as well as the elimination of the target altogether by the creation of new metabolic
pathways (Kaye et al., 2004). The subsequent resistance mechanisms such as altered outer
cellular layers, stress response factors and the presence of efflux pumps are the most studied,
with many references existing in literature (Cooper and Hanlon, 2010; Simoês et al., 2009).
1.6.4.1 Physiology and metabolism
Different biocides have specific and specialized modes of action, including the differences in
the reaction sites located on the cell’s outer cell structure (Chapman, 2003b). The effect of
these biocides (chlorine, monochloramine etc.) on pathogens may also be reliant on several
important factors such as contact time, concentration of disinfectant, temperature and pH
(Russell, 2003). The difference in outer cellular membranes of different microorganisms also
affects the action and degree of biocide effect. Gram negative bacteria are found to be more
resistant to numerous biocides due to the presence of the outer membrane which decreases
permeability (Cloete, 2003). The outer membrane may also provide an additional intrinsic
barrier that prevents drugs from reaching these targets in Gram-negative bacteria (Cloete,
2003; Kaye et al., 2004).
41
Lowered permeability decreases the movement of molecules across the cell membrane,
creating a permeability barrier therefore reducing uptake of foreign particles (Loughlin et al.,
2002). This may result in the decreased uptake of disinfectants which are widely used in
wastewater and drinking water treatment processes. The modifications in outer membrane
permeability by both alterations in porin protein channels and by the up-regulation of
intrinsic multidrug efflux pumps may comprise a component of the mechanisms contributing
to resistance in many gram-negative organisms (Grobe et al., 2002; Kaye et al., 2004).
Aeromonas and Pseudomonas spp. have the ability to transform toxic compounds into non-
toxic compounds, rigidify the cell membrane via alteration of the cell membrane including
the phospholipid composition, alter the cell surface, make the cells less permeable, form
vesicles that remove the solvent from the cell surface and efflux of the toxic compounds via
efflux pumps in an energy dependent process (Lăzăroaie, 2009; Loughlin et al., 2002). The
targets of most antimicrobial agents are located either in the cell wall, cytoplasmic
membrane, or within the cytoplasm (Ghosh et al., 2011).
1.6.4.2 Neutralization of disinfectants
Pseudomonas spp. also produces acyl-homoserine lactone (HSL) quorum-sensing signal
compounds, which react with biocides. Hexanoyl HSL, 3-oxohexanoyl HSL, 3-
oxododecanoyl HSL are also involved in biofilm formation, with the 3-oxo moiety reacting
with HOCl. All HSL compounds carrying the 3-oxo group have the ability to react with
oxidising halogen groups by consuming it (Borchardt et al., 2001). Pseudomonas spp.
defence mechanisms involve the transfer of genetic material including virulence and
resistance gene between monospecies and polyspecies of closely associated microorganisms
(Picardo and Giroux, 2004). The most common resistance trait is penetration failure of
42
bactericidal agents as well as their neutralization before reacting with the target site of
specific microbial cells (Morris and Hagr, 2005).
1.6.4.3 Alginate production
Study of Pseudomonas spp. biofilms revealed that they have the ability to produce alginate,
an extracellular polymeric substance which contains branches resembling the N-acyl
homoserine lactone groups (Morris and Hagr, 2005). Planktonic Pseudomonas aeruginosa
also secretes the alginate polysaccharide which provides the cell with protection against a
variety of host factors (Leid et al., 2005). The role and the mechanism of action of alginate in
both the sessile and planktonic microbial cell forms in their protection is still unknown
(Morris and Hagr, 2005; Shrivastava et al., 2004). Wood et al. (2006), showed that
Pseudomonas spp. with a mucoid phenotype had enhanced survival in chlorinated waters and
that removal of the slime layer increased susceptibility to chlorine. Alginate production is
regulated by a cassette of genes, algTmucABC. AlgT is a sigma factor involved in the
positive regulation of the mucoid phenotype in P. aeruginosa. MucA and MucB inhibit the
production of AlgT in a negative feedback loop (Cochran et al., 1999). When spontaneous
null mutations in mucA or mucB occur, AlgT is up-regulated, resulting in increased
production of alginate (Cochran et al., 1999). It has been suggested that alginate promotes
biofilm formation.
Encapsulation is another factor which contributes to microbial resistance (Grobe et al., 2001).
Resistance in Pseudomonas aeruginosa and Legionella species results from a physical
change in the cell membrane, affecting permeability. In studies where the capsular material of
Pseudomonas was isolated to measure various components such as hexose sugar and
proteins, it was revealed that a structural change does occur in resistant microorganisms (Kim
43
et al., 2009). Free chlorine reacts with extracellular capsular materials and the extracellular
material can accumulate to a great concentration. The reaction between chlorine and the
extracellular material can be slow due to this, increasing the free chlorine demand
(Shrivastava et al., 2004). Studies have shown that the maintenance of residual chlorine
cannot guarantee total prevention of bacterial prevalence. A link between chlorine and
antibiotic resistance was made, and three mechanism of chlorine-induced antibiotic resistance
in bacteria still remains unknown. It is possible that chlorine can increase expression of the
multidrug efflux pumps, leading to resistance to disinfection by-products as well as
antibiotics (Xi et al., 2009).
The outer membrane of microorganisms may create a diffusion barrier to antimicrobial
agents, since diffusion into the biofilm is affected by ionic surface charge interactions
between the glycocalyx and antimicrobial agents. One of the ways by which this is
accomplished, is by size exclusion or sieving affected by the viscosity of the glycocalyx
(Chapman, 2003b). The polyanionic nature creates a charge interaction barrier to diffusion of
cationic antimicrobial agents (Cloete, 2003). Enzyme mediated resistance is another trait of
resistant microbial pathogens; these enzymes have the ability to transform bacteriocides from
their toxic to a non-toxic form. The mechanism of action of these enzymes is similar to those
involved in heavy metal resistance, useful in biodegradation of toxic pollutants (Eze et al.,
2009; Sarme et al., 2010). The Gram negative cell envelope has evolved to regulate passage
of substances into and out of the cell at increasing specificities (Morris and Hagr, 2005). All
the cell envelope components play a role in barrier mechanism except that the peptidoglycan
is spongy and therefore highly permeable (Cloete, 2003). The metabolic state of
microorganisms growing within a biofilm has been reported to be suppressed. The
physiological state of cells and the nature of the habitat can lead to considerable variation in

44
the susceptibility of bacteria to bactericides (Kim et al., 2009). Envelope and barrier
composition are altered under nutrient deprivation. Sub-inhibitory concentrations of
bacteriocides can confer a resistant phenotype. Cloete (2003), discovered that the resistant
phenotype is mostly lost upon removal of the bacteriocidal stress. Due to the arrangement of
biofilm cells, some cells within the biofilm are slow growing or in a starved state with
reduced respiration. Slow or non-growing cells are less susceptible to a variety of
antimicrobial agents when compared to cells grown in rich media at high specific growth
rates (Kim et al., 2009). Wang and Gu (2003) analysed Aeromonas species growth and
behaviour in water at a water reserve and reported that these species had the ability to
produce chitinase which aids in the adsorption and multiplication on different zooplanktons
and pytoplanktons. The exopolymeric matrix of Listeria spp. biofilms is charged, hydrated
and surrounds individual cells and micro colonies, it therefore affects the access solutes
(Cloete, 2003). The polymers act as ion exchange resin and therefore actively removing
strongly charged molecules from the solution. Chlorine therefore poorly penetrates through
anionic matrices, chemically reacting and neutralizing the reactive molecules (Cloete, 2003;
Sagripanti and Bonifacino, 2000). A commonly observed disadvantage is that chlorine can be
inactivated in the presence of organic material (Shrivastava et al., 2004).
1.6.5 Changes in gene expression
Bacterial efflux systems capable of accommodating antimicrobials generally fall into five
classes. The major facilitator (MF) super family, the ATP-binding cassette (ABC) family, the
resistance-nodulation-division (RND) family, the small multidrug resistance (SMR) and the
multidrug and toxic compound extrusion (MATE) family. Three such efflux systems have
also been described for P. aeruginosa, MexA-MexB-OprM, MexC-MexD-OprJ and MexE-
MexF-OprN. Pseudomonas aeruginosa genes for the efflux systems (Cml, CmlA, CmlB)
45
and pump family (MF), are located mostly in plasmids while others are chromosomal (Poole,
2005). The MexAB-OprM and EmrE pumps of P. aeruginosa have also been reported to
provide a very modest contribution to intrinsic resistance to these antimicrobial agents (Liao
and Shollenberger, 2003). A recent study suggests that the MexAB-OprM efflux system of P.
aeruginosa promotes the release of molecules ultimately important for the virulence of this
organism, though the actual virulence-related factors exported were not identified (Poole,
2005; Xi et al., 2009). This efflux system is well known for its non-specificity and is linked
to chlorine resistance (Xi et al., 2009). Two novel putative exopolysaccharide gene clusters,
pea and peb, were identified in P. putida KT2440, both genes encode products that stabilize
the biofilm structure. The gene clusters alg and bcs, which code for proteins mediating
alginate and cellulose biosynthesis, were also discovered and these play minor roles in P.
putida KT2440 biofilm formation and stability under the conditions tested (Nilsson et al.,
2011). All efforts directed towards the isolation of the chlorine resistance plasmid in
Pseudomonas have not been successful to date, regardless of the fact that it is linked to
multidrug resistance (Shrivastava et al., 2004). Listeria spp. was found to express a stress-
response-related cplC gene, which encodes a protein (CplC ATPase) that is produced under
stress conditions (Rodrigues et al., 2011). The oxyR gene system responsible for the
prevention and repair purposes of radical induced damage was also discovered. Induction of
these systems in response to radicals results in the synthesis of proteins such as catalases,
superoxide dismutase, and alkyl hydroperoxidases. The regulation of these systems is
complex, featuring overlapping expression with each other and several other stress response
regulations as well. One of the features of these systems is cross-resistance to oxidants;
induction by hydrogen peroxide can protect against hypochlorous acid and vice versa
(Chapman, 2003a).

46
1.7 Wastewater guidelines and the protection of surface waters
1.7.1 Current guidelines: Review and reliability
The Durban Wastewater Managing Department (DWM), controlled and monitored by the
Department of Water Affairs (DWA) has set specific guidelines to monitor, maintain and
protect the state of the surface water in South Africa. The DWA is responsible for monthly
sampling and testing of wastewater effluent to ensure that current water constitutions meet
the appropriate legislative requirements (DWAF, 1996). The detection, isolation and
identification of the many different types of microbial pathogens associated with wastewater
would be difficult, time consuming and hugely expensive undertaking if attempted on a
regular basis. Indicator microorganisms are therefore used to determine the relative risk of the
possible presence of pathogenic microorganisms in a sample (Scott et al., 2003). Besides the
routine monitoring for total coliform (TC) and feacal coliform (FC) bacteria that have been
used for assessing water quality, several types of alternative microorganisms have been
suggested as indicators of water quality, feacal pollution and public health risks (Toze, 1997).
To ensure that these indicators function effectively, the following should be true for such
microorganisms: the indicator should be a member of the intestinal microflora of warm-
blooded animals; should be present in the presence of pathogens, and absent in pathogen-free
or uncontaminated samples; it should be present in greater population numbers compared to
the pathogenic counterparts; the indicator and pathogen need to be of equal resistance to
environmental factors as well as to disinfection in water and wastewater treatment plants; it
must not have the ability to multiply in the environment; it should be non-pathogenic and
easily, rapidly and inexpensively detected (Bitton, 2005). These include enterococci,
Clostridium perfringens, and coliphage among others. In 1986, USEPA published new
criteria for bacteria based on studies of the occurrence of illness in swimmers. Feacal
coliforms proved not to have a reliable relation with illness occurrence, thus the new criteria
47
was no longer supported, instead Enterococcus or E. coli were recommended because they
showed good correlations with illness and therefore more protective of public health (Toze,
1997).
Different countries have shown to have differing standards, mainly based on each countries
outbreak history and current possible health risks; however the differences are not too great.
Table 1.3 represents guidelines from 4 different countries, indicating that South African
guidelines seem to be of first world standard irrespective of its third world status.
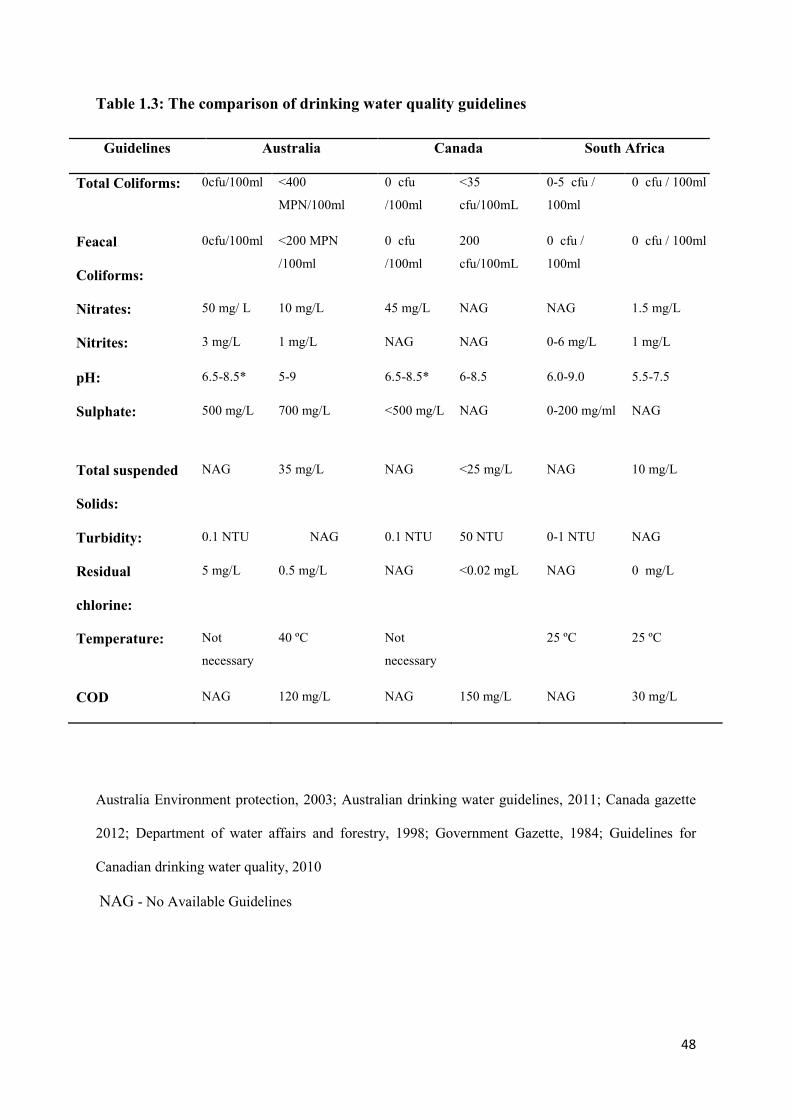
48
Table 1.3: The comparison of drinking water quality guidelines
Australia Environment protection, 2003; Australian drinking water guidelines, 2011; Canada gazette
2012; Department of water affairs and forestry, 1998; Government Gazette, 1984; Guidelines for
Canadian drinking water quality, 2010
NAG - No Available Guidelines
Guidelines Australia Canada South Africa
Total Coliforms: 0cfu/100ml <400
MPN/100ml
0 cfu
/100ml
<35
cfu/100mL
0-5 cfu /
100ml
0 cfu / 100ml
Feacal
Coliforms:
0cfu/100ml <200 MPN
/100ml
0 cfu
/100ml
200
cfu/100mL
0 cfu /
100ml
0 cfu / 100ml
Nitrates: 50 mg/ L 10 mg/L 45 mg/L NAG NAG 1.5 mg/L
Nitrites: 3 mg/L 1 mg/L NAG NAG 0-6 mg/L 1 mg/L
pH: 6.5-8.5* 5-9 6.5-8.5* 6-8.5 6.0-9.0 5.5-7.5
Sulphate: 500 mg/L 700 mg/L <500 mg/L NAG 0-200 mg/ml NAG
Total suspended
Solids:
NAG 35 mg/L NAG <25 mg/L NAG 10 mg/L
Turbidity: 0.1 NTU NAG 0.1 NTU 50 NTU 0-1 NTU NAG
Residual
chlorine:
5 mg/L 0.5 mg/L NAG <0.02 mgL NAG 0 mg/L
Temperature: Not
necessary
40 ºC Not
necessary
25 ºC 25 ºC
COD NAG 120 mg/L NAG 150 mg/L NAG 30 mg/L
49
1.7.2 Indicator microorganisms
1.7.2.1 Current indicator microorganisms
Indicator microorganisms are those microorganisms which can provide information about the
state
(safety and health) of a water body through the organism’s presence, condition, or numbers
(EPA, 2011). Escherichia coli was used as the most suitable indicator in the early centuries,
until it was discovered that its removal during wastewater treatment stages is much more
easily achieved when compared to the other emerging bacterial pathogens. Pathogens and
possibly emerging pathogens were found to be more resistant to the application of
traditionally employed stages of wastewater or drinking water treatment (Hörman et al.,
2004; USEPA, 2000, Slawson et al., 2011). Non-pathogenic bacteria known as coliforms and
faecal coliform have been used to indicate the presence or absence of pathogenic wastewater
bacteria (EPA, 1996; APHA, 2001).
Faecal coliform testing has been accepted as the best indicator of faecal contamination
because it is easier to test for coliforms. Faecal coliform counts of 100 million per 100
millilitres may be found in raw domestic sewage. Detectable health effects have been found
at levels of 2300 to 2400 total coliforms per 100 milliliters in recreational waters.
Disinfection, usually chlorination, is generally used to reduce these pathogens (EPA, 1996;
Absar, 2005). Testing for the presence of indicator microorganisms such as faecal coliforms,
total coliforms and enterococci are imperative to ensure their reduction to safe levels with no
health hazards such as disease outbreaks resulting from exposure to such waters (Ashbolt,
2004; Samie et al., 2009). It is assumed that the presence of these microorganisms is a sure
50
indicator of the presence of pathogens, especially enteropathogens (Hoogenboezem, 2007;
Perdek et al., 2002).
1.7.2.2 Indicator-pathogen relationship with respect to human health
Human health risks linked to surface water usually used for recreational purposes and other
domestic needs, especially in much poorer communities have not been extensively studied. In
the past years, a significant increase in the pathogen detection and quantification studies has
been observed (Slawson, 2011). Molecular detection methods such as quantitative
polymerase chain reaction (QT-PCR) and multiplex PCR have resulted in better sensitivity
compared to the traditional monitoring of organisms. Several studies have resulted in the
identification of pathogens of human health concern with very little to no correlation with the
known and employed indicator microorganisms (AWRA, 2007; Paillard et al., 2005; Pablos
et al., 2009; Poffe et al., 1991; Odjadjare et al., 2010). There are however a few studies such
as that conducted by Wade et al. (2006), which found a strong correlation or association
between microbial indicators and human health risks. This was seen where indicator
microorganisms were detected in the occurrence of gastro intestinal illnesses. Wilkes et al.
(2009), reported on the lack of a relationship found between pathogens and indicator
microorganisms, with varying cases supporting the detection of pathogens in the absence of
indicators (Slawson, 2011). This has led to the possible suggestions that no single indicator is
responsible or suitable for the detection of pathogens, considering that many have shown
varying strengths of resistance and are prone to develop adaptive traits based on their current
environments and need for survival.
51
1.7.2.3 Alternative indicators
Although coliform bacteria are utilized worldwide as indicator microorganisms, it is of
utmost importance to understand the present limitations of these organisms and their
implementation in the current guidelines (Tyagi et al., 2006). It has been proved that the
conventional indicators of faecal origin i.e. coliform bacteria (total and faecal coliforms),
used to evaluate microbiological quality of waters provide erroneous information. They do
not adequately reflect the occurrence of pathogens in disinfected wastewater effluent due to
their relatively high susceptibility to chemical disinfection and failure to correlate with
protozoan parasites and enteric viruses (Harwood et al., 2005). Thus, the public health is not
protected by using these common indicators, since methods for the detection of sewage borne
pathogen become complex, qualitatively unreliable and do not ensure complete safety of
water for the consumer. Therefore, the approach is to select some unconventional indicator
microbes whose presence presumes that contamination has occurred and suggests the nature
and extent of contaminants.
Clostridium perfringens has been considered greatly as an indicator of faecal pollution (José
Figueras and Borrego, 2010; Harwood et al., 2005). It has been recorded as one of the
organisms which is more resistant to conventional chemical treatment and is more suitable
and successful in the monitoring of faecal contamination (José Figueras and Borrego, 2010).
The World Health Organisation (2008) however expressed concerns related to this organism
in that it had a longer survival rate and could therefore be detected long after the pollution.
Pseudomonas and Aeromonas species have also been considered as possible indicator
organisms based on their occurrence in faecal polluted waters as well as their resistance to
chemical disinfection (Health Canada, 2006). The use of bacteriophages has been the most
supported for bacterial analyses. These virus particles infect faecal bacterial organisms
52
without affecting or infecting human populations. They have been supported due to their
more reliable correlation to the presence of pathogens when compared to other coliform
bacteria (José Figueras and Borrego, 2010; Roop, 2007). Coliphage meet several of the ideal
indicator organisms’ criteria and therefore seem to be the better alternative for coliforms
(Roop, 2007).
Emerging bacterial pathogens have been discovered in many treated waters, whether it be
treated wastewater effluent or treated drinking water. Their prevalence is prominent resulting
in a widespread increase in health problems around the world. To combat or decrease these
cases, the adaptation and defence mechanisms of these bacterial pathogens to environmental
stresses and bactericidal or bacteriostatic agents need to be fully understood. This, however,
is a challenge and will remain so for as long as no attention is paid to the different defence
mechanism and the specifics of the modes of action. Based on previous literature and
findings, it is evident that these bacterial pathogens are indeed prevalent, but minimal
research has been done on how they resist treatment and disinfection (Shrivastava et al.,
2004). It is therefore a challenge to pinpoint the direct cause of decreased susceptibility in
treatment processes especially in emerging pathogens that are not broadly studied including
Listeria and Yersinia spp. The recorded mechanisms are known but are not fully understood
and this creates a tainted picture and view on the survival of these emerging bacterial
pathogens, resulting in many grey areas and assumption based findings rather than fact.
However, the discovery of emerging pathogens in treated water, in the absence of indicator
organisms, indicates that the treatment processes are not effective in efficient pathogen
removal (Toze, 1997).
53
These findings have placed much doubt on the reliability of indicator organisms and their use
in water treatment monitoring (Wade et al., 2006; Graczyk et al. 2010). It has been
recognised that the microbial indicator parameters do not behave in the same way as
emerging bacterial pathogens in the same waters (Stanfield et al., 2002). Blackburn et al.
(2004) reported that more than 40% of the water samples linked to disease outbreaks
contained acceptable coliform levels, further re-iterating the inadequacy of the use of these
coliforms as indicators of water quality.
South Africa currently has no set guidelines for emerging bacterial pathogens and their
presence in the discharged wastewater effluent cannot be monitored (Bartie et al., 2002).
Emerging pathogens have been implicated in a wide range of disease outbreaks which may
result in death if ignored or untreated e.g. Yersinia causes septicaemia and pneumonia
resulting in 100% mortality if untreated (Rollins et al., 2003). The fact that these pathogens
are also found to be present in drinking tap water which is meant to be safe and pathogen
free, further proves that guidelines need to be revised. According to the safe water act, the
maximum contamination levels for safe drinking water should be zero for all pathogens “no
tolerable lower limit” (WHO, 2008). It is therefore evident that the ineffectiveness of these
established processes poses a health threat worldwide (Obi et al., 2002).
1.8 Scope of the present study
The presence of emerging bacterial pathogens cannot be tracked or monitored during
traditional treatment processes, mainly due to the absence of set guidelines for emerging
bacterial pathogens in South African wastewater, leading to their release and dissemination
into the environment (Bartie et al., 2002; Odjadjare, 2012). Reports of inadequate removal of
emerging bacterial pathogens in wastewater effluent in developing country are on the rise,
54
however most studies which have focused on water quality, particularly in South Africa have
focused mostly on drinking or potable water supply with limited reports on treated
wastewater effluent as a source of pathogens (Mackintosh and Colvin, 2003; Obi et al., 2007;
Obi et al., 2008). It is therefore imperative that South African waters be monitored for the
presence of these pathogens in wastewater effluents in the interest of the environment as well
as public health. Some of these microorganisms have displayed high microbial or antibiotic
resistance trends, which can be linked to the increased usage of antimicrobial agents in
multiple industries, thus resulting in the acquisition of resistance (Goni-Urriza et al., 2000;
Huddleston et al., 2006; Vandan et al., 2011). The acquisition of resistance and virulence
genes as well as the adaptation to adverse environmental conditions further aids their ability
to escape conventional treatment processes (Almuzara et al., 2007; Jury et al., 2010). This
project therefore aimed at evaluating the prevalence of Aeromonas spp., Pseudomonas spp.,
Legionella spp., Listeria spp., and Yersinia spp. in the treated effluent from two wastewater
treatment plants in Durban, to determine the possible correlation between the microbial load
and the physico-chemical profiles of the treated effluent and the receiving surface water as
well as characterize the antibiotic resistance profiles and virulence determinants of selected
Listeria and Aeromonas species recovered from these water samples.
55
1.8.1 Hypotheses
It was hypothesized that inadequately treated wastewater effluent is a source of multidrug-
resistant emerging bacterial pathogens in surface waters in Durban and that some of these
emerging bacteria are resistant to commonly used disinfectants and harbour virulence genes.
1.8.2 Objectives
The following objectives were established:
1.8.2.1 To determine the effect of seasonal variability changes on the populations of
emerging bacterial pathogens in the treated wastewater effluent and receiving bodies.
1.8.2.2 To correlate microbial load with physicochemical parameters of the collected water
samples.
1.8.2.3 To characterize virulence markers in selected emerging bacterial pathogens.
1.8.2.4 To establish the antibiotic resistance profiles of selected emerging bacterial pathogen
to the currently used antibiotics.
1.8.3 Aims
1.8.3.1 Enumeration of presumptive population of Aeromonas spp., Pseudomonas spp.,
Legionella spp., Listeria spp., Yersinia spp. in the collected water sample using the
membrane filtration technique and selective media.
1.8.3.2 Determination of physical and chemical profiles of the water samples namely; pH,
temperature, phosphate, nitrate, sulphate, residual chlorine, chemical oxygen demand,
biochemical oxygen demand, turbidity, total dissolved solids and total suspended solids and
electrical conductivity.
56
1.8.3.3 Confirmation of selected emerging bacterial pathogens identity isolated from the
treated wastewater effluent samples and receiving surface waters using standard biochemical
tests and PCR methods.
1.8.3.4 Determination of antimicrobial resistance profiles of selected emerging bacterial
pathogens using the antibiotic Kirby Bauer disk diffusion method.
1.8.3.5 Detection of virulence genes in selected emerging bacterial pathogens using specific
primers
57
CHAPTER TWO
EMERGING BACTERIAL PATHOGEN ENUMERATION AND PHYSICOCHEMICAL ANALYSIS OF TREATED WASTEWATER EFFLUENT
AND THE RECEIVING RIVERS
2.1 Introduction
Water forms a part of the most important resources world-wide, having the ability to directly
or indirectly affect the world’s economy and health status (Obi et al., 2007). Furthermore the
backbone of many life systems, and important for industrial and agricultural processes,
including multiple domestic uses and basic water functions (Hu, 2009). South Africa being a
developing country, still struggles with meeting the basic water needs of its people. Many
poor and rural communities still tend to rely more on river water for many of their water
needs e.g. drinking, cooking, washing and recreational purposes (Odjadjare and Okoh, 2010).
Therefore the state and quality of available water sources is of importance world-wide.
This has been demonstrated by the constant government efforts to better improve the
provision and distribution of water that is of acceptable quality and environmental standard.
Thus, working towards the improvement of wastewater treatment which greatly impacts the
surrounding water milieus in both rural and urban communities is a priority (DWAF, 2003).
However most of the wastewater treatment plants in South Africa do not meet the expected
standards, which is monitored and regulated via the green drop certification programme being
implemented by the Department of Water Affairs.
The inadequate treatment of wastes has a negative impact on natural water sources, which are
the common receiving water bodies of treated effluent, as well as on the surrounding
ecosystems and human population by altering chemical and physical properties of the
58
affected water. Chemical and biochemical interactions in these natural water systems can be
influenced by both physical and chemical parameters such as pH, temperature, salinity
electrical conductivity and nutrient load of the treated effluent (Igbinosa and Okoh, 2009).
Wastewater effluent has been reported to contain a plethora of pathogenic microorganisms
and chemical compounds some of which have been proven to pose serious threats to the
surrounding environment as well as other biological systems dependant on this water,
affecting biodiversity, human health and other aquatic dependant businesses such as the fish
industry. Such contaminants include emerging bacterial pathogens which have been a threat
to both animal and human survival over the past decades. Bacterial pathogens have also
become more resistant to disinfectants and other antimicrobial agents when compared to
coliform microorganisms which are commonly used as the indicators (fecal coliforms, total
coliforms and enterococci) (Eze et al., 2009). This also implies that even in the absence of
coliform indicators, emerging bacterial pathogens are still present in their numbers. Their
presence in the absence of indicators is common and in most cases are even found
dominating drinking water systems (Eze et al., 2009; Toze, 1997). Microbial pathogens such
as Aeromonas, Pseudomonas, Listeria, Yersinia and Legionella with disease causing abilities
have been reported in multiple cases. Some of these microorganisms have very high mortality
rates and therefore are of a major threat if ignored or untreated, as most of them have been
classified as opportunistic pathogens (Metcalf and Eddy, 2003; Rollins et al., 2003). This is
of grave concern in South Africa, a country with a high number of HIV/AIDS pandemic,
coupled with a high level of drug and alcohol abuse, which has led to many people being
immune-compromised.
South Africa currently has no set guidelines for emerging bacterial pathogens (Bartie et al.,
2002), and their presence in the discharged wastewater effluent cannot be monitored (Bartie
59
et al., 2002). These pathogens have been implicated in a wide range of disease outbreaks
which may result in death if ignored or untreated e.g. Yersinia causes septicaemia and
pneumonia resulting in 100% mortality if untreated (Rollin et al., 2003). Although a
considerable number of studies have been carried out on various pathogens isolated from
wastewater effluents in South Africa, there exist little or no current reports in literature on the
prevalence of Aeromonas, Pseudomonas, Listeria Yersinia and Legionella species isolated
from wastewater effluents and the surrounding water bodies. This chapter aims at evaluating
the prevalence of Aeromonas spp., Pseudomonas spp., Legionella spp., Listeria spp., and
Yersinia spp. in the treated effluent samples and receiving waterbodies in Durban, to
determine the effect of seasonal variability changes on the populations of emerging bacterial
pathogens in the treated wastewater effluent and receiving bodies, and to correlate microbial
loads/populations with physicochemical parameters of the collected water samples.
2.2 Materials and methods
2.2.1 Description of study site
Wastewater and river samples were collected from two different wastewater treatment plants
located in the Durban area, namely: Northern Wastewater Treatment Works (NWTW) and
New Germany Wastewater Treatment Works (NGWTW) (Figure 2.1). The NWTW is
situated in the centre of industrial factories and residential areas and receives sewage
containing both industrial and domestic wastes. The plant is situated very close to the
Umgeni River into which it discharges its effluent. The river is surrounded by informal
settlement communities which are dependent on the river water for recreation purposes,
washing, bathing, cooking and drinking. The New Germany Sewage Plant processes about
90% of industrial waste in their final wastewater and the remaining is predominantly
domestic wastes (Olaniran et al., 2005). It is surrounded by industrial factories processing
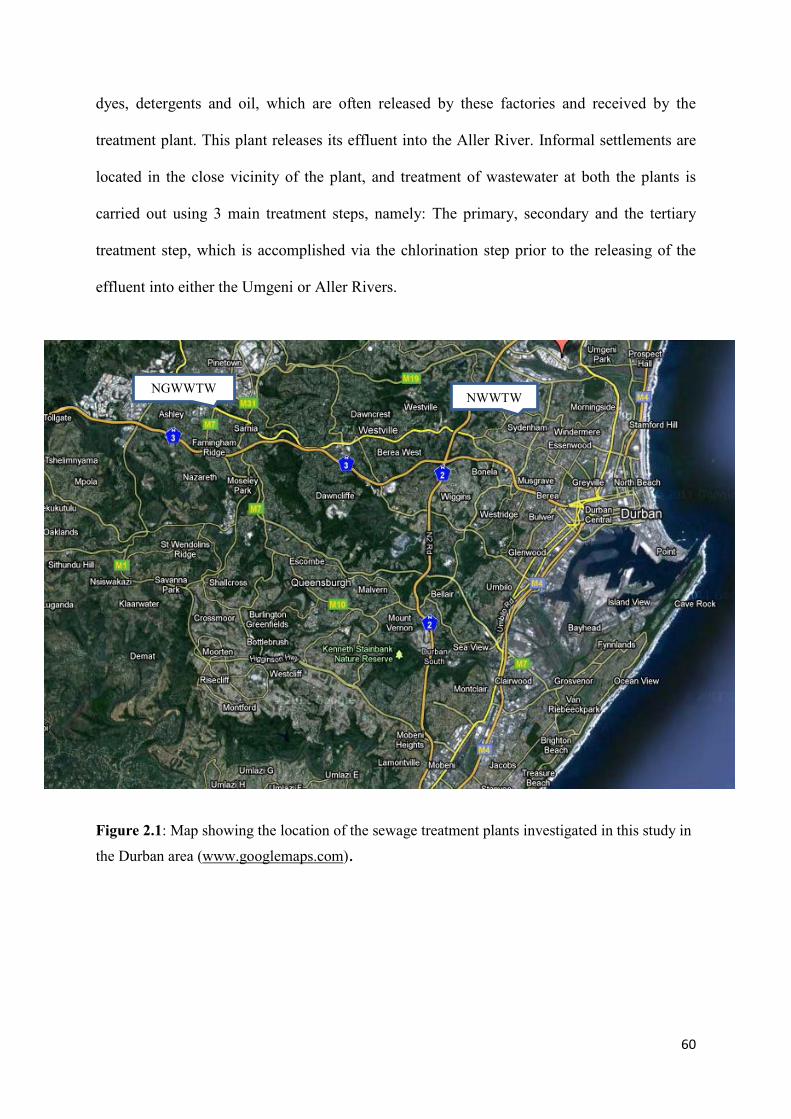
60
dyes, detergents and oil, which are often released by these factories and received by the
treatment plant. This plant releases its effluent into the Aller River. Informal settlements are
located in the close vicinity of the plant, and treatment of wastewater at both the plants is
carried out using 3 main treatment steps, namely: The primary, secondary and the tertiary
treatment step, which is accomplished via the chlorination step prior to the releasing of the
effluent into either the Umgeni or Aller Rivers.
Figure 2.1: Map showing the location of the sewage treatment plants investigated in this study in
the Durban area (www.googlemaps.com).
NWWTW NGWWTW
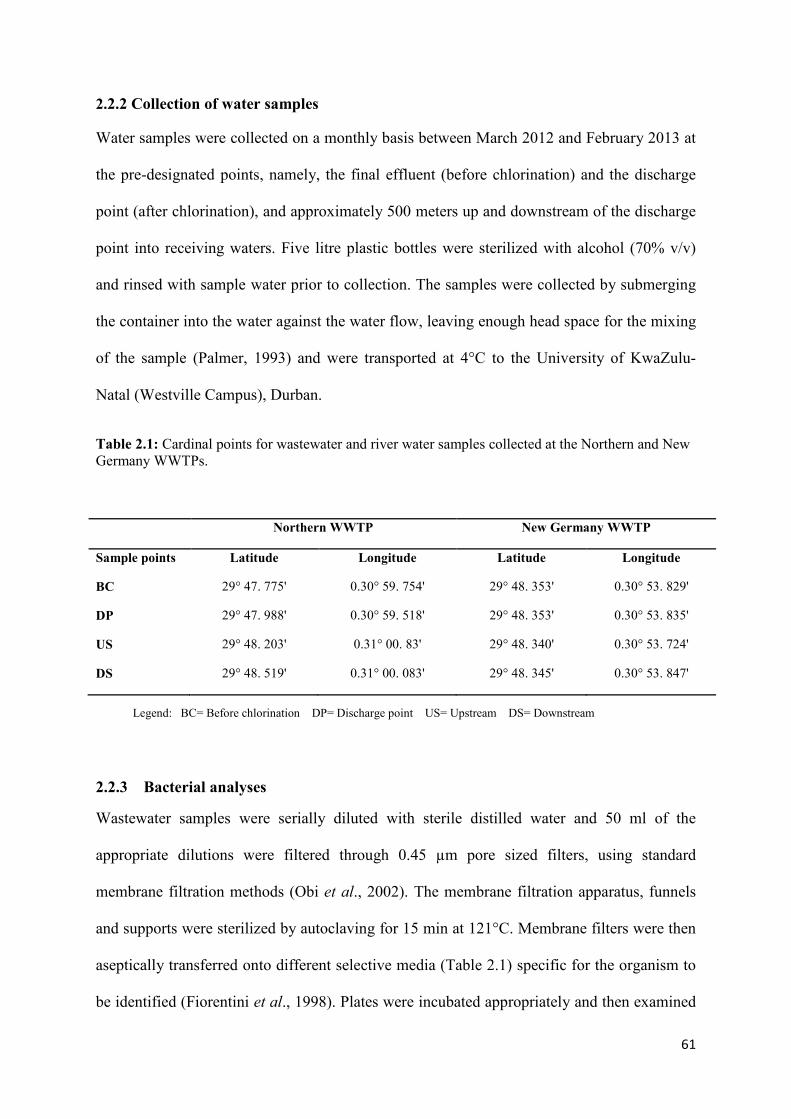
61
2.2.2 Collection of water samples
Water samples were collected on a monthly basis between March 2012 and February 2013 at
the pre-designated points, namely, the final effluent (before chlorination) and the discharge
point (after chlorination), and approximately 500 meters up and downstream of the discharge
point into receiving waters. Five litre plastic bottles were sterilized with alcohol (70% v/v)
and rinsed with sample water prior to collection. The samples were collected by submerging
the container into the water against the water flow, leaving enough head space for the mixing
of the sample (Palmer, 1993) and were transported at 4°C to the University of KwaZulu-
Natal (Westville Campus), Durban.
Table 2.1: Cardinal points for wastewater and river water samples collected at the Northern and New Germany WWTPs.
Northern WWTP New Germany WWTP
Sample points Latitude Longitude Latitude Longitude
BC 29° 47. 775' 0.30° 59. 754' 29° 48. 353' 0.30° 53. 829'
DP 29° 47. 988' 0.30° 59. 518' 29° 48. 353' 0.30° 53. 835'
US 29° 48. 203' 0.31° 00. 83' 29° 48. 340' 0.30° 53. 724'
DS 29° 48. 519' 0.31° 00. 083' 29° 48. 345' 0.30° 53. 847'
2.2.3 Bacterial analyses
Wastewater samples were serially diluted with sterile distilled water and 50 ml of the
appropriate dilutions were filtered through 0.45 µm pore sized filters, using standard
membrane filtration methods (Obi et al., 2002). The membrane filtration apparatus, funnels
and supports were sterilized by autoclaving for 15 min at 121°C. Membrane filters were then
aseptically transferred onto different selective media (Table 2.1) specific for the organism to
be identified (Fiorentini et al., 1998). Plates were incubated appropriately and then examined
Legend: BC= Before chlorination DP= Discharge point US= Upstream DS= Downstream
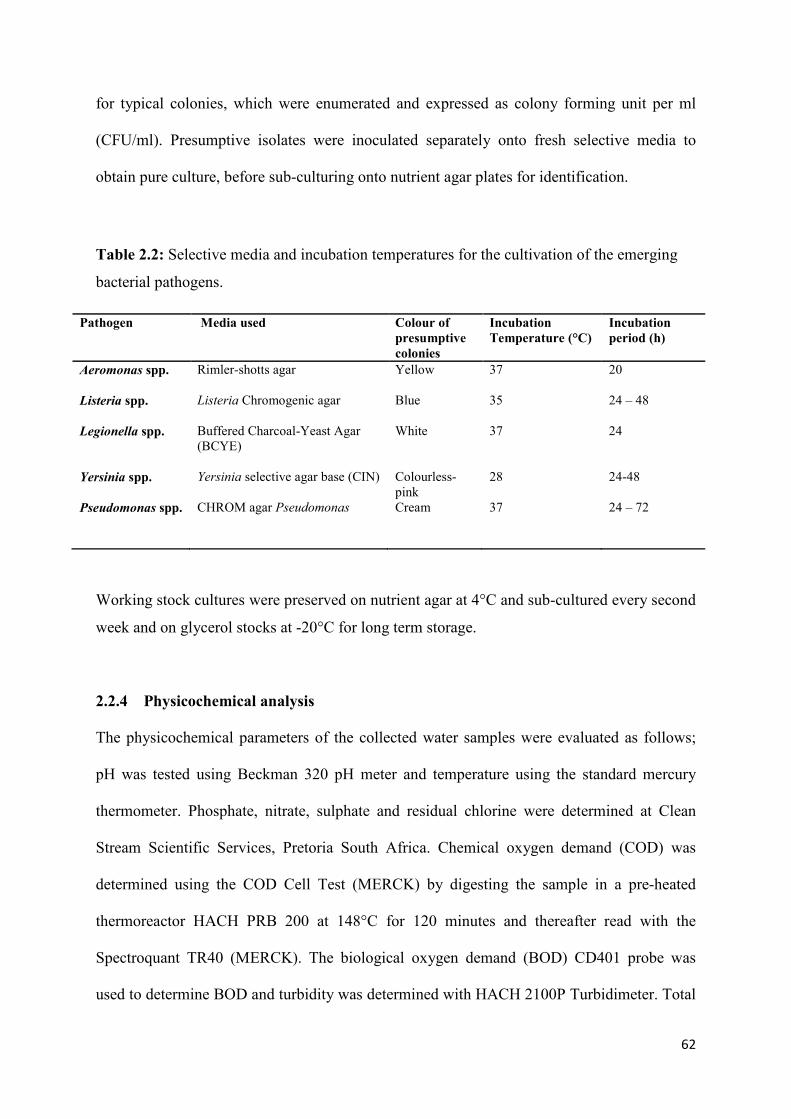
62
for typical colonies, which were enumerated and expressed as colony forming unit per ml
(CFU/ml). Presumptive isolates were inoculated separately onto fresh selective media to
obtain pure culture, before sub-culturing onto nutrient agar plates for identification.
Table 2.2: Selective media and incubation temperatures for the cultivation of the emerging
bacterial pathogens.
Pathogen Media used Colour of presumptive colonies
Incubation Temperature (°C)
Incubation period (h)
Aeromonas spp.
Rimler-shotts agar Yellow 37
20
Listeria spp.
Listeria Chromogenic agar Blue 35 24 – 48
Legionella spp.
Buffered Charcoal-Yeast Agar (BCYE)
White 37 24
Yersinia spp.
Yersinia selective agar base (CIN) Colourless- pink
28 24-48
Pseudomonas spp.
CHROM agar Pseudomonas
Cream 37 24 – 72
Working stock cultures were preserved on nutrient agar at 4°C and sub-cultured every second
week and on glycerol stocks at -20°C for long term storage.
2.2.4 Physicochemical analysis
The physicochemical parameters of the collected water samples were evaluated as follows;
pH was tested using Beckman 320 pH meter and temperature using the standard mercury
thermometer. Phosphate, nitrate, sulphate and residual chlorine were determined at Clean
Stream Scientific Services, Pretoria South Africa. Chemical oxygen demand (COD) was
determined using the COD Cell Test (MERCK) by digesting the sample in a pre-heated
thermoreactor HACH PRB 200 at 148°C for 120 minutes and thereafter read with the
Spectroquant TR40 (MERCK). The biological oxygen demand (BOD) CD401 probe was
used to determine BOD and turbidity was determined with HACH 2100P Turbidimeter. Total
63
dissolved solids, total suspended solids, and electrical conductivity were determined using
HACH HQ40d Portable Meter, using the CDC401 PROBE.
2.3 Results
2.3.1 Bacterial analysis of wastewater effluent and receiving surface waters
During the 12 months sampling period (March 2012- February 2013), all the emerging
bacterial pathogens investigated, namely: Aeromonas, Pseudomonas, Listeria, Yersinia and
Legionella spp. were recovered from the four sampling points of the wastewater treatment
plants.. The discharge and downstream points at the New Germany wastewater treatment
plant had no Listeria species recovered for 8 of the 12 months samplingperiod (Table 2.4),
with the months of March, June, July and December displaying counts for all sampling
points. Different bacterial and seasonal trends were observed for both wastewater treatment
plants, with each plant displaying varying results per tested organism. Of the five tested
organisms, Legionella and Yersinia spp. were mostly recovered at higher concentration for
both treatment plants, displaying similar patterns of microbial loads at the different sampling
points. Aeromonas and Pseudomonas spp. also displayed similar recovery trends, while
Listeria spp. were present at much lower concentrations at both plants.
At the NWWTP, Aeromonas spp. populations were obtained at higher populations before
chlorination between the spring and summer months, with a presumptive population of
231000 x 103 CFU/ml recorded in December. Lower counts were observed during the autumn
and winter seasons, with counts as low as 4.54 x 10³ CFU/ml observed in January. Over the
12 months sampling period, bacterial populations (CFU/ml x 103) ranged between 4.42 –
23100, 0.53 –329000, 0.01 – 1470, 20.60 – 140000, and 40.13 – 95000 for Aeromonas,
64
Pseudomonas, Listeria, Yersinia and Legionella spp. respectively. Four out of the five tested
bacteria were recovered at lowest concentrations in January and the highest concentrations
observed in December for Aeromonas and Yersinia spp., September for Pseudomonas spp.
and June for Legionella species. Listeria spp. counts at NWWTP were recovered at much
lower concentrations when compared to the other microorganisms, with the highest counts
recovered during the winter season.
The results obtained before and after tertiary treatment, allowed for the evaluation of the
effectiveness of tertiary treatment for the removal of the emerging bacterial pathogens. The
NWWTP displayed low reduction levels for the investigated bacteria for most of the
sampling period, with an increase in populations observed in some months after chlorination.
Percentage bacterial reduction varied between 19.5 – 99.9, 23.3 – 99.9, 8.2 – 99, 29.1 – 99.9,
and 2.4 – 99 for Aeromonas spp., Pseudomonas spp., Listeria spp., Yersinia spp. and
Legionella spp. respectively (Table 2.3).
The microbial counts obtained at the NGWWTP (Table 2.4) displayed a similar pattern to that
observed at NWWTP and a relationship could be established between most of the tested
organisms. The same trend was observed for most of the microbial populations, if a
population increase or decrease was observed in one, the same would hold for the rest of the
tested organisms. A positive correlation was observed mostly for Aeromonas, Pseudomonas,
Yersinia and Legionella displaying significance levels with P-values < 0.01.
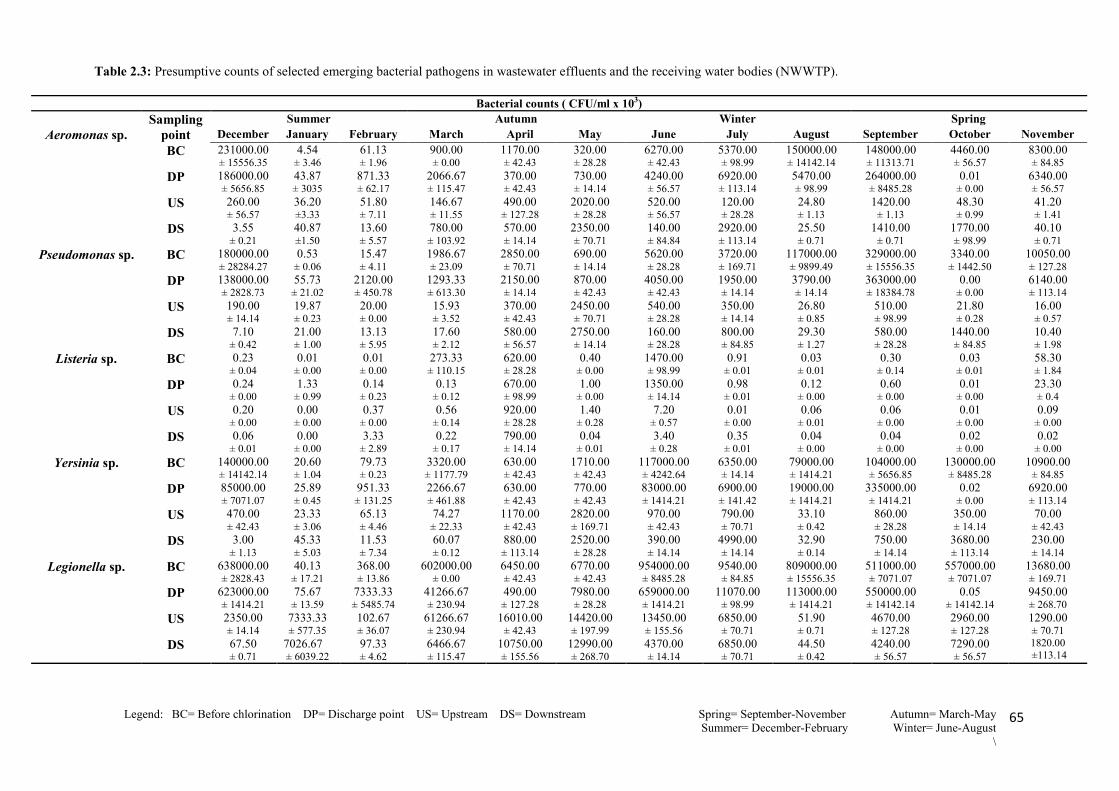
65
Table 2.3: Presumptive counts of selected emerging bacterial pathogens in wastewater effluents and the receiving water bodies (NWWTP).
Bacterial counts ( CFU/ml x 103) Sampling
point Summer Autumn Winter Spring
Aeromonas sp. December January February March April May June July August September October November BC 231000.00
± 15556.35 4.54
± 3.46 61.13 ± 1.96
900.00 ± 0.00
1170.00 ± 42.43
320.00 ± 28.28
6270.00 ± 42.43
5370.00 ± 98.99
150000.00 ± 14142.14
148000.00 ± 11313.71
4460.00 ± 56.57
8300.00 ± 84.85
DP 186000.00 ± 5656.85
43.87 ± 3035
871.33 ± 62.17
2066.67 ± 115.47
370.00 ± 42.43
730.00 ± 14.14
4240.00 ± 56.57
6920.00 ± 113.14
5470.00 ± 98.99
264000.00 ± 8485.28
0.01 ± 0.00
6340.00 ± 56.57
US 260.00 ± 56.57
36.20 ±3.33
51.80 ± 7.11
146.67 ± 11.55
490.00 ± 127.28
2020.00 ± 28.28
520.00 ± 56.57
120.00 ± 28.28
24.80 ± 1.13
1420.00 ± 1.13
48.30 ± 0.99
41.20 ± 1.41
DS 3.55 ± 0.21
40.87 ±1.50
13.60 ± 5.57
780.00 ± 103.92
570.00 ± 14.14
2350.00 ± 70.71
140.00 ± 84.84
2920.00 ± 113.14
25.50 ± 0.71
1410.00 ± 0.71
1770.00 ± 98.99
40.10 ± 0.71
Pseudomonas sp. BC 180000.00 ± 28284.27
0.53 ± 0.06
15.47 ± 4.11
1986.67 ± 23.09
2850.00 ± 70.71
690.00 ± 14.14
5620.00 ± 28.28
3720.00 ± 169.71
117000.00 ± 9899.49
329000.00 ± 15556.35
3340.00 ± 1442.50
10050.00 ± 127.28
DP 138000.00 ± 2828.73
55.73 ± 21.02
2120.00 ± 450.78
1293.33 ± 613.30
2150.00 ± 14.14
870.00 ± 42.43
4050.00 ± 42.43
1950.00 ± 14.14
3790.00 ± 14.14
363000.00 ± 18384.78
0.00 ± 0.00
6140.00 ± 113.14
US 190.00 ± 14.14
19.87 ± 0.23
20.00 ± 0.00
15.93 ± 3.52
370.00 ± 42.43
2450.00 ± 70.71
540.00 ± 28.28
350.00 ± 14.14
26.80 ± 0.85
510.00 ± 98.99
21.80 ± 0.28
16.00 ± 0.57
DS 7.10 ± 0.42
21.00 ± 1.00
13.13 ± 5.95
17.60 ± 2.12
580.00 ± 56.57
2750.00 ± 14.14
160.00 ± 28.28
800.00 ± 84.85
29.30 ± 1.27
580.00 ± 28.28
1440.00 ± 84.85
10.40 ± 1.98
Listeria sp. BC 0.23 ± 0.04
0.01 ± 0.00
0.01 ± 0.00
273.33 ± 110.15
620.00 ± 28.28
0.40 ± 0.00
1470.00 ± 98.99
0.91 ± 0.01
0.03 ± 0.01
0.30 ± 0.14
0.03 ± 0.01
58.30 ± 1.84
DP 0.24 ± 0.00
1.33 ± 0.99
0.14 ± 0.23
0.13 ± 0.12
670.00 ± 98.99
1.00 ± 0.00
1350.00 ± 14.14
0.98 ± 0.01
0.12 ± 0.00
0.60 ± 0.00
0.01 ± 0.00
23.30 ± 0.4
US 0.20 ± 0.00
0.00 ± 0.00
0.37 ± 0.00
0.56 ± 0.14
920.00 ± 28.28
1.40 ± 0.28
7.20 ± 0.57
0.01 ± 0.00
0.06 ± 0.01
0.06 ± 0.00
0.01 ± 0.00
0.09 ± 0.00
DS 0.06 ± 0.01
0.00 ± 0.00
3.33 ± 2.89
0.22 ± 0.17
790.00 ± 14.14
0.04 ± 0.01
3.40 ± 0.28
0.35 ± 0.01
0.04 ± 0.00
0.04 ± 0.00
0.02 ± 0.00
0.02 ± 0.00
Yersinia sp. BC 140000.00 ± 14142.14
20.60 ± 1.04
79.73 ± 0.23
3320.00 ± 1177.79
630.00 ± 42.43
1710.00 ± 42.43
117000.00 ± 4242.64
6350.00 ± 14.14
79000.00 ± 1414.21
104000.00 ± 5656.85
130000.00 ± 8485.28
10900.00 ± 84.85
DP 85000.00 ± 7071.07
25.89 ± 0.45
951.33 ± 131.25
2266.67 ± 461.88
630.00 ± 42.43
770.00 ± 42.43
83000.00 ± 1414.21
6900.00 ± 141.42
19000.00 ± 1414.21
335000.00 ± 1414.21
0.02 ± 0.00
6920.00 ± 113.14
US 470.00 ± 42.43
23.33 ± 3.06
65.13 ± 4.46
74.27 ± 22.33
1170.00 ± 42.43
2820.00 ± 169.71
970.00 ± 42.43
790.00 ± 70.71
33.10 ± 0.42
860.00 ± 28.28
350.00 ± 14.14
70.00 ± 42.43
DS 3.00 ± 1.13
45.33 ± 5.03
11.53 ± 7.34
60.07 ± 0.12
880.00 ± 113.14
2520.00 ± 28.28
390.00 ± 14.14
4990.00 ± 14.14
32.90 ± 0.14
750.00 ± 14.14
3680.00 ± 113.14
230.00 ± 14.14
Legionella sp. BC 638000.00 ± 2828.43
40.13 ± 17.21
368.00 ± 13.86
602000.00 ± 0.00
6450.00 ± 42.43
6770.00 ± 42.43
954000.00 ± 8485.28
9540.00 ± 84.85
809000.00 ± 15556.35
511000.00 ± 7071.07
557000.00 ± 7071.07
13680.00 ± 169.71
DP 623000.00 ± 1414.21
75.67 ± 13.59
7333.33 ± 5485.74
41266.67 ± 230.94
490.00 ± 127.28
7980.00 ± 28.28
659000.00 ± 1414.21
11070.00 ± 98.99
113000.00 ± 1414.21
550000.00 ± 14142.14
0.05 ± 14142.14
9450.00 ± 268.70
US 2350.00 ± 14.14
7333.33 ± 577.35
102.67 ± 36.07
61266.67 ± 230.94
16010.00 ± 42.43
14420.00 ± 197.99
13450.00 ± 155.56
6850.00 ± 70.71
51.90 ± 0.71
4670.00 ± 127.28
2960.00 ± 127.28
1290.00 ± 70.71
DS 67.50 ± 0.71
7026.67 ± 6039.22
97.33 ± 4.62
6466.67 ± 115.47
10750.00 ± 155.56
12990.00 ± 268.70
4370.00 ± 14.14
6850.00 ± 70.71
44.50 ± 0.42
4240.00 ± 56.57
7290.00 ± 56.57
1820.00 ±113.14
Legend: BC= Before chlorination DP= Discharge point US= Upstream DS= Downstream Spring= September-November Autumn= March-May Summer= December-February Winter= June-August
\
66
Over the sampling period, bacterial populations (CFU/ml x 103) in treated effluent samples
before the chlorination step ranged between 17 – 9613.3, 19.2 –8820, 0.01 – 331, 70 – 11480,
and 258 – 46600 for Aeromonas, Pseudomonas, Listeria, Yersinia and Legionella spp.
respectively. The lowest concentrations recovered for Aeromonas, Pseudomonas, Yersinia
and Legionella were recorded in October while the highest concentrations were observed in
June. Similar to NWWTP, Listeria spp. counts at NGWWTP were at much lower
concentrations compared to the other microorganisms, with the highest Listeria counts
obtained during the winter season. Emerging bacterial pathogens were also recovered at the
receiving water bodies throughout the sampling period. Counts obtained upstream of the
receiving river were notably higher than any of the counts obtained at other points of
sampling. Of the four samples, those collected at the discharge point and downstream of the
receiving river had the lowest bacterial counts, in most cases during the sampling period.
Bacterial reduction at the NGWWTP after chlorination was considerably high, reaching
reduction levels as high as 100% for Listeria and 99.9% for the other four emerging bacterial
pathogens tested (Table 2.4). The month of May displayed very poor reduction of all tested
microorganisms, with a few other cases displaying the failure to reduce or preferably
eliminate the tested organisms after chlorination.
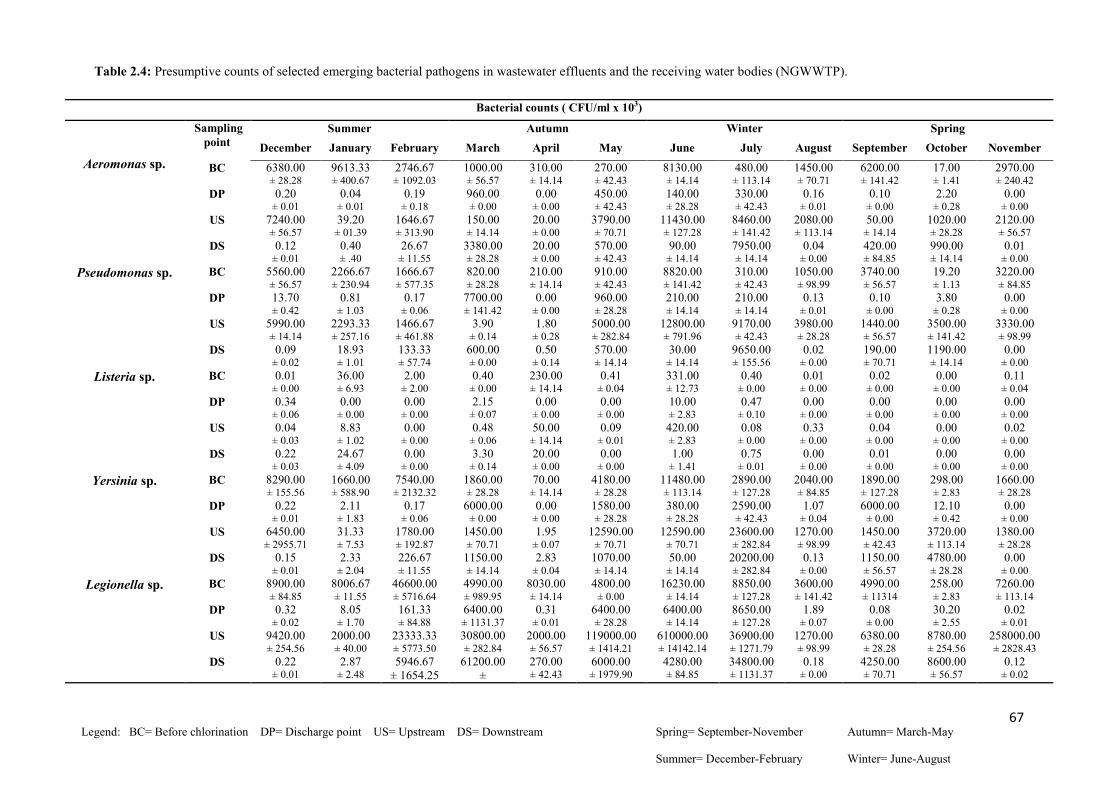
67
Table 2.4: Presumptive counts of selected emerging bacterial pathogens in wastewater effluents and the receiving water bodies (NGWWTP).
Bacterial counts ( CFU/ml x 103)
Sampling point
Summer Autumn Winter Spring
Aeromonas sp.
December January February March April May June July August September October November
BC 6380.00 ± 28.28
9613.33 ± 400.67
2746.67 ± 1092.03
1000.00 ± 56.57
310.00 ± 14.14
270.00 ± 42.43
8130.00 ± 14.14
480.00 ± 113.14
1450.00 ± 70.71
6200.00 ± 141.42
17.00 ± 1.41
2970.00 ± 240.42
DP 0.20 ± 0.01
0.04 ± 0.01
0.19 ± 0.18
960.00 ± 0.00
0.00 ± 0.00
450.00 ± 42.43
140.00 ± 28.28
330.00 ± 42.43
0.16 ± 0.01
0.10 ± 0.00
2.20 ± 0.28
0.00 ± 0.00
US 7240.00 ± 56.57
39.20 ± 01.39
1646.67 ± 313.90
150.00 ± 14.14
20.00 ± 0.00
3790.00 ± 70.71
11430.00 ± 127.28
8460.00 ± 141.42
2080.00 ± 113.14
50.00 ± 14.14
1020.00 ± 28.28
2120.00 ± 56.57
DS 0.12 ± 0.01
0.40 ± .40
26.67 ± 11.55
3380.00 ± 28.28
20.00 ± 0.00
570.00 ± 42.43
90.00 ± 14.14
7950.00 ± 14.14
0.04 ± 0.00
420.00 ± 84.85
990.00 ± 14.14
0.01 ± 0.00
Pseudomonas sp. BC 5560.00 ± 56.57
2266.67 ± 230.94
1666.67 ± 577.35
820.00 ± 28.28
210.00 ± 14.14
910.00 ± 42.43
8820.00 ± 141.42
310.00 ± 42.43
1050.00 ± 98.99
3740.00 ± 56.57
19.20 ± 1.13
3220.00 ± 84.85
DP 13.70 ± 0.42
0.81 ± 1.03
0.17 ± 0.06
7700.00 ± 141.42
0.00 ± 0.00
960.00 ± 28.28
210.00 ± 14.14
210.00 ± 14.14
0.13 ± 0.01
0.10 ± 0.00
3.80 ± 0.28
0.00 ± 0.00
US 5990.00 ± 14.14
2293.33 ± 257.16
1466.67 ± 461.88
3.90 ± 0.14
1.80 ± 0.28
5000.00 ± 282.84
12800.00 ± 791.96
9170.00 ± 42.43
3980.00 ± 28.28
1440.00 ± 56.57
3500.00 ± 141.42
3330.00 ± 98.99
DS 0.09 ± 0.02
18.93 ± 1.01
133.33 ± 57.74
600.00 ± 0.00
0.50 ± 0.14
570.00 ± 14.14
30.00 ± 14.14
9650.00 ± 155.56
0.02 ± 0.00
190.00 ± 70.71
1190.00 ± 14.14
0.00 ± 0.00
Listeria sp. BC 0.01 ± 0.00
36.00 ± 6.93
2.00 ± 2.00
0.40 ± 0.00
230.00 ± 14.14
0.41 ± 0.04
331.00 ± 12.73
0.40 ± 0.00
0.01 ± 0.00
0.02 ± 0.00
0.00 ± 0.00
0.11 ± 0.04
DP 0.34 ± 0.06
0.00 ± 0.00
0.00 ± 0.00
2.15 ± 0.07
0.00 ± 0.00
0.00 ± 0.00
10.00 ± 2.83
0.47 ± 0.10
0.00 ± 0.00
0.00 ± 0.00
0.00 ± 0.00
0.00 ± 0.00
US 0.04 ± 0.03
8.83 ± 1.02
0.00 ± 0.00
0.48 ± 0.06
50.00 ± 14.14
0.09 ± 0.01
420.00 ± 2.83
0.08 ± 0.00
0.33 ± 0.00
0.04 ± 0.00
0.00 ± 0.00
0.02 ± 0.00
DS 0.22 ± 0.03
24.67 ± 4.09
0.00 ± 0.00
3.30 ± 0.14
20.00 ± 0.00
0.00 ± 0.00
1.00 ± 1.41
0.75 ± 0.01
0.00 ± 0.00
0.01 ± 0.00
0.00 ± 0.00
0.00 ± 0.00
Yersinia sp. BC 8290.00 ± 155.56
1660.00 ± 588.90
7540.00 ± 2132.32
1860.00 ± 28.28
70.00 ± 14.14
4180.00 ± 28.28
11480.00 ± 113.14
2890.00 ± 127.28
2040.00 ± 84.85
1890.00 ± 127.28
298.00 ± 2.83
1660.00 ± 28.28
DP 0.22 ± 0.01
2.11 ± 1.83
0.17 ± 0.06
6000.00 ± 0.00
0.00 ± 0.00
1580.00 ± 28.28
380.00 ± 28.28
2590.00 ± 42.43
1.07 ± 0.04
6000.00 ± 0.00
12.10 ± 0.42
0.00 ± 0.00
US 6450.00 ± 2955.71
31.33 ± 7.53
1780.00 ± 192.87
1450.00 ± 70.71
1.95 ± 0.07
12590.00 ± 70.71
12590.00 ± 70.71
23600.00 ± 282.84
1270.00 ± 98.99
1450.00 ± 42.43
3720.00 ± 113.14
1380.00 ± 28.28
DS 0.15 ± 0.01
2.33 ± 2.04
226.67 ± 11.55
1150.00 ± 14.14
2.83 ± 0.04
1070.00 ± 14.14
50.00 ± 14.14
20200.00 ± 282.84
0.13 ± 0.00
1150.00 ± 56.57
4780.00 ± 28.28
0.00 ± 0.00
Legionella sp. BC 8900.00 ± 84.85
8006.67 ± 11.55
46600.00 ± 5716.64
4990.00 ± 989.95
8030.00 ± 14.14
4800.00 ± 0.00
16230.00 ± 14.14
8850.00 ± 127.28
3600.00 ± 141.42
4990.00 ± 11314
258.00 ± 2.83
7260.00 ± 113.14
DP 0.32 ± 0.02
8.05 ± 1.70
161.33 ± 84.88
6400.00 ± 1131.37
0.31 ± 0.01
6400.00 ± 28.28
6400.00 ± 14.14
8650.00 ± 127.28
1.89 ± 0.07
0.08 ± 0.00
30.20 ± 2.55
0.02 ± 0.01
US 9420.00 ± 254.56
2000.00 ± 40.00
23333.33 ± 5773.50
30800.00 ± 282.84
2000.00 ± 56.57
119000.00 ± 1414.21
610000.00 ± 14142.14
36900.00 ± 1271.79
1270.00 ± 98.99
6380.00 ± 28.28
8780.00 ± 254.56
258000.00 ± 2828.43
DS 0.22 ± 0.01
2.87 ± 2.48
5946.67 ± 1654.25
61200.00 ±
270.00 ± 42.43
6000.00 ± 1979.90
4280.00 ± 84.85
34800.00 ± 1131.37
0.18 ± 0.00
4250.00 ± 70.71
8600.00 ± 56.57
0.12 ± 0.02
Legend: BC= Before chlorination DP= Discharge point US= Upstream DS= Downstream Spring= September-November Autumn= March-May
Summer= December-February Winter= June-August
68
2.3.2 Physico-chemical parameters of the collected water samples
The physico-chemical parameters observed at the Northern wastewater treatment plant over
the 12 month sampling period are shown in Table 2.5. The temperature and pH readings
ranged between 12 – 27 °C and 6.41 – 7.88 respectively. For these parameters, the lowest
readings were observed in September and the highest in February. There was no significant
change in temperature readings across the sampling points for each month. Dissolved oxygen
(DO), biochemical oxygen demand (BOD), chemical oxygen demand (COD) and total
dissolved solids (TDS) ranged between 4.01 – 7.66, 1.40 – 9.61, <10 – 309.06, 200.03 –
710.00 mg/L respectively. Turbidity and total suspended solids readings ranged between 6.48
– 71.02 NTU and 0.01 – 5.93 respectively. Higher DO readings were noted more commonly
at the discharge point than before chlorination point in March, May, October and November.
A similar trend was noted for BOD, except for November when a higher reading was
obtained before chlorination. Residual chlorine reading ranged broadly between 20.40 –
1090.00 mg/l, with higher concentrations observed in autumn and winter and lower in spring
and summer. No notable trend was observed for the rest of the parameters determined.
Temperature and pH readings at the NGWWTP (Table 2.6) ranged between 12 – 26 °C and
6.34 – 8.08 respectively. The lower readings were observed during winter and spring; with
values obtained upstream and downstream of the receiving Aller River samples commonly
lower than those in samples collected before and after chlorination. DO, BOD, COD and
TDS readings ranged between 7.07 – 8.69, 2.20 – 11.04, 24.33 – 313.61, 153.07 – 567.33
mg/L respectively. DO and BOD readings were higher at the discharge point (after
chlorination) than before chlorination as well as higher upstream than in the downstream
samples. The residual chlorine readings ranged between 22.31 – 677.37 mg/L throughout the
sampling period, with the month of June displaying higher readings than usual. No notable
trend was observed for the remainder of the physico-chemical parameters.
69
The correlations among the physicochemical and/or bacterial parameters were studied and
results are presented in Tables 2.7 - 2.14. The correlation matrices obtained for NWWTP,
before chlorination (Table 2.7) revealed a strong positive correlation between COD and the
presumptive populations of Aeromonas, Yersinia and Legionella (p<0.01), followed by
Pseudomonas and Listeria (p<0.05). Turbidity values also displayed a positive correlation
with Yersinia and Legionella spp. populations. A positive correlation was observed between
COD and all the tested organisms, however a stronger correlation was formed between
Aeromonas and Yersina spp. (p<0.01) compared to the other organisms (p<0.05) obtained at
the discharge point (Table 2.8). Results of samples obtained from this point also displayed a
significant positive correlation between turbidity, TSS and Legionella spp. populations
(p<0.05). Total suspended solids also showed significant positive correlation with the BOD
readings. Tables 2.9 and 2.10 display the correlation results obtained for the upstream and
downstream samples. A significant negative correlation (p<0.05) was observed between
temperature readings and all the tested microorganisms, at both the sampling points. Most of
the physico-chemical correlations were insignificant, while those which showed some level
of correlation, such as BOD and COD displayed a negative one.
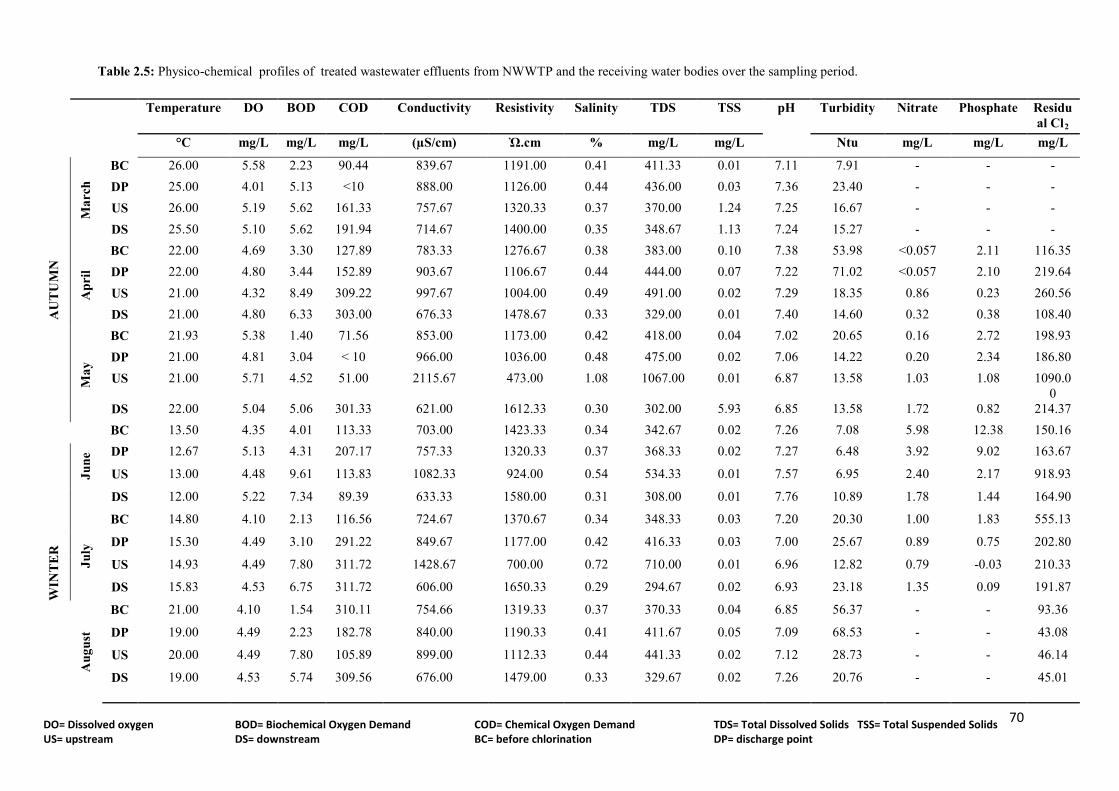
70
Table 2.5: Physico-chemical profiles of treated wastewater effluents from NWWTP and the receiving water bodies over the sampling period.
Temperature DO BOD COD Conductivity Resistivity Salinity TDS TSS pH Turbidity Nitrate Phosphate Residual Cl2
°C mg/L mg/L mg/L (µS/cm) Ὠ.cm % mg/L mg/L Ntu mg/L mg/L mg/L
AU
TU
MN
Mar
ch
BC 26.00 5.58 2.23 90.44 839.67 1191.00 0.41 411.33 0.01 7.11 7.91 - - - DP 25.00 4.01 5.13 <10 888.00 1126.00 0.44 436.00 0.03 7.36 23.40 - - - US 26.00 5.19 5.62 161.33 757.67 1320.33 0.37 370.00 1.24 7.25 16.67 - - - DS 25.50 5.10 5.62 191.94 714.67 1400.00 0.35 348.67 1.13 7.24 15.27 - - -
Apr
il
BC 22.00 4.69 3.30 127.89 783.33 1276.67 0.38 383.00 0.10 7.38 53.98 <0.057 2.11 116.35 DP 22.00 4.80 3.44 152.89 903.67 1106.67 0.44 444.00 0.07 7.22 71.02 <0.057 2.10 219.64 US 21.00 4.32 8.49 309.22 997.67 1004.00 0.49 491.00 0.02 7.29 18.35 0.86 0.23 260.56 DS 21.00 4.80 6.33 303.00 676.33 1478.67 0.33 329.00 0.01 7.40 14.60 0.32 0.38 108.40
May
BC 21.93 5.38 1.40 71.56 853.00 1173.00 0.42 418.00 0.04 7.02 20.65 0.16 2.72 198.93 DP 21.00 4.81 3.04 < 10 966.00 1036.00 0.48 475.00 0.02 7.06 14.22 0.20 2.34 186.80 US 21.00 5.71 4.52 51.00 2115.67 473.00 1.08 1067.00 0.01 6.87 13.58 1.03 1.08 1090.0
0 DS 22.00 5.04 5.06 301.33 621.00 1612.33 0.30 302.00 5.93 6.85 13.58 1.72 0.82 214.37
June
BC 13.50 4.35 4.01 113.33 703.00 1423.33 0.34 342.67 0.02 7.26 7.08 5.98 12.38 150.16
WIN
TE
R
DP 12.67 5.13 4.31 207.17 757.33 1320.33 0.37 368.33 0.02 7.27 6.48 3.92 9.02 163.67
US 13.00 4.48 9.61 113.83 1082.33 924.00 0.54 534.33 0.01 7.57 6.95 2.40 2.17 918.93
DS 12.00 5.22 7.34 89.39 633.33 1580.00 0.31 308.00 0.01 7.76 10.89 1.78 1.44 164.90
July
BC 14.80 4.10 2.13 116.56 724.67 1370.67 0.34 348.33 0.03 7.20 20.30 1.00 1.83 555.13
DP 15.30 4.49 3.10 291.22 849.67 1177.00 0.42 416.33 0.03 7.00 25.67 0.89 0.75 202.80
US 14.93 4.49 7.80 311.72 1428.67 700.00 0.72 710.00 0.01 6.96 12.82 0.79 -0.03 210.33
DS 15.83 4.53 6.75 311.72 606.00 1650.33 0.29 294.67 0.02 6.93 23.18 1.35 0.09 191.87
Aug
ust
BC 21.00 4.10 1.54 310.11 754.66 1319.33 0.37 370.33 0.04 6.85 56.37 - - 93.36
DP 19.00 4.49 2.23 182.78 840.00 1190.33 0.41 411.67 0.05 7.09 68.53 - - 43.08
US 20.00 4.49 7.80 105.89 899.00 1112.33 0.44 441.33 0.02 7.12 28.73 - - 46.14
DS 19.00 4.53 5.74 309.56 676.00 1479.00 0.33 329.67 0.02 7.26 20.76 - - 45.01
DO= Dissolved oxygen BOD= Biochemical Oxygen Demand COD= Chemical Oxygen Demand TDS= Total Dissolved Solids TSS= Total Suspended Solids US= upstream DS= downstream BC= before chlorination DP= discharge point
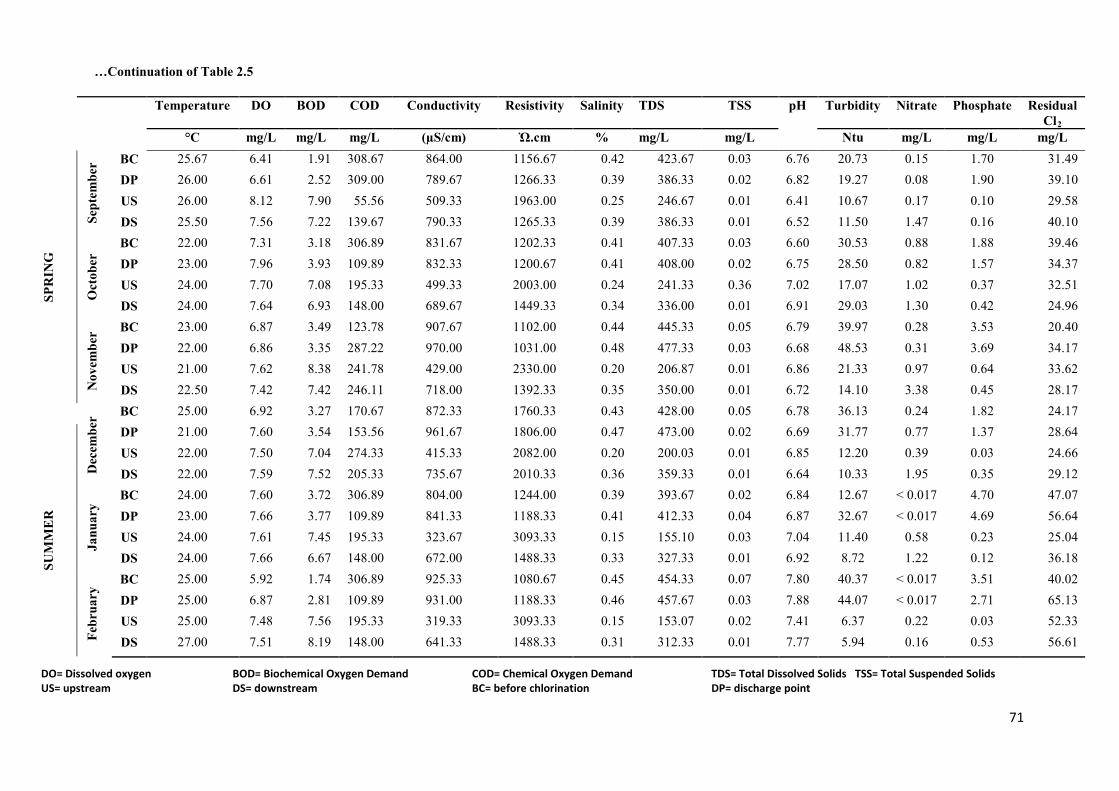
71
…Continuation of Table 2.5
Temperature DO BOD COD Conductivity Resistivity Salinity TDS TSS pH Turbidity Nitrate Phosphate Residual Cl2
°C mg/L mg/L mg/L (µS/cm) Ὠ.cm % mg/L mg/L Ntu mg/L mg/L mg/L
SPR
ING
Sept
embe
r BC 25.67 6.41 1.91 308.67 864.00 1156.67 0.42 423.67 0.03 6.76 20.73 0.15 1.70 31.49 DP 26.00 6.61 2.52 309.00 789.67 1266.33 0.39 386.33 0.02 6.82 19.27 0.08 1.90 39.10 US 26.00 8.12 7.90 55.56 509.33 1963.00 0.25 246.67 0.01 6.41 10.67 0.17 0.10 29.58 DS 25.50 7.56 7.22 139.67 790.33 1265.33 0.39 386.33 0.01 6.52 11.50 1.47 0.16 40.10
Oct
ober
BC 22.00 7.31 3.18 306.89 831.67 1202.33 0.41 407.33 0.03 6.60 30.53 0.88 1.88 39.46 DP 23.00 7.96 3.93 109.89 832.33 1200.67 0.41 408.00 0.02 6.75 28.50 0.82 1.57 34.37 US 24.00 7.70 7.08 195.33 499.33 2003.00 0.24 241.33 0.36 7.02 17.07 1.02 0.37 32.51 DS 24.00 7.64 6.93 148.00 689.67 1449.33 0.34 336.00 0.01 6.91 29.03 1.30 0.42 24.96
Nov
embe
r BC 23.00 6.87 3.49 123.78 907.67 1102.00 0.44 445.33 0.05 6.79 39.97 0.28 3.53 20.40 DP 22.00 6.86 3.35 287.22 970.00 1031.00 0.48 477.33 0.03 6.68 48.53 0.31 3.69 34.17 US 21.00 7.62 8.38 241.78 429.00 2330.00 0.20 206.87 0.01 6.86 21.33 0.97 0.64 33.62 DS 22.50 7.42 7.42 246.11 718.00 1392.33 0.35 350.00 0.01 6.72 14.10 3.38 0.45 28.17
Dec
embe
r BC 25.00 6.92 3.27 170.67 872.33 1760.33 0.43 428.00 0.05 6.78 36.13 0.24 1.82 24.17
SUM
ME
R
DP 21.00 7.60 3.54 153.56 961.67 1806.00 0.47 473.00 0.02 6.69 31.77 0.77 1.37 28.64 US 22.00 7.50 7.04 274.33 415.33 2082.00 0.20 200.03 0.01 6.85 12.20 0.39 0.03 24.66 DS 22.00 7.59 7.52 205.33 735.67 2010.33 0.36 359.33 0.01 6.64 10.33 1.95 0.35 29.12
Jan
uary
BC 24.00 7.60 3.72 306.89 804.00 1244.00 0.39 393.67 0.02 6.84 12.67 < 0.017 4.70 47.07 DP 23.00 7.66 3.77 109.89 841.33 1188.33 0.41 412.33 0.04 6.87 32.67 < 0.017 4.69 56.64 US 24.00 7.61 7.45 195.33 323.67 3093.33 0.15 155.10 0.03 7.04 11.40 0.58 0.23 25.04 DS 24.00 7.66 6.67 148.00 672.00 1488.33 0.33 327.33 0.01 6.92 8.72 1.22 0.12 36.18
Febr
uary
BC 25.00 5.92 1.74 306.89 925.33 1080.67 0.45 454.33 0.07 7.80 40.37 < 0.017 3.51 40.02 DP 25.00 6.87 2.81 109.89 931.00 1188.33 0.46 457.67 0.03 7.88 44.07 < 0.017 2.71 65.13 US 25.00 7.48 7.56 195.33 319.33 3093.33 0.15 153.07 0.02 7.41 6.37 0.22 0.03 52.33 DS 27.00 7.51 8.19 148.00 641.33 1488.33 0.31 312.33 0.01 7.77 5.94 0.16 0.53 56.61
DO= Dissolved oxygen BOD= Biochemical Oxygen Demand COD= Chemical Oxygen Demand TDS= Total Dissolved Solids TSS= Total Suspended Solids US= upstream DS= downstream BC= before chlorination DP= discharge point
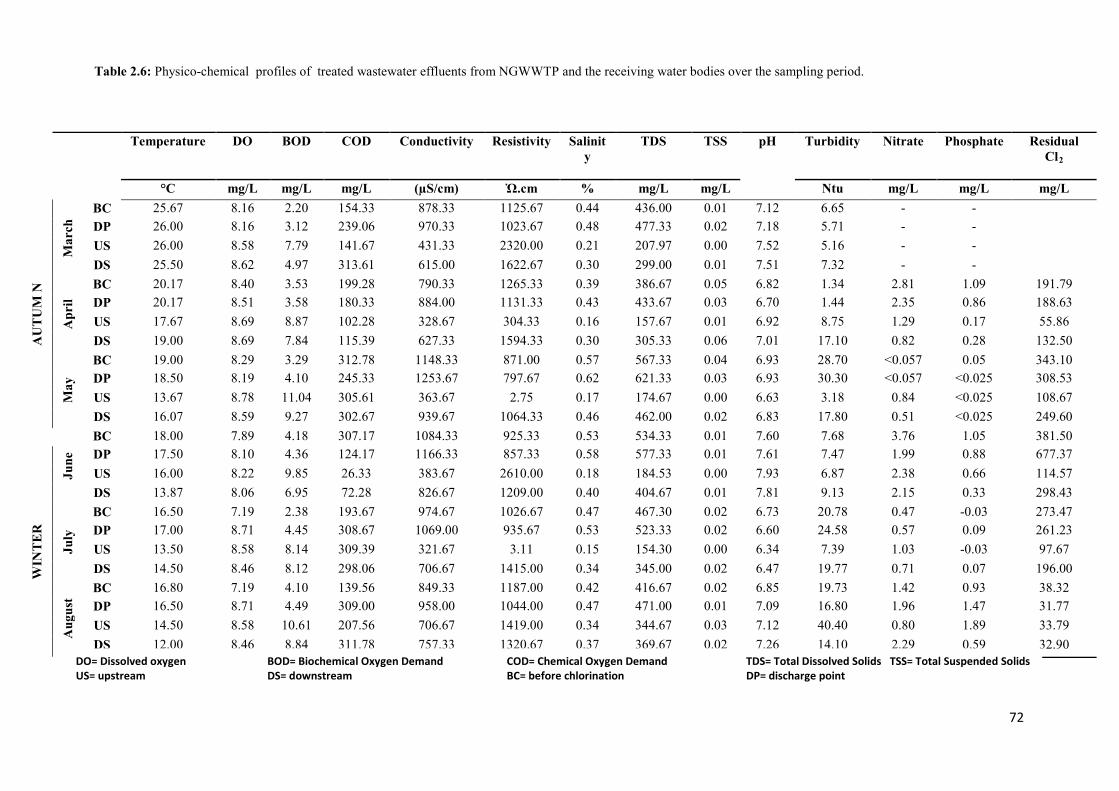
72
Table 2.6: Physico-chemical profiles of treated wastewater effluents from NGWWTP and the receiving water bodies over the sampling period.
Temperature DO BOD COD Conductivity Resistivity Salinity
TDS TSS pH Turbidity Nitrate Phosphate Residual Cl2
°C mg/L mg/L mg/L (µS/cm) Ὠ.cm % mg/L mg/L Ntu mg/L mg/L mg/L
AU
TU
M N
Mar
ch BC 25.67 8.16 2.20 154.33 878.33 1125.67 0.44 436.00 0.01 7.12 6.65 - -
DP 26.00 8.16 3.12 239.06 970.33 1023.67 0.48 477.33 0.02 7.18 5.71 - - US 26.00 8.58 7.79 141.67 431.33 2320.00 0.21 207.97 0.00 7.52 5.16 - - DS 25.50 8.62 4.97 313.61 615.00 1622.67 0.30 299.00 0.01 7.51 7.32 - -
Apr
il
BC 20.17 8.40 3.53 199.28 790.33 1265.33 0.39 386.67 0.05 6.82 1.34 2.81 1.09 191.79 DP 20.17 8.51 3.58 180.33 884.00 1131.33 0.43 433.67 0.03 6.70 1.44 2.35 0.86 188.63 US 17.67 8.69 8.87 102.28 328.67 304.33 0.16 157.67 0.01 6.92 8.75 1.29 0.17 55.86 DS 19.00 8.69 7.84 115.39 627.33 1594.33 0.30 305.33 0.06 7.01 17.10 0.82 0.28 132.50
May
BC 19.00 8.29 3.29 312.78 1148.33 871.00 0.57 567.33 0.04 6.93 28.70 <0.057 0.05 343.10 DP 18.50 8.19 4.10 245.33 1253.67 797.67 0.62 621.33 0.03 6.93 30.30 <0.057 <0.025 308.53 US 13.67 8.78 11.04 305.61 363.67 2.75 0.17 174.67 0.00 6.63 3.18 0.84 <0.025 108.67 DS 16.07 8.59 9.27 302.67 939.67 1064.33 0.46 462.00 0.02 6.83 17.80 0.51 <0.025 249.60
June
BC 18.00 7.89 4.18 307.17 1084.33 925.33 0.53 534.33 0.01 7.60 7.68 3.76 1.05 381.50
WIN
TE
R
DP 17.50 8.10 4.36 124.17 1166.33 857.33 0.58 577.33 0.01 7.61 7.47 1.99 0.88 677.37 US 16.00 8.22 9.85 26.33 383.67 2610.00 0.18 184.53 0.00 7.93 6.87 2.38 0.66 114.57 DS 13.87 8.06 6.95 72.28 826.67 1209.00 0.40 404.67 0.01 7.81 9.13 2.15 0.33 298.43
July
BC 16.50 7.19 2.38 193.67 974.67 1026.67 0.47 467.30 0.02 6.73 20.78 0.47 -0.03 273.47 DP 17.00 8.71 4.45 308.67 1069.00 935.67 0.53 523.33 0.02 6.60 24.58 0.57 0.09 261.23 US 13.50 8.58 8.14 309.39 321.67 3.11 0.15 154.30 0.00 6.34 7.39 1.03 -0.03 97.67 DS 14.50 8.46 8.12 298.06 706.67 1415.00 0.34 345.00 0.02 6.47 19.77 0.71 0.07 196.00
Aug
ust
BC 16.80 7.19 4.10 139.56 849.33 1187.00 0.42 416.67 0.02 6.85 19.73 1.42 0.93 38.32 DP 16.50 8.71 4.49 309.00 958.00 1044.00 0.47 471.00 0.01 7.09 16.80 1.96 1.47 31.77 US 14.50 8.58 10.61 207.56 706.67 1419.00 0.34 344.67 0.03 7.12 40.40 0.80 1.89 33.79 DS 12.00 8.46 8.84 311.78 757.33 1320.67 0.37 369.67 0.02 7.26 14.10 2.29 0.59 32.90
DO= Dissolved oxygen BOD= Biochemical Oxygen Demand COD= Chemical Oxygen Demand TDS= Total Dissolved Solids TSS= Total Suspended Solids US= upstream DS= downstream BC= before chlorination DP= discharge point
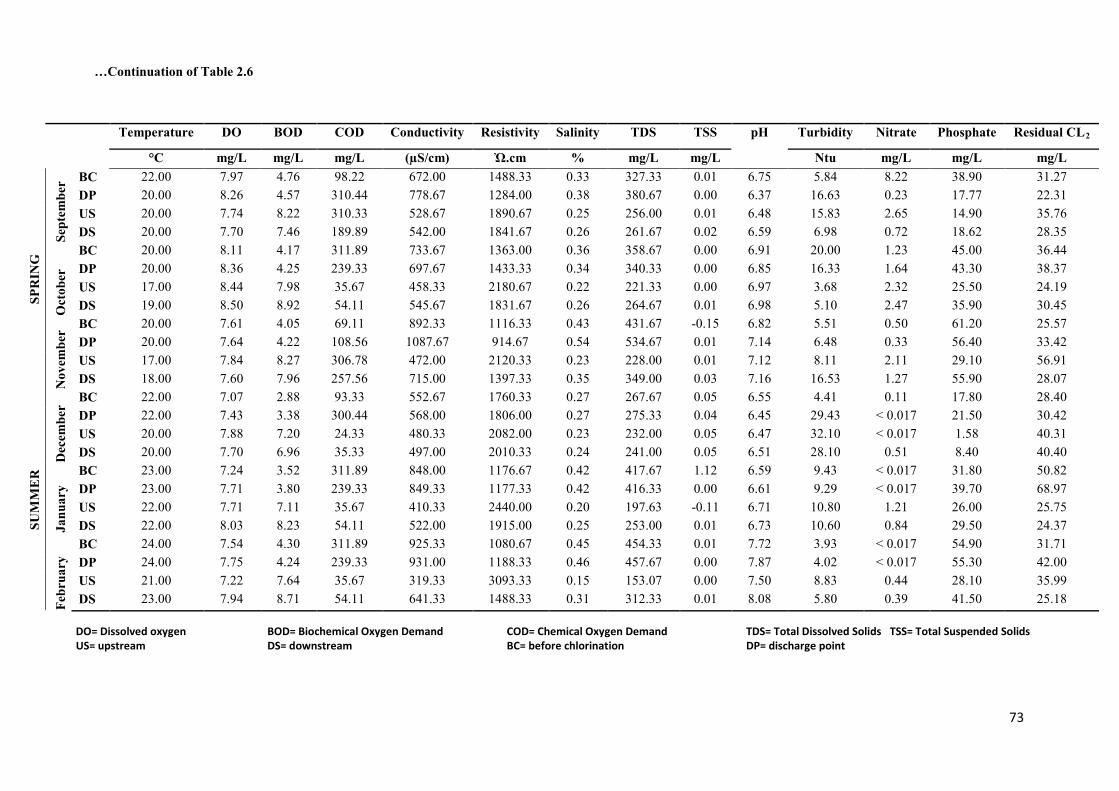
73
…Continuation of Table 2.6
Temperature DO BOD COD Conductivity Resistivity Salinity TDS TSS pH Turbidity Nitrate Phosphate Residual CL2
°C mg/L mg/L mg/L (µS/cm) Ὠ.cm % mg/L mg/L Ntu mg/L mg/L mg/L
SPR
ING
Sept
embe
r BC 22.00 7.97 4.76 98.22 672.00 1488.33 0.33 327.33 0.01 6.75 5.84 8.22 38.90 31.27 DP 20.00 8.26 4.57 310.44 778.67 1284.00 0.38 380.67 0.00 6.37 16.63 0.23 17.77 22.31 US 20.00 7.74 8.22 310.33 528.67 1890.67 0.25 256.00 0.01 6.48 15.83 2.65 14.90 35.76 DS 20.00 7.70 7.46 189.89 542.00 1841.67 0.26 261.67 0.02 6.59 6.98 0.72 18.62 28.35
Oct
ober
BC 20.00 8.11 4.17 311.89 733.67 1363.00 0.36 358.67 0.00 6.91 20.00 1.23 45.00 36.44 DP 20.00 8.36 4.25 239.33 697.67 1433.33 0.34 340.33 0.00 6.85 16.33 1.64 43.30 38.37 US 17.00 8.44 7.98 35.67 458.33 2180.67 0.22 221.33 0.00 6.97 3.68 2.32 25.50 24.19 DS 19.00 8.50 8.92 54.11 545.67 1831.67 0.26 264.67 0.01 6.98 5.10 2.47 35.90 30.45
Nov
embe
r BC 20.00 7.61 4.05 69.11 892.33 1116.33 0.43 431.67 -0.15 6.82 5.51 0.50 61.20 25.57 DP 20.00 7.64 4.22 108.56 1087.67 914.67 0.54 534.67 0.01 7.14 6.48 0.33 56.40 33.42 US 17.00 7.84 8.27 306.78 472.00 2120.33 0.23 228.00 0.01 7.12 8.11 2.11 29.10 56.91 DS 18.00 7.60 7.96 257.56 715.00 1397.33 0.35 349.00 0.03 7.16 16.53 1.27 55.90 28.07
SUM
ME
R D
ecem
ber
BC 22.00 7.07 2.88 93.33 552.67 1760.33 0.27 267.67 0.05 6.55 4.41 0.11 17.80 28.40 DP 22.00 7.43 3.38 300.44 568.00 1806.00 0.27 275.33 0.04 6.45 29.43 < 0.017 21.50 30.42 US 20.00 7.88 7.20 24.33 480.33 2082.00 0.23 232.00 0.05 6.47 32.10 < 0.017 1.58 40.31 DS 20.00 7.70 6.96 35.33 497.00 2010.33 0.24 241.00 0.05 6.51 28.10 0.51 8.40 40.40
Jan
uary
BC 23.00 7.24 3.52 311.89 848.00 1176.67 0.42 417.67 1.12 6.59 9.43 < 0.017 31.80 50.82 DP 23.00 7.71 3.80 239.33 849.33 1177.33 0.42 416.33 0.00 6.61 9.29 < 0.017 39.70 68.97 US 22.00 7.71 7.11 35.67 410.33 2440.00 0.20 197.63 -0.11 6.71 10.80 1.21 26.00 25.75 DS 22.00 8.03 8.23 54.11 522.00 1915.00 0.25 253.00 0.01 6.73 10.60 0.84 29.50 24.37
Febr
uary
BC 24.00 7.54 4.30 311.89 925.33 1080.67 0.45 454.33 0.01 7.72 3.93 < 0.017 54.90 31.71 DP 24.00 7.75 4.24 239.33 931.00 1188.33 0.46 457.67 0.00 7.87 4.02 < 0.017 55.30 42.00 US 21.00 7.22 7.64 35.67 319.33 3093.33 0.15 153.07 0.00 7.50 8.83 0.44 28.10 35.99 DS 23.00 7.94 8.71 54.11 641.33 1488.33 0.31 312.33 0.01 8.08 5.80 0.39 41.50 25.18
DO= Dissolved oxygen BOD= Biochemical Oxygen Demand COD= Chemical Oxygen Demand TDS= Total Dissolved Solids TSS= Total Suspended Solids US= upstream DS= downstream BC= before chlorination DP= discharge point
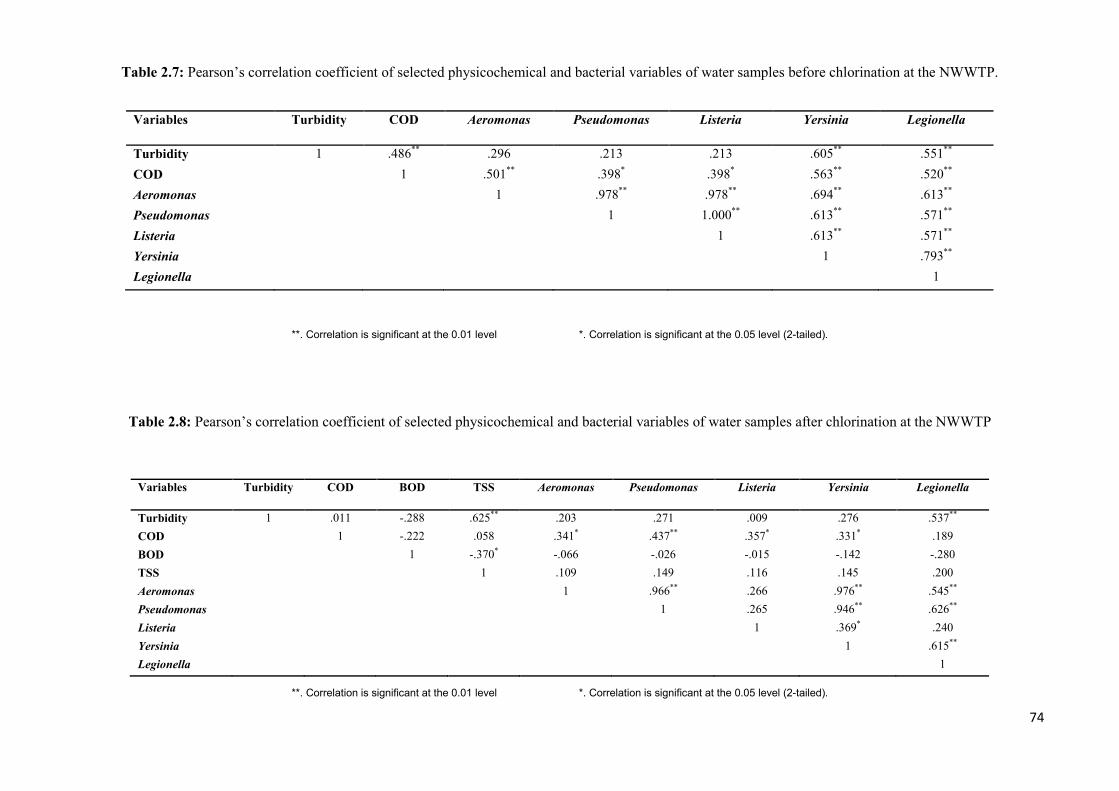
74
Table 2.7: Pearson’s correlation coefficient of selected physicochemical and bacterial variables of water samples before chlorination at the NWWTP.
Variables Turbidity COD Aeromonas Pseudomonas Listeria Yersinia Legionella
Turbidity 1 .486** .296 .213 .213 .605** .551** COD 1 .501** .398* .398* .563** .520** Aeromonas 1 .978** .978** .694** .613** Pseudomonas 1 1.000** .613** .571** Listeria 1 .613** .571** Yersinia 1 .793** Legionella 1
**. Correlation is significant at the 0.01 level *. Correlation is significant at the 0.05 level (2-tailed).
Table 2.8: Pearson’s correlation coefficient of selected physicochemical and bacterial variables of water samples after chlorination at the NWWTP
**. Correlation is significant at the 0.01 level *. Correlation is significant at the 0.05 level (2-tailed).
Variables Turbidity COD BOD TSS Aeromonas Pseudomonas Listeria Yersinia Legionella
Turbidity 1 .011 -.288 .625** .203 .271 .009 .276 .537** COD 1 -.222 .058 .341* .437** .357* .331* .189 BOD 1 -.370* -.066 -.026 -.015 -.142 -.280 TSS 1 .109 .149 .116 .145 .200 Aeromonas 1 .966** .266 .976** .545** Pseudomonas 1 .265 .946** .626** Listeria 1 .369* .240 Yersinia 1 .615** Legionella 1
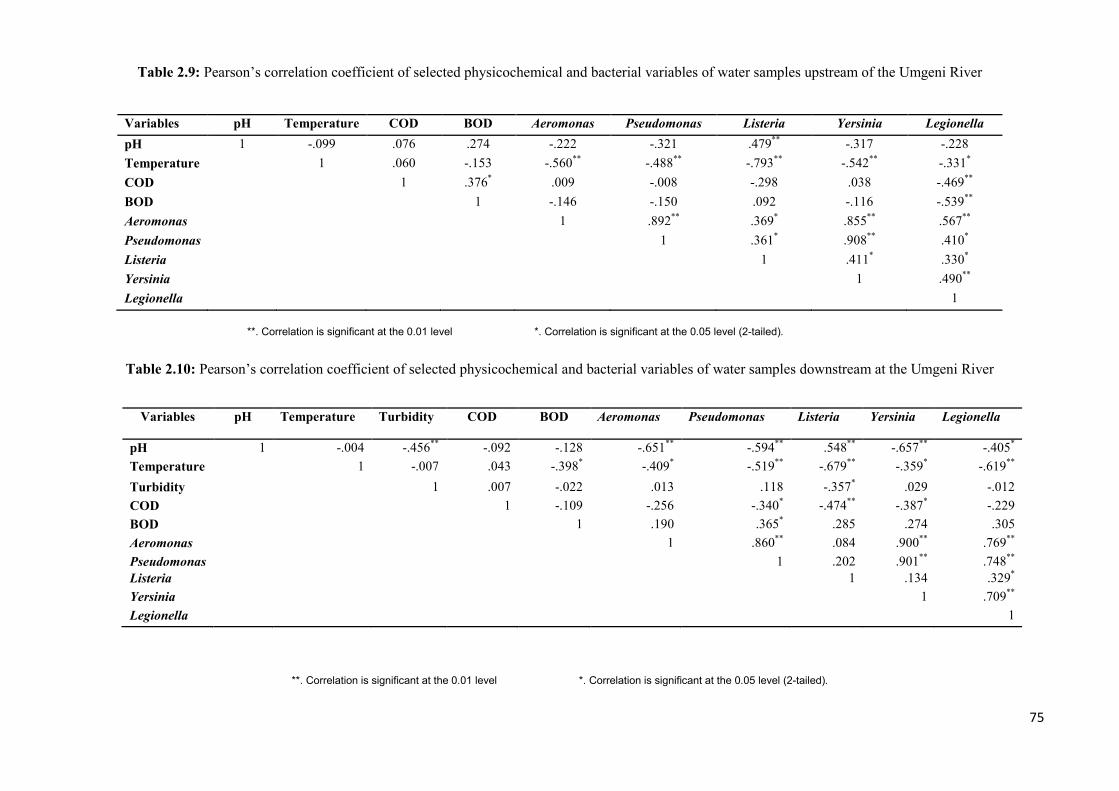
75
Table 2.9: Pearson’s correlation coefficient of selected physicochemical and bacterial variables of water samples upstream of the Umgeni River
Table 2.10: Pearson’s correlation coefficient of selected physicochemical and bacterial variables of water samples downstream at the Umgeni River
Variables pH Temperature Turbidity COD BOD Aeromonas Pseudomonas Listeria Yersinia Legionella
pH 1 -.004 -.456** -.092 -.128 -.651** -.594** .548** -.657** -.405* Temperature 1 -.007 .043 -.398* -.409* -.519** -.679** -.359* -.619** Turbidity 1 .007 -.022 .013 .118 -.357* .029 -.012 COD 1 -.109 -.256 -.340* -.474** -.387* -.229 BOD 1 .190 .365* .285 .274 .305 Aeromonas 1 .860** .084 .900** .769** Pseudomonas 1 .202 .901** .748** Listeria 1 .134 .329* Yersinia 1 .709** Legionella 1
**. Correlation is significant at the 0.01 level *. Correlation is significant at the 0.05 level (2-tailed).
Variables pH Temperature COD BOD Aeromonas Pseudomonas Listeria Yersinia Legionella pH 1 -.099 .076 .274 -.222 -.321 .479** -.317 -.228 Temperature 1 .060 -.153 -.560** -.488** -.793** -.542** -.331* COD 1 .376* .009 -.008 -.298 .038 -.469** BOD 1 -.146 -.150 .092 -.116 -.539** Aeromonas 1 .892** .369* .855** .567** Pseudomonas 1 .361* .908** .410* Listeria 1 .411* .330* Yersinia 1 .490** Legionella 1
**. Correlation is significant at the 0.01 level *. Correlation is significant at the 0.05 level (2-tailed).
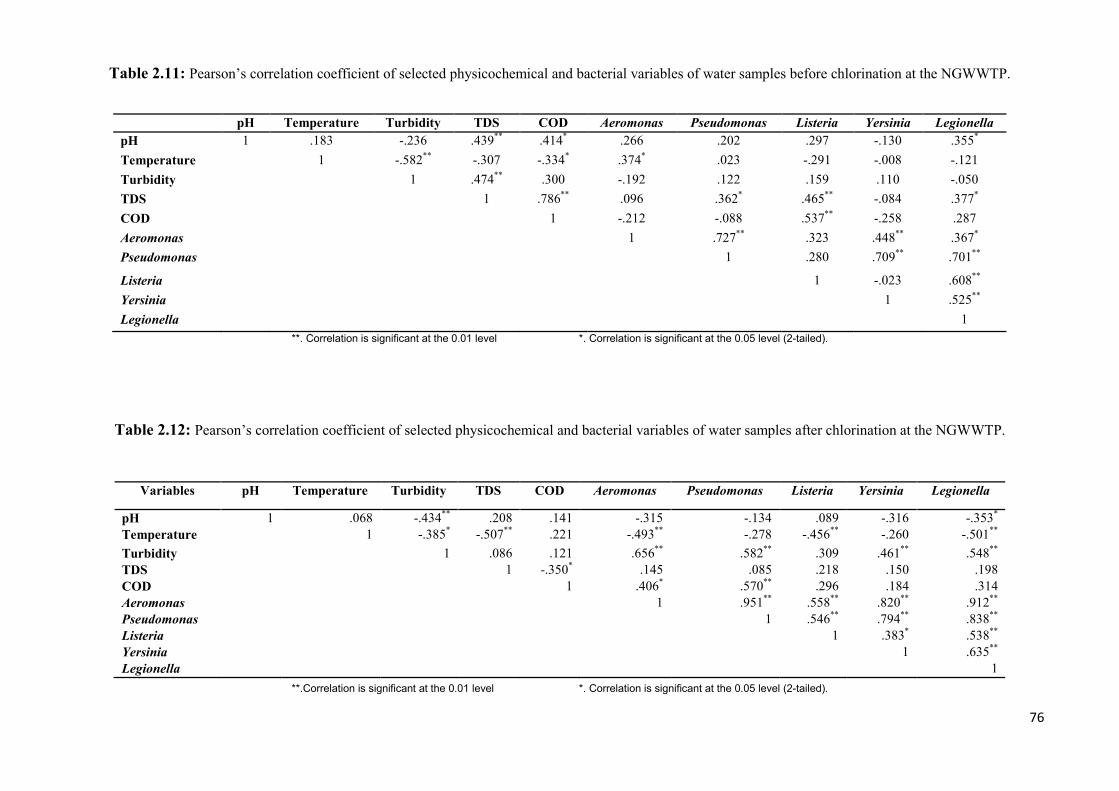
76
Table 2.11: Pearson’s correlation coefficient of selected physicochemical and bacterial variables of water samples before chlorination at the NGWWTP.
pH Temperature Turbidity TDS COD Aeromonas Pseudomonas Listeria Yersinia Legionella pH 1 .183 -.236 .439** .414* .266 .202 .297 -.130 .355* Temperature 1 -.582** -.307 -.334* .374* .023 -.291 -.008 -.121 Turbidity 1 .474** .300 -.192 .122 .159 .110 -.050 TDS 1 .786** .096 .362* .465** -.084 .377* COD 1 -.212 -.088 .537** -.258 .287 Aeromonas 1 .727** .323 .448** .367* Pseudomonas 1 .280 .709** .701**
Listeria 1 -.023 .608** Yersinia 1 .525** Legionella 1
**. Correlation is significant at the 0.01 level *. Correlation is significant at the 0.05 level (2-tailed).
Table 2.12: Pearson’s correlation coefficient of selected physicochemical and bacterial variables of water samples after chlorination at the NGWWTP.
**.Correlation is significant at the 0.01 level *. Correlation is significant at the 0.05 level (2-tailed).
Variables pH Temperature Turbidity TDS COD Aeromonas Pseudomonas Listeria Yersinia Legionella
pH 1 .068 -.434** .208 .141 -.315 -.134 .089 -.316 -.353* Temperature 1 -.385* -.507** .221 -.493** -.278 -.456** -.260 -.501** Turbidity 1 .086 .121 .656** .582** .309 .461** .548** TDS 1 -.350* .145 .085 .218 .150 .198 COD 1 .406* .570** .296 .184 .314 Aeromonas 1 .951** .558** .820** .912** Pseudomonas 1 .546** .794** .838** Listeria 1 .383* .538** Yersinia 1 .635** Legionella 1
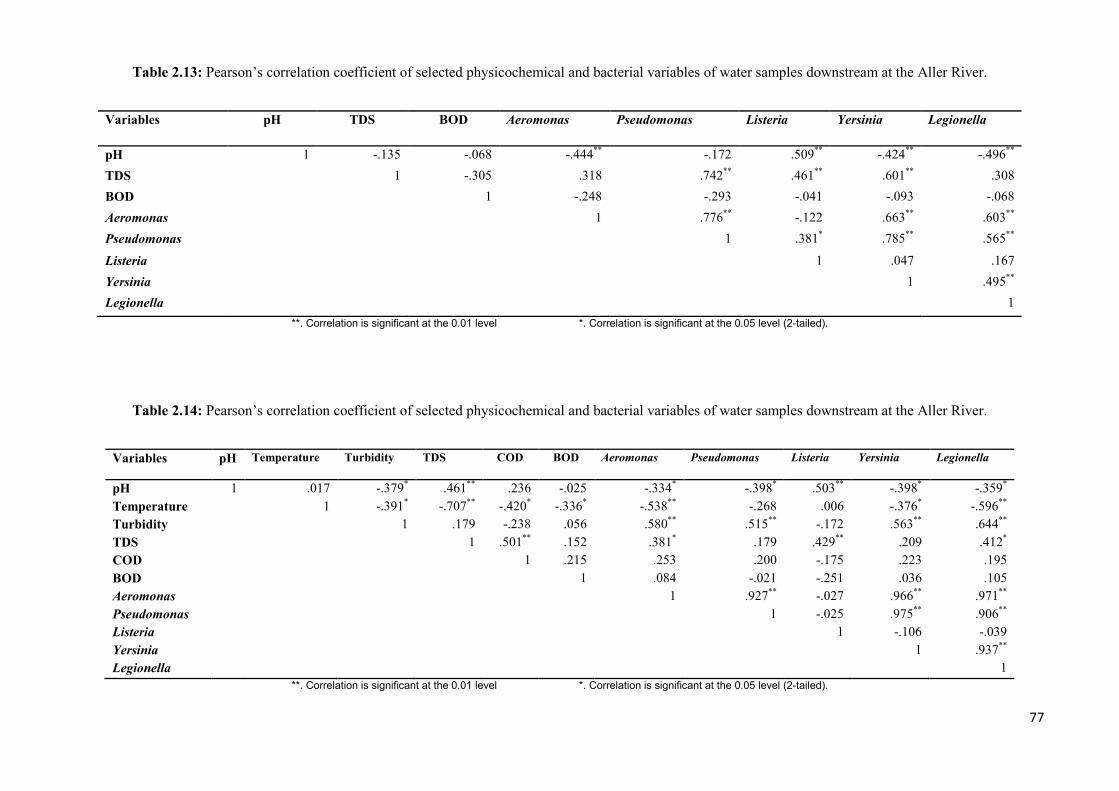
77
Table 2.13: Pearson’s correlation coefficient of selected physicochemical and bacterial variables of water samples downstream at the Aller River.
Variables pH TDS BOD Aeromonas Pseudomonas Listeria Yersinia Legionella
pH 1 -.135 -.068 -.444** -.172 .509** -.424** -.496** TDS 1 -.305 .318 .742** .461** .601** .308 BOD 1 -.248 -.293 -.041 -.093 -.068 Aeromonas 1 .776** -.122 .663** .603** Pseudomonas 1 .381* .785** .565**
Listeria 1 .047 .167 Yersinia 1 .495** Legionella 1
**. Correlation is significant at the 0.01 level *. Correlation is significant at the 0.05 level (2-tailed).
Table 2.14: Pearson’s correlation coefficient of selected physicochemical and bacterial variables of water samples downstream at the Aller River.
Variables pH Temperature Turbidity TDS COD BOD Aeromonas Pseudomonas Listeria Yersinia Legionella
pH 1 .017 -.379* .461** .236 -.025 -.334* -.398* .503** -.398* -.359* Temperature 1 -.391* -.707** -.420* -.336* -.538** -.268 .006 -.376* -.596** Turbidity 1 .179 -.238 .056 .580** .515** -.172 .563** .644** TDS 1 .501** .152 .381* .179 .429** .209 .412* COD 1 .215 .253 .200 -.175 .223 .195 BOD 1 .084 -.021 -.251 .036 .105 Aeromonas 1 .927** -.027 .966** .971** Pseudomonas 1 -.025 .975** .906** Listeria 1 -.106 -.039 Yersinia 1 .937** Legionella 1
**. Correlation is significant at the 0.01 level *. Correlation is significant at the 0.05 level (2-tailed).
78
A positive correlation was observed between pH and TDS, COD and Legionella, while
temperature was positively correlated with turbidity, COD, and Aeromonas (Table 2.11).
TDS displayed a significant positive correlation with COD, Pseudomonas, Listeria and
Legionella. Listeria was the only microorganism which was significantly, positively
correlated to COD values. At the discharge point, temperature and pH show a negative
correlation to the tested microorganisms (Table 2.12), while TDS and COD were positively
correlated (P < 0.05). Tables 2.13 and 2.14 display the correlation results obtained for the
upstream and downstream samples. Similar to NWWTP, a significant negative correlation
(p<0.05) was observed between temperature readings and all the tested microorganisms, at
both the sampling points. Most of the physico-chemical parameters were negatively
correlated, while most displayed non-significant results. Throughout the sampling points at
both the plants, the microbial populations mostly displayed a strong correlation to each other,
with the exception of Listeria spp. which were not significantly correlated to neither of the
organisms.
2.4 Discussion
Bacterial analyses of treated effluents from both plants displayed an unexpected trend for
some of the sampling months, with an increase in the bacterial loads obtained at the discharge
points (after chlorination) compared to counts obtained before chlorination, showing the
survival of these organisms after chlorine treatment. This corroborates the findings of
Odjadjare et al. (2010), who reported higher Listeria spp. populations in treated effluent after
chlorination compared to the population recovered before the chlorination step. In another
study by Odjadjare et al. (2012), Pseudomonas spp. populations were also obtained at higher
concentrations after chlorination. This study however only focused on assessing final
effluents of different plants.
79
Two factors could be responsible for the observed increase in the bacterial populations after
the chlorination point at the NWWTP. Firstly the plant was undergoing an upgrade which
could have resulted in treatment inefficiency during the sampling period. Secondly, after
tertiary treatment, the water is channelled out of the plant to the DP which is approximately 4
km from the plant. The effluent pipe could have provided a conducive growth environment
for the microorganisms, resulting in growth and microbial proliferation. At low tide the river
water flow was inevitably directed towards the sea, allowing the water to flow from the
downstream to upstream points where higher counts would be obtained. At high tide the river
water flowed from upstream to downstream, where higher counts were obtained at the
downstream point. This had an influence on the microbial populations obtained at both these
points. Bacterial populations at NGWWTP were found to be generally lower than that of
NWWTP. This could be attributed to the fact that NGWWTP is a smaller plant and treated
lesser amounts of water having reduced the treatment capacity from the initial 7 to 0.5
megalitres per day. A greater reduction in the bacterial popultions was observed at this plant
after chlorination step. This plant is also situated very close to the river, eliminating the use of
a discharge pipe.
Bacterial populations were generally much higher in treated effluent than the receiving water
bodies with the exception of NGWWTP’s upstream point which is highly influence by other
human activities. This could be as a result of higher nutrient levels in the wastewater effluents
compared to the receiving water bodies, as previously reported (Conter et al., 2009;
Czeszejko et al., 2003; Odjadjare et al., 2010; Pailard et al., 2005). The observed lower
bacterial populations downstream of the Aller River at the NGWWTP could be due to the
dilution effect of the treated effluent discharge high in residual chlorine concentrations to the
80
downstream flowing water. The narrow Aller River also has vegetation growing in it which
might also serve as a filtration system to the downstream waters.
The Durban Wastewater Managing Department (DWM), controlled and monitored by the
Department of Water Affairs (DWA) has set specific guidelines to monitor, maintain and
protect the state of the surface water in South Africa. The DWA is responsible for monthly
sampling and testing of wastewater effluent to ensure that current water policy meet the
appropriate legislative requirements (DWAF, 1996). In this particular study, the five tested
emerging bacterial pathogens were found to be present after tertiary treatment at both plants.
This is of great concern, taking into consideration that in some cases, these pathogens were
found to be present in extremely high numbers in the absence or low occurrence of
commonly used indicator microorganisms (fecal coliforms, total coliforms and enterococci),
which is assumed to be a sure indicator of the presence of pathogens, especially
enteropathogens (Hoogeboezem, 2007; Perdek et al., 2002). However, the discovery of
emerging pathogens in treated water, in the absence of indicator organisms as observed in the
study, indicates that the treatment processes are not effective in efficient pathogen removal
(Toze, 1997). The alarmingly high counts obtained at the discharge point are worrisome,
indicating the ineffectiveness of the tertiary treatment in removing these emerging bacterial
pathogens and the potential health effects of these effluent discharge on the environment and
many communities dependants of this water (Obi, 2002; Philippaeux, 1998, UNEP, 2010).
Previous studies have shown that people who swim in waters with an increased number of
pathogens showed signs of respiratory and gastrointestinal infections, fevers, chills, ear
discharges, vomiting and coughing (Perez Guzzi et al., 2000). WHO (2008) reported that
approximately 1.8 million children under five years of age die every year from water related
diseases, with the under developed and developing countries such as South Africa being most
81
affected. The high rate of disease outbreaks resulting from contact or consumption of water
from rivers into which wastewater effluent is discharged reflects on the poor treatment
processes and the lack of compliance to set guidelines.
Receiving rivers of improperly treated wastewater effluent have been found to have
minimized aquatic ecosystems and species diversity. It also affects the marine resource trade
and allows for an increased possibility of ingesting food with toxic compounds that were
absorbed by algal blooms during the process of eutrophication (Luger and Brown, 2010).
Most of the rivers in the Durban Metropolitan Area suffer from eutrophication, due to
contamination from untreated sewage resulting from poor treatment processes or blockage of
sewage carrier pipes (DMW, 1999). The non-compliance of treated wastewater effluent has
resulted in a number of disease outbreaks all around South Africa. In 2008, media reports in
KwaZulu Natal claimed that large amounts of sewage effluents were being discharged into
the Durban harbour killing a large population of fish and destabilizing aquatic ecosystems
(Mema, 2009).
The presence of Legionella in alarmingly high numbers in the treated effluent tested in this
study was not surprising since they are known to be more resistant to chlorine than coliform
bacteria and may also be protected by amoebae and be sheltered in biofilms (Palmer et al.,
1995). It has also been previously reported that Y. enterocolitica and other Yersinia spp. from
raw sewage and sewage sludge, can survive up to 1.5 years in the environment, ultimately
resulting in the contamination of drinking water. Legionella species were also found to
survive for periods as long as 2.5 years in low and nutrient limiting environments, after being
released into the environment. In addition, organisms such as Pseudomonas and Aeromonas
spp., produce bacteriocins that result in significant inhibition of legionellae in treated water if
82
found in high numbers (Palmer et al., 1995). Thus, chlorine levels that eliminate
microorganisms that inhibit Legionella spp. could result in increases in the population of
indigenous Legionella spp. This can be true for this study considering that the Aeromonas
and Pseudomonas spp. always had lower counts when compared to those of Legionella spp.
The Listeria counts obtained after tertiary treatment were found to be similar or within the
same as those reported by Odjadjare et al. (2010). Listeria infections are reported to have the
highest (up to 50%) mortality rate amongst foodborne pathogens. This is of grave concern in
South Africa, with a high number of HIV/AIDS infected people, coupled with a high level of
drug and alcohol abuse, which has led to many people being immunocompromised in the
country. The potential severity of listeriosis outbreak on the public health is disquieting since
there is absence of information on the prevalence of this pathogen in South Africa. The fact
that Listeria is not considered a waterborne pathogen globally in spite of reports in the
literature suggesting that the pathogen is well established in the water supply chain is also of
grave concern (Odjadjare et al., 2010).
Aeromonas and Pseudomonas spp. were also found to be present at both plants after tertiary
treatment throughout the sampling periods. These results are similar to those obtained in
similar studies (Bressler et al., 2009; Paillard et al., 2005; Pablos et al., 2009). These
organisms have the ability to multiply under appropriate temperature and nutritional
conditions and can also survive in drinking water despite treatment (Goni-Urriza et al., 2000).
They have also been implicated in a wide range of disease outbreaks around the world
including South Africa. One of the main reasons that these organism have been found to
escape treatment, is the fact that they have the advantageous ability to form biofilm
structures, which are highly involved in their survival and protection from disinfection (Vila
et al., 2003). The mere fact that they are also highly present in drinking water which has
83
higher treatment standards is an indicator that they house numerous defence systems that
provide protection during treatment. P. aeruginosa is especially of concern to human health
today because it is a formidable nosocomial pathogen. P. aeruginosa is an appropriate
commonly associated with a variety of health ailments including: urinary tract infections,
respiratory infections, dermatitis, bone and joint infections, gastrointestinal infections, and
systemic infections (Picardo and Giroux, 2004).
The physicochemical quality of the treated effluents from the two treatment plants were
generally compliant to recommended limits of pH, temperature, TSS, and DO (Hitchins,
2001) set for effluents to be discharged into the receiving environment such as rivers
(DWAF, 1992; CLSI, 2005). However, the remainder of the physico-chemical parameters
displayed poor quality across the sampled sites and generally fell short of set
guidelines/limits for turbidity, COD, phosphates and nitrates (Conter et al., 2009; DWAF,
1992; Hitchins, 2001, Naravaneni and Jamil, 2005). Temperature readings were commonly
below the recommended limit of 25 °C for no risk stipulated in the South African water
quality guidelines for domestic use (DWAF, 1996). According to Jaji et al. (2007), the
temperature readings obtained in this study do not pose any threat to the homeostatic balance
of the receiving water bodies. High turbidity readings obtained in the influent cannot be
graded against guidelines, since no standard can be found for this parameter. The turbidity
readings were however always higher that the 0 – 1 NTU standard set for water intended for
domestic use (DWAF, 1998). Highly turbid waters may also give rise to other problems,
during the treatment processes. Salinity, like turbidity has no set guidelines for treated
effluent, but the conductivity readings exceeded the South African acceptable limit of 70
μ/Scm for conductivity in domestic water supply (DWAF, 1996), by extreme ranges, raising
concern and disqualifying the water for domestic use. In previous studies conducted by
84
Igbinosa et al. (2009) and Fatoki et al. (2003), the conductivity readings obtained were also
considerably higher than the set guideline. There are no guidelines set to monitor salinity
readings, which in this study are below 1% for all the sampled points at both plants.
However, certain companies and organisations such as SANCOR have established and put in
place some criteria for aquatic ecosystems (SANCOR, 1984). Increased salinity values have a
negative impact on crop yield, increase corrosion and highly salinized water often require
high pre-treatment levels prior to use (DEAT, 2000). Dissolved oxygen reading seemed to
fluctuate with the microbial population, probably due to the fact that in the presence of
degradable organic matter, microorganisms require more oxygen to carry out the degradation
and this process is oxygen demanding. DO readings obtained in this study were higher than
those obtained in similar studies (Fatoki et al., 2003; Igbinosa et al., 2009; Jaji et al., 2007).
This again could possibly have a negative impact on the receiving water systems, considering
the importance of a well-balanced biological system and that the oxygen balance of the
system is essential for maintaining life within a biological system. COD values obtained at
most of the sampling points were higher than the 30 mg/L South African guideline set for
wastewater effluents to be discharged into the receiving water bodies (Government Gazette,
1984). COD is often linked to both the organic and inorganic substances which might be
present in an environment, which can include organic contaminant carried by the wastewater
influent into the plant, as well as from other sources. High COD values obtained at the
NGWWTP could be attributed to the fact that the plant is surrounded by a number of
industrial companies and treats mainly industrial wastes containing high concentrations of
dyes, detergents and other toxic chemicals. High COD levels can be harmful to aquatic life
and ecosystems (Fatoki et al., 2003). The high turbidity, COD and TDS obtained in this study
suggesting the presence of high organic matter content which have a negative effect on the
surrounding ecosystems as well as human population.
85
The residual chlorine values generally fell short of the recommended limit (0.3 to 0.6 mg/L)
of no risk at point of use (SA Government Gazette, 1984) and this implies that the effluents
may not be appropriate for domestic uses. A mixture of chlorine particles with high organic
matter forms a toxic compound known as trihalomethane which is a carcinogenic compound
formed as a by-product of chlorine and organic matter reaction in water systems and has been
reported to have serious health implications for aquatic life and humans exposed to it
(Murrell et al., 1999; Venkateswaran et al., 1989). Nitrate and phosphate levels for both
plants were mostly higher that the expected or set guidelines and phosphate levels were
alarmingly higher than the 1.5 mg/L guideline. Nitrate can be reduced to nitrite, which at high
levels gives rise to methaemoglobinemia (Fatoki, 2003). It also results in eutrophication of
receiving water bodies when values obtained exceeded the recommended limits for no risk of
0 to 0.5 mg/L (DWAF, 1996). Nitrates and phosphorus are essential nutrients important to
plant growth when moderated. Excess quantities of these nutrients have the ability to
stimulate excessive plant growth giving rise to algal blooms. Eutrophication could possibly
affect the use of rivers and dams for recreation purposes, blocking access to waterways and
giving rise to scum, which in turn could lead to the growth of blue-green algae and release
toxic substances (cyanotoxins) into the water systems.
The prevalence and survival of pathogens in treated effluent after treatment processes poses a
major threat both to the receiving environment and ecosystems and most importantly presents
a potential threat to the health of the receiving communities primarily dependant on these
waters (Luger and Brown, 2010). Microorganisms that bypass treatment processes have been
found to be more virulent and have also been found as the main causatives of infections
which cannot be easily treated (Kaye et al., 2004). South Africa currently has no set
86
guidelines for emerging bacterial pathogens (Bartie et al., 2002), and therefore requires new
and revised standards that will include emerging pathogens since treatment appears to be
ineffective (Odjadjare et al., 2010) and the presence of these pathogens in the discharged
wastewater effluent cannot be monitored (Bartie et al., 2002). The fact that these pathogens
are also found to be present in drinking tap water which is meant to be safe and pathogen
free, further proves that guidelines need to be revised. According to the safe water act, the
maximum contamination levels for safe drinking water should be zero for all pathogens “no
tolerable lower limit” (WHO, 2008). Some tested physico-chemical parameters also have no
set guidelines making the monitoring of these factors difficult. Most of the guidelines being
used are numerous decades old and are evidently outdated. There exists a need for the
revision of wastewater effluent guidelines to ensure a system with no grey/uncertainty areas,
especially since South Africa seems to be inclined towards the recycling of wastewater into
drinking water.
87
CHAPTER THREE
ANTIMICROBIAL RESISTANCE AND VIRULENCE SIGNATURES OF LISTERIA
SPECIES RECOVERED FROM TREATED EFFLUENT AND RECEIVING
SURFACE WATER
3.1 Introduction
Wastewater effluent and surrounding fresh water bodies such as rivers and estuaries have
been found to contain high levels of contaminants, including disease-causing bacteria such as
Listeria species (Odjadjare and Okoh, 2010). The ability of these organisms to survive
conventional wastewater treatment processes could lead to major environmental and human
health problems, resulting from the highly contaminated surface waters (Odjadjare and Okoh,
2010). Previously, Listeria has only been associated with food related infections and disease,
but has now been discovered and reported in water (Paillard et al., 2005). Listeria species are
rod shaped Gram positive bacteria which are non-spore and capsule forming, with the ability
to grow at a wide range of pH (4.4- 10), salinity (up to 20% concentration) and temperature (-
0.4°C - 37°C) (Brugere-Picoux, 2008). Of the seven recognised Listeria species (L.
monocytogenes, L. ivanovii. L. innocua, L. seeligeri, L. welshimeri, L. grayii and L. murrayi),
only L. monocytogenes and L. ivanovii are currently deemed as pathogenic and infectious,
causing diseases in animals and human beings, also being the only species that are known and
have been previously reported to display β-haemolytic activity (Brugere-Picoux, 2008;
Roberts and Wiednann 2003; Rodriguez-Lazaro et al., 2004; Schuchat et al., 1991). L.
ivanovii, L. seeligeri and L. innocua however have also been reported to cause disease in both
animals and humans (Brugere-Picoux, 2008; Cocolin et al., 2002; Cummins et al., 1994;
Walker et al., 1994).
88
Listeria species are known to be oxidase negative, catalase, methyl red and Voges-Proskauer
positive. Listeria species, mainly Listeria monocytogenes cause listeriosis which develops
mostly in neonates, the elderly, pregnant women, and immuno-compromised individuals.
Listeria monocytogenes can be classified as invasive or non-invasive, the former which
spread to the nervous system causing meningoencephalitis, encephalitis, sepsis, abscesses and
abortions resulting in a 20-30% mortality rate and the latter affecting not only the immuno-
compromised but even the healthy individuals, resulting in abdominal pains, fever, diarrhoea,
muscular pain, headache, nausea and vomiting (Arslan and özdemir, 2008; Paillard et al.,
2005).
Limited information has been documented regarding listeriosis outbreaks and incidence rates;
however the disease still remains of great public health concern due to the high fatality rate,
which for the past 2 decades has been estimated to be between 20 to 30 % in developed
countries (Tirumalai, 2013). The prevalence of Listeria species in treated wastewater effluent
has been reported both in developing and developed countries (Czeszejko et al., 2003,
Paillard et al., 2005, Odjadjare and Okoh, 2010). Higher incidence rates have been reported
to occur annually in other first world countries like the US and Europe (Mead et al., 1999;
WHO/FAO, 2004) when compared to the low incidence or prevalence reported in Africa,
Asia and South America and mostly in the 3rd world or developing countries (Rocourt, 1996;
Tirumalai, 2013). This is possibly due to differing food consumption patterns between the
developed and developing countries, as well as ineffective and inefficient pathogen detection
methods in these countries (WHO/FAO, 2004). Listeria spp. are commonly reported as
foodborne pathogens, however wastewater has for a long period been reported to be a
potential reservoir and transporter of pathogenic Listeria which harbour virulence
89
determinants and display a notable trend of resistance to commonly used antimicrobials
(Aslan and Ozdemir, 2008, Czeszejko et al., 2003, Paillard et al., 2005; Watkins and Sleath,
1981).
Wastewater treatment plants across South Africa have displayed poor bacterial pathogen
removal over the years. Also, the current treatment regulations and guidelines mainly using
common indicator organisms as a standard for monitoring drinking water and wastewater
treatment processes have proven to be unreliable (Eze et al., 2009; Toze, 1997). This is of
great public concern considering that an estimated 80% of South Africans depend on surface
water for most of their domestic water needs (Venter, 2007, Mackintosh and Colvin, 2003).
Worse cases of waterborne infections have been seen and reported mostly in poverty stricken
populations which lack adequate sanitation and infrastructure as surrounding populations
have easy and uncontrolled access to free-flowing highly contaminated waters to meet their
water needs (Odjadjare and Okoh, 2010). Recent reports on waterborne disease outbreaks
have shown to be unreliable and in most cases, the supposedly causative organisms found to
represent a small percentage with the remainder causative organisms remaining unidentified,
also highlighting the lack of reliable pathogen detection methods in South Africa (Odjadjare
and Okoh, 2010).
This study assessed the prevalence of Listeria species in treated effluent of two wastewater
treatment plants in Durban and the impact of the effluent discharge on the receiving water
bodies (the Aller and Umgeni Rivers). The presumptive Listeria isolates recovered from the
treated effluent and the receiving Rivers were confirmed by both the conventional
biochemical tests and PCR methods. The confirmed isolates were further characterized for
their virulence determinants and antimicrobial resistance profiles.
90
3.2 Materials and methods
3.2.1 Biochemical analyses
Identification of the presumptive Listeria spp. isolated from the treated effluent and the
receiving rivers was performed using a range of biochemical tests including the oxidase and
catalase test, carbohydrate fermentation, acid formation (TSI), indole production test and
Methyl red and Voges-Proskauer test.
3.2.2 Molecular analyses
Polymerase chain reaction (PCR) was used to amplify and detect the presence of specific
conserved sequences (iap gene) in each of the presumptive Listeria species isolates, using
universal Listeria primers for further identification.
3.2.2.1 DNA isolation
Genomic DNA was isolated from biochemically identified Listeria species using the boiling
method (Lin et al., 1996; Yàñez et al., 2003). One colony from fresh 24 hour culture was
suspended in a microcentrifuge tube containing 70 μl sterile ddH2O. The culture and water
mixtures were vortexed at high speed for 1 min and heated to 100 °C for 10 min in a water
bath to lyse the cells and thereafter cooled to room temperature. The tubes were vortexed
again prior to centrifugation at 13 000 rpm for 5 min and the supernatant was transferred to a
sterile tube and used as template in the PCR assay.

91
3.2.2.2 PCR identification of Listeria species isolates
The PCR amplification of the iap gene was performed in a thermal cycler (GeneAMP PCR
System 2400, Bio Rad) using the primers indicated in Table 3.1. PCR conditions were as
follows: Pre-denaturation at 95 °C for 5 min, denaturation at 95 °C for 1 min, annealing at 36
°C for 1 min, extension at 72 °C for 3 min and final extension 72 °C for 7 min for 30 cycles
(Cocolin et al., 2002). PCR was performed in a final volume of 50 µl containing 50 mM KCl,
10mM Tris/HCl (pH 8.3), 3.5 mM MgCl2, 0.2 µM of each dNTP, 1.25 U Taq DNA
polymerase, 0.2 µM of each primer and 1 µl of the extracted DNA sample (Cocolin et al.,
2002). Listeria monocytogenes ATCC 19115 strain was used as a positive control in all PCR
assays.
Table 3.1: Characteristics of primers used for PCR amplification of iap gene.
Following the PCR, the amplification products were subjected to gel electrophoresis using a
1% (w/v) agarose gel and detected by staining in ethidum bromide solution (0.5 μg/ml) for 30
– 40 min (Cocolin et al., 2002). The gels were rinsed in water or TAE buffer to remove
excess dye on the gel, and were visualized under the SYNGENE Gel documentation/ Bio-
imaging system (Syngene UK).
Organism Primer Sequence(5′-3′) Product size (bp)
References
Listeria spp. List-Universal1 ATGTCATGGAATAA 457-610 Cocolin et al. (2002) List-Universal2 GCTTTTCCAAGGTGTTTTT
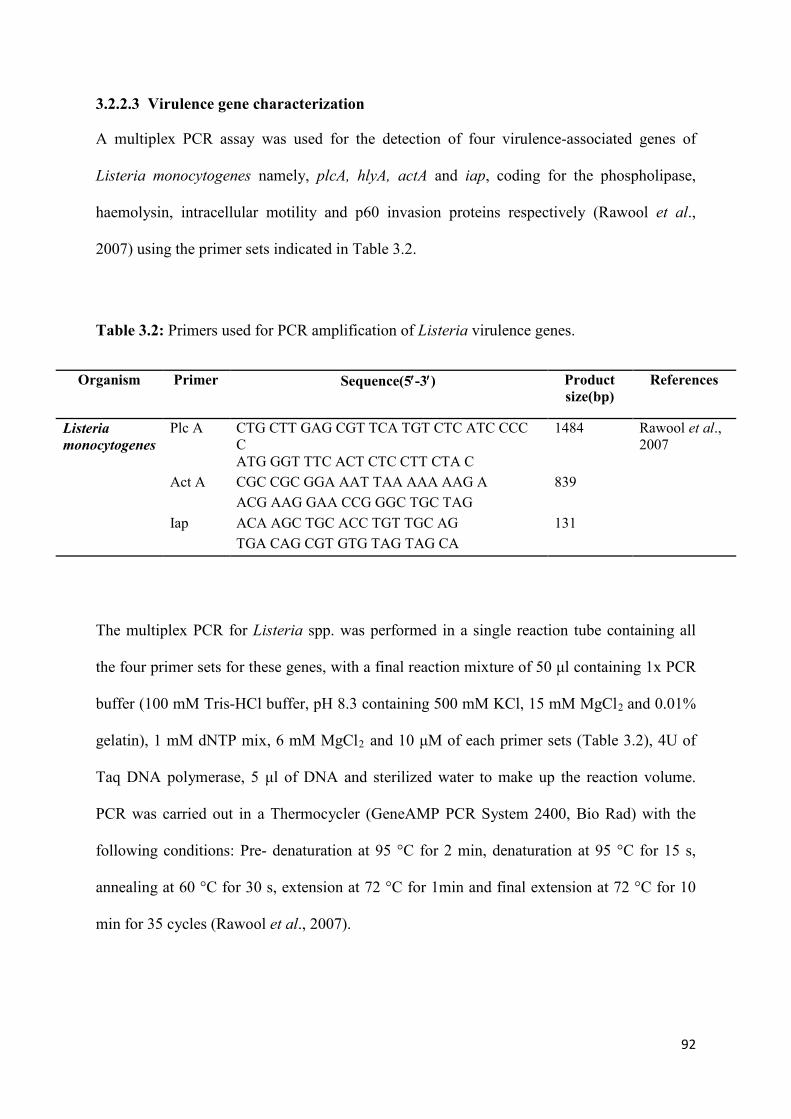
92
3.2.2.3 Virulence gene characterization
A multiplex PCR assay was used for the detection of four virulence-associated genes of
Listeria monocytogenes namely, plcA, hlyA, actA and iap, coding for the phospholipase,
haemolysin, intracellular motility and p60 invasion proteins respectively (Rawool et al.,
2007) using the primer sets indicated in Table 3.2.
Table 3.2: Primers used for PCR amplification of Listeria virulence genes.
The multiplex PCR for Listeria spp. was performed in a single reaction tube containing all
the four primer sets for these genes, with a final reaction mixture of 50 μl containing 1x PCR
buffer (100 mM Tris-HCl buffer, pH 8.3 containing 500 mM KCl, 15 mM MgCl2 and 0.01%
gelatin), 1 mM dNTP mix, 6 mM MgCl2 and 10 μM of each primer sets (Table 3.2), 4U of
Taq DNA polymerase, 5 μl of DNA and sterilized water to make up the reaction volume.
PCR was carried out in a Thermocycler (GeneAMP PCR System 2400, Bio Rad) with the
following conditions: Pre- denaturation at 95 °C for 2 min, denaturation at 95 °C for 15 s,
annealing at 60 °C for 30 s, extension at 72 °C for 1min and final extension at 72 °C for 10
min for 35 cycles (Rawool et al., 2007).
Organism Primer Sequence(5′-3′) Product size(bp)
References
Listeria monocytogenes
Plc A CTG CTT GAG CGT TCA TGT CTC ATC CCC C
1484 Rawool et al., 2007
ATG GGT TTC ACT CTC CTT CTA C Act A CGC CGC GGA AAT TAA AAA AAG A 839 ACG AAG GAA CCG GGC TGC TAG Iap ACA AGC TGC ACC TGT TGC AG 131 TGA CAG CGT GTG TAG TAG CA
93
3.2.3 Antimicrobial resistance profile analyses
The Kirby Bauer Disk diffusion method (CLSI, 2005) was used to determine the antibiotic
resistance profile of Listeria spp. isolates. The isolates were screened against a predetermined
panel of 24 antibiotics belonging to 14 different classes (Table 3.3). Cultures were grown for
24 h in Luria–Bertani broth and thereafter standardized to 0.5 McFarland standard (OD 625nm
= 0.1- 0.8) using a spectrophotometer (Biochrom, Libras), before spreading on Mueller-
Hinton agar plates using sterile swabs. The plates were then dried at room temperature for 45
min before placing the discs on the plates at equidistance. The plates were incubated for 24 h
at 37 °C (CLSI, 2005). Zones of clearance surrounding each disk were used to determine the
level of susceptibility or resistance, and were scored based on the CLSI (CLSI, 2005)
standards. The results were interpreted according to CLSI standards for Escherichia Coli
ATCC 25922 due to lack of specific standards for Listeria species (Zuraini et al., 2001).
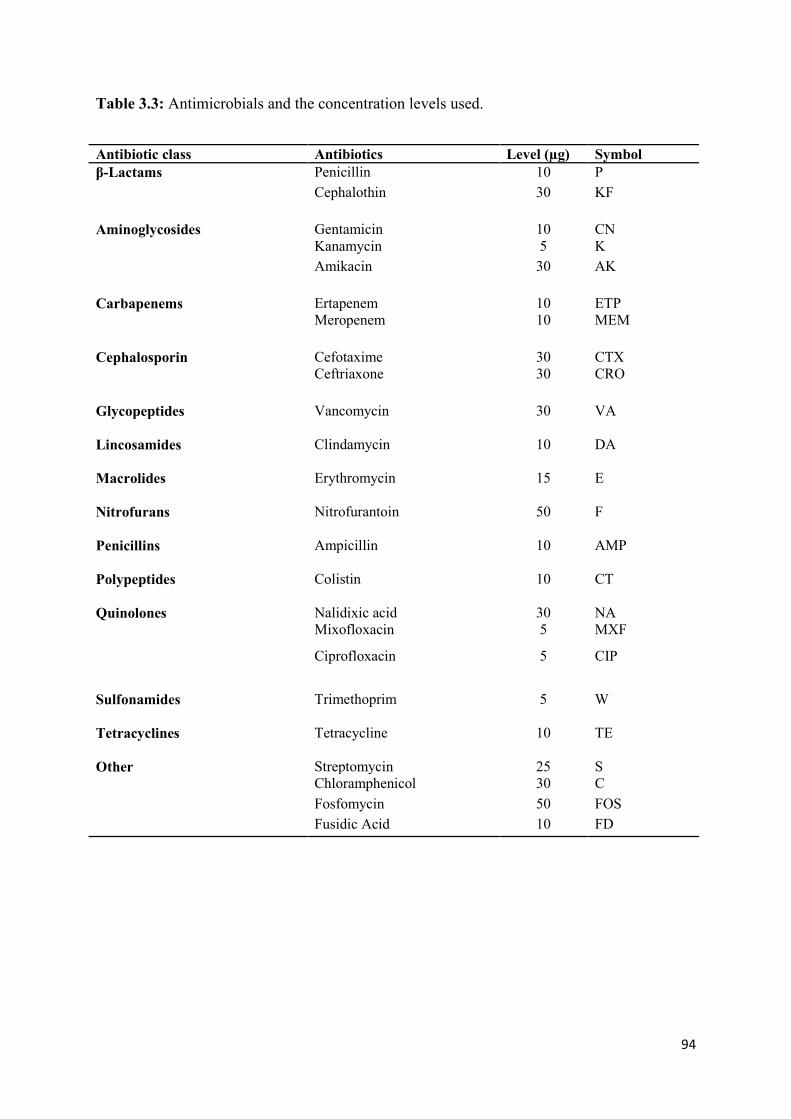
94
Table 3.3: Antimicrobials and the concentration levels used.
Antibiotic class Antibiotics Level (µg) Symbol β-Lactams Penicillin 10 P
Cephalothin 30 KF Aminoglycosides
Gentamicin
10
CN
Kanamycin 5 K Amikacin 30 AK
Carbapenems
Ertapenem
10
ETP
Meropenem 10 MEM Cephalosporin
Cefotaxime
30
CTX
Ceftriaxone 30 CRO Glycopeptides
Vancomycin
30
VA
Lincosamides
Clindamycin
10
DA
Macrolides
Erythromycin
15
E
Nitrofurans
Nitrofurantoin
50
F
Penicillins
Ampicillin
10
AMP
Polypeptides
Colistin
10
CT
Quinolones
Nalidixic acid
30
NA
Mixofloxacin 5 MXF
Ciprofloxacin 5 CIP
Sulfonamides
Trimethoprim
5
W
Tetracyclines
Tetracycline
10
TE
Other
Streptomycin
25
S
Chloramphenicol 30 C Fosfomycin 50 FOS Fusidic Acid 10 FD
95
3.2.4 Protease, gelatinase and haemolysin assay
Protease activity was assayed by spreading Listeria strains on nutrient agar containing 1.5%
skim milk. After incubation at 30°C for 72 h, the production of protease was shown by the
formation of a clear zone caused by casein degradation. Gelatinase production was
determined using LB agar containing gelatine (30 g/L), the plates were incubated at 30°C for
24 h and cooled for 5 h at 4°C. The appearance of turbid halos around the colonies was
considered positive for gelatinase production (Sechi et al., 2002). Haemolysin production was
assayed by culturing each strain on human blood agar at 30°C for 24 h. The production of
haemolysin was observed by the formation of a clear zone caused by β-haemolysis activity of
the enzyme on the blood (modified from Sechi et al., 2002).
3.3 Results
3.3.1 Identification of the presumptive Listeria spp. isolates
Based on the biochemical tests listed under section 3.2.1., isolates were confirmed as either
negative or positive. Oxidase negative, catalase positive and Methyl red and Voges-Proskauer
positive tested organisms were further confirmed using PCR. The resulting PCR
amplification products with the expected sizes (457-610 bp, commonly 457 bp) of the
universal conserved iap gene regions in the Listeria spp. isolates are shown in Figure 3.1. A
total of 78 Listeria spp. isolates obtained from the FE (23.08%), DP (35.90%), US (20.81%)
and DS (19.23%) sampling points were confirmed and identified as Listeria species.
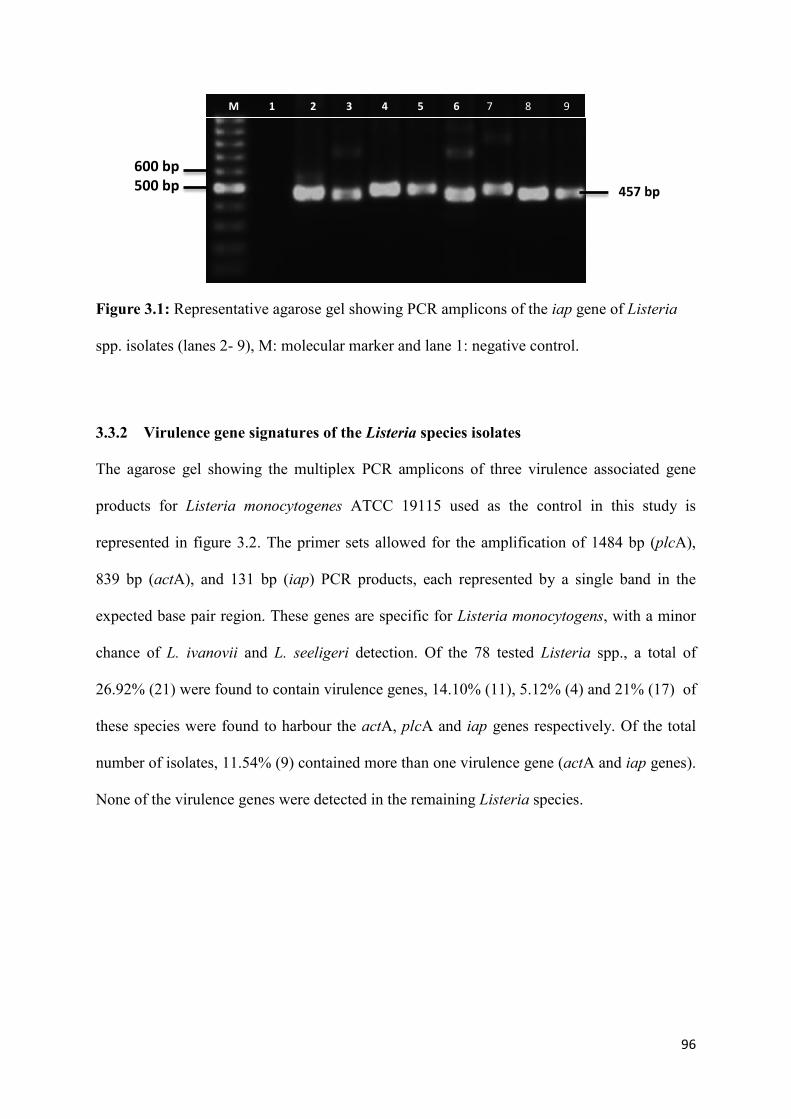
96
Figure 3.1: Representative agarose gel showing PCR amplicons of the iap gene of Listeria
spp. isolates (lanes 2- 9), M: molecular marker and lane 1: negative control.
3.3.2 Virulence gene signatures of the Listeria species isolates
The agarose gel showing the multiplex PCR amplicons of three virulence associated gene
products for Listeria monocytogenes ATCC 19115 used as the control in this study is
represented in figure 3.2. The primer sets allowed for the amplification of 1484 bp (plcA),
839 bp (actA), and 131 bp (iap) PCR products, each represented by a single band in the
expected base pair region. These genes are specific for Listeria monocytogens, with a minor
chance of L. ivanovii and L. seeligeri detection. Of the 78 tested Listeria spp., a total of
26.92% (21) were found to contain virulence genes, 14.10% (11), 5.12% (4) and 21% (17) of
these species were found to harbour the actA, plcA and iap genes respectively. Of the total
number of isolates, 11.54% (9) contained more than one virulence gene (actA and iap genes).
None of the virulence genes were detected in the remaining Listeria species.
M 1 2 3 4 5 6 7 8 9
600 bp 500 bp 457 bp
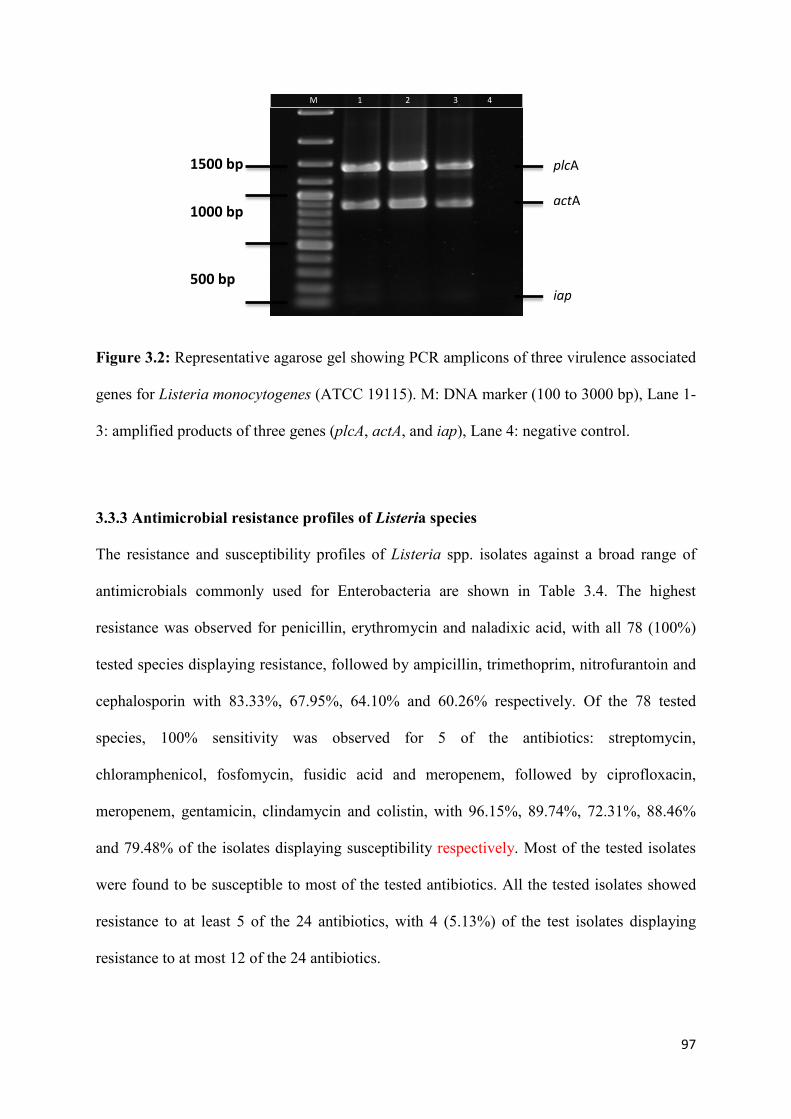
97
Figure 3.2: Representative agarose gel showing PCR amplicons of three virulence associated
genes for Listeria monocytogenes (ATCC 19115). M: DNA marker (100 to 3000 bp), Lane 1-
3: amplified products of three genes (plcA, actA, and iap), Lane 4: negative control.
3.3.3 Antimicrobial resistance profiles of Listeria species
The resistance and susceptibility profiles of Listeria spp. isolates against a broad range of
antimicrobials commonly used for Enterobacteria are shown in Table 3.4. The highest
resistance was observed for penicillin, erythromycin and naladixic acid, with all 78 (100%)
tested species displaying resistance, followed by ampicillin, trimethoprim, nitrofurantoin and
cephalosporin with 83.33%, 67.95%, 64.10% and 60.26% respectively. Of the 78 tested
species, 100% sensitivity was observed for 5 of the antibiotics: streptomycin,
chloramphenicol, fosfomycin, fusidic acid and meropenem, followed by ciprofloxacin,
meropenem, gentamicin, clindamycin and colistin, with 96.15%, 89.74%, 72.31%, 88.46%
and 79.48% of the isolates displaying susceptibility respectively. Most of the tested isolates
were found to be susceptible to most of the tested antibiotics. All the tested isolates showed
resistance to at least 5 of the 24 antibiotics, with 4 (5.13%) of the test isolates displaying
resistance to at most 12 of the 24 antibiotics.
1500 bp
1000 bp
500 bp
plcA
actA
iap
M 1 2 3 4
98
The antibiotic resistance index (ARI) for the Listeria spp. ranged between 0.13 (resistance to
3 test antibiotics) – 0.5 (resistance to 12 of the test antibiotics). The multidrug resistance
patterns of the Listeria spp. as shown in Table 3.5, revealed that at least 1 (1.28%) of the
isolates was found to be resistant to 3-4 antibiotic classes, with most of the multidrug
resistant organisms being resistant to more than 5 and at most 11 antimicrobial classes. The
highest multidrug resistance patterns was observed in 3 (3.85%) of the total 78 isolates, being
resistant to 11 of the 24 tested antibiotics, followed by 5 (6.41%) which were resistant to 10
antibiotic classes. The highest percentage resistance was observed for 19 (24.36%) of the
tested Listeria spp. which were resistant to 9 antimicrobial classes, followed by 16 (20.51%)
and 12 (15.38%) isolates found to be resistant to 6 and 7 antimicrobial classes, respectively.
None of the Listeria species was found to be resistant to more than 11 antimicrobial classes.
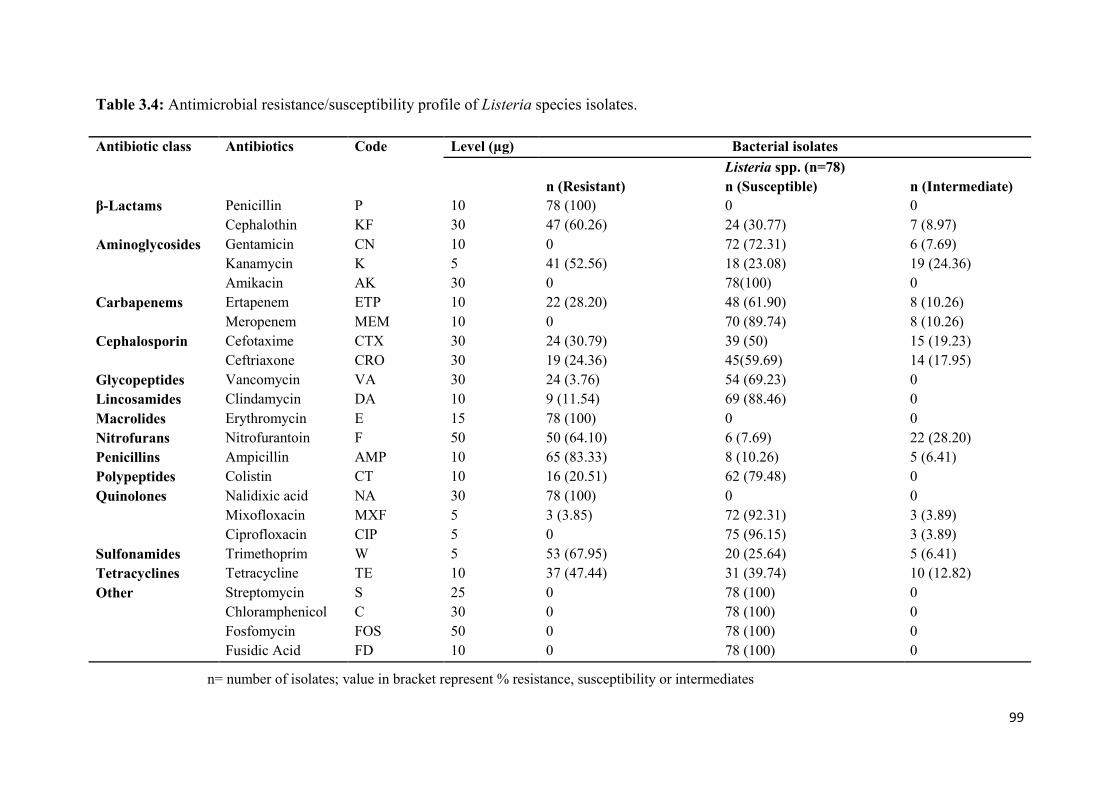
99
Table 3.4: Antimicrobial resistance/susceptibility profile of Listeria species isolates.
Antibiotic class
Antibiotics Code Level (µg) Bacterial isolates Listeria spp. (n=78) n (Resistant) n (Susceptible) n (Intermediate)
β-Lactams Penicillin P 10 78 (100) 0 0 Cephalothin KF 30 47 (60.26) 24 (30.77) 7 (8.97)
Aminoglycosides Gentamicin CN 10 0 72 (72.31) 6 (7.69) Kanamycin K 5 41 (52.56) 18 (23.08) 19 (24.36) Amikacin AK 30 0 78(100) 0
Carbapenems Ertapenem ETP 10 22 (28.20) 48 (61.90) 8 (10.26) Meropenem MEM 10 0 70 (89.74) 8 (10.26)
Cephalosporin Cefotaxime CTX 30 24 (30.79) 39 (50) 15 (19.23) Ceftriaxone CRO 30 19 (24.36) 45(59.69) 14 (17.95)
Glycopeptides Vancomycin VA 30 24 (3.76) 54 (69.23) 0 Lincosamides Clindamycin DA 10 9 (11.54) 69 (88.46) 0 Macrolides Erythromycin E 15 78 (100) 0 0 Nitrofurans Nitrofurantoin F 50 50 (64.10) 6 (7.69) 22 (28.20) Penicillins Ampicillin AMP 10 65 (83.33) 8 (10.26) 5 (6.41) Polypeptides Colistin CT 10 16 (20.51) 62 (79.48) 0 Quinolones Nalidixic acid NA 30 78 (100) 0 0
Mixofloxacin MXF 5 3 (3.85) 72 (92.31) 3 (3.89) Ciprofloxacin CIP 5 0 75 (96.15) 3 (3.89)
Sulfonamides Trimethoprim W 5 53 (67.95) 20 (25.64) 5 (6.41) Tetracyclines Tetracycline TE 10 37 (47.44) 31 (39.74) 10 (12.82) Other
Streptomycin S 25 0 78 (100) 0 Chloramphenicol C 30 0 78 (100) 0 Fosfomycin FOS 50 0 78 (100) 0 Fusidic Acid FD 10 0 78 (100) 0
n= number of isolates; value in bracket represent % resistance, susceptibility or intermediates
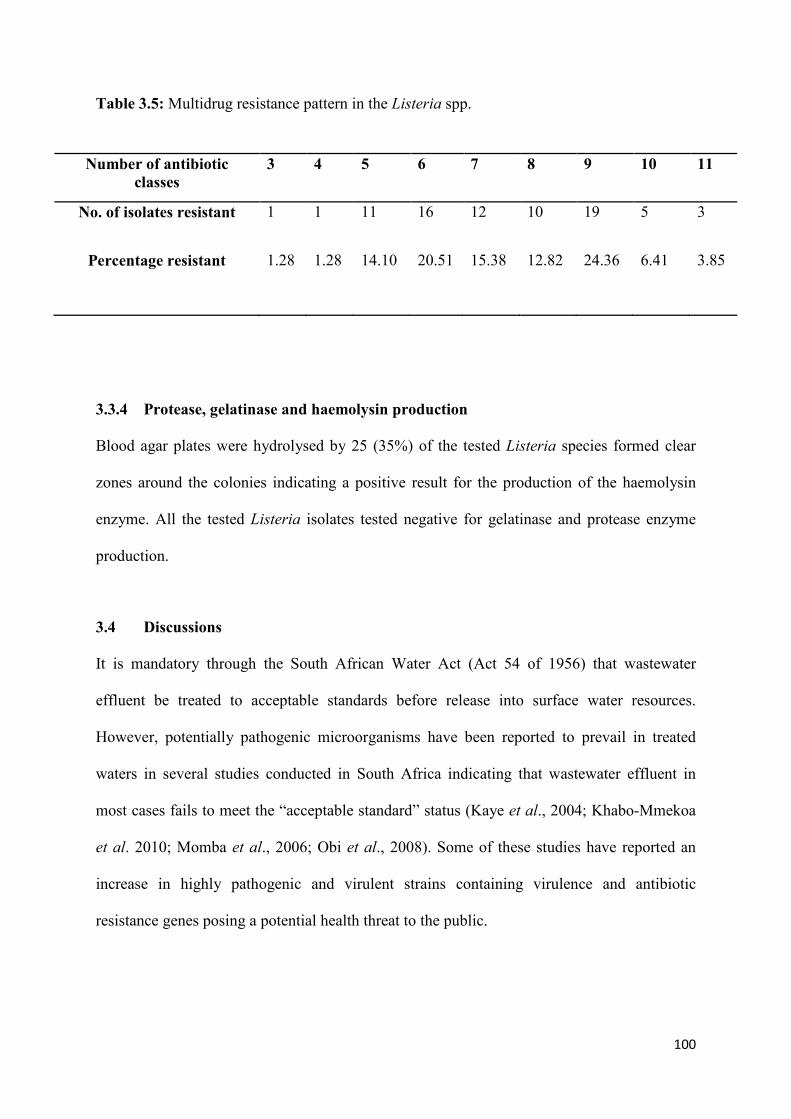
100
Table 3.5: Multidrug resistance pattern in the Listeria spp.
3.3.4 Protease, gelatinase and haemolysin production
Blood agar plates were hydrolysed by 25 (35%) of the tested Listeria species formed clear
zones around the colonies indicating a positive result for the production of the haemolysin
enzyme. All the tested Listeria isolates tested negative for gelatinase and protease enzyme
production.
3.4 Discussions
It is mandatory through the South African Water Act (Act 54 of 1956) that wastewater
effluent be treated to acceptable standards before release into surface water resources.
However, potentially pathogenic microorganisms have been reported to prevail in treated
waters in several studies conducted in South Africa indicating that wastewater effluent in
most cases fails to meet the “acceptable standard” status (Kaye et al., 2004; Khabo-Mmekoa
et al. 2010; Momba et al., 2006; Obi et al., 2008). Some of these studies have reported an
increase in highly pathogenic and virulent strains containing virulence and antibiotic
resistance genes posing a potential health threat to the public.
Number of antibiotic classes
3 4 5 6 7 8 9 10 11
No. of isolates resistant 1 1 11 16 12 10 19 5 3
Percentage resistant 1.28 1.28 14.10 20.51 15.38 12.82 24.36 6.41 3.85
101
In the current study, the presumptively identified Listeria species were subjected to a range of
biochemical tests and PCR methods for further confirmation, with results indicating that
potentially pathogenic Listeria species have the ability to bypass conventional wastewater
treatment processes. A similar study conducted by Odjadjare and Okoh (2010) reported on
the prevalence of Listeria species in wastewater effluent after tertiary treatment, leading to
the contamination of surrounding rivers in the Eastern Cape. There are currently no standards
in place to determine the acceptable limit of Listeria spp. in treated effluent in South Africa.
However, the “no risk limit” of 0 cfu/100 ml for faecal coliform recommended for domestic
water uses by the South African government (DWAF, 1996), was exceeded in this study.
This is of great concern considering that these emerging bacterial pathogens are in most cases
found present in the absence of common indicator microorganisms (fecal coliforms, total
coliforms and enterococci). The discovery of emerging pathogens in treated water, in the
absence of indicator organisms as observed in the study, indicates that the treatment
processes are not effective in efficient pathogen removal (Toze, 1997). The limited
information on Listeria related studies and their prevalence in wastewater, particularly in
South Africa could be due to the fact that Listeria species are still largely associated with
food associated infections (foodborne pathogen) as opposed to being fully recognised
waterborne pathogens (Paillard et al., 2005). Few studies which have been conducted have
reported similar results displaying a notable prevalence of Listeria species in treated effluent
(Al-Ghazali and Al-Azawi, 1988; 1988; Paillard et al., 2005; Odjadjare and Okoh, 2010;
Watkins and Sleath, 1981).
In this study, 14.10% (11), 5.12% (4) and (21%) 17 of the tested Listeria species were found
to harbour the actA, plcA and iap genes respectively, while no virulence genes were detected
in the remainder of the tested isolates. Based on previous findings reported by Rawool et al.
102
(2007), all the isolates containing the above listed virulence genes, could possibly be L.
monocytogenes, L. ivanovii and L. seeligeri. Results obtained in this study indicate a possible
presence of virulent Listeria strains, which could infect the users of these contaminated
waters. Although the use of primers specific for plcA, actA, hlyA and iap genes are reported
to be unique to pathogenic Listeria monocytogens (Furrer et al., 1991), the identity of the
Listeria species containing virulence genes cannot be accurately identified as common
pathogenic Liseria monocytogens, in agreement to a study conducted by Rawool et al.,
(2007) which indicated their detection in two other Listeria species. The remainder of the
Listeria species in this study can therefore not be completely disregarded as possible Listeria
monocytogenes strains considering that there is a possibility that some strains may lack one or
more virulence determinants due to genetic mutations (Cooray et al., 1994). The use of PCR
based methods is said to be insufficient at revealing the true pathogenic potential considering
that different Listeria monocytogene strains display different profiles (Rawool et al., 2007;
Shakuntala et al., 2006).
There is also limited information on the antibiotic resistance/susceptibility profiles of Listeria
species isolated from treated wastewater effluent, with most studies on the antimicrobial
susceptibility profiles of Listeria species focusing almost exclusively on clinical and/or food
isolates. The susceptibility patterns of Listeria spp. obtained in this study is similar to that
reported by Odjadjare and Okoh (2010), who tested 23 Listeria isolates against 20 antibiotics.
All the 23 Listeria species tested in that study were sensitive to 3 of the 20 test antibiotics
including amikacin (aminoglycosides), meropenem, and ertapenem (carbapenems) suggesting
that these antibiotics may be the best therapy in the event of listeriosis outbreak in South
Africa. Similar to the observation in this study, Hansen et al. (2005) reported complete
sensitivity of 106 Listeria species isolated from humans to meropenem, and moderate
103
sensitivity to gentamycin, chloramphenicol, and tetracycline, while Safdar and Armstrong
(2003) observed 100% sensitivity to amikacin and ciprofloxacin. Odjadjare and Okoh (2010)
also reported complete sensitivity to the three antibiotics by all Listeria species isolated from
chlorinated wastewater effluent. None of the isolates were resistant to erythromycin and
penicillin. These results are similar to the results obtained in other studies looking at Listeria
species (Abuin et al., 1994; Conter, et al., 2009; Safdar and Armstrong, 2003; Zhang et al.,
2007). Contrary to the results obtained in this study, Odjadjare and Okoh (2010) observed
resistance to the above mentioned antibiotics among the tested species. In general, L.
monocytogenes, as well as other strains of Listeria spp., are susceptible to a wide range of
antibiotics (Adetunji and Isola, 2011), however a notable increased resistance has been
observed over the past couple of years (Marian et al., 2012). Studies have also described the
transfer, by conjugation of enterococcal and streptococcal plasmids and transposons carrying
antibiotic resistance genes from Enterococcus-Streptococcus to Listeria and between species
of Listeria (Charpentier and Courvalin, 1999). Listeria monocytogenes may acquire or
transfer antibiotic resistance gene from mobile genetic elements such as self-transferable and
mobilizable plasmids and conjugative transposons or mutational events in chromosomal
genes (Steve et al., 2009).
High sensitivity levels towards the β-Lactams (penicillins, cephalothins) and penicillins have
been reported in literature, and are therefore considered as the main treatment drug for
listeriosis (Abuin et al., 1994; Conter et al., 2009; Hansen et al., 2005; Zuraini et al., 2011;
Zhang et al., 2007). In Contrast, results obtained in this study revealed high resistance levels
towards the β-Lactams: 100%, 60.26% and 83.33% resistance to penicillin, cephalothin, and
ampicillin, respectively. Similarly, Srinivasan et al. (2005) reported 92% and 40% resistance
against ampicillin and penicillin G respectively, for L. monocytogenes strains isolated from
104
dairy farms. Arslan and Ozdemir (2008) also reported resistance against ampicillin (2.1 %)
and penicillin (12.8 %) in strains of Listeria species isolated from white cheese. A study by
Odjadjare and Okoh (2010) reported a high level of resistance to ampicillin (71%) and
penicillin G (64%) by the Listeria isolates. The sudden occurrence of high level of resistance
in Listeria spp. towards ampicillin and penicillin G may be attributed to their frequent use for
most manifestations of listeriosis, which remain the first choice antibiotics (Steve et al.,
2009). A dual combination of trimetroprim and mostly sulfamethoxazole is considered to be a
second-choice therapy for listeriosis infection especially in patients allergic to penicillin
(Mauro et al., 2008).
The physical and chemical properties of the wastewater effluent could largely influence the
level of resistance displayed by the Listeria species isolated in this study. It has been widely
reported that conventional wastewater treatment plants are unable to effectively remove
antimicrobials such as antibiotics as well as a number of other chemicals from wastewater,
thereby increasing the chances of bacterial pathogens resident in such wastewater effluent to
acquire resistance to commonly used antibiotics due to selective pressures (Giger et al., 2003;
Kummerer, 2003; Volkmann et al., 2004). Medical and pharmaceutical discharge from
hospitals has largely contributed largely to the increase in antibiotic concentration and
therefore has led to the rise of highly resistant bacterial populations (Naviner et al., 2011).
Wastewater treatment plants have therefore been considered as a rich reservoir of antibiotic
and multidrug resistant organisms since the antibiotics ingested by humans are not
completely processed by the body. Some of these antibiotics are expelled as waste and wind
up at wastewater treatment plants (Jury et al., 2010; Adetunji and Isola, 2011). Rivers
contaminated with urban and agricultural effluent have shown to have greater antibiotic
resistant bacterial populations than areas upstream of the contamination source (Falcão et al.,
105
2004). Antibiotic resistance in streams is also indirectly selected for by an increase in
industrial wastes containing heavy metals. This could explain the findings of this study since
this supports the observations of this study, both wastewater treatment plants investigated are
surrounded by industrial areas, receiving wastes containing carcinogenic heavy metals and
toxic chemicals. Multiple drug resistance in Listeria species have also been attributed to
antimicrobial selective pressure and gene transfer between and amongst Listeria species and
closely related bacteria such as Enterococcus, Streptococcus and Staphylococcus species
(Safdar and Armstrong, 2003). Recent findings suggest an increase in the percentage of
multi-antibiotic resistance over the last few years (Ebrahim et al., 2010; Zuraini et al., 2001;
Mauro et al., 2008; Pesavento et al., 2010). It is therefore not surprising that a high
prevalence of multi-antibiotic resistance was observed among the Listeria spp. in this study.
The presence of Listeria spp. in the discharged wastewater effluent therefore cannot be
monitored (Bartie et al., 2002) leading to their untracked release into the environment,
contaminating fresh water sources, which are easily accessible to surrounding rural
communities. This would cause a health hazard for consumers who use the contaminated
water for other domestic purposes. Listeria species in this study were found to be resistant to
a range of antibiotics, some of which are traditionally used in treatment or control of
infections, such as the ampicillins. This would be highly problematic if an outbreak had to
occur since some of the Listeria species were also multidrug resistant. This is especially
worrisome in a province with a high number of immunocompromised individuals due to the
extremely high HIV and TB, increasing their infection potential. The presence of virulence
genes also indicates that these isolates could potentially be pathogenic Listeria monocytogens
strains which in history have been reported in a number of worldwide infection studies. This
could also raise alarms and questions regarding the safety of South African fruit and

106
vegetable, since most farmers still depend on treated wastewater effluent, as irrigation water
for their crops. The lack of information and previous literature regarding the prevalence and
survival of Listeria species in South African wastewaters and fresh water sources coupled by
the limited reports on occurrence and outbreaks in the country indicates a vast research area
which needs to be investigated.
107
CHAPTER FOUR
ANTIMICROBIAL RESISTANCE AND VIRULENCE SIGNATURES OF
AEROMONAS SPECIES RECOVERED FROM TREATED WASTEWATER
EFFLUENT AND RECEIVING SURFACE WATER
4.1 Introduction
In recent history, Aeromonas species have been implicated or associated with numerous
animal and human diseases (Igbinosa et al., 2012; Obi et al., 2008). They have grown in
importance, both as food and waterborne pathogens, receiving much research attention, since
the discovery of Aeromonads and their implication in gastrointestinal diseases (Ansari et al.,
2011; Ghenghesh et al, 2008; Holmberg, 1986). Seven Aeromonas spp., (A. hydrophila, A.
caviae, A. veronii biovar sobria, A. veronii biovar veronii, A. jandaei, A. trota, and A.
schubertii) are currently recognized as human pathogens (Obi et al., 2007).
Aeromonads are rod shaped, Gram negative, non-spore forming psychrophilic or mesophilic
bacteria which are found and widely distributed in soil and mostly aquatic (fresh, marine,
estuarian) environments. They are easily differentiated by the oxidase test from other related
genus groups, such as Vibrio and Enterobacteriacea which were previously thought to belong
to the same genus classification. They are mostly opportunistic microorganisms, mainly
affecting individuals with reduced or compromised immunity, children and the elderly.
Aeromonas spp. have been widely reported in diarrheal diseases based on their common
discovery in faecal samples of patients suffering from diarrhoea and other gastrointestinal
diseases (Igbinosa et al., 2012; Vila et al., 2003). Aeromonas infections cause gastroenteritis
in healthy individuals, and may results in primary or secondary septicaemia in immuno-
compromised individuals (Di Pinto et al., 2012). Red sore disease, water associated wound
108
infections (skin and soft tissue infections), eye infection, meningitis and pneumonia as well
as bone and joint enteritis are some of the Aeromonas associated infections, amongst many
other infections (Sartory et al., 1996). Clinical syndromes inevitably arise in immuno-
compromised patients. Aeromonas spp. have previously been isolated from patients with
diarrhoea in the absence of other enteropathogens, but its association with gastroenteritis
remains unknown (Vila et al., 2003). Septicaemia is also often connected to other underlying
diseases such as leukaemia, cirrhosis, meningitis, peritonitis, and endocarditis urinary tract
and surgical wound infections, and a strong link has been established with Aeromonas
infections (Bravo et al., 2003). Motile Aeromonas species which are usually responsible for
human infections grow at optimum temperatures between 35 - 37 °C, while non-motile
species that usually infect fish grow optimally at lower temperatures between 22 - 28 °C.
These two groups can easily be differentiated by the different growth temperatures, as well as
the indole production test (Joseph and Carnahan, 2000). All Aeromonas species have the
ability to grow between 4.5 - 9 pH levels (Isonhood and Drake, 2002).
Inadequately treated wastewater effluent transports these emerging pathogenic species to
open water sources, posing a threat to man and animals which come into contact with the
contaminated waters (Igbinosa and Okoh, 2012). They are also found in high numbers both
before and after sewage treatment, and have for a while been proposed as potential indicators
of faecal contamination, because of their constant detection even in the absence of traditional
indicator organisms (EPA, 2009; Toze, 1997; Vila et al., 2003). These organisms also have
the ability to produce a wide range of extracellular enzymes, which are often linked to their
pathogenic characteristics. These include enterotoxins, proteases, haemolysins etc. which are
the main components playing a major role in the establishment of disease, as well as in
initiating host infection processes (Igbinosa and Okoh, 2013; Gavin et al., 2003; Trower et
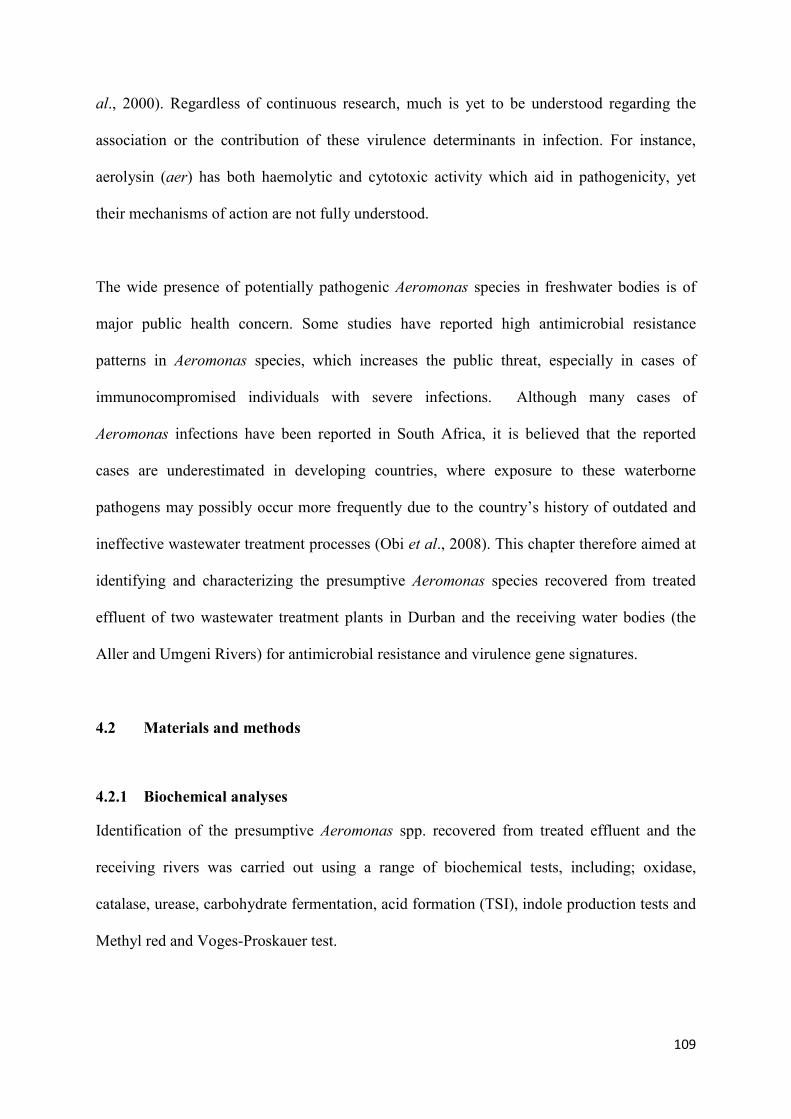
109
al., 2000). Regardless of continuous research, much is yet to be understood regarding the
association or the contribution of these virulence determinants in infection. For instance,
aerolysin (aer) has both haemolytic and cytotoxic activity which aid in pathogenicity, yet
their mechanisms of action are not fully understood.
The wide presence of potentially pathogenic Aeromonas species in freshwater bodies is of
major public health concern. Some studies have reported high antimicrobial resistance
patterns in Aeromonas species, which increases the public threat, especially in cases of
immunocompromised individuals with severe infections. Although many cases of
Aeromonas infections have been reported in South Africa, it is believed that the reported
cases are underestimated in developing countries, where exposure to these waterborne
pathogens may possibly occur more frequently due to the country’s history of outdated and
ineffective wastewater treatment processes (Obi et al., 2008). This chapter therefore aimed at
identifying and characterizing the presumptive Aeromonas species recovered from treated
effluent of two wastewater treatment plants in Durban and the receiving water bodies (the
Aller and Umgeni Rivers) for antimicrobial resistance and virulence gene signatures.
4.2 Materials and methods
4.2.1 Biochemical analyses
Identification of the presumptive Aeromonas spp. recovered from treated effluent and the
receiving rivers was carried out using a range of biochemical tests, including; oxidase,
catalase, urease, carbohydrate fermentation, acid formation (TSI), indole production tests and
Methyl red and Voges-Proskauer test.

110
4.2.2 Molecular analyses
Polymerase chain reaction (PCR) was used to amplify and detect the presence of specific
conserved sequences (gyrB gene) which code for the β-subunit of DNA gyrase in each of the
presumptive Aeromonas species isolates, using specific Aeromonas gyrase primers for further
identification.
4.2.2.1 DNA isolation
Genomic DNA was isolated from biochemically identified Aeromonas species using the
boiling method (Lin et al., 1996; Yàñez et al., 2003). One colony from a 24 h culture was
suspended in a micro-centrifuge tube containing 70 μl sterile distilled water. The culture and
water mixtures were vortexed at high speed for 1 min and heated to 100 °C for 10 min in a
water bath, to lyse the cells and thereafter cooled to room temperature. The tubes were
vortexed again prior to centrifugation at 13 000 rpm for 5 min and the supernatant was
transferred to a sterile tube and used as template in the PCR assay.
4.2.2.2 PCR amplification of gyrB of Aeromonas species
The PCR amplification of the gyrB gene was performed in a thermal cycler (GeneAMP PCR
System 2400, Bio Rad) using forwards and reverse primers (gyrB3F:
TCCGGCGGTCTGCACGGCGT, gyrB14R: TTGTCCGGGTTGTACTCGTC) with an expected
product size of 1100 base pairs (Huddleston et al. 2006; Yàñez et al. 2003). The following PCR
conditions were applied: Pre-denaturation at 94 °C for 2 min, denaturation at 93 °C for 30
sec, annealing at 62 °C for 30 sec and extension at 72 °C for 1 min for 30 cycles (Huddleston
et al., 2006). PCR was performed in a final volume of 50 µl containing 50 mM KCl, 10mM
Tris/HCl (pH 9), 1.5 mM MgCl2, 0.2 mM dNTPs , 1U Taq DNA polymerase , 20 pmol of
each primer and 1 µl of the extracted DNA sample (Yàñez et al., 2003). Aeromonas caviae

111
ATCC 15468 and Aeromonas hydrophila ATCC 7965 strain were used as positive controls in
all PCR assays. Following PCR, the amplification products were subjected to gel
electrophoresis using a 1% (w/v) agarose gel and detected by staining in ethidum bromide
solution (0.5 μg/ml) for 30 – 40 min (Cocolin et al., 2002). The gels were rinsed in water or
TAE buffer to remove excess dye on the gel and visualized under the SYNGENE Gel
documentation/ Bio-imaging system (Syngene UK).
4.2.2.3 Virulence gene characterization
A monoplex PCR was used for the detection of two virulence-associated genes of Aeromonas
species namely, aer and lip, coding for the aerolysin and lipase enzymes, respectively, using
the primer sets indicated in Table 4.1
Table 4.1 Primers used for PCR amplification of Aeromonas virulence genes.
The monoplex reactions were carried out in a total volume of 25 µl, containing 12.5 µl of the
PROMEGA G2 Go taq green master mix (ANATECH), 5 μl of isolated genomic DNA and
sterile double distilled water to make up the reaction volume. PCR was carried out in a
Thermocycler (GeneAMP PCR System 2400, Bio Rad) with the following conditions,
Aerolysin (aer): Pre-denaturation at 94 °C for 2 min, denaturation at 94 °C for 30 s,
annealing at 64 °C for 50 s and extension at 72 °C for 10 min for 35 cycles. The Lipase (lip)
Organism Primer Sequence(5′-3′) Product size(bp)
References
Aeromonas spp. aer-F CCTATGGCCTGAGCGAGAAG 431 Igbinosa et al., 2013 aer-R CCAGTTCCAGTCCCACCACT
lip-F
CA(C/T)CTGGT(T/G)CCGCTCAAG
247
lip-R GT(A/G)CCGAACCAGTCGGAGAA
112
gene: Pre-denaturation at 94 °C for 2 min, denaturation at 94 °C for 30 s, annealing at 59 °C
for 50 s and extension at 72 °C for 10 min for 35 cycles (Igbinosa et al., 2013).
4.2.3 Antimicrobial resistance profile analyses
The Kirby Bauer Disk diffusion method as explained in the previous chapter was used to
determine the antibiotic resistance profile of Aeromonas spp. isolates. The isolates were
screened against a predetermined panel of 24 antibiotics belonging to 14 different classes
(Listed in Table 3.3 of the previous chapter). The results were interpreted according to CLSI
standards for Escherichia coli ATCC 25922.
4.2.4 Protease, gelatinase and haemolysin assay
Protease activity was assayed by spreading cultures of Aeromonas strains on nutrient agar
containing 1.5% skim milk. After incubation at 30°C for 72 h, the production of protease was
shown by the formation of a clear zone caused by casein degradation. Gelatinase production
was determined using LB agar containing gelatine (30 g/L), the plates were incubated at 30°C
for 24 h and cooled for 5 h at 4°C. The appearance of turbid halos around the colonies was
considered positive for gelatinase production (Sechi et al., 2002). Haemolysin production was
assayed by culturing each strain on human blood agar at 30°C for 24 h. The production of
haemolysin was observed by the formation of a clear zone caused by β-haemolysis activity of
the enzyme on the blood using a modified method of Sechi et al. (2002).
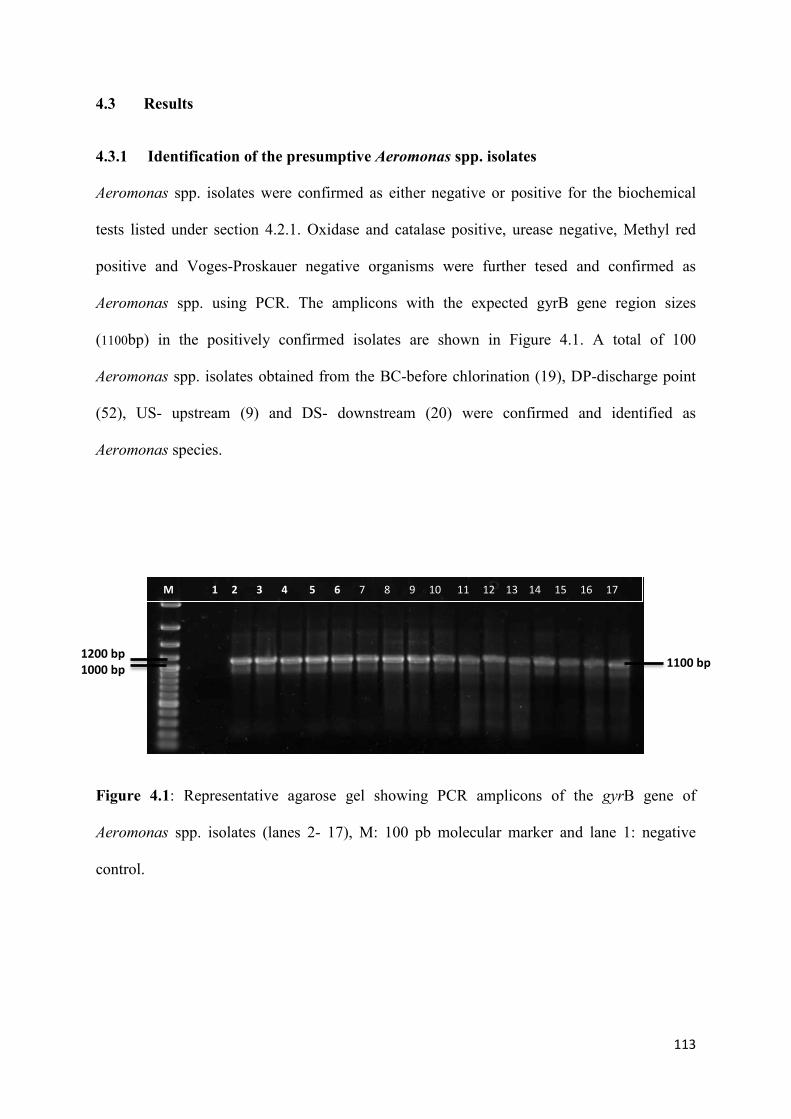
113
4.3 Results
4.3.1 Identification of the presumptive Aeromonas spp. isolates
Aeromonas spp. isolates were confirmed as either negative or positive for the biochemical
tests listed under section 4.2.1. Oxidase and catalase positive, urease negative, Methyl red
positive and Voges-Proskauer negative organisms were further tesed and confirmed as
Aeromonas spp. using PCR. The amplicons with the expected gyrB gene region sizes
(1100bp) in the positively confirmed isolates are shown in Figure 4.1. A total of 100
Aeromonas spp. isolates obtained from the BC-before chlorination (19), DP-discharge point
(52), US- upstream (9) and DS- downstream (20) were confirmed and identified as
Aeromonas species.
Figure 4.1: Representative agarose gel showing PCR amplicons of the gyrB gene of
Aeromonas spp. isolates (lanes 2- 17), M: 100 pb molecular marker and lane 1: negative
control.
M 1 2 3 4 5 6 7 8 9 10 11 12 13 14 15 16 17
1200 bp 1000 bp 1100 bp
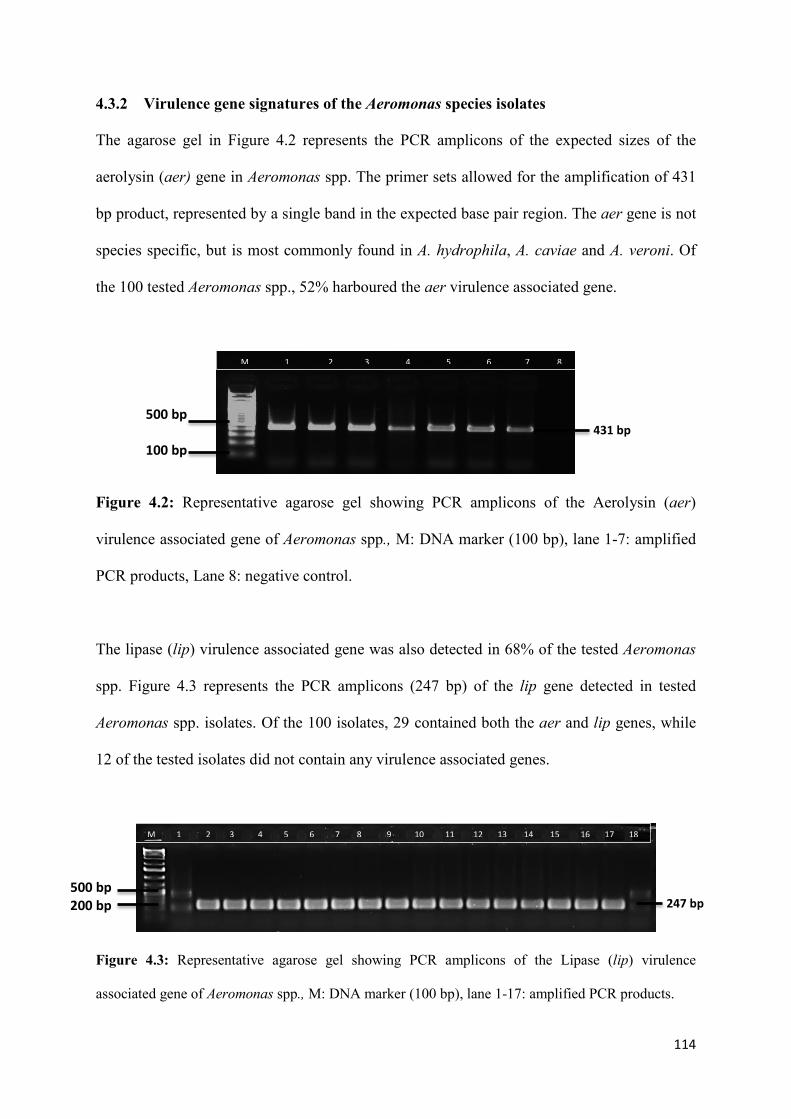
114
4.3.2 Virulence gene signatures of the Aeromonas species isolates
The agarose gel in Figure 4.2 represents the PCR amplicons of the expected sizes of the
aerolysin (aer) gene in Aeromonas spp. The primer sets allowed for the amplification of 431
bp product, represented by a single band in the expected base pair region. The aer gene is not
species specific, but is most commonly found in A. hydrophila, A. caviae and A. veroni. Of
the 100 tested Aeromonas spp., 52% harboured the aer virulence associated gene.
Figure 4.2: Representative agarose gel showing PCR amplicons of the Aerolysin (aer)
virulence associated gene of Aeromonas spp., M: DNA marker (100 bp), lane 1-7: amplified
PCR products, Lane 8: negative control.
The lipase (lip) virulence associated gene was also detected in 68% of the tested Aeromonas
spp. Figure 4.3 represents the PCR amplicons (247 bp) of the lip gene detected in tested
Aeromonas spp. isolates. Of the 100 isolates, 29 contained both the aer and lip genes, while
12 of the tested isolates did not contain any virulence associated genes.
Figure 4.3: Representative agarose gel showing PCR amplicons of the Lipase (lip) virulence
associated gene of Aeromonas spp., M: DNA marker (100 bp), lane 1-17: amplified PCR products.
500 bp 100 bp
M 1 2 3 4 5 6 7 8
M 1 2 3 4 5 6 7 8 9 10 11 12 13 14 15 16 17 18
500 bp 200 bp
431 bp
247 bp
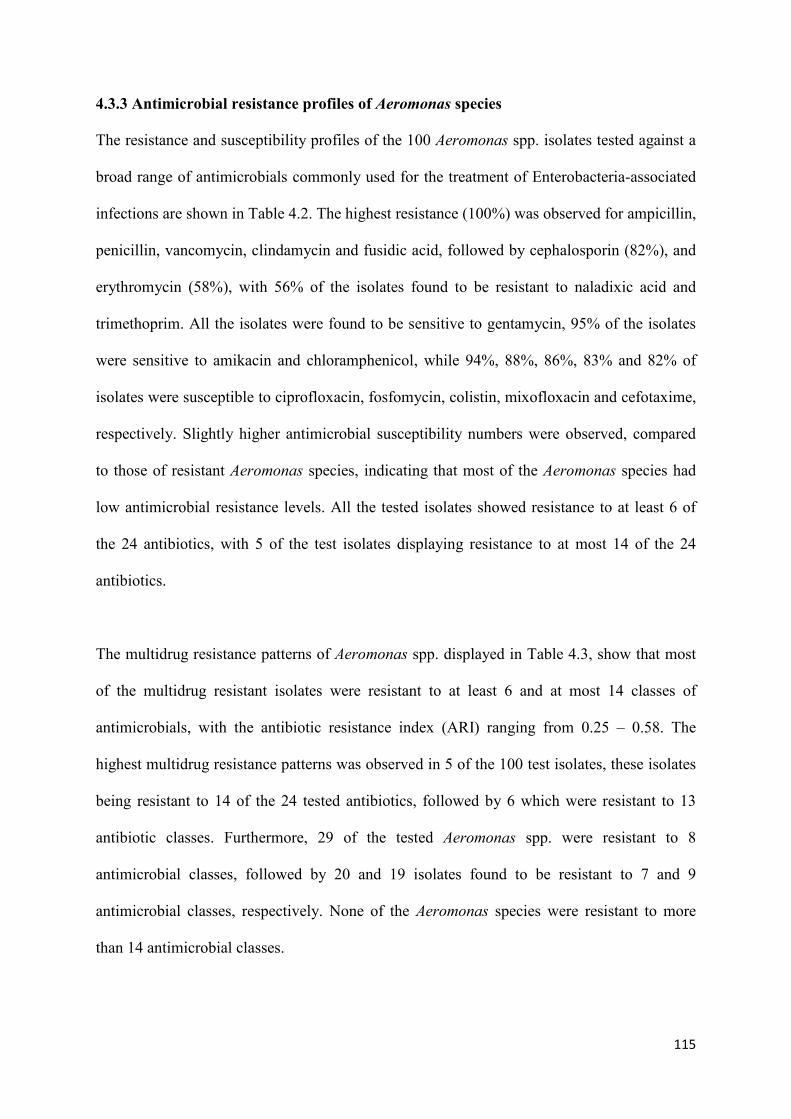
115
4.3.3 Antimicrobial resistance profiles of Aeromonas species
The resistance and susceptibility profiles of the 100 Aeromonas spp. isolates tested against a
broad range of antimicrobials commonly used for the treatment of Enterobacteria-associated
infections are shown in Table 4.2. The highest resistance (100%) was observed for ampicillin,
penicillin, vancomycin, clindamycin and fusidic acid, followed by cephalosporin (82%), and
erythromycin (58%), with 56% of the isolates found to be resistant to naladixic acid and
trimethoprim. All the isolates were found to be sensitive to gentamycin, 95% of the isolates
were sensitive to amikacin and chloramphenicol, while 94%, 88%, 86%, 83% and 82% of
isolates were susceptible to ciprofloxacin, fosfomycin, colistin, mixofloxacin and cefotaxime,
respectively. Slightly higher antimicrobial susceptibility numbers were observed, compared
to those of resistant Aeromonas species, indicating that most of the Aeromonas species had
low antimicrobial resistance levels. All the tested isolates showed resistance to at least 6 of
the 24 antibiotics, with 5 of the test isolates displaying resistance to at most 14 of the 24
antibiotics.
The multidrug resistance patterns of Aeromonas spp. displayed in Table 4.3, show that most
of the multidrug resistant isolates were resistant to at least 6 and at most 14 classes of
antimicrobials, with the antibiotic resistance index (ARI) ranging from 0.25 – 0.58. The
highest multidrug resistance patterns was observed in 5 of the 100 test isolates, these isolates
being resistant to 14 of the 24 tested antibiotics, followed by 6 which were resistant to 13
antibiotic classes. Furthermore, 29 of the tested Aeromonas spp. were resistant to 8
antimicrobial classes, followed by 20 and 19 isolates found to be resistant to 7 and 9
antimicrobial classes, respectively. None of the Aeromonas species were resistant to more
than 14 antimicrobial classes.
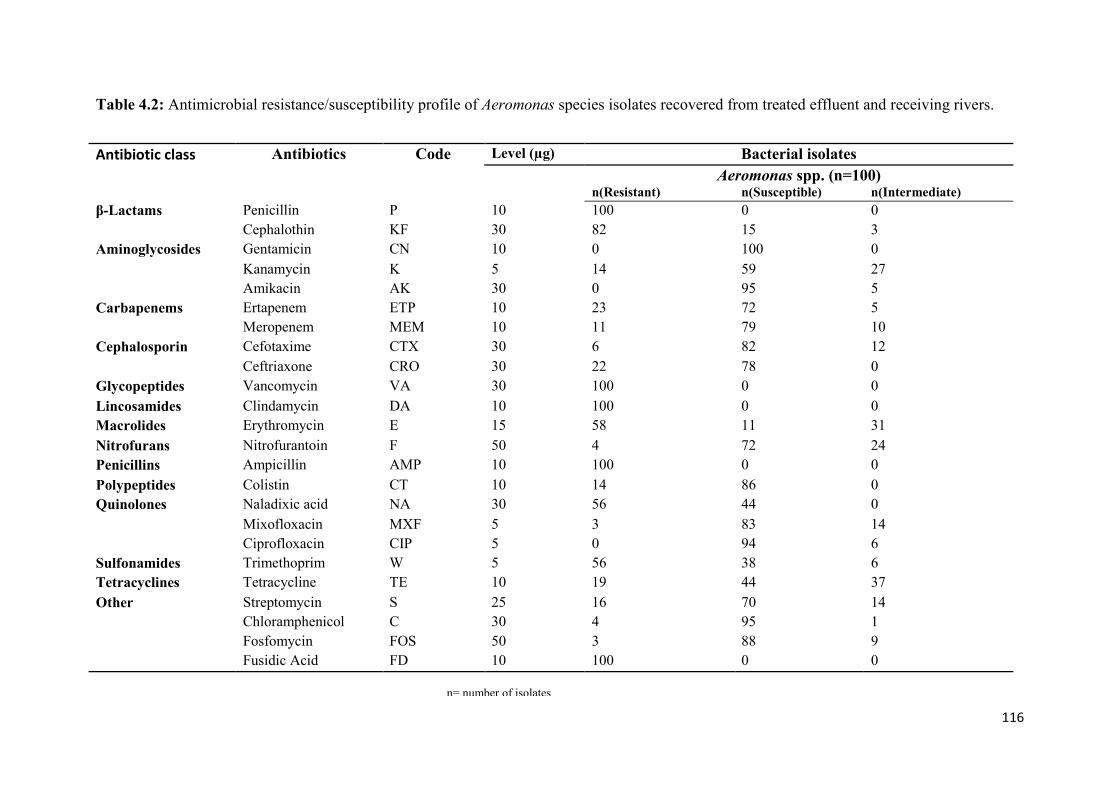
116
Table 4.2: Antimicrobial resistance/susceptibility profile of Aeromonas species isolates recovered from treated effluent and receiving rivers.
Antibiotic class
Antibiotics Code Level (µg) Bacterial isolates Aeromonas spp. (n=100) n(Resistant) n(Susceptible) n(Intermediate)
β-Lactams Penicillin P 10 100 0 0 Cephalothin KF 30 82 15 3
Aminoglycosides Gentamicin CN 10 0 100 0 Kanamycin K 5 14 59 27 Amikacin AK 30 0 95 5
Carbapenems Ertapenem ETP 10 23 72 5 Meropenem MEM 10 11 79 10
Cephalosporin Cefotaxime CTX 30 6 82 12 Ceftriaxone CRO 30 22 78 0
Glycopeptides Vancomycin VA 30 100 0 0 Lincosamides Clindamycin DA 10 100 0 0 Macrolides Erythromycin E 15 58 11 31 Nitrofurans Nitrofurantoin F 50 4 72 24 Penicillins Ampicillin AMP 10 100 0 0 Polypeptides Colistin CT 10 14 86 0 Quinolones Naladixic acid NA 30 56 44 0
Mixofloxacin MXF 5 3 83 14 Ciprofloxacin CIP 5 0 94 6
Sulfonamides Trimethoprim W 5 56 38 6 Tetracyclines Tetracycline TE 10 19 44 37 Other
Streptomycin S 25 16 70 14 Chloramphenicol C 30 4 95 1 Fosfomycin FOS 50 3 88 9 Fusidic Acid FD 10 100 0 0
n= number of isolates

117
Table 4.3: Multidrug resistance patterns of Aeromonas spp.
4.3.4 Protease, gelatinase and haemolysin production
All the 100 tested Aeromomonas spp isolates tested positive for protease enzyme production,
while 67% and 88% of the isolates tested positive for the production of haemolysin
(evidenced by distint clearing zones around the colonies due to the hydrolysis of blood agar)
and gelatinase, respectively.
4.4 Discussion
The increasing number of studies reporting on Aeromonas spp. isolated from treated waters,
even drinking waters is a cause for concern, considering the severity of Aeromonas infections
on immune-compromised individual. Results obtained in this study indicate the prevalence of
Aeromonas species in treated wastewater effluent, reiterating the fact that they are able to
withstand and survive conventional wastewater treatment processes as previously reported
(Lafdal et al., 2012; Martone-Rocha, 2012; Obi et al., 2007). Organisms with the ability to
withstand wastewater treatment and thereafter disseminated into the environment from
treatment plants which are reservoirs of antimicrobial substances, easily transferring their
resistance properties to other environmental bacterial organisms (Jury et al., 2010).
In this study, the aerolysin (aer) and lipase (lip) genes were detected in most of the tested
Aeromonas species isolates. The aerolysin gene which was detected in 52% of the isolates is
Number of antibiotic classes 6 7 8 9 10 11 12 13 14
No. of isolates resistant 4 20 29 19 8 6 3 6 5
Percentage resistant 4 20 29 19 8 6 3 6 5
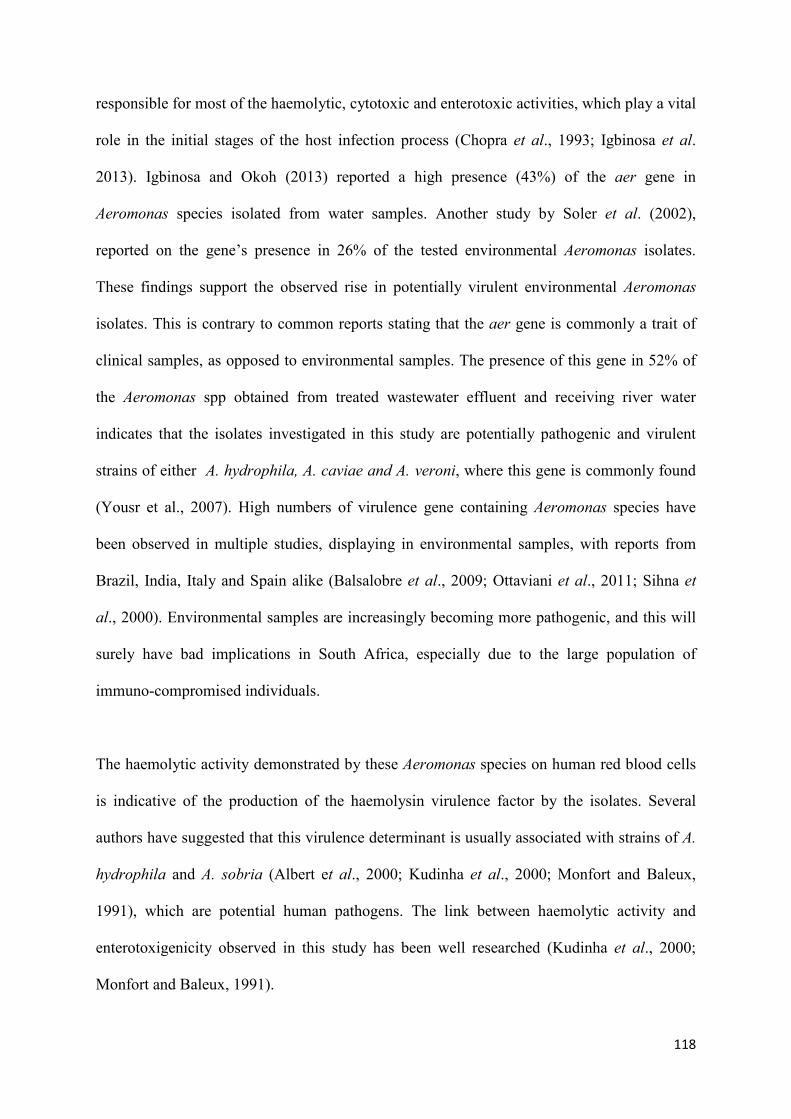
118
responsible for most of the haemolytic, cytotoxic and enterotoxic activities, which play a vital
role in the initial stages of the host infection process (Chopra et al., 1993; Igbinosa et al.
2013). Igbinosa and Okoh (2013) reported a high presence (43%) of the aer gene in
Aeromonas species isolated from water samples. Another study by Soler et al. (2002),
reported on the gene’s presence in 26% of the tested environmental Aeromonas isolates.
These findings support the observed rise in potentially virulent environmental Aeromonas
isolates. This is contrary to common reports stating that the aer gene is commonly a trait of
clinical samples, as opposed to environmental samples. The presence of this gene in 52% of
the Aeromonas spp obtained from treated wastewater effluent and receiving river water
indicates that the isolates investigated in this study are potentially pathogenic and virulent
strains of either A. hydrophila, A. caviae and A. veroni, where this gene is commonly found
(Yousr et al., 2007). High numbers of virulence gene containing Aeromonas species have
been observed in multiple studies, displaying in environmental samples, with reports from
Brazil, India, Italy and Spain alike (Balsalobre et al., 2009; Ottaviani et al., 2011; Sihna et
al., 2000). Environmental samples are increasingly becoming more pathogenic, and this will
surely have bad implications in South Africa, especially due to the large population of
immuno-compromised individuals.
The haemolytic activity demonstrated by these Aeromonas species on human red blood cells
is indicative of the production of the haemolysin virulence factor by the isolates. Several
authors have suggested that this virulence determinant is usually associated with strains of A.
hydrophila and A. sobria (Albert et al., 2000; Kudinha et al., 2000; Monfort and Baleux,
1991), which are potential human pathogens. The link between haemolytic activity and
enterotoxigenicity observed in this study has been well researched (Kudinha et al., 2000;
Monfort and Baleux, 1991).
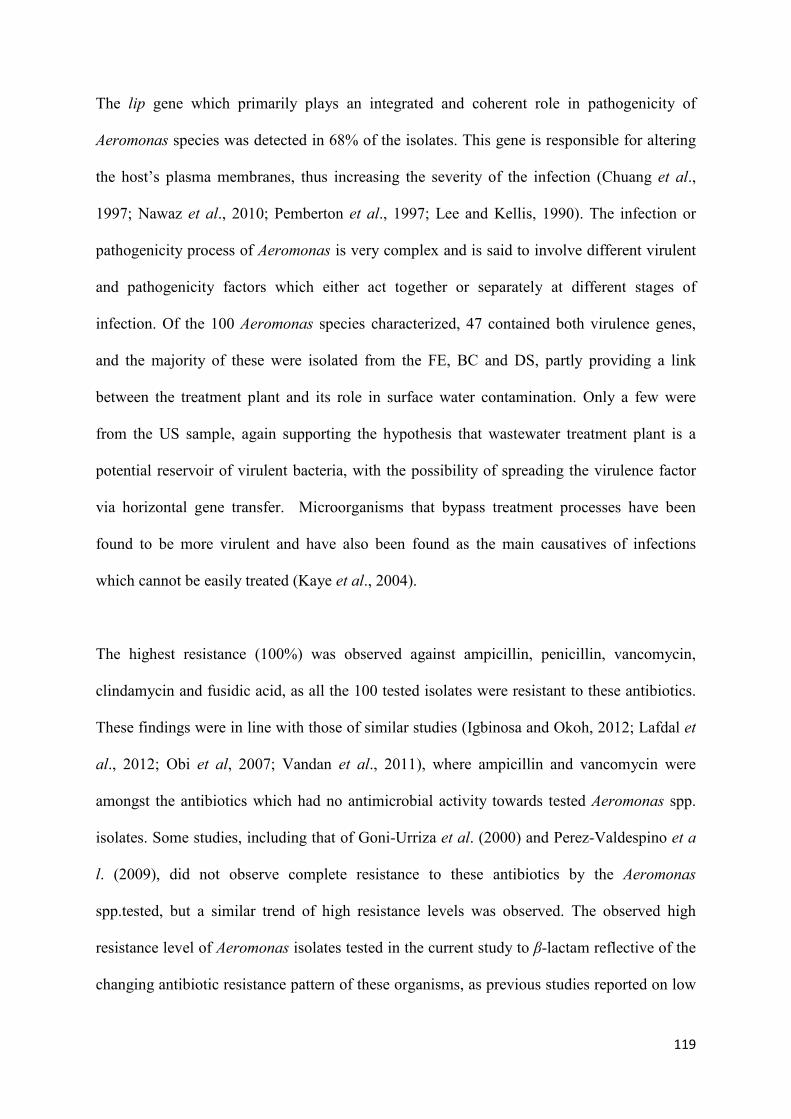
119
The lip gene which primarily plays an integrated and coherent role in pathogenicity of
Aeromonas species was detected in 68% of the isolates. This gene is responsible for altering
the host’s plasma membranes, thus increasing the severity of the infection (Chuang et al.,
1997; Nawaz et al., 2010; Pemberton et al., 1997; Lee and Kellis, 1990). The infection or
pathogenicity process of Aeromonas is very complex and is said to involve different virulent
and pathogenicity factors which either act together or separately at different stages of
infection. Of the 100 Aeromonas species characterized, 47 contained both virulence genes,
and the majority of these were isolated from the FE, BC and DS, partly providing a link
between the treatment plant and its role in surface water contamination. Only a few were
from the US sample, again supporting the hypothesis that wastewater treatment plant is a
potential reservoir of virulent bacteria, with the possibility of spreading the virulence factor
via horizontal gene transfer. Microorganisms that bypass treatment processes have been
found to be more virulent and have also been found as the main causatives of infections
which cannot be easily treated (Kaye et al., 2004).
The highest resistance (100%) was observed against ampicillin, penicillin, vancomycin,
clindamycin and fusidic acid, as all the 100 tested isolates were resistant to these antibiotics.
These findings were in line with those of similar studies (Igbinosa and Okoh, 2012; Lafdal et
al., 2012; Obi et al, 2007; Vandan et al., 2011), where ampicillin and vancomycin were
amongst the antibiotics which had no antimicrobial activity towards tested Aeromonas spp.
isolates. Some studies, including that of Goni-Urriza et al. (2000) and Perez-Valdespino et a
l. (2009), did not observe complete resistance to these antibiotics by the Aeromonas
spp.tested, but a similar trend of high resistance levels was observed. The observed high
resistance level of Aeromonas isolates tested in the current study to β-lactam reflective of the
changing antibiotic resistance pattern of these organisms, as previous studies reported on low
120
resistance levels of these organisms towards this group of antibiotics (Goni-Urriza et al.,
2000). Tetracycline resistance results obtained in this study were however different to the
results of obtained by Igbinosa and Okoh (2012) where close to 80% of isolates displayed
resistance, compared to only 19% of resistant isolates observed in this study, with most
isolates having an intermediate result. However, lower percentage of resistance to
tetracycline was also observed by Goni-Urriza et al. (2000) among isolates obtained from
river that received wastewater samples. The high resistance pattens observed in Aeromonas
strains, mainly towards ampicillin and vancomycin corroborates many reports and could be
attributed to the frequent utilization of ampicillin as a selective agent in the most common
Aeromonas culture media, such as the one used in this study (Vila et al., 2003). The high
sensitivity patterns observed against gentamycin, fosfomycin, cefotaxime, amikacin, and
meropenem in this study were comparable to previous findings (Igbinosa and Okoh 2012;
Obi et al, 2007).
The high prevalence of virulence and antimicrobial resistant Aeromonas species obtained in
this study is indicative of the severity of the threat these pathogens might pose to the health of
the environment and other organisms exposed to the contaminated waters. This is of great
concern as most of the surface water samples (US and DS) were collected from locations
which were easily accessible to animals and human populations residing in informal
settlements along the river. Some of the residents in these areas used this water to meet some
of their domestic needs, such as washing and laundry as well as for fishing. Results obtained
in this study suggest a high prevalence of Aeromonas species in the treated effluent, and
receiving water bodies. These organisms harbour virulence determinants which are involved
in human and animal infection, increasing the organisms’ pathogenicity. Wastewater
treatment plants are therefore reservoirs of pathogenic Aeromonas species, with the potential

121
to pose a risk to the health and well-being of human and animals exposed to these waters.
Once in a bacterial population, antibiotic resistance can spread rapidly (Adetunji and Isola,
2011; Stokes and Gillings, 2011).The study shows that some of the tested environmental
isolates possessed virulence genes which are mostly associated with clinical samples
indicates an evolution of these genes in environmental isolates. Antimicrobial resistance
profile also indicates that more Aeromonas species are becoming resistant to multiple
antibiotics. Although the number of multidrug resistant Aeromonas species might be low, it
doesn’t indicate safe levels, as resistance to antibacterial agents may be strain dependent.
Results from this study further highlight the need for improved treatment processes for
effective removal of these emerging bacterial pathogens.
122
CHAPTER FIVE
GENERAL DISCUSSION AND CONCLUSION
5.1 Research in perspective
South African fresh surface water bodies are increasingly being exposed to a broad range of
microbial and chemical pollutants. These diverse and mostly noxious contaminants have been
traced to numerous contributing factors of varying anthropogenic and natural derived sources
(UNEP, 2010). Of these sources, inadequately treated wastewater effluent has been reported
as a major contributor to fresh water pollution, transporting a plethora of microorganisms,
some of which are highly infectious disease-causing bacterial pathogens with alarmingly high
mortality rates and chemical complexes. Contaminated fresh water sources of poor microbial
and physico-chemical quality are increasingly posing a greater health and environmental
threat than previously projected (Crockett, 2007). This raises serious concern in developing
countries, such as South Africa, especially in rural areas where surface water and
groundwater sources are still being depended upon for basic water needs (Bolonga et al.,
2009; Odjadjare and Okoh, 2010). In 2012, sixteen million South Africans were estimated to
lack adequate access to safe water and sanitation facilities. This in conjunction with
contaminated water bodies undoubtedly escalates the problems of water-related infection,
treatment and the spread of waterborne diseases (NICD, 2012).
Additionally, the increased usage of antimicrobial substances and their residual presence in
wastewater could be potentially linked to increased antimicrobial resistance detected in
microorganisms isolated from wastewater effluents, which are then later disseminated into
fresh water bodies. These organisms then spread antimicrobial resistance among
environmental isolates, further posing potential harm to human (Abraham, 2011; Zhang et al.,
123
2009). Waterborne pathogens of fecal origin in developing countries have been largely
implicated in numerous infectious disease outbreaks, thus necessitating the need to safeguard
and effectively protect surface water by the relevant regulatory authorities (Crockett, 2007;
Scott et al., 2003; Santo Domingo and Edge, 2010; Shatanawi et al., 2006). There is lack of
adequate knowledge pertaining to waterborne emerging bacterial pathogens, despite their
frequent detection in surface water even in the absence of traditional indicator bacterial
pathogens. This study therefore evaluated the prevalence of five emerging bacterial
pathogens; namely Aeromonas, Pseudomonas, Listeria, Yersinia and Legionella species, in
treated effluent of two wastewater treatment plants and the receiving rivers in Durban.
Physico-chemical profiles of these waters were also assessed and correlated with the bacterial
loads over the study period followed by antimicrobial resistance and virulence gene
characterization of the positively confirmed Aeromonas and Listeria species isolates.
Bacterial analyses of treated effluents from both plants as presented in Chapter two, displayed
varying trends over the sampling period, with some samples from the Northern wastewater
treatment plant (NWWTP) displaying unexpectedly higher bacterial populations at the
discharge points (after tertiary treatment) compared to counts obtained before chlorination.
This could be attributed to a number of factors, such as an incapacitated plant, treatment
inefficiency and the regrowth and proliferation of microorganisms in the effluent pipe
systems. Microbial counts upstream and downstream of the receiving Umgeni River varied
greatly, with microbial population recovery trends closely linked to the observed directional
flow of the tidal current as well as the quality of the released effluent. Bacterial populations at
the NWWTP (in CFU/ml x 103) ranged between 4.42 – 23100, 0.53 –329000, 0.01 – 1470,
20.60 – 140000, and 40.13 – 95000 for Aeromonas, Pseudomonas, Listeria, Yersinia and
Legionella spp., respectively, over the sampling period. Bacterial counts displayed great
124
variability with no observable monthly or seasonal trends. The NGWWTP which was the
smaller plant of the two displayed a more normalised trend of lower bacterial count at the
discharge point compared to the values obtained in samples before chlorination. Counts (in
CFU/ml x 103) varied between 17 – 9613.3, 19.2 –8820, 0.01 – 331, 70 – 11480, and 258 –
46600 for Aeromonas, Pseudomonas, Listeria, Yersinia and Legionella spp. respectively. The
observed very low bacterial counts in downstream samples compared to samples upstream
and at the discharge point could be due to the dilution effect of the treated effluent discharge
with high residual chlorine. In NGWWTP, up to 100% reduction in Listeria spp population
and up to 99% for the other four emerging bacterial pathogens investigated was observed
after chlorination. However, similar to NWWTP, emerging bacterial pathogens were also
recovered at the receiving water bodies throughout the sampling period. Results of this study
highlight the ineffectiveness of wastewater treatment processes in pathogen removal (Toze,
1997). Some of the tested organisms (Legionella and Yersinia) are known to be more
resistant to chlorine and survived longer than coliform bacteria (Palmer et al., 1995). Some of
the results obtained in this study corroborate reports of previous studies (Bressler et al., 2009;
Odjadjare and Okoh, 2010; Paillard et al., 2005; Pablos et al., 2009). The high microbial
population bypassing treatment and being transferred into fresh water bodies is a cause for
concern as this poses multiple threats of waterborne disease outbreaks.
The physico-chemical profile of the treated final effluent samples generally fell short of set
guidelines, with respect to certain parameters, notably turbidity, COD, phosphates and
nitrates, while pH, temperature, TSS, and DO displayed overall compliance to the set
guidelines (Conter et al., 2009; DWAF, 1992; Hitchins, 2001, Naravaneni and Jamil, 2005).
Extremely high turbidity, DO, COD and conductivity readings completely rule out the river
waters for any domestic use. The presence of organic matter affects the biochemical
125
composition of a natural water system, thus affecting and altering normal biological function.
A positive correlation (P < 0.05) was observed between some physicochemical parameters
like; pH, TDS and COD. The strong correlation between microbial counts and DO readings
can be attributed to the high organic matter of the water. The high turbidity, COD and TDS
obtained in this study suggested a high presence of organic matter which may have a negative
effect on the surrounding ecosystems as well as human population.
Virulence and antibiotic resistance profiling of confirmed Listeria and Aeromonas spp.
isolates (reported in chapters 3 and 4) further provided relevant information of the potential
negative impact of the effluent discharge from the two treatment plants studied. The virulence
genes; plcA, actA, and iap associated with pathogenic Listeria species were detected in some
of the confirmed isolates. A similar trend has been observed in environmental samples from
numerous Listeria studies conducted in different parts of the world (Balsalobre et al., 2009;
Ottaviani et al., 2011; Sihna et al., 2000). The presence of such virulence genes commonly
found in pathogenic clinical isolates indicates that these genes have now been transferred to
environmental isolates. The aer and lip genes associated with the initial stages of the
infection process were detected in most of the Aeromonas species isolates.
As reported in chapter 3, Listeria species tested in this study displayed high resistance
towards penicillin (100%), erythromycin (100%), nalidixic acid (100%), ampicillin (88.33%),
trimethoprim (67.95%), nitrofurantoin (64.10%) and cephalosporin (60.26%). Complete
sensitivity was observed towards streptomycin, chloramphenicol, fosfomycin, fusidic acid
and meropenem, followed by ciprofloxacin (96.15%), meropenem (89.74%), clindamycin
(88.46%), colistin (79.48%) and gentamicin (72.31%). The high Listeria sensitivity levels
towards β-Lactams and penicillins observed in this study is similar to previous reports in
126
related studies (Abuin et al., 1994; Conter et al., 2009; Hansen et al., 2005; Zuraini et al.,
2001; Zhang et al., 2007). There has been an increase in reports of multidrug resistant
Listeria species over the past years (Marian et al., 2012), and this can be attributed to their
gene acquisition ability from other bacterial species such as Streptococcus (Charpentier and
Courvalin, 1999; Steve et al., 2009). It has been widely reported that conventional
wastewater treatment processes are incapable of effectively removing antimicrobials and
other chemical compounds from wastewater, thereby increasing the chances of bacterial
pathogens established in such wastewater effluent to acquire resistance to commonly used
antibiotics due to selective pressures (Giger et al., 2003; Kummerer, 2003; Volkmann et al.,
2004). Medical and pharmaceutical wastes have contributed largely to the increase in
antibiotic concentration and therefore have led to the rise of highly resistant bacterial
populations in the environment (Naviner et al., 2011). As presented in chapter 4, all
Aeromonas spp. tested in this study were resistant to ampicillin, penicillin, vancomycin,
clindamycin and fusidic acid, followed by cephalosporin (82%), erythromycin (58%),
naladixic acid (56%) and trimethoprim (56%). The observed resistance patterns are
comparable to similar studies conducted by other authors (Igbinosa and Okoh, 2012; Lafdal
et al., 2012; Obi et al, 2007; Vandan et al., 2011). Although some studies did not observe
complete resistance towards ampicillin and vancomycin, a similar trend of high resistance
levels has been reported (Goni-Urriza et al. 2000; Perez- Valdespino et al. 2009).
Overall, findings from this study highlight the need for the Department of Water Affairs to
revise the current guidelines and standards to include the emerging bacterial pathogens. There
also needs for constant evaluation of South African wastewater treatment plants to ensure
efficiency and compliance to set guidelines and regulation to protect public and
environmental health. This study also demonstrated that some of the treatment plants in the
127
Durban are not effective in the removal of emerging bacterial pathogens, considering that one
of the tested plants is one of the biggest within the Durban area. Multidrug resistant
organisms found in this study were also resistant to some of the commonly used antibiotics
and this is particularly worrisome in a province with a high number of immunocompromised
individuals due to the extremely high HIV and TB pandemic.
5.2 Potential for future development of the study
The presence of emerging bacterial pathogens in treated effluent has been reported in
numerous studies; however there is limited research on the tested organisms recovered from
the wastewater effluent, thus restricting ones understanding on their impact and
epidemiological effects on exposed communities. Future studies should therefore focus on
further characterization of the recovered emerging bacterial pathogens to ascertain their
survival mechanisms, such as that of biofilm formation and interaction, the presence of efflux
pumps which is associated closely to antibiotic resistance levels. Antibiotic testing can be
partnered with antibiotic resistance genes screening and consequently the investigation of
antibiotic resistance mechanisms utilized, ultimately giving an holistic understanding on the
associated resistance mechanisms and how these differ between different organisms. More
toxicity or virulence determinant assays could be performed to better understand the level of
pathogenicity of the tested isolates. Finally, genetic fingerprinting of the isolates should be
carried out using pulse field gel electrophoresis (PFGE) or amplified fragment length
polymorphism (AFLP) to establish the level of relatedness of the isolates recovered from the
different sources for contaminant source tracking. Future studies should also attempt to
characterize other emerging bacterial pathogens (Yersinia, Legionella and Pseudomonas
species) recovered from the treated effluent, as they were also found in extremely high
number and could pose environmental and human health threat.
128
6.0 References
Abuin, C. M. F., E. J. Q. Fernandez, C. F. Sampayo, J. T. R. Otero, L. D. Rodriguez, S.
Cepeda. 1994. Susceptibilities of Listeria species isolated from food to nine antimicrobial
agents. Antimicrobial Agents and Chemotherapy, 38: 1655-1657.
Abraham, W. 2011.Megacities as Sources for Pathogenic Bacteria in Rivers and Their Fate
Downstream.International Journal of Microbiology, 011: 1-13.
Absar, A. K. 2005. Water and Wastewater Properties and Characteristics. In water
Encyclopedia: Domestic, Municipal and Industrial Water Supply and Waste Disposal. Lehr,
J.H. & Keeley, J. (editors). John Wiley and Sons, Inc., New Jersey, 903-905.
Adetunji, V. O., and T. O. Isola. 2011. Antibiotic resistance of Escherichia coli, Listeria
and Salmonella isolates from retail meat tables in Ibadan municipal abattoir, Nigeria. African
Journal of Biotechnology, 10: 5795-5799.
Akpor, O. B., and M. Muchie. 2011. Environmental and public health implications of
wastewater quality. African Journal of Biotechnology, 10: 2379-2387.
Albert, M. J., M. Ansaruzzaman, K. A. Talukder, A. K. Chopra. I. Kuhn, and M.
Rahman. 2000. Prevalence of enterotoxin genes in Aeromonas spp. isolated from children
with diarrhea, healthy controls, and the environment. Journal of Clinical Microbiology, 38:
3785-90.
Al-Ghazali, M. R., and S. K. Al-Azawi. 1988. Effects of sewage treatment on the removal
of Listeria monocytogenes. Journal of Applied Bacteriology, 65:203–208.
129
Almuzara, M., M. Radice, N. de Gárate, A. Kossman, A. Cuirolo, G. Santella, A.
Famiglietti, G. Gutkind, and V. Vay. 2007. Emerging Infectious Diseases, 13: 667-669.
Ansari, M., E. Rahimi, and M. Raissy. 2011. Antibiotic susceptibility and resistance of
Aeromonas spp. isolated from fish. African Journal of Microbiology Research, 5: 5772-5775.
APHA. 2001. Standard Methods for the Examination of Water and Wastewater, 20th
edition. APHA, Washington D.C.
Arslan, S., and F. O¨ zdemir. 2008. Prevalence and antimicrobial resistance of Listeria spp.
in homemade white cheese. Food Control, 19: 360–363.
Ashbolt. N. J. 2003. Methods to identify and enumerate frank and opportunistic bacterial
pathogens in water and biofilms. World Health Organization (WHO). Heterotrophic Plate
Counts and Drinking-water Safety, 147- 169.
Ashbolt, N. J. 2004. Microbial contamination of drinking water and disease outcomes in
developing regions. Toxicology, 198: 229–238.
American Water Resources Association (AWRA). 2007. Contaminants of emerging
concern, Water Resources Impact, 9: 1-33
American Water Works Association (AWWA). 1999. Waterborne Pathogens, 1st edn.
AWWA, Washington, DC.
Baker-Austin C., M. S. Wright, R. Stepanauskas, and J. V. Mcarthur. 2006. Co-
selection of antibiotic and metal resistance. Trends Microbiology. 14: 176–182.
130
Balsalobre, L. C., M. Dropa, G. R. Matté, and M. H. Matté. 2009. Molecular detection of
enterotoxins in environmental strains of Aeromonas hydrophila and Aeromonas jandaei.
Journal of Water Health, 7: 685-691.
Bartie, C., S. N. Venter, and L. H. Nel. 2002. Identification methods for Legionella from
environmental samples. Water Research, 37: 1362–1370.
Bendt, T., B. Pehl, A. Gehrt, and C. H. Rolfs. 2002. Antibiotikaresistente Keime in einem
Klärwerk; KA - Wasserwirtschaft, Abwasser, Abfall, 49: 49 – 56.
Bitton, G. 2005. Microbial indicators of faecal contamination: application to microbial
source tracking. Report submitted to the Florida Stormwater Association 719 East Park
Avenue, Tallahassee, 32301.
Blackburn, B. G., G. G. Craun, J. S. Yoder, V. C . R. L. Hill, N. L. S. H. Chen, D. A.
Nora, and M. J. Levy. 2004. Surveillance for Waterborne-Disease Outbreaks Associated
with Drinking Water. United States, 2001-2002 MMWR.Surveillance summaries, 53: 1-102.
Bolonga, N., A. F. Ismaila, M. R. Salimb, and T. Matsuurad. 2009. A review of the
effects of emerging contaminants in wastewater and options for their removal. Desalination,
239: 229–246.
Borchardt S. A., E. J. Allain, J. J. Michels, G. W. Stearns, R. F. Kelly, and W. F.
McCoy. 2001. Reaction of Acylated Homoserine Lactone Bacterial Signaling Molecules with
Oxidized Halogen Antimicrobials. Applied and Environmental Microbiology, 67: 3174 3179.
Bravo, L., L. Morier, and N. Castaneda. 2003. Aeromonas: an emerging pathogen
associated with extra-intestinal infection in Cuba. Revista Cubana de Medicina Tropical, 55:
208-209.
131
Bressler, D., M. Balzer, A. Dannehl, H.C. Flemming, and J. Wingender. 2009.
Persistence of Pseudomonas aeruginosa in drinking water biofilms on elastomeric material.
IWA Publishing: Water Science and Technology, 9: 81-87.
Brugere-Picoux, O. 2008. Ovine listeriosis. Small Ruminant Research, 76:12-20.
Burak D. M and Z. Zeybek. 2009. Investigation of Legionella pneumophila and free living
amoebas in the domestic hot water systems in İstanbul. Turk Journal of Bioliology, 35: 679-
685.
CDC. 1997. Update: outbreaks of cyclosporiasis: United States and Canada, 1997. Morb.
Mort. Weekly Report 46, 521–523.
Cabral, J. P. S. 2010. Water Microbiology. Bacterial Pathogens and Water. International
Journal of Environmental Research and Public Health, 7: 3657-3703.
Chapman, J. S. 2003a. Biocide resistance mechanisms. International Biodeterioration &
Biodegradation, 51: 133 – 138.
Chapman, J. S. 2003b. Disinfectant resistance mechanisms, cross-resistance, and co-
resistance. International Biodeterioration and Biodegradation, 51: 271 – 276.
Charpentier. E and P. Courvalin. 1999. Antibiotic Resistance in Listeria spp.
Antimicrobial Agents and Chemotherapy, 43: 2103-2108.
Chopra, A. K., C. W. Houston, J. W. Peterson, and G. F. Jin. 1993 Cloning, expression,
and sequence analysis of a cytolytic enterotoxin gene from Aeromonas hydrophila. Canadian
Journal of Microbiology, 39: 513-523.
132
Chuang, Y. C., S. F. Chiou, J. H. Su, M. L. Wu, and M. C. Chang. 1997. Molecular
analysis and expression of the extracellular lipase of Aeromonas hydrophila MCC-2.
Microbiology, 143: 803-812.
Cloete, T. E. 2003. Resistance mechanisms of bacteria to antimicrobial compounds.
International Biodeterioration& Biodegradation, 51: 277 – 282.
CLSI. 2005. Performance Standards for Antimicrobial Susceptibility Testing; Fifteenth
Informational Supplement,. Clinical and Laboratory Standards Institute: Wayne, PA, USA,
M100-S15, 25: 163.
Cochran, W. N., S. J. Suh, G. A. McFeters, and P.S. Stewart. 1999. Role of RpoS and
AlgT in Pseudomonas aeruginosa biofilm resistance to hydrogen peroxide and
monochloramine.
Cocolin, L., K. Rantsiou, L. Iacumin, C. Cantoni, and G. Comi. 2002. Direct
Identification in Food Samples of Listeria spp. And Listeria momocytogenes by Molecular
Methods. Applied and Environmental Microbiology. 68: 6273-6282.
Combarro, M. P., M. Gonzalez, M. Araujo, A. C. Amezaga, R. A. Sueiro, and M. J.
Garrido. 1997. Listeria species incidence and characterisation in a river receiving town
sewage from a sewage treatment plant. Water Science and technology, 35: 201–204.
Conter, M., D. Paludi, E. Zanardi, S. Ghidini, A. Vergara, and A. Ianieri. 2009.
Characterization of antimicrobial resistance of foodborne Listeria monocytogenes.
International Journal of Food Microbiology, 128; 497-500.
Cooper, I. R., and G.W. Hanlon. 2010. Resistance of Legionella pneumophila serotype 1
biofilms to chlorine-based disinfection. Journal of Hospital Infection, 74: 152-159.
133
Cooray, K. J., T. Nishibori, H. Xiong, T. Matsuyama, M. Fujita, and M. Mitsuyama.
1994. Detection of multiple virulence-associated genes of Listeria monocytogenes by PCR in
artificially contaminated milk samples. Applied Environmental Microbiology, 60: 3023-
3026.
Crittenden J.C., R. R. Trussell, D. W. Hand, K. J. Howe, and G. Tchobanoglous. 2005.
Water treatment: Principles and Design. 2nd. Ed. John Wiley & Sons, New Jersey.
Crockett, C. S. 2007. The role of wastewater treatment in protecting water supplies against
emerging pathogens. Water Environment Research, 79: 221-232.
Cummins, A. J., A. K. Fielding, and J. McLauchlin. 1994. Listeria ivanovii infection in a
patient with AIDS. Journal of Infection, 28: 89-91.
Czeszejko, K., E. Boguslawska-Was, W. Dabrowski, S. Kaban, and R. Umanski. 2003
Prevalence of Listeria monocytogenes in municipal and industrial sewage. Electronic Journal
of Polish Agricultural Universities, Environmental, 6.
DEAT. 2000. White paper on integrated pollution and waste management for South Africa:
A policy on pollution prevention, Waste minimization, impact management and remediation,
Department of Environmental Affairs and Tourism, 80.
De Oliveira Scoaris D., J. Colacite, C. V. Nakamura, T. Ueda-Nakamura, B. A. de
Abreu Filho, and B. P. Dias Filho. 2008. Virulence and antibiotic susceptibility of
Aeromonas spp. isolated from drinking water. Antonie van Leeuwenhoek, 93:111–122.
Department of Natural Science. 2006. Wastewater characterization for evaluation of
biological phosphorus removal. http://dnr.wi.gov/topic/water.html 02/02/2012
134
Di Pinto, A., V. Terio, P. Di Pinto, and G. Tantillo. 2012. Detection of potentially
pathogenic Aeromonas isolates from ready-to-eat seafood products by PCR analysis.
International Journal of Food Science and Technology, 47: 269-273.
Durban Metropolitan Wastes. 1999. Waste : Impact, accesed from: http://www.ceroi.net/
reports/durban/issues/waste/impact.htm 16/02/2012.
Dreeszen, P. H. 2003. Biofilm: The Key to Understanding and Controlling Bacterial Growth
in Automated Animal Drinking Water Systems. Edstrom Industries.
Drenkard, E. 2003.Antimicrobial resistance of Pseudomonas aeruginosa biofilms. Microbes
and Infection, 5: 1213–1219.
DWAF. 1992. Analytical Methods Manual, TR 151; Department of Water Affairs and
Forestry, Pretoria, South Africa, 1992.
DWAF, 1996. South African Water Quality Guidelines: Domestic Use, 2nd ed.; Department
of Water Affairs and Forestry, 2nd volume: Pretoria, South Africa.
DWAF. 1998. Quality of Domestic Water Supplies. Assessment Guide. 1 (2nd. Ed.)
Department of Water Affairs and Forestry, Department of Health and Water Research
Commission.
DWAF. 2003. Strategic Framework for Water Services. Government Printer, Pretoria, South
Africa.
Ebrahim, R., A. Mehrdad, and M. Hassan. 2010. Prevalence and antimicrobial resistance
of Listeria species isolated from milk and dairy products in Iran. Food Control, 21:1448-
1452.
135
Egun, N. K. 2010. Effect of Channelling Wastewater into Water Bodies: A Case Study of the
Orogodo River in Agbor, Delta State. Journal of Human Ecology, 31: 47-52.
Environmental Protection Agency (EPA). 1986. Bacteriological Water Quality Criteria for
Marine and Fresh Recreational Waters. EPA-440/5-84-002.Cincinnati, OH:U.S.
Environmental Protection Agency, Office of Water Regulations and Standards.
Environmental Protection Agency (EPA). 1996. U.S. Environmental Protection Agency,
American Society of Civil Engineers, and American Water Works Association. Technology
Transfer Handbook: Management of Water Treatment Plan Residuals. EPA/625/R-95/008.
Washington DC.
Environmental Protection Agency (EPA). 2009. Occurrence of Contaminants of Emerging
Concern in Wastewater From Nine Publicly Owned Treatment Works. EPA-821-R-09-009.
El-Bahri, L., J. Belguith, and A, Blouin. 1997. Toxicology of nitrates and nitrites in
livestock. Compendium on Continuing Education for the Practicing Veterinarian, 19: 643-
649.
Environmental Canada (2003). Environmental indicator series. Available
from http://www.ec.gc.ca/soer.ree.
Eze, E., U. Eze, C. Eze and K. Ugwu. 2009. Association of metal tolerance with multidrug
resistance among bacteria isolated from sewage. Journal of Rural and Tropical Public Health,
8: 25-29.
Falcão, J. P., M. Brocchi, J. L. Proenc¸a-Mo´dena, G. O. Acrani, E. F. Correˆa and D. P.
Falcão. 2004. Virulence characteristics and epidemiology of Yersinia enterocolitica and
136
Yersiniae other than Y. pseudotuberculosis and Y. pestis isolated from water and sewage.
Journal of Applied Microbiology, 96: 1230-1236.
Fatoki, S.O., P. Gogwana, and A. O. Ogunfowokan. 2003. Pollution assessment in the
Keiskamma River and in the impoundment downstream. Water SA, 29:183-187.
Fiorentini, C., E. Barbier, L. Falzano, P. Matarrese, W. Baffone, A. Pianetti, M.
Katouli, I. Kuhn, R. Mollby, F. Bruscoloni, A. Casiere, and G. Donilli. 1998. Occurence,
diversity and pathogenicity of mesophilic Aeromonas in estuarine water of the Ilalian coast of
the Adriatic Sea. Journal of Applied Microbiology, 86; 501-511.
Fischbach, M. A., and C. T. Walsh. 2009. Antibiotics For Emerging Pathogens. National
Institutes of Health PA, Science, 325:1089-1093
Ford, T. 2006. Emerging issues in water and health research.Journal of Water and Health, 4:
59 – 65.
Fraser, P. 1995. Nitrates: epidemiological evidence. IARC Scientific Publication, 65: 183-
202.
Frederiksen, H. D. 1996. Water crisis in developing world: Misconceptions about solutions.
Water Resources Planning and Management Journal, 122: 1750-2060.
Furrer, B., U. Candrian, C. H. Hoefelein, and J. Luethy. 1991. Detection and
identification of Listeria monocytogenes in cooked sausage products and in milk
by in vitro amplification of haemolysin gene fragments. Journal of Applied Bacteriology. 70:
372-379.
137
Gavin, R., S. Merino, and J. M. Tomas. 2003. Molecular mechanisms of bacterial
pathogenesis from an emerging pathogen: Aeromonas spp, Recent Research Developments in
Infection and Immunity, 1: 337-354.
Ghenghesh, K. S., S. F. Ahmed, R. A. El-Khalek, A. Al-Gendy, and J. Klena. 2008.
Aeromonas infections in developing countries. Journal of Infection in Developing Countries,
2: 81-98.
Ghosh, S., C. M. Cremers, U. Jakob, and N. G. Love. 2011. Chlorinated phenols control
the expression of the multidrugresistance efflux pump MexAB–OprM in Pseudomonas
aeruginosa by interacting with NalC. Molecular Microbiology, 79: 1547-1556.
Giger, W., A. C. Alder, E. M. Golet, H. E. Kohler, C. S. McArdell, E. Molnar, H.
Siegrist, and M. Suter. 2003. Occurrence and fate of antibiotics as trace contaminants in
wastewaters, sewage sludges, and surface waters. Chimia, 57: 485-491.
Government Gazette. 1984. Requirements for the purification of wastewater or effluent.
Gazette No. 9225, Regulation,991.
Goni-Urriza, M., M. Capdepuy, C. Arpin, N. Raymond, P. Caumette, and C. Quentin.
2000. Impact of an urban effluent on antibiotic resistance of riverine Enterobacteriacae and
Aeromonas, spp. Applied and Envirinmental Microbiology, 66: 125-132.
Gonzalez-Serrano, C. J., J. A. Santos, M. L. Garcı´a-Lo´pez and A. Otero. 2002.
Virulence markers in Aeromonas hydrophila and Aeromonas veronii biovar sobria isolates
from freshwater fish and from a diarrhoea case, Journal of Applied Microbiology, 93: 414-
419.
138
Graczyk, T. K., D. Sunderland, G. N. Awantang, Y. Mashinski, F. E. Lucy, Z. Graczyk,
L. Chomicz, and P. N. Breysse. 2010. ). Relationships among bather density, levels of human
waterborne pathogens, and fecal coliform counts in marine recreational beach water. Para Research,
10: 1103-1108.
Grobe, S., J. Wingender, H. Flemming. 2001. Capability of mucoid Pseudomonas
aeruginosa to survive in chlorinated water International Journal of Hygiene and
Environmental Health, 204: 139 – 142.
Grobe, K. J., J. Zahller, and P. S. Stewart. 2002. Role of dose concentration in biocide
efficacy against Pseudomonas aeruginosa biofilms. Journal of Industrial Microbiology and
Biotechnology, 29: 10 – 15.
Hansen, J.M., P. Gerna-Smidt, and B. Bruun. 2005. Antibiotic susceptibility of Listeria
monocytogenes in Denmark 1958-2001. Acta Pathologica. Microbiologica Immunologica
Scandinavica, 113: 31-36.
Harwood, V, J., A. D. Levine, T. M. Scott, V. Chivukula, J. Lukasik, S. R. Farrah, and
J. B. Rose. 2005. Validity of the Indicator Organism Paradigm for Pathogen Reduction in
Reclaimed Water and Public Health Protection. Applied and Environmental Microbiology,
71: 3163–3170.
Health Canada. 2006. Bacterial Waterborne Pathogens Current and Emerging Organisms of
Concern. Guidelines for Canadian Drinking Water Quality: Guideline Technical Document, Ottawa
Ontario, 1-24.
Hijnen W. A. M., E. F. Beerendonk, G. J. Medema. 2006) Inactivation of UV radiation
for viruses, bacteria, and protozoan (oo)cysts in water: a review. Water Resources, 40: 3-22.

139
Hitchins A.D. 2001. Detection and enumeration of Listeria monocytogenes in foods. In
Bacteriological Analytical Manual; U.S. Food and Drug Administration: Madison, WI, USA,
Available online: http://www.cfsan.fda.gov/~ebam/bam-toc.html (accessed on 10 August
2012).
Holmberg, S. D., W. L. Schell, and G. R. Fanning. 1986. Aeromonas intestinal infections
in the United States,” Annals of Internal Medicine, 105: 683-689.
Hoogenboezem, W. 2007. Influence of sewage plant effluent on occurrence of emerging
waterborne pathogens on surface water. Association of River waterworks (RIWA).
Horman, A., R. Rimhanen-Finne, L. Maunula, C. H. von Bonsdorff, N. Torvela, N. A.
Heikinheimo, and L. M. Hanninen. 2004. Campylobacter sp., Giardia sp.,
Cryptosporidium sp., Noroviruses, and indicator organisms in surface water in south-western
Finland, 2000–2001. Applied Environmental Microbiology. 70: 87–95.
Hoyer, O. (2004). Water disinfection with UV radiation-requirements and realization. In
Proceedings of the European Conference UV Karlsruhe, UV radiation. Efects and
technologies, Karlsruhe.
Hu, B. 2009. New strategies for environmental water analysis. Proceedings of the
international conference and exhibition on water and the environment, held in Stellenbosch,
South Africa between 2nd and 4th of March 2009.
Huddleston, J. R., J. C. Zak, and R. M. Jeter. 2006. Antimicrobial Susceptibilities of
Aeromonas spp. Isolated from Environmental Sources. Applied Environmental.
Microbiology, 72: 7036-7042.
140
Ibusquiza, P. S. 2011. Biofilm formation by Listeria monocytogenes. Resistance to industrial
biocides and crossresponse caused by adaptation to benzalkonium chloride. Departamento de
Química Orgánica.
Igbinosa, E. O., and A. I. Okoh. 2009. Impact of discharge wastewater effluents on the
physico-chemical qualities of a receiving watershed in a typical rural community. Int. J.
Environmental Science and Technology, 6; 175-182.
Igbinosa, I. H., E. U. Igumbor, F. Aghdasi, M. Tom, and A. I. Okoh. 2012. Emerging
Aeromonas Species Infections and Their Significance in Public Health. The Scientific World
Journal, 1-13.
Igbinosa, I. H., and A. I. Okoh. 2012. Antibiotic Susceptibility Profile of Aeromonas
Species Isolated fromWastewater Treatment Plant.The ScientificWorld Journal, 12: 1-6.
Igbinosa, I. H., and A. I. Okoh. 2013. Detection and distribution of putative virulence
associatedgenes in Aeromonas species from freshwater and wastewatertreatment plant.
Journal of Basic Microbiology, 53: 895-901.
Isonhood, J. H., and M. Drake. 2002. Aeromonas species in foods,” Journal of Food
Protection, 65: 575-582.
Jaji, M. O., O. Bamgbose, O. O, Odukoya, and T. A. Arowlo. 2007. Water quality
assessment of Ogun River, south west Nigeria. Environmental Monitoring and Assessment,
133; 447-482.
José Figueras, M., and J. J. Borrego. 2010 New Perspectives in Monitoring Drinking
Water Microbial Quality. International Journal of Environmental Research and Public
Health, 7: 4179-4202.
141
Joseph S. W., and A. M. Carnahan. 2000. Update on the genus Aeromonas,” ASM News,
66: 218-223.
Jury, K. L., T. Vancov, R. M. Stuetz, and S. J. Khan. 2010. Antibiotic resistance
dissemination and sewage treatment plants. Current Research, Technology and Education
Topics in Applied Microbiology and Microbial Biotechnology, 509-519.
Jydegaard-Axelson A., A. Aaes-Jorgensen, A. G. Koch, J. S. Jensen, and S. Knøchel.
2005. Changes in growth, rRNA content and cell morphology of Listeria monocytogenes
induced by CO2 up- and downshift. International Journal of Food Microbiology, 98:145–55.
Kaye, S. K., J. J. Engemann, H. S. Fraimow, and E. Abrutyn. 2004. Pathogens resistant to
antimicrobial agents: epidemiology, molecular mechanisms, and clinical management.
Infectious Diseases Society of North America, 18: 467–511.
Khabo-Mmekoa, C. M. N., M. N. B., Momba, and E. Madoroba. 2010. The prevalence of
enteric pathogens in drinking water and itsimpact on the health of HIV/AIDS individuals in
Kwa-Zulu Natalprovince, South Africa. Department of Environmental, Water, Earth &
Sciences, Arcadia CampusTshwane University of Technology.
Kim, J., J. Hahn, M. J. Franklin, P. S. Stewart, and J. Yoon. 2009. Tolerance of dormant
and active cells in Pseudomonas aeruginosa PA01 biofilm to antimicrobial agents.Journal of
Antimicrobial Chemotherapy, 63: 129–135.
Koo, J., J. H. Lee, Y. D. Jung, S. P. Hong, and S. R. Yoon. 2008. Chlorine Resistant
Membrane and The Mechanism of Membrane Degradation by Chlorine. Water Environment
Federation, 1: 2958-2969.
142
Kudinha T., S. A. Tswana, and C. Simango. 2000. Virulence properties of Aeromonas
strains from humans, animals and water. South African Journal of Epidemiology Infections,
15: 94-7.
Kummerer, K. 2003. Significance of antibiotics in the environment. Journal of
Antimicrobial Chemotherrapy, 52: 5-7.
Lafdal, M. Y., S. Malang, and B. S. Toguebaye. 2012. Antimicrobial susceptibility of
aeromonads and coliforms before and after municipal wastewater treatment by activated
sludge under arid climate. International Research Journal of Microbiology, 3: 174-180.
Langsrud, S, G. Sundheim, and R. Borgmann-Strahsen. 2003a. Intrinsic and acquired
resistance to quaternary ammonium compounds in food-related Pseudomonas spp. Journal of
Applied Microbiology, 95: 874–882.
Langsrud, S., M. S. Sidhu, E. Heir, and A. L. Holck. 2003b. Bacterial disinfectant
resistance - a challenge for the food industry. International Biodeterioration and
Biodegradation, 51: 283 – 290.
Larsdotter. K., E. Söderbäck, and G. Dalhammar. 2003. Phosphorus removal from
wastewater by microalgae in a greenhouse in Sweden. In Proceedings at the IWA conference
on Environmental biotechnology, Malaysia.
Lăzăroaie, M. M. 2009. Mechanisms Involved In Organic Solvent Resistance in Gram-
Negative Bacteria. World Academy of Science, Engineering and Technology, 54: 648 – 656.
Lee, K. K., and A. E. Ellis. 1990. Glycerophospholipid:cholesterol acyltransferase
complexed with lipopolysaccharide (LPS) is a major lethal exotoxin and cytolysin of
143
Aeromonas salmonicida: LPS stabilizes and enhances toxicity of the enzyme. Journal of
Bacteriology, 172: 5382-5393.
Leid, J. G., C. J. Willson, M. E. Shirtliff, D. J. Hassett, M. R. Parsek, and A. K. Jeffers.
2005. The Exopolysaccharide Alginate Protects Pseudomonas aeruginosa Biofilm Bacteria
from IFN-γ-MediatedMacrophage Killing. The Journal of Immunology, 175: 7512–7518.
Liao C.H., and L. M. Shollenberger. 2003. Survivability and long-term preservation of
bacteria in water and in phosphate-buffered saline. Letters of Applied Microbiology, 37: 45-
50.
Lin, A. W., M. A. Usera, T. J. Barrett, and R. A. Goldsby. 1996. Applicatin of Random
Amplified Polymorphic DNA analysi to differentiate strains of Salmonella enteritidis.
Journal of Clinical Microbiology. 34: 870 – 876.
Linnan, M. J, L. Mascola, X. D. Lou, V. Goulet, S. May, C. Salminen, D. W. Hird, M.
L. Yonekura, P. Hayes, and R. Weaver. 1988. Epidemic listeriosis associated with
Mexican style cheese. New English Journal of Medicine, 29:823-828.
Loughlin, M. F., M. V. Jones, and P. A. Lambert. 2002. Pseudomonas aeruginosa cells
adapted to benzalkonium chloride show resistance to other membrane-active agents but not to
clinically relevant antibiotics. Journal of Antimicrobial Chemotherapy, 49: 631-639.
Luger, M., and C.Brown. 2010. The impact of treated sewage effluent on urban rivers – an
ecological, social and economic perspective. Southern Waters, SA.
Mackintosh, G. and C. Colvin. 2003. Failure of rural schemes in South Africa to provide
potable water. Environmental Geology, 44: 101- 105.
144
Marian, M. N., S. M. Sharifah Aminah, M. I. Zuraini, R. Son, M. Maimunah, and H. Y.
Lee. 2012. MPN-PCR detection and antimicrobial resistance of Listeria monocytogenes
isolated from raw and ready-to-eat foods in Malaysia. Food Control, 28: 309-314.
Martone-Rocha, S., R. P. Piveli, G. R. Matté, M. C. Dória, M. Dropa, M. Morita, F. A.
Peternella, M. H. Matté. 2010. Dynamics of Aeromonas species isolated from wastewater
treatment system. Journal of Water Health, 8: 703-711.
Mauro, C., P. Domenico, Z. Emanuela, G. Sergio, V. Albert, and I. Adriana.
2008.Characterization of antimicrobial resistance of foodborne Listeria monocytogenes,”
International Journal of Food Microbiology, 128: 497-500.
Mbwele, L., M. Rubindamayugi, A. Kivaisi, and G. Dalhammar 2003. Performance of a
small wastewater stabilisation pond system in tropical climate in Dar es Salaam, Tanzania.
Water Science and Technology, 48: 187-191.
Mead, P.S., L. Slutske, R. L. Dietz, L. F. McCaig, J. S. Bresee, C. Shapiro, P. M. Griffin,
and R. V. Tauxe. 1999. Food-related illness and death in the United States. Emerging
Infectious Diseases, 5: 607-625.
Mema, V. 2009. Impact of poorly maintained wastewater and sewage treatment plants:
lessons from South Africa. Council for Scientific and Industrial Research (CSIR).
Metcalf X., and X. Eddy. 2003. Wastewater Engineering: Treatment and Reuse. In:
Wastewater Engineering, Treatment, Disposal and Reuse. Techobanoglous G, Burton FL,
Stensel HD (eds), Tata McGraw- Hill Publishing Company Limited, 4th edition. New Delhi,
India.
145
Minnesota Water Sustainability Framework (MWSF). 2011. Wastewater Treatment Best
Practices.
Momba, M.N.B., A. N. Osode, and M. Sibewu. 2006. The impact of inadequate
wastewater treatment on the receiving water bodies – case study: Buffalo City and Nkokonbe
Municipalities of the Eastern Cape Province. Water SA, 32: 687-692.
Momba M. N. B., and P Kaleni. 2002. Regrowth and survival of indicator microorganisms
on the surfaces of household containers used for the storage of drinking water in rural
communities of South Africa. Water Research, 36: 3023-3028.
Monfort, P., and B Baleux. Haemolysin occurrence among Aeromonas hydrophila,
Aeromonas caviae and Aeromonas sobria strains isolated from different acquatic ecosystems.
Research in Microbiology, 142: 95-102.
Morato, J., J. Mir, F. Codony , J. Mas, and F. Ribas. 2003. Microbial response to
disinfectants. Handbook of Water and Wastewater Microbiology, 39: 657- 693.
Morse, S. 1995. Factors in the emergence of infectious diseases. Emerging Infectious
disease. 1: 7 – 15.
Morens, D. M., G. K. Folkers, and A. S. Fauci. 2004. The challenge of emerging and re-
emerging infectious diseases. National Institute of Allergy and Infectious Diseases, 430: 242-
249.
Morris, D. P., and A. Hagr. 2005. Biofilm: Why the Sudden Interest? The Journal of
Otolaryngology, 34: S56-S59.
146
Munir, M., K. Wong, and I. Xagoraraki. 2011. Release of antibiotic resistant bacteria and
genes in the effluent and biosolids of five wastewater utilities in Michigan. Water Research
45: 681-693.
Murrell, M. C., J. T. Hollibaugh, M. W. Silver, and P. S. Wong. 1999. Bacterioplankton
dynamics in Northern San Francisco Bay: role of particle association and seasonal freshwater
flow. Limnol. Oceanogr, 44, 295-308.
National Health Service (NHS). 2009. Enumeration of Pseudomonas aeruginosa by
membrane filtration. National Standard Methods, 6: 1-13.
Naravaneni, R., K. Jamil. 2005. Rapid detection of food-borne pathogens by using
molecular techniques. Journal of Medical Microbiology, 54; 51-54.
National Institute for communicable Diseases (NICD). 2012. Annual review. National
health laboratory services, National Institute for Communicable Diseases annual review 2011
– 2012.
Naviner, M., L. Gordon, E Giraud, M Denis, C. Mangion, H. Le Bris, and J Ganière.
2011. Antimicrobial resistance of Aeromonas spp. isolated from the growth pond to the
commercial product in a rainbow trout farm following a flumequine treatment. Aquaculture,
315: 236–241.
Nawaz, M., S. A. Khan, A. A. Khan, and K. Sung. 2010. Detection and characterization of
virulence genes and integrons in Aeromonas veronii isolated from catfish. Food
Microbiology, 27: 327–331.
Nilsson, M. W. Chiang, M. Fazli, M. Gjermansen, M. Givskov and T. Tolker-Nielsen.
2011. Influence of putative exopolysaccharide genes onPseudomonas putida KT2440 biofilm
stability. Environmental Microbiology, 13: 1357 – 1369.
147
Obi C. L., N Potgieter, P. O Bessong, and G. Matsaung. 2002. Assessment of the
microbial quality of river water sources in rural Venda communities in South Africa. Water
SA, 28: 287 – 292.
Obi C., and L, Bessong. 2002. Diarrhoeagenic bacterial pathogens in HIV-positive patients
with diarrhoea in rural communities of Limpopo province, South Africa. Journal of Health
Population and Nutrition, 20: 230-4.
Obi C. L., J. Ramalivhana, A. Samie, and E. O. Igumbor. 2007. Prevalence, pathogenesis,
antibiotic susceptibility profiles, and in-vitro activity of selected medicinal plants against
Aeromonas isolates from stool samples of patients in the Venda Region of South Africa.
Journal of Health, Population and Nutrition, 25: 428–435.
Obi, C. L., J. O. Igumbor, M. N. B. Momba, and A. Samie. 2008. Interplay of factors
involving chlorine dose, turbidity flow capacity and pH on microbial quality of drinking
water in small treatment plants. Water SA, 34: 565-572.
Odjadjare, E.E.O., and A. I. Okoh. 2010. Prevalence and distribution of Listeria pathogens
in the final effluents of a rural wastewater treatment facility in the Eastern Cape Province of
South Africa. World Journal of Microbiology and Biotechnology, 26: 297-307.
Odjadjare, E. E. E. O. Igbinosa, R. Mordi, B. Igere, C. L. Igeleke, and A. I. Okoh. 2012.
Prevalence of Multiple Antibiotics Resistant (MAR) Pseudomonas Species in the Final
Effluents of Three Municipal Wastewater Treatment Facilities in South Africa. International
Journal of Environmental Research and Public Health, 9: 2092-2107.
Okoh, A. I., E. E. Odjadjare, E. O. Igbinosa, and A. N. Osode. 2007 Wastewater
treatment plants as a source of pathogens in receiving watersheds. African Journal of
Biotechnolgy, 6: 2932-2944.
148
Olaniran, A. O., D. Pillay, and B. Pillay. 2005. Characterization of two bacteria isolated
from a wastewater treatment plant in South Africa for aerobic dehalogenation of some
aliphatic chlorinated compounds. International Journal of the Environment, 62: 59 – 68.
Ottaviani, D., C. Parlani, B. Citterio, L. Masini, F. Leoni, C. Canonico, L. Sabatini, F.
Bruscolini, and A. Pianetti. 2011. Putative virulence properties of Aeromonas strains
isolated from food environmental and clinical sources in Italy: A comparative study.
International Journal of Food Microbiology 144: 538–545.
Pablos, M., J. M. Rodríguez-Calleja, A. J. A. Santos, A. Otero, and M. García-López.
2009. Occurrence of motile Aeromonas in municipal drinking water and distribution of genes
encoding virulence factors. International Journal of Food Microbiology 135: 158–164.
Palmer, C. J., Y. Tsai, C. Paszko-Kolva, C. Mayer, and L. R. Sangermano. 1993.
Detection of Legionella Species in Sewage and Ocean Water by Polymerase Chain Reaction,
Direct Fluorescent-Antibody, and Plate Culture Methods. Applied Environmental
Microbiology, 59: 3618-3624.
Palmer, C. J., G. F. Bonilla, B. Roll, C. Paszko-kolva, L. R. Sangermano, and Roger S.
Fujioka. 1995. Detection of Legionella Species in Reclaimed Water and Air with the
EnviroAmp Legionella PCR Kit and Direct Fluorescent Antibody Staining. Applied
Environmental Microbiology, 61; 407–412.
Paillard, D., V. Dubois, R. Thiebaut, F. Nathier, E. Hoogland, P. Caumette, and C.
Quentin. 2005. Occurrence of Listeria spp. in effluents of French urban wastewater
treatment plants. Applied Environmental Microbiology, 71: 7562-7566.
149
Palmer, C. J., Y. Tsai, C. Paszko-Kolva, C. Mayer, and L. R. Sangermano. 1993.
Detection of Legionella Species in Sewage and Ocean Water by Polymerase Chain Reaction,
Direct Fluorescent-Antibody, and Plate Culture Methods. Applied and Environmental
Microbiology, 59: 3618-3624.
Palmer, C. J., G. F. Bonilla, B. Roll, C. Paszko-kolva, L. R. Sangermano, and Roger S.
Fujioka. 1995. Detection of Legionella Species in Reclaimed Water and Air with the
EnviroAmp Legionella PCR Kit and Direct Fluorescent Antibody Staining. Applied
Environmental Microbiology, 61: 407–412.
Pemberton, J.M., S. P. Kidd, and R. Schmidt. 1997. Secreted enzymes of Aeromonas.
FEMS Microbiology Letters, 152: 1-10.
Perdek, J. M., R. D. Arnone, and M. K. Stinson. 2002. Managing Urban Watershed
Pathogen Contamination. National Risk Management Research Laboratory. Research and
Development U.S. Environmental Protection Agency Cincinnati, Ohio, 1-127.
Perez Guzzi, J., A. Folabella, E. Miliwebsky, M. Rivas, C. Fernandez Pascua, D. Gomez,
A. Zomora, C. Zotta, and M. Cordoba. 2000. Isolation of Escherichia coli 0157:H7 in
Combined-sewer outflows with fecal bacterial contamination in Mar del Plata. Argentina de
Microbiology, 32: 161-164.
P´erez-Valdespino, A., E. Fern´andez-Rend, and E. Curiel-Qesada. 2009. Detection and
characterization of class 1 integrons in Aeromonas spp. isolated from human diarrheic stool
in Mexico. Journal of Basic Microbiology, 49: 572-578.
Pesavento, G., B. Ducci, D. Nieri, N. Comodo and A. Lo Nostro. 2010. Prevalence and
antibiotic susceptibility of Listeria spp. isolated from raw meat and retail foods. Food
Control. 21: 708-713.
150
Philippeaux. A. 1998. Emerging water borne pathogens. Pan American Health Organization.
Picardo, K. F., and D. W. Giroux. 2004. Novel Scientific Research in the College
Classroom: Identification of Antibiotic Resistant Pseudomonas Species from a Wastewater
Treatment Plant. Current research, technology and education topics in applied Microbiology and
Biotechnolgy, a. Mendez-Vilas (Ed.), 494- 500.
Poffe, R and E. Op de Beeck. 1991. Enumeration of Aeromonas hydrophila from domestic
wastewater treatment plants and surface waters. Journal of Applied Bacteriology, 71: 366-
370.
Poole, K. 2005. Efflux-mediated antimicrobial resistance. Journal of Antimicrobial
Chemotherapy 56: 20–51.
Purkrtová, S., H. Turoňová, T. Pilchová, K Demnerová, and J Pazlarová. 2010.
Resistance of Listeria monocytogenesBiofilms to Disinfectants. Czech Journal of Food
Science, 28: 326–332.
Rawool, D. B., S. V. S. Malik, S. B. Barbuddhe, I. Shakuntala, and R. Aurora, . 2007. A
Multiplex PCR for Detection of Virulence Associated Genes in Listeria monocytogenes.
Internet Journal of Food Safety, 9: 56-62.
Roberts, A. J. and M. Wiedmann. 2003. Pathogen, host and environmental factors
contributing to the pathogenesis of listeriosis. Cellular and Molecular Life Sciences, 60:
904 918.
Rocourt, J. 1996. Risk factors for listeriosis. Food Control 7: 195–202.
151
Rodrigues, D., N. Cerca, P. Teixeira, R. Oliveira, H. Ceri, and J. Azeredo. 2011. Listeria
monocytogenes and Salmonella enterica Enteritidis Biofilms Susceptibility to Different
Disinfectants and Stress-Response and Virulence Gene Expression of Surviving Cells.
Microbial Drug Resistance, 17: 181-189.
Rodríguez-Lázaro, D., M. Hernandez, M. Scortti, T. Esteve, J. A. Vázquez-Boland, and
M Pla. 2004. Quantitative detection of Listeria monocytogenes and Listeria innocua by real-
time PCR: assessment of hly, iap , and lin02483 targets and AmpliFluor technology. Applied
and Environmental Microbiology, 70: 1366 -1377
Rollins, S. E, S. M. Rollins, and E. T. Ryan. 2003. Yersinia pestis and the Plague.
American Journal of Clinical Pathology, 119: S78-S85.
Roop, D. L. 2007. Indicator Systems for Assessing Public Health Risk in Waters. Masters
Thesis in Environmental Engineering, Worcester Polytechnic Institute, UK.
Runion, R. 2008. Factors to consider in wastewater-2. Ezine Articles (April 14). Available
from http://ezinearticles.com/?factors-To-Consider-Wastewater--2&
Russell. A. D. 2003. Similarities and differences in the responses of microorganisms to
biocides. Journal of Antimicrobial Chemotherapy, 52: 750–763.
Safdar, A., and D. Armstrong. 2003. Antimicrobial activities against 84 Listeria
monocytogenes isolates from patients with systemic listeriosis at a comprehensive cancer
center (1955–1997). Journal of Clinical Microbioogyl, 41: 483-485.
SANCOR. 1984. Report of the ad hocworking committee. Lusher, J. A. (Ed.). Established by
the Marine Pollution Committee of the South African National Committee for Oceanographic
Research, South African Network for Coastal and Oceanic Research, 25.
152
Santo Domingo, J. W., and T. A. Edge. 2010. Identification of primary sources of faecal
pollution. Safe Management of Shellfish and Harvest Waters, 5: 61-90.
Sagripanti, J., and A. Bonifacino. 2000. Resistance of Pseudomonas aeruginosa to Liquid
Disinfectants onContaminated Surfaces before Formation of Biofilms. Journal of AOAC
International, 83: 1415-1422.
Samie, A., C. L. Obi, J. O. Igumbor, and M. N. B. Momba. 2009. Focus on 14 sewage
treatment plants in the Mpumalanga Province, South Africa in order to gauge the efficiency
of wastewater treatment. African Journal of Biotechnology, 8: 3276-3285.
Sarme, B., C. Acharya, and S. R. Joshi. 2010. Pseudomonads: A versatile bacterial group
exhibitingdual resistance to metals and antibiotics. African Journal of Microbiology
Research, 4: 2828-2835.
Schuchat, A., B. Swaminathan, and C. V. Broome. 1991. Epidemiology of human
listeriosis. Clinical Microbiological Review, 4: 169-183.
Sartory, P. D., L. Bonnadonna, P. Gosling, M. Janda, and D. van der Kooij. 1996.
Aeromonas: Guidelines for drinking water quality. Quality and environmental Services.
Sechi, L.A., A. Deriu, M. P. Falchi, G. Fadda, and S. Zanetti. 2002. Distribution of
virulence genes in Aeromonas spp. Isolated from Sardinian waters and from patients with
diarrhoea. Journal of Applied Microbiology, 92: 221-227.
Scott. T. M., M. R. McLaughlin, V. J. Harwood, V. Chivukula, A. Levine, A.
Gennaccaro, J. Lukasik, S. R. Farrah, and J. B. Rose. 2003. Reduction of pathogens,
indicator bacteria, and alternative indicators by wastewater treatment and reclamation
processes. Water Science and Technology: Water Supply, 3: 247–252.
153
Shakuntala, I., S. V. S. Malik, S. B. Barbuddhe, and D. B. Rawool. 2006. Isolation of
Listeria monocytogenes from buffaloes with reproductive disorders and its confirmation by
polymerase chain reaction. Vetenary Microbiology, 117: 229-234.
Sharma, S., P. Sachdeva, and J. S. Virdi. 2003. Emerging water-borne pathogens. Applied
Microbiology and Biotechnology,. 61: 424–428.
Shatanawi, M., A. Hamdy, and H. Smadi. 2006. Urban wastewater: Problems, risks and its
potential use for irrigation. Mediterranean Agronomic Institute of Bari, 9: 15-44.
Shrivastava, R., R. K. Upreti, S. R. Jain, K. N. Prasad, P. K. Seth, and U. C.
Chaturvedia. 2004. Suboptimal chlorine treatment of drinking water leads to selection of
multidrug-resistant Pseudomonas aeruginosa. Ecotoxicology and Environmental Safety, 58:
277–283.
Silva, J., Castillo, G., L. Callejas, H. López, and J. Olmos. 2006. Frequency of transferable
multiple antibiotic resistance amongst coliform bacteria isolated from a treated sewage
effluent in Antofagasta, Chile. Electronic Journal of Biotechnology, 9: 533-549.
Simoês, M., L. C. Simoês, M. J. Vieira. 2009. Species association increases biofilm
resistance to chemical and mechanical treatments. Water research, 43: 229 – 237.
Sinha, I., I. Choudhary, and J. S. Virdi. 2000. Isolation of Yersinia enterocolitica and
Yersinia intermedia from wastewaters and their biochemical and serological characteristics.
Current Science, 74: 510 – 513.
Slawson, R. M. 2011. Waterborne Pathogens and Indicators: An Overview of Sources,
Persistence and Associated Human Health Risk Potential. Great Lakes Working Group on
behalf of the International Joint Commission, 1-26.
154
Small, D. A., W, Chang, F. Toghrol, W. E. Bentley. 2006. Toxicogenomic analysis of
sodium hypochlorite antimicrobial mechanisms in Pseudomonas aeruginosa. Applied
Microbiology and biotechnology, 06: 1-10
Soler, L., M. J. Figueras, M. R. Chacón, and J. Vila. 2002. Potential virulence and
antimicrobial susceptibility of Aeromonas popoffii recovered from freshwater and seawater.
FEMS Immunology and Medical Microbiology, 32: 243-247.
Stanfield, G., M. Lechevallier, and M. Snozzi. 2002. Treatment Efficiency. In: Assessing
microbial safety of drinking water: Imporoving approaches and methods (Eds. Dufour A.; Snizzi M.;
Koster, W.; et al.), IWA Publishing, 159-178
Steve, H., S. Imane, Z. Omar, B. Elias, B., Elie, and A. Nisreen. 2009. Antimicrobial
resistance of Listeria monocytogenes isolated from dairy-based food products. Science of the
Total Environment, 407: 4022-4027.
Stokes, H. W., and M. R. Gillings. 2011. Gene flow, mobile genetic elements and the
recruitment of antibiotic resistance genes into Gram-negative pathogens. Federation of
European Microbiological Societies Microbiology reviews, 35; 1-30.
Tirodimos, I., M. Arvanitidou, T. Dardavessis, A. Bisiklis, and S. Alexiou-Daniil. 2011.
Prevalence and antibiotic resistance of Pseudomonas aeruginosa isolated from swimming
pools in northern Greece. Eastern Mediterranean Health Journal, 16: 783-787.
Tirumalai, P. S. 2013. Listeriosis and Listeria monocytogenes in India. Wudpecker Journal
of Food Technology, 1: 098 – 103.
Toze, S. 1997. Reuse of effluent water – benefits and risk. CSIRO Land and Water report.
155
Tree, J. A., M. R. Adams, and D. N. Lees. 2003. Chlorination of indicator bacteria and
viruses in primary sewage effluent. Applied Environmental Microbiology, 69: 2038-2043.
Trower, C. J., S. Abo, K. N. Majeed, and M. von Itzstein. 2000. Production of an
enterotoxin by a gastro-enteritis-associated Aeromonas strain. Journal of Medical
Microbiology, 49: 121-126.
Tyagi, K., A. K. Chopra, A. A. Kazmi, and Arvind Kumar. 2006. Alternative Microbial
Indicators of Faecal Pollution: Current Perspective. Iran. Journal of Environmental and
Health Sciences 3; 205-216.
United Nations Environmental Programmes (UNEP). 2010. Sick water: The central roleof
wastewater management in sustainable development. A Rapid Response Assessment. United
Nations Environment Programme, UN-HABITAT, GRID-Arendal assessment.
United States Environmental Protection Agency (U.S. EPA). 2000. Improved
Enumeration Methods for the Recreational Water Quality Indicators: Enterococci and
Escherichia coli. EPA/821/R-97/004. Office of Science and Technology, Washington, DC,
55.
United States Environmental Protection Agency (U.S. EPA). 2004. Primer for Municipal
Wastewater treatment systems. U.S. EPA, Washington DC.
U.S. Environmental Protection Agency Water Page (2011): National Beach Guidance and
Required Performance Criteria: Indicator
Organisms. http://water.epa.gov/grants_funding/beachgrants/app1c.cfm
Upadhyay, A. R., V. K. Mishra, S. K. Pandey SK, and B. D. Tripathi. 2007. Biofiltration
of secondary treated municipal wastewater in tropical city. Ecology and Engineering, 30: 9-
15.
156
Vandan, N., S. Ravindranath, and J. R. Bandekar. 2011. Prevalence, Characterization,
and Antimicrobial Resistance of Aeromonas Strains from Various Retail Food Products in
Mumbai, India. Indian Journal of Food Science, 76: 486-492.
Venkateswaran, K., T. Takai, I. M. Navarro, H. Nakano, H. Hashimoto, and R. J.
Siebeling. 1989. Ecology of Vibrio cholerae non-01 and Salmonella spp. and role of
zooplankton in their seasonal distribution in Fukuyama coastal waters, Japan. Applied
Environmental Microbiology, 55; 1591-1598.
Venter, J. M. E., J. van Heerden, J. C. Vivier, W. O. K. Grabow and M. B. Taylor.
2007. Hepatitis A virus in surface water in South Africa: what are the risks? Journal of
Water and Health, 5: 229-240.
Vila, J., F. Marco, L. Soler, M. Chacon, and M. J. Figueras. 2003. Aeromonas spp. and
Traveler’s Diarrhea: Clinical Features and Antimicrobial Resistance. Emerging Infectious
Diseases.9: 552-555.
Volkmann, H., T. Schwartz, P. Bischoff, S. Kirchen and U. Obst. 2004. Detection of
clinically relevant antibiotic-resistance genes in municipal wastewater using real-time PCR
(TaqMan). Journal of Microbological Methods 56: 277-286.
Wade, T. J., R. L. Calderon, E. Sams, M. Beach, K. P. Brenner, A. H. Williams and A.
P. Dufour. 2006. Rapidly measured indicators of recreational water quality ar predictive of
swimming-associated gastrointestinal illness. Environmental Health Perspectives. 114: 24-28.
Walker, J.K., J. H. Morgan, J. McLauchlin, K. A. Grant, and J. A. Shallcross. 1994.
Listeria ivanovii isolated from a case of ovine meningoencephalitis. Veterinary Microbiology
59: 193-202.
157
Wang, G., K. D. Tyler, C.K. Munro, and W. M. Johnson. 1996. Characterization of
cytotoxic, hemolytic Aeromonas caviae clinical isolates and their identification by
determining presence of a unique hemolysin gene. Journal of Clinical Microbiology, 34:
3203–3205
Wang, Y., and J. Gu. 2003. Cape Town, South Africa. Environmental Aeromonas and
Vibrio spp. isolated from Mai Po Nature Reserve and Inner Deep Bay of Hong Kong, and
their responses to environmental factors. International Symposium on Health-related Water.
September 2003, 108-110.
Water Supply and Sanitation Collaborative Council (WSSCC). 2008. A guide to
investigating one of the biggest scandals of the last 50 years.
Watkins, J. and K. P. Sleath. 1981. Isolation and enumeration of Listeria monocytogenes
from sewage, sewage sludge, and river water. Journal of Applied Bacteriology, 50: 1-9.
Wigle, T. 1992. Future climate on the Mediterranean basin with particular emphasis on
changes in precipitation. Climate change and the Mediterranean. UNEP, New YORK.
Wilkes, G., T. Edge, V. Gannon, C. Jokinen, E. Lyautey, D. Medeiros, N. Neumann, N.
Ruecker, E. Topp and D.R. Lapen. 2009. Seasonal relationships among indicator bacteria,
pathogenic bacteria, Cryptosporidium oocysts, Giardia cysts, and hydrological indices for
surface waters within an agricultural landscape. Water Research, 43:2209-2223.
Wood, L. F., A. J. Leech, and D. E. Ohman. 2006. Cell wall-inhibitory antibiotics activate
the alginate biosynthesis operon in Pseudomonas aeruginosa: roles of σ22 (AlgT) and the
AlgW and Prc proteases. Molecular Microbiology, 62: 412–426.
158
Woodall, C. J. 2008.Waterborne diseases – What are the primary killers? Desalination. 252:
199-204.
World Health Organisation (WHO) 1997. Nitrogen oxides. Environmental Health Criteria.
Geneva, Switzerland.
World Health Organization (WHO) 2006. Guidelines for the Safe use of Wastewater,
Excreta and Greywater: Wastewater Use in Agriculture, France.
World Health Organization (WHO) 2008. Progress in drinking water and sanitation:
special focus on sanitation, world Health Organization Geleva. Switzerland. France.
World Health Organization and the Food and Agriculture Organization of the United
Nations (WHO/FAO). 2004. Risk assessment of Listeria monocytogenes in ready-to-eat
foods : interpretative summary. Microbiological risk assessment series, 4: 1-78.
Xi, C. Y. Zhang, C. F. Marrs, W. Ye, C. Simon, B. Foxman, and J. Nriagu. 2009.
Prevalence of Antibiotic Resistance in Drinking Water Treatment and Distribution Systems.
Applied and Environmental Microbiology, 75: 5714–5718.
Yàñez, M. A., V. Catala´n, D. Apra´iz, M. J. Figueras, and A. J. Martı´nez- Murcia.
2003. Phylogenetic analysis of members of the genus Aeromonas based on gyrB gene
sequences. International Journal of System and Evolution Microbiology, 53: 875–883.
Yousr, A. H., S. Napis, G. R. A. Rusul, and R. Son, 2007. Detection of Aerolysin and
Hemolysin genes in Aeromonas spp. isolated from environmental and shellfish sources by
polymerase chain reaction. ASEAN Food Journal, 14: 115-122.
Zeng L. 2004. Pseudomonas aeruginosa pathogenicity and antibiotic resistance.
microbiology and immunology, University of Florida.
159
Zhang, Y., E. Yeh, G. Hall, J. Cripe, A. Bhagwat, and J Meng. 2007. Characterization of
Listeria monocytogenes isolated from retail foods. International Journal of Food
Microbiology, 113: 47-53.
Zhang, X., T. Zhang, and .H. H. P. Fang. 2009. Antibiotic resistance genes in water
environment. Applied Microbiology and Biotechnology, 82: 397–414.
Zhang Q. 1, G. Lambert, D. Liao, H. Kim, K. Robin, C. K. Tung, N. Pourmand, and R.
H. Austin. 2011 Acceleration of emergence of bacterial antibiotic resistance in connected
microenvironments, Science, 333:1764-1767
Zuraini, M. I. , M. Maimunah, S. M. Sharifah Aminah, M. M. Noor, H. Y. Lee, and R.
Son. 2001. Antibiogram Profiles of Listeria monocytogenes isolated from foods. Second
International Conference on Biotechnology and Food Science. IPCBEE, 7: 133-137.
7.0 Appendices
APPENDIX I
1. media and reagents
1.1 MRVP reagents
Methyle red solution
0.1g of methyl red
300 ml of ethanol (95%)
200 ml of deionized water added to make 500 ml of a 0.05% (wt/vol) solution in 60%
(vol/vol) ethanol.
Voges-Proskauer reagents
160
Barritt’s reagent A: 5% (wt/vol) a-naphthol in absolute ethanol
Barritt’s reagent B: 40% (wt/vol) KOH in deionized water
Reagents were prepared fresh.
All the components were added to 1000ml of distilled water.
1.3 TSI slants g/500ml
Beef extract 1.5
Yeast extract 1.5
Peptone 10
Glucose 0.5
Lactose 5
Sucrose 5
Ferrous sulphate 0.1
NaCl 2.5
Sodium Thiosulfate 0.15
Phenol red 0.012
Nutrient agar 6.5
1.4 Urease broth g/500ml
Yeast extract 0.5
Potassium phosphate monobasic 4.5g
Potassium phosphate dibasic 4.5
Urea 10
Phenol red 0.0005
1.5 Casein g/500ml
161
Skim milk 37.5
Nutrient agar 10
1.6 MRVP broth g/500ml
Peptone 3.5
Potassium phosphate 2.5
Dextrose 2.5
All broth and media components the components were added to 500ml of distilled water, mixed, boiled and then sterilized via autoclaving at 121°C for 15 minutes.

162
Temperature DO BOD COD Conductivity Resistivity Salinity TDS TSS pH Turbidity Nitrate Phosphate Residual Cl2
°C mg/L mg/L mg/L (µS/cm) Ὠ.cm % mg/L mg/L Ntu mg/L mg/L mg/L
AUTU
MN
Mar
ch
BC 26.00 ±0
5.58 ±0.14
2.23 ±0.36
90.44 ±4.48
839.67 ±0.57
1191.00 ±1
0.41 ±0
411.33 ±0.57
0.01 ±0
7.11±0.02
7.91 ±0.32
- - -
DP 25.00 ±0
4.01 ±0.25
5.13 ±0.18
<10 ±0
888.00 ±0
1126.00 ±1
0.44 ±0
436.00 ±1.00
0.03 ±0.03
7.36 ±0.06
23.40 ±12.12
- - -
US 26.00 ±0
5.19 ±0.6
5.62 ±1.01
161.33 ±1.32
757.67 ±2.51
1320.33 ±4.51
0.37 ±0
370.00 ±1.00
1.24 ±4.20
7.25 ±0.08
16.67 ±0.37
- - -
DS 25.50 ±0
5.10 ±0.54
5.62 ±0.24
191.94 ±2.37
714.67 ±2.08
1400.00 ±4.25
0.35 ±1.8
348.67 ±1.15
1.13 ±1.03
7.24 ±0.05
15.27 ±0.11
- - -
April
BC 22.00 ±0
4.69 ±0.25
3.30 ±0.97
127.89 ±0.57
783.33 ±2.08
1276.67 ±3.21
0.38 ±0
383.00 ±1.00
0.10 ±0.01
7.38 ±0.05
53.98 ±0.02
<0.057 ±0
2.11 ±0
116.35 ±0
DP 22.00 ±0
4.80 ±0.58
3.44 ±0.67
152.89 ±0.57
903.67 ±2.08
1106.67 ±2.30
0.44 ±0
444.00 ±1.00
0.07 ±0.02
7.22 ±0.1
71.02 ±0.28
<0.057 ±0
2.10 ±0
219.64 ±0
US 21.00 ±0
4.32 ±0.17
8.49 ±0.47
309.22 ±1.52
997.67 ±2.88
1004.00 ±0
0.49 ±0
491.00 ±1.73
0.02 ±0
7.29 ±0.12
18.35 ±0
0.86 ±0
0.23 ±0
260.56 ±0
DS 21.00 ±0
4.80 ±0.30
6.33 ±0.21
303.00 ±0
676.33 ±4.35
1478.67 ±2.31
0.33 ±0
329.00 ±2.08
0.01 ±0
7.40 ±0.05
14.60 ±0
0.32 ±0
0.38 ±0
108.40 ±0
May
BC 22.00 ±0
5.38 ±0.1
1.40 ±0.19
71.56 ±0.47
853.00 ±0
1173.00 ±0
0.42 ±0
418.00 ±0
0.04 ±0
7.02 ±0.03
20.65 ±0
0.16 ±0
2.72 ±0
198.93 ±0
DP 21.00 ±0
4.81 ±0.01
3.04 ±0.17
< 10 ±0
966.00 ±0
1036.00 ±1
0.48 ±0
475.00 ±0
0.02 ±0.01
7.06 ±0.02
14.22 ±0.17
0.20 ±0
2.34 ±0
186.80 ±0
US 21.00 ±0
5.71 ±0.58
4.52 ±0.79
51.00 ±0.28
2115.67 ±0.57
473.00 ±1.15
1.08 ±0
1067.00 ±3.47
0.01 ±0
6.87 ±0.04
13.58 ±0
1.03 ±0
1.08 ±0
1090.00 ±0
DS 22.00 ±0
5.04 ±0.25
5.06 ±0.30
301.33 ±.66
621.00 ±2.65
1612.33 ±3.51
0.30 ±0
302.00 ±1.00
5.93 ±9.10
6.85 ±0.04
13.58 ±0
1.72 ±0
0.82 ±0
214.37 ±0
June
BC 13.50 ±0
4.35 ±0.48
4.01 ±0.30
113.33 ±0.58
703.00 ±1.00
1423.33 ±2.57
0.34 ±0
342.67 ±0.5
0.02 ±0
7.26 ±0
7.08 ±0.30
5.98 ±0
12.38 ±0
150.16 ±0
WIN
TER
DP 12.67 ±0.29
5.13 ±0.03
4.31 ±0.21
207.17 ±0
757.33 ±2.08
1320.33 ±3.25
0.37 ±0
368.33 ±2.08
0.02 ±0
7.27 ±0
6.48 ±0.07
3.92 ±0
9.02 ±0
163.67 ±0
US 13.00 ±0
4.48 ±0.25
9.61 ±0.44
113.83 ±0.58
1082.33 ±2.08
924.00 ±1.73
0.54 ±0
534.33 ±1.15
0.01 ±0
7.57 ±0
6.95 ±0.06
2.40 ±0
2.17 ±0
918.93 ±0
DS 12.00 ±0
5.22 ±0.25
7.34 ±0.35
89.39 ±0.58
633.33 ±0.58
1580.00 ±1.73
0.31 ±0
308.00 ±0
0.01 ±0
7.76 ±0
10.89 ±0.21
1.78 ±0
1.44 ±0
164.90 ±0
July
BC 14.80 ±0
4.10 ±0.40
2.13 ±0.38
116.56 ±0.58
724.67 ±6.57
1370.67 ±7.3
0.34 ±0
348.33 ±7.37
0.03 ±0.01
7.20 ±0.01
20.30 ±0.06
1.00 ±0
1.83 ±0
555.13 ±0
DP 15.30 ±0.17
4.49 ±0.59
3.10 ±0.19
291.22 ±0.58
849.67 ±1.15
1177.00 ±1.00
0.42 ±0
416.33 ±0.58
0.03 ±0
7.00 ±0
25.67 ±0.37
0.89 ±0
0.75 ±0
202.80 ±0
US 14.93 ±0.12
4.49 ±0.28
7.±80 ±1.03
311.72 ±0.52
1428.67 ±4.16
700.00 ±1.73
0.72 ±0
710.00 ±4.26
0.01 ±0
6.96 ±0.02
12.82 ±0.15
0.79 ±0
-0.03 ±0
210.33 ±0
DS 15.83 ±0.29
4.53 ±0.21
6.75±0.64
311.72 ±0.58
606.00 ±1.73
1650.33 ±4.04
0.29 ±0
294.67 ±0.58
0.02 ±0
6.93 ±0.02
23.18 ±0.12
1.35 ±0
0.09 ±0
191.87 ±0
Augu
st
BC 21.00 ±0
4.10 ±0.03
1.54 ±0.19
310.11 ±0.58
754.66 ±3.79
1319.33 ±6.80
0.37 ±0
370.33 ±2.08
0.04 ±0
6.85 ±0.11
56.37 ±0.35
- - 93.36 ±0
DP 19.00 ±0
4.49 ±0.87
2.23 ±0.47
182.78 ±0.58
840.00 ±1
1190.33 ±1.52
0.41 ±0
411.67 ±0.57
0.05 ±0
7.09 ±0.04
68.53 ±0.56
- - 43.08 ±0
US 20.00 ±0
4.49 ±0.25
7.80 ±0.30
105.89±0.±0.58
899.00 ±3.60
1112.33 ±4.72
0.44 ±0
441.33 ±1.58
0.02 ±0
7.12 ±0.02
28.73 ±0.05
- - 46.14 ±0
DS 19.00 ±0
4.53 ±0.25
5.74 ±0.14
309.56 ±0.58
676.00 ±3.25
1479.00 ±7.55
0.33 ±0
329.67 ±1.53
0.02 ±0
7.26 ±0.02
20.76 ±0.05
- - 45.01 ±0
Table: Physico-chemical profiles of treated wastewater effluents from NWWTP and NGWWTP and the receiving water bodies over the sampling period (March-February)

163
Temperature DO BOD COD Conductivity Resistivity Salinity TDS TSS pH Turbidity Nitrate Phosphate Residual Cl2 °C mg/L mg/L mg/L (µS/cm) Ὠ.cm % mg/L mg/L Ntu mg/L mg/L mg/L
SPRI
NG
Sept
embe
r
BC 25.67 ±0.25
6.41 ±0.12
1.91 ±0.24
308.67 ±0.58
864.00 ±4.36
1156.67 ±6.35
0.42 ±0
423.67 ±0.30
0.03 ±0.01
6.76 ±0.02
20.73 ±0.06
0.15 ±0
1.70 ±0
31.49 ±0
DP 26.00 ±0
6.61 ±0.05
2.52 ±0.31
309.00 ±0
789.67 ±1.15
1266.33 ±2.08
0.39 ±0.00
386.33 ±0.57
0.02 ±0.04
6.82 ±0.04
19.27 ±0.02
0.08 ±0
1.90 ±0
39.10 ±0
US 26.00 ±0
8.12 ±0.03
7.90 ±0.21
55.56 ±0
509.33 ±1.15
1963.00 ±3.46
0.25 ±0
246.67 ±0.58
0.01 ±0.01
6.41 ±0.05
10.67 ±0.06
0.17 ±0
0.10 ±0
29.58 ±0
DS 25.50 ±0.25
7.56 ±0.07
7.22 ±0.25
139.67 ±0.58
790.33 ±1.52
1265.33 ±2.08
0.39 ±0
386.33 ±0.58
0.01 ±0
6.52 ±0.02
11.50 ±0.1
1.47 ±0
0.16 ±0
40.10 ±0
Oct
ober
BC 22.00 ±0
7.31 ±0.07
3.18 ±0.32
306.89 ±0
831.67 ±1.15
1202.33 ±2.08
0.41 ±0
407.33 ±0.58
0.03 ±0.04
6.60 ±0.05
30.53 ±0.2
0.88 ±0
1.88 ±0
39.46 ±0
DP 23.00 ±0
7.96 ±0.03
3.93 ±0.17
109.89 ±0
832.33 ±0.57
1200.67 ±0.58
0.41 ±0
408.00 ±0
0.02 ±0.01
6.75 ±0.05
28.50 ±0
0.82 ±0
1.57 ±0
34.37 ±0
US 24.00 ±0
7.70 ±0.04
7.08 ±0.19
195.33 ±0
499.33 ±0.58
2003.00 ±1.73
0.24 ±0
241.33 ±0.57
0.36 ±0.01
7.02 ±0
17.07 ±0.02
1.02 ±0
0.37 ±0
32.51 ±0
DS 24.00 ±0
7.64 ±0.09
6.93 ±0.55
148.00 ±0
689.67 ±0.57
1449.33 ±0.58
0.34 ±0
336.00 ±0
0.01 ±0
6.91 ±0.01
29.03 ±0.05
1.30 ±0
0.42 ±0
24.96 ±0
Nov
embe
r
BC 23.00 ±0
6.87 ±0.04
3.49 ±0.28
123.78 ±0.58
907.67 ±0
1102.00 ±1.73
0.44 ±0
445.33 ±0.58
0.05 ±0.01
6.79 ±0.01
39.97 ±0.11
0.28 ±0
3.53 ±0
20.40 ±0
DP 22.00 ±0
6.86 ±0.05
3.35 ±0.36
287.22 ±0.58
970.00 ±0
1031.00 ±4.36
0.48 ±0.05
477.33 ±2.08
0.03 ±0
6.68 ±0.02
48.53 ±0.55
0.31 ±0
3.69 ±0
34.17 ±0
US 21.00 ±0
7.62 ±0.03
8.38 ±0.43
241.78 ±0.58
429.00 ±0
2330.00 ±0
0.20 ±0.05
206.87 ±0.23
0.01 ±0.6
6.86 ±0.01
21.33 ±0.76
0.97 ±0
0.64 ±0
33.62 ±0
DS 22.50 ±0
7.42 ±0.05
7.42 ±0.28
246.11 ±0.58
718.00 ±0
1392.33 ±0.58
0.35 ±0
350.00 ±0
0.01 ±0.1
6.72 ±0.04
14.10 ±0.45
3.38 ±0
0.45 ±0
28.17 ±0
Dece
mbe
r
BC 25.00 ±0
6.92 ±0.05
3.27 ±0.03
170.67 ±0.57
872.33 ±0.58
1760.33 ±3.78
0.43 ±0
428.00 ±0
0.05 ±0
6.78 ±0.03
36.13 ±0.40
0.24 ±0
1.82 ±0
24.17 ±0
SUM
MER
DP 21.00 ±0
7.60 ±0.02
3.54 ±0.27
153.56 ±1.154
961.67 ±2.08
1806.00 ±2.64
0.47 ±0
473.00 ±1
0.02 ±0.01
6.69 ±0.01
31.77 ±0.23
0.77 ±0
1.37 ±0
28.64 ±0
US 22.00 ±0
7.50 ±0.02
7.04 ±0.47
274.33 ±0.58
415.33 ±0.58
2082.00 ±2.00
0.20 ±0
200.03 ±0.08
0.01 ±0
6.85 ±0.01
12.20 ±0.26
0.39 ±0
0.03 ±0
24.66 ±0
DS 22.00 ±0
7.59 ±0.02
7.52 ±0.09
205.33 ±0.27
735.67 ±1015
2010.33 ±0.57
0.36 ±0
359.33 ±0.58
0.01 ±0
6.64 ±0.06
10.33 ±0.27
1.95 ±0
0.35 ±0
29.12 ±0
Janu
ary
BC 24.00 ±0
7.60 ±0.03
3.72 ±008
306.89 ±2.08
804.00 ±1
1244.00 ±4.36
0.39 ±0
393.67 ±0.58
0.02 ±0.2
6.84 ±0.01
12.67 ±0.15
< 0.017 ±0
4.70 ±0
47.07 ±0
DP 23.00 ±0
7.66 ±0.03
3.77 ±0.10
109.89 ±0.58
841.33 ±1.56
1188.33 ±2.08
0.41 ±0
412.33 ±0.58
0.04 ±0.02
6.87 ±0.03
32.67 ±0.82
< 0.017 ±0
4.69 ±0
56.64 ±0
US 24.00 ±0
7.61 ±0.05
7.45 ±0.11
195.33 ±3.21
323.67 ±0.5
3093.33 ±5.77
0.15 ±0
155.10 ±0.25
0.03 ±0.04
7.04 ±0.01
11.40 ±0.26
0.58 ±0
0.23 ±0
25.04 ±0
DS 24.00 ±0
7.66 ±0.04
6.67 ±0.16
148.00 ±0
672.00 ±1.00
1488.33 ±2.88
0.33 ±0
327.33 ±0.57
0.01 ±0.03
6.92 ±0.02
8.72 ±0.04
1.22 ±0
0.12 ±0
36.18 ±0
Febr
uary
BC 25.00 ±0
5.92 ±0.08
1.74 ±0.15
306.89 ±4.58
925.33 ±1.52
1080.67 ±1.58
0.45 ±0.01
454.33 ±0.58
0.07 ±0.01
7.80 ±0.02
40.37 ±0.21
< 0.017 ±0
3.51 ±0
40.02 ±0
DP 25.00 ±0
6.87 ±0.03
2.81 ±0.08
109.89 ±0.58
931.00 ±1.73
1188.33 ±2.08
0.46 ±0
457.67 ±1.15
0.03 ±0.02
7.88 ±0.01
44.07 ±0.25
< 0.017 ±0
2.71 ±0
65.13 ±0
US 25.00 ±0
7.48 ±0.01
7.56 ±0.19
195.33 ±0.58
319.33 ±0.57
3093.33 ±5.77
0.15 ±0
153.07 ±0.30
0.02 ±0.01
7.41 ±0.01
6.37 ±0.05
0.22 ±0
0.03 ±0
52.33 ±0
DS 27.00 ±0
7.51 ±0.02
8.19 ±0.78
148.00 ±0
641.33 ±1.154
1488.33 ±2.89
0.31 ±0
312.33 ±0.58
0.01 ±0
7.77 ±0.01
5.94 ±0.09
0.16 ±0
0.53 ±0
56.61 ±0
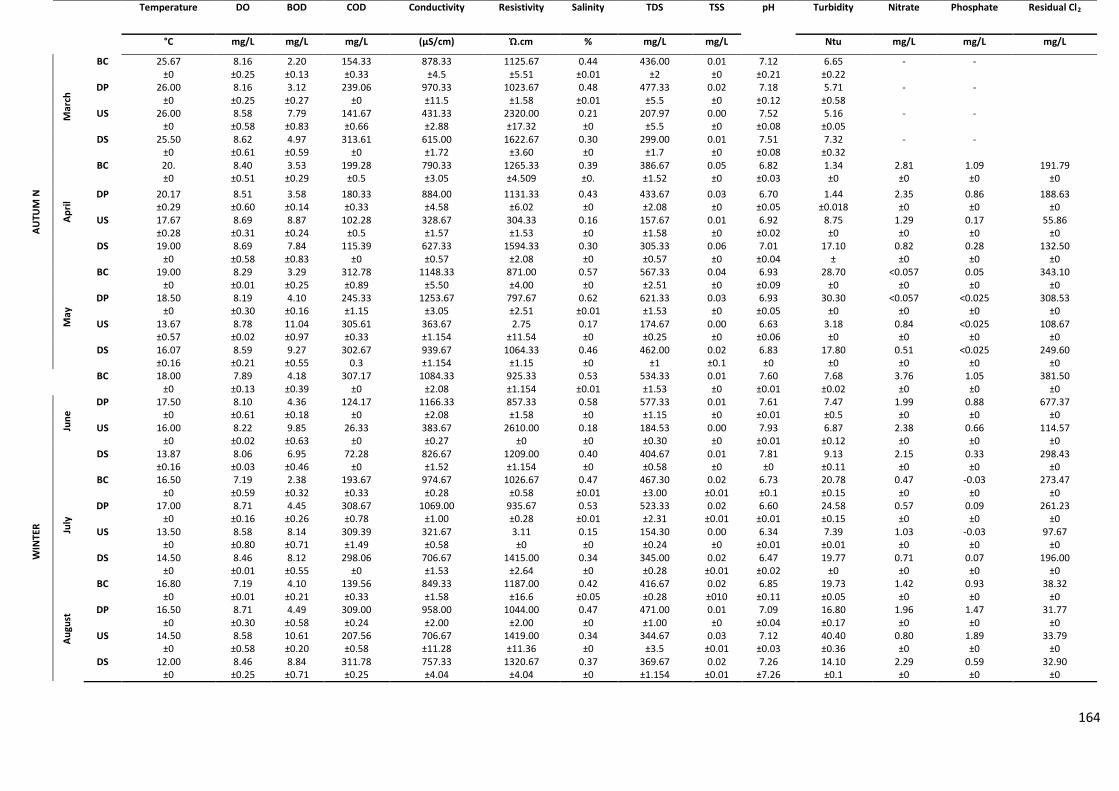
164
Temperature DO BOD COD Conductivity Resistivity Salinity TDS TSS pH Turbidity Nitrate Phosphate Residual Cl2
°C mg/L mg/L mg/L (µS/cm) Ὠ.cm % mg/L mg/L Ntu mg/L mg/L mg/L AU
TUM
N
Mar
ch
BC 25.67 ±0
8.16 ±0.25
2.20 ±0.13
154.33 ±0.33
878.33 ±4.5
1125.67 ±5.51
0.44 ±0.01
436.00 ±2
0.01 ±0
7.12 ±0.21
6.65 ±0.22
- -
DP 26.00 ±0
8.16 ±0.25
3.12 ±0.27
239.06 ±0
970.33 ±11.5
1023.67 ±1.58
0.48 ±0.01
477.33 ±5.5
0.02 ±0
7.18 ±0.12
5.71 ±0.58
- -
US 26.00 ±0
8.58 ±0.58
7.79 ±0.83
141.67 ±0.66
431.33 ±2.88
2320.00 ±17.32
0.21 ±0
207.97 ±5.5
0.00 ±0
7.52 ±0.08
5.16 ±0.05
- -
DS 25.50 ±0
8.62 ±0.61
4.97 ±0.59
313.61 ±0
615.00 ±1.72
1622.67 ±3.60
0.30 ±0
299.00 ±1.7
0.01 ±0
7.51 ±0.08
7.32 ±0.32
- -
April
BC 20. ±0
8.40 ±0.51
3.53 ±0.29
199.28 ±0.5
790.33 ±3.05
1265.33 ±4.509
0.39 ±0.
386.67 ±1.52
0.05 ±0
6.82 ±0.03
1.34 ±0
2.81 ±0
1.09 ±0
191.79 ±0
DP 20.17 ±0.29
8.51 ±0.60
3.58 ±0.14
180.33 ±0.33
884.00 ±4.58
1131.33 ±6.02
0.43 ±0
433.67 ±2.08
0.03 ±0
6.70 ±0.05
1.44 ±0.018
2.35 ±0
0.86 ±0
188.63 ±0
US 17.67 ±0.28
8.69 ±0.31
8.87 ±0.24
102.28 ±0.5
328.67 ±1.57
304.33 ±1.53
0.16 ±0
157.67 ±1.58
0.01 ±0
6.92 ±0.02
8.75 ±0
1.29 ±0
0.17 ±0
55.86 ±0
DS 19.00 ±0
8.69 ±0.58
7.84 ±0.83
115.39 ±0
627.33 ±0.57
1594.33 ±2.08
0.30 ±0
305.33 ±0.57
0.06 ±0
7.01 ±0.04
17.10 ±
0.82 ±0
0.28 ±0
132.50 ±0
May
BC 19.00 ±0
8.29 ±0.01
3.29 ±0.25
312.78 ±0.89
1148.33 ±5.50
871.00 ±4.00
0.57 ±0
567.33 ±2.51
0.04 ±0
6.93 ±0.09
28.70 ±0
<0.057 ±0
0.05 ±0
343.10 ±0
DP 18.50 ±0
8.19 ±0.30
4.10 ±0.16
245.33 ±1.15
1253.67 ±3.05
797.67 ±2.51
0.62 ±0.01
621.33 ±1.53
0.03 ±0
6.93 ±0.05
30.30 ±0
<0.057 ±0
<0.025 ±0
308.53 ±0
US 13.67 ±0.57
8.78 ±0.02
11.04 ±0.97
305.61 ±0.33
363.67 ±1.154
2.75 ±11.54
0.17 ±0
174.67 ±0.25
0.00 ±0
6.63 ±0.06
3.18 ±0
0.84 ±0
<0.025 ±0
108.67 ±0
DS 16.07 ±0.16
8.59 ±0.21
9.27 ±0.55
302.67 0.3
939.67 ±1.154
1064.33 ±1.15
0.46 ±0
462.00 ±1
0.02 ±0.1
6.83 ±0
17.80 ±0
0.51 ±0
<0.025 ±0
249.60 ±0
June
BC 18.00 ±0
7.89 ±0.13
4.18 ±0.39
307.17 ±0
1084.33 ±2.08
925.33 ±1.154
0.53 ±0.01
534.33 ±1.53
0.01 ±0
7.60 ±0.01
7.68 ±0.02
3.76 ±0
1.05 ±0
381.50 ±0
WIN
TER
DP 17.50 ±0
8.10 ±0.61
4.36 ±0.18
124.17 ±0
1166.33 ±2.08
857.33 ±1.58
0.58 ±0
577.33 ±1.15
0.01 ±0
7.61 ±0.01
7.47 ±0.5
1.99 ±0
0.88 ±0
677.37 ±0
US 16.00 ±0
8.22 ±0.02
9.85 ±0.63
26.33 ±0
383.67 ±0.27
2610.00 ±0
0.18 ±0
184.53 ±0.30
0.00 ±0
7.93 ±0.01
6.87 ±0.12
2.38 ±0
0.66 ±0
114.57 ±0
DS 13.87 ±0.16
8.06 ±0.03
6.95 ±0.46
72.28 ±0
826.67 ±1.52
1209.00 ±1.154
0.40 ±0
404.67 ±0.58
0.01 ±0
7.81 ±0
9.13 ±0.11
2.15 ±0
0.33 ±0
298.43 ±0
July
BC 16.50 ±0
7.19 ±0.59
2.38 ±0.32
193.67 ±0.33
974.67 ±0.28
1026.67 ±0.58
0.47 ±0.01
467.30 ±3.00
0.02 ±0.01
6.73 ±0.1
20.78 ±0.15
0.47 ±0
-0.03 ±0
273.47 ±0
DP 17.00 ±0
8.71 ±0.16
4.45 ±0.26
308.67 ±0.78
1069.00 ±1.00
935.67 ±0.28
0.53 ±0.01
523.33 ±2.31
0.02 ±0.01
6.60 ±0.01
24.58 ±0.15
0.57 ±0
0.09 ±0
261.23 ±0
US 13.50 ±0
8.58 ±0.80
8.14 ±0.71
309.39 ±1.49
321.67 ±0.58
3.11 ±0
0.15 ±0
154.30 ±0.24
0.00 ±0
6.34 ±0.01
7.39 ±0.01
1.03 ±0
-0.03 ±0
97.67 ±0
DS 14.50 ±0
8.46 ±0.01
8.12 ±0.55
298.06 ±0
706.67 ±1.53
1415.00 ±2.64
0.34 ±0
345.00 ±0.28
0.02 ±0.01
6.47 ±0.02
19.77 ±0
0.71 ±0
0.07 ±0
196.00 ±0
Augu
st
BC 16.80 ±0
7.19 ±0.01
4.10 ±0.21
139.56 ±0.33
849.33 ±1.58
1187.00 ±16.6
0.42 ±0.05
416.67 ±0.28
0.02 ±010
6.85 ±0.11
19.73 ±0.05
1.42 ±0
0.93 ±0
38.32 ±0
DP 16.50 ±0
8.71 ±0.30
4.49 ±0.58
309.00 ±0.24
958.00 ±2.00
1044.00 ±2.00
0.47 ±0
471.00 ±1.00
0.01 ±0
7.09 ±0.04
16.80 ±0.17
1.96 ±0
1.47 ±0
31.77 ±0
US 14.50 ±0
8.58 ±0.58
10.61 ±0.20
207.56 ±0.58
706.67 ±11.28
1419.00 ±11.36
0.34 ±0
344.67 ±3.5
0.03 ±0.01
7.12 ±0.03
40.40 ±0.36
0.80 ±0
1.89 ±0
33.79 ±0
DS 12.00 ±0
8.46 ±0.25
8.84 ±0.71
311.78 ±0.25
757.33 ±4.04
1320.67 ±4.04
0.37 ±0
369.67 ±1.154
0.02 ±0.01
7.26 ±7.26
14.10 ±0.1
2.29 ±0
0.59 ±0
32.90 ±0
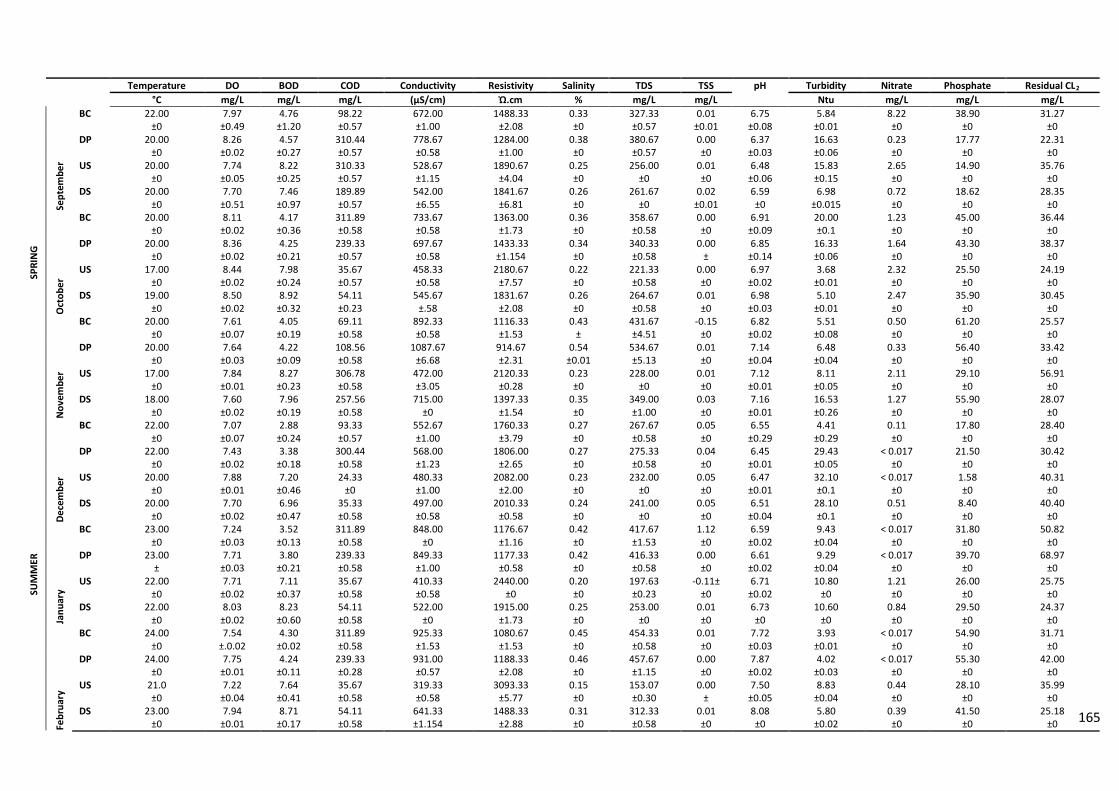
165
Temperature DO BOD COD Conductivity Resistivity Salinity TDS TSS pH Turbidity Nitrate Phosphate Residual CL2 °C mg/L mg/L mg/L (µS/cm) Ὠ.cm % mg/L mg/L Ntu mg/L mg/L mg/L
SPRI
NG
Sept
embe
r
BC 22.00 ±0
7.97 ±0.49
4.76 ±1.20
98.22 ±0.57
672.00 ±1.00
1488.33 ±2.08
0.33 ±0
327.33 ±0.57
0.01 ±0.01
6.75 ±0.08
5.84 ±0.01
8.22 ±0
38.90 ±0
31.27 ±0
DP 20.00 ±0
8.26 ±0.02
4.57 ±0.27
310.44 ±0.57
778.67 ±0.58
1284.00 ±1.00
0.38 ±0
380.67 ±0.57
0.00 ±0
6.37 ±0.03
16.63 ±0.06
0.23 ±0
17.77 ±0
22.31 ±0
US 20.00 ±0
7.74 ±0.05
8.22 ±0.25
310.33 ±0.57
528.67 ±1.15
1890.67 ±4.04
0.25 ±0
256.00 ±0
0.01 ±0
6.48 ±0.06
15.83 ±0.15
2.65 ±0
14.90 ±0
35.76 ±0
DS 20.00 ±0
7.70 ±0.51
7.46 ±0.97
189.89 ±0.57
542.00 ±6.55
1841.67 ±6.81
0.26 ±0
261.67 ±0
0.02 ±0.01
6.59 ±0
6.98 ±0.015
0.72 ±0
18.62 ±0
28.35 ±0
Oct
ober
BC 20.00 ±0
8.11 ±0.02
4.17 ±0.36
311.89 ±0.58
733.67 ±0.58
1363.00 ±1.73
0.36 ±0
358.67 ±0.58
0.00 ±0
6.91 ±0.09
20.00 ±0.1
1.23 ±0
45.00 ±0
36.44 ±0
DP 20.00 ±0
8.36 ±0.02
4.25 ±0.21
239.33 ±0.57
697.67 ±0.58
1433.33 ±1.154
0.34 ±0
340.33 ±0.58
0.00 ±
6.85 ±0.14
16.33 ±0.06
1.64 ±0
43.30 ±0
38.37 ±0
US 17.00 ±0
8.44 ±0.02
7.98 ±0.24
35.67 ±0.57
458.33 ±0.58
2180.67 ±7.57
0.22 ±0
221.33 ±0.58
0.00 ±0
6.97 ±0.02
3.68 ±0.01
2.32 ±0
25.50 ±0
24.19 ±0
DS 19.00 ±0
8.50 ±0.02
8.92 ±0.32
54.11 ±0.23
545.67 ±.58
1831.67 ±2.08
0.26 ±0
264.67 ±0.58
0.01 ±0
6.98 ±0.03
5.10 ±0.01
2.47 ±0
35.90 ±0
30.45 ±0
Nov
embe
r
BC 20.00 ±0
7.61 ±0.07
4.05 ±0.19
69.11 ±0.58
892.33 ±0.58
1116.33 ±1.53
0.43 ±
431.67 ±4.51
-0.15 ±0
6.82 ±0.02
5.51 ±0.08
0.50 ±0
61.20 ±0
25.57 ±0
DP 20.00 ±0
7.64 ±0.03
4.22 ±0.09
108.56 ±0.58
1087.67 ±6.68
914.67 ±2.31
0.54 ±0.01
534.67 ±5.13
0.01 ±0
7.14 ±0.04
6.48 ±0.04
0.33 ±0
56.40 ±0
33.42 ±0
US 17.00 ±0
7.84 ±0.01
8.27 ±0.23
306.78 ±0.58
472.00 ±3.05
2120.33 ±0.28
0.23 ±0
228.00 ±0
0.01 ±0
7.12 ±0.01
8.11 ±0.05
2.11 ±0
29.10 ±0
56.91 ±0
DS 18.00 ±0
7.60 ±0.02
7.96 ±0.19
257.56 ±0.58
715.00 ±0
1397.33 ±1.54
0.35 ±0
349.00 ±1.00
0.03 ±0
7.16 ±0.01
16.53 ±0.26
1.27 ±0
55.90 ±0
28.07 ±0
SUM
MER
Dece
mbe
r
BC 22.00 ±0
7.07 ±0.07
2.88 ±0.24
93.33 ±0.57
552.67 ±1.00
1760.33 ±3.79
0.27 ±0
267.67 ±0.58
0.05 ±0
6.55 ±0.29
4.41 ±0.29
0.11 ±0
17.80 ±0
28.40 ±0
DP 22.00 ±0
7.43 ±0.02
3.38 ±0.18
300.44 ±0.58
568.00 ±1.23
1806.00 ±2.65
0.27 ±0
275.33 ±0.58
0.04 ±0
6.45 ±0.01
29.43 ±0.05
< 0.017 ±0
21.50 ±0
30.42 ±0
US 20.00 ±0
7.88 ±0.01
7.20 ±0.46
24.33 ±0
480.33 ±1.00
2082.00 ±2.00
0.23 ±0
232.00 ±0
0.05 ±0
6.47 ±0.01
32.10 ±0.1
< 0.017 ±0
1.58 ±0
40.31 ±0
DS 20.00 ±0
7.70 ±0.02
6.96 ±0.47
35.33 ±0.58
497.00 ±0.58
2010.33 ±0.58
0.24 ±0
241.00 ±0
0.05 ±0
6.51 ±0.04
28.10 ±0.1
0.51 ±0
8.40 ±0
40.40 ±0
Janu
ary
BC 23.00 ±0
7.24 ±0.03
3.52 ±0.13
311.89 ±0.58
848.00 ±0
1176.67 ±1.16
0.42 ±0
417.67 ±1.53
1.12 ±0
6.59 ±0.02
9.43 ±0.04
< 0.017 ±0
31.80 ±0
50.82 ±0
DP 23.00 ±
7.71 ±0.03
3.80 ±0.21
239.33 ±0.58
849.33 ±1.00
1177.33 ±0.58
0.42 ±0
416.33 ±0.58
0.00 ±0
6.61 ±0.02
9.29 ±0.04
< 0.017 ±0
39.70 ±0
68.97 ±0
US 22.00 ±0
7.71 ±0.02
7.11 ±0.37
35.67 ±0.58
410.33 ±0.58
2440.00 ±0
0.20 ±0
197.63 ±0.23
-0.11± ±0
6.71 ±0.02
10.80 ±0
1.21 ±0
26.00 ±0
25.75 ±0
DS 22.00 ±0
8.03 ±0.02
8.23 ±0.60
54.11 ±0.58
522.00 ±0
1915.00 ±1.73
0.25 ±0
253.00 ±0
0.01 ±0
6.73 ±0
10.60 ±0
0.84 ±0
29.50 ±0
24.37 ±0
Febr
uary
BC 24.00 ±0
7.54 ±.0.02
4.30 ±0.02
311.89 ±0.58
925.33 ±1.53
1080.67 ±1.53
0.45 ±0
454.33 ±0.58
0.01 ±0
7.72 ±0.03
3.93 ±0.01
< 0.017 ±0
54.90 ±0
31.71 ±0
DP 24.00 ±0
7.75 ±0.01
4.24 ±0.11
239.33 ±0.28
931.00 ±0.57
1188.33 ±2.08
0.46 ±0
457.67 ±1.15
0.00 ±0
7.87 ±0.02
4.02 ±0.03
< 0.017 ±0
55.30 ±0
42.00 ±0
US 21.0 ±0
7.22 ±0.04
7.64 ±0.41
35.67 ±0.58
319.33 ±0.58
3093.33 ±5.77
0.15 ±0
153.07 ±0.30
0.00 ±
7.50 ±0.05
8.83 ±0.04
0.44 ±0
28.10 ±0
35.99 ±0
DS 23.00 ±0
7.94 ±0.01
8.71 ±0.17
54.11 ±0.58
641.33 ±1.154
1488.33 ±2.88
0.31 ±0
312.33 ±0.58
0.01 ±0
8.08 ±0
5.80 ±0.02
0.39 ±0
41.50 ±0
25.18 ±0
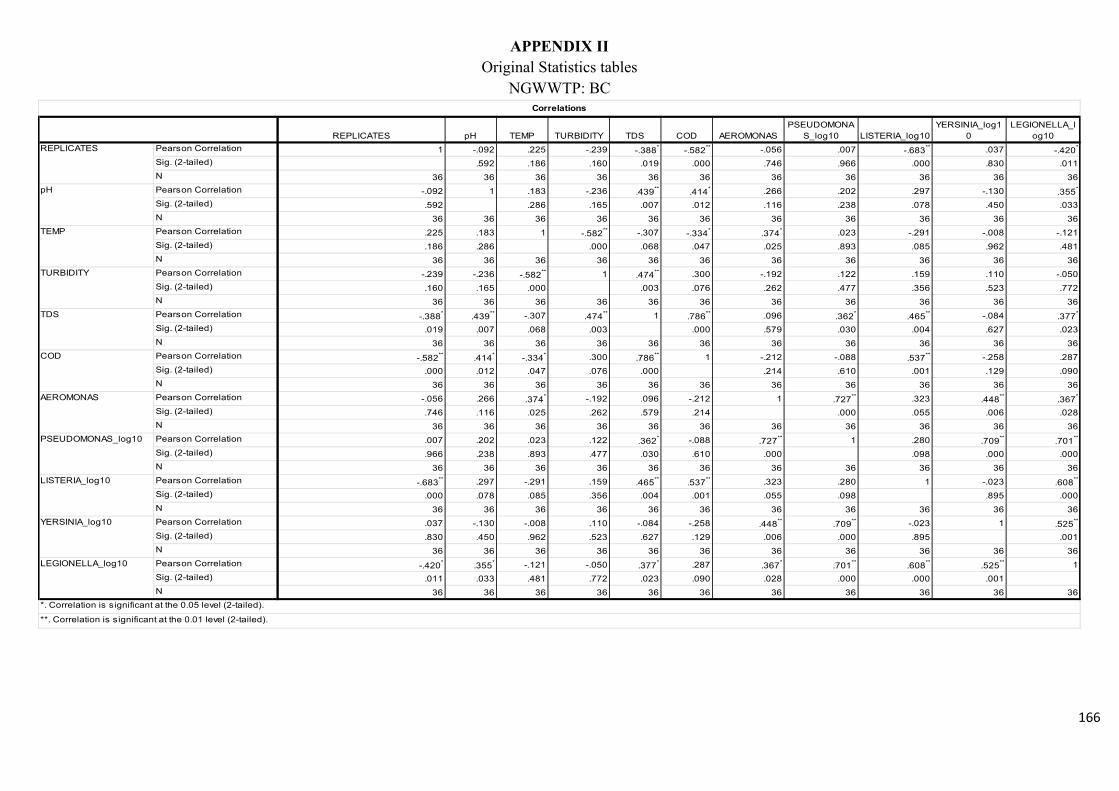
166
APPENDIX II
Original Statistics tables NGWWTP: BC
REPLICATES pH TEMP TURBIDITY TDS COD AEROMONASPSEUDOMONA
S_log10 LISTERIA_log10YERSINIA_log1
0LEGIONELLA_l
og10Pearson Correlation 1 -.092 .225 -.239 -.388* -.582** -.056 .007 -.683** .037 -.420*
Sig. (2-tailed) .592 .186 .160 .019 .000 .746 .966 .000 .830 .011N 36 36 36 36 36 36 36 36 36 36 36Pearson Correlation -.092 1 .183 -.236 .439** .414* .266 .202 .297 -.130 .355*
Sig. (2-tailed) .592 .286 .165 .007 .012 .116 .238 .078 .450 .033N 36 36 36 36 36 36 36 36 36 36 36Pearson Correlation .225 .183 1 -.582** -.307 -.334* .374* .023 -.291 -.008 -.121Sig. (2-tailed) .186 .286 .000 .068 .047 .025 .893 .085 .962 .481N 36 36 36 36 36 36 36 36 36 36 36Pearson Correlation -.239 -.236 -.582** 1 .474** .300 -.192 .122 .159 .110 -.050Sig. (2-tailed) .160 .165 .000 .003 .076 .262 .477 .356 .523 .772N 36 36 36 36 36 36 36 36 36 36 36Pearson Correlation -.388* .439** -.307 .474** 1 .786** .096 .362* .465** -.084 .377*
Sig. (2-tailed) .019 .007 .068 .003 .000 .579 .030 .004 .627 .023N 36 36 36 36 36 36 36 36 36 36 36Pearson Correlation -.582** .414* -.334* .300 .786** 1 -.212 -.088 .537** -.258 .287Sig. (2-tailed) .000 .012 .047 .076 .000 .214 .610 .001 .129 .090N 36 36 36 36 36 36 36 36 36 36 36Pearson Correlation -.056 .266 .374* -.192 .096 -.212 1 .727** .323 .448** .367*
Sig. (2-tailed) .746 .116 .025 .262 .579 .214 .000 .055 .006 .028N 36 36 36 36 36 36 36 36 36 36 36Pearson Correlation .007 .202 .023 .122 .362* -.088 .727** 1 .280 .709** .701**
Sig. (2-tailed) .966 .238 .893 .477 .030 .610 .000 .098 .000 .000N 36 36 36 36 36 36 36 36 36 36 36Pearson Correlation -.683** .297 -.291 .159 .465** .537** .323 .280 1 -.023 .608**
Sig. (2-tailed) .000 .078 .085 .356 .004 .001 .055 .098 .895 .000N 36 36 36 36 36 36 36 36 36 36 36Pearson Correlation .037 -.130 -.008 .110 -.084 -.258 .448** .709** -.023 1 .525**
Sig. (2-tailed) .830 .450 .962 .523 .627 .129 .006 .000 .895 .001N 36 36 36 36 36 36 36 36 36 36 36Pearson Correlation -.420* .355* -.121 -.050 .377* .287 .367* .701** .608** .525** 1Sig. (2-tailed) .011 .033 .481 .772 .023 .090 .028 .000 .000 .001N 36 36 36 36 36 36 36 36 36 36 36
Correlations
REPLICATES
pH
TEMP
TURBIDITY
TDS
COD
*. Correlation is significant at the 0.05 level (2-tailed).
**. Correlation is significant at the 0.01 level (2-tailed).
AEROMONAS
PSEUDOMONAS_log10
LISTERIA_log10
YERSINIA_log10
LEGIONELLA_log10
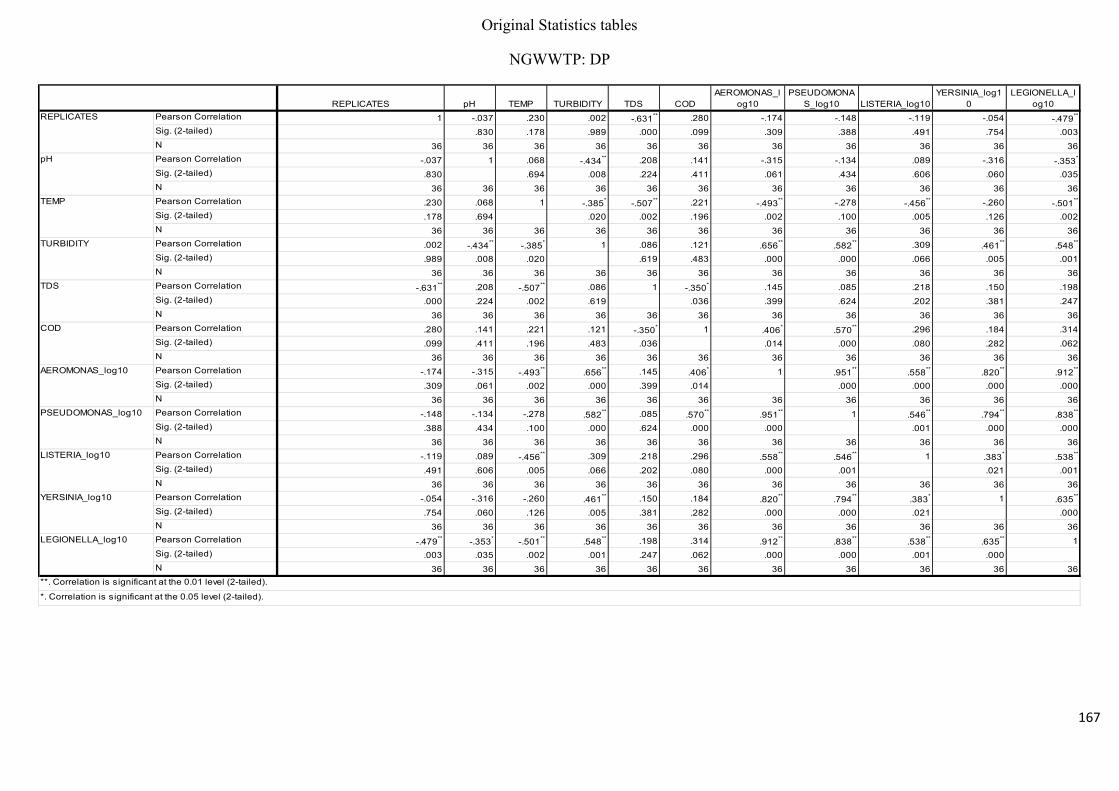
167
Original Statistics tables
NGWWTP: DP
REPLICATES pH TEMP TURBIDITY TDS CODAEROMONAS_l
og10PSEUDOMONA
S_log10 LISTERIA_log10YERSINIA_log1
0LEGIONELLA_l
og10Pearson Correlation 1 -.037 .230 .002 -.631** .280 -.174 -.148 -.119 -.054 -.479**
Sig. (2-tailed) .830 .178 .989 .000 .099 .309 .388 .491 .754 .003N 36 36 36 36 36 36 36 36 36 36 36Pearson Correlation -.037 1 .068 -.434** .208 .141 -.315 -.134 .089 -.316 -.353*
Sig. (2-tailed) .830 .694 .008 .224 .411 .061 .434 .606 .060 .035N 36 36 36 36 36 36 36 36 36 36 36Pearson Correlation .230 .068 1 -.385* -.507** .221 -.493** -.278 -.456** -.260 -.501**
Sig. (2-tailed) .178 .694 .020 .002 .196 .002 .100 .005 .126 .002N 36 36 36 36 36 36 36 36 36 36 36Pearson Correlation .002 -.434** -.385* 1 .086 .121 .656** .582** .309 .461** .548**
Sig. (2-tailed) .989 .008 .020 .619 .483 .000 .000 .066 .005 .001N 36 36 36 36 36 36 36 36 36 36 36Pearson Correlation -.631** .208 -.507** .086 1 -.350* .145 .085 .218 .150 .198Sig. (2-tailed) .000 .224 .002 .619 .036 .399 .624 .202 .381 .247N 36 36 36 36 36 36 36 36 36 36 36Pearson Correlation .280 .141 .221 .121 -.350* 1 .406* .570** .296 .184 .314Sig. (2-tailed) .099 .411 .196 .483 .036 .014 .000 .080 .282 .062N 36 36 36 36 36 36 36 36 36 36 36Pearson Correlation -.174 -.315 -.493** .656** .145 .406* 1 .951** .558** .820** .912**
Sig. (2-tailed) .309 .061 .002 .000 .399 .014 .000 .000 .000 .000N 36 36 36 36 36 36 36 36 36 36 36Pearson Correlation -.148 -.134 -.278 .582** .085 .570** .951** 1 .546** .794** .838**
Sig. (2-tailed) .388 .434 .100 .000 .624 .000 .000 .001 .000 .000N 36 36 36 36 36 36 36 36 36 36 36Pearson Correlation -.119 .089 -.456** .309 .218 .296 .558** .546** 1 .383* .538**
Sig. (2-tailed) .491 .606 .005 .066 .202 .080 .000 .001 .021 .001N 36 36 36 36 36 36 36 36 36 36 36Pearson Correlation -.054 -.316 -.260 .461** .150 .184 .820** .794** .383* 1 .635**
Sig. (2-tailed) .754 .060 .126 .005 .381 .282 .000 .000 .021 .000N 36 36 36 36 36 36 36 36 36 36 36Pearson Correlation -.479** -.353* -.501** .548** .198 .314 .912** .838** .538** .635** 1Sig. (2-tailed) .003 .035 .002 .001 .247 .062 .000 .000 .001 .000N 36 36 36 36 36 36 36 36 36 36 36
REPLICATES
pH
TEMP
TURBIDITY
TDS
COD
**. Correlation is significant at the 0.01 level (2-tailed).
*. Correlation is significant at the 0.05 level (2-tailed).
AEROMONAS_log10
PSEUDOMONAS_log10
LISTERIA_log10
YERSINIA_log10
LEGIONELLA_log10
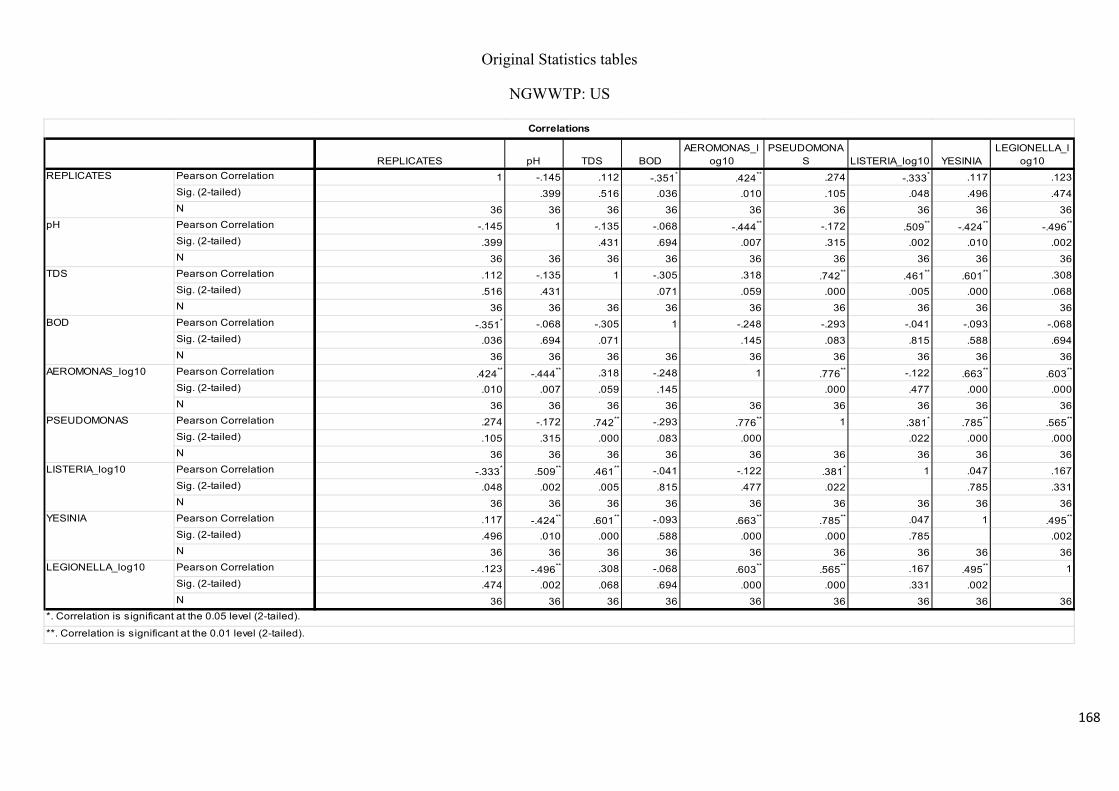
168
Original Statistics tables
NGWWTP: US
REPLICATES pH TDS BODAEROMONAS_l
og10PSEUDOMONA
S LISTERIA_log10 YESINIALEGIONELLA_l
og10Pearson Correlation 1 -.145 .112 -.351* .424** .274 -.333* .117 .123Sig. (2-tailed) .399 .516 .036 .010 .105 .048 .496 .474N 36 36 36 36 36 36 36 36 36Pearson Correlation -.145 1 -.135 -.068 -.444** -.172 .509** -.424** -.496**
Sig. (2-tailed) .399 .431 .694 .007 .315 .002 .010 .002N 36 36 36 36 36 36 36 36 36Pearson Correlation .112 -.135 1 -.305 .318 .742** .461** .601** .308Sig. (2-tailed) .516 .431 .071 .059 .000 .005 .000 .068N 36 36 36 36 36 36 36 36 36Pearson Correlation -.351* -.068 -.305 1 -.248 -.293 -.041 -.093 -.068Sig. (2-tailed) .036 .694 .071 .145 .083 .815 .588 .694N 36 36 36 36 36 36 36 36 36Pearson Correlation .424** -.444** .318 -.248 1 .776** -.122 .663** .603**
Sig. (2-tailed) .010 .007 .059 .145 .000 .477 .000 .000N 36 36 36 36 36 36 36 36 36Pearson Correlation .274 -.172 .742** -.293 .776** 1 .381* .785** .565**
Sig. (2-tailed) .105 .315 .000 .083 .000 .022 .000 .000N 36 36 36 36 36 36 36 36 36Pearson Correlation -.333* .509** .461** -.041 -.122 .381* 1 .047 .167Sig. (2-tailed) .048 .002 .005 .815 .477 .022 .785 .331N 36 36 36 36 36 36 36 36 36Pearson Correlation .117 -.424** .601** -.093 .663** .785** .047 1 .495**
Sig. (2-tailed) .496 .010 .000 .588 .000 .000 .785 .002N 36 36 36 36 36 36 36 36 36Pearson Correlation .123 -.496** .308 -.068 .603** .565** .167 .495** 1Sig. (2-tailed) .474 .002 .068 .694 .000 .000 .331 .002N 36 36 36 36 36 36 36 36 36
Correlations
REPLICATES
pH
TDS
BOD
AEROMONAS_log10
PSEUDOMONAS
LISTERIA_log10
YESINIA
LEGIONELLA_log10
*. Correlation is significant at the 0.05 level (2-tailed).
**. Correlation is significant at the 0.01 level (2-tailed).
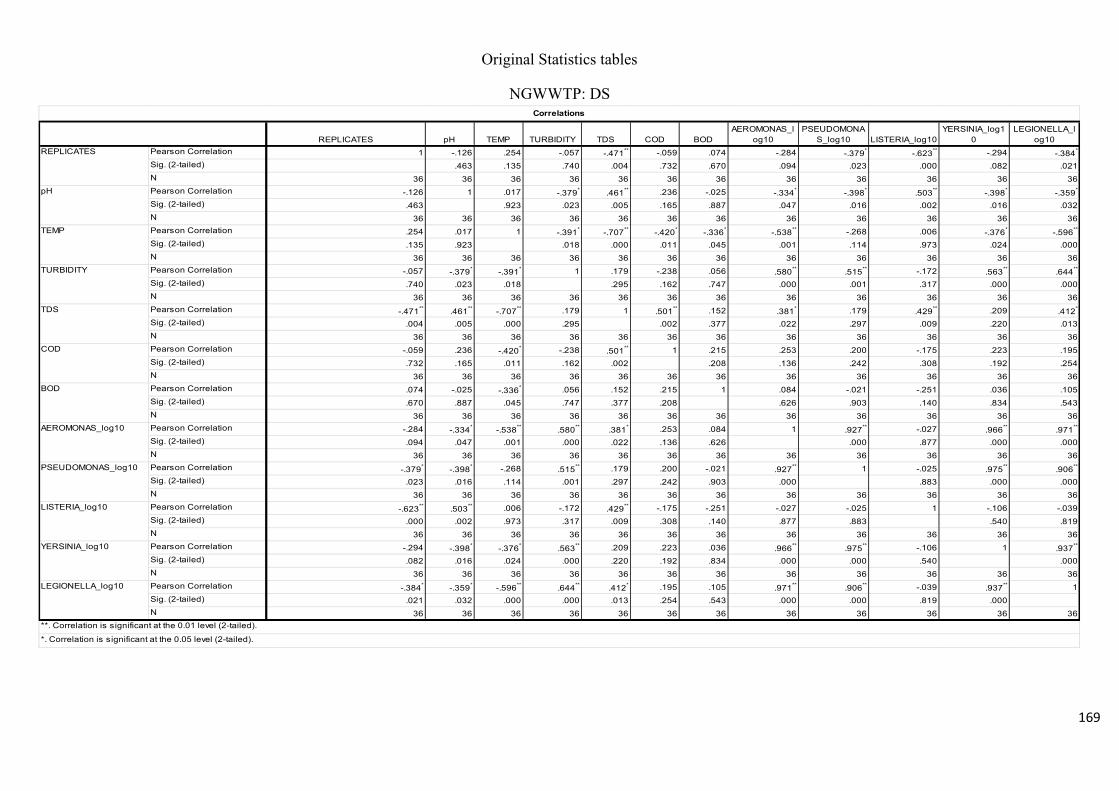
169
Original Statistics tables
NGWWTP: DS
REPLICATES pH TEMP TURBIDITY TDS COD BODAEROMONAS_l
og10PSEUDOMONA
S_log10 LISTERIA_log10YERSINIA_log1
0LEGIONELLA_l
og10Pearson Correlation 1 -.126 .254 -.057 -.471** -.059 .074 -.284 -.379* -.623** -.294 -.384*
Sig. (2-tailed) .463 .135 .740 .004 .732 .670 .094 .023 .000 .082 .021N 36 36 36 36 36 36 36 36 36 36 36 36Pearson Correlation -.126 1 .017 -.379* .461** .236 -.025 -.334* -.398* .503** -.398* -.359*
Sig. (2-tailed) .463 .923 .023 .005 .165 .887 .047 .016 .002 .016 .032N 36 36 36 36 36 36 36 36 36 36 36 36Pearson Correlation .254 .017 1 -.391* -.707** -.420* -.336* -.538** -.268 .006 -.376* -.596**
Sig. (2-tailed) .135 .923 .018 .000 .011 .045 .001 .114 .973 .024 .000N 36 36 36 36 36 36 36 36 36 36 36 36Pearson Correlation -.057 -.379* -.391* 1 .179 -.238 .056 .580** .515** -.172 .563** .644**
Sig. (2-tailed) .740 .023 .018 .295 .162 .747 .000 .001 .317 .000 .000N 36 36 36 36 36 36 36 36 36 36 36 36Pearson Correlation -.471** .461** -.707** .179 1 .501** .152 .381* .179 .429** .209 .412*
Sig. (2-tailed) .004 .005 .000 .295 .002 .377 .022 .297 .009 .220 .013N 36 36 36 36 36 36 36 36 36 36 36 36Pearson Correlation -.059 .236 -.420* -.238 .501** 1 .215 .253 .200 -.175 .223 .195Sig. (2-tailed) .732 .165 .011 .162 .002 .208 .136 .242 .308 .192 .254N 36 36 36 36 36 36 36 36 36 36 36 36Pearson Correlation .074 -.025 -.336* .056 .152 .215 1 .084 -.021 -.251 .036 .105Sig. (2-tailed) .670 .887 .045 .747 .377 .208 .626 .903 .140 .834 .543N 36 36 36 36 36 36 36 36 36 36 36 36Pearson Correlation -.284 -.334* -.538** .580** .381* .253 .084 1 .927** -.027 .966** .971**
Sig. (2-tailed) .094 .047 .001 .000 .022 .136 .626 .000 .877 .000 .000N 36 36 36 36 36 36 36 36 36 36 36 36Pearson Correlation -.379* -.398* -.268 .515** .179 .200 -.021 .927** 1 -.025 .975** .906**
Sig. (2-tailed) .023 .016 .114 .001 .297 .242 .903 .000 .883 .000 .000N 36 36 36 36 36 36 36 36 36 36 36 36Pearson Correlation -.623** .503** .006 -.172 .429** -.175 -.251 -.027 -.025 1 -.106 -.039Sig. (2-tailed) .000 .002 .973 .317 .009 .308 .140 .877 .883 .540 .819N 36 36 36 36 36 36 36 36 36 36 36 36Pearson Correlation -.294 -.398* -.376* .563** .209 .223 .036 .966** .975** -.106 1 .937**
Sig. (2-tailed) .082 .016 .024 .000 .220 .192 .834 .000 .000 .540 .000N 36 36 36 36 36 36 36 36 36 36 36 36Pearson Correlation -.384* -.359* -.596** .644** .412* .195 .105 .971** .906** -.039 .937** 1Sig. (2-tailed) .021 .032 .000 .000 .013 .254 .543 .000 .000 .819 .000N 36 36 36 36 36 36 36 36 36 36 36 36
Correlations
REPLICATES
pH
TEMP
TURBIDITY
TDS
COD
LEGIONELLA_log10
**. Correlation is significant at the 0.01 level (2-tailed).
*. Correlation is significant at the 0.05 level (2-tailed).
BOD
AEROMONAS_log10
PSEUDOMONAS_log10
LISTERIA_log10
YERSINIA_log10
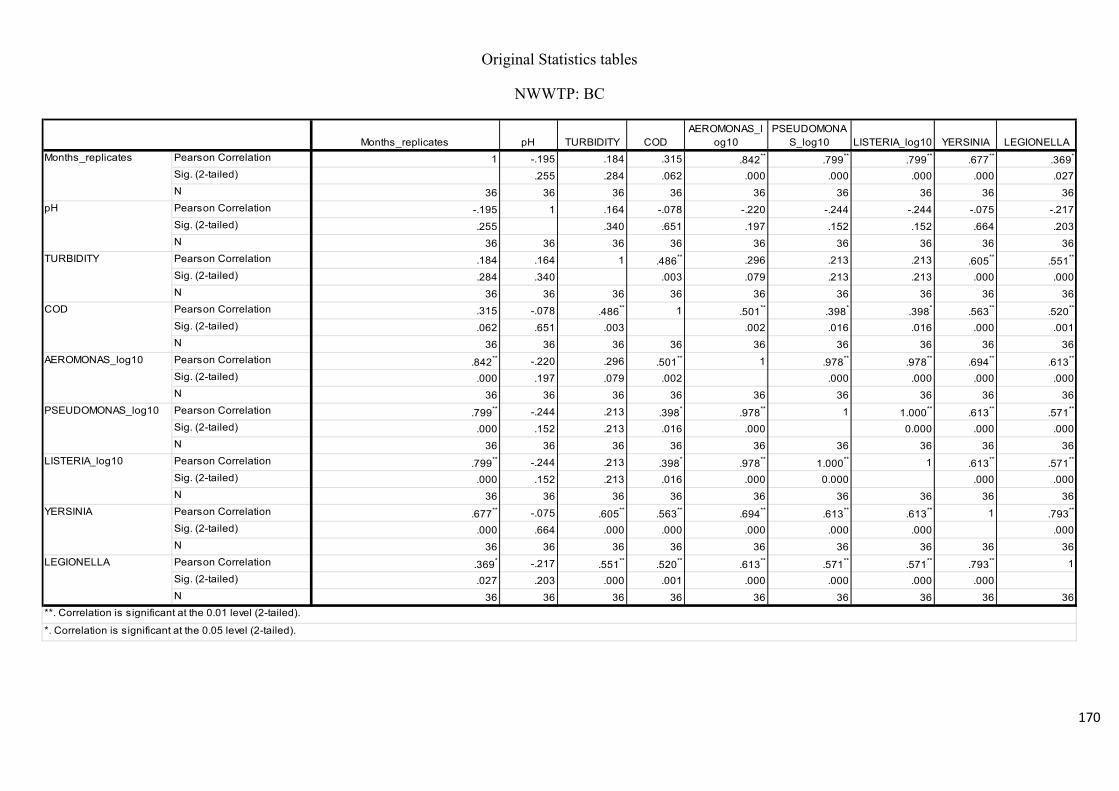
170
Original Statistics tables
NWWTP: BC
Months_replicates pH TURBIDITY CODAEROMONAS_l
og10PSEUDOMONA
S_log10 LISTERIA_log10 YERSINIA LEGIONELLAPearson Correlation 1 -.195 .184 .315 .842** .799** .799** .677** .369*
Sig. (2-tailed) .255 .284 .062 .000 .000 .000 .000 .027N 36 36 36 36 36 36 36 36 36Pearson Correlation -.195 1 .164 -.078 -.220 -.244 -.244 -.075 -.217Sig. (2-tailed) .255 .340 .651 .197 .152 .152 .664 .203N 36 36 36 36 36 36 36 36 36Pearson Correlation .184 .164 1 .486** .296 .213 .213 .605** .551**
Sig. (2-tailed) .284 .340 .003 .079 .213 .213 .000 .000N 36 36 36 36 36 36 36 36 36Pearson Correlation .315 -.078 .486** 1 .501** .398* .398* .563** .520**
Sig. (2-tailed) .062 .651 .003 .002 .016 .016 .000 .001N 36 36 36 36 36 36 36 36 36Pearson Correlation .842** -.220 .296 .501** 1 .978** .978** .694** .613**
Sig. (2-tailed) .000 .197 .079 .002 .000 .000 .000 .000N 36 36 36 36 36 36 36 36 36Pearson Correlation .799** -.244 .213 .398* .978** 1 1.000** .613** .571**
Sig. (2-tailed) .000 .152 .213 .016 .000 0.000 .000 .000N 36 36 36 36 36 36 36 36 36Pearson Correlation .799** -.244 .213 .398* .978** 1.000** 1 .613** .571**
Sig. (2-tailed) .000 .152 .213 .016 .000 0.000 .000 .000N 36 36 36 36 36 36 36 36 36Pearson Correlation .677** -.075 .605** .563** .694** .613** .613** 1 .793**
Sig. (2-tailed) .000 .664 .000 .000 .000 .000 .000 .000N 36 36 36 36 36 36 36 36 36Pearson Correlation .369* -.217 .551** .520** .613** .571** .571** .793** 1Sig. (2-tailed) .027 .203 .000 .001 .000 .000 .000 .000N 36 36 36 36 36 36 36 36 36
Months_replicates
pH
TURBIDITY
COD
AEROMONAS_log10
PSEUDOMONAS_log10
LISTERIA_log10
YERSINIA
LEGIONELLA
**. Correlation is significant at the 0.01 level (2-tailed).
*. Correlation is significant at the 0.05 level (2-tailed).
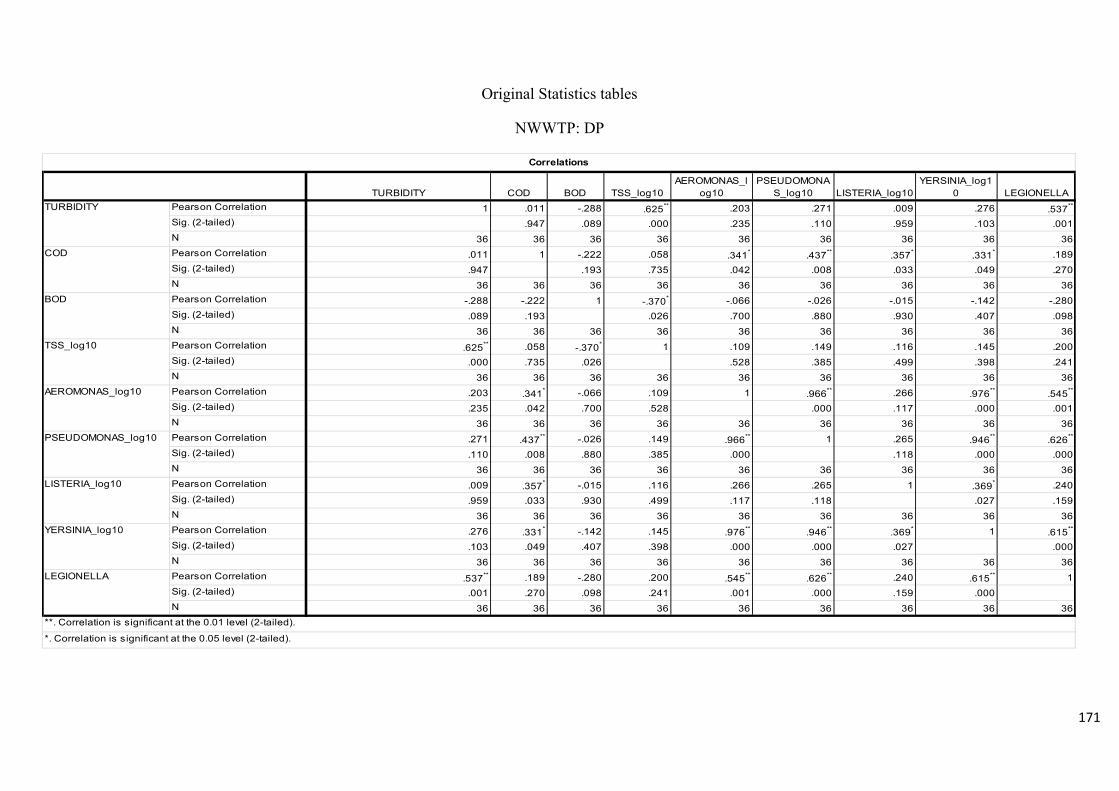
171
Original Statistics tables
NWWTP: DP
TURBIDITY COD BOD TSS_log10AEROMONAS_l
og10PSEUDOMONA
S_log10 LISTERIA_log10YERSINIA_log1
0 LEGIONELLAPearson Correlation 1 .011 -.288 .625** .203 .271 .009 .276 .537**
Sig. (2-tailed) .947 .089 .000 .235 .110 .959 .103 .001N 36 36 36 36 36 36 36 36 36Pearson Correlation .011 1 -.222 .058 .341* .437** .357* .331* .189Sig. (2-tailed) .947 .193 .735 .042 .008 .033 .049 .270N 36 36 36 36 36 36 36 36 36Pearson Correlation -.288 -.222 1 -.370* -.066 -.026 -.015 -.142 -.280Sig. (2-tailed) .089 .193 .026 .700 .880 .930 .407 .098N 36 36 36 36 36 36 36 36 36Pearson Correlation .625** .058 -.370* 1 .109 .149 .116 .145 .200Sig. (2-tailed) .000 .735 .026 .528 .385 .499 .398 .241N 36 36 36 36 36 36 36 36 36Pearson Correlation .203 .341* -.066 .109 1 .966** .266 .976** .545**
Sig. (2-tailed) .235 .042 .700 .528 .000 .117 .000 .001N 36 36 36 36 36 36 36 36 36Pearson Correlation .271 .437** -.026 .149 .966** 1 .265 .946** .626**
Sig. (2-tailed) .110 .008 .880 .385 .000 .118 .000 .000N 36 36 36 36 36 36 36 36 36Pearson Correlation .009 .357* -.015 .116 .266 .265 1 .369* .240Sig. (2-tailed) .959 .033 .930 .499 .117 .118 .027 .159N 36 36 36 36 36 36 36 36 36Pearson Correlation .276 .331* -.142 .145 .976** .946** .369* 1 .615**
Sig. (2-tailed) .103 .049 .407 .398 .000 .000 .027 .000N 36 36 36 36 36 36 36 36 36Pearson Correlation .537** .189 -.280 .200 .545** .626** .240 .615** 1Sig. (2-tailed) .001 .270 .098 .241 .001 .000 .159 .000N 36 36 36 36 36 36 36 36 36
Correlations
TURBIDITY
COD
BOD
TSS_log10
AEROMONAS_log10
PSEUDOMONAS_log10
LISTERIA_log10
YERSINIA_log10
LEGIONELLA
**. Correlation is significant at the 0.01 level (2-tailed).
*. Correlation is significant at the 0.05 level (2-tailed).
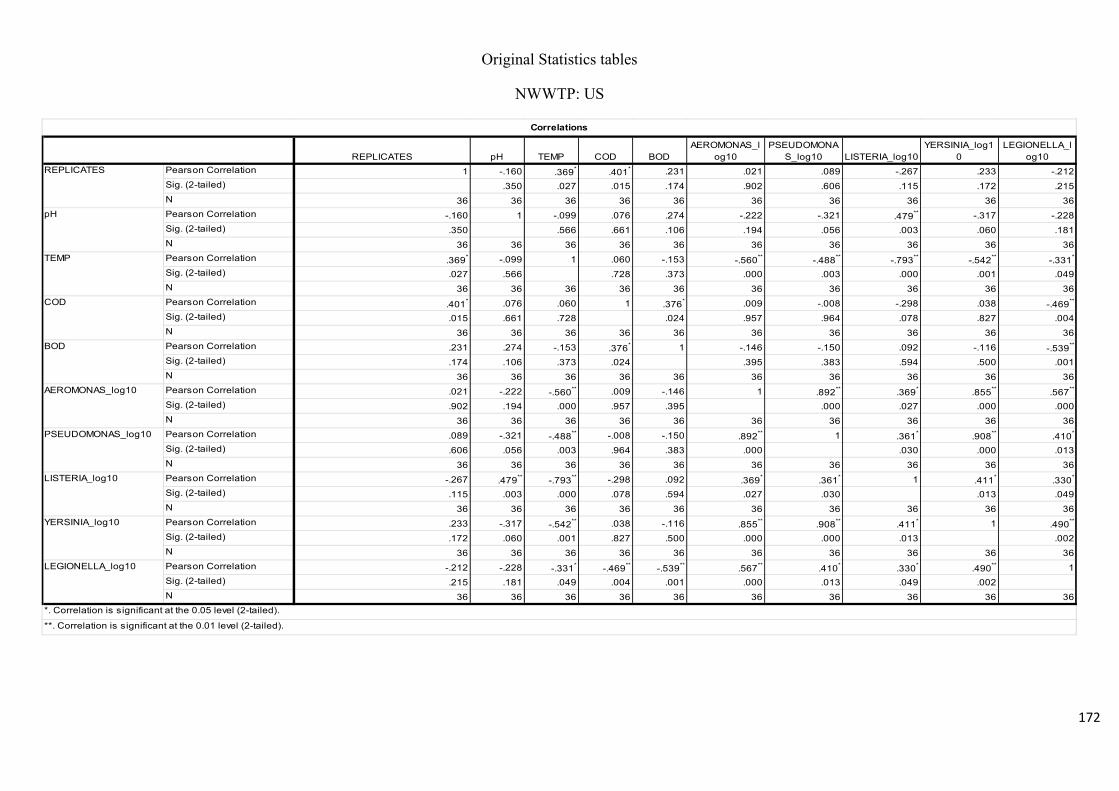
172
Original Statistics tables
NWWTP: US
REPLICATES pH TEMP COD BODAEROMONAS_l
og10PSEUDOMONA
S_log10 LISTERIA_log10YERSINIA_log1
0LEGIONELLA_l
og10Pearson Correlation 1 -.160 .369* .401* .231 .021 .089 -.267 .233 -.212Sig. (2-tailed) .350 .027 .015 .174 .902 .606 .115 .172 .215N 36 36 36 36 36 36 36 36 36 36Pearson Correlation -.160 1 -.099 .076 .274 -.222 -.321 .479** -.317 -.228Sig. (2-tailed) .350 .566 .661 .106 .194 .056 .003 .060 .181N 36 36 36 36 36 36 36 36 36 36Pearson Correlation .369* -.099 1 .060 -.153 -.560** -.488** -.793** -.542** -.331*
Sig. (2-tailed) .027 .566 .728 .373 .000 .003 .000 .001 .049N 36 36 36 36 36 36 36 36 36 36Pearson Correlation .401* .076 .060 1 .376* .009 -.008 -.298 .038 -.469**
Sig. (2-tailed) .015 .661 .728 .024 .957 .964 .078 .827 .004N 36 36 36 36 36 36 36 36 36 36Pearson Correlation .231 .274 -.153 .376* 1 -.146 -.150 .092 -.116 -.539**
Sig. (2-tailed) .174 .106 .373 .024 .395 .383 .594 .500 .001N 36 36 36 36 36 36 36 36 36 36Pearson Correlation .021 -.222 -.560** .009 -.146 1 .892** .369* .855** .567**
Sig. (2-tailed) .902 .194 .000 .957 .395 .000 .027 .000 .000N 36 36 36 36 36 36 36 36 36 36Pearson Correlation .089 -.321 -.488** -.008 -.150 .892** 1 .361* .908** .410*
Sig. (2-tailed) .606 .056 .003 .964 .383 .000 .030 .000 .013N 36 36 36 36 36 36 36 36 36 36Pearson Correlation -.267 .479** -.793** -.298 .092 .369* .361* 1 .411* .330*
Sig. (2-tailed) .115 .003 .000 .078 .594 .027 .030 .013 .049N 36 36 36 36 36 36 36 36 36 36Pearson Correlation .233 -.317 -.542** .038 -.116 .855** .908** .411* 1 .490**
Sig. (2-tailed) .172 .060 .001 .827 .500 .000 .000 .013 .002N 36 36 36 36 36 36 36 36 36 36Pearson Correlation -.212 -.228 -.331* -.469** -.539** .567** .410* .330* .490** 1Sig. (2-tailed) .215 .181 .049 .004 .001 .000 .013 .049 .002N 36 36 36 36 36 36 36 36 36 36
Correlations
REPLICATES
pH
TEMP
COD
BOD
AEROMONAS_log10
**. Correlation is significant at the 0.01 level (2-tailed).
PSEUDOMONAS_log10
LISTERIA_log10
YERSINIA_log10
LEGIONELLA_log10
*. Correlation is significant at the 0.05 level (2-tailed).
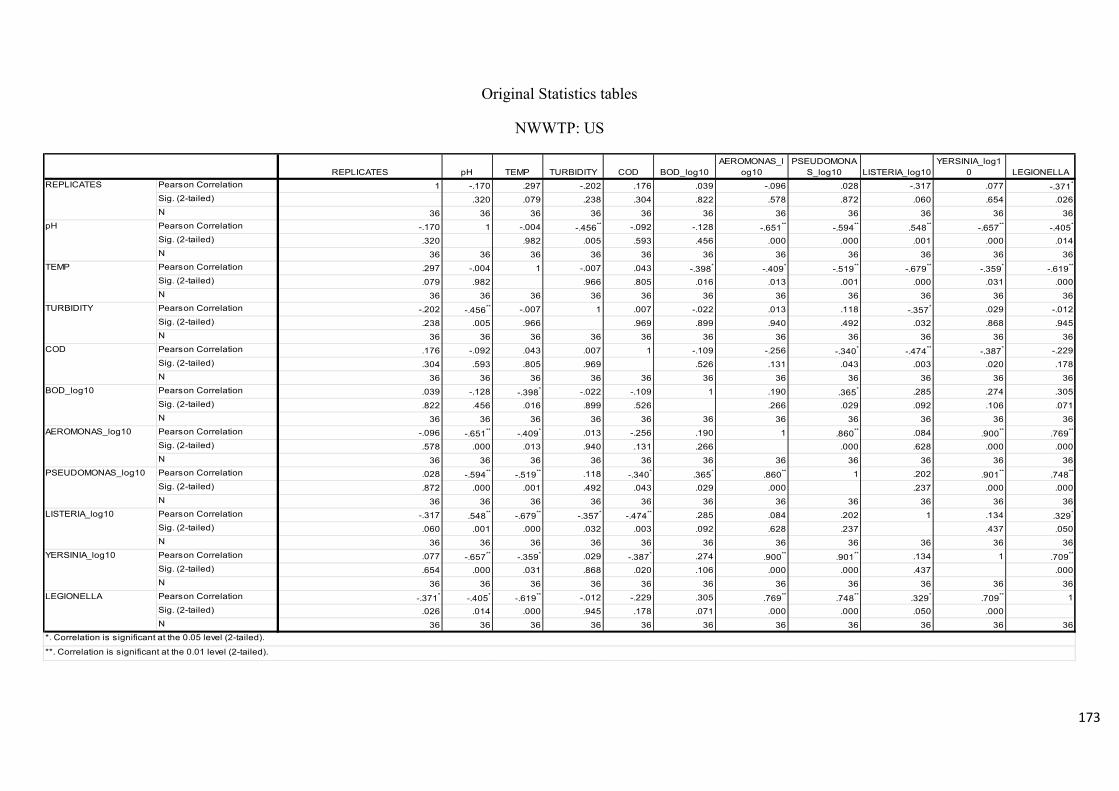
173
Original Statistics tables
NWWTP: US
REPLICATES pH TEMP TURBIDITY COD BOD_log10AEROMONAS_l
og10PSEUDOMONA
S_log10 LISTERIA_log10YERSINIA_log1
0 LEGIONELLAPearson Correlation 1 -.170 .297 -.202 .176 .039 -.096 .028 -.317 .077 -.371*
Sig. (2-tailed) .320 .079 .238 .304 .822 .578 .872 .060 .654 .026N 36 36 36 36 36 36 36 36 36 36 36Pearson Correlation -.170 1 -.004 -.456** -.092 -.128 -.651** -.594** .548** -.657** -.405*
Sig. (2-tailed) .320 .982 .005 .593 .456 .000 .000 .001 .000 .014N 36 36 36 36 36 36 36 36 36 36 36Pearson Correlation .297 -.004 1 -.007 .043 -.398* -.409* -.519** -.679** -.359* -.619**
Sig. (2-tailed) .079 .982 .966 .805 .016 .013 .001 .000 .031 .000N 36 36 36 36 36 36 36 36 36 36 36Pearson Correlation -.202 -.456** -.007 1 .007 -.022 .013 .118 -.357* .029 -.012Sig. (2-tailed) .238 .005 .966 .969 .899 .940 .492 .032 .868 .945N 36 36 36 36 36 36 36 36 36 36 36Pearson Correlation .176 -.092 .043 .007 1 -.109 -.256 -.340* -.474** -.387* -.229Sig. (2-tailed) .304 .593 .805 .969 .526 .131 .043 .003 .020 .178N 36 36 36 36 36 36 36 36 36 36 36Pearson Correlation .039 -.128 -.398* -.022 -.109 1 .190 .365* .285 .274 .305Sig. (2-tailed) .822 .456 .016 .899 .526 .266 .029 .092 .106 .071N 36 36 36 36 36 36 36 36 36 36 36Pearson Correlation -.096 -.651** -.409* .013 -.256 .190 1 .860** .084 .900** .769**
Sig. (2-tailed) .578 .000 .013 .940 .131 .266 .000 .628 .000 .000N 36 36 36 36 36 36 36 36 36 36 36Pearson Correlation .028 -.594** -.519** .118 -.340* .365* .860** 1 .202 .901** .748**
Sig. (2-tailed) .872 .000 .001 .492 .043 .029 .000 .237 .000 .000N 36 36 36 36 36 36 36 36 36 36 36Pearson Correlation -.317 .548** -.679** -.357* -.474** .285 .084 .202 1 .134 .329*
Sig. (2-tailed) .060 .001 .000 .032 .003 .092 .628 .237 .437 .050N 36 36 36 36 36 36 36 36 36 36 36Pearson Correlation .077 -.657** -.359* .029 -.387* .274 .900** .901** .134 1 .709**
Sig. (2-tailed) .654 .000 .031 .868 .020 .106 .000 .000 .437 .000N 36 36 36 36 36 36 36 36 36 36 36Pearson Correlation -.371* -.405* -.619** -.012 -.229 .305 .769** .748** .329* .709** 1Sig. (2-tailed) .026 .014 .000 .945 .178 .071 .000 .000 .050 .000N 36 36 36 36 36 36 36 36 36 36 36
REPLICATES
pH
TEMP
TURBIDITY
COD
BOD_log10
*. Correlation is significant at the 0.05 level (2-tailed).
**. Correlation is significant at the 0.01 level (2-tailed).
AEROMONAS_log10
PSEUDOMONAS_log10
LISTERIA_log10
YERSINIA_log10
LEGIONELLA
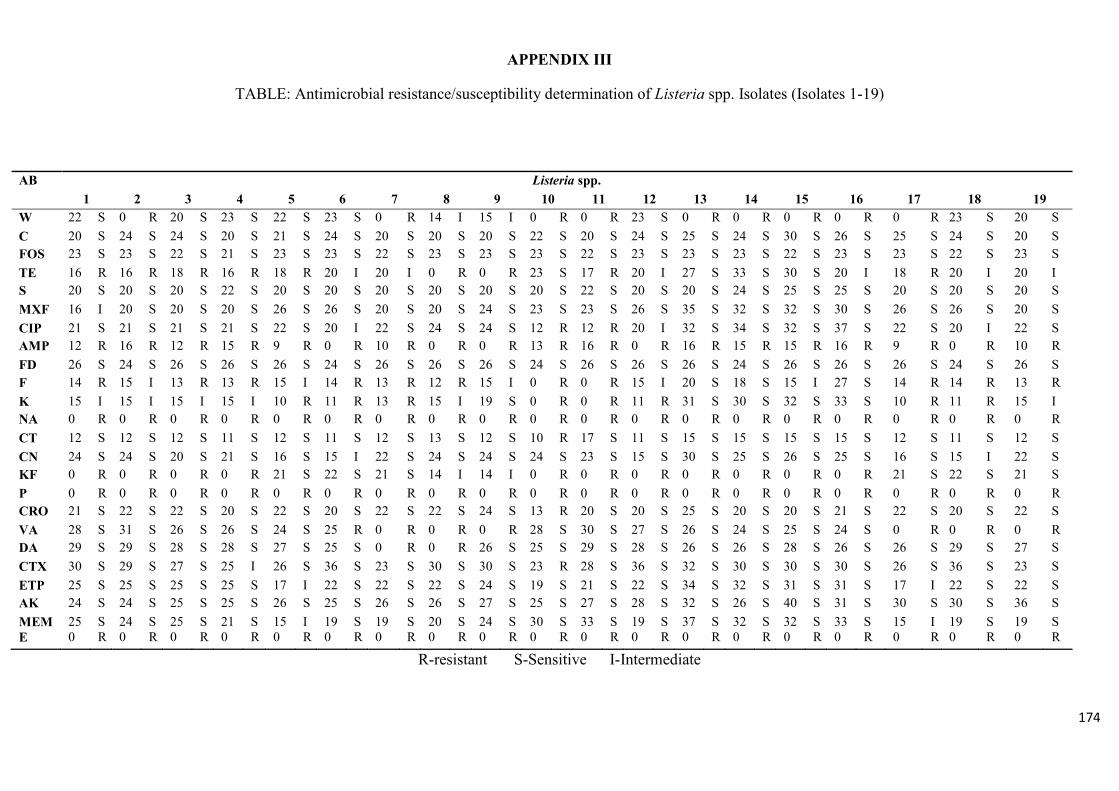
174
APPENDIX III
TABLE: Antimicrobial resistance/susceptibility determination of Listeria spp. Isolates (Isolates 1-19)
R-resistant S-Sensitive I-Intermediate
AB Listeria spp. 1 2 3 4 5 6 7 8 9 10 11 12 13 14 15 16 17 18 19 W 22 S 0 R 20 S 23 S 22 S 23 S 0 R 14 I 15 I 0 R 0 R 23 S 0 R 0 R 0 R 0 R 0 R 23 S 20 S C 20 S 24 S 24 S 20 S 21 S 24 S 20 S 20 S 20 S 22 S 20 S 24 S 25 S 24 S 30 S 26 S 25 S 24 S 20 S FOS 23 S 23 S 22 S 21 S 23 S 23 S 22 S 23 S 23 S 23 S 22 S 23 S 23 S 23 S 22 S 23 S 23 S 22 S 23 S TE 16 R 16 R 18 R 16 R 18 R 20 I 20 I 0 R 0 R 23 S 17 R 20 I 27 S 33 S 30 S 20 I 18 R 20 I 20 I S 20 S 20 S 20 S 22 S 20 S 20 S 20 S 20 S 20 S 20 S 22 S 20 S 20 S 24 S 25 S 25 S 20 S 20 S 20 S MXF 16 I 20 S 20 S 20 S 26 S 26 S 20 S 20 S 24 S 23 S 23 S 26 S 35 S 32 S 32 S 30 S 26 S 26 S 20 S CIP 21 S 21 S 21 S 21 S 22 S 20 I 22 S 24 S 24 S 12 R 12 R 20 I 32 S 34 S 32 S 37 S 22 S 20 I 22 S AMP 12 R 16 R 12 R 15 R 9 R 0 R 10 R 0 R 0 R 13 R 16 R 0 R 16 R 15 R 15 R 16 R 9 R 0 R 10 R FD 26 S 24 S 26 S 26 S 26 S 24 S 26 S 26 S 26 S 24 S 26 S 26 S 26 S 24 S 26 S 26 S 26 S 24 S 26 S F 14 R 15 I 13 R 13 R 15 I 14 R 13 R 12 R 15 I 0 R 0 R 15 I 20 S 18 S 15 I 27 S 14 R 14 R 13 R K 15 I 15 I 15 I 15 I 10 R 11 R 13 R 15 I 19 S 0 R 0 R 11 R 31 S 30 S 32 S 33 S 10 R 11 R 15 I NA 0 R 0 R 0 R 0 R 0 R 0 R 0 R 0 R 0 R 0 R 0 R 0 R 0 R 0 R 0 R 0 R 0 R 0 R 0 R CT 12 S 12 S 12 S 11 S 12 S 11 S 12 S 13 S 12 S 10 R 17 S 11 S 15 S 15 S 15 S 15 S 12 S 11 S 12 S CN 24 S 24 S 20 S 21 S 16 S 15 I 22 S 24 S 24 S 24 S 23 S 15 S 30 S 25 S 26 S 25 S 16 S 15 I 22 S KF 0 R 0 R 0 R 0 R 21 S 22 S 21 S 14 I 14 I 0 R 0 R 0 R 0 R 0 R 0 R 0 R 21 S 22 S 21 S P 0 R 0 R 0 R 0 R 0 R 0 R 0 R 0 R 0 R 0 R 0 R 0 R 0 R 0 R 0 R 0 R 0 R 0 R 0 R CRO 21 S 22 S 22 S 20 S 22 S 20 S 22 S 22 S 24 S 13 R 20 S 20 S 25 S 20 S 20 S 21 S 22 S 20 S 22 S VA 28 S 31 S 26 S 26 S 24 S 25 R 0 R 0 R 0 R 28 S 30 S 27 S 26 S 24 S 25 S 24 S 0 R 0 R 0 R DA 29 S 29 S 28 S 28 S 27 S 25 S 0 R 0 R 26 S 25 S 29 S 28 S 26 S 26 S 28 S 26 S 26 S 29 S 27 S CTX 30 S 29 S 27 S 25 I 26 S 36 S 23 S 30 S 30 S 23 R 28 S 36 S 32 S 30 S 30 S 30 S 26 S 36 S 23 S ETP 25 S 25 S 25 S 25 S 17 I 22 S 22 S 22 S 24 S 19 S 21 S 22 S 34 S 32 S 31 S 31 S 17 I 22 S 22 S AK 24 S 24 S 25 S 25 S 26 S 25 S 26 S 26 S 27 S 25 S 27 S 28 S 32 S 26 S 40 S 31 S 30 S 30 S 36 S MEM 25 S 24 S 25 S 21 S 15 I 19 S 19 S 20 S 24 S 30 S 33 S 19 S 37 S 32 S 32 S 33 S 15 I 19 S 19 S E 0 R 0 R 0 R 0 R 0 R 0 R 0 R 0 R 0 R 0 R 0 R 0 R 0 R 0 R 0 R 0 R 0 R 0 R 0 R
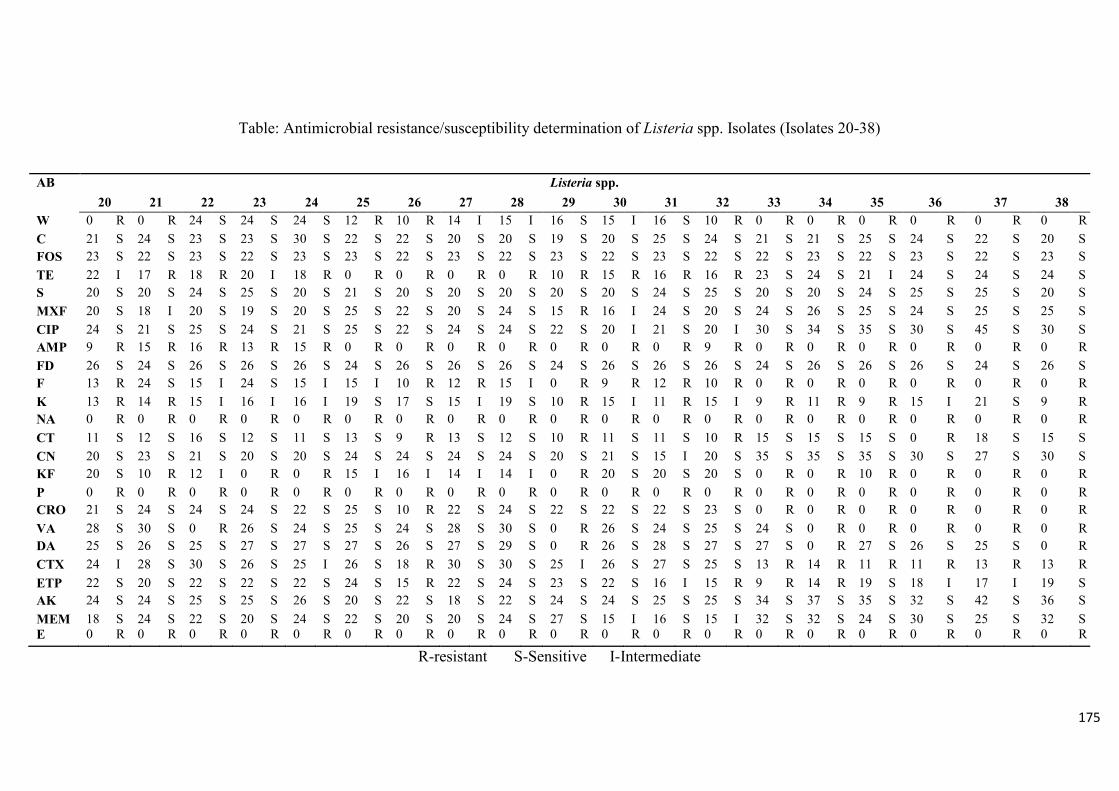
175
Table: Antimicrobial resistance/susceptibility determination of Listeria spp. Isolates (Isolates 20-38)
R-resistant S-Sensitive I-Intermediate
AB Listeria spp. 20 21 22 23 24 25 26 27 28 29 30 31 32 33 34 35 36 37 38
W 0 R 0 R 24 S 24 S 24 S 12 R 10 R 14 I 15 I 16 S 15 I 16 S 10 R 0 R 0 R 0 R 0 R 0 R 0 R C 21 S 24 S 23 S 23 S 30 S 22 S 22 S 20 S 20 S 19 S 20 S 25 S 24 S 21 S 21 S 25 S 24 S 22 S 20 S FOS 23 S 22 S 23 S 22 S 23 S 23 S 22 S 23 S 22 S 23 S 22 S 23 S 22 S 22 S 23 S 22 S 23 S 22 S 23 S TE 22 I 17 R 18 R 20 I 18 R 0 R 0 R 0 R 0 R 10 R 15 R 16 R 16 R 23 S 24 S 21 I 24 S 24 S 24 S S 20 S 20 S 24 S 25 S 20 S 21 S 20 S 20 S 20 S 20 S 20 S 24 S 25 S 20 S 20 S 24 S 25 S 25 S 20 S MXF 20 S 18 I 20 S 19 S 20 S 25 S 22 S 20 S 24 S 15 R 16 I 24 S 20 S 24 S 26 S 25 S 24 S 25 S 25 S CIP 24 S 21 S 25 S 24 S 21 S 25 S 22 S 24 S 24 S 22 S 20 I 21 S 20 I 30 S 34 S 35 S 30 S 45 S 30 S AMP 9 R 15 R 16 R 13 R 15 R 0 R 0 R 0 R 0 R 0 R 0 R 0 R 9 R 0 R 0 R 0 R 0 R 0 R 0 R FD 26 S 24 S 26 S 26 S 26 S 24 S 26 S 26 S 26 S 24 S 26 S 26 S 26 S 24 S 26 S 26 S 26 S 24 S 26 S F 13 R 24 S 15 I 24 S 15 I 15 I 10 R 12 R 15 I 0 R 9 R 12 R 10 R 0 R 0 R 0 R 0 R 0 R 0 R K 13 R 14 R 15 I 16 I 16 I 19 S 17 S 15 I 19 S 10 R 15 I 11 R 15 I 9 R 11 R 9 R 15 I 21 S 9 R NA 0 R 0 R 0 R 0 R 0 R 0 R 0 R 0 R 0 R 0 R 0 R 0 R 0 R 0 R 0 R 0 R 0 R 0 R 0 R CT 11 S 12 S 16 S 12 S 11 S 13 S 9 R 13 S 12 S 10 R 11 S 11 S 10 R 15 S 15 S 15 S 0 R 18 S 15 S CN 20 S 23 S 21 S 20 S 20 S 24 S 24 S 24 S 24 S 20 S 21 S 15 I 20 S 35 S 35 S 35 S 30 S 27 S 30 S KF 20 S 10 R 12 I 0 R 0 R 15 I 16 I 14 I 14 I 0 R 20 S 20 S 20 S 0 R 0 R 10 R 0 R 0 R 0 R P 0 R 0 R 0 R 0 R 0 R 0 R 0 R 0 R 0 R 0 R 0 R 0 R 0 R 0 R 0 R 0 R 0 R 0 R 0 R CRO 21 S 24 S 24 S 24 S 22 S 25 S 10 R 22 S 24 S 22 S 22 S 22 S 23 S 0 R 0 R 0 R 0 R 0 R 0 R VA 28 S 30 S 0 R 26 S 24 S 25 S 24 S 28 S 30 S 0 R 26 S 24 S 25 S 24 S 0 R 0 R 0 R 0 R 0 R DA 25 S 26 S 25 S 27 S 27 S 27 S 26 S 27 S 29 S 0 R 26 S 28 S 27 S 27 S 0 R 27 S 26 S 25 S 0 R CTX 24 I 28 S 30 S 26 S 25 I 26 S 18 R 30 S 30 S 25 I 26 S 27 S 25 S 13 R 14 R 11 R 11 R 13 R 13 R ETP 22 S 20 S 22 S 22 S 22 S 24 S 15 R 22 S 24 S 23 S 22 S 16 I 15 R 9 R 14 R 19 S 18 I 17 I 19 S AK 24 S 24 S 25 S 25 S 26 S 20 S 22 S 18 S 22 S 24 S 24 S 25 S 25 S 34 S 37 S 35 S 32 S 42 S 36 S MEM 18 S 24 S 22 S 20 S 24 S 22 S 20 S 20 S 24 S 27 S 15 I 16 S 15 I 32 S 32 S 24 S 30 S 25 S 32 S E 0 R 0 R 0 R 0 R 0 R 0 R 0 R 0 R 0 R 0 R 0 R 0 R 0 R 0 R 0 R 0 R 0 R 0 R 0 R
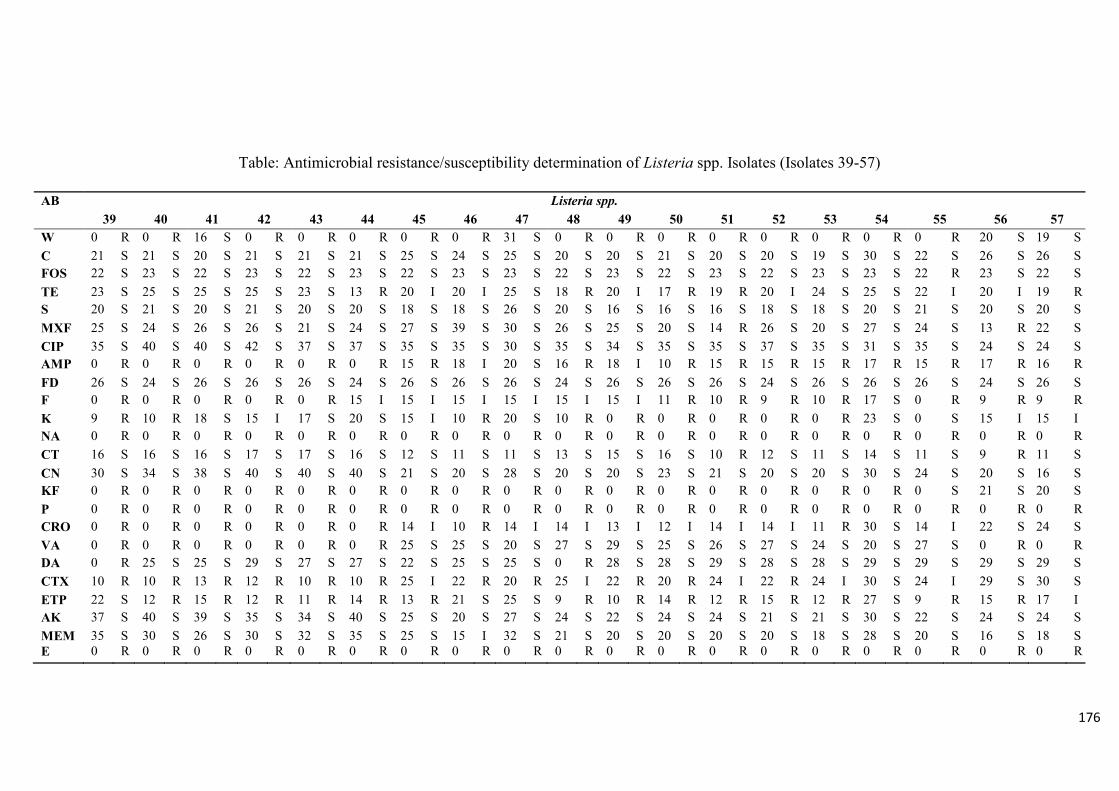
176
Table: Antimicrobial resistance/susceptibility determination of Listeria spp. Isolates (Isolates 39-57)
AB Listeria spp. 39 40 41 42 43 44 45 46 47 48 49 50 51 52 53 54 55 56 57 W 0 R 0 R 16 S 0 R 0 R 0 R 0 R 0 R 31 S 0 R 0 R 0 R 0 R 0 R 0 R 0 R 0 R 20 S 19 S C 21 S 21 S 20 S 21 S 21 S 21 S 25 S 24 S 25 S 20 S 20 S 21 S 20 S 20 S 19 S 30 S 22 S 26 S 26 S FOS 22 S 23 S 22 S 23 S 22 S 23 S 22 S 23 S 23 S 22 S 23 S 22 S 23 S 22 S 23 S 23 S 22 R 23 S 22 S TE 23 S 25 S 25 S 25 S 23 S 13 R 20 I 20 I 25 S 18 R 20 I 17 R 19 R 20 I 24 S 25 S 22 I 20 I 19 R S 20 S 21 S 20 S 21 S 20 S 20 S 18 S 18 S 26 S 20 S 16 S 16 S 16 S 18 S 18 S 20 S 21 S 20 S 20 S MXF 25 S 24 S 26 S 26 S 21 S 24 S 27 S 39 S 30 S 26 S 25 S 20 S 14 R 26 S 20 S 27 S 24 S 13 R 22 S CIP 35 S 40 S 40 S 42 S 37 S 37 S 35 S 35 S 30 S 35 S 34 S 35 S 35 S 37 S 35 S 31 S 35 S 24 S 24 S AMP 0 R 0 R 0 R 0 R 0 R 0 R 15 R 18 I 20 S 16 R 18 I 10 R 15 R 15 R 15 R 17 R 15 R 17 R 16 R FD 26 S 24 S 26 S 26 S 26 S 24 S 26 S 26 S 26 S 24 S 26 S 26 S 26 S 24 S 26 S 26 S 26 S 24 S 26 S F 0 R 0 R 0 R 0 R 0 R 15 I 15 I 15 I 15 I 15 I 15 I 11 R 10 R 9 R 10 R 17 S 0 R 9 R 9 R K 9 R 10 R 18 S 15 I 17 S 20 S 15 I 10 R 20 S 10 R 0 R 0 R 0 R 0 R 0 R 23 S 0 S 15 I 15 I NA 0 R 0 R 0 R 0 R 0 R 0 R 0 R 0 R 0 R 0 R 0 R 0 R 0 R 0 R 0 R 0 R 0 R 0 R 0 R CT 16 S 16 S 16 S 17 S 17 S 16 S 12 S 11 S 11 S 13 S 15 S 16 S 10 R 12 S 11 S 14 S 11 S 9 R 11 S CN 30 S 34 S 38 S 40 S 40 S 40 S 21 S 20 S 28 S 20 S 20 S 23 S 21 S 20 S 20 S 30 S 24 S 20 S 16 S KF 0 R 0 R 0 R 0 R 0 R 0 R 0 R 0 R 0 R 0 R 0 R 0 R 0 R 0 R 0 R 0 R 0 S 21 S 20 S P 0 R 0 R 0 R 0 R 0 R 0 R 0 R 0 R 0 R 0 R 0 R 0 R 0 R 0 R 0 R 0 R 0 R 0 R 0 R CRO 0 R 0 R 0 R 0 R 0 R 0 R 14 I 10 R 14 I 14 I 13 I 12 I 14 I 14 I 11 R 30 S 14 I 22 S 24 S VA 0 R 0 R 0 R 0 R 0 R 0 R 25 S 25 S 20 S 27 S 29 S 25 S 26 S 27 S 24 S 20 S 27 S 0 R 0 R DA 0 R 25 S 25 S 29 S 27 S 27 S 22 S 25 S 25 S 0 R 28 S 28 S 29 S 28 S 28 S 29 S 29 S 29 S 29 S CTX 10 R 10 R 13 R 12 R 10 R 10 R 25 I 22 R 20 R 25 I 22 R 20 R 24 I 22 R 24 I 30 S 24 I 29 S 30 S ETP 22 S 12 R 15 R 12 R 11 R 14 R 13 R 21 S 25 S 9 R 10 R 14 R 12 R 15 R 12 R 27 S 9 R 15 R 17 I AK 37 S 40 S 39 S 35 S 34 S 40 S 25 S 20 S 27 S 24 S 22 S 24 S 24 S 21 S 21 S 30 S 22 S 24 S 24 S MEM 35 S 30 S 26 S 30 S 32 S 35 S 25 S 15 I 32 S 21 S 20 S 20 S 20 S 20 S 18 S 28 S 20 S 16 S 18 S E 0 R 0 R 0 R 0 R 0 R 0 R 0 R 0 R 0 R 0 R 0 R 0 R 0 R 0 R 0 R 0 R 0 R 0 R 0 R
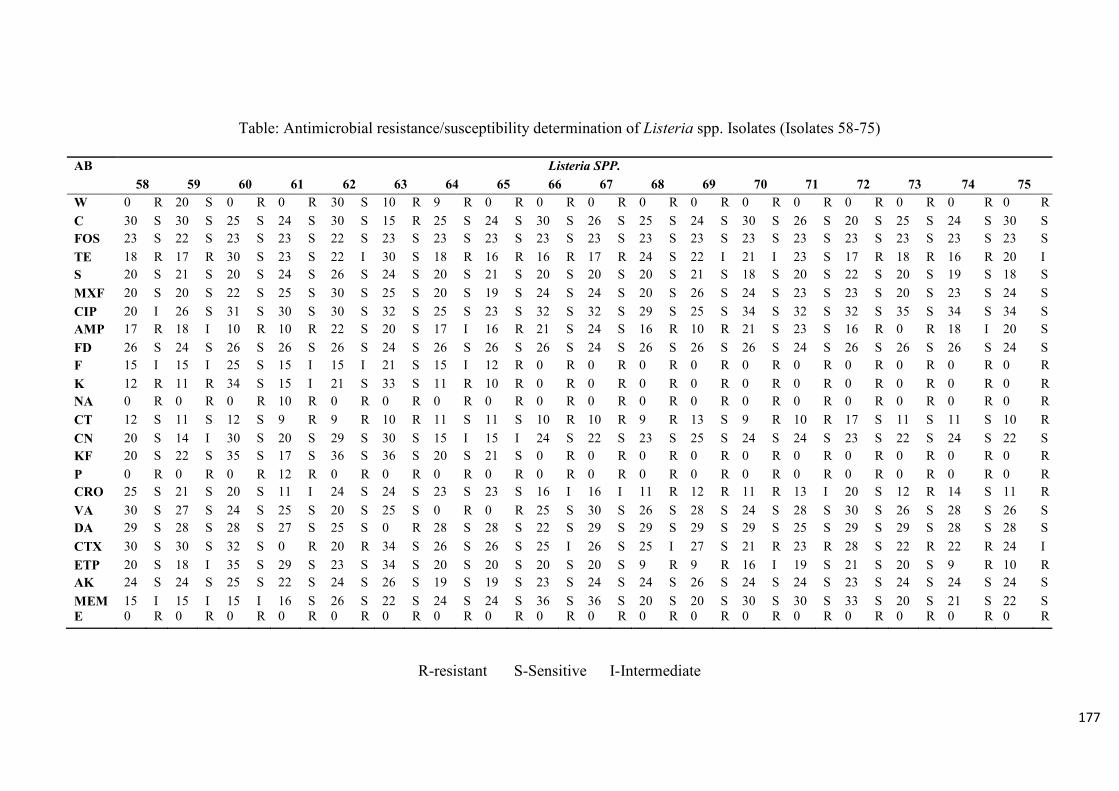
177
Table: Antimicrobial resistance/susceptibility determination of Listeria spp. Isolates (Isolates 58-75)
R-resistant S-Sensitive I-Intermediate
AB Listeria SPP. 58 59 60 61 62 63 64 65 66 67 68 69 70 71 72 73 74 75 W 0 R 20 S 0 R 0 R 30 S 10 R 9 R 0 R 0 R 0 R 0 R 0 R 0 R 0 R 0 R 0 R 0 R 0 R C 30 S 30 S 25 S 24 S 30 S 15 R 25 S 24 S 30 S 26 S 25 S 24 S 30 S 26 S 20 S 25 S 24 S 30 S FOS 23 S 22 S 23 S 23 S 22 S 23 S 23 S 23 S 23 S 23 S 23 S 23 S 23 S 23 S 23 S 23 S 23 S 23 S TE 18 R 17 R 30 S 23 S 22 I 30 S 18 R 16 R 16 R 17 R 24 S 22 I 21 I 23 S 17 R 18 R 16 R 20 I S 20 S 21 S 20 S 24 S 26 S 24 S 20 S 21 S 20 S 20 S 20 S 21 S 18 S 20 S 22 S 20 S 19 S 18 S MXF 20 S 20 S 22 S 25 S 30 S 25 S 20 S 19 S 24 S 24 S 20 S 26 S 24 S 23 S 23 S 20 S 23 S 24 S CIP 20 I 26 S 31 S 30 S 30 S 32 S 25 S 23 S 32 S 32 S 29 S 25 S 34 S 32 S 32 S 35 S 34 S 34 S AMP 17 R 18 I 10 R 10 R 22 S 20 S 17 I 16 R 21 S 24 S 16 R 10 R 21 S 23 S 16 R 0 R 18 I 20 S FD 26 S 24 S 26 S 26 S 26 S 24 S 26 S 26 S 26 S 24 S 26 S 26 S 26 S 24 S 26 S 26 S 26 S 24 S F 15 I 15 I 25 S 15 I 15 I 21 S 15 I 12 R 0 R 0 R 0 R 0 R 0 R 0 R 0 R 0 R 0 R 0 R K 12 R 11 R 34 S 15 I 21 S 33 S 11 R 10 R 0 R 0 R 0 R 0 R 0 R 0 R 0 R 0 R 0 R 0 R NA 0 R 0 R 0 R 10 R 0 R 0 R 0 R 0 R 0 R 0 R 0 R 0 R 0 R 0 R 0 R 0 R 0 R 0 R CT 12 S 11 S 12 S 9 R 9 R 10 R 11 S 11 S 10 R 10 R 9 R 13 S 9 R 10 R 17 S 11 S 11 S 10 R CN 20 S 14 I 30 S 20 S 29 S 30 S 15 I 15 I 24 S 22 S 23 S 25 S 24 S 24 S 23 S 22 S 24 S 22 S KF 20 S 22 S 35 S 17 S 36 S 36 S 20 S 21 S 0 R 0 R 0 R 0 R 0 R 0 R 0 R 0 R 0 R 0 R P 0 R 0 R 0 R 12 R 0 R 0 R 0 R 0 R 0 R 0 R 0 R 0 R 0 R 0 R 0 R 0 R 0 R 0 R CRO 25 S 21 S 20 S 11 I 24 S 24 S 23 S 23 S 16 I 16 I 11 R 12 R 11 R 13 I 20 S 12 R 14 S 11 R VA 30 S 27 S 24 S 25 S 20 S 25 S 0 R 0 R 25 S 30 S 26 S 28 S 24 S 28 S 30 S 26 S 28 S 26 S DA 29 S 28 S 28 S 27 S 25 S 0 R 28 S 28 S 22 S 29 S 29 S 29 S 29 S 25 S 29 S 29 S 28 S 28 S CTX 30 S 30 S 32 S 0 R 20 R 34 S 26 S 26 S 25 I 26 S 25 I 27 S 21 R 23 R 28 S 22 R 22 R 24 I ETP 20 S 18 I 35 S 29 S 23 S 34 S 20 S 20 S 20 S 20 S 9 R 9 R 16 I 19 S 21 S 20 S 9 R 10 R AK 24 S 24 S 25 S 22 S 24 S 26 S 19 S 19 S 23 S 24 S 24 S 26 S 24 S 24 S 23 S 24 S 24 S 24 S MEM 15 I 15 I 15 I 16 S 26 S 22 S 24 S 24 S 36 S 36 S 20 S 20 S 30 S 30 S 33 S 20 S 21 S 22 S E 0 R 0 R 0 R 0 R 0 R 0 R 0 R 0 R 0 R 0 R 0 R 0 R 0 R 0 R 0 R 0 R 0 R 0 R
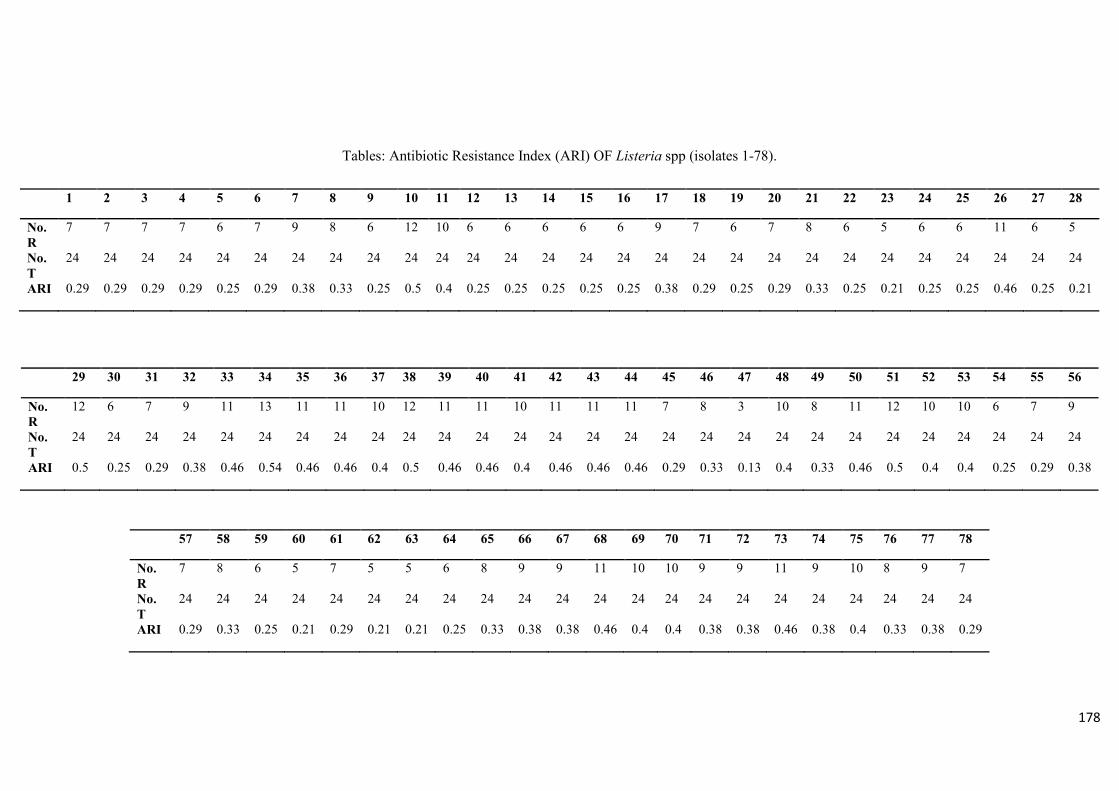
178
Tables: Antibiotic Resistance Index (ARI) OF Listeria spp (isolates 1-78).
1 2 3 4 5 6 7 8 9 10 11 12 13 14 15 16 17 18 19 20 21 22 23 24 25 26 27 28
No. R
7 7 7 7 6 7 9 8 6 12 10 6 6 6 6 6 9 7 6 7 8 6 5 6 6 11 6 5
No. T
24 24 24 24 24 24 24 24 24 24 24 24 24 24 24 24 24 24 24 24 24 24 24 24 24 24 24 24
ARI 0.29 0.29 0.29 0.29 0.25 0.29 0.38 0.33 0.25 0.5 0.4 0.25 0.25 0.25 0.25 0.25 0.38 0.29 0.25 0.29 0.33 0.25 0.21 0.25 0.25 0.46 0.25 0.21
29 30 31 32 33 34 35 36 37 38 39 40 41 42 43 44 45 46 47 48 49 50 51 52 53 54 55 56
No. R
12 6 7 9 11 13 11 11 10 12 11 11 10 11 11 11 7 8 3 10 8 11 12 10 10 6 7 9
No. T
24 24 24 24 24 24 24 24 24 24 24 24 24 24 24 24 24 24 24 24 24 24 24 24 24 24 24 24
ARI 0.5 0.25 0.29 0.38 0.46 0.54 0.46 0.46 0.4 0.5 0.46 0.46 0.4 0.46 0.46 0.46 0.29 0.33 0.13 0.4 0.33 0.46 0.5 0.4 0.4 0.25 0.29 0.38
57 58 59 60 61 62 63 64 65 66 67 68 69 70 71 72 73 74 75 76 77 78
No. R
7 8 6 5 7 5 5 6 8 9 9 11 10 10 9 9 11 9 10 8 9 7
No. T
24 24 24 24 24 24 24 24 24 24 24 24 24 24 24 24 24 24 24 24 24 24
ARI 0.29 0.33 0.25 0.21 0.29 0.21 0.21 0.25 0.33 0.38 0.38 0.46 0.4 0.4 0.38 0.38 0.46 0.38 0.4 0.33 0.38 0.29
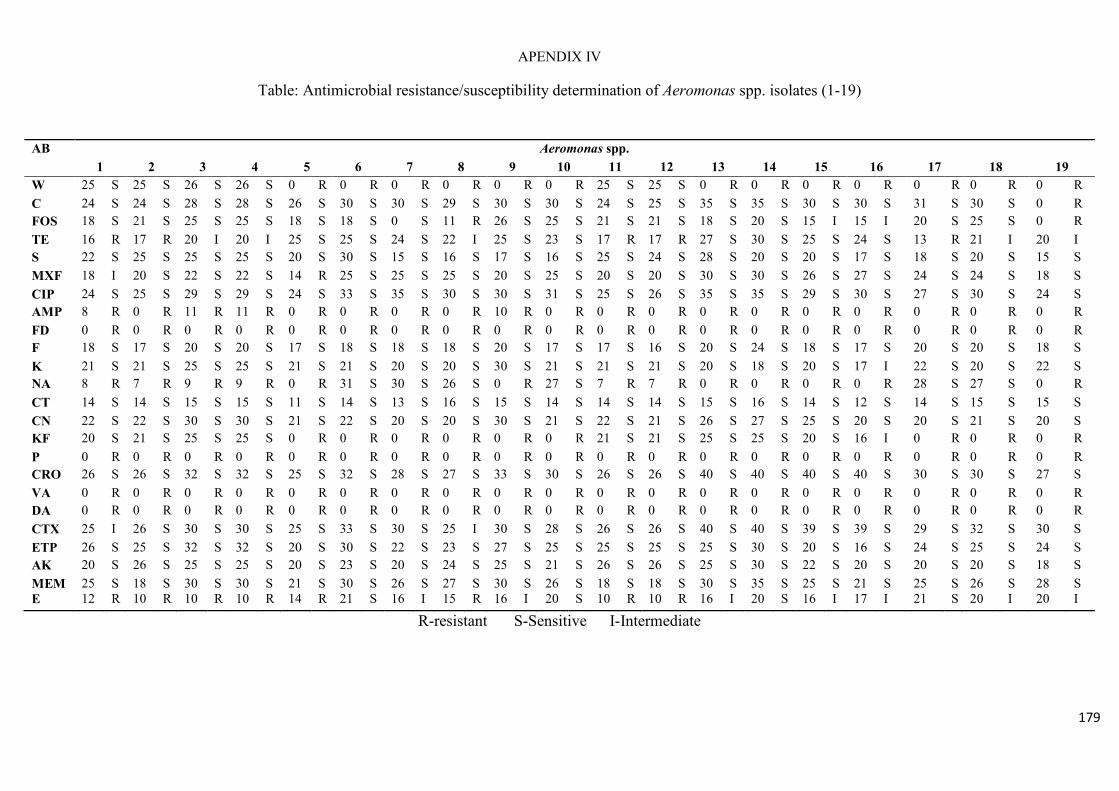
179
APENDIX IV
Table: Antimicrobial resistance/susceptibility determination of Aeromonas spp. isolates (1-19)
R-resistant S-Sensitive I-Intermediate
AB Aeromonas spp. 1 2 3 4 5 6 7 8 9 10 11 12 13 14 15 16 17 18 19 W 25 S 25 S 26 S 26 S 0 R 0 R 0 R 0 R 0 R 0 R 25 S 25 S 0 R 0 R 0 R 0 R 0 R 0 R 0 R C 24 S 24 S 28 S 28 S 26 S 30 S 30 S 29 S 30 S 30 S 24 S 25 S 35 S 35 S 30 S 30 S 31 S 30 S 0 R FOS 18 S 21 S 25 S 25 S 18 S 18 S 0 S 11 R 26 S 25 S 21 S 21 S 18 S 20 S 15 I 15 I 20 S 25 S 0 R TE 16 R 17 R 20 I 20 I 25 S 25 S 24 S 22 I 25 S 23 S 17 R 17 R 27 S 30 S 25 S 24 S 13 R 21 I 20 I S 22 S 25 S 25 S 25 S 20 S 30 S 15 S 16 S 17 S 16 S 25 S 24 S 28 S 20 S 20 S 17 S 18 S 20 S 15 S MXF 18 I 20 S 22 S 22 S 14 R 25 S 25 S 25 S 20 S 25 S 20 S 20 S 30 S 30 S 26 S 27 S 24 S 24 S 18 S CIP 24 S 25 S 29 S 29 S 24 S 33 S 35 S 30 S 30 S 31 S 25 S 26 S 35 S 35 S 29 S 30 S 27 S 30 S 24 S AMP 8 R 0 R 11 R 11 R 0 R 0 R 0 R 0 R 10 R 0 R 0 R 0 R 0 R 0 R 0 R 0 R 0 R 0 R 0 R FD 0 R 0 R 0 R 0 R 0 R 0 R 0 R 0 R 0 R 0 R 0 R 0 R 0 R 0 R 0 R 0 R 0 R 0 R 0 R F 18 S 17 S 20 S 20 S 17 S 18 S 18 S 18 S 20 S 17 S 17 S 16 S 20 S 24 S 18 S 17 S 20 S 20 S 18 S K 21 S 21 S 25 S 25 S 21 S 21 S 20 S 20 S 30 S 21 S 21 S 21 S 20 S 18 S 20 S 17 I 22 S 20 S 22 S NA 8 R 7 R 9 R 9 R 0 R 31 S 30 S 26 S 0 R 27 S 7 R 7 R 0 R 0 R 0 R 0 R 28 S 27 S 0 R CT 14 S 14 S 15 S 15 S 11 S 14 S 13 S 16 S 15 S 14 S 14 S 14 S 15 S 16 S 14 S 12 S 14 S 15 S 15 S CN 22 S 22 S 30 S 30 S 21 S 22 S 20 S 20 S 30 S 21 S 22 S 21 S 26 S 27 S 25 S 20 S 20 S 21 S 20 S KF 20 S 21 S 25 S 25 S 0 R 0 R 0 R 0 R 0 R 0 R 21 S 21 S 25 S 25 S 20 S 16 I 0 R 0 R 0 R P 0 R 0 R 0 R 0 R 0 R 0 R 0 R 0 R 0 R 0 R 0 R 0 R 0 R 0 R 0 R 0 R 0 R 0 R 0 R CRO 26 S 26 S 32 S 32 S 25 S 32 S 28 S 27 S 33 S 30 S 26 S 26 S 40 S 40 S 40 S 40 S 30 S 30 S 27 S VA 0 R 0 R 0 R 0 R 0 R 0 R 0 R 0 R 0 R 0 R 0 R 0 R 0 R 0 R 0 R 0 R 0 R 0 R 0 R DA 0 R 0 R 0 R 0 R 0 R 0 R 0 R 0 R 0 R 0 R 0 R 0 R 0 R 0 R 0 R 0 R 0 R 0 R 0 R CTX 25 I 26 S 30 S 30 S 25 S 33 S 30 S 25 I 30 S 28 S 26 S 26 S 40 S 40 S 39 S 39 S 29 S 32 S 30 S ETP 26 S 25 S 32 S 32 S 20 S 30 S 22 S 23 S 27 S 25 S 25 S 25 S 25 S 30 S 20 S 16 S 24 S 25 S 24 S AK 20 S 26 S 25 S 25 S 20 S 23 S 20 S 24 S 25 S 21 S 26 S 26 S 25 S 30 S 22 S 20 S 20 S 20 S 18 S MEM 25 S 18 S 30 S 30 S 21 S 30 S 26 S 27 S 30 S 26 S 18 S 18 S 30 S 35 S 25 S 21 S 25 S 26 S 28 S E 12 R 10 R 10 R 10 R 14 R 21 S 16 I 15 R 16 I 20 S 10 R 10 R 16 I 20 S 16 I 17 I 21 S 20 I 20 I
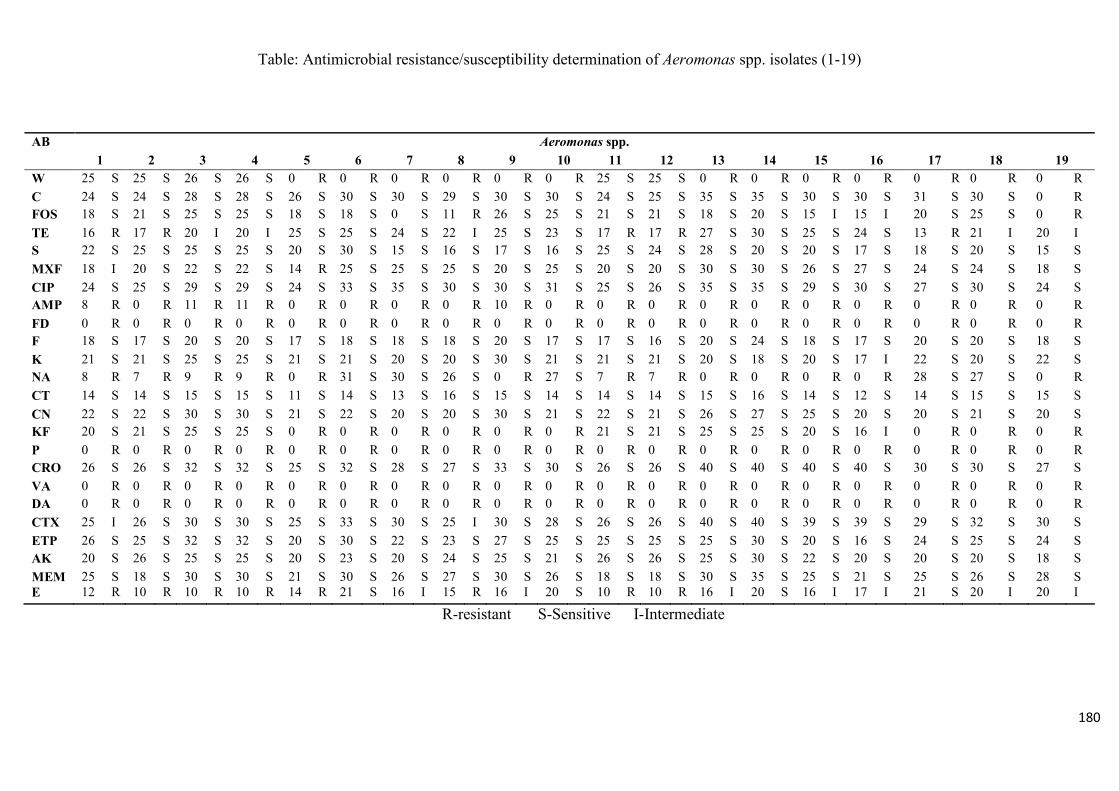
180
Table: Antimicrobial resistance/susceptibility determination of Aeromonas spp. isolates (1-19)
R-resistant S-Sensitive I-Intermediate
AB Aeromonas spp. 1 2 3 4 5 6 7 8 9 10 11 12 13 14 15 16 17 18 19 W 25 S 25 S 26 S 26 S 0 R 0 R 0 R 0 R 0 R 0 R 25 S 25 S 0 R 0 R 0 R 0 R 0 R 0 R 0 R C 24 S 24 S 28 S 28 S 26 S 30 S 30 S 29 S 30 S 30 S 24 S 25 S 35 S 35 S 30 S 30 S 31 S 30 S 0 R FOS 18 S 21 S 25 S 25 S 18 S 18 S 0 S 11 R 26 S 25 S 21 S 21 S 18 S 20 S 15 I 15 I 20 S 25 S 0 R TE 16 R 17 R 20 I 20 I 25 S 25 S 24 S 22 I 25 S 23 S 17 R 17 R 27 S 30 S 25 S 24 S 13 R 21 I 20 I S 22 S 25 S 25 S 25 S 20 S 30 S 15 S 16 S 17 S 16 S 25 S 24 S 28 S 20 S 20 S 17 S 18 S 20 S 15 S MXF 18 I 20 S 22 S 22 S 14 R 25 S 25 S 25 S 20 S 25 S 20 S 20 S 30 S 30 S 26 S 27 S 24 S 24 S 18 S CIP 24 S 25 S 29 S 29 S 24 S 33 S 35 S 30 S 30 S 31 S 25 S 26 S 35 S 35 S 29 S 30 S 27 S 30 S 24 S AMP 8 R 0 R 11 R 11 R 0 R 0 R 0 R 0 R 10 R 0 R 0 R 0 R 0 R 0 R 0 R 0 R 0 R 0 R 0 R FD 0 R 0 R 0 R 0 R 0 R 0 R 0 R 0 R 0 R 0 R 0 R 0 R 0 R 0 R 0 R 0 R 0 R 0 R 0 R F 18 S 17 S 20 S 20 S 17 S 18 S 18 S 18 S 20 S 17 S 17 S 16 S 20 S 24 S 18 S 17 S 20 S 20 S 18 S K 21 S 21 S 25 S 25 S 21 S 21 S 20 S 20 S 30 S 21 S 21 S 21 S 20 S 18 S 20 S 17 I 22 S 20 S 22 S NA 8 R 7 R 9 R 9 R 0 R 31 S 30 S 26 S 0 R 27 S 7 R 7 R 0 R 0 R 0 R 0 R 28 S 27 S 0 R CT 14 S 14 S 15 S 15 S 11 S 14 S 13 S 16 S 15 S 14 S 14 S 14 S 15 S 16 S 14 S 12 S 14 S 15 S 15 S CN 22 S 22 S 30 S 30 S 21 S 22 S 20 S 20 S 30 S 21 S 22 S 21 S 26 S 27 S 25 S 20 S 20 S 21 S 20 S KF 20 S 21 S 25 S 25 S 0 R 0 R 0 R 0 R 0 R 0 R 21 S 21 S 25 S 25 S 20 S 16 I 0 R 0 R 0 R P 0 R 0 R 0 R 0 R 0 R 0 R 0 R 0 R 0 R 0 R 0 R 0 R 0 R 0 R 0 R 0 R 0 R 0 R 0 R CRO 26 S 26 S 32 S 32 S 25 S 32 S 28 S 27 S 33 S 30 S 26 S 26 S 40 S 40 S 40 S 40 S 30 S 30 S 27 S VA 0 R 0 R 0 R 0 R 0 R 0 R 0 R 0 R 0 R 0 R 0 R 0 R 0 R 0 R 0 R 0 R 0 R 0 R 0 R DA 0 R 0 R 0 R 0 R 0 R 0 R 0 R 0 R 0 R 0 R 0 R 0 R 0 R 0 R 0 R 0 R 0 R 0 R 0 R CTX 25 I 26 S 30 S 30 S 25 S 33 S 30 S 25 I 30 S 28 S 26 S 26 S 40 S 40 S 39 S 39 S 29 S 32 S 30 S ETP 26 S 25 S 32 S 32 S 20 S 30 S 22 S 23 S 27 S 25 S 25 S 25 S 25 S 30 S 20 S 16 S 24 S 25 S 24 S AK 20 S 26 S 25 S 25 S 20 S 23 S 20 S 24 S 25 S 21 S 26 S 26 S 25 S 30 S 22 S 20 S 20 S 20 S 18 S MEM 25 S 18 S 30 S 30 S 21 S 30 S 26 S 27 S 30 S 26 S 18 S 18 S 30 S 35 S 25 S 21 S 25 S 26 S 28 S E 12 R 10 R 10 R 10 R 14 R 21 S 16 I 15 R 16 I 20 S 10 R 10 R 16 I 20 S 16 I 17 I 21 S 20 I 20 I
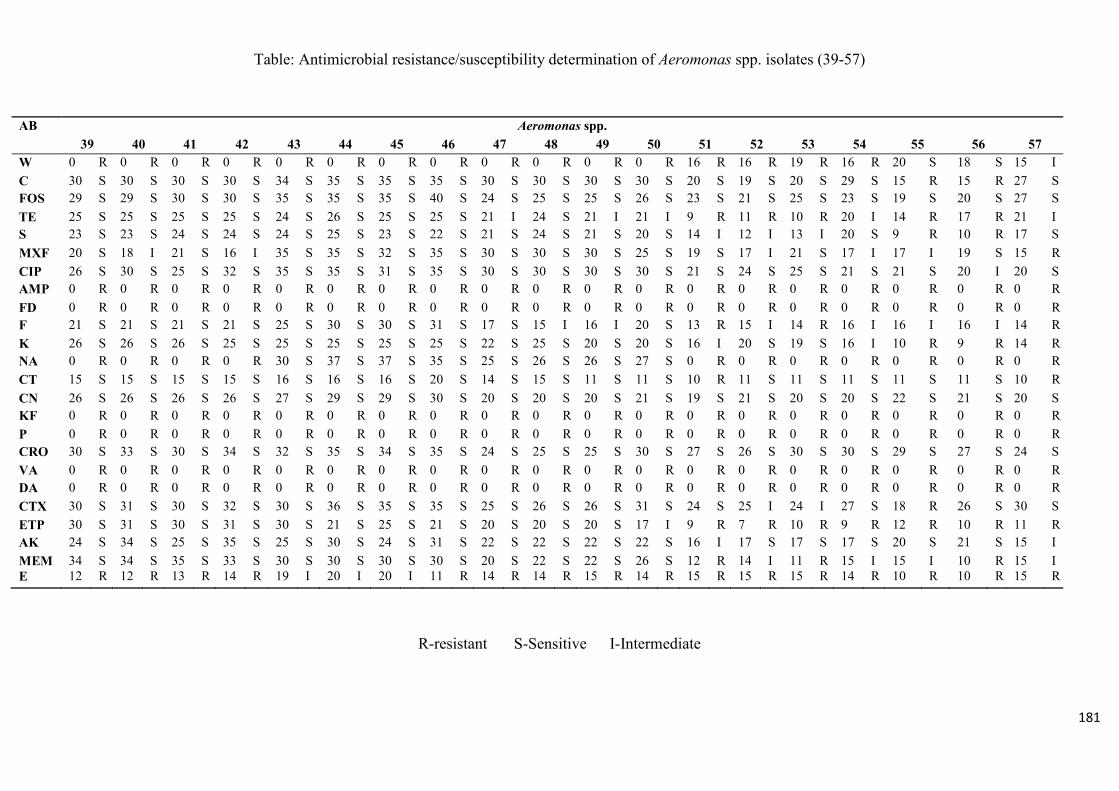
181
Table: Antimicrobial resistance/susceptibility determination of Aeromonas spp. isolates (39-57)
R-resistant S-Sensitive I-Intermediate
AB Aeromonas spp. 39 40 41 42 43 44 45 46 47 48 49 50 51 52 53 54 55 56 57 W 0 R 0 R 0 R 0 R 0 R 0 R 0 R 0 R 0 R 0 R 0 R 0 R 16 R 16 R 19 R 16 R 20 S 18 S 15 I C 30 S 30 S 30 S 30 S 34 S 35 S 35 S 35 S 30 S 30 S 30 S 30 S 20 S 19 S 20 S 29 S 15 R 15 R 27 S FOS 29 S 29 S 30 S 30 S 35 S 35 S 35 S 40 S 24 S 25 S 25 S 26 S 23 S 21 S 25 S 23 S 19 S 20 S 27 S TE 25 S 25 S 25 S 25 S 24 S 26 S 25 S 25 S 21 I 24 S 21 I 21 I 9 R 11 R 10 R 20 I 14 R 17 R 21 I S 23 S 23 S 24 S 24 S 24 S 25 S 23 S 22 S 21 S 24 S 21 S 20 S 14 I 12 I 13 I 20 S 9 R 10 R 17 S MXF 20 S 18 I 21 S 16 I 35 S 35 S 32 S 35 S 30 S 30 S 30 S 25 S 19 S 17 I 21 S 17 I 17 I 19 S 15 R CIP 26 S 30 S 25 S 32 S 35 S 35 S 31 S 35 S 30 S 30 S 30 S 30 S 21 S 24 S 25 S 21 S 21 S 20 I 20 S AMP 0 R 0 R 0 R 0 R 0 R 0 R 0 R 0 R 0 R 0 R 0 R 0 R 0 R 0 R 0 R 0 R 0 R 0 R 0 R FD 0 R 0 R 0 R 0 R 0 R 0 R 0 R 0 R 0 R 0 R 0 R 0 R 0 R 0 R 0 R 0 R 0 R 0 R 0 R F 21 S 21 S 21 S 21 S 25 S 30 S 30 S 31 S 17 S 15 I 16 I 20 S 13 R 15 I 14 R 16 I 16 I 16 I 14 R K 26 S 26 S 26 S 25 S 25 S 25 S 25 S 25 S 22 S 25 S 20 S 20 S 16 I 20 S 19 S 16 I 10 R 9 R 14 R NA 0 R 0 R 0 R 0 R 30 S 37 S 37 S 35 S 25 S 26 S 26 S 27 S 0 R 0 R 0 R 0 R 0 R 0 R 0 R CT 15 S 15 S 15 S 15 S 16 S 16 S 16 S 20 S 14 S 15 S 11 S 11 S 10 R 11 S 11 S 11 S 11 S 11 S 10 R CN 26 S 26 S 26 S 26 S 27 S 29 S 29 S 30 S 20 S 20 S 20 S 21 S 19 S 21 S 20 S 20 S 22 S 21 S 20 S KF 0 R 0 R 0 R 0 R 0 R 0 R 0 R 0 R 0 R 0 R 0 R 0 R 0 R 0 R 0 R 0 R 0 R 0 R 0 R P 0 R 0 R 0 R 0 R 0 R 0 R 0 R 0 R 0 R 0 R 0 R 0 R 0 R 0 R 0 R 0 R 0 R 0 R 0 R CRO 30 S 33 S 30 S 34 S 32 S 35 S 34 S 35 S 24 S 25 S 25 S 30 S 27 S 26 S 30 S 30 S 29 S 27 S 24 S VA 0 R 0 R 0 R 0 R 0 R 0 R 0 R 0 R 0 R 0 R 0 R 0 R 0 R 0 R 0 R 0 R 0 R 0 R 0 R DA 0 R 0 R 0 R 0 R 0 R 0 R 0 R 0 R 0 R 0 R 0 R 0 R 0 R 0 R 0 R 0 R 0 R 0 R 0 R CTX 30 S 31 S 30 S 32 S 30 S 36 S 35 S 35 S 25 S 26 S 26 S 31 S 24 S 25 I 24 I 27 S 18 R 26 S 30 S ETP 30 S 31 S 30 S 31 S 30 S 21 S 25 S 21 S 20 S 20 S 20 S 17 I 9 R 7 R 10 R 9 R 12 R 10 R 11 R AK 24 S 34 S 25 S 35 S 25 S 30 S 24 S 31 S 22 S 22 S 22 S 22 S 16 I 17 S 17 S 17 S 20 S 21 S 15 I MEM 34 S 34 S 35 S 33 S 30 S 30 S 30 S 30 S 20 S 22 S 22 S 26 S 12 R 14 I 11 R 15 I 15 I 10 R 15 I E 12 R 12 R 13 R 14 R 19 I 20 I 20 I 11 R 14 R 14 R 15 R 14 R 15 R 15 R 15 R 14 R 10 R 10 R 15 R
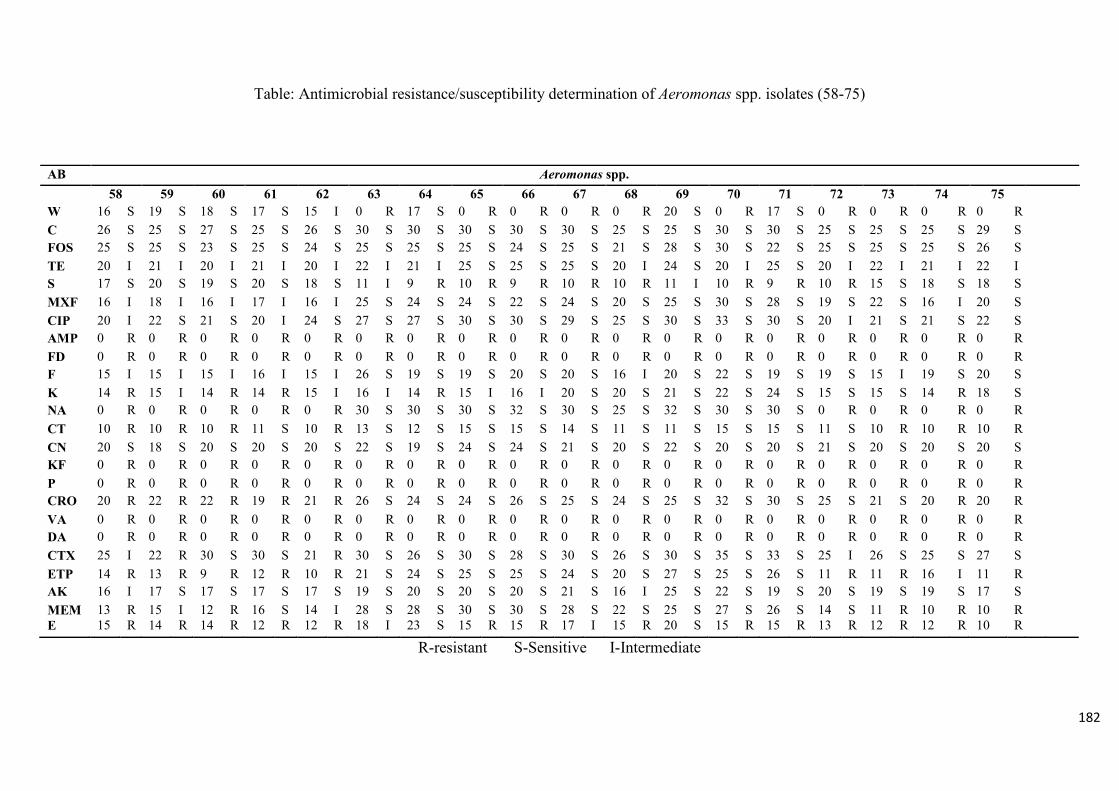
182
Table: Antimicrobial resistance/susceptibility determination of Aeromonas spp. isolates (58-75)
R-resistant S-Sensitive I-Intermediate
AB Aeromonas spp. 58 59 60 61 62 63 64 65 66 67 68 69 70 71 72 73 74 75 W 16 S 19 S 18 S 17 S 15 I 0 R 17 S 0 R 0 R 0 R 0 R 20 S 0 R 17 S 0 R 0 R 0 R 0 R C 26 S 25 S 27 S 25 S 26 S 30 S 30 S 30 S 30 S 30 S 25 S 25 S 30 S 30 S 25 S 25 S 25 S 29 S FOS 25 S 25 S 23 S 25 S 24 S 25 S 25 S 25 S 24 S 25 S 21 S 28 S 30 S 22 S 25 S 25 S 25 S 26 S TE 20 I 21 I 20 I 21 I 20 I 22 I 21 I 25 S 25 S 25 S 20 I 24 S 20 I 25 S 20 I 22 I 21 I 22 I S 17 S 20 S 19 S 20 S 18 S 11 I 9 R 10 R 9 R 10 R 10 R 11 I 10 R 9 R 10 R 15 S 18 S 18 S MXF 16 I 18 I 16 I 17 I 16 I 25 S 24 S 24 S 22 S 24 S 20 S 25 S 30 S 28 S 19 S 22 S 16 I 20 S CIP 20 I 22 S 21 S 20 I 24 S 27 S 27 S 30 S 30 S 29 S 25 S 30 S 33 S 30 S 20 I 21 S 21 S 22 S AMP 0 R 0 R 0 R 0 R 0 R 0 R 0 R 0 R 0 R 0 R 0 R 0 R 0 R 0 R 0 R 0 R 0 R 0 R FD 0 R 0 R 0 R 0 R 0 R 0 R 0 R 0 R 0 R 0 R 0 R 0 R 0 R 0 R 0 R 0 R 0 R 0 R F 15 I 15 I 15 I 16 I 15 I 26 S 19 S 19 S 20 S 20 S 16 I 20 S 22 S 19 S 19 S 15 I 19 S 20 S K 14 R 15 I 14 R 14 R 15 I 16 I 14 R 15 I 16 I 20 S 20 S 21 S 22 S 24 S 15 S 15 S 14 R 18 S NA 0 R 0 R 0 R 0 R 0 R 30 S 30 S 30 S 32 S 30 S 25 S 32 S 30 S 30 S 0 R 0 R 0 R 0 R CT 10 R 10 R 10 R 11 S 10 R 13 S 12 S 15 S 15 S 14 S 11 S 11 S 15 S 15 S 11 S 10 R 10 R 10 R CN 20 S 18 S 20 S 20 S 20 S 22 S 19 S 24 S 24 S 21 S 20 S 22 S 20 S 20 S 21 S 20 S 20 S 20 S KF 0 R 0 R 0 R 0 R 0 R 0 R 0 R 0 R 0 R 0 R 0 R 0 R 0 R 0 R 0 R 0 R 0 R 0 R P 0 R 0 R 0 R 0 R 0 R 0 R 0 R 0 R 0 R 0 R 0 R 0 R 0 R 0 R 0 R 0 R 0 R 0 R CRO 20 R 22 R 22 R 19 R 21 R 26 S 24 S 24 S 26 S 25 S 24 S 25 S 32 S 30 S 25 S 21 S 20 R 20 R VA 0 R 0 R 0 R 0 R 0 R 0 R 0 R 0 R 0 R 0 R 0 R 0 R 0 R 0 R 0 R 0 R 0 R 0 R DA 0 R 0 R 0 R 0 R 0 R 0 R 0 R 0 R 0 R 0 R 0 R 0 R 0 R 0 R 0 R 0 R 0 R 0 R CTX 25 I 22 R 30 S 30 S 21 R 30 S 26 S 30 S 28 S 30 S 26 S 30 S 35 S 33 S 25 I 26 S 25 S 27 S ETP 14 R 13 R 9 R 12 R 10 R 21 S 24 S 25 S 25 S 24 S 20 S 27 S 25 S 26 S 11 R 11 R 16 I 11 R AK 16 I 17 S 17 S 17 S 17 S 19 S 20 S 20 S 20 S 21 S 16 I 25 S 22 S 19 S 20 S 19 S 19 S 17 S MEM 13 R 15 I 12 R 16 S 14 I 28 S 28 S 30 S 30 S 28 S 22 S 25 S 27 S 26 S 14 S 11 R 10 R 10 R E 15 R 14 R 14 R 12 R 12 R 18 I 23 S 15 R 15 R 17 I 15 R 20 S 15 R 15 R 13 R 12 R 12 R 10 R
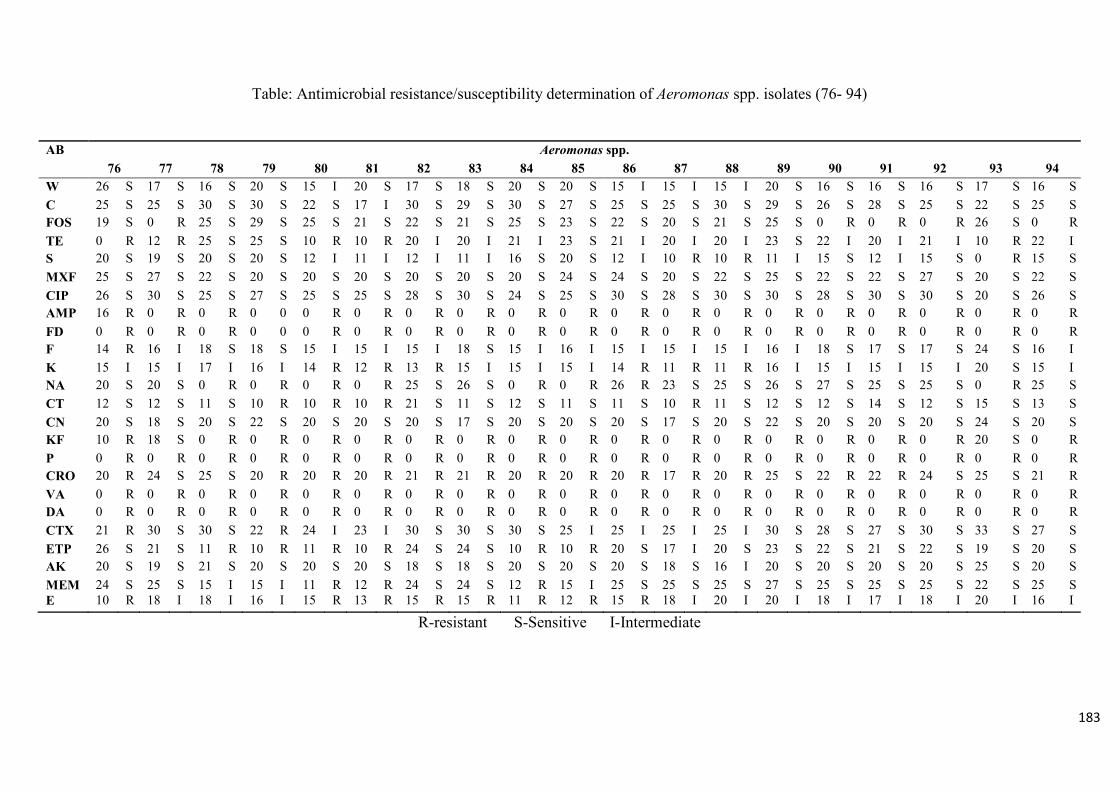
183
Table: Antimicrobial resistance/susceptibility determination of Aeromonas spp. isolates (76- 94)
R-resistant S-Sensitive I-Intermediate
AB Aeromonas spp. 76 77 78 79 80 81 82 83 84 85 86 87 88 89 90 91 92 93 94 W 26 S 17 S 16 S 20 S 15 I 20 S 17 S 18 S 20 S 20 S 15 I 15 I 15 I 20 S 16 S 16 S 16 S 17 S 16 S C 25 S 25 S 30 S 30 S 22 S 17 I 30 S 29 S 30 S 27 S 25 S 25 S 30 S 29 S 26 S 28 S 25 S 22 S 25 S FOS 19 S 0 R 25 S 29 S 25 S 21 S 22 S 21 S 25 S 23 S 22 S 20 S 21 S 25 S 0 R 0 R 0 R 26 S 0 R TE 0 R 12 R 25 S 25 S 10 R 10 R 20 I 20 I 21 I 23 S 21 I 20 I 20 I 23 S 22 I 20 I 21 I 10 R 22 I S 20 S 19 S 20 S 20 S 12 I 11 I 12 I 11 I 16 S 20 S 12 I 10 R 10 R 11 I 15 S 12 I 15 S 0 R 15 S MXF 25 S 27 S 22 S 20 S 20 S 20 S 20 S 20 S 20 S 24 S 24 S 20 S 22 S 25 S 22 S 22 S 27 S 20 S 22 S CIP 26 S 30 S 25 S 27 S 25 S 25 S 28 S 30 S 24 S 25 S 30 S 28 S 30 S 30 S 28 S 30 S 30 S 20 S 26 S AMP 16 R 0 R 0 R 0 0 0 R 0 R 0 R 0 R 0 R 0 R 0 R 0 R 0 R 0 R 0 R 0 R 0 R 0 R 0 R FD 0 R 0 R 0 R 0 0 0 R 0 R 0 R 0 R 0 R 0 R 0 R 0 R 0 R 0 R 0 R 0 R 0 R 0 R 0 R F 14 R 16 I 18 S 18 S 15 I 15 I 15 I 18 S 15 I 16 I 15 I 15 I 15 I 16 I 18 S 17 S 17 S 24 S 16 I K 15 I 15 I 17 I 16 I 14 R 12 R 13 R 15 I 15 I 15 I 14 R 11 R 11 R 16 I 15 I 15 I 15 I 20 S 15 I NA 20 S 20 S 0 R 0 R 0 R 0 R 25 S 26 S 0 R 0 R 26 R 23 S 25 S 26 S 27 S 25 S 25 S 0 R 25 S CT 12 S 12 S 11 S 10 R 10 R 10 R 21 S 11 S 12 S 11 S 11 S 10 R 11 S 12 S 12 S 14 S 12 S 15 S 13 S CN 20 S 18 S 20 S 22 S 20 S 20 S 20 S 17 S 20 S 20 S 20 S 17 S 20 S 22 S 20 S 20 S 20 S 24 S 20 S KF 10 R 18 S 0 R 0 R 0 R 0 R 0 R 0 R 0 R 0 R 0 R 0 R 0 R 0 R 0 R 0 R 0 R 20 S 0 R P 0 R 0 R 0 R 0 R 0 R 0 R 0 R 0 R 0 R 0 R 0 R 0 R 0 R 0 R 0 R 0 R 0 R 0 R 0 R CRO 20 R 24 S 25 S 20 R 20 R 20 R 21 R 21 R 20 R 20 R 20 R 17 R 20 R 25 S 22 R 22 R 24 S 25 S 21 R VA 0 R 0 R 0 R 0 R 0 R 0 R 0 R 0 R 0 R 0 R 0 R 0 R 0 R 0 R 0 R 0 R 0 R 0 R 0 R DA 0 R 0 R 0 R 0 R 0 R 0 R 0 R 0 R 0 R 0 R 0 R 0 R 0 R 0 R 0 R 0 R 0 R 0 R 0 R CTX 21 R 30 S 30 S 22 R 24 I 23 I 30 S 30 S 30 S 25 I 25 I 25 I 25 I 30 S 28 S 27 S 30 S 33 S 27 S ETP 26 S 21 S 11 R 10 R 11 R 10 R 24 S 24 S 10 R 10 R 20 S 17 I 20 S 23 S 22 S 21 S 22 S 19 S 20 S AK 20 S 19 S 21 S 20 S 20 S 20 S 18 S 18 S 20 S 20 S 20 S 18 S 16 I 20 S 20 S 20 S 20 S 25 S 20 S MEM 24 S 25 S 15 I 15 I 11 R 12 R 24 S 24 S 12 R 15 I 25 S 25 S 25 S 27 S 25 S 25 S 25 S 22 S 25 S E 10 R 18 I 18 I 16 I 15 R 13 R 15 R 15 R 11 R 12 R 15 R 18 I 20 I 20 I 18 I 17 I 18 I 20 I 16 I
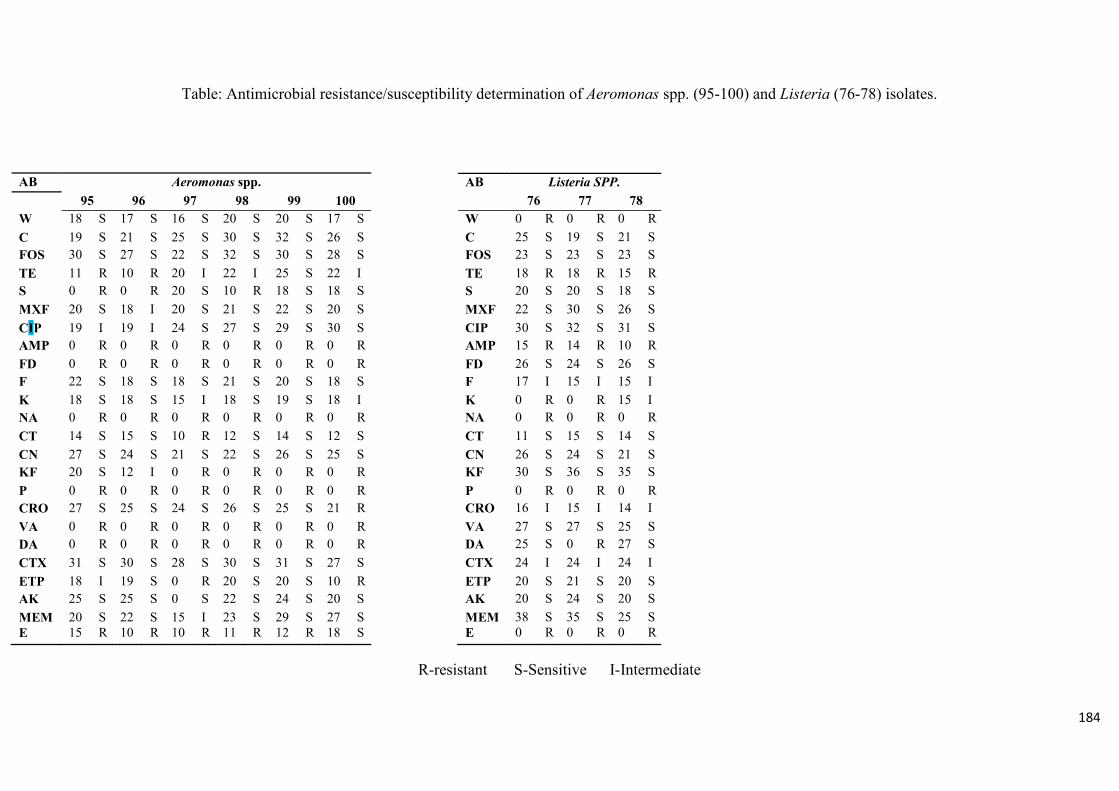
184
Table: Antimicrobial resistance/susceptibility determination of Aeromonas spp. (95-100) and Listeria (76-78) isolates.
R-resistant S-Sensitive I-Intermediate
AB Aeromonas spp. 95 96 97 98 99 100 W 18 S 17 S 16 S 20 S 20 S 17 S C 19 S 21 S 25 S 30 S 32 S 26 S FOS 30 S 27 S 22 S 32 S 30 S 28 S TE 11 R 10 R 20 I 22 I 25 S 22 I S 0 R 0 R 20 S 10 R 18 S 18 S MXF 20 S 18 I 20 S 21 S 22 S 20 S CIP 19 I 19 I 24 S 27 S 29 S 30 S AMP 0 R 0 R 0 R 0 R 0 R 0 R FD 0 R 0 R 0 R 0 R 0 R 0 R F 22 S 18 S 18 S 21 S 20 S 18 S K 18 S 18 S 15 I 18 S 19 S 18 I NA 0 R 0 R 0 R 0 R 0 R 0 R CT 14 S 15 S 10 R 12 S 14 S 12 S CN 27 S 24 S 21 S 22 S 26 S 25 S KF 20 S 12 I 0 R 0 R 0 R 0 R P 0 R 0 R 0 R 0 R 0 R 0 R CRO 27 S 25 S 24 S 26 S 25 S 21 R VA 0 R 0 R 0 R 0 R 0 R 0 R DA 0 R 0 R 0 R 0 R 0 R 0 R CTX 31 S 30 S 28 S 30 S 31 S 27 S ETP 18 I 19 S 0 R 20 S 20 S 10 R AK 25 S 25 S 0 S 22 S 24 S 20 S MEM 20 S 22 S 15 I 23 S 29 S 27 S E 15 R 10 R 10 R 11 R 12 R 18 S
AB Listeria SPP. 76 77 78 W 0 R 0 R 0 R C 25 S 19 S 21 S FOS 23 S 23 S 23 S TE 18 R 18 R 15 R S 20 S 20 S 18 S MXF 22 S 30 S 26 S CIP 30 S 32 S 31 S AMP 15 R 14 R 10 R FD 26 S 24 S 26 S F 17 I 15 I 15 I K 0 R 0 R 15 I NA 0 R 0 R 0 R CT 11 S 15 S 14 S CN 26 S 24 S 21 S KF 30 S 36 S 35 S P 0 R 0 R 0 R CRO 16 I 15 I 14 I VA 27 S 27 S 25 S DA 25 S 0 R 27 S CTX 24 I 24 I 24 I ETP 20 S 21 S 20 S AK 20 S 24 S 20 S MEM 38 S 35 S 25 S E 0 R 0 R 0 R
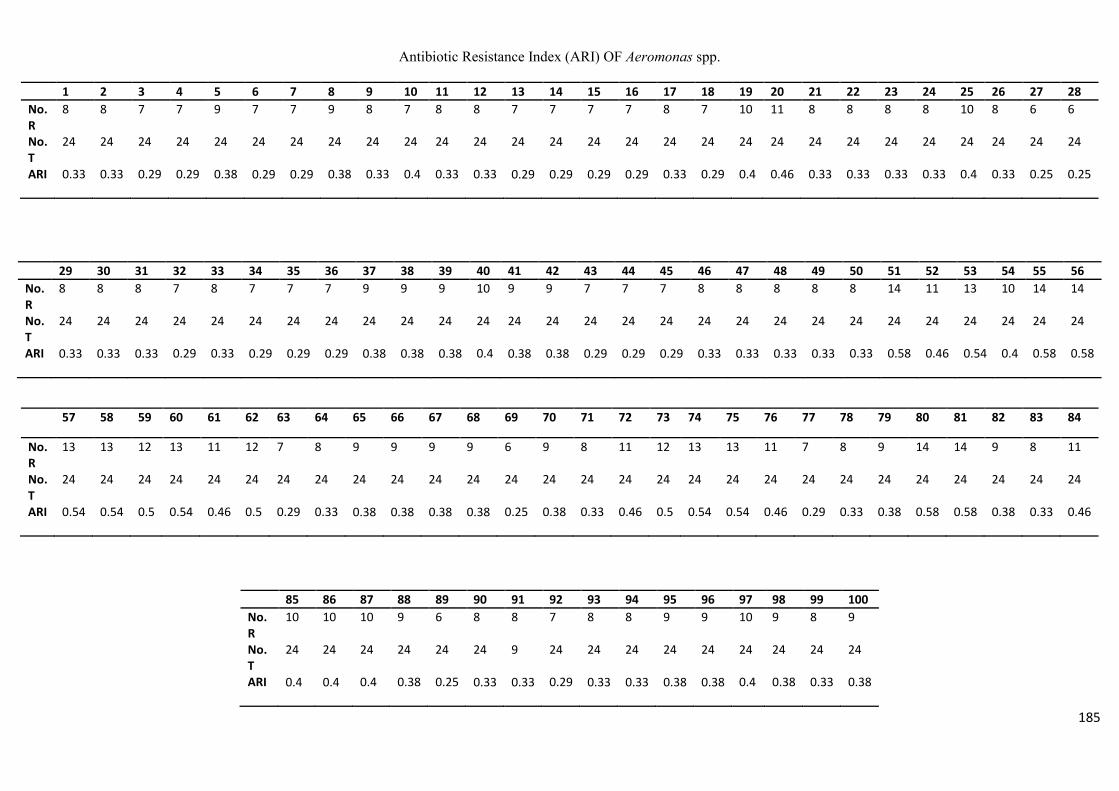
185
Antibiotic Resistance Index (ARI) OF Aeromonas spp.
1 2 3 4 5 6 7 8 9 10 11 12 13 14 15 16 17 18 19 20 21 22 23 24 25 26 27 28 No. R
8 8 7 7 9 7 7 9 8 7 8 8 7 7 7 7 8 7 10 11 8 8 8 8 10 8 6 6
No. T
24 24 24 24 24 24 24 24 24 24 24 24 24 24 24 24 24 24 24 24 24 24 24 24 24 24 24 24
ARI 0.33 0.33 0.29 0.29 0.38 0.29 0.29 0.38 0.33 0.4 0.33 0.33 0.29 0.29 0.29 0.29 0.33 0.29 0.4 0.46 0.33 0.33 0.33 0.33 0.4 0.33 0.25 0.25
29 30 31 32 33 34 35 36 37 38 39 40 41 42 43 44 45 46 47 48 49 50 51 52 53 54 55 56 No. R
8 8 8 7 8 7 7 7 9 9 9 10 9 9 7 7 7 8 8 8 8 8 14 11 13 10 14 14
No. T
24 24 24 24 24 24 24 24 24 24 24 24 24 24 24 24 24 24 24 24 24 24 24 24 24 24 24 24
ARI 0.33 0.33 0.33 0.29 0.33 0.29 0.29 0.29 0.38 0.38 0.38 0.4 0.38 0.38 0.29 0.29 0.29 0.33 0.33 0.33 0.33 0.33 0.58 0.46 0.54 0.4 0.58 0.58
57 58 59 60 61 62 63 64 65 66 67 68 69 70 71 72 73 74 75 76 77 78 79 80 81 82 83 84
No. R
13 13 12 13 11 12 7 8 9 9 9 9 6 9 8 11 12 13 13 11 7 8 9 14 14 9 8 11
No. T
24 24 24 24 24 24 24 24 24 24 24 24 24 24 24 24 24 24 24 24 24 24 24 24 24 24 24 24
ARI 0.54 0.54 0.5 0.54 0.46 0.5 0.29 0.33 0.38 0.38 0.38 0.38 0.25 0.38 0.33 0.46 0.5 0.54 0.54 0.46 0.29 0.33 0.38 0.58 0.58 0.38 0.33 0.46
85 86 87 88 89 90 91 92 93 94 95 96 97 98 99 100 No. R
10 10 10 9 6 8 8 7 8 8 9 9 10 9 8 9
No. T
24 24 24 24 24 24 9 24 24 24 24 24 24 24 24 24
ARI 0.4 0.4 0.4 0.38 0.25 0.33 0.33 0.29 0.33 0.33 0.38 0.38 0.4 0.38 0.33 0.38
Recommended