www.trcsolutions.com
Q2 Fiscal 2016 Investor Review
February 4, 2016Chris Vincze Tom BennetChairman & CEO Chief Financial Officer
T R R
Safe Harbor Statement
2
Certain statements in this presentation may be forward-looking statements within the meaning of Section 27A of the Securities Act of
1933 and Section 21E of the Securities Exchange Act of 1934. You can identify these statements by forward-looking words such as
"may," "expects," "plans," "anticipates," "believes," "estimates," or other words of similar import. You should consider statements that
contain these words carefully because they discuss TRC’s future expectations, contain projections of the Company’s future results of
operations or of its financial condition, or state other "forward-looking" information. TRC believes that it is important to communicate
its future expectations to its investors. However, there may be events in the future that the Company is not able to accurately predict
or control and that may cause its actual results to differ materially from the expectations described in its forward-looking statements.
Investors are cautioned that all forward-looking statements involve risks and uncertainties, and actual results may differ materially
from those discussed as a result of various factors, including, but not limited to, the uncertainty of TRC’s operational and growth
strategies; circumstances which could create large cash outflows, such as contract losses, litigation, uncollectible receivables and
income tax assessments; regulatory uncertainty; the availability of funding for government projects; the level of demand for TRC’s
services; product acceptance; industry-wide competitive factors; the ability to continue to attract and retain highly skilled and qualified
personnel; the availability and adequacy of insurance; and general political or economic conditions. Furthermore, market trends are
subject to changes which could adversely affect future results. See the risk factors and additional discussion in TRC’s Annual Report on
Form 10-K for the fiscal year ended June 30, 2015, Quarterly Reports on Form 10-Q, and other factors detailed from time to time in the
Company’s other filings with the Securities and Exchange Commission.
These slides are intended as a visual aid to TRC’s commentary on the Second Quarter Fiscal Year 2016 Financial Results Conference
Call. As such they should be considered in the full context of that commentary, the transcript of that conference call and TRC’s second
quarter Form 10-Q and Financial Results Press Release. Also, this presentation contains references to non-GAAP metrics such as
EBITDA, gross margin and free cash flow. A reconciliation of GAAP to non-GAAP metrics can be found on slides 22-27.
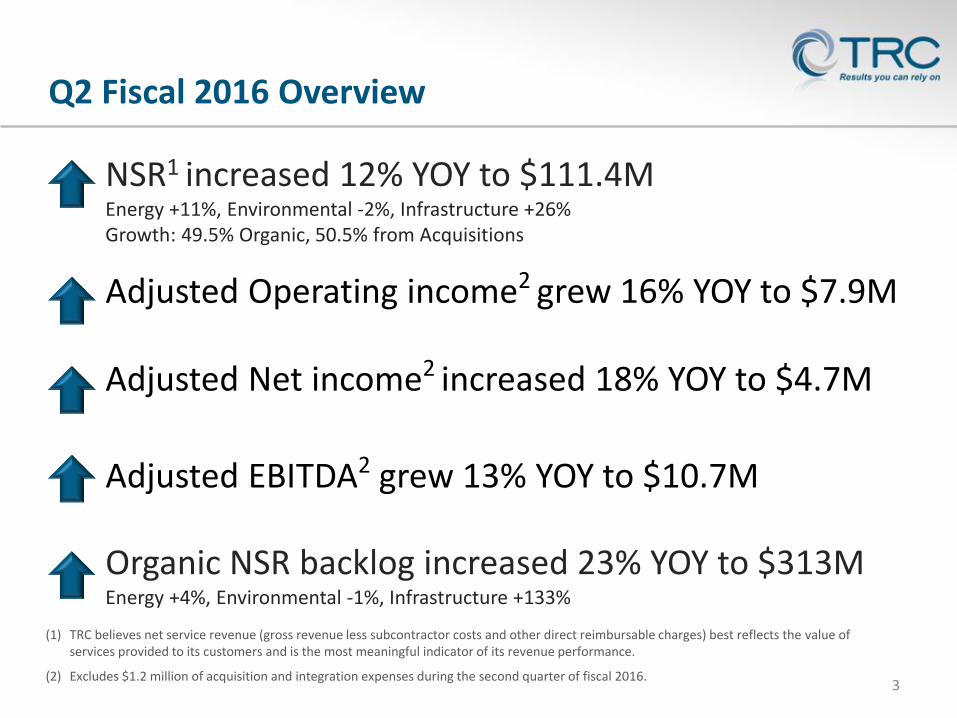
Q2 Fiscal 2016 Overview
3
NSR1 increased 12% YOY to $111.4MEnergy +11%, Environmental -2%, Infrastructure +26%Growth: 49.5% Organic, 50.5% from Acquisitions
Adjusted Operating income2 grew 16% YOY to $7.9M
Organic NSR backlog increased 23% YOY to $313MEnergy +4%, Environmental -1%, Infrastructure +133%
(1) TRC believes net service revenue (gross revenue less subcontractor costs and other direct reimbursable charges) best reflects the value of services provided to its customers and is the most meaningful indicator of its revenue performance.
(2) Excludes $1.2 million of acquisition and integration expenses during the second quarter of fiscal 2016.
Adjusted EBITDA2 grew 13% YOY to $10.7M
Adjusted Net income2 increased 18% YOY to $4.7M
Envi
ronm
enta
l Seg
men
t
4
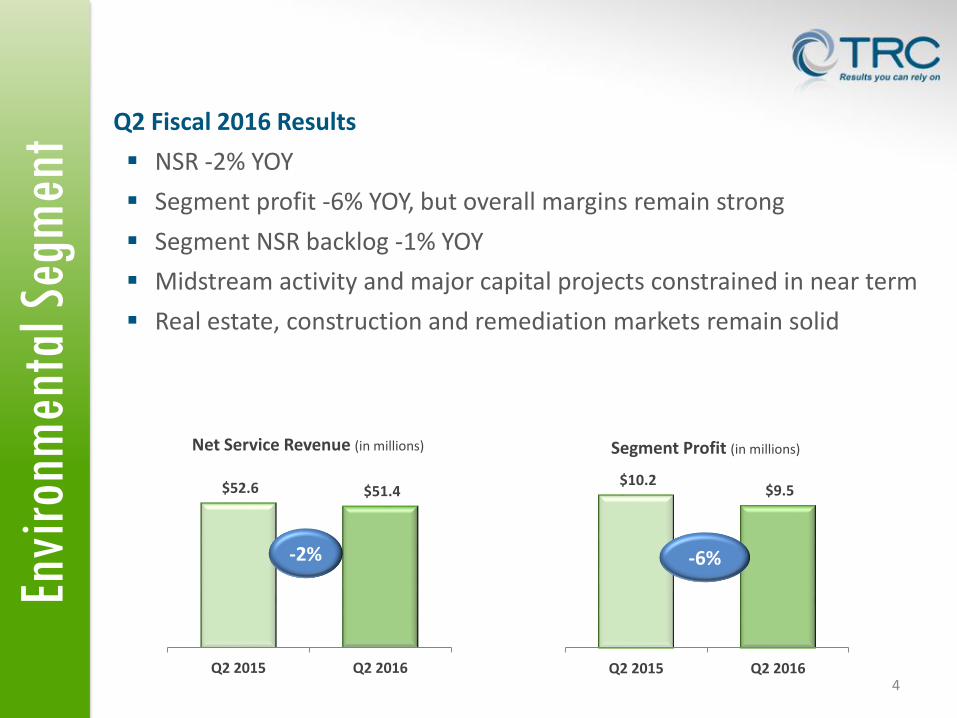
$52.6 $51.4
Q2 2015 Q2 2016
Net Service Revenue (in millions)
$10.2 $9.5
Q2 2015 Q2 2016
Segment Profit (in millions)
-2% -6%
Q2 Fiscal 2016 Results
NSR -2% YOY
Segment profit -6% YOY, but overall margins remain strong
Segment NSR backlog -1% YOY
Midstream activity and major capital projects constrained in near term
Real estate, construction and remediation markets remain solid
Ener
gy S
egm
ent
5
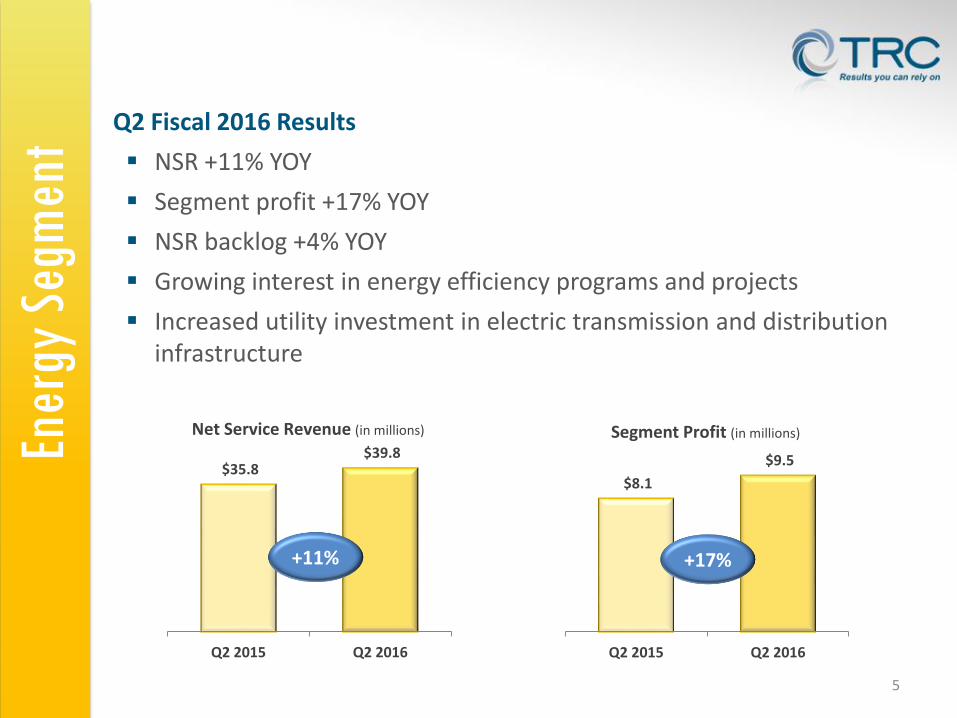
$35.8 $39.8
Q2 2015 Q2 2016
Net Service Revenue (in millions)
$8.1
$9.5
Q2 2015 Q2 2016
Segment Profit (in millions)
+17%+11%
Q2 Fiscal 2016 Results
NSR +11% YOY
Segment profit +17% YOY
NSR backlog +4% YOY
Growing interest in energy efficiency programs and projects
Increased utility investment in electric transmission and distribution infrastructure
Infr
astr
uctu
re S
egm
ent
6
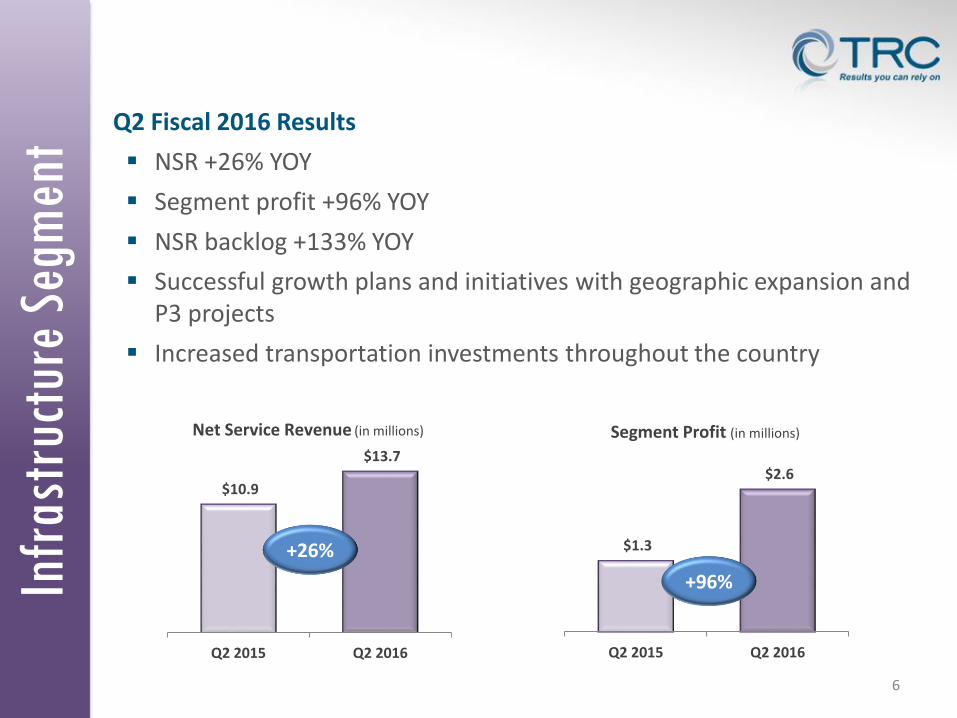
$10.9
$13.7
Q2 2015 Q2 2016
Net Service Revenue (in millions)
$1.3
$2.6
Q2 2015 Q2 2016
Segment Profit (in millions)
+26%
+96%
Q2 Fiscal 2016 Results
NSR +26% YOY
Segment profit +96% YOY
NSR backlog +133% YOY
Successful growth plans and initiatives with geographic expansion and P3 projects
Increased transportation investments throughout the country
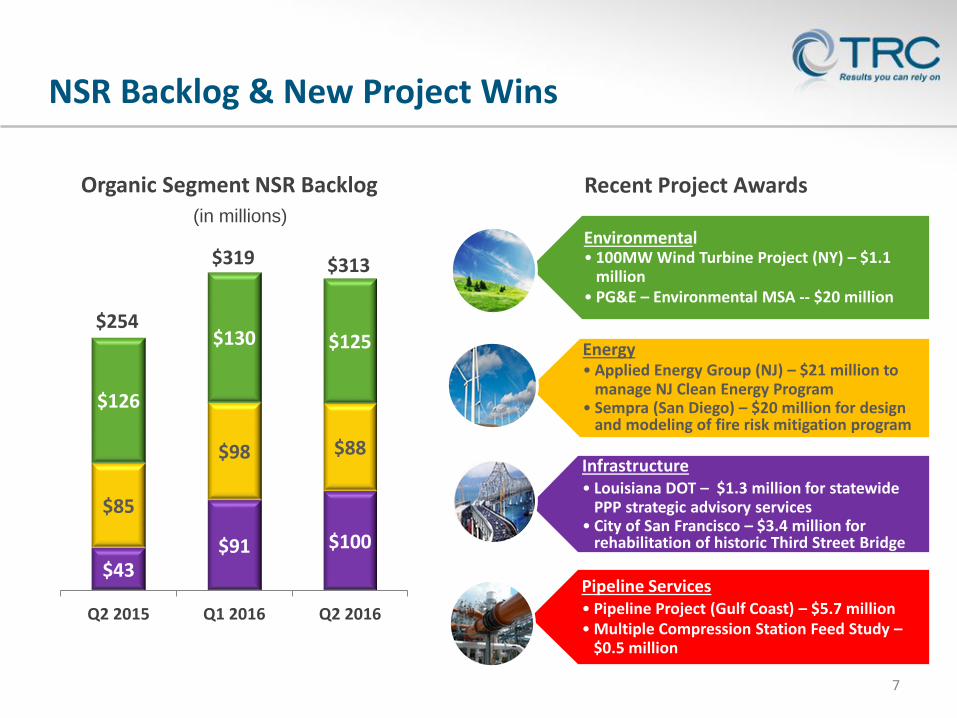
$43$91 $100
$85
$98 $88
$126
$130 $125
Q2 2015 Q1 2016 Q2 2016
Organic Segment NSR Backlog
$313
NSR Backlog & New Project Wins
7
(in millions)
$254
$319
Energy• Applied Energy Group (NJ) – $21 million to
manage NJ Clean Energy Program• Sempra (San Diego) – $20 million for design
and modeling of fire risk mitigation program
Environmental• 100MW Wind Turbine Project (NY) – $1.1
million• PG&E – Environmental MSA -- $20 million
Infrastructure• Louisiana DOT – $1.3 million for statewide
PPP strategic advisory services• City of San Francisco – $3.4 million for
rehabilitation of historic Third Street Bridge
Pipeline Services• Pipeline Project (Gulf Coast) – $5.7 million• Multiple Compression Station Feed Study –
$0.5 million
Recent Project Awards
8
Willbros Integration – Operations Update
All Pipeline Services active projects are able to bill time and report financials on TRC’s Deltek enterprise system
Pipeline Services migrated onto TRC’s IT networks and operating platforms
Pipeline Services employees integrated into payroll and benefits plan
Billing now conducted on TRC systems
Pipeline Services now incorporated into TRC’s weekly and monthly internal reporting, including company-wide management meetings
Identified and pursuing cost synergies
Management retention and incentive programs in place
Pipeline Services has been functionally integrated within two months of closing
9
Willbros Integration – Market Update
Oil and gas market constraining new capital projects
Midstream segment less impacted than Upstream / Downstream markets
Full TRC rebranding of Pipeline Services offices and marketing now complete
Launched integrated client strategy pursuits with TRC verticals and operations
Multiple opportunities with integrated services in pursuit and awarded
Identifying key market players in support of our organic profitable growth strategy
On track to be accretive to net income in FY 2017
10
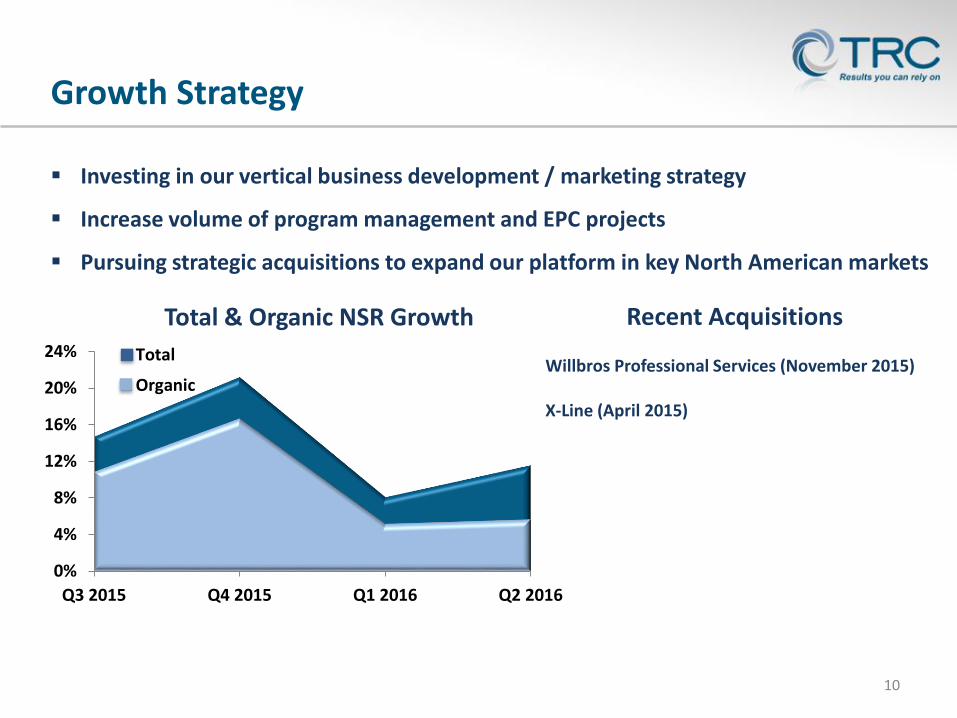
Growth Strategy
0%
4%
8%
12%
16%
20%
24%
Q3 2015 Q4 2015 Q1 2016 Q2 2016
Total
Organic
Total & Organic NSR Growth Recent Acquisitions
Willbros Professional Services (November 2015)
X-Line (April 2015)
Investing in our vertical business development / marketing strategy
Increase volume of program management and EPC projects
Pursuing strategic acquisitions to expand our platform in key North American markets
Key Initiatives
11
Invest in organic growth opportunities
Increase focus on strategic markets:
Oil & Gas – Changing market plus enhanced regulatory attention resulting in increased investment in existing assets
Utility/Power – Continued investment to modernize gas & electric systems, including energy efficiency programs; regulatory drivers for significant renewable generation investment
Transportation – $305 billion five-year surface transportation reauthorization package supports capital expansion and P3 projects
Pursue strategic acquisitions that provide geographic expansion and enhanced technical capabilities
Capture scale-based synergies and continue to emphasize cost efficiency
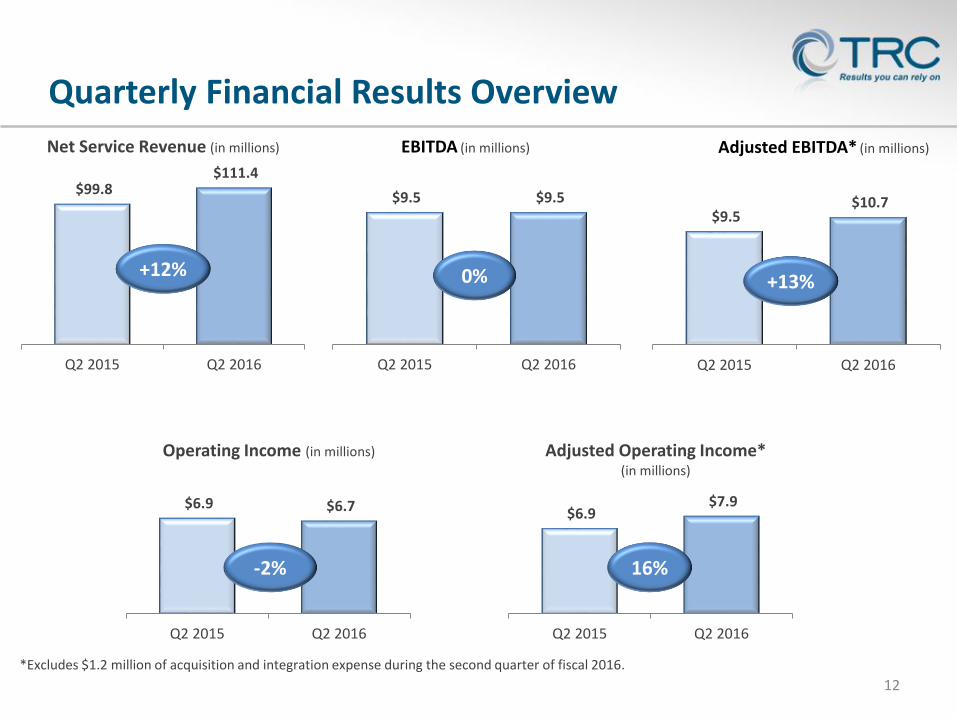
$9.5 $9.5
Q2 2015 Q2 2016
EBITDA (in millions)
Quarterly Financial Results Overview
12
$6.9 $6.7
Q2 2015 Q2 2016
Operating Income (in millions)
-2%
$99.8 $111.4
Q2 2015 Q2 2016
Net Service Revenue (in millions)
+12% 0%
$9.5 $10.7
Q2 2015 Q2 2016
Adjusted EBITDA* (in millions)
*Excludes $1.2 million of acquisition and integration expense during the second quarter of fiscal 2016.
+13%
$6.9 $7.9
Q2 2015 Q2 2016
Adjusted Operating Income* (in millions)
16%
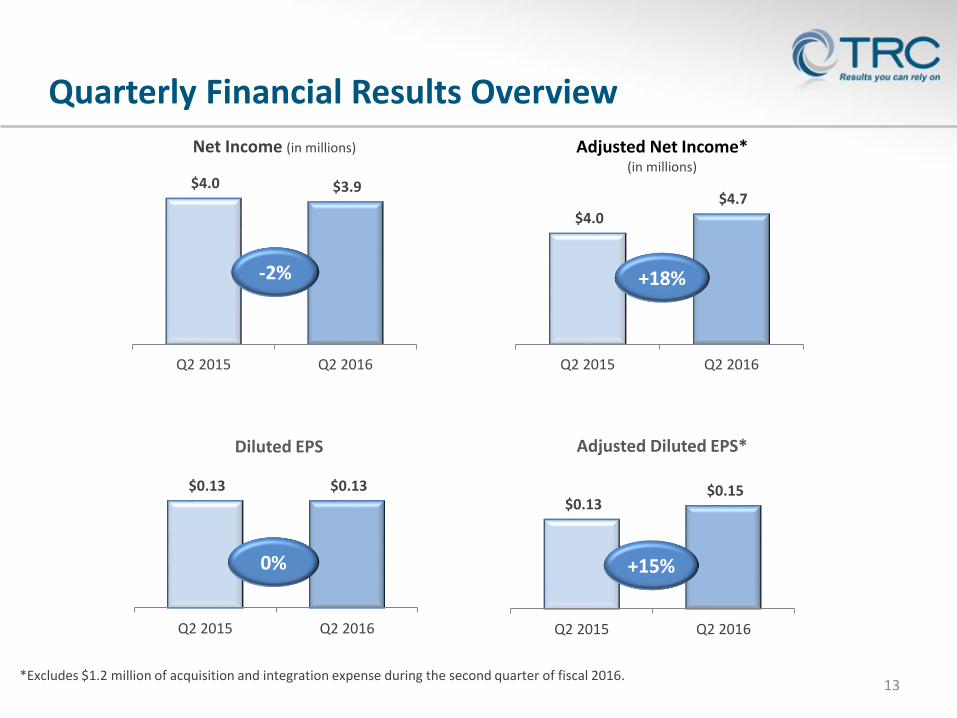
$4.0 $4.7
Q2 2015 Q2 2016
Adjusted Net Income* (in millions)
Quarterly Financial Results Overview
13
$0.13 $0.13
Q2 2015 Q2 2016
Diluted EPS
0%
$4.0 $3.9
Q2 2015 Q2 2016
Net Income (in millions)
-2% +18%
*Excludes $1.2 million of acquisition and integration expense during the second quarter of fiscal 2016.
$0.13 $0.15
Q2 2015 Q2 2016
Adjusted Diluted EPS*
+15%
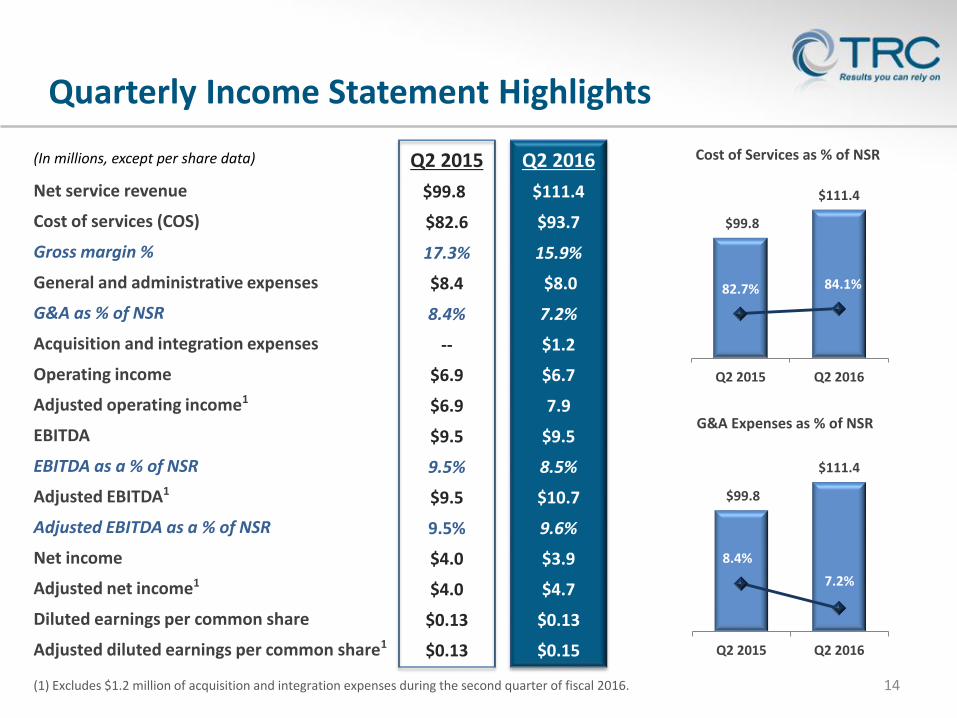
Q2 2015
$99.8
$82.6
17.3%
$8.4
8.4%
--
$6.9
$6.9
$9.5
9.5%
$9.5
9.5%
$4.0
$4.0
$0.13
$0.13
Q2 2016
$111.4
$93.7
15.9%
$8.0
7.2%
$1.2
$6.7
7.9
$9.5
8.5%
$10.7
9.6%
$3.9
$4.7
$0.13
$0.15
14
(In millions, except per share data)
Quarterly Income Statement Highlights
$99.8
$111.4
82.7% 84.1%
Q2 2015 Q2 2016
Cost of Services as % of NSR
$99.8
$111.4
8.4%
7.2%
Q2 2015 Q2 2016
G&A Expenses as % of NSR
Net service revenue
Cost of services (COS)
Gross margin %
General and administrative expenses
G&A as % of NSR
Acquisition and integration expenses
Operating income
Adjusted operating income1
EBITDA
EBITDA as a % of NSR
Adjusted EBITDA1
Adjusted EBITDA as a % of NSR
Net income
Adjusted net income1
Diluted earnings per common share
Adjusted diluted earnings per common share1
(1) Excludes $1.2 million of acquisition and integration expenses during the second quarter of fiscal 2016.
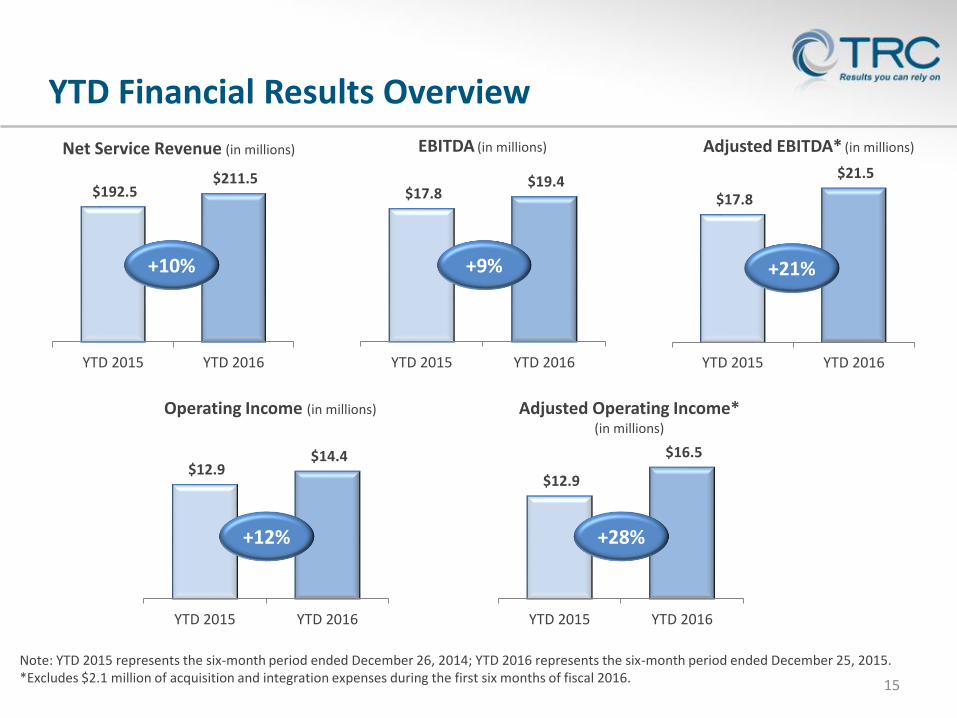
$192.5 $211.5
YTD 2015 YTD 2016
Net Service Revenue (in millions)
YTD Financial Results Overview
15
$17.8 $19.4
YTD 2015 YTD 2016
EBITDA (in millions)
$12.9 $14.4
YTD 2015 YTD 2016
Operating Income (in millions)
+10%
+12%
+9%
Note: YTD 2015 represents the six-month period ended December 26, 2014; YTD 2016 represents the six-month period ended December 25, 2015.*Excludes $2.1 million of acquisition and integration expenses during the first six months of fiscal 2016.
$17.8
$21.5
YTD 2015 YTD 2016
Adjusted EBITDA* (in millions)
+21%
$12.9
$16.5
YTD 2015 YTD 2016
Adjusted Operating Income* (in millions)
+28%
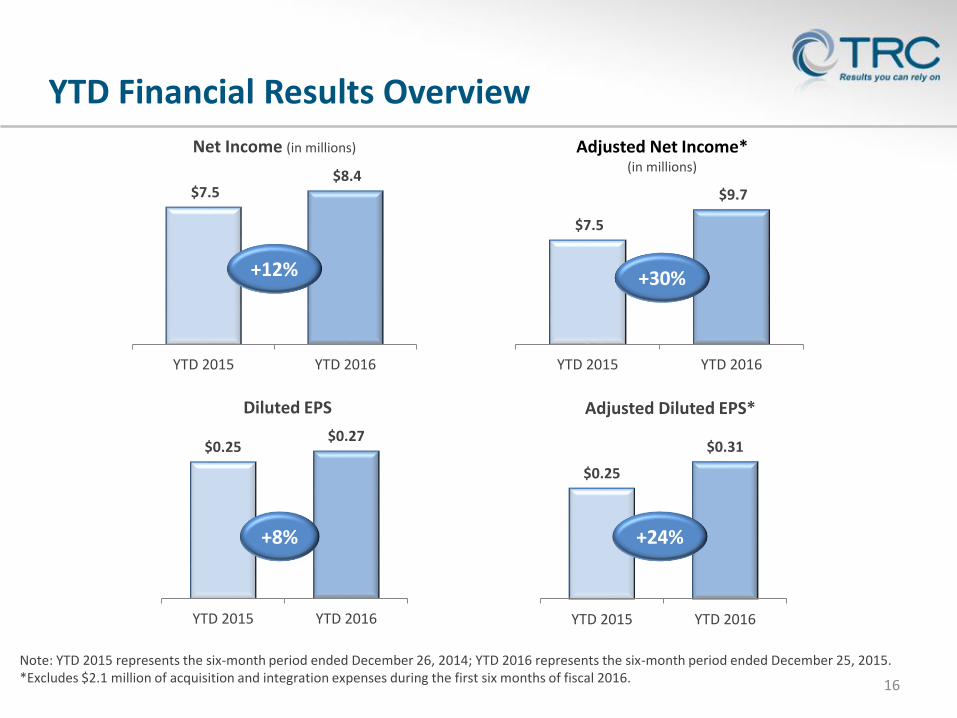
$0.25 $0.27
YTD 2015 YTD 2016
Diluted EPS
YTD Financial Results Overview
16
+8%
$0.25
$0.31
YTD 2015 YTD 2016
Adjusted Diluted EPS*
+24%
Note: YTD 2015 represents the six-month period ended December 26, 2014; YTD 2016 represents the six-month period ended December 25, 2015.*Excludes $2.1 million of acquisition and integration expenses during the first six months of fiscal 2016.
$7.5
$9.7
YTD 2015 YTD 2016
Adjusted Net Income* (in millions)
$7.5 $8.4
YTD 2015 YTD 2016
Net Income (in millions)
+12% +30%
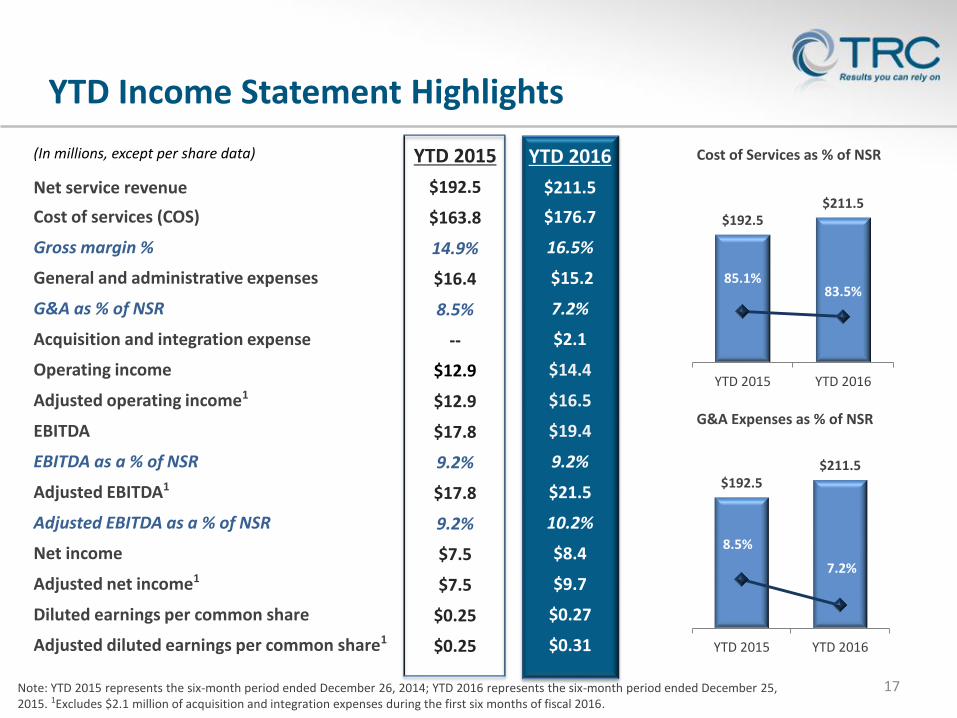
YTD 2015
$192.5
$163.8
14.9%
$16.4
8.5%
--
$12.9
$12.9
$17.8
9.2%
$17.8
9.2%
$7.5
$7.5
$0.25
$0.25
YTD 2015
$192.5
$5.5
$163.8
14.9%
$16.4
$12.9
$17.8
9.2%
$7.5
$0.25
17
(In millions, except per share data)
YTD Income Statement Highlights
$192.5 $211.5
85.1%83.5%
YTD 2015 YTD 2016
Cost of Services as % of NSR
$192.5 $211.5
8.5%
7.2%
YTD 2015 YTD 2016
G&A Expenses as % of NSR
Note: YTD 2015 represents the six-month period ended December 26, 2014; YTD 2016 represents the six-month period ended December 25, 2015. 1Excludes $2.1 million of acquisition and integration expenses during the first six months of fiscal 2016.
Net service revenue
Cost of services (COS)
Gross margin %
General and administrative expenses
G&A as % of NSR
Acquisition and integration expense
Operating income
Adjusted operating income1
EBITDA
EBITDA as a % of NSR
Adjusted EBITDA1
Adjusted EBITDA as a % of NSR
Net income
Adjusted net income1
Diluted earnings per common share
Adjusted diluted earnings per common share1
YTD 2016
$211.5
$176.7
16.5%
$15.2
7.2%
$2.1
$14.4
$16.5
$19.4
9.2%
$21.5
10.2%
$8.4
$9.7
$0.27
$0.31
18
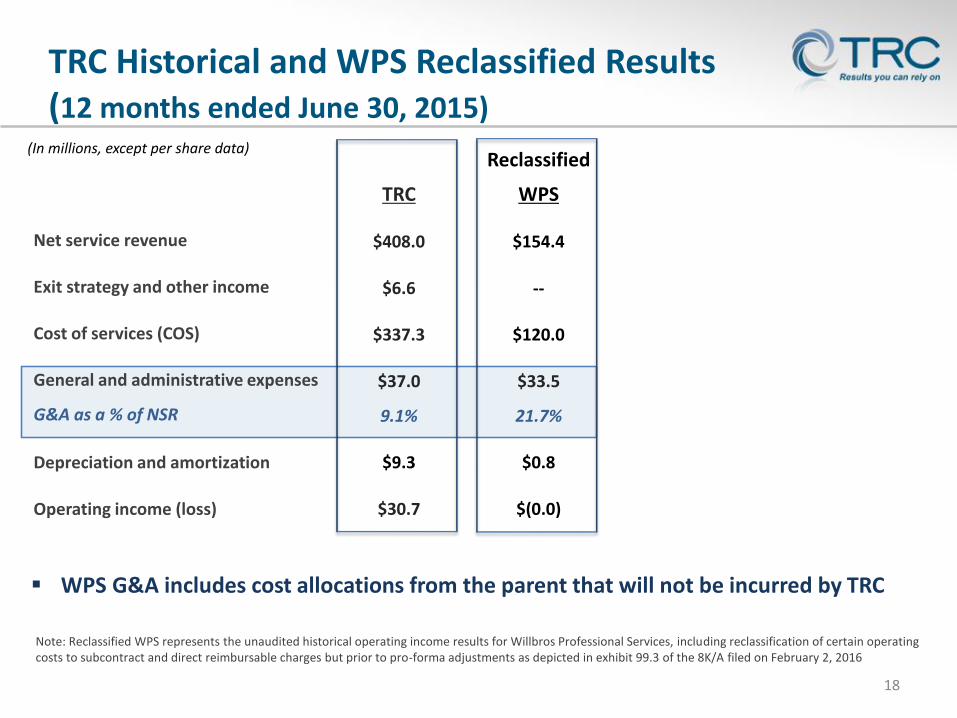
TRC Historical and WPS Reclassified Results(12 months ended June 30, 2015)
Reclassified
WPS
$154.4
--
$120.0
$33.5
21.7%
$0.8
$(0.0)
TRC
$408.0
$6.6
$337.3
$37.0
9.1%
$9.3
$30.7
(In millions, except per share data)
Net service revenue
Exit strategy and other income
Cost of services (COS)
General and administrative expenses
G&A as a % of NSR
Depreciation and amortization
Operating income (loss)
Note: Reclassified WPS represents the unaudited historical operating income results for Willbros Professional Services, including reclassification of certain operating costs to subcontract and direct reimbursable charges but prior to pro-forma adjustments as depicted in exhibit 99.3 of the 8K/A filed on February 2, 2016
WPS G&A includes cost allocations from the parent that will not be incurred by TRC
19
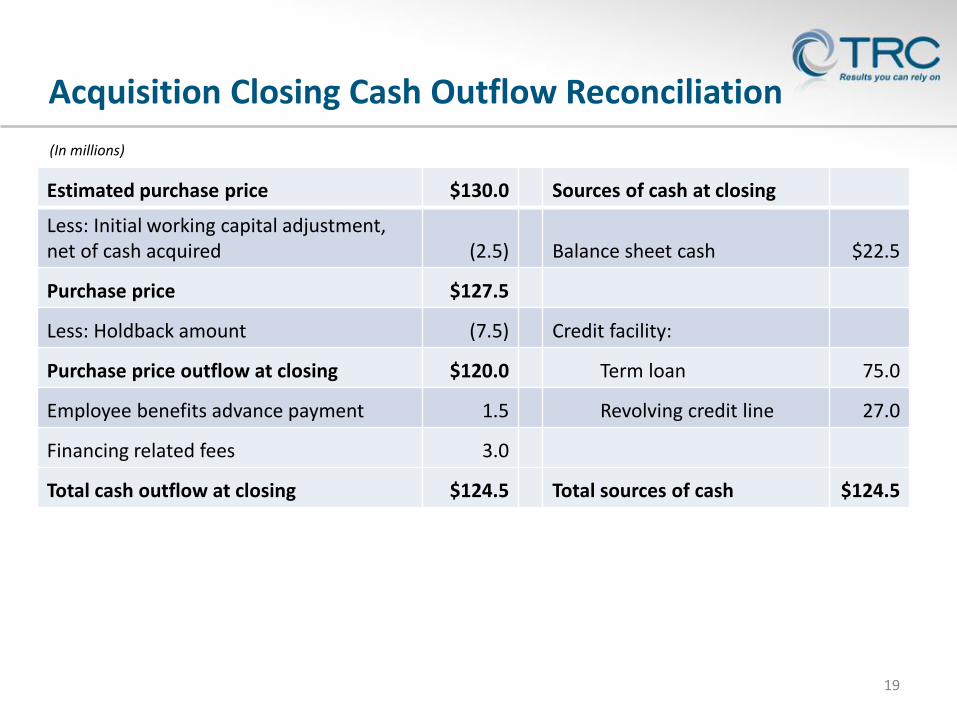
(In millions)
Acquisition Closing Cash Outflow Reconciliation
Estimated purchase price $130.0 Sources of cash at closing
Less: Initial working capital adjustment, net of cash acquired (2.5) Balance sheet cash $22.5
Purchase price $127.5
Less: Holdback amount (7.5) Credit facility:
Purchase price outflow at closing $120.0 Term loan 75.0
Employee benefits advance payment 1.5 Revolving credit line 27.0
Financing related fees 3.0
Total cash outflow at closing $124.5 Total sources of cash $124.5
20
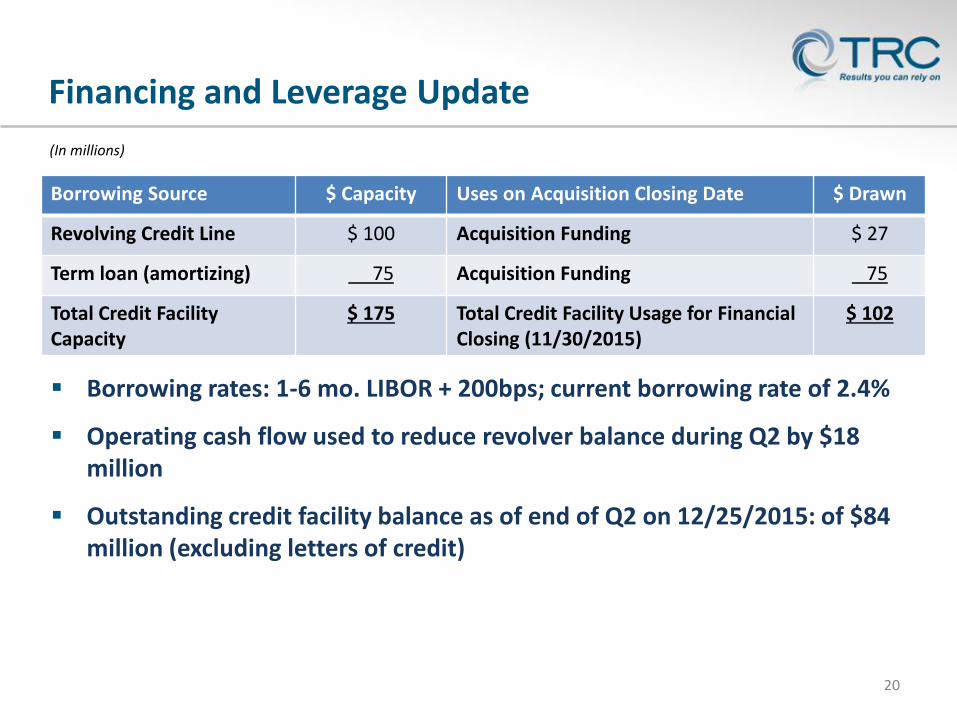
(In millions)
Financing and Leverage Update
Borrowing Source $ Capacity Uses on Acquisition Closing Date $ Drawn
Revolving Credit Line $ 100 Acquisition Funding $ 27
Term loan (amortizing) 75 Acquisition Funding 75
Total Credit Facility Capacity
$ 175 Total Credit Facility Usage for Financial Closing (11/30/2015)
$ 102
Borrowing rates: 1-6 mo. LIBOR + 200bps; current borrowing rate of 2.4%
Operating cash flow used to reduce revolver balance during Q2 by $18 million
Outstanding credit facility balance as of end of Q2 on 12/25/2015: of $84 million (excluding letters of credit)
21
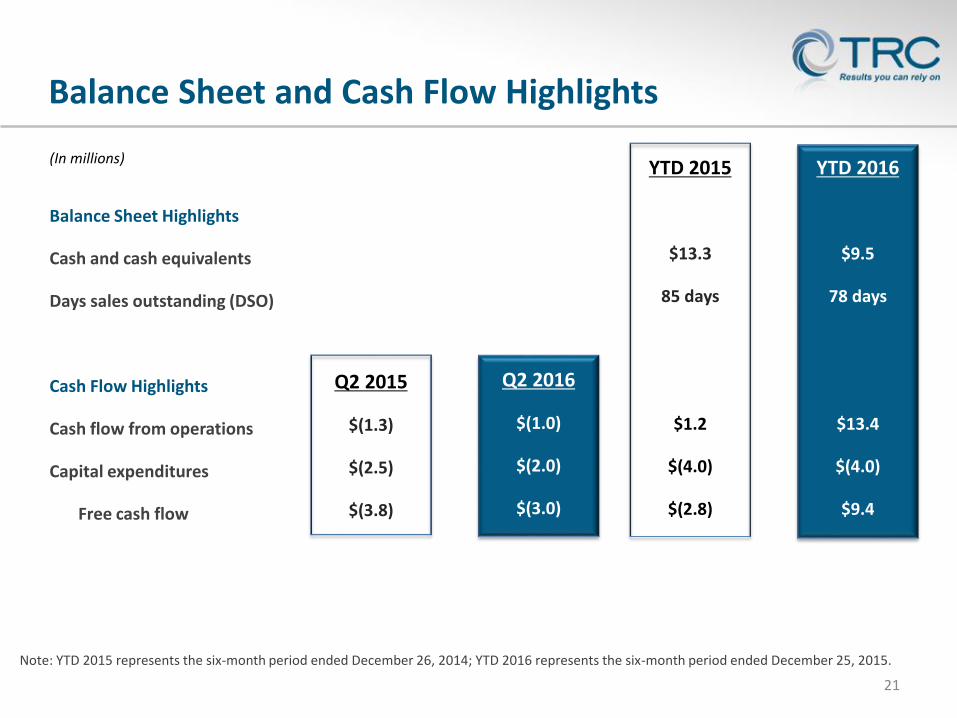
Balance Sheet Highlights
Cash and cash equivalents
Days sales outstanding (DSO)
Cash Flow Highlights
Cash flow from operations
Capital expenditures
Free cash flow
Q2 2015
$(1.3)
$(2.5)
$(3.8)
Q2 2016
$(1.0)
$(2.0)
$(3.0)
(In millions)
Balance Sheet and Cash Flow Highlights
YTD 2015
$13.3
85 days
$1.2
$(4.0)
$(2.8)
YTD 2016
$9.5
78 days
$13.4
$(4.0)
$9.4
Note: YTD 2015 represents the six-month period ended December 26, 2014; YTD 2016 represents the six-month period ended December 25, 2015.
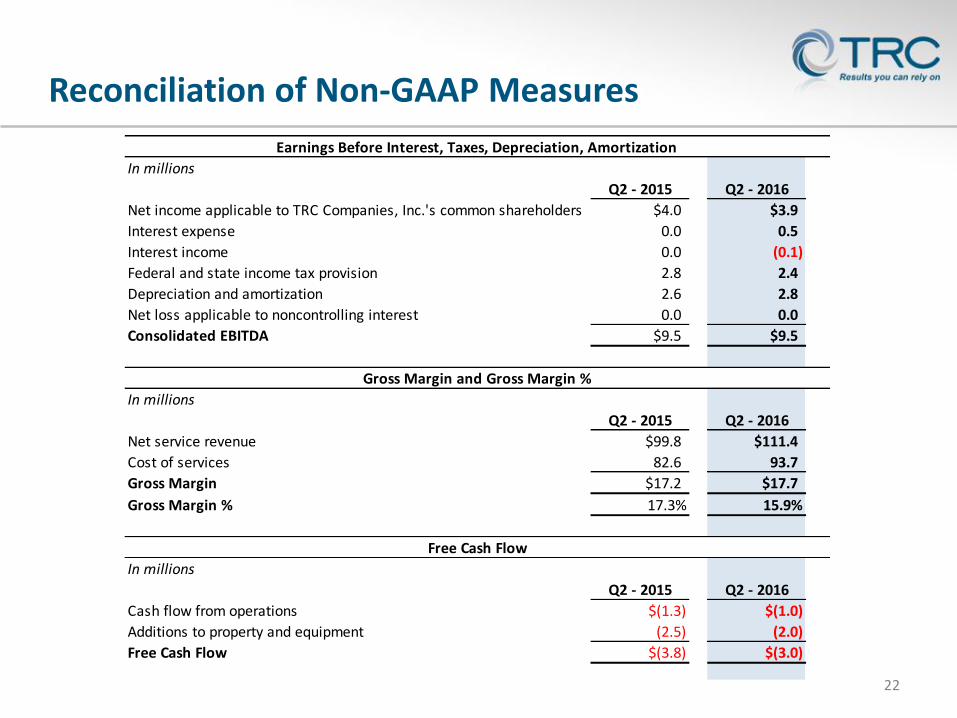
Reconciliation of Non-GAAP Measures
22
In millions
Q2 - 2015 Q2 - 2016
Net income applicable to TRC Companies, Inc.'s common shareholders $4.0 $3.9
Interest expense 0.0 0.5
Interest income 0.0 (0.1)
Federal and state income tax provision 2.8 2.4
Depreciation and amortization 2.6 2.8
Net loss applicable to noncontrolling interest 0.0 0.0
Consolidated EBITDA $9.5 $9.5
In millions
Q2 - 2015 Q2 - 2016
Net service revenue $99.8 $111.4
Cost of services 82.6 93.7
Gross Margin $17.2 $17.7
Gross Margin % 17.3% 15.9%
In millions
Q2 - 2015 Q2 - 2016
Cash flow from operations $(1.3) $(1.0)
Additions to property and equipment (2.5) (2.0)
Free Cash Flow $(3.8) $(3.0)
Earnings Before Interest, Taxes, Depreciation, Amortization
Gross Margin and Gross Margin %
Free Cash Flow
Reconciliation of Non-GAAP Measures
23
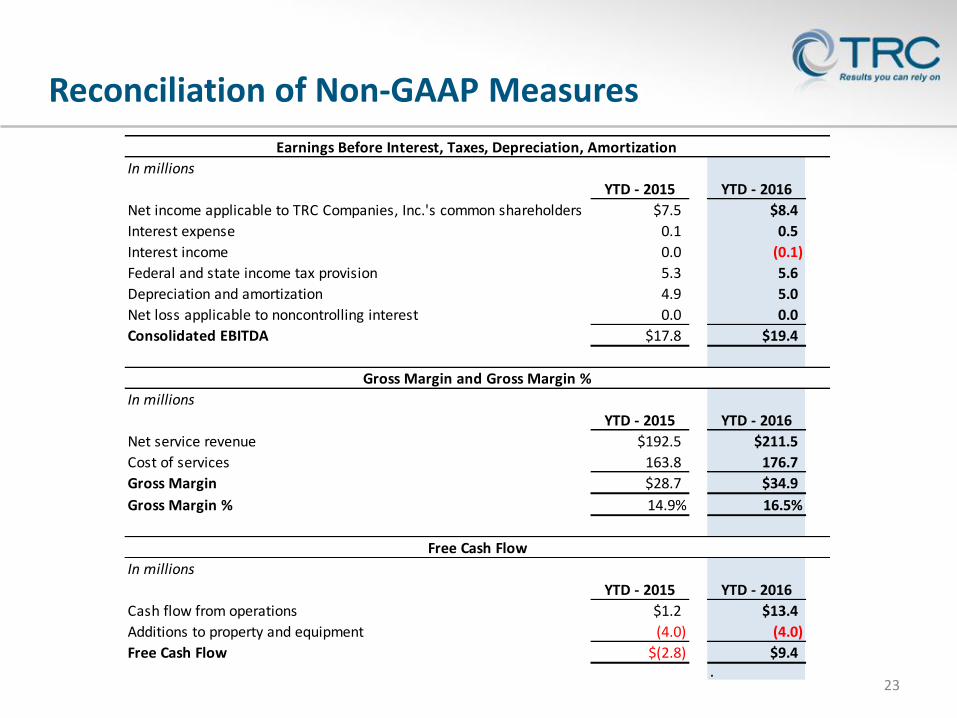
In millions
YTD - 2015 YTD - 2016
Net income applicable to TRC Companies, Inc.'s common shareholders $7.5 $8.4
Interest expense 0.1 0.5
Interest income 0.0 (0.1)
Federal and state income tax provision 5.3 5.6
Depreciation and amortization 4.9 5.0
Net loss applicable to noncontrolling interest 0.0 0.0
Consolidated EBITDA $17.8 $19.4
In millions
YTD - 2015 YTD - 2016
Net service revenue $192.5 $211.5
Cost of services 163.8 176.7
Gross Margin $28.7 $34.9
Gross Margin % 14.9% 16.5%
In millions
YTD - 2015 YTD - 2016
Cash flow from operations $1.2 $13.4
Additions to property and equipment (4.0) (4.0)
Free Cash Flow $(2.8) $9.4.
Earnings Before Interest, Taxes, Depreciation, Amortization
Gross Margin and Gross Margin %
Free Cash Flow
Reconciliation of Non-GAAP Measures
24
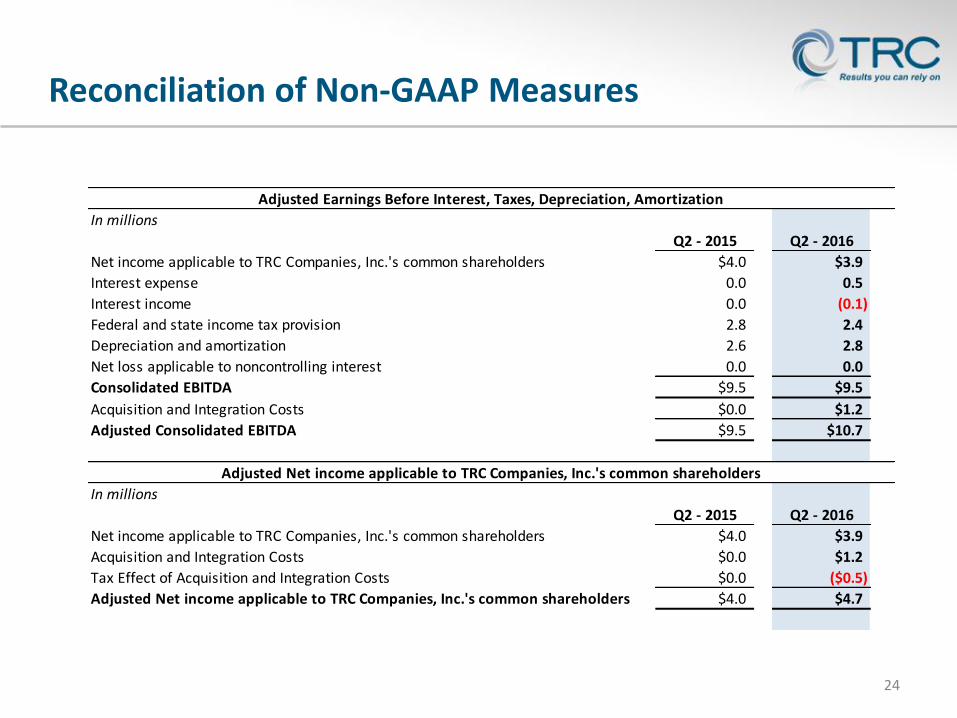
In millions
Q2 - 2015 Q2 - 2016
Net income applicable to TRC Companies, Inc.'s common shareholders $4.0 $3.9
Interest expense 0.0 0.5
Interest income 0.0 (0.1)
Federal and state income tax provision 2.8 2.4
Depreciation and amortization 2.6 2.8
Net loss applicable to noncontrolling interest 0.0 0.0
Consolidated EBITDA $9.5 $9.5
Acquisition and Integration Costs $0.0 $1.2
Adjusted Consolidated EBITDA $9.5 $10.7
In millions
Q2 - 2015 Q2 - 2016
Net income applicable to TRC Companies, Inc.'s common shareholders $4.0 $3.9
Acquisition and Integration Costs $0.0 $1.2
Tax Effect of Acquisition and Integration Costs $0.0 ($0.5)
Adjusted Net income applicable to TRC Companies, Inc.'s common shareholders $4.0 $4.7
Adjusted Earnings Before Interest, Taxes, Depreciation, Amortization
Adjusted Net income applicable to TRC Companies, Inc.'s common shareholders

Reconciliation of Non-GAAP Measures
25
In millions
YTD - 2015 YTD - 2016
Net income applicable to TRC Companies, Inc.'s common shareholders $7.5 $8.4
Interest expense 0.1 0.5
Interest income 0.0 (0.1)
Federal and state income tax provision 5.3 5.6
Depreciation and amortization 4.9 5.0
Net loss applicable to noncontrolling interest 0.0 0.0
Consolidated EBITDA $17.8 $19.4
Acquisition and Integration Costs $0.0 $2.1
Adjusted Consolidated EBITDA $17.8 $21.5
In millions
YTD - 2015 YTD - 2016
Net income applicable to TRC Companies, Inc.'s common shareholders $7.5 $8.4
Acquisition and Integration Costs $0.0 $2.1
Tax Effect of Acquisition and Integration Costs $0.0 ($0.8)
Adjusted Net income applicable to TRC Companies, Inc.'s common shareholders $7.5 $9.7
Adjusted Earnings Before Interest, Taxes, Depreciation, Amortization
Adjusted Net income applicable to TRC Companies, Inc.'s common shareholders
Reconciliation of Non-GAAP Measures
26
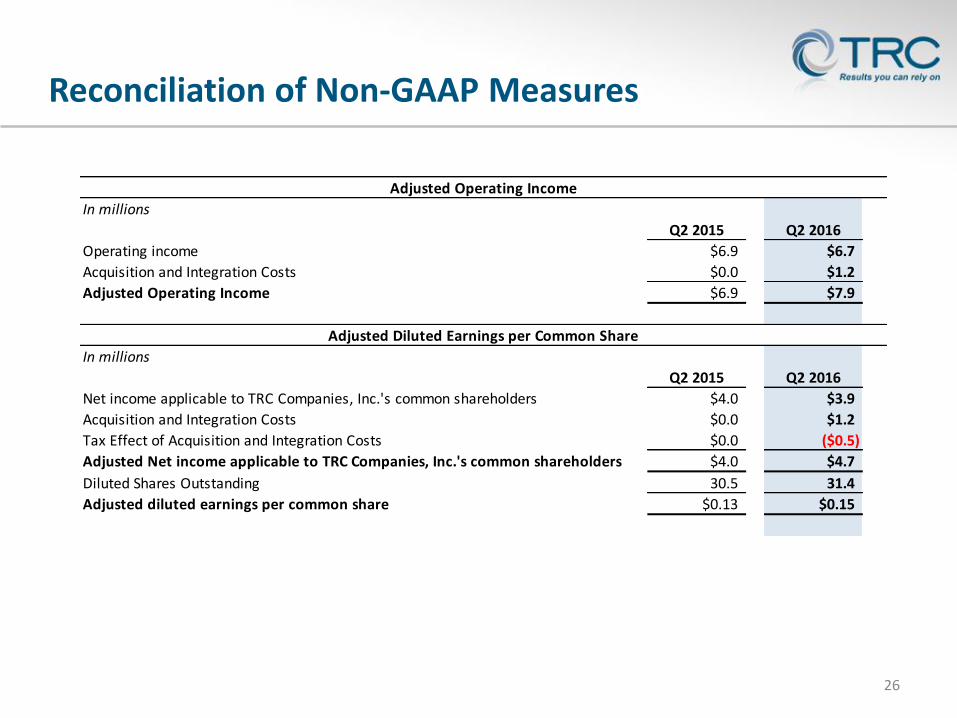
In millions
Q2 2015 Q2 2016
Operating income $6.9 $6.7
Acquisition and Integration Costs $0.0 $1.2
Adjusted Operating Income $6.9 $7.9
In millions
Q2 2015 Q2 2016
Net income applicable to TRC Companies, Inc.'s common shareholders $4.0 $3.9
Acquisition and Integration Costs $0.0 $1.2
Tax Effect of Acquisition and Integration Costs $0.0 ($0.5)
Adjusted Net income applicable to TRC Companies, Inc.'s common shareholders $4.0 $4.7
Diluted Shares Outstanding 30.5 31.4
Adjusted diluted earnings per common share $0.13 $0.15
Adjusted Diluted Earnings per Common Share
Adjusted Operating Income
Reconciliation of Non-GAAP Measures
27
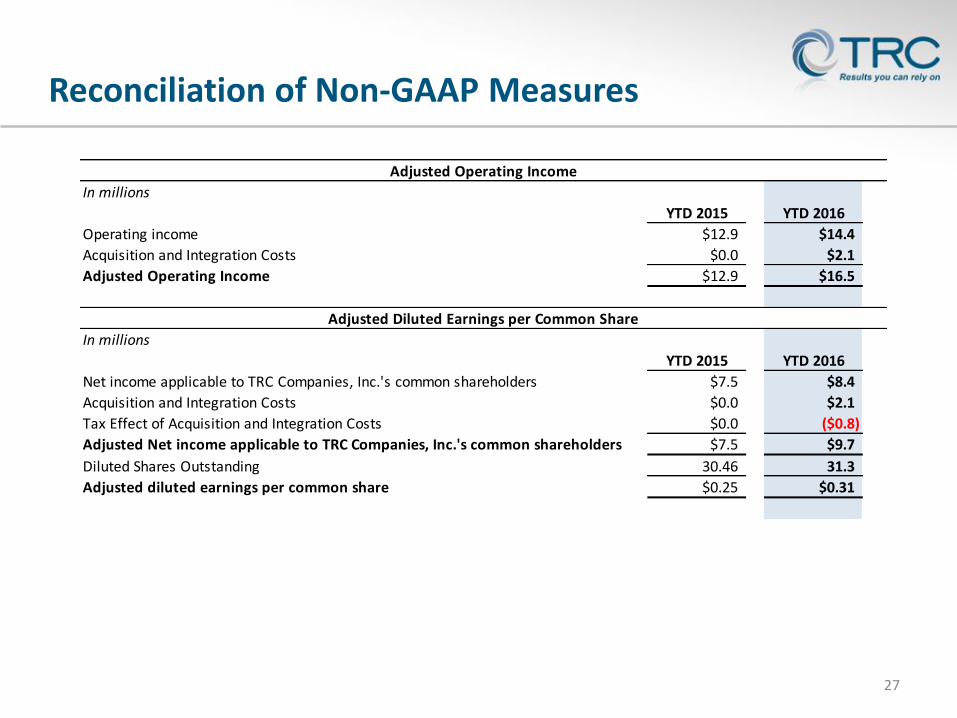
In millions
YTD 2015 YTD 2016
Operating income $12.9 $14.4
Acquisition and Integration Costs $0.0 $2.1
Adjusted Operating Income $12.9 $16.5
In millions
YTD 2015 YTD 2016
Net income applicable to TRC Companies, Inc.'s common shareholders $7.5 $8.4
Acquisition and Integration Costs $0.0 $2.1
Tax Effect of Acquisition and Integration Costs $0.0 ($0.8)
Adjusted Net income applicable to TRC Companies, Inc.'s common shareholders $7.5 $9.7
Diluted Shares Outstanding 30.46 31.3
Adjusted diluted earnings per common share $0.25 $0.31
Adjusted Diluted Earnings per Common Share
Adjusted Operating Income
Definitions for Non-GAAP Measures
28
Earnings Before Interest, Taxes, Depreciation, Amortization (EBITDA)The Company presents EBITDA because it believes that it is a useful tool for the Company, its lenders and its investors to measure the Company’s ability to meet debt service, capital expenditure and working capital requirements. As used in the presentation, EBITDA is operating income plus depreciation and amortization.
Adjusted Earnings Before Interest, Taxes, Depreciation, Amortization (Adjusted EBITDA)The Company presents Adjusted EBITDA because it believes that it is a useful tool for the Company, its lenders and its investors to measure the Company’s ability to meet debt service, capital expenditure and working capital requirements to measure the Company’s underlying performance. As used in the presentation, Adjusted EBITDA is defined as operating income plus depreciation and amortization plus acquisition and integration expenses.
Gross Margin and Gross Margin %The Company presents Gross Margin and Gross Margin % to allow investors to better evaluate short-term and long-term profitability trends. The definition of Gross Margin is equal to Net Service Revenue less Cost of Services. Gross Margin % is equal to Gross Margin Divided by Net Service Revenue.
Free Cash FlowThe Company presents free cash flow, and ratios based on it, to conduct and evaluate its business because, although it is similar to cash flow from operations, the Company believes it is a useful measure of cash flows since purchases of fixed assets are a necessary component of ongoing operations. The definition of Free Cash Flow is equal to net cash provided by (used in) operating activities plus additions to property and equipment.
Definitions for Non-GAAP Measures
29
Adjusted Operating IncomeThe Company presents Adjusted Operating Income because it believes that it is a useful tool for the Company, its lenders and its investors to measure the Company’s underlying operating performance. As used in the presentation, Adjusted Operating Income is defined as operating income plus acquisition and integration expenses.
Adjusted Net IncomeThe Company presents Adjusted Net Income because it believes that it is a useful tool for the Company, its lenders and its investors to measure the Company’s financial performance. As used in the presentation, Adjusted Net Income is defined as net income applicable to TRC Companies, Inc. plus the tax effected acquisition and integration expenses. The Company utilizes its effective tax rate for the period in calculating the tax effect.
Adjusted Diluted Earnings Per Share (Adjusted Diluted EPS)The Company presents Adjusted Diluted EPS because it believes that it is a useful tool for the Company, its lenders and its investors to measure the Company’s financial performance. As used in the presentation, Adjusted Diluted EPS is defined as Adjusted Net Income divided by diluted weighted average shares outstanding.
Recommended