Appendix 3.10-1
Transportation Supporting Data

332 Pine Street | 4th Floor | San Francisco, CA 94104 | (415) 348-0300 | Fax (415) 773-1790 www.fehrandpeers.com
Transportation Chapter Appendix The purpose of this appendix is to clarify analysis approach, assumptions, and results prepared for the Bayhill Specific Plan (Project) Environmental Impact Report. This appendix includes three sections:
• Trip Generation • Vehicle Miles Traveled (VMT) • Travel Demand Management (TDM)
It is followed by four corresponding attachments: • Attachment A: VMT by Speedbin and Scenario • Attachment B: TDM Calculation Worksheets • Attachment C: Queue Summary • Attachment D: LOS Summary
Trip Generation Trip generation refers to the process of estimating the amount of vehicular traffic a project would add to the surrounding roadway system. Estimates are created for the peak one-hour periods during the morning and evening commute periods when traffic volumes on the adjacent streets are the highest. For all alternatives, trip generation was estimated using a combination of rates from the Institute of Transportation Engineers (ITE) Trip Generation Manual (10th Edition) as well as Fehr & Peers’ MainStreet Trip Generation tool.
The MainStreet trip generation tool, which is based on MXD methodology, developed for and approved by the US Environmental Protection Agency (EPA) for use in evaluating trip generation at mixed-use projects. The primary difference between the ITE and MXD methodologies is that the traditional ITE methodology relies on one factor—the project’s land use type—to predict vehicle trip generation, while MXD incorporates local data and travel behaviors, as well as leading research in how density, mix of land uses, and other built environment factors affect vehicle trip generation.
Bayhill Specific Plan Environmental Impact Report Transportation Chapter Appendix Page 2 of 11
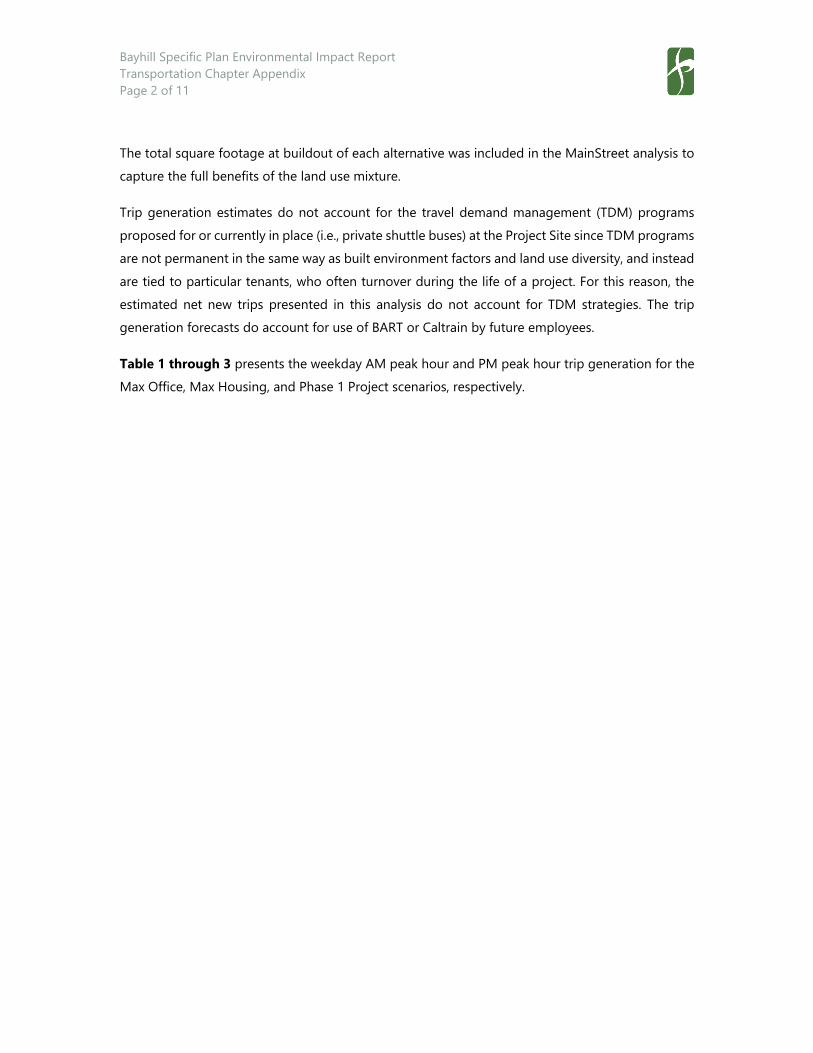
The total square footage at buildout of each alternative was included in the MainStreet analysis to capture the full benefits of the land use mixture.
Trip generation estimates do not account for the travel demand management (TDM) programs proposed for or currently in place (i.e., private shuttle buses) at the Project Site since TDM programs are not permanent in the same way as built environment factors and land use diversity, and instead are tied to particular tenants, who often turnover during the life of a project. For this reason, the estimated net new trips presented in this analysis do not account for TDM strategies. The trip generation forecasts do account for use of BART or Caltrain by future employees.
Table 1 through 3 presents the weekday AM peak hour and PM peak hour trip generation for the Max Office, Max Housing, and Phase 1 Project scenarios, respectively.
Bayhill Specific Plan Environmental Impact Report Transportation Chapter Appendix Page 3 of 11
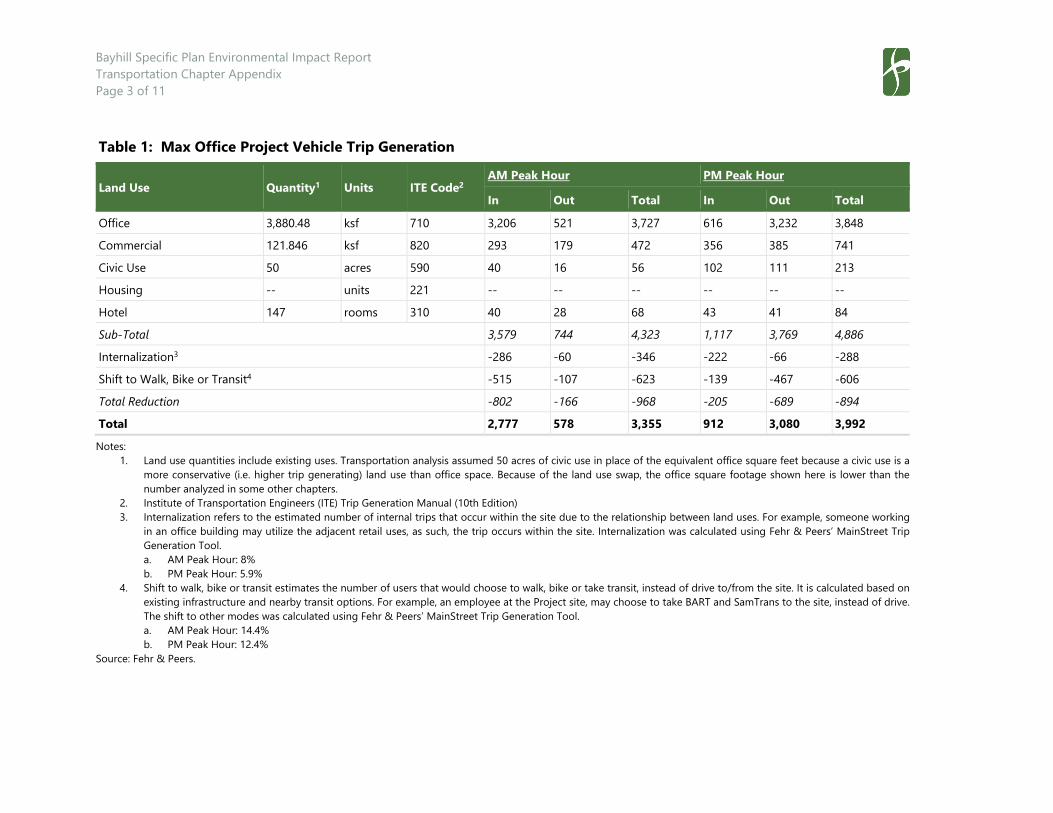
Table 1: Max Office Project Vehicle Trip Generation
Land Use Quantity1 Units ITE Code2 AM Peak Hour PM Peak Hour In Out Total In Out Total
Office 3,880.48 ksf 710 3,206 521 3,727 616 3,232 3,848 Commercial 121.846 ksf 820 293 179 472 356 385 741 Civic Use 50 acres 590 40 16 56 102 111 213 Housing -- units 221 -- -- -- -- -- -- Hotel 147 rooms 310 40 28 68 43 41 84 Sub-Total 3,579 744 4,323 1,117 3,769 4,886 Internalization3 -286 -60 -346 -222 -66 -288 Shift to Walk, Bike or Transit4 -515 -107 -623 -139 -467 -606 Total Reduction -802 -166 -968 -205 -689 -894 Total 2,777 578 3,355 912 3,080 3,992 Notes:
1. Land use quantities include existing uses. Transportation analysis assumed 50 acres of civic use in place of the equivalent office square feet because a civic use is a more conservative (i.e. higher trip generating) land use than office space. Because of the land use swap, the office square footage shown here is lower than the number analyzed in some other chapters.
2. Institute of Transportation Engineers (ITE) Trip Generation Manual (10th Edition) 3. Internalization refers to the estimated number of internal trips that occur within the site due to the relationship between land uses. For example, someone working
in an office building may utilize the adjacent retail uses, as such, the trip occurs within the site. Internalization was calculated using Fehr & Peers’ MainStreet Trip Generation Tool. a. AM Peak Hour: 8% b. PM Peak Hour: 5.9%
4. Shift to walk, bike or transit estimates the number of users that would choose to walk, bike or take transit, instead of drive to/from the site. It is calculated based on existing infrastructure and nearby transit options. For example, an employee at the Project site, may choose to take BART and SamTrans to the site, instead of drive. The shift to other modes was calculated using Fehr & Peers’ MainStreet Trip Generation Tool. a. AM Peak Hour: 14.4% b. PM Peak Hour: 12.4%
Source: Fehr & Peers.
Bayhill Specific Plan Environmental Impact Report Transportation Chapter Appendix Page 4 of 11
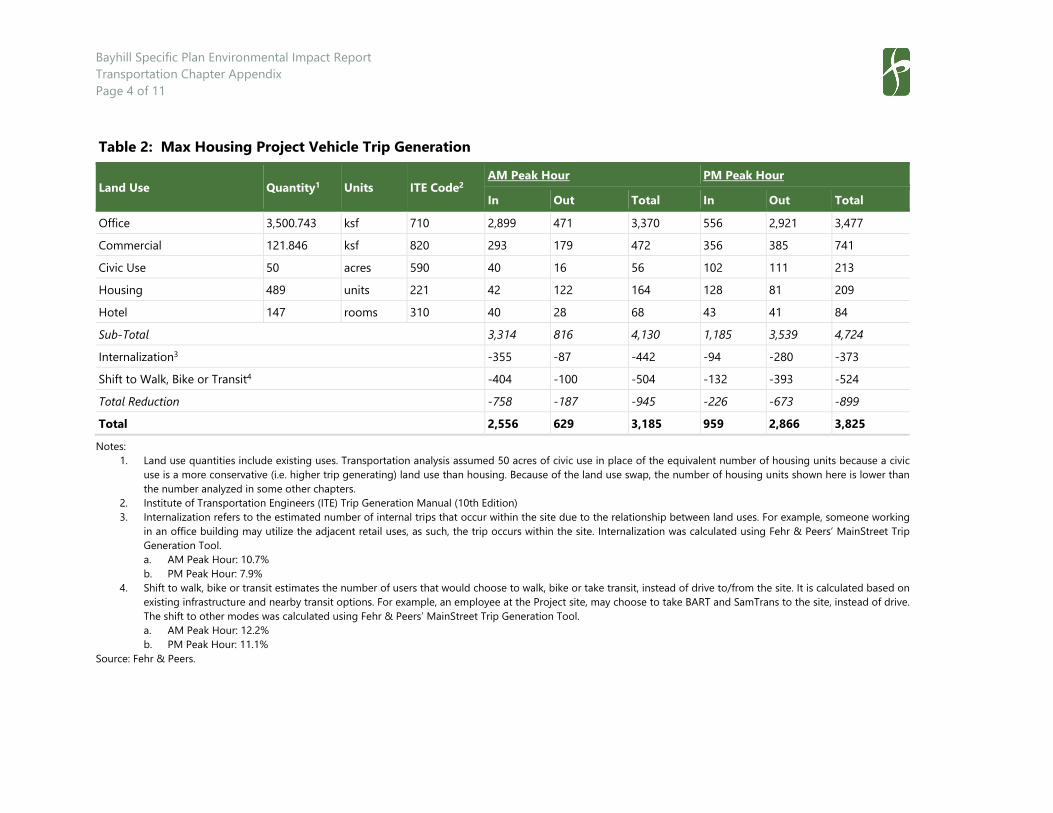
Table 2: Max Housing Project Vehicle Trip Generation
Land Use Quantity1 Units ITE Code2 AM Peak Hour PM Peak Hour In Out Total In Out Total
Office 3,500.743 ksf 710 2,899 471 3,370 556 2,921 3,477 Commercial 121.846 ksf 820 293 179 472 356 385 741 Civic Use 50 acres 590 40 16 56 102 111 213 Housing 489 units 221 42 122 164 128 81 209 Hotel 147 rooms 310 40 28 68 43 41 84 Sub-Total 3,314 816 4,130 1,185 3,539 4,724 Internalization3 -355 -87 -442 -94 -280 -373 Shift to Walk, Bike or Transit4 -404 -100 -504 -132 -393 -524 Total Reduction -758 -187 -945 -226 -673 -899 Total 2,556 629 3,185 959 2,866 3,825 Notes:
1. Land use quantities include existing uses. Transportation analysis assumed 50 acres of civic use in place of the equivalent number of housing units because a civic use is a more conservative (i.e. higher trip generating) land use than housing. Because of the land use swap, the number of housing units shown here is lower than the number analyzed in some other chapters.
2. Institute of Transportation Engineers (ITE) Trip Generation Manual (10th Edition) 3. Internalization refers to the estimated number of internal trips that occur within the site due to the relationship between land uses. For example, someone working
in an office building may utilize the adjacent retail uses, as such, the trip occurs within the site. Internalization was calculated using Fehr & Peers’ MainStreet Trip Generation Tool. a. AM Peak Hour: 10.7% b. PM Peak Hour: 7.9%
4. Shift to walk, bike or transit estimates the number of users that would choose to walk, bike or take transit, instead of drive to/from the site. It is calculated based on existing infrastructure and nearby transit options. For example, an employee at the Project site, may choose to take BART and SamTrans to the site, instead of drive. The shift to other modes was calculated using Fehr & Peers’ MainStreet Trip Generation Tool. a. AM Peak Hour: 12.2% b. PM Peak Hour: 11.1%
Source: Fehr & Peers.
Bayhill Specific Plan Environmental Impact Report Transportation Chapter Appendix Page 5 of 11
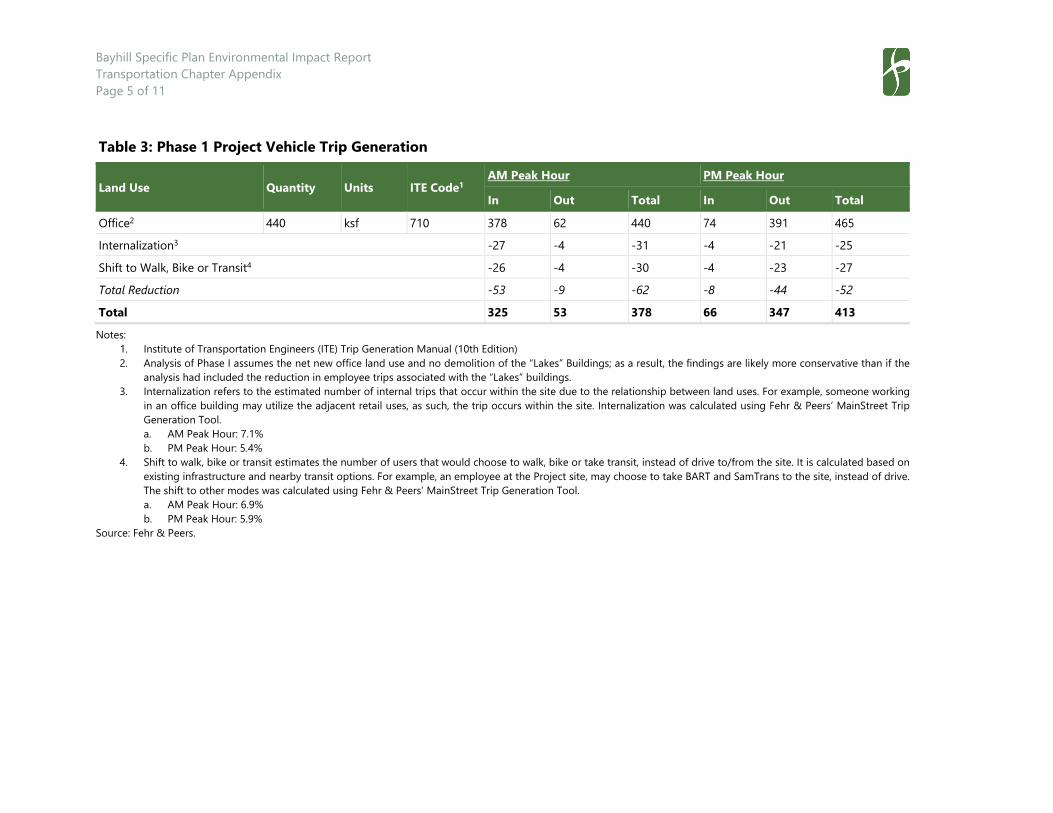
Table 3: Phase 1 Project Vehicle Trip Generation
Land Use Quantity Units ITE Code1 AM Peak Hour PM Peak Hour In Out Total In Out Total
Office2 440 ksf 710 378 62 440 74 391 465 Internalization3 -27 -4 -31 -4 -21 -25 Shift to Walk, Bike or Transit4 -26 -4 -30 -4 -23 -27 Total Reduction -53 -9 -62 -8 -44 -52 Total 325 53 378 66 347 413 Notes:
1. Institute of Transportation Engineers (ITE) Trip Generation Manual (10th Edition) 2. Analysis of Phase I assumes the net new office land use and no demolition of the “Lakes” Buildings; as a result, the findings are likely more conservative than if the
analysis had included the reduction in employee trips associated with the “Lakes” buildings. 3. Internalization refers to the estimated number of internal trips that occur within the site due to the relationship between land uses. For example, someone working
in an office building may utilize the adjacent retail uses, as such, the trip occurs within the site. Internalization was calculated using Fehr & Peers’ MainStreet Trip Generation Tool. a. AM Peak Hour: 7.1% b. PM Peak Hour: 5.4%
4. Shift to walk, bike or transit estimates the number of users that would choose to walk, bike or take transit, instead of drive to/from the site. It is calculated based on existing infrastructure and nearby transit options. For example, an employee at the Project site, may choose to take BART and SamTrans to the site, instead of drive. The shift to other modes was calculated using Fehr & Peers’ MainStreet Trip Generation Tool. a. AM Peak Hour: 6.9% b. PM Peak Hour: 5.9%
Source: Fehr & Peers.
Bayhill Specific Plan Environmental Impact Report Transportation Chapter Appendix Page 6 of 11
As shown in the footnotes of Tables 1 and 2, the internalization varies between the time of day and by the mix of land use. Between the two land use scenarios, the Max Housing scenario results in a slightly higher internalization due to the greater mix of land uses (e.g. more housing). The shift to walk, bike, and transit, is dependent on the available pedestrian and bicycle infrastructure, such as the presence of sidewalks and bike lanes. Additionally, it’s based on the proximity to transit. Based on the existing site and its proximity to El Camino Real, BART, and Caltrain, the Max Office and Max Housing scenarios are expected to shift 5 to 15 percent of users to walk, bike or transit. Similarly, the Phase 1 project is expected to result in some internalization and shift to other modes. The total reduction for the Phase 1 Project ranges from approximately 5 to 10 percent.
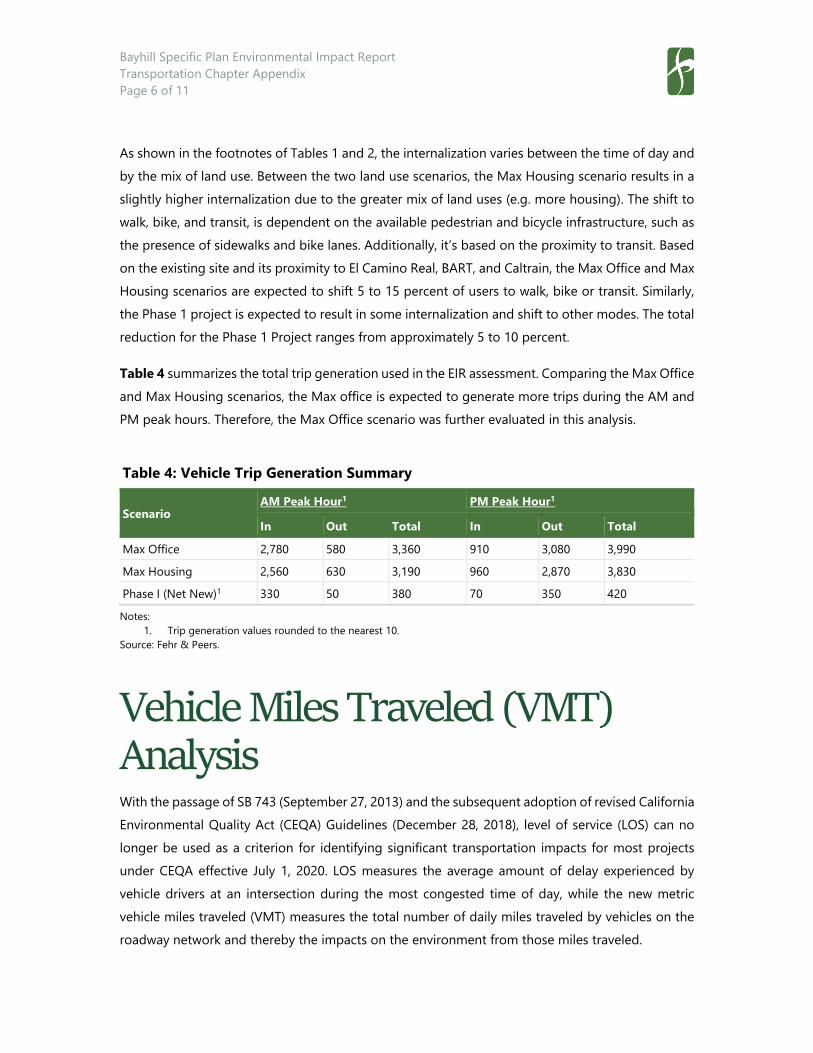
Table 4 summarizes the total trip generation used in the EIR assessment. Comparing the Max Office and Max Housing scenarios, the Max office is expected to generate more trips during the AM and PM peak hours. Therefore, the Max Office scenario was further evaluated in this analysis.
Table 4: Vehicle Trip Generation Summary
Scenario AM Peak Hour1 PM Peak Hour1 In Out Total In Out Total
Max Office 2,780 580 3,360 910 3,080 3,990 Max Housing 2,560 630 3,190 960 2,870 3,830 Phase I (Net New)1 330 50 380 70 350 420 Notes:
1. Trip generation values rounded to the nearest 10. Source: Fehr & Peers.
Vehicle Miles Traveled (VMT) Analysis With the passage of SB 743 (September 27, 2013) and the subsequent adoption of revised California Environmental Quality Act (CEQA) Guidelines (December 28, 2018), level of service (LOS) can no longer be used as a criterion for identifying significant transportation impacts for most projects under CEQA effective July 1, 2020. LOS measures the average amount of delay experienced by vehicle drivers at an intersection during the most congested time of day, while the new metric vehicle miles traveled (VMT) measures the total number of daily miles traveled by vehicles on the roadway network and thereby the impacts on the environment from those miles traveled.
Bayhill Specific Plan Environmental Impact Report Transportation Chapter Appendix Page 7 of 11
In other words, SB 743 changes the focus of transportation impact analysis in CEQA from measuring impacts to drivers, to measuring the impact of driving.
VMT measures the total number of daily miles traveled by vehicles on the roadway network and thereby the impacts on the environment from those miles traveled. For the purpose of this analysis, two VMT metrics were prepared:
- Total VMT: the amount of VMT generated by the Project - VMT per Service Population: the total VMT represented by a per-capita metric
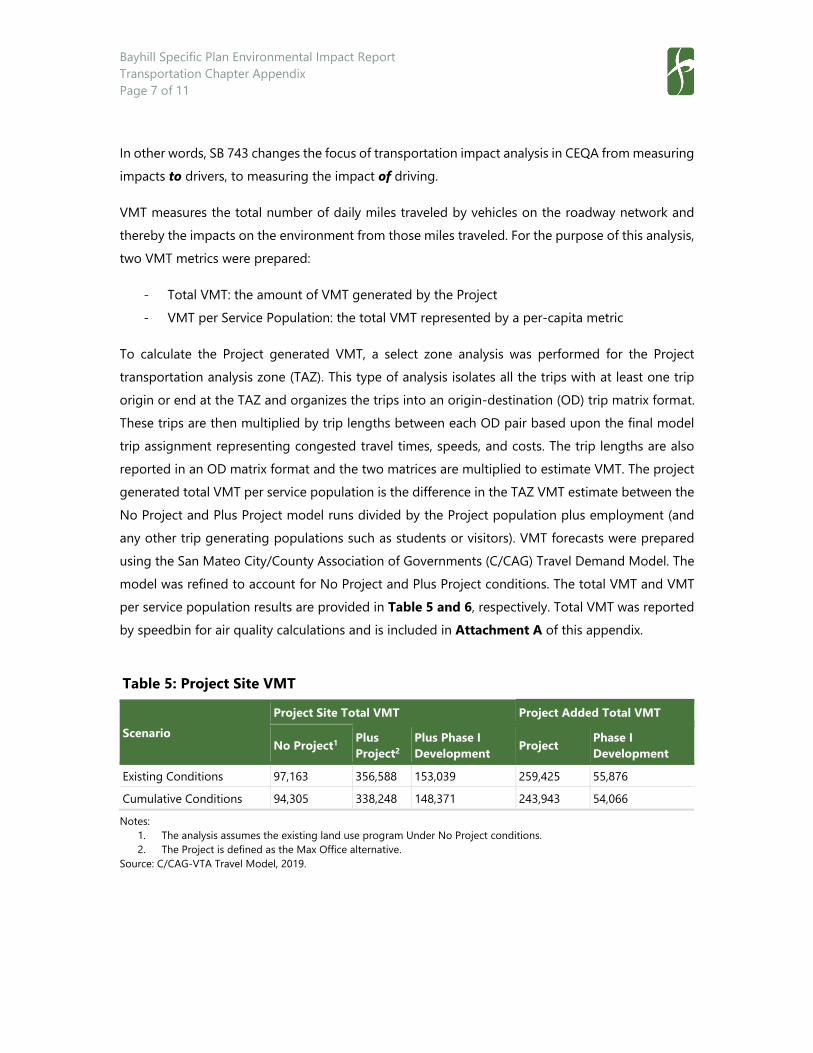
To calculate the Project generated VMT, a select zone analysis was performed for the Project transportation analysis zone (TAZ). This type of analysis isolates all the trips with at least one trip origin or end at the TAZ and organizes the trips into an origin-destination (OD) trip matrix format. These trips are then multiplied by trip lengths between each OD pair based upon the final model trip assignment representing congested travel times, speeds, and costs. The trip lengths are also reported in an OD matrix format and the two matrices are multiplied to estimate VMT. The project generated total VMT per service population is the difference in the TAZ VMT estimate between the No Project and Plus Project model runs divided by the Project population plus employment (and any other trip generating populations such as students or visitors). VMT forecasts were prepared using the San Mateo City/County Association of Governments (C/CAG) Travel Demand Model. The model was refined to account for No Project and Plus Project conditions. The total VMT and VMT per service population results are provided in Table 5 and 6, respectively. Total VMT was reported by speedbin for air quality calculations and is included in Attachment A of this appendix.
Table 5: Project Site VMT
Scenario Project Site Total VMT Project Added Total VMT
No Project1 Plus Project2
Plus Phase I Development Project Phase I
Development Existing Conditions 97,163 356,588 153,039 259,425 55,876 Cumulative Conditions 94,305 338,248 148,371 243,943 54,066 Notes:
1. The analysis assumes the existing land use program Under No Project conditions. 2. The Project is defined as the Max Office alternative.
Source: C/CAG-VTA Travel Model, 2019.
Bayhill Specific Plan Environmental Impact Report Transportation Chapter Appendix Page 8 of 11
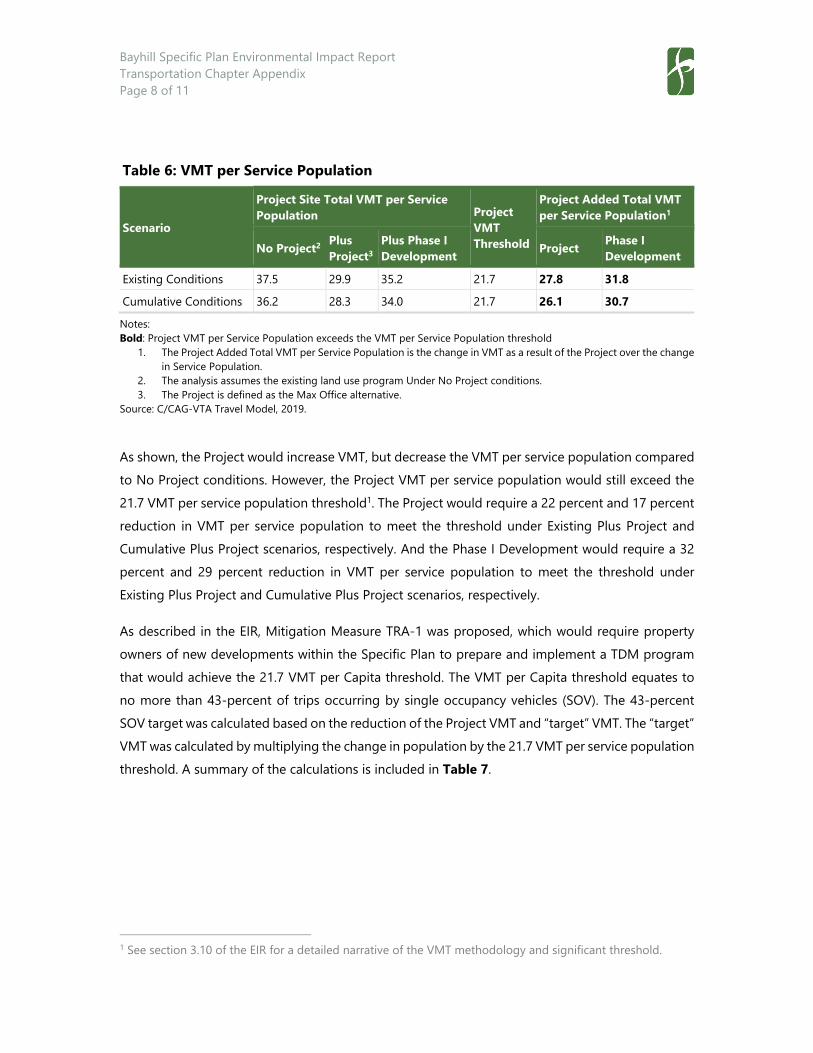
Table 6: VMT per Service Population
Scenario
Project Site Total VMT per Service Population Project
VMT Threshold
Project Added Total VMT per Service Population1
No Project2 Plus Project3
Plus Phase I Development Project Phase I
Development Existing Conditions 37.5 29.9 35.2 21.7 27.8 31.8 Cumulative Conditions 36.2 28.3 34.0 21.7 26.1 30.7 Notes: Bold: Project VMT per Service Population exceeds the VMT per Service Population threshold
1. The Project Added Total VMT per Service Population is the change in VMT as a result of the Project over the change in Service Population.
2. The analysis assumes the existing land use program Under No Project conditions. 3. The Project is defined as the Max Office alternative.
Source: C/CAG-VTA Travel Model, 2019.
As shown, the Project would increase VMT, but decrease the VMT per service population compared to No Project conditions. However, the Project VMT per service population would still exceed the 21.7 VMT per service population threshold1. The Project would require a 22 percent and 17 percent reduction in VMT per service population to meet the threshold under Existing Plus Project and Cumulative Plus Project scenarios, respectively. And the Phase I Development would require a 32 percent and 29 percent reduction in VMT per service population to meet the threshold under Existing Plus Project and Cumulative Plus Project scenarios, respectively.
As described in the EIR, Mitigation Measure TRA-1 was proposed, which would require property owners of new developments within the Specific Plan to prepare and implement a TDM program that would achieve the 21.7 VMT per Capita threshold. The VMT per Capita threshold equates to no more than 43-percent of trips occurring by single occupancy vehicles (SOV). The 43-percent SOV target was calculated based on the reduction of the Project VMT and “target” VMT. The “target” VMT was calculated by multiplying the change in population by the 21.7 VMT per service population threshold. A summary of the calculations is included in Table 7.
1 See section 3.10 of the EIR for a detailed narrative of the VMT methodology and significant threshold.
Bayhill Specific Plan Environmental Impact Report Transportation Chapter Appendix Page 9 of 11
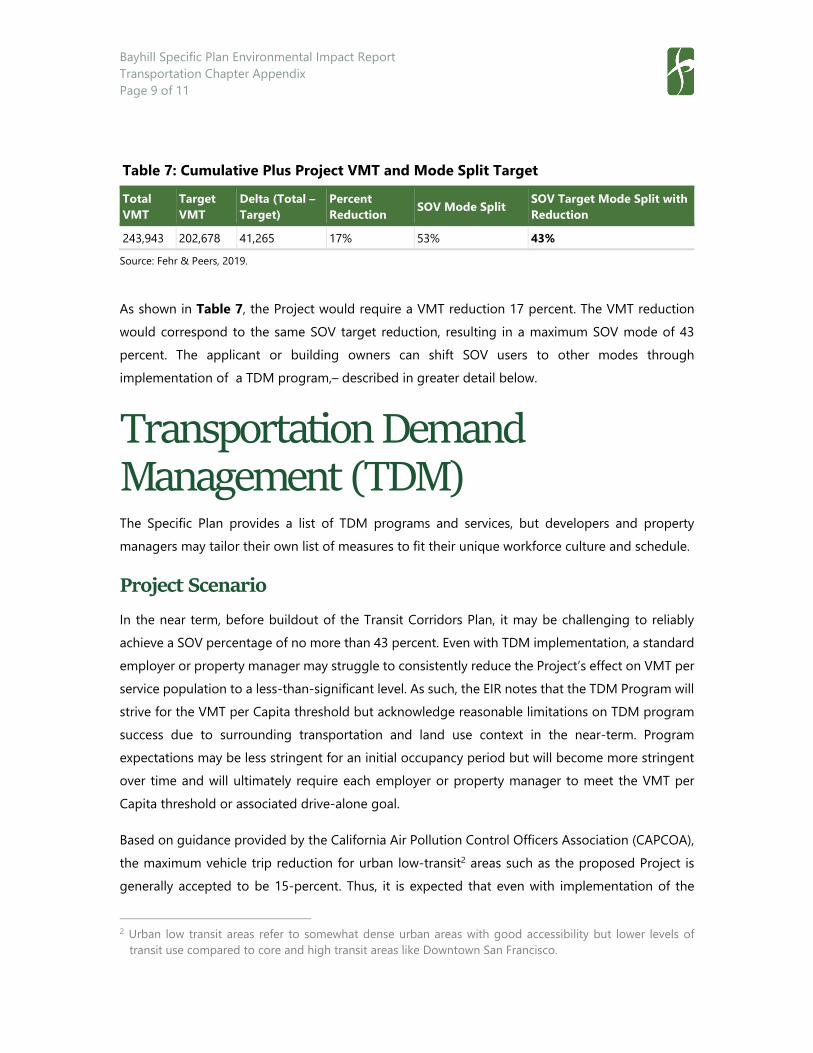
Table 7: Cumulative Plus Project VMT and Mode Split Target Total VMT
Target VMT
Delta (Total – Target)
Percent Reduction SOV Mode Split SOV Target Mode Split with
Reduction 243,943 202,678 41,265 17% 53% 43% Source: Fehr & Peers, 2019.
As shown in Table 7, the Project would require a VMT reduction 17 percent. The VMT reduction would correspond to the same SOV target reduction, resulting in a maximum SOV mode of 43 percent. The applicant or building owners can shift SOV users to other modes through implementation of a TDM program,– described in greater detail below.
Transportation Demand Management (TDM) The Specific Plan provides a list of TDM programs and services, but developers and property managers may tailor their own list of measures to fit their unique workforce culture and schedule.
Project Scenario
In the near term, before buildout of the Transit Corridors Plan, it may be challenging to reliably achieve a SOV percentage of no more than 43 percent. Even with TDM implementation, a standard employer or property manager may struggle to consistently reduce the Project’s effect on VMT per service population to a less-than-significant level. As such, the EIR notes that the TDM Program will strive for the VMT per Capita threshold but acknowledge reasonable limitations on TDM program success due to surrounding transportation and land use context in the near-term. Program expectations may be less stringent for an initial occupancy period but will become more stringent over time and will ultimately require each employer or property manager to meet the VMT per Capita threshold or associated drive-alone goal.
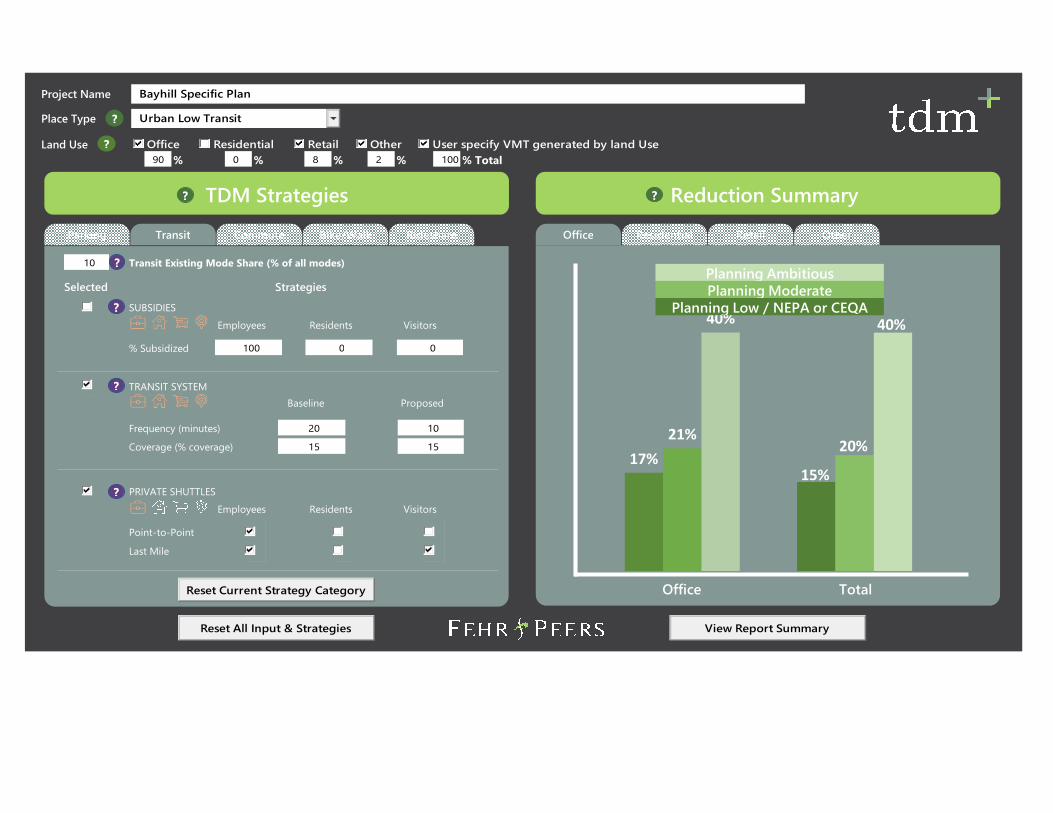
Based on guidance provided by the California Air Pollution Control Officers Association (CAPCOA), the maximum vehicle trip reduction for urban low-transit2 areas such as the proposed Project is generally accepted to be 15-percent. Thus, it is expected that even with implementation of the
2 Urban low transit areas refer to somewhat dense urban areas with good accessibility but lower levels of
transit use compared to core and high transit areas like Downtown San Francisco.
Bayhill Specific Plan Environmental Impact Report Transportation Chapter Appendix Page 10 of 11
comprehensive TDM program as described in the Specific Plan, the VMT reduction would not reduce by more than 15-percent. However, Fehr & Peers prepared a quantitative assessment of the TDM strategies proposed in the Specific Plan, included in Attachment C, using their TDM+ tool3. As shown, implementation of the program is expected to result in a VMT reduction ranging from 15 percent to 20 percent. As described in the EIR, the Project requires a reduction of 23 percent under current conditions; therefore, implementation of a TDM program would not result in a significant reduction that would meet the VMT per Capita threshold. However, under Cumulative conditions, the Project would require a reduction of 17 percent, which falls within the expected range of VMT reduction with implementation of a TDM program.
Therefore, it is unlikely that implementation of a TDM program would result in meeting the VMT per Capita threshold under Existing Plus Project conditions; however, would meet the threshold under Cumulative Plus Project conditions.
Phase I
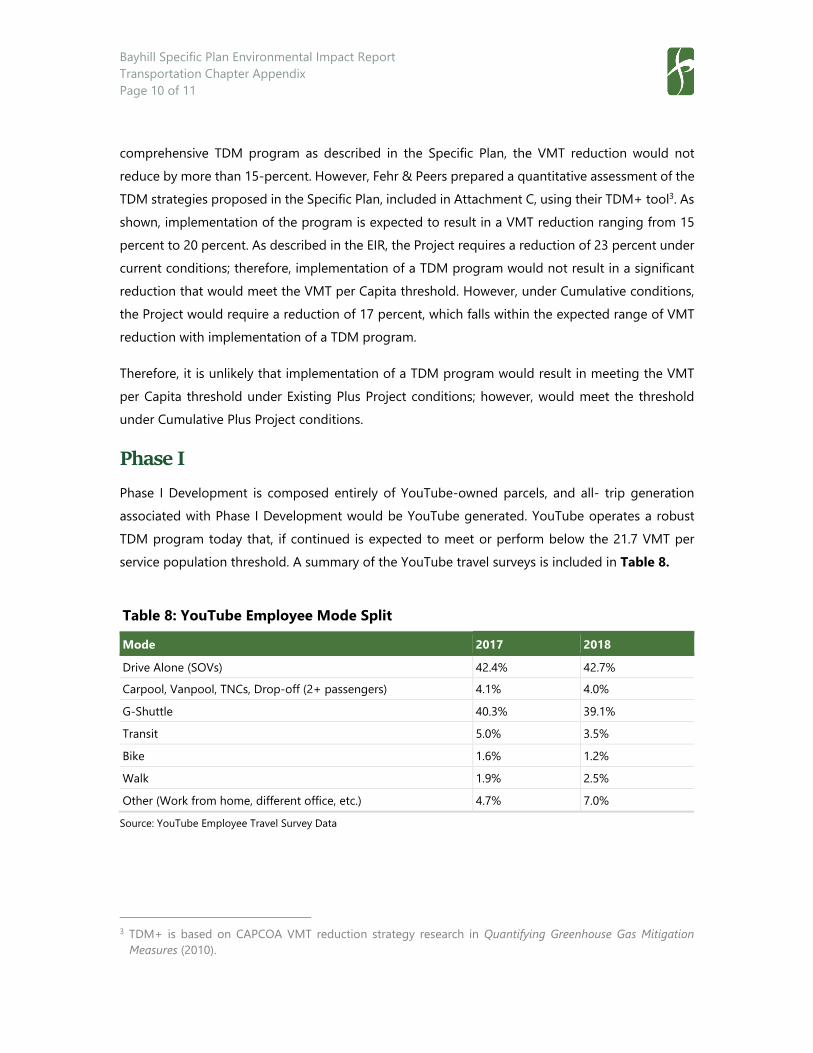
Phase I Development is composed entirely of YouTube-owned parcels, and all- trip generation associated with Phase I Development would be YouTube generated. YouTube operates a robust TDM program today that, if continued is expected to meet or perform below the 21.7 VMT per service population threshold. A summary of the YouTube travel surveys is included in Table 8.
Table 8: YouTube Employee Mode Split Mode 2017 2018 Drive Alone (SOVs) 42.4% 42.7% Carpool, Vanpool, TNCs, Drop-off (2+ passengers) 4.1% 4.0% G-Shuttle 40.3% 39.1% Transit 5.0% 3.5% Bike 1.6% 1.2% Walk 1.9% 2.5% Other (Work from home, different office, etc.) 4.7% 7.0% Source: YouTube Employee Travel Survey Data
3 TDM+ is based on CAPCOA VMT reduction strategy research in Quantifying Greenhouse Gas Mitigation
Measures (2010).
Bayhill Specific Plan Environmental Impact Report Transportation Chapter Appendix Page 11 of 11
As shown, approximately 40 percent of employees drive alone to work, whereas the 60 percent use the G-shuttle, employee owned and operated shuttle system, take transit, bike, carpool or other mode. YouTube’s current drive alone performance is below the 43 percent drive threshold, therefore, if the current or similar YouTube TDM program continues to be implemented with the addition of Phase I, it is expected that the Phase I Project would result in a VMT per service population under the 21.7 threshold.
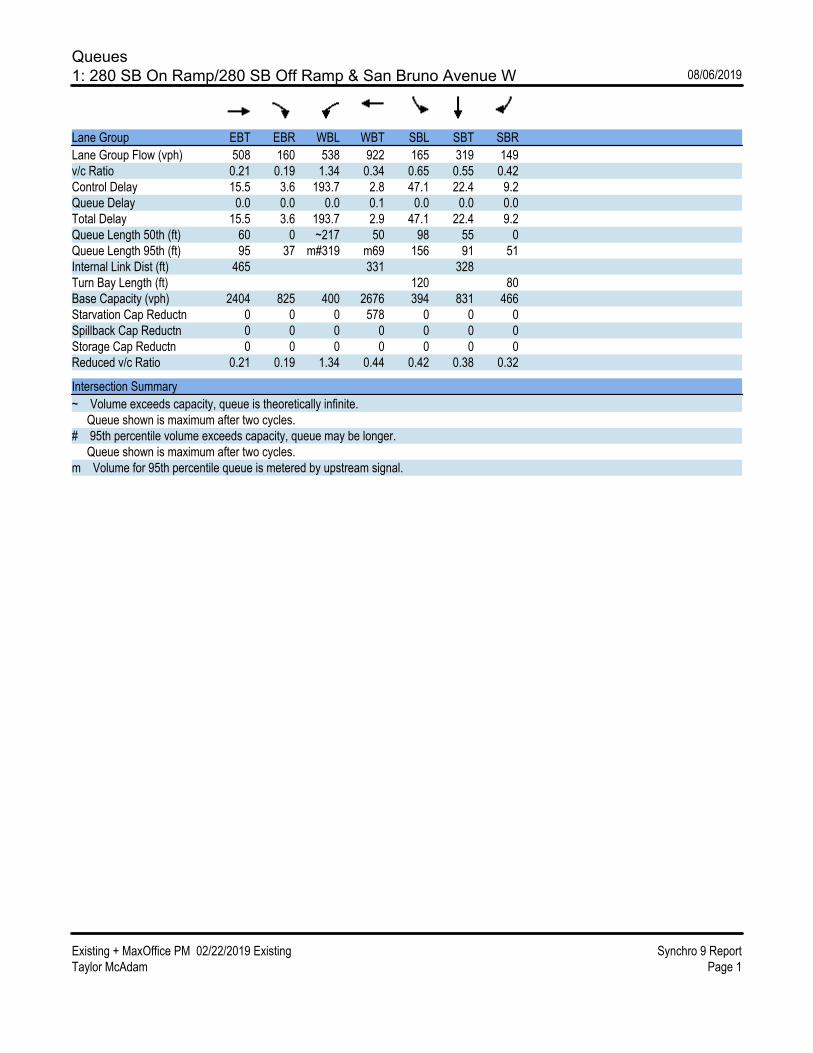
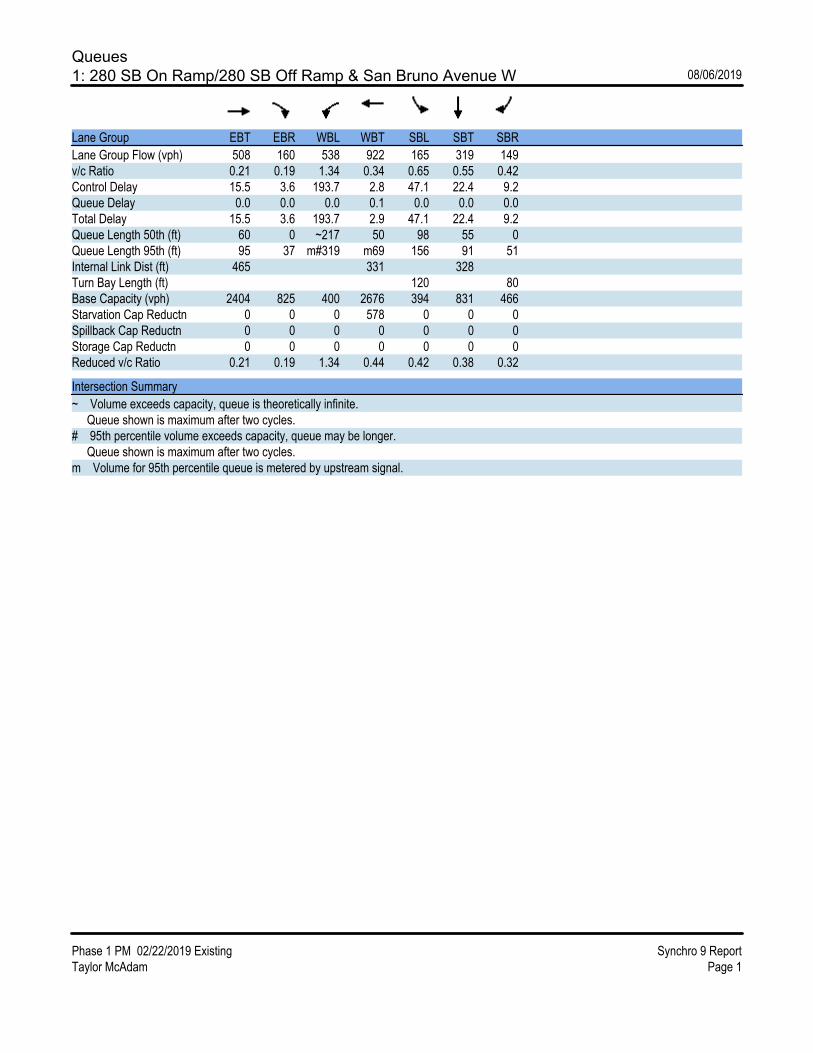
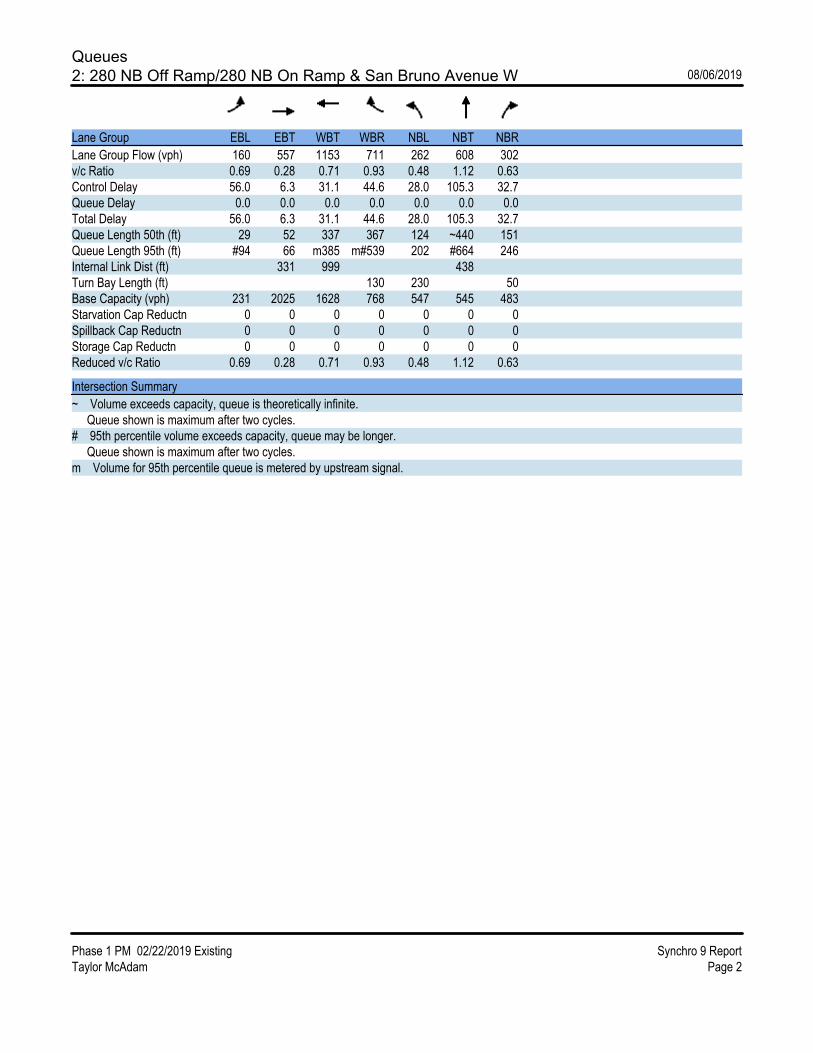
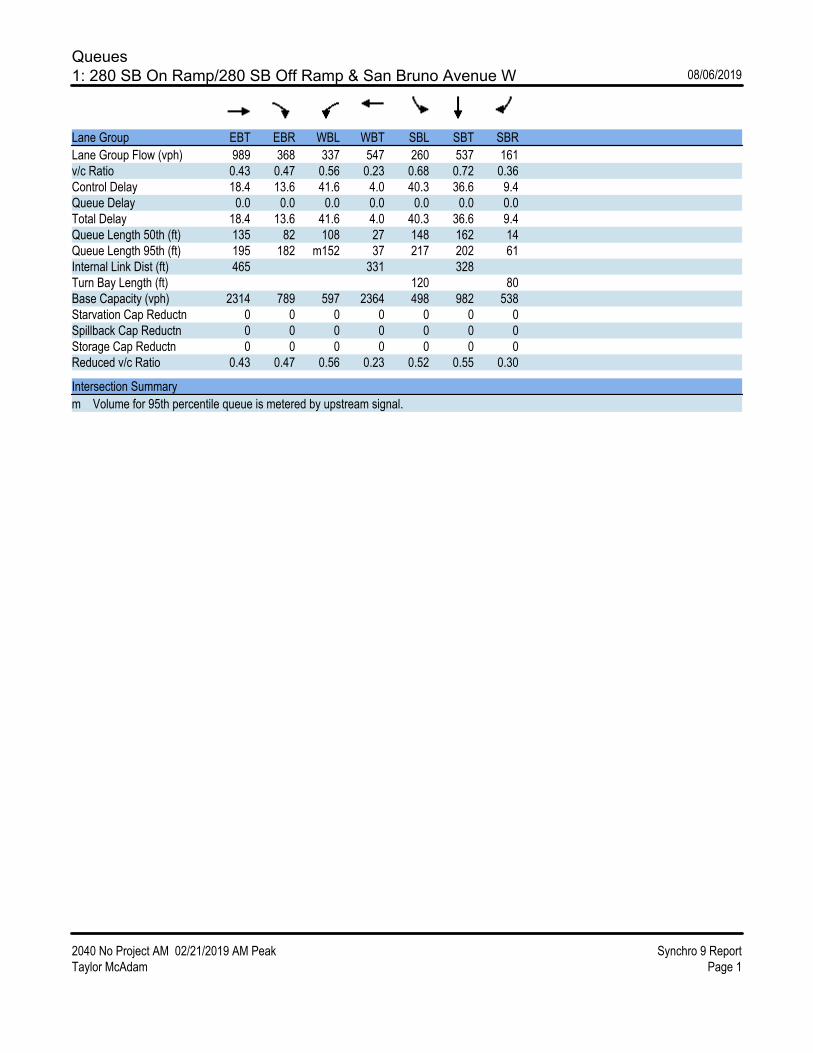
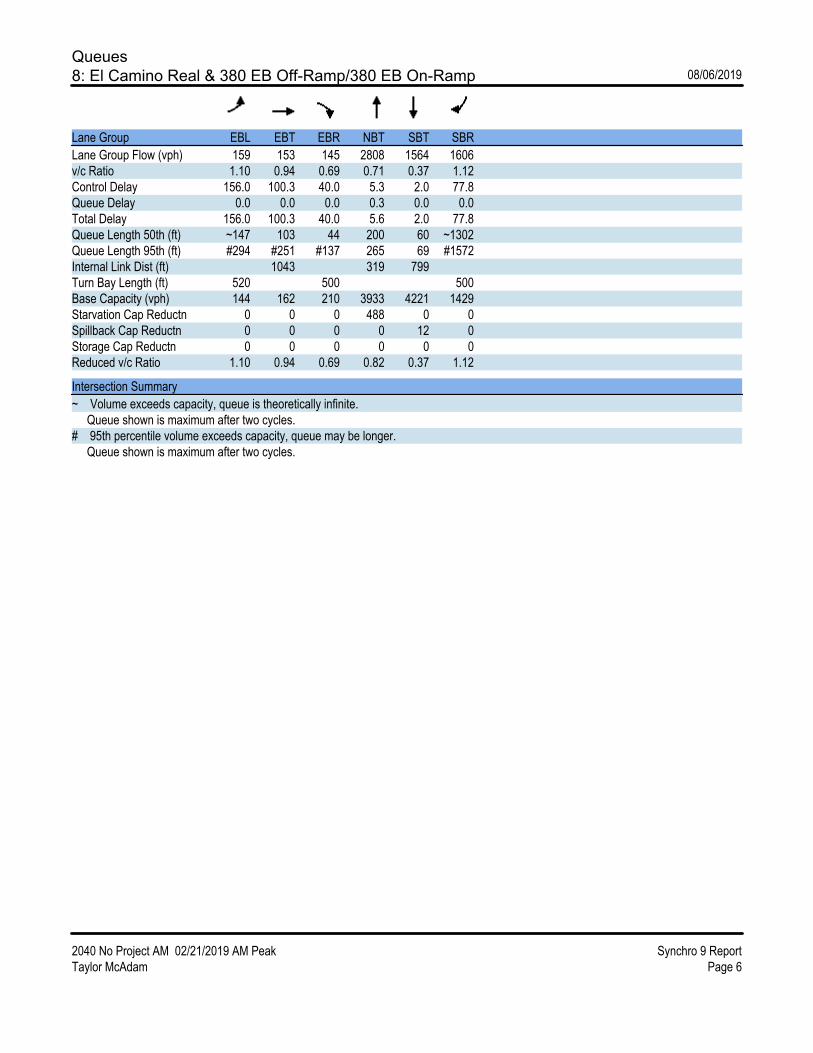
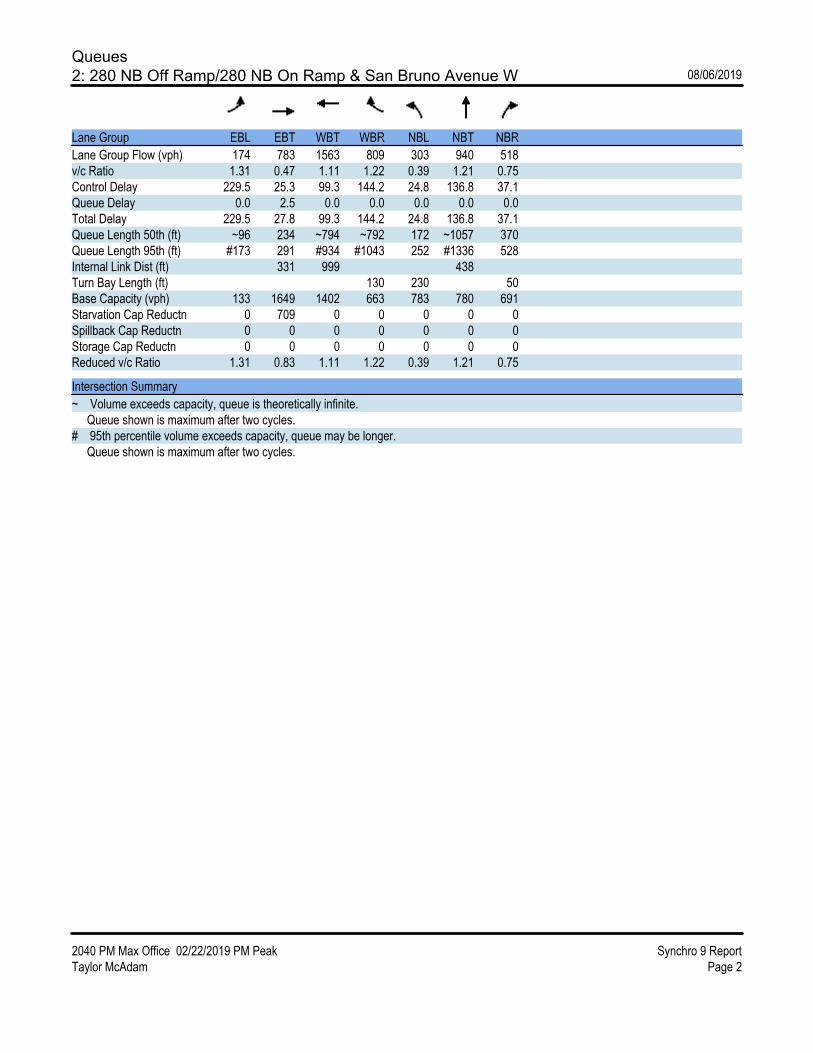
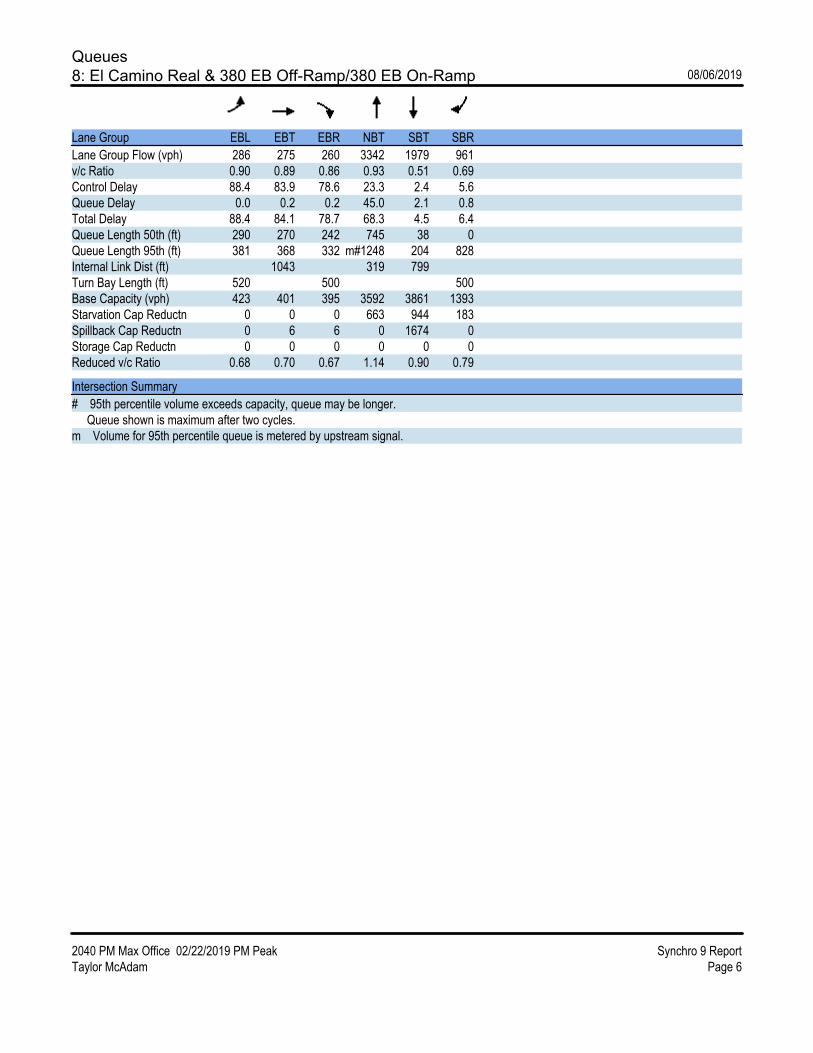
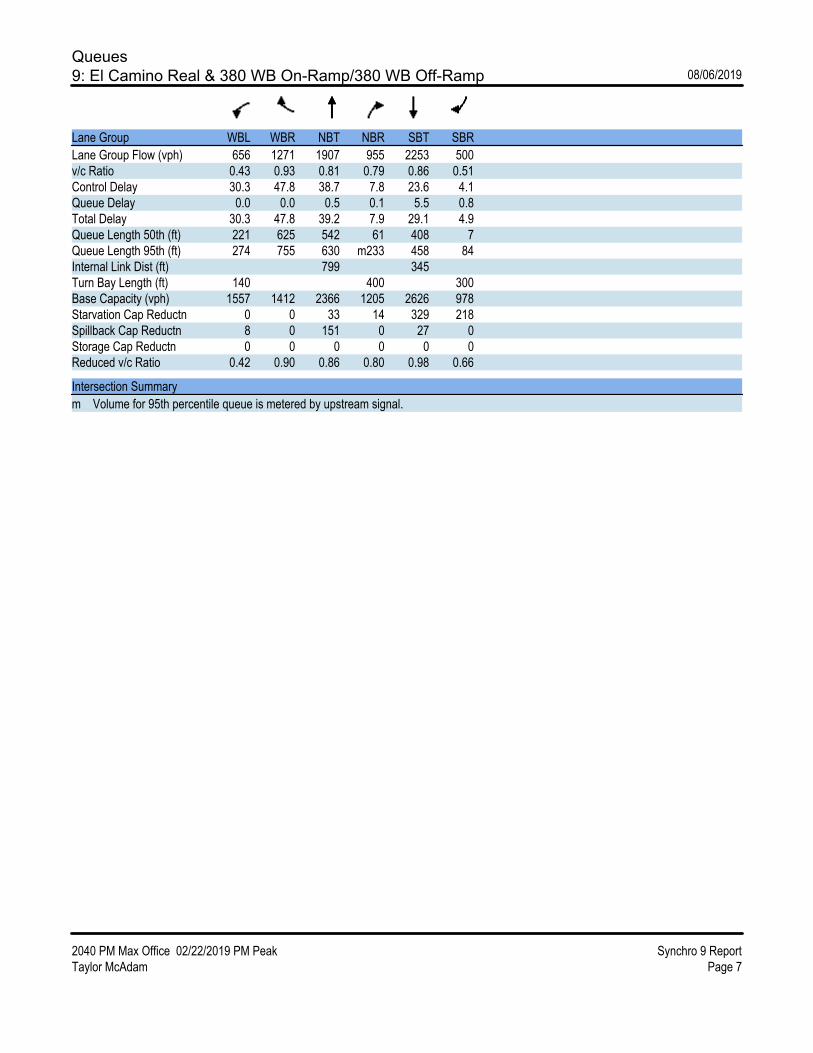
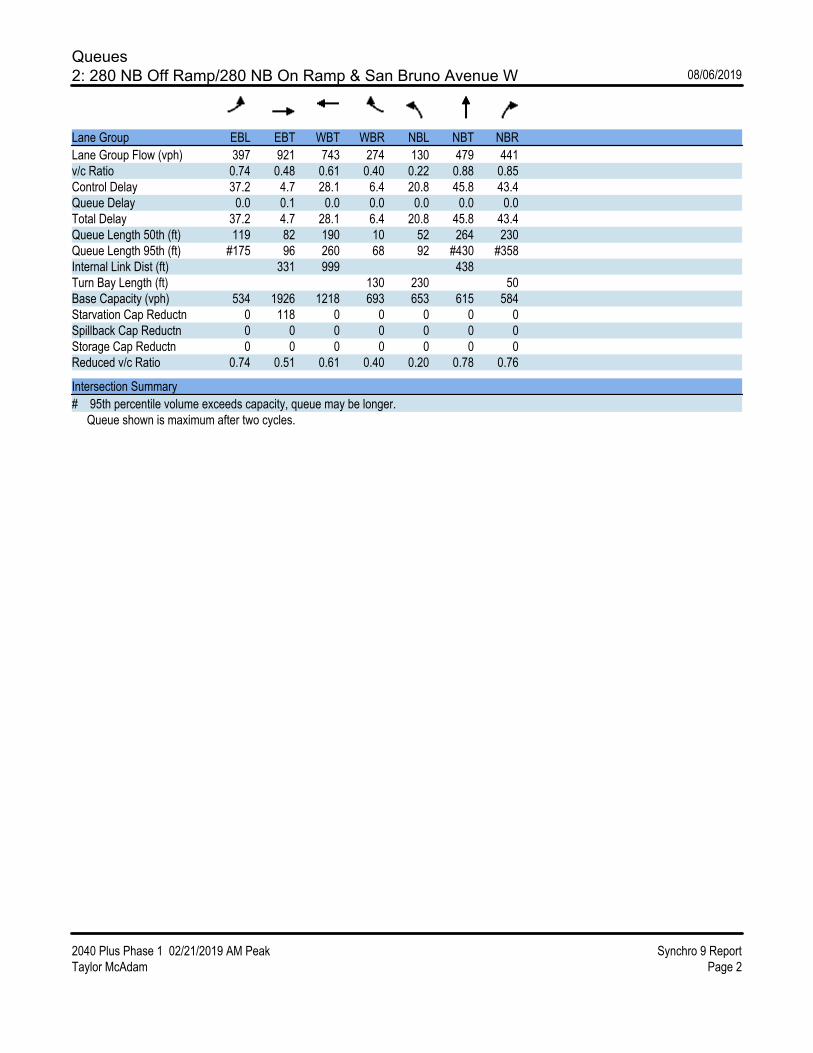
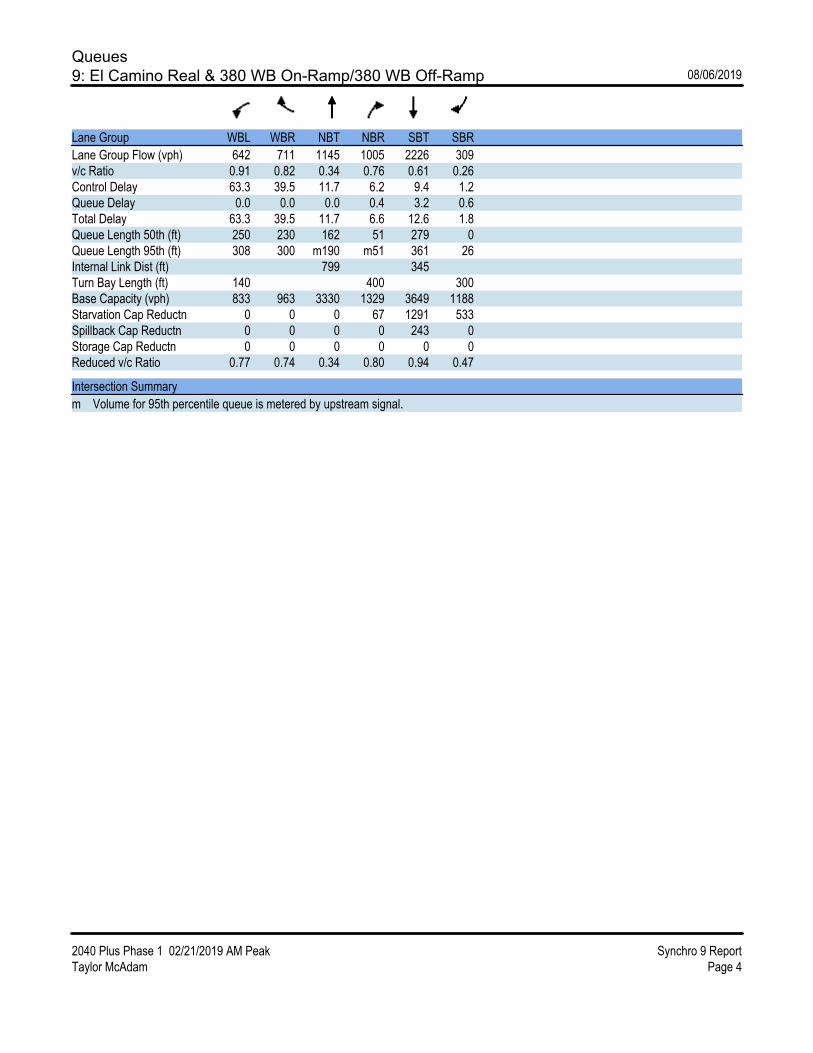
Queue Summary Attachment C of this appendix includes queue summary calculations, which were prepared to evaluate the possibility of hazardous operations at freeway off-ramp termini intersections. Synchro software was used to evaluate the Project’s impact to queue lengths at off-ramp termini intersections to understand if the Project would cause substantial queueing that would extend beyond the available ramp storage length. The Project’s impact was evaluated using 95th percentile queues. The 95th percentile queue represents a queue length that has a five percent probability of being exceeded during the analysis time period. Therefore, the 95th percentile represents a more conservative queue length, greater than typical or average conditions.
LOS Summary Attachment D of this appendix includes an additional memo and LOS summary. As discussed above, Senate Bill 743 and the resulting CEQA Guidelines update completed in early 2019 replaces the use of LOS for determining transportation impacts with an evaluation of VMT. However, a LOS analysis was prepared to understand if the Project would perform under acceptable LOS thresholds established by the City of San Bruno’s General Plan and C/CAG CMP. Attachment D documents the analysis assumptions and findings.
Attachments This appendix is followed by four corresponding attachments:
• Attachment A: VMT by Speedbin and Scenario • Attachment B: TDM Calculation Worksheets • Attachment C: Queue Summary • Attachment D: LOS Summary

Transportation Model Worksheets

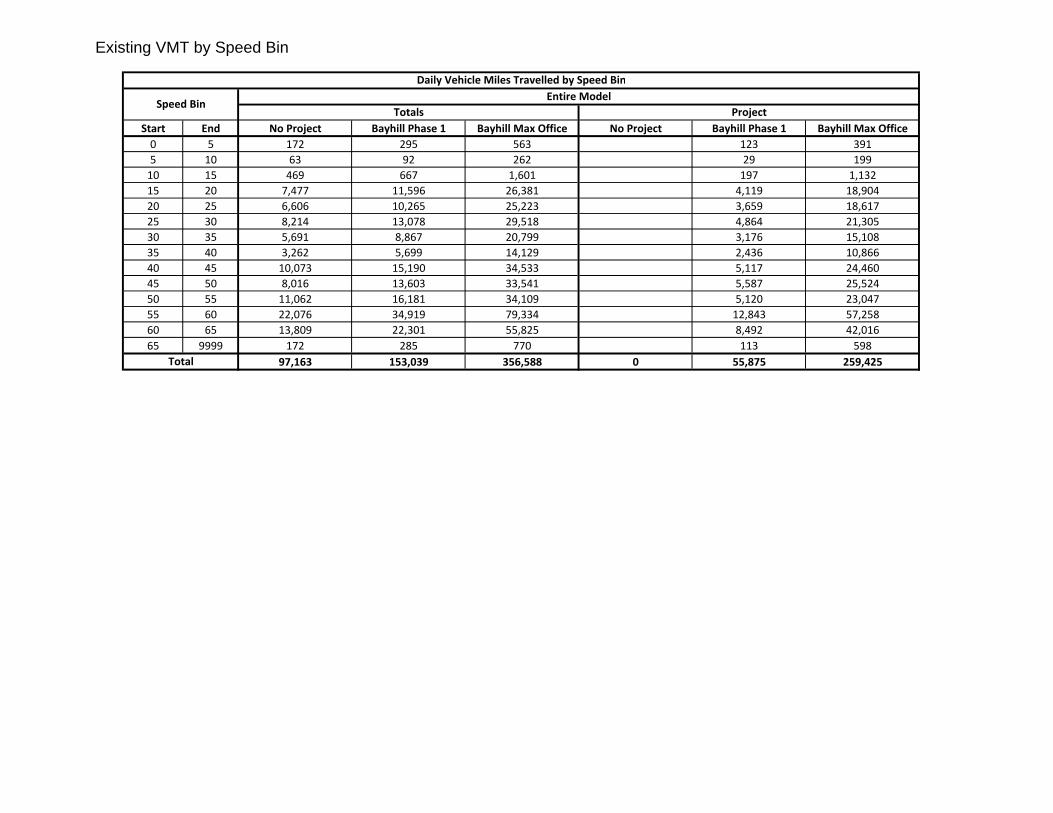
Start End No Project Bayhill Phase 1 Bayhill Max Office No Project Bayhill Phase 1 Bayhill Max Office
0 5 172 295 563 123 391
5 10 63 92 262 29 199
10 15 469 667 1,601 197 1,132
15 20 7,477 11,596 26,381 4,119 18,904
20 25 6,606 10,265 25,223 3,659 18,617
25 30 8,214 13,078 29,518 4,864 21,305
30 35 5,691 8,867 20,799 3,176 15,108
35 40 3,262 5,699 14,129 2,436 10,866
40 45 10,073 15,190 34,533 5,117 24,460
45 50 8,016 13,603 33,541 5,587 25,524
50 55 11,062 16,181 34,109 5,120 23,047
55 60 22,076 34,919 79,334 12,843 57,258
60 65 13,809 22,301 55,825 8,492 42,016
65 9999 172 285 770 113 598
97,163 153,039 356,588 0 55,875 259,425Total
Daily Vehicle Miles Travelled by Speed Bin
Speed BinEntire Model
Totals Project
Existing VMT by Speed Bin
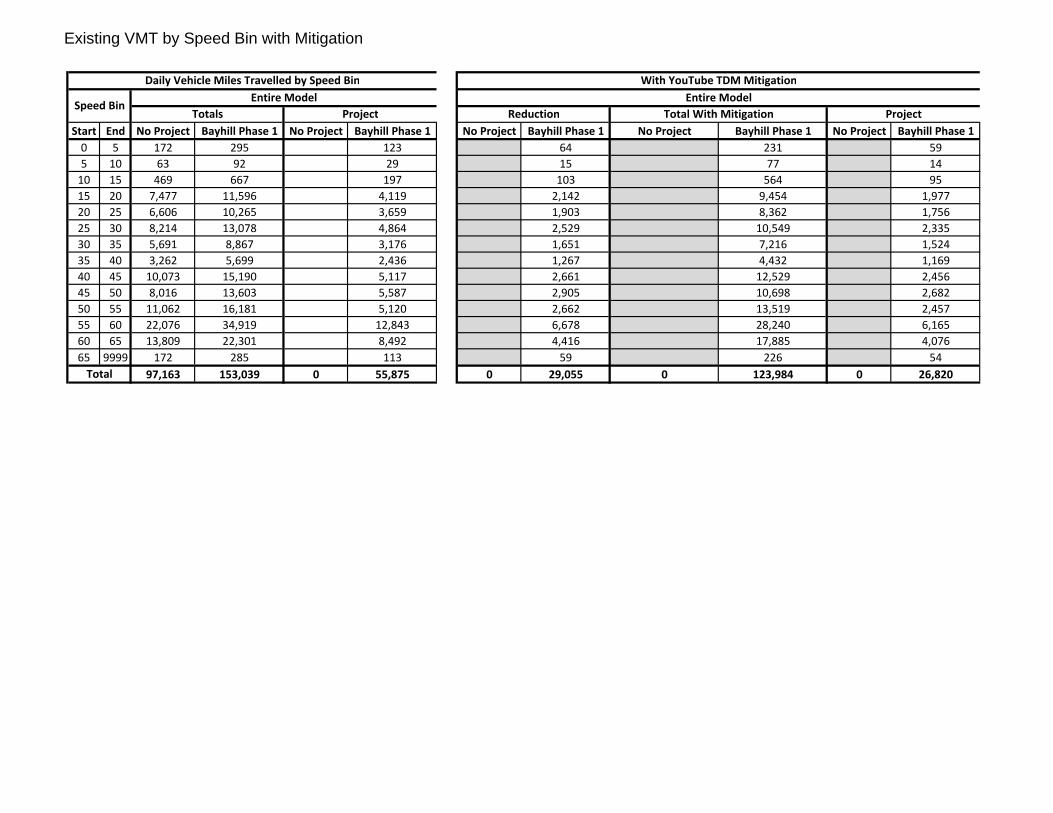
2013 No Project and Plus Project (Phase 1) - With Mitigation
Start End No Project Bayhill Phase 1 No Project Bayhill Phase 1 No Project Bayhill Phase 1 No Project Bayhill Phase 1 No Project Bayhill Phase 1
0 5 172 295 123 64 231 59
5 10 63 92 29 15 77 14
10 15 469 667 197 103 564 95
15 20 7,477 11,596 4,119 2,142 9,454 1,977
20 25 6,606 10,265 3,659 1,903 8,362 1,756
25 30 8,214 13,078 4,864 2,529 10,549 2,335
30 35 5,691 8,867 3,176 1,651 7,216 1,524
35 40 3,262 5,699 2,436 1,267 4,432 1,169
40 45 10,073 15,190 5,117 2,661 12,529 2,456
45 50 8,016 13,603 5,587 2,905 10,698 2,682
50 55 11,062 16,181 5,120 2,662 13,519 2,457
55 60 22,076 34,919 12,843 6,678 28,240 6,165
60 65 13,809 22,301 8,492 4,416 17,885 4,076
65 9999 172 285 113 59 226 54
97,163 153,039 0 55,875 0 29,055 0 123,984 0 26,820Total
Daily Vehicle Miles Travelled by Speed Bin
Speed BinEntire Model
Totals Project
With YouTube TDM Mitigation
Entire Model
Reduction ProjectTotal With Mitigation
Existing VMT by Speed Bin with Mitigation
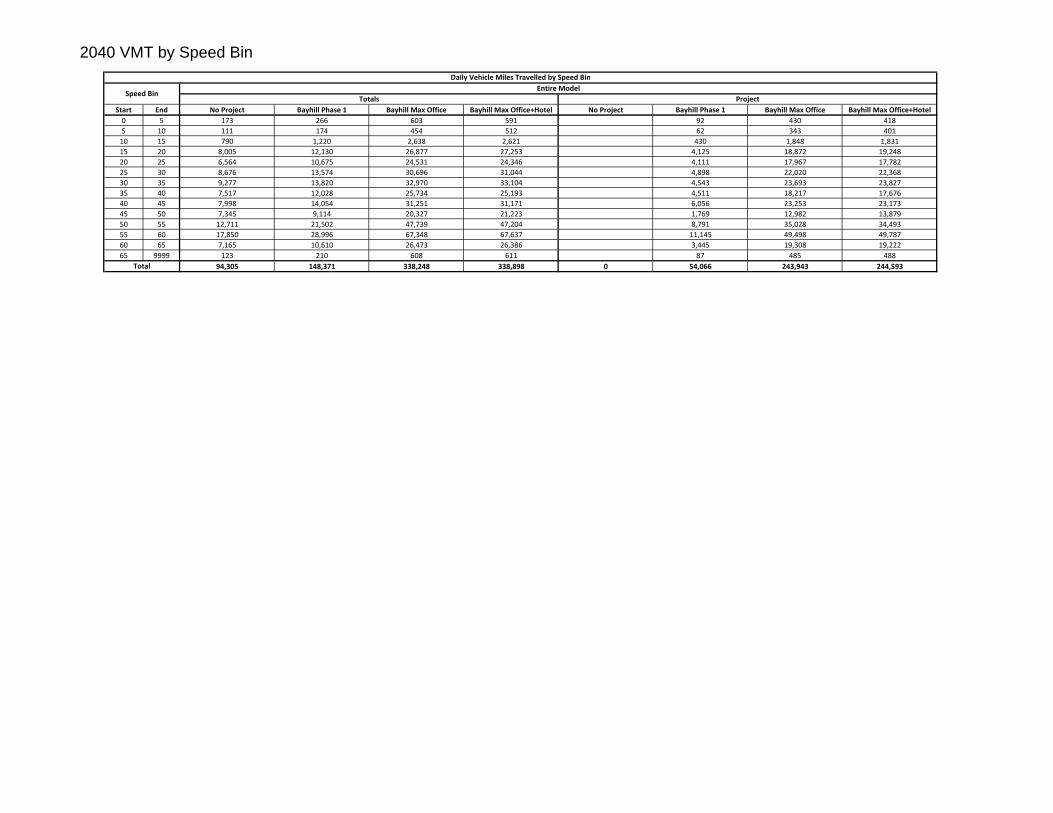
Start End No Project Bayhill Phase 1 Bayhill Max Office Bayhill Max Office+Hotel No Project Bayhill Phase 1 Bayhill Max Office Bayhill Max Office+Hotel
0 5 173 266 603 591 92 430 418
5 10 111 174 454 512 62 343 401
10 15 790 1,220 2,638 2,621 430 1,848 1,831
15 20 8,005 12,130 26,877 27,253 4,125 18,872 19,248
20 25 6,564 10,675 24,531 24,346 4,111 17,967 17,782
25 30 8,676 13,574 30,696 31,044 4,898 22,020 22,368
30 35 9,277 13,820 32,970 33,104 4,543 23,693 23,827
35 40 7,517 12,028 25,734 25,193 4,511 18,217 17,676
40 45 7,998 14,054 31,251 31,171 6,056 23,253 23,173
45 50 7,345 9,114 20,327 21,223 1,769 12,982 13,879
50 55 12,711 21,502 47,739 47,204 8,791 35,028 34,493
55 60 17,850 28,996 67,348 67,637 11,145 49,498 49,787
60 65 7,165 10,610 26,473 26,386 3,445 19,308 19,222
65 9999 123 210 608 611 87 485 488
94,305 148,371 338,248 338,898 0 54,066 243,943 244,593Total
Daily Vehicle Miles Travelled by Speed Bin
Speed BinEntire Model
Totals Project
2040 VMT by Speed Bin
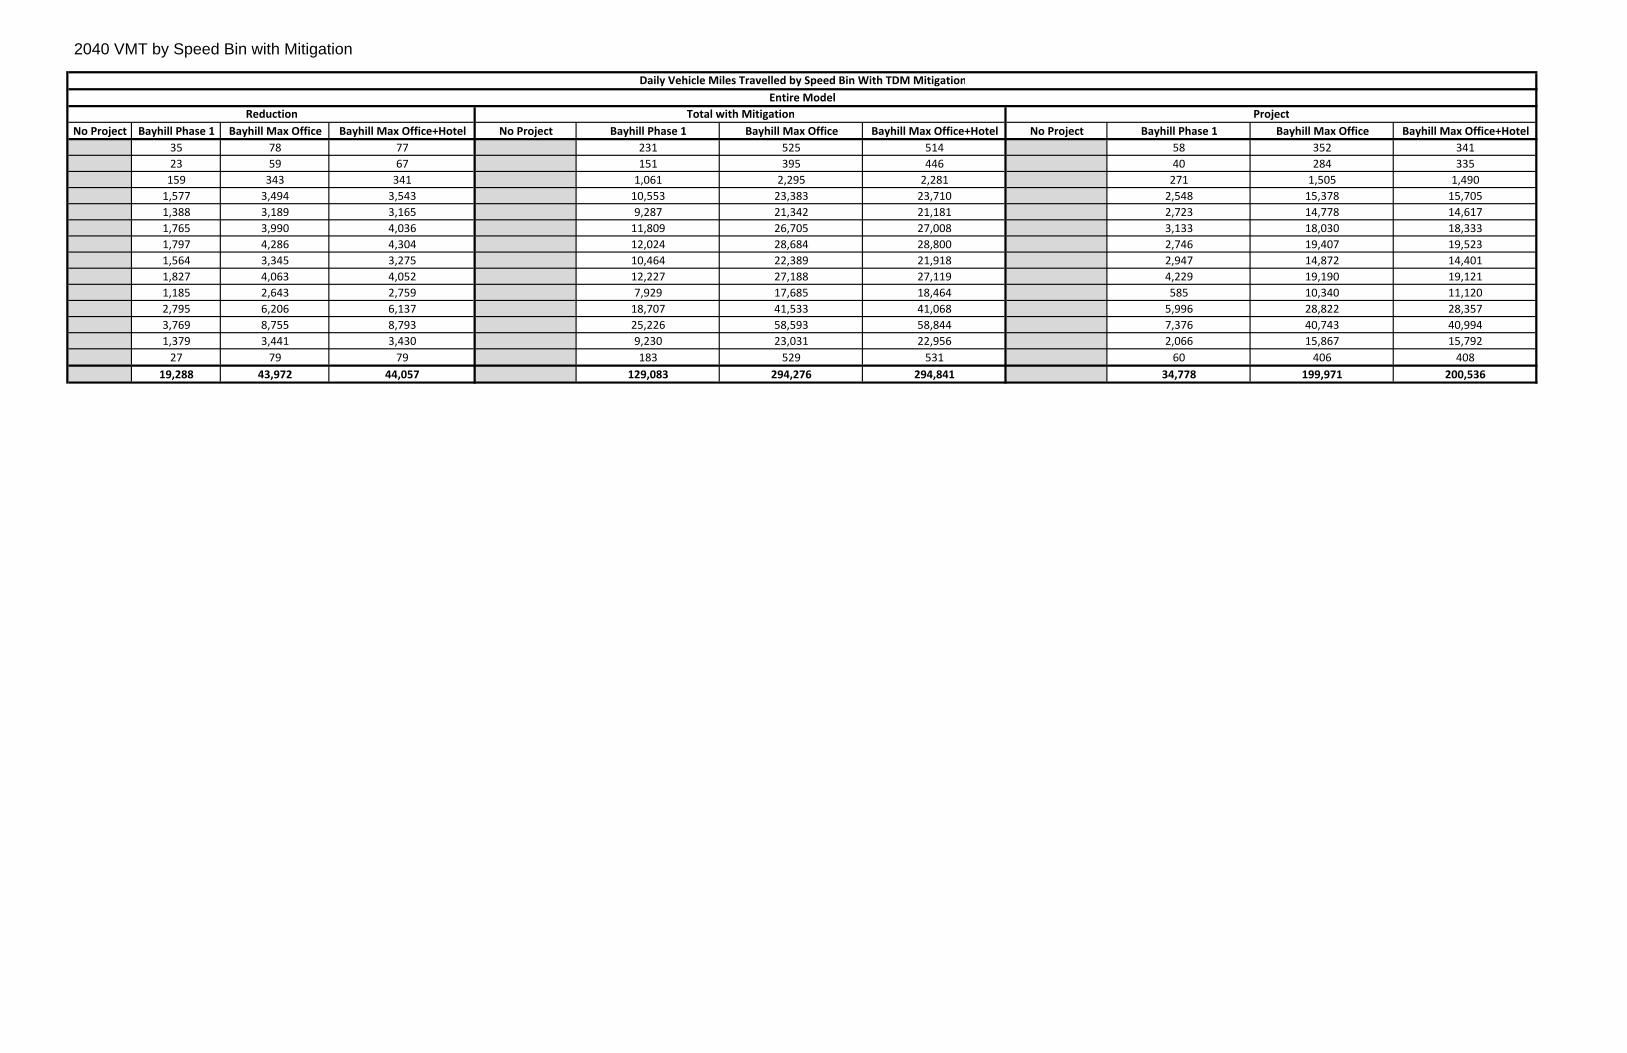
No Project Bayhill Phase 1 Bayhill Max Office Bayhill Max Office+Hotel No Project Bayhill Phase 1 Bayhill Max Office Bayhill Max Office+Hotel No Project Bayhill Phase 1 Bayhill Max Office Bayhill Max Office+Hotel
35 78 77 231 525 514 58 352 341
23 59 67 151 395 446 40 284 335
159 343 341 1,061 2,295 2,281 271 1,505 1,490
1,577 3,494 3,543 10,553 23,383 23,710 2,548 15,378 15,705
1,388 3,189 3,165 9,287 21,342 21,181 2,723 14,778 14,617
1,765 3,990 4,036 11,809 26,705 27,008 3,133 18,030 18,333
1,797 4,286 4,304 12,024 28,684 28,800 2,746 19,407 19,523
1,564 3,345 3,275 10,464 22,389 21,918 2,947 14,872 14,401
1,827 4,063 4,052 12,227 27,188 27,119 4,229 19,190 19,121
1,185 2,643 2,759 7,929 17,685 18,464 585 10,340 11,120
2,795 6,206 6,137 18,707 41,533 41,068 5,996 28,822 28,357
3,769 8,755 8,793 25,226 58,593 58,844 7,376 40,743 40,994
1,379 3,441 3,430 9,230 23,031 22,956 2,066 15,867 15,792
27 79 79 183 529 531 60 406 408
19,288 43,972 44,057 129,083 294,276 294,841 34,778 199,971 200,536
Total with Mitigation
Daily Vehicle Miles Travelled by Speed Bin With TDM Mitigation
Entire Model
Reduction Project
2040 VMT by Speed Bin with Mitigation
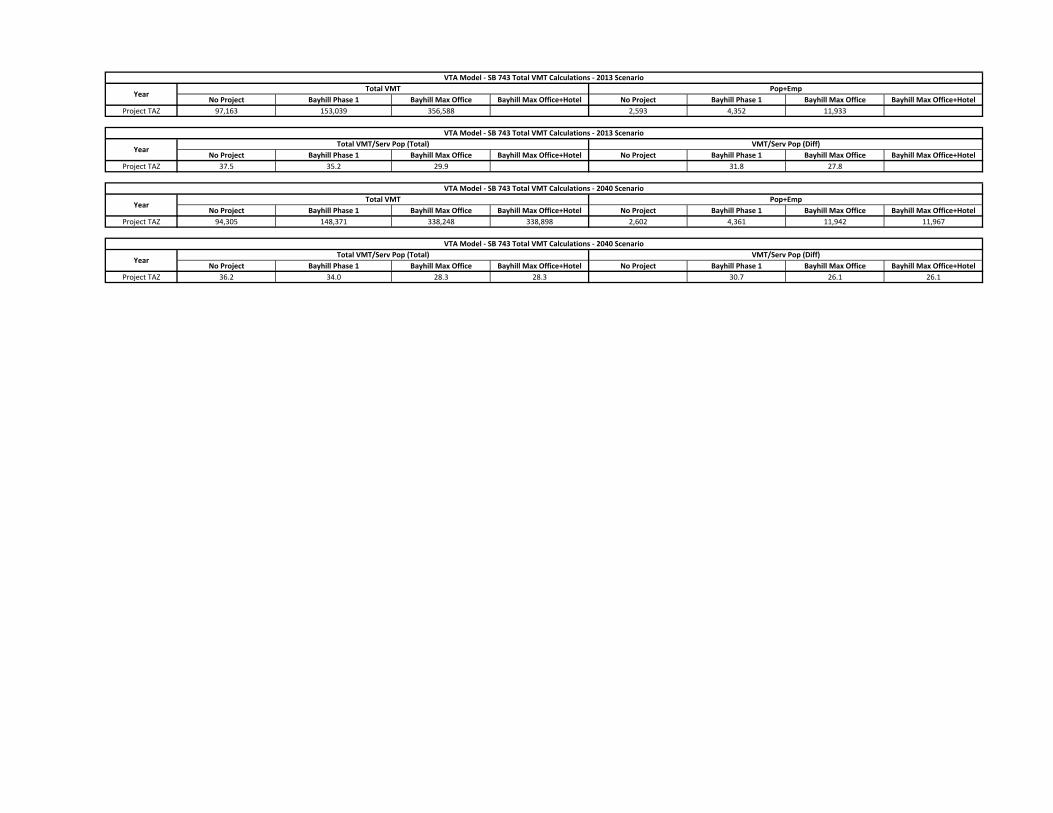
No Project Bayhill Phase 1 Bayhill Max Office Bayhill Max Office+Hotel No Project Bayhill Phase 1 Bayhill Max Office Bayhill Max Office+Hotel
Project TAZ 97,163 153,039 356,588 2,593 4,352 11,933
No Project Bayhill Phase 1 Bayhill Max Office Bayhill Max Office+Hotel No Project Bayhill Phase 1 Bayhill Max Office Bayhill Max Office+Hotel
Project TAZ 37.5 35.2 29.9 31.8 27.8
No Project Bayhill Phase 1 Bayhill Max Office Bayhill Max Office+Hotel No Project Bayhill Phase 1 Bayhill Max Office Bayhill Max Office+Hotel
Project TAZ 94,305 148,371 338,248 338,898 2,602 4,361 11,942 11,967
No Project Bayhill Phase 1 Bayhill Max Office Bayhill Max Office+Hotel No Project Bayhill Phase 1 Bayhill Max Office Bayhill Max Office+Hotel
Project TAZ 36.2 34.0 28.3 28.3 30.7 26.1 26.1
YearTotal VMT/Serv Pop (Total) VMT/Serv Pop (Diff)
VTA Model - SB 743 Total VMT Calculations - 2013 Scenario
YearTotal VMT Pop+Emp
VTA Model - SB 743 Total VMT Calculations - 2013 Scenario
VTA Model - SB 743 Total VMT Calculations - 2040 Scenario
YearTotal VMT Pop+Emp
VTA Model - SB 743 Total VMT Calculations - 2040 Scenario
YearTotal VMT/Serv Pop (Total) VMT/Serv Pop (Diff)
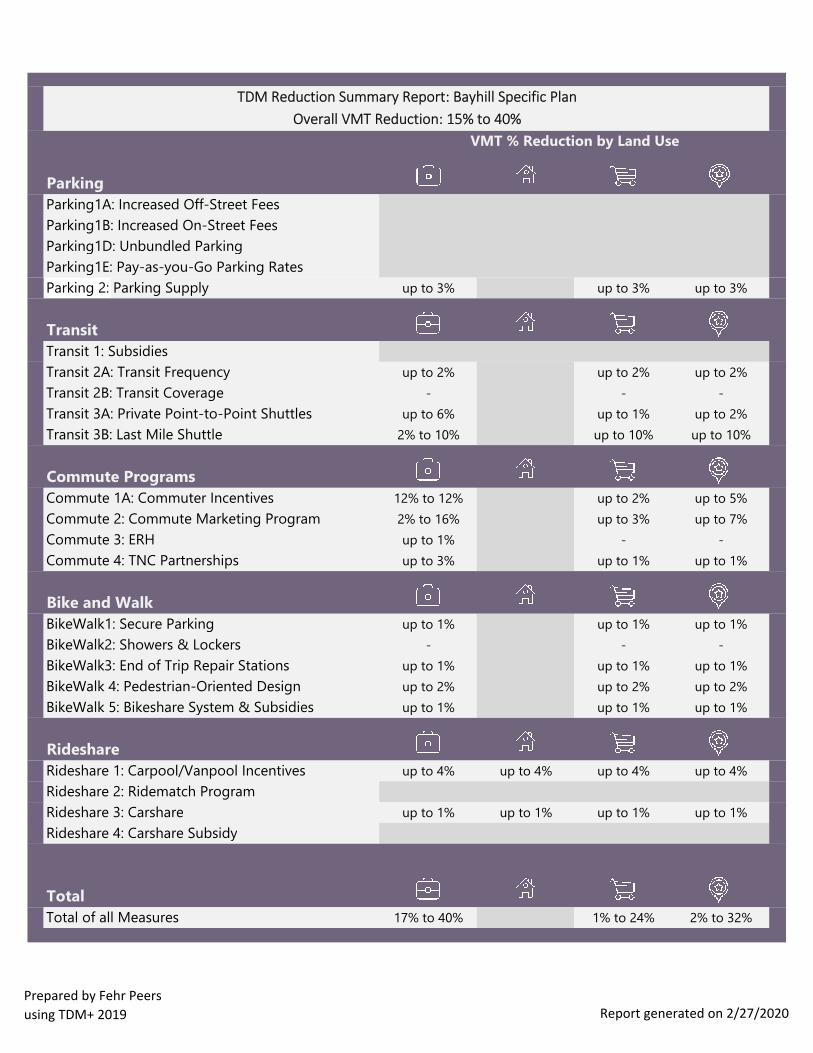
Parking
Parking1A: Increased Off-Street Fees n/a n/a n/a n/a
Parking1B: Increased On-Street Fees n/a n/a n/a n/a
Parking1D: Unbundled Parking n/a n/a n/a n/a
Parking1E: Pay-as-you-Go Parking Rates n/a n/a n/a n/a
Parking 2: Parking Supply up to 3% n/a up to 3% up to 3%
Transit
Transit 1: Subsidies n/a n/a n/a n/a
Transit 2A: Transit Frequency up to 2% n/a up to 2% up to 2%
Transit 2B: Transit Coverage - n/a - -
Transit 3A: Private Point-to-Point Shuttles up to 6% n/a up to 1% up to 2%
Transit 3B: Last Mile Shuttle 2% to 10% n/a up to 10% up to 10%
Commute Programs
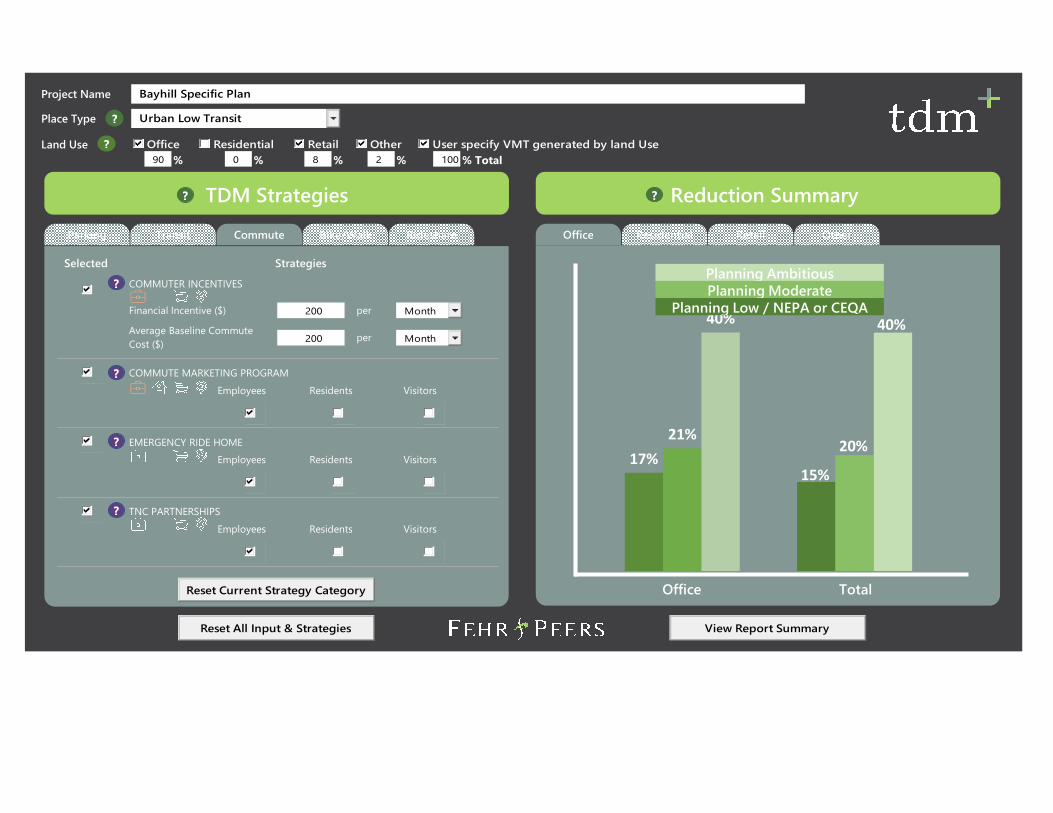
Commute 1A: Commuter Incentives 12% to 12% n/a up to 2% up to 5%
Commute 2: Commute Marketing Program 2% to 16% n/a up to 3% up to 7%
Commute 3: ERH up to 1% n/a - -
Commute 4: TNC Partnerships up to 3% n/a up to 1% up to 1%
Bike and Walk
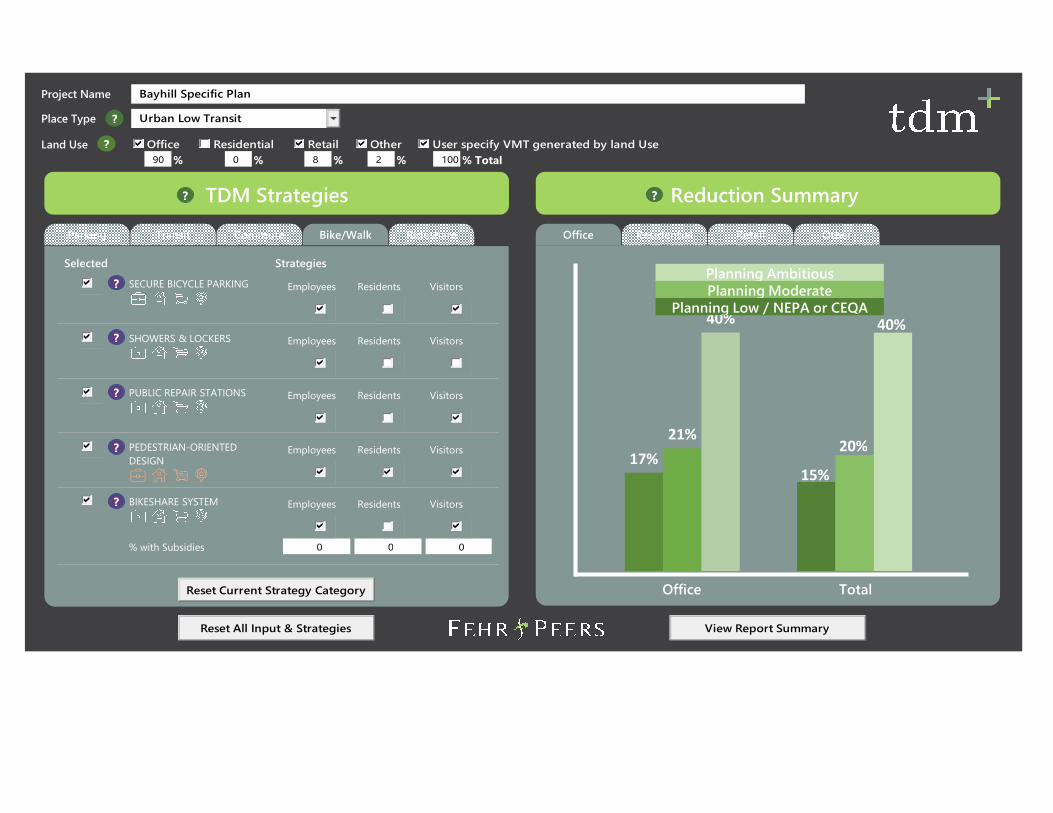
BikeWalk1: Secure Parking up to 1% n/a up to 1% up to 1%
BikeWalk2: Showers & Lockers - n/a - -
BikeWalk3: End of Trip Repair Stations up to 1% n/a up to 1% up to 1%
BikeWalk 4: Pedestrian-Oriented Design up to 2% n/a up to 2% up to 2%
BikeWalk 5: Bikeshare System & Subsidies up to 1% n/a up to 1% up to 1%
Rideshare
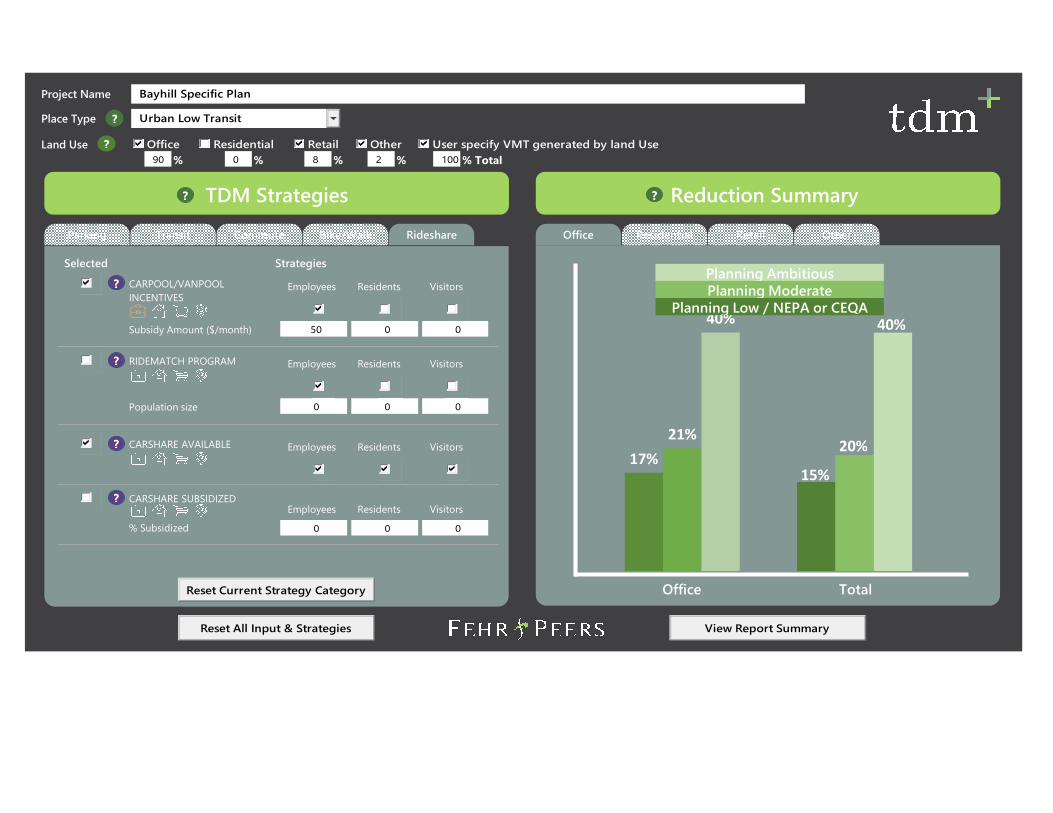
Rideshare 1: Carpool/Vanpool Incentives up to 4% up to 4% up to 4% up to 4%
Rideshare 2: Ridematch Program n/a n/a n/a n/a
Rideshare 3: Carshare up to 1% up to 1% up to 1% up to 1%
Rideshare 4: Carshare Subsidy n/a n/a n/a n/a
Total
Total of all Measures 17% to 40% n/a 1% to 24% 2% to 32%
VMT % Reduction by Land Use
TDM Reduction Summary Report: Bayhill Specific Plan
Overall VMT Reduction: 15% to 40%
Prepared by Fehr Peers
using TDM+ 2019 Report generated on 2/27/2020
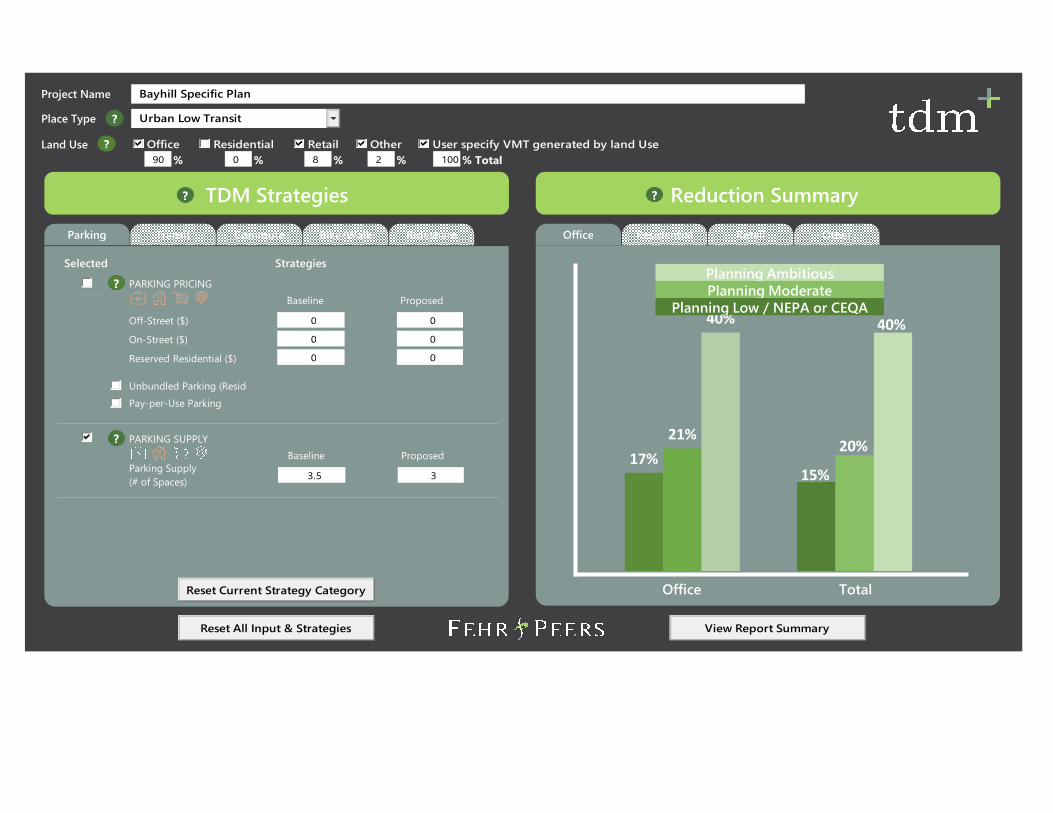
TDM Strategies?
% Total% % % %
Bayhill Specific PlanProject Name
Place Type Urban Low Transit
Land Use Office Residential Retail Other
90 0 8 2
User specify VMT generated by land Use
Reset All Input & Strategies View Report Summary
Reduction Summary
Parking Transit Commute Bike/Walk Rideshare
Reset Current Strategy Category
Selected Strategies
Baseline Proposed
Off-Street ($)
On-Street ($)
Reserved Residential ($)
0 0
0 0
0 0
Office Residential Retail Other
PARKING PRICING
PARKING SUPPLY
Baseline ProposedParking Supply
(# of Spaces)3.5 3
Unbundled Parking (Residential)
Pay-per-Use Parking
100
17%
21%
40%
15%
20%
40%
Planning AmbitiousPlanning Moderate
Planning Low / NEPA or CEQA
Office Total
?
?
?
?
?
TDM Strategies?
% Total% % % %
Bayhill Specific PlanProject Name
Place Type Urban Low Transit
Land Use Office Residential Retail Other
90 0 8 2
User specify VMT generated by land Use
Reset All Input & Strategies View Report Summary
Reduction Summary
Parking Transit Commute Bike/Walk Rideshare
Reset Current Strategy Category
Selected Strategies
Office Residential Retail Other
Employees Residents
100 0
SUBSIDIES
TRANSIT SYSTEM
Baseline Proposed
Frequency (minutes) 20 10
Coverage (% coverage) 15 15
0
Visitors
% Subsidized
Employees Residents
PRIVATE SHUTTLES
Visitors
Point-to-Point
Last Mile
Transit Existing Mode Share (% of all modes)10
100
17%
21%
40%
15%
20%
40%
Planning AmbitiousPlanning Moderate
Planning Low / NEPA or CEQA
Office Total
?
?
?
?
?
?
?
TDM Strategies?
% Total% % % %
Bayhill Specific PlanProject Name
Place Type Urban Low Transit
Land Use Office Residential Retail Other
90 0 8 2
User specify VMT generated by land Use
Reset All Input & Strategies View Report Summary
Reduction Summary
Parking Transit Commute Bike/Walk Rideshare
Reset Current Strategy Category
Selected Strategies
Office Residential Retail Other
200
200
per
per
COMMUTER INCENTIVES
Visitors
Financial Incentive ($)
Average Baseline Commute
Cost ($)
Month
Month
Employees Residents
COMMUTE MARKETING PROGRAM
VisitorsEmployees Residents
EMERGENCY RIDE HOME
VisitorsEmployees Residents
TNC PARTNERSHIPS
100
17%
21%
40%
15%
20%
40%
Planning AmbitiousPlanning Moderate
Planning Low / NEPA or CEQA
Office Total
?
?
?
?
?
?
?
TDM Strategies?
% Total% % % %
Bayhill Specific PlanProject Name
Place Type Urban Low Transit
Land Use Office Residential Retail Other
90 0 8 2
User specify VMT generated by land Use
Reset All Input & Strategies View Report Summary
Reduction Summary
Parking Transit Commute Bike/Walk Rideshare
Reset Current Strategy Category
Selected Strategies
Office Residential Retail Other
BIKESHARE SYSTEM
Visitors
% with Subsidies
Employees ResidentsSHOWERS & LOCKERS
VisitorsEmployees ResidentsPUBLIC REPAIR STATIONS
VisitorsEmployees ResidentsPEDESTRIAN-ORIENTED
DESIGN
00 0
VisitorsEmployees ResidentsSECURE BICYCLE PARKING
VisitorsEmployees Residents
100
17%
21%
40%
15%
20%
40%
Planning AmbitiousPlanning Moderate
Planning Low / NEPA or CEQA
Office Total
?
?
?
?
?
?
?
?
TDM Strategies?
% Total% % % %
Bayhill Specific PlanProject Name
Place Type Urban Low Transit
Land Use Office Residential Retail Other
90 0 8 2
User specify VMT generated by land Use
Reset All Input & Strategies View Report Summary
Reduction Summary
Parking Transit Commute Bike/Walk Rideshare
Reset Current Strategy Category
Selected Strategies
Office Residential Retail Other
CARPOOL/VANPOOL
INCENTIVES
Subsidy Amount ($/month)
VisitorsEmployees Residents
050 0
RIDEMATCH PROGRAM
Population size
VisitorsEmployees Residents
00 0
VisitorsEmployees ResidentsCARSHARE AVAILABLE
VisitorsEmployees ResidentsCARSHARE SUBSIDIZED
00 0% Subsidized
100
17%
21%
40%
15%
20%
40%
Planning AmbitiousPlanning Moderate
Planning Low / NEPA or CEQA
Office Total
?
?
?
?
?
?
?
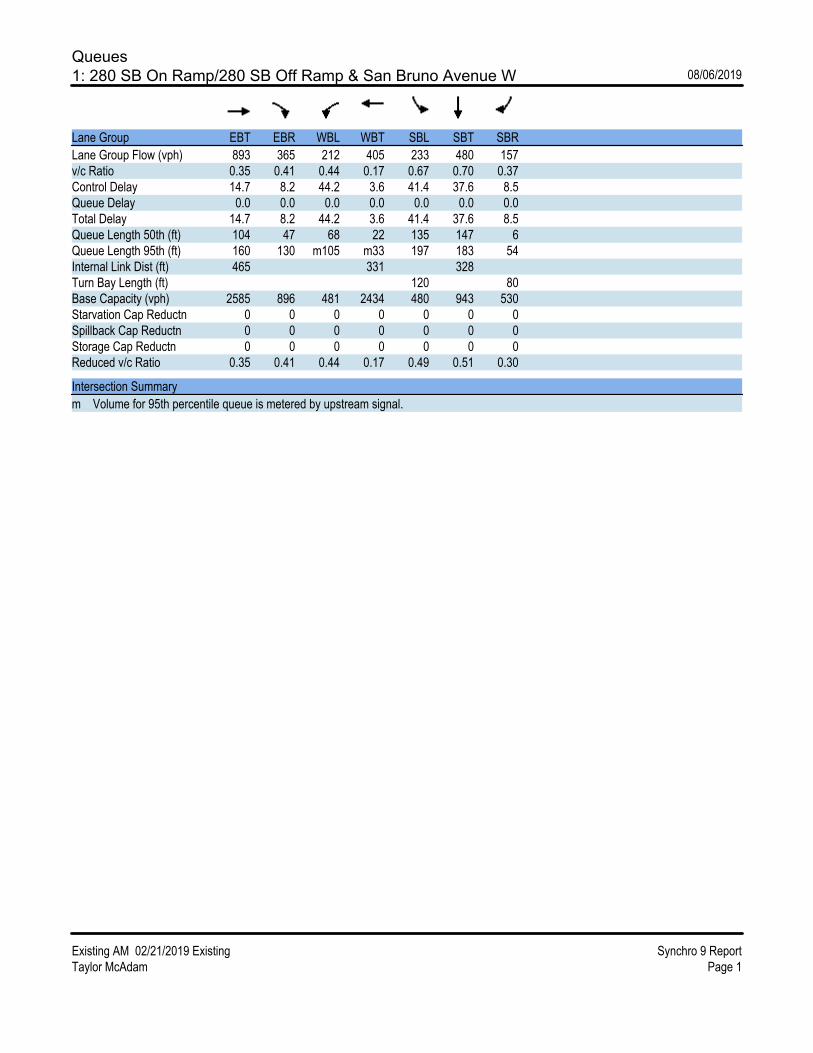
Queues
1: 280 SB On Ramp/280 SB Off Ramp & San Bruno Avenue W 08/06/2019
Existing AM 02/21/2019 Existing Synchro 9 Report
Taylor McAdam Page 1
Lane Group EBT EBR WBL WBT SBL SBT SBR
Lane Group Flow (vph) 893 365 212 405 233 480 157
v/c Ratio 0.35 0.41 0.44 0.17 0.67 0.70 0.37
Control Delay 14.7 8.2 44.2 3.6 41.4 37.6 8.5
Queue Delay 0.0 0.0 0.0 0.0 0.0 0.0 0.0
Total Delay 14.7 8.2 44.2 3.6 41.4 37.6 8.5
Queue Length 50th (ft) 104 47 68 22 135 147 6
Queue Length 95th (ft) 160 130 m105 m33 197 183 54
Internal Link Dist (ft) 465 331 328
Turn Bay Length (ft) 120 80
Base Capacity (vph) 2585 896 481 2434 480 943 530
Starvation Cap Reductn 0 0 0 0 0 0 0
Spillback Cap Reductn 0 0 0 0 0 0 0
Storage Cap Reductn 0 0 0 0 0 0 0
Reduced v/c Ratio 0.35 0.41 0.44 0.17 0.49 0.51 0.30
Intersection Summary
m Volume for 95th percentile queue is metered by upstream signal.

Queues
2: 280 NB Off Ramp/280 NB On Ramp & San Bruno Avenue W 08/06/2019
Existing AM 02/21/2019 Existing Synchro 9 Report
Taylor McAdam Page 2
Lane Group EBL EBT WBT WBR NBL NBT NBR
Lane Group Flow (vph) 328 881 492 264 104 379 342
v/c Ratio 1.35 0.41 0.33 0.33 0.22 0.85 0.82
Control Delay 213.2 4.8 18.4 5.1 24.9 48.9 46.5
Queue Delay 0.0 0.1 0.0 0.0 0.0 0.0 0.0
Total Delay 213.2 4.9 18.4 5.1 24.9 48.9 46.5
Queue Length 50th (ft) ~132 80 125 20 46 217 185
Queue Length 95th (ft) #220 93 78 31 85 #334 284
Internal Link Dist (ft) 331 999 438
Turn Bay Length (ft) 130 230 50
Base Capacity (vph) 243 2162 1494 804 541 516 484
Starvation Cap Reductn 0 344 0 0 0 0 0
Spillback Cap Reductn 0 0 0 0 0 0 0
Storage Cap Reductn 0 0 0 0 0 0 0
Reduced v/c Ratio 1.35 0.48 0.33 0.33 0.19 0.73 0.71
Intersection Summary
~ Volume exceeds capacity, queue is theoretically infinite.
Queue shown is maximum after two cycles.
# 95th percentile volume exceeds capacity, queue may be longer.
Queue shown is maximum after two cycles.

Queues
8: El Camino Real & 380 EB Off-Ramp/380 EB On-Ramp 08/06/2019
Existing AM 02/21/2019 Existing Synchro 9 Report
Taylor McAdam Page 3
Lane Group EBL EBT EBR NBT SBT SBR
Lane Group Flow (vph) 94 92 87 1644 1557 1140
v/c Ratio 0.72 0.57 0.54 0.42 0.37 0.80
Control Delay 81.6 40.6 38.2 3.6 1.9 8.3
Queue Delay 0.0 0.0 0.0 0.1 0.0 0.0
Total Delay 81.6 40.6 38.2 3.8 1.9 8.3
Queue Length 50th (ft) 75 36 30 43 53 157
Queue Length 95th (ft) 131 92 83 63 86 355
Internal Link Dist (ft) 1043 319 799
Turn Bay Length (ft) 520 500 500
Base Capacity (vph) 416 411 408 3889 4260 1432
Starvation Cap Reductn 0 0 0 988 0 0
Spillback Cap Reductn 0 0 0 0 0 0
Storage Cap Reductn 0 0 0 0 0 0
Reduced v/c Ratio 0.23 0.22 0.21 0.57 0.37 0.80
Intersection Summary

Queues
9: El Camino Real & 380 WB On-Ramp/380 WB Off-Ramp 08/06/2019
Existing AM 02/21/2019 Existing Synchro 9 Report
Taylor McAdam Page 4
Lane Group WBL WBR NBT NBR SBT SBR
Lane Group Flow (vph) 508 694 801 315 2155 241
v/c Ratio 0.85 0.67 0.26 0.31 0.56 0.20
Control Delay 61.7 28.0 10.6 2.5 7.3 1.0
Queue Delay 0.0 0.0 0.0 0.0 1.7 0.0
Total Delay 61.7 28.0 10.6 2.5 9.0 1.0
Queue Length 50th (ft) 198 194 111 3 221 0
Queue Length 95th (ft) 246 248 119 15 315 22
Internal Link Dist (ft) 799 345
Turn Bay Length (ft) 140 400 300
Base Capacity (vph) 1076 1397 3034 1025 3815 1210
Starvation Cap Reductn 0 0 0 0 1414 0
Spillback Cap Reductn 0 0 0 0 0 0
Storage Cap Reductn 0 0 0 0 0 0
Reduced v/c Ratio 0.47 0.50 0.26 0.31 0.90 0.20
Intersection Summary

Queues
1: 280 SB On Ramp/280 SB Off Ramp & San Bruno Avenue W 08/06/2019
Existing PM 02/22/2019 Existing Synchro 9 Report
Taylor McAdam Page 1
Lane Group EBT EBR WBL WBT SBL SBT SBR
Lane Group Flow (vph) 507 160 461 916 162 318 146
v/c Ratio 0.21 0.19 1.15 0.34 0.65 0.55 0.42
Control Delay 15.4 3.6 117.9 2.9 47.1 22.1 9.3
Queue Delay 0.0 0.0 0.0 0.1 0.0 0.0 0.0
Total Delay 15.4 3.6 117.9 3.0 47.1 22.1 9.3
Queue Length 50th (ft) 59 0 ~167 53 96 54 0
Queue Length 95th (ft) 94 37 m#263 m73 153 90 51
Internal Link Dist (ft) 465 331 328
Turn Bay Length (ft) 120 80
Base Capacity (vph) 2413 828 400 2682 394 833 463
Starvation Cap Reductn 0 0 0 535 0 0 0
Spillback Cap Reductn 0 0 0 0 0 0 0
Storage Cap Reductn 0 0 0 0 0 0 0
Reduced v/c Ratio 0.21 0.19 1.15 0.43 0.41 0.38 0.32
Intersection Summary
~ Volume exceeds capacity, queue is theoretically infinite.
Queue shown is maximum after two cycles.
# 95th percentile volume exceeds capacity, queue may be longer.
Queue shown is maximum after two cycles.
m Volume for 95th percentile queue is metered by upstream signal.

Queues
2: 280 NB Off Ramp/280 NB On Ramp & San Bruno Avenue W 08/06/2019
Existing PM 02/22/2019 Existing Synchro 9 Report
Taylor McAdam Page 2
Lane Group EBL EBT WBT WBR NBL NBT NBR
Lane Group Flow (vph) 160 549 1073 673 262 606 289
v/c Ratio 0.69 0.27 0.66 0.88 0.48 1.11 0.60
Control Delay 55.9 6.2 30.1 40.0 28.0 104.0 31.8
Queue Delay 0.0 0.0 0.0 0.0 0.0 0.0 0.0
Total Delay 55.9 6.2 30.1 40.0 28.0 104.0 31.8
Queue Length 50th (ft) 29 50 312 343 124 ~437 144
Queue Length 95th (ft) #94 64 365 #539 202 #660 233
Internal Link Dist (ft) 331 999 438
Turn Bay Length (ft) 130 230 50
Base Capacity (vph) 231 2025 1628 768 547 545 483
Starvation Cap Reductn 0 0 0 0 0 0 0
Spillback Cap Reductn 0 0 0 0 0 0 0
Storage Cap Reductn 0 0 0 0 0 0 0
Reduced v/c Ratio 0.69 0.27 0.66 0.88 0.48 1.11 0.60
Intersection Summary
~ Volume exceeds capacity, queue is theoretically infinite.
Queue shown is maximum after two cycles.
# 95th percentile volume exceeds capacity, queue may be longer.
Queue shown is maximum after two cycles.

Queues
8: El Camino Real & 380 EB Off-Ramp/380 EB On-Ramp 08/06/2019
Existing PM 02/22/2019 Existing Synchro 9 Report
Taylor McAdam Page 3
Lane Group EBL EBT EBR NBT SBT SBR
Lane Group Flow (vph) 240 227 222 2219 1514 741
v/c Ratio 0.91 0.77 0.75 0.59 0.38 0.54
Control Delay 96.8 58.9 56.2 6.0 7.2 2.8
Queue Delay 0.0 0.8 0.7 0.2 0.5 0.1
Total Delay 96.8 59.7 56.9 6.2 7.6 2.8
Queue Length 50th (ft) 245 165 152 95 183 38
Queue Length 95th (ft) 340 263 245 284 218 81
Internal Link Dist (ft) 1043 319 799
Turn Bay Length (ft) 520 500 500
Base Capacity (vph) 339 355 359 3754 4023 1363
Starvation Cap Reductn 0 0 0 668 0 75
Spillback Cap Reductn 0 24 24 0 1832 0
Storage Cap Reductn 0 0 0 0 0 0
Reduced v/c Ratio 0.71 0.69 0.66 0.72 0.69 0.58
Intersection Summary

Queues
9: El Camino Real & 380 WB On-Ramp/380 WB Off-Ramp 08/06/2019
Existing PM 02/22/2019 Existing Synchro 9 Report
Taylor McAdam Page 4
Lane Group WBL WBR NBT NBR SBT SBR
Lane Group Flow (vph) 500 1263 1634 331 1727 367
v/c Ratio 0.74 0.96 0.66 0.37 0.45 0.29
Control Delay 64.3 55.1 32.0 4.9 6.1 1.2
Queue Delay 0.0 0.0 0.2 0.0 0.1 0.3
Total Delay 64.3 55.1 32.2 4.9 6.2 1.5
Queue Length 50th (ft) 238 655 506 74 86 0
Queue Length 95th (ft) 303 #834 432 55 100 0
Internal Link Dist (ft) 799 345
Turn Bay Length (ft) 140 400 300
Base Capacity (vph) 693 1332 2473 893 3864 1264
Starvation Cap Reductn 0 0 0 0 766 414
Spillback Cap Reductn 0 0 188 0 0 0
Storage Cap Reductn 0 0 0 0 0 0
Reduced v/c Ratio 0.72 0.95 0.72 0.37 0.56 0.43
Intersection Summary
# 95th percentile volume exceeds capacity, queue may be longer.
Queue shown is maximum after two cycles.

Queues
1: 280 SB On Ramp/280 SB Off Ramp & San Bruno Avenue W 08/06/2019
Existing + Max Office AM 02/21/2019 Synchro 9 Report
Taylor McAdam Page 1
Lane Group EBT EBR WBL WBT SBL SBT SBR
Lane Group Flow (vph) 927 365 212 405 273 559 157
v/c Ratio 0.38 0.42 0.44 0.17 0.71 0.74 0.36
Control Delay 16.1 8.8 42.4 3.8 41.4 37.6 10.3
Queue Delay 0.0 0.0 0.0 0.0 0.0 0.0 0.0
Total Delay 16.1 8.8 42.4 3.8 41.4 37.6 10.3
Queue Length 50th (ft) 118 51 68 22 156 169 17
Queue Length 95th (ft) 167 130 m104 m33 232 216 65
Internal Link Dist (ft) 465 331 328
Turn Bay Length (ft) 120 80
Base Capacity (vph) 2468 865 481 2353 480 937 515
Starvation Cap Reductn 0 0 0 0 0 0 0
Spillback Cap Reductn 17 0 0 0 0 0 0
Storage Cap Reductn 0 0 0 0 0 0 0
Reduced v/c Ratio 0.38 0.42 0.44 0.17 0.57 0.60 0.30
Intersection Summary
m Volume for 95th percentile queue is metered by upstream signal.

Queues
2: 280 NB Off Ramp/280 NB On Ramp & San Bruno Avenue W 08/06/2019
Existing + Max Office AM 02/21/2019 Synchro 9 Report
Taylor McAdam Page 2
Lane Group EBL EBT WBT WBR NBL NBT NBR
Lane Group Flow (vph) 328 1031 492 264 104 492 458
v/c Ratio 1.35 0.51 0.37 0.35 0.19 0.98 0.95
Control Delay 212.8 8.3 21.2 5.6 23.3 66.8 61.2
Queue Delay 0.0 0.1 0.0 0.0 0.0 0.0 0.0
Total Delay 212.8 8.4 21.2 5.6 23.3 66.8 61.2
Queue Length 50th (ft) ~132 112 128 21 44 301 265
Queue Length 95th (ft) #220 132 83 32 85 #524 #466
Internal Link Dist (ft) 331 999 438
Turn Bay Length (ft) 130 230 50
Base Capacity (vph) 243 2005 1336 747 541 504 484
Starvation Cap Reductn 0 246 0 0 0 0 0
Spillback Cap Reductn 0 0 0 0 0 0 0
Storage Cap Reductn 0 0 0 0 0 0 0
Reduced v/c Ratio 1.35 0.59 0.37 0.35 0.19 0.98 0.95
Intersection Summary
~ Volume exceeds capacity, queue is theoretically infinite.
Queue shown is maximum after two cycles.
# 95th percentile volume exceeds capacity, queue may be longer.
Queue shown is maximum after two cycles.

Queues
8: El Camino Real & 380 EB Off-Ramp/380 EB On-Ramp 08/06/2019
Existing + Max Office AM 02/21/2019 Synchro 9 Report
Taylor McAdam Page 3
Lane Group EBL EBT EBR NBT SBT SBR
Lane Group Flow (vph) 120 122 123 1644 1964 1140
v/c Ratio 0.74 0.77 0.75 0.43 0.47 0.80
Control Delay 77.9 72.9 70.6 5.6 2.6 7.5
Queue Delay 0.0 0.1 0.1 0.2 0.0 0.0
Total Delay 77.9 73.0 70.7 5.7 2.6 7.5
Queue Length 50th (ft) 96 86 83 134 72 109
Queue Length 95th (ft) 156 151 146 198 160 287
Internal Link Dist (ft) 1043 319 799
Turn Bay Length (ft) 520 500 500
Base Capacity (vph) 416 376 387 3811 4167 1425
Starvation Cap Reductn 0 0 0 965 0 0
Spillback Cap Reductn 0 22 22 0 32 0
Storage Cap Reductn 0 0 0 0 0 0
Reduced v/c Ratio 0.29 0.34 0.34 0.58 0.47 0.80
Intersection Summary

Queues
9: El Camino Real & 380 WB On-Ramp/380 WB Off-Ramp 08/06/2019
Existing + Max Office AM 02/21/2019 Synchro 9 Report
Taylor McAdam Page 4
Lane Group WBL WBR NBT NBR SBT SBR
Lane Group Flow (vph) 871 747 801 315 2186 241
v/c Ratio 0.92 0.58 0.32 0.35 0.66 0.22
Control Delay 57.7 20.4 18.9 5.2 14.3 1.7
Queue Delay 0.0 0.0 0.0 0.0 10.2 0.0
Total Delay 57.7 20.4 18.9 5.2 24.5 1.7
Queue Length 50th (ft) 335 182 155 41 352 0
Queue Length 95th (ft) 398 232 206 108 447 30
Internal Link Dist (ft) 799 345
Turn Bay Length (ft) 140 400 300
Base Capacity (vph) 1076 1397 2522 906 3303 1080
Starvation Cap Reductn 0 0 0 0 1117 0
Spillback Cap Reductn 0 0 0 0 0 0
Storage Cap Reductn 0 0 0 0 0 0
Reduced v/c Ratio 0.81 0.53 0.32 0.35 1.00 0.22
Intersection Summary
Queues
1: 280 SB On Ramp/280 SB Off Ramp & San Bruno Avenue W 08/06/2019
Existing + MaxOffice PM 02/22/2019 Existing Synchro 9 Report
Taylor McAdam Page 1
Lane Group EBT EBR WBL WBT SBL SBT SBR
Lane Group Flow (vph) 508 160 538 922 165 319 149
v/c Ratio 0.21 0.19 1.34 0.34 0.65 0.55 0.42
Control Delay 15.5 3.6 193.7 2.8 47.1 22.4 9.2
Queue Delay 0.0 0.0 0.0 0.1 0.0 0.0 0.0
Total Delay 15.5 3.6 193.7 2.9 47.1 22.4 9.2
Queue Length 50th (ft) 60 0 ~217 50 98 55 0
Queue Length 95th (ft) 95 37 m#319 m69 156 91 51
Internal Link Dist (ft) 465 331 328
Turn Bay Length (ft) 120 80
Base Capacity (vph) 2404 825 400 2676 394 831 466
Starvation Cap Reductn 0 0 0 578 0 0 0
Spillback Cap Reductn 0 0 0 0 0 0 0
Storage Cap Reductn 0 0 0 0 0 0 0
Reduced v/c Ratio 0.21 0.19 1.34 0.44 0.42 0.38 0.32
Intersection Summary
~ Volume exceeds capacity, queue is theoretically infinite.
Queue shown is maximum after two cycles.
# 95th percentile volume exceeds capacity, queue may be longer.
Queue shown is maximum after two cycles.
m Volume for 95th percentile queue is metered by upstream signal.

Queues
2: 280 NB Off Ramp/280 NB On Ramp & San Bruno Avenue W 08/06/2019
Existing + MaxOffice PM 02/22/2019 Existing Synchro 9 Report
Taylor McAdam Page 2
Lane Group EBL EBT WBT WBR NBL NBT NBR
Lane Group Flow (vph) 160 557 1153 711 262 608 302
v/c Ratio 0.69 0.28 0.71 0.93 0.48 1.12 0.63
Control Delay 56.0 6.3 31.1 44.6 28.0 105.3 32.7
Queue Delay 0.0 0.0 0.0 0.0 0.0 0.0 0.0
Total Delay 56.0 6.3 31.1 44.6 28.0 105.3 32.7
Queue Length 50th (ft) 29 52 337 367 124 ~440 151
Queue Length 95th (ft) #94 66 m385 m#539 202 #664 246
Internal Link Dist (ft) 331 999 438
Turn Bay Length (ft) 130 230 50
Base Capacity (vph) 231 2025 1628 768 547 545 483
Starvation Cap Reductn 0 0 0 0 0 0 0
Spillback Cap Reductn 0 0 0 0 0 0 0
Storage Cap Reductn 0 0 0 0 0 0 0
Reduced v/c Ratio 0.69 0.28 0.71 0.93 0.48 1.12 0.63
Intersection Summary
~ Volume exceeds capacity, queue is theoretically infinite.
Queue shown is maximum after two cycles.
# 95th percentile volume exceeds capacity, queue may be longer.
Queue shown is maximum after two cycles.
m Volume for 95th percentile queue is metered by upstream signal.

Queues
8: El Camino Real & 380 EB Off-Ramp/380 EB On-Ramp 08/06/2019
Existing + MaxOffice PM 02/22/2019 Existing Synchro 9 Report
Taylor McAdam Page 3
Lane Group EBL EBT EBR NBT SBT SBR
Lane Group Flow (vph) 240 230 225 2384 1542 762
v/c Ratio 0.91 0.79 0.77 0.64 0.38 0.56
Control Delay 96.8 62.2 59.2 5.3 7.3 3.0
Queue Delay 0.0 0.9 0.7 0.3 0.5 0.1
Total Delay 96.8 63.0 60.0 5.7 7.9 3.1
Queue Length 50th (ft) 245 173 160 184 175 41
Queue Length 95th (ft) 340 273 253 245 233 87
Internal Link Dist (ft) 1043 319 799
Turn Bay Length (ft) 520 500 500
Base Capacity (vph) 339 352 356 3738 4023 1368
Starvation Cap Reductn 0 0 0 649 0 74
Spillback Cap Reductn 0 23 23 0 1849 0
Storage Cap Reductn 0 0 0 0 0 0
Reduced v/c Ratio 0.71 0.70 0.68 0.77 0.71 0.59
Intersection Summary
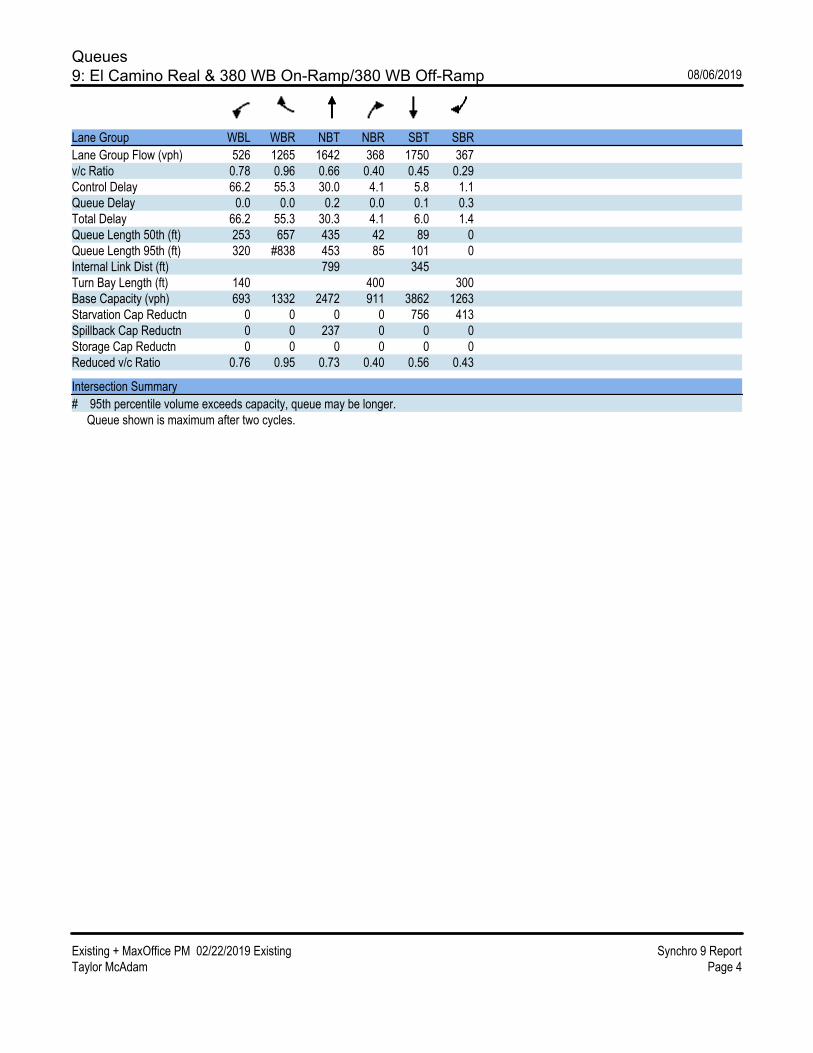
Queues
9: El Camino Real & 380 WB On-Ramp/380 WB Off-Ramp 08/06/2019
Existing + MaxOffice PM 02/22/2019 Existing Synchro 9 Report
Taylor McAdam Page 4
Lane Group WBL WBR NBT NBR SBT SBR
Lane Group Flow (vph) 526 1265 1642 368 1750 367
v/c Ratio 0.78 0.96 0.66 0.40 0.45 0.29
Control Delay 66.2 55.3 30.0 4.1 5.8 1.1
Queue Delay 0.0 0.0 0.2 0.0 0.1 0.3
Total Delay 66.2 55.3 30.3 4.1 6.0 1.4
Queue Length 50th (ft) 253 657 435 42 89 0
Queue Length 95th (ft) 320 #838 453 85 101 0
Internal Link Dist (ft) 799 345
Turn Bay Length (ft) 140 400 300
Base Capacity (vph) 693 1332 2472 911 3862 1263
Starvation Cap Reductn 0 0 0 0 756 413
Spillback Cap Reductn 0 0 237 0 0 0
Storage Cap Reductn 0 0 0 0 0 0
Reduced v/c Ratio 0.76 0.95 0.73 0.40 0.56 0.43
Intersection Summary
# 95th percentile volume exceeds capacity, queue may be longer.
Queue shown is maximum after two cycles.

Queues
1: 280 SB On Ramp/280 SB Off Ramp & San Bruno Avenue W 08/06/2019
Phase 1 AM 02/21/2019 Phase 1 Synchro 9 Report
Taylor McAdam Page 1
Lane Group EBT EBR WBL WBT SBL SBT SBR
Lane Group Flow (vph) 897 365 222 406 243 501 157
v/c Ratio 0.35 0.41 0.46 0.17 0.68 0.71 0.37
Control Delay 15.1 8.5 43.6 3.6 41.0 37.3 9.0
Queue Delay 0.0 0.0 0.0 0.0 0.0 0.0 0.0
Total Delay 15.1 8.5 43.6 3.6 41.0 37.3 9.0
Queue Length 50th (ft) 109 50 71 22 139 151 9
Queue Length 95th (ft) 161 133 m108 m33 206 191 58
Internal Link Dist (ft) 465 331 328
Turn Bay Length (ft) 120 80
Base Capacity (vph) 2547 884 481 2408 480 942 526
Starvation Cap Reductn 0 0 0 0 0 0 0
Spillback Cap Reductn 0 0 0 0 0 0 0
Storage Cap Reductn 0 0 0 0 0 0 0
Reduced v/c Ratio 0.35 0.41 0.46 0.17 0.51 0.53 0.30
Intersection Summary
m Volume for 95th percentile queue is metered by upstream signal.

Queues
2: 280 NB Off Ramp/280 NB On Ramp & San Bruno Avenue W 08/06/2019
Phase 1 AM 02/21/2019 Phase 1 Synchro 9 Report
Taylor McAdam Page 2
Lane Group EBL EBT WBT WBR NBL NBT NBR
Lane Group Flow (vph) 328 915 503 270 104 415 377
v/c Ratio 1.36 0.43 0.35 0.34 0.21 0.89 0.85
Control Delay 217.8 5.8 19.4 5.4 24.0 52.3 48.9
Queue Delay 0.0 0.1 0.0 0.0 0.0 0.0 0.0
Total Delay 217.8 5.9 19.4 5.4 24.0 52.3 48.9
Queue Length 50th (ft) ~133 88 132 36 44 236 202
Queue Length 95th (ft) #221 103 79 31 85 #404 #350
Internal Link Dist (ft) 331 999 438
Turn Bay Length (ft) 130 230 50
Base Capacity (vph) 241 2105 1436 786 541 512 484
Starvation Cap Reductn 0 304 0 0 0 0 0
Spillback Cap Reductn 0 0 0 0 0 0 0
Storage Cap Reductn 0 0 0 0 0 0 0
Reduced v/c Ratio 1.36 0.51 0.35 0.34 0.19 0.81 0.78
Intersection Summary
~ Volume exceeds capacity, queue is theoretically infinite.
Queue shown is maximum after two cycles.
# 95th percentile volume exceeds capacity, queue may be longer.
Queue shown is maximum after two cycles.

Queues
8: El Camino Real & 380 EB Off-Ramp/380 EB On-Ramp 08/06/2019
Phase 1 AM 02/21/2019 Phase 1 Synchro 9 Report
Taylor McAdam Page 7
Lane Group EBL EBT EBR NBT SBT SBR
Lane Group Flow (vph) 106 102 99 1668 1696 1144
v/c Ratio 0.74 0.64 0.61 0.43 0.40 0.80
Control Delay 81.0 52.2 50.1 5.1 2.0 8.4
Queue Delay 0.0 0.0 0.0 0.1 0.0 0.0
Total Delay 81.0 52.2 50.2 5.2 2.0 8.4
Queue Length 50th (ft) 85 56 50 129 60 149
Queue Length 95th (ft) 144 116 107 186 96 322
Internal Link Dist (ft) 1043 319 799
Turn Bay Length (ft) 520 500 500
Base Capacity (vph) 416 395 398 3857 4221 1429
Starvation Cap Reductn 0 0 0 942 0 0
Spillback Cap Reductn 0 6 6 0 0 0
Storage Cap Reductn 0 0 0 0 0 0
Reduced v/c Ratio 0.25 0.26 0.25 0.57 0.40 0.80
Intersection Summary
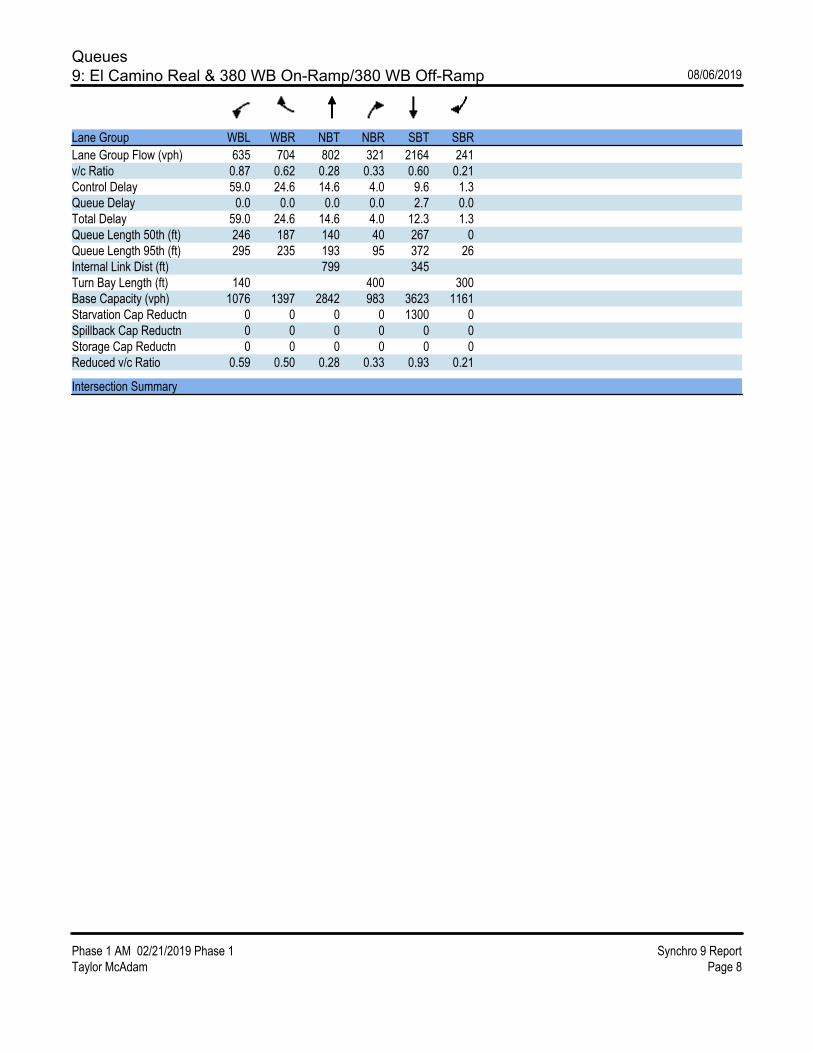
Queues
9: El Camino Real & 380 WB On-Ramp/380 WB Off-Ramp 08/06/2019
Phase 1 AM 02/21/2019 Phase 1 Synchro 9 Report
Taylor McAdam Page 8
Lane Group WBL WBR NBT NBR SBT SBR
Lane Group Flow (vph) 635 704 802 321 2164 241
v/c Ratio 0.87 0.62 0.28 0.33 0.60 0.21
Control Delay 59.0 24.6 14.6 4.0 9.6 1.3
Queue Delay 0.0 0.0 0.0 0.0 2.7 0.0
Total Delay 59.0 24.6 14.6 4.0 12.3 1.3
Queue Length 50th (ft) 246 187 140 40 267 0
Queue Length 95th (ft) 295 235 193 95 372 26
Internal Link Dist (ft) 799 345
Turn Bay Length (ft) 140 400 300
Base Capacity (vph) 1076 1397 2842 983 3623 1161
Starvation Cap Reductn 0 0 0 0 1300 0
Spillback Cap Reductn 0 0 0 0 0 0
Storage Cap Reductn 0 0 0 0 0 0
Reduced v/c Ratio 0.59 0.50 0.28 0.33 0.93 0.21
Intersection Summary
Queues
1: 280 SB On Ramp/280 SB Off Ramp & San Bruno Avenue W 08/06/2019
Phase 1 PM 02/22/2019 Existing Synchro 9 Report
Taylor McAdam Page 1
Lane Group EBT EBR WBL WBT SBL SBT SBR
Lane Group Flow (vph) 508 160 538 922 165 319 149
v/c Ratio 0.21 0.19 1.34 0.34 0.65 0.55 0.42
Control Delay 15.5 3.6 193.7 2.8 47.1 22.4 9.2
Queue Delay 0.0 0.0 0.0 0.1 0.0 0.0 0.0
Total Delay 15.5 3.6 193.7 2.9 47.1 22.4 9.2
Queue Length 50th (ft) 60 0 ~217 50 98 55 0
Queue Length 95th (ft) 95 37 m#319 m69 156 91 51
Internal Link Dist (ft) 465 331 328
Turn Bay Length (ft) 120 80
Base Capacity (vph) 2404 825 400 2676 394 831 466
Starvation Cap Reductn 0 0 0 578 0 0 0
Spillback Cap Reductn 0 0 0 0 0 0 0
Storage Cap Reductn 0 0 0 0 0 0 0
Reduced v/c Ratio 0.21 0.19 1.34 0.44 0.42 0.38 0.32
Intersection Summary
~ Volume exceeds capacity, queue is theoretically infinite.
Queue shown is maximum after two cycles.
# 95th percentile volume exceeds capacity, queue may be longer.
Queue shown is maximum after two cycles.
m Volume for 95th percentile queue is metered by upstream signal.
Queues
2: 280 NB Off Ramp/280 NB On Ramp & San Bruno Avenue W 08/06/2019
Phase 1 PM 02/22/2019 Existing Synchro 9 Report
Taylor McAdam Page 2
Lane Group EBL EBT WBT WBR NBL NBT NBR
Lane Group Flow (vph) 160 557 1153 711 262 608 302
v/c Ratio 0.69 0.28 0.71 0.93 0.48 1.12 0.63
Control Delay 56.0 6.3 31.1 44.6 28.0 105.3 32.7
Queue Delay 0.0 0.0 0.0 0.0 0.0 0.0 0.0
Total Delay 56.0 6.3 31.1 44.6 28.0 105.3 32.7
Queue Length 50th (ft) 29 52 337 367 124 ~440 151
Queue Length 95th (ft) #94 66 m385 m#539 202 #664 246
Internal Link Dist (ft) 331 999 438
Turn Bay Length (ft) 130 230 50
Base Capacity (vph) 231 2025 1628 768 547 545 483
Starvation Cap Reductn 0 0 0 0 0 0 0
Spillback Cap Reductn 0 0 0 0 0 0 0
Storage Cap Reductn 0 0 0 0 0 0 0
Reduced v/c Ratio 0.69 0.28 0.71 0.93 0.48 1.12 0.63
Intersection Summary
~ Volume exceeds capacity, queue is theoretically infinite.
Queue shown is maximum after two cycles.
# 95th percentile volume exceeds capacity, queue may be longer.
Queue shown is maximum after two cycles.
m Volume for 95th percentile queue is metered by upstream signal.

Queues
8: El Camino Real & 380 EB Off-Ramp/380 EB On-Ramp 08/06/2019
Phase 1 PM 02/22/2019 Existing Synchro 9 Report
Taylor McAdam Page 3
Lane Group EBL EBT EBR NBT SBT SBR
Lane Group Flow (vph) 240 230 225 2384 1542 762
v/c Ratio 0.91 0.79 0.77 0.64 0.38 0.56
Control Delay 96.8 62.2 59.2 5.3 7.3 3.0
Queue Delay 0.0 0.9 0.7 0.3 0.5 0.1
Total Delay 96.8 63.0 60.0 5.7 7.9 3.1
Queue Length 50th (ft) 245 173 160 184 175 41
Queue Length 95th (ft) 340 273 253 245 233 87
Internal Link Dist (ft) 1043 319 799
Turn Bay Length (ft) 520 500 500
Base Capacity (vph) 339 352 356 3738 4023 1368
Starvation Cap Reductn 0 0 0 649 0 74
Spillback Cap Reductn 0 23 23 0 1849 0
Storage Cap Reductn 0 0 0 0 0 0
Reduced v/c Ratio 0.71 0.70 0.68 0.77 0.71 0.59
Intersection Summary

Queues
9: El Camino Real & 380 WB On-Ramp/380 WB Off-Ramp 08/06/2019
Phase 1 PM 02/22/2019 Existing Synchro 9 Report
Taylor McAdam Page 4
Lane Group WBL WBR NBT NBR SBT SBR
Lane Group Flow (vph) 526 1265 1642 368 1750 367
v/c Ratio 0.78 0.96 0.66 0.40 0.45 0.29
Control Delay 66.2 55.3 30.0 4.1 5.8 1.1
Queue Delay 0.0 0.0 0.2 0.0 0.1 0.3
Total Delay 66.2 55.3 30.3 4.1 6.0 1.4
Queue Length 50th (ft) 253 657 435 42 89 0
Queue Length 95th (ft) 320 #838 453 85 101 0
Internal Link Dist (ft) 799 345
Turn Bay Length (ft) 140 400 300
Base Capacity (vph) 693 1332 2472 911 3862 1263
Starvation Cap Reductn 0 0 0 0 756 413
Spillback Cap Reductn 0 0 237 0 0 0
Storage Cap Reductn 0 0 0 0 0 0
Reduced v/c Ratio 0.76 0.95 0.73 0.40 0.56 0.43
Intersection Summary
# 95th percentile volume exceeds capacity, queue may be longer.
Queue shown is maximum after two cycles.
Queues
1: 280 SB On Ramp/280 SB Off Ramp & San Bruno Avenue W 08/06/2019
2040 No Project AM 02/21/2019 AM Peak Synchro 9 Report
Taylor McAdam Page 1
Lane Group EBT EBR WBL WBT SBL SBT SBR
Lane Group Flow (vph) 989 368 337 547 260 537 161
v/c Ratio 0.43 0.47 0.56 0.23 0.68 0.72 0.36
Control Delay 18.4 13.6 41.6 4.0 40.3 36.6 9.4
Queue Delay 0.0 0.0 0.0 0.0 0.0 0.0 0.0
Total Delay 18.4 13.6 41.6 4.0 40.3 36.6 9.4
Queue Length 50th (ft) 135 82 108 27 148 162 14
Queue Length 95th (ft) 195 182 m152 37 217 202 61
Internal Link Dist (ft) 465 331 328
Turn Bay Length (ft) 120 80
Base Capacity (vph) 2314 789 597 2364 498 982 538
Starvation Cap Reductn 0 0 0 0 0 0 0
Spillback Cap Reductn 0 0 0 0 0 0 0
Storage Cap Reductn 0 0 0 0 0 0 0
Reduced v/c Ratio 0.43 0.47 0.56 0.23 0.52 0.55 0.30
Intersection Summary
m Volume for 95th percentile queue is metered by upstream signal.

Queues
2: 280 NB Off Ramp/280 NB On Ramp & San Bruno Avenue W 08/06/2019
2040 No Project AM 02/21/2019 AM Peak Synchro 9 Report
Taylor McAdam Page 2
Lane Group EBL EBT WBT WBR NBL NBT NBR
Lane Group Flow (vph) 397 887 732 268 130 445 404
v/c Ratio 0.74 0.45 0.58 0.38 0.24 0.85 0.82
Control Delay 37.1 4.0 18.2 3.6 21.5 43.3 41.1
Queue Delay 0.0 0.1 0.0 0.0 0.0 0.0 0.0
Total Delay 37.1 4.0 18.2 3.6 21.5 43.3 41.1
Queue Length 50th (ft) 119 73 119 16 54 248 212
Queue Length 95th (ft) #175 86 125 25 92 358 312
Internal Link Dist (ft) 331 999 438
Turn Bay Length (ft) 130 230 50
Base Capacity (vph) 534 1980 1273 713 653 619 584
Starvation Cap Reductn 0 143 0 0 0 0 0
Spillback Cap Reductn 0 0 0 0 0 0 0
Storage Cap Reductn 0 0 0 0 0 0 0
Reduced v/c Ratio 0.74 0.48 0.58 0.38 0.20 0.72 0.69
Intersection Summary
# 95th percentile volume exceeds capacity, queue may be longer.
Queue shown is maximum after two cycles.
Queues
8: El Camino Real & 380 EB Off-Ramp/380 EB On-Ramp 08/06/2019
2040 No Project AM 02/21/2019 AM Peak Synchro 9 Report
Taylor McAdam Page 6
Lane Group EBL EBT EBR NBT SBT SBR
Lane Group Flow (vph) 159 153 145 2808 1564 1606
v/c Ratio 1.10 0.94 0.69 0.71 0.37 1.12
Control Delay 156.0 100.3 40.0 5.3 2.0 77.8
Queue Delay 0.0 0.0 0.0 0.3 0.0 0.0
Total Delay 156.0 100.3 40.0 5.6 2.0 77.8
Queue Length 50th (ft) ~147 103 44 200 60 ~1302
Queue Length 95th (ft) #294 #251 #137 265 69 #1572
Internal Link Dist (ft) 1043 319 799
Turn Bay Length (ft) 520 500 500
Base Capacity (vph) 144 162 210 3933 4221 1429
Starvation Cap Reductn 0 0 0 488 0 0
Spillback Cap Reductn 0 0 0 0 12 0
Storage Cap Reductn 0 0 0 0 0 0
Reduced v/c Ratio 1.10 0.94 0.69 0.82 0.37 1.12
Intersection Summary
~ Volume exceeds capacity, queue is theoretically infinite.
Queue shown is maximum after two cycles.
# 95th percentile volume exceeds capacity, queue may be longer.
Queue shown is maximum after two cycles.

Queues
9: El Camino Real & 380 WB On-Ramp/380 WB Off-Ramp 08/06/2019
2040 No Project AM 02/21/2019 AM Peak Synchro 9 Report
Taylor McAdam Page 7
Lane Group WBL WBR NBT NBR SBT SBR
Lane Group Flow (vph) 515 701 1144 1000 2216 309
v/c Ratio 0.78 0.84 0.34 0.75 0.60 0.26
Control Delay 54.3 42.1 11.0 6.2 8.7 1.2
Queue Delay 0.2 0.0 0.0 0.4 2.3 0.6
Total Delay 54.5 42.1 11.0 6.6 11.0 1.8
Queue Length 50th (ft) 195 230 154 53 261 0
Queue Length 95th (ft) 241 294 m194 m117 360 26
Internal Link Dist (ft) 799 345
Turn Bay Length (ft) 140 400 300
Base Capacity (vph) 833 963 3405 1334 3724 1205
Starvation Cap Reductn 0 0 0 66 1321 544
Spillback Cap Reductn 44 0 0 0 108 0
Storage Cap Reductn 0 0 0 0 0 0
Reduced v/c Ratio 0.65 0.73 0.34 0.79 0.92 0.47
Intersection Summary
m Volume for 95th percentile queue is metered by upstream signal.
Queues
1: 280 SB On Ramp/280 SB Off Ramp & San Bruno Avenue W 08/06/2019
2040 No Project 02/22/2019 PM Peak Synchro 9 Report
Taylor McAdam Page 1
Lane Group EBT EBR WBL WBT SBL SBT SBR
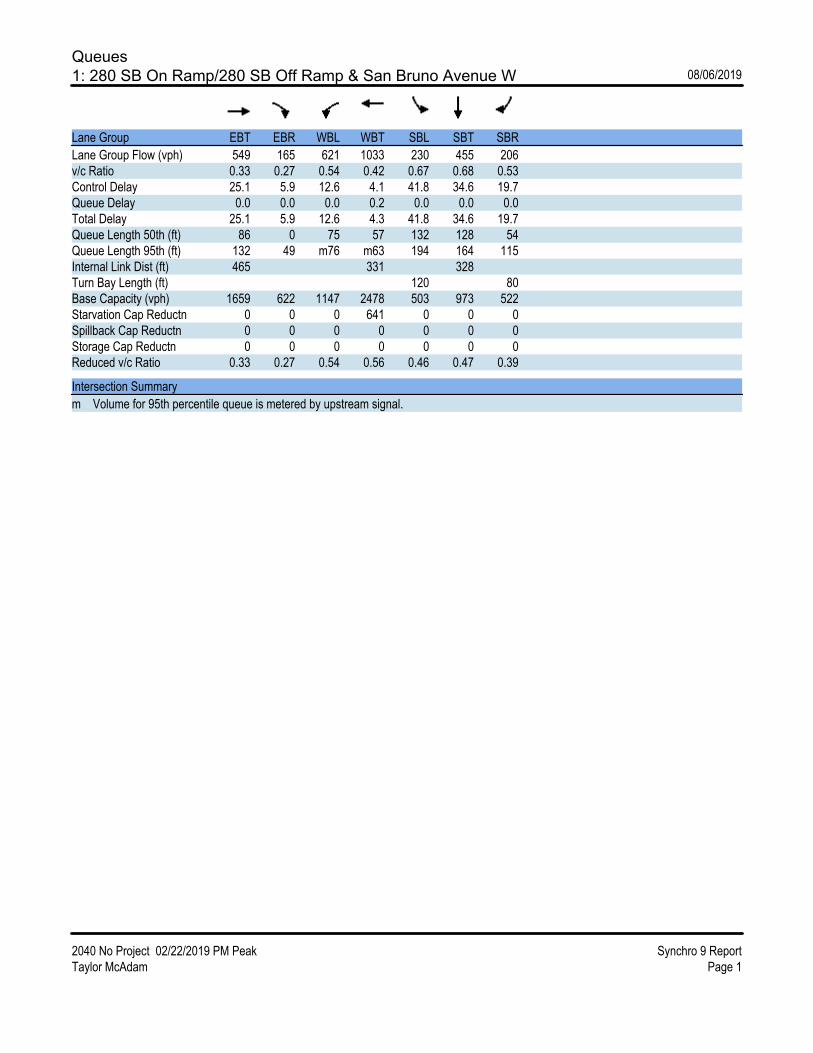
Lane Group Flow (vph) 549 165 621 1033 230 455 206
v/c Ratio 0.33 0.27 0.54 0.42 0.67 0.68 0.53
Control Delay 25.1 5.9 12.6 4.1 41.8 34.6 19.7
Queue Delay 0.0 0.0 0.0 0.2 0.0 0.0 0.0
Total Delay 25.1 5.9 12.6 4.3 41.8 34.6 19.7
Queue Length 50th (ft) 86 0 75 57 132 128 54
Queue Length 95th (ft) 132 49 m76 m63 194 164 115
Internal Link Dist (ft) 465 331 328
Turn Bay Length (ft) 120 80
Base Capacity (vph) 1659 622 1147 2478 503 973 522
Starvation Cap Reductn 0 0 0 641 0 0 0
Spillback Cap Reductn 0 0 0 0 0 0 0
Storage Cap Reductn 0 0 0 0 0 0 0
Reduced v/c Ratio 0.33 0.27 0.54 0.56 0.46 0.47 0.39
Intersection Summary
m Volume for 95th percentile queue is metered by upstream signal.

Queues
2: 280 NB Off Ramp/280 NB On Ramp & San Bruno Avenue W 08/06/2019
2040 No Project 02/22/2019 PM Peak Synchro 9 Report
Taylor McAdam Page 2
Lane Group EBL EBT WBT WBR NBL NBT NBR
Lane Group Flow (vph) 174 783 1293 674 303 940 518
v/c Ratio 1.13 0.52 1.09 1.16 0.38 1.19 0.74
Control Delay 144.9 16.6 77.4 110.6 17.4 123.9 27.5
Queue Delay 0.0 1.2 0.0 0.0 0.0 0.0 0.0
Total Delay 144.9 17.8 77.4 110.6 17.4 123.9 27.5
Queue Length 50th (ft) ~40 233 ~444 ~429 113 ~716 243
Queue Length 95th (ft) #130 299 m#540 m#536 180 #969 382
Internal Link Dist (ft) 331 999 438
Turn Bay Length (ft) 130 230 50
Base Capacity (vph) 154 1509 1191 580 792 789 699
Starvation Cap Reductn 0 467 0 0 0 0 0
Spillback Cap Reductn 0 0 0 0 0 0 0
Storage Cap Reductn 0 0 0 0 0 0 0
Reduced v/c Ratio 1.13 0.75 1.09 1.16 0.38 1.19 0.74
Intersection Summary
~ Volume exceeds capacity, queue is theoretically infinite.
Queue shown is maximum after two cycles.
# 95th percentile volume exceeds capacity, queue may be longer.
Queue shown is maximum after two cycles.
m Volume for 95th percentile queue is metered by upstream signal.

Queues
8: El Camino Real & 380 EB Off-Ramp/380 EB On-Ramp 08/06/2019
2040 No Project 02/22/2019 PM Peak Synchro 9 Report
Taylor McAdam Page 7
Lane Group EBL EBT EBR NBT SBT SBR
Lane Group Flow (vph) 286 275 260 2895 1979 884
v/c Ratio 0.90 0.89 0.86 0.80 0.51 0.64
Control Delay 88.4 83.9 78.6 23.7 2.6 3.7
Queue Delay 0.0 0.2 0.2 5.0 1.8 0.6
Total Delay 88.4 84.1 78.7 28.7 4.4 4.4
Queue Length 50th (ft) 290 270 242 688 39 0
Queue Length 95th (ft) 381 368 332 834 218 714
Internal Link Dist (ft) 1043 319 799
Turn Bay Length (ft) 520 500 500
Base Capacity (vph) 423 401 395 3628 3861 1374
Starvation Cap Reductn 0 0 0 675 929 191
Spillback Cap Reductn 0 6 6 0 1642 0
Storage Cap Reductn 0 0 0 0 0 0
Reduced v/c Ratio 0.68 0.70 0.67 0.98 0.89 0.75
Intersection Summary

Queues
9: El Camino Real & 380 WB On-Ramp/380 WB Off-Ramp 08/06/2019
2040 No Project 02/22/2019 PM Peak Synchro 9 Report
Taylor McAdam Page 8
Lane Group WBL WBR NBT NBR SBT SBR
Lane Group Flow (vph) 656 1271 1875 865 2177 500
v/c Ratio 0.43 0.93 0.79 0.75 0.83 0.51
Control Delay 30.3 47.8 37.4 8.2 22.3 3.6
Queue Delay 0.0 0.0 0.4 0.1 3.0 0.7
Total Delay 30.3 47.8 37.8 8.3 25.3 4.3
Queue Length 50th (ft) 221 625 499 99 378 6
Queue Length 95th (ft) 274 755 616 335 373 72
Internal Link Dist (ft) 799 345
Turn Bay Length (ft) 140 400 300
Base Capacity (vph) 1557 1412 2366 1156 2626 984
Starvation Cap Reductn 0 0 0 13 339 211
Spillback Cap Reductn 9 0 148 0 7 0
Storage Cap Reductn 0 0 0 0 0 0
Reduced v/c Ratio 0.42 0.90 0.85 0.76 0.95 0.65
Intersection Summary

Queues
1: 280 SB On Ramp/280 SB Off Ramp & San Bruno Avenue W 08/06/2019
2040 Max Office 02/21/2019 AM Peak Synchro 9 Report
Taylor McAdam Page 1
Lane Group EBT EBR WBL WBT SBL SBT SBR
Lane Group Flow (vph) 1024 368 337 547 298 618 161
v/c Ratio 0.47 0.49 0.56 0.24 0.72 0.76 0.35
Control Delay 20.0 14.5 38.7 4.1 40.1 36.7 10.9
Queue Delay 0.0 0.0 0.0 0.0 0.0 0.0 0.0
Total Delay 20.0 14.5 38.7 4.1 40.1 36.7 10.9
Queue Length 50th (ft) 148 87 108 27 169 186 21
Queue Length 95th (ft) 204 182 m152 m37 251 238 72
Internal Link Dist (ft) 465 331 328
Turn Bay Length (ft) 120 80
Base Capacity (vph) 2199 756 597 2284 498 977 525
Starvation Cap Reductn 0 0 0 0 0 0 0
Spillback Cap Reductn 4 0 0 0 0 0 0
Storage Cap Reductn 0 0 0 0 0 0 0
Reduced v/c Ratio 0.47 0.49 0.56 0.24 0.60 0.63 0.31
Intersection Summary
m Volume for 95th percentile queue is metered by upstream signal.

Queues
2: 280 NB Off Ramp/280 NB On Ramp & San Bruno Avenue W 08/06/2019
2040 Max Office 02/21/2019 AM Peak Synchro 9 Report
Taylor McAdam Page 2
Lane Group EBL EBT WBT WBR NBL NBT NBR
Lane Group Flow (vph) 397 1036 732 268 130 562 516
v/c Ratio 0.74 0.57 0.67 0.41 0.20 0.95 0.91
Control Delay 37.1 7.2 30.9 6.5 19.5 55.1 48.4
Queue Delay 0.0 0.1 0.0 0.0 0.0 0.0 0.0
Total Delay 37.1 7.2 30.9 6.5 19.5 55.1 48.4
Queue Length 50th (ft) 120 106 192 8 50 328 282
Queue Length 95th (ft) #176 124 255 64 92 #557 #484
Internal Link Dist (ft) 331 999 438
Turn Bay Length (ft) 130 230 50
Base Capacity (vph) 534 1804 1096 648 653 607 584
Starvation Cap Reductn 0 63 0 0 0 0 0
Spillback Cap Reductn 0 0 0 0 0 0 0
Storage Cap Reductn 0 0 0 0 0 0 0
Reduced v/c Ratio 0.74 0.60 0.67 0.41 0.20 0.93 0.88
Intersection Summary
# 95th percentile volume exceeds capacity, queue may be longer.
Queue shown is maximum after two cycles.
Queues
8: El Camino Real & 380 EB Off-Ramp/380 EB On-Ramp 08/06/2019
2040 Max Office 02/21/2019 AM Peak Synchro 9 Report
Taylor McAdam Page 6
Lane Group EBL EBT EBR NBT SBT SBR
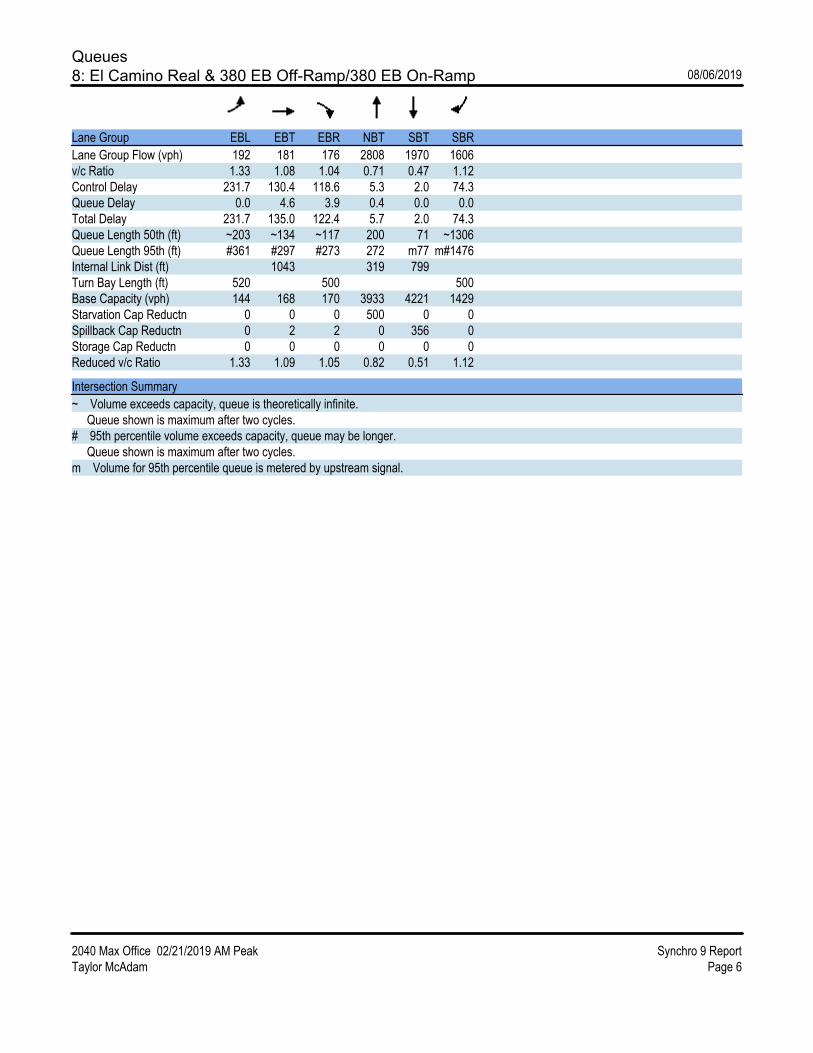
Lane Group Flow (vph) 192 181 176 2808 1970 1606
v/c Ratio 1.33 1.08 1.04 0.71 0.47 1.12
Control Delay 231.7 130.4 118.6 5.3 2.0 74.3
Queue Delay 0.0 4.6 3.9 0.4 0.0 0.0
Total Delay 231.7 135.0 122.4 5.7 2.0 74.3
Queue Length 50th (ft) ~203 ~134 ~117 200 71 ~1306
Queue Length 95th (ft) #361 #297 #273 272 m77 m#1476
Internal Link Dist (ft) 1043 319 799
Turn Bay Length (ft) 520 500 500
Base Capacity (vph) 144 168 170 3933 4221 1429
Starvation Cap Reductn 0 0 0 500 0 0
Spillback Cap Reductn 0 2 2 0 356 0
Storage Cap Reductn 0 0 0 0 0 0
Reduced v/c Ratio 1.33 1.09 1.05 0.82 0.51 1.12
Intersection Summary
~ Volume exceeds capacity, queue is theoretically infinite.
Queue shown is maximum after two cycles.
# 95th percentile volume exceeds capacity, queue may be longer.
Queue shown is maximum after two cycles.
m Volume for 95th percentile queue is metered by upstream signal.
Queues
9: El Camino Real & 380 WB On-Ramp/380 WB Off-Ramp 08/06/2019
2040 Max Office 02/21/2019 AM Peak Synchro 9 Report
Taylor McAdam Page 7
Lane Group WBL WBR NBT NBR SBT SBR
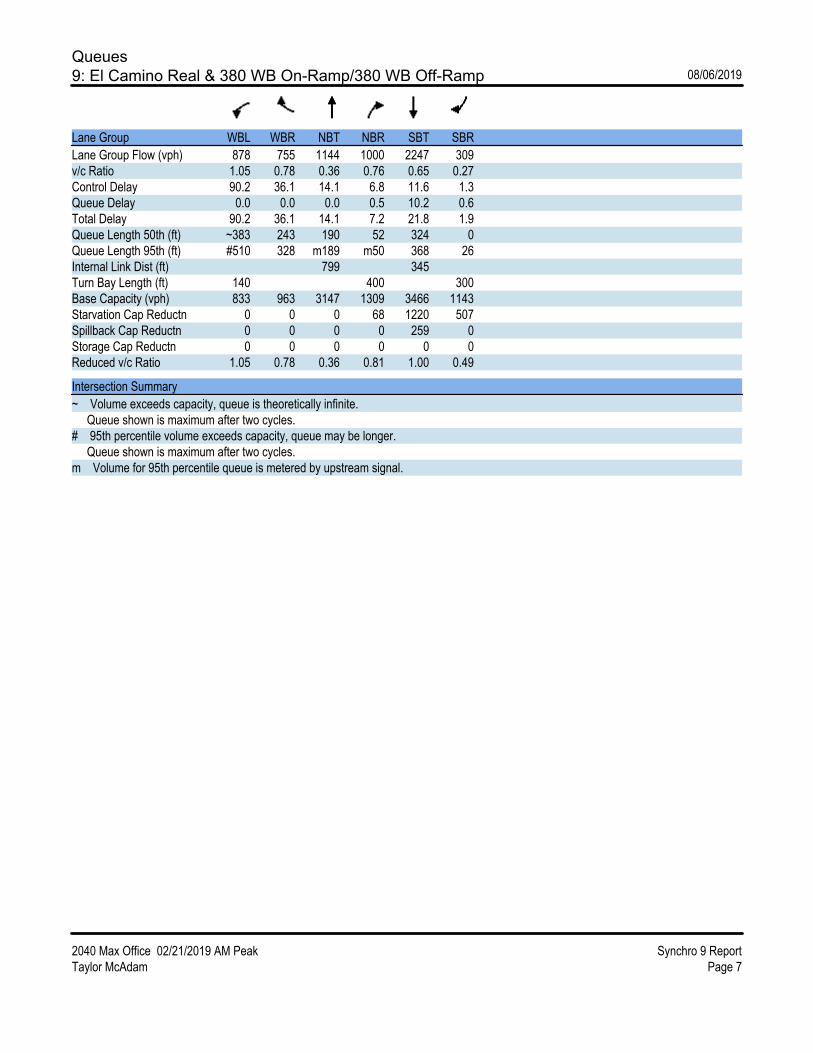
Lane Group Flow (vph) 878 755 1144 1000 2247 309
v/c Ratio 1.05 0.78 0.36 0.76 0.65 0.27
Control Delay 90.2 36.1 14.1 6.8 11.6 1.3
Queue Delay 0.0 0.0 0.0 0.5 10.2 0.6
Total Delay 90.2 36.1 14.1 7.2 21.8 1.9
Queue Length 50th (ft) ~383 243 190 52 324 0
Queue Length 95th (ft) #510 328 m189 m50 368 26
Internal Link Dist (ft) 799 345
Turn Bay Length (ft) 140 400 300
Base Capacity (vph) 833 963 3147 1309 3466 1143
Starvation Cap Reductn 0 0 0 68 1220 507
Spillback Cap Reductn 0 0 0 0 259 0
Storage Cap Reductn 0 0 0 0 0 0
Reduced v/c Ratio 1.05 0.78 0.36 0.81 1.00 0.49
Intersection Summary
~ Volume exceeds capacity, queue is theoretically infinite.
Queue shown is maximum after two cycles.
# 95th percentile volume exceeds capacity, queue may be longer.
Queue shown is maximum after two cycles.
m Volume for 95th percentile queue is metered by upstream signal.
Queues
1: 280 SB On Ramp/280 SB Off Ramp & San Bruno Avenue W 08/06/2019
2040 PM Max Office 02/22/2019 PM Peak Synchro 9 Report
Taylor McAdam Page 1
Lane Group EBT EBR WBL WBT SBL SBT SBR
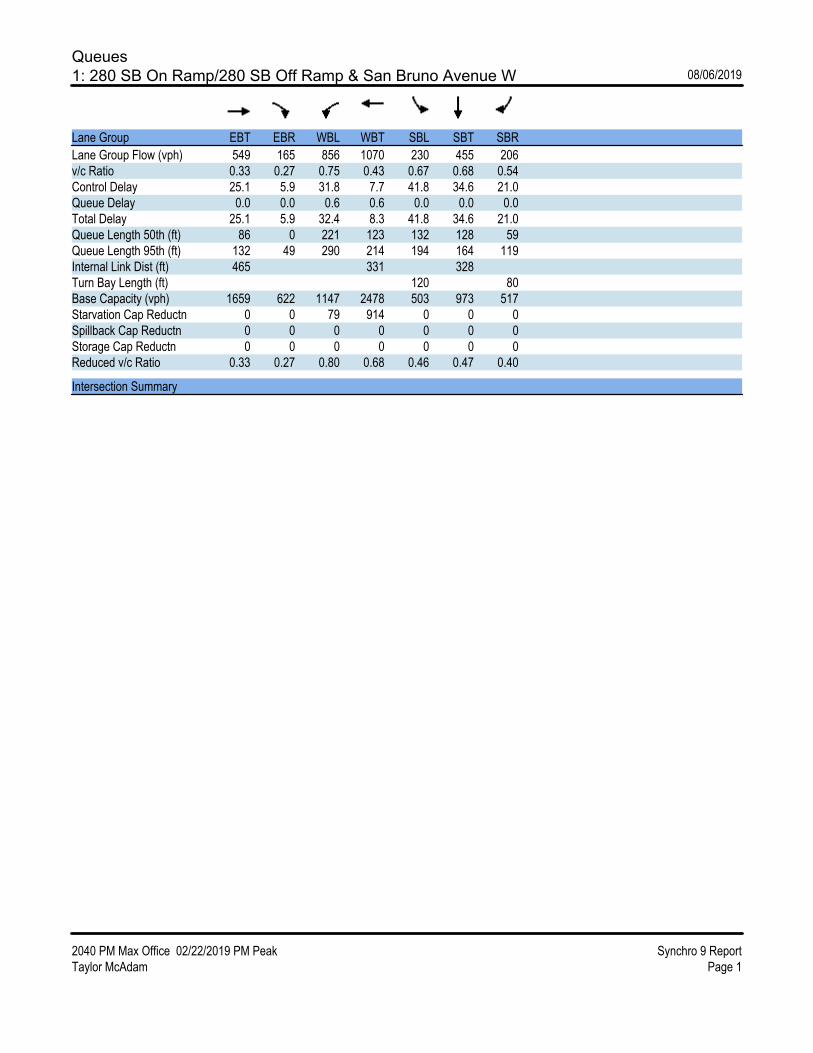
Lane Group Flow (vph) 549 165 856 1070 230 455 206
v/c Ratio 0.33 0.27 0.75 0.43 0.67 0.68 0.54
Control Delay 25.1 5.9 31.8 7.7 41.8 34.6 21.0
Queue Delay 0.0 0.0 0.6 0.6 0.0 0.0 0.0
Total Delay 25.1 5.9 32.4 8.3 41.8 34.6 21.0
Queue Length 50th (ft) 86 0 221 123 132 128 59
Queue Length 95th (ft) 132 49 290 214 194 164 119
Internal Link Dist (ft) 465 331 328
Turn Bay Length (ft) 120 80
Base Capacity (vph) 1659 622 1147 2478 503 973 517
Starvation Cap Reductn 0 0 79 914 0 0 0
Spillback Cap Reductn 0 0 0 0 0 0 0
Storage Cap Reductn 0 0 0 0 0 0 0
Reduced v/c Ratio 0.33 0.27 0.80 0.68 0.46 0.47 0.40
Intersection Summary
Queues
2: 280 NB Off Ramp/280 NB On Ramp & San Bruno Avenue W 08/06/2019
2040 PM Max Office 02/22/2019 PM Peak Synchro 9 Report
Taylor McAdam Page 2
Lane Group EBL EBT WBT WBR NBL NBT NBR
Lane Group Flow (vph) 174 783 1563 809 303 940 518
v/c Ratio 1.31 0.47 1.11 1.22 0.39 1.21 0.75
Control Delay 229.5 25.3 99.3 144.2 24.8 136.8 37.1
Queue Delay 0.0 2.5 0.0 0.0 0.0 0.0 0.0
Total Delay 229.5 27.8 99.3 144.2 24.8 136.8 37.1
Queue Length 50th (ft) ~96 234 ~794 ~792 172 ~1057 370
Queue Length 95th (ft) #173 291 #934 #1043 252 #1336 528
Internal Link Dist (ft) 331 999 438
Turn Bay Length (ft) 130 230 50
Base Capacity (vph) 133 1649 1402 663 783 780 691
Starvation Cap Reductn 0 709 0 0 0 0 0
Spillback Cap Reductn 0 0 0 0 0 0 0
Storage Cap Reductn 0 0 0 0 0 0 0
Reduced v/c Ratio 1.31 0.83 1.11 1.22 0.39 1.21 0.75
Intersection Summary
~ Volume exceeds capacity, queue is theoretically infinite.
Queue shown is maximum after two cycles.
# 95th percentile volume exceeds capacity, queue may be longer.
Queue shown is maximum after two cycles.
Queues
8: El Camino Real & 380 EB Off-Ramp/380 EB On-Ramp 08/06/2019
2040 PM Max Office 02/22/2019 PM Peak Synchro 9 Report
Taylor McAdam Page 6
Lane Group EBL EBT EBR NBT SBT SBR
Lane Group Flow (vph) 286 275 260 3342 1979 961
v/c Ratio 0.90 0.89 0.86 0.93 0.51 0.69
Control Delay 88.4 83.9 78.6 23.3 2.4 5.6
Queue Delay 0.0 0.2 0.2 45.0 2.1 0.8
Total Delay 88.4 84.1 78.7 68.3 4.5 6.4
Queue Length 50th (ft) 290 270 242 745 38 0
Queue Length 95th (ft) 381 368 332 m#1248 204 828
Internal Link Dist (ft) 1043 319 799
Turn Bay Length (ft) 520 500 500
Base Capacity (vph) 423 401 395 3592 3861 1393
Starvation Cap Reductn 0 0 0 663 944 183
Spillback Cap Reductn 0 6 6 0 1674 0
Storage Cap Reductn 0 0 0 0 0 0
Reduced v/c Ratio 0.68 0.70 0.67 1.14 0.90 0.79
Intersection Summary
# 95th percentile volume exceeds capacity, queue may be longer.
Queue shown is maximum after two cycles.
m Volume for 95th percentile queue is metered by upstream signal.
Queues
9: El Camino Real & 380 WB On-Ramp/380 WB Off-Ramp 08/06/2019
2040 PM Max Office 02/22/2019 PM Peak Synchro 9 Report
Taylor McAdam Page 7
Lane Group WBL WBR NBT NBR SBT SBR
Lane Group Flow (vph) 656 1271 1907 955 2253 500
v/c Ratio 0.43 0.93 0.81 0.79 0.86 0.51
Control Delay 30.3 47.8 38.7 7.8 23.6 4.1
Queue Delay 0.0 0.0 0.5 0.1 5.5 0.8
Total Delay 30.3 47.8 39.2 7.9 29.1 4.9
Queue Length 50th (ft) 221 625 542 61 408 7
Queue Length 95th (ft) 274 755 630 m233 458 84
Internal Link Dist (ft) 799 345
Turn Bay Length (ft) 140 400 300
Base Capacity (vph) 1557 1412 2366 1205 2626 978
Starvation Cap Reductn 0 0 33 14 329 218
Spillback Cap Reductn 8 0 151 0 27 0
Storage Cap Reductn 0 0 0 0 0 0
Reduced v/c Ratio 0.42 0.90 0.86 0.80 0.98 0.66
Intersection Summary
m Volume for 95th percentile queue is metered by upstream signal.

Queues
1: 280 SB On Ramp/280 SB Off Ramp & San Bruno Avenue W 08/06/2019
2040 Plus Phase 1 02/21/2019 AM Peak Synchro 9 Report
Taylor McAdam Page 1
Lane Group EBT EBR WBL WBT SBL SBT SBR
Lane Group Flow (vph) 994 368 347 548 268 560 161
v/c Ratio 0.43 0.47 0.58 0.23 0.69 0.73 0.36
Control Delay 18.7 13.9 40.6 4.0 40.2 37.0 9.9
Queue Delay 0.0 0.0 0.0 0.0 0.0 0.0 0.0
Total Delay 18.7 13.9 40.6 4.0 40.2 37.0 9.9
Queue Length 50th (ft) 138 84 111 26 152 169 16
Queue Length 95th (ft) 197 183 m156 m37 224 212 64
Internal Link Dist (ft) 465 331 328
Turn Bay Length (ft) 120 80
Base Capacity (vph) 2287 780 597 2346 498 979 534
Starvation Cap Reductn 0 0 0 0 0 0 0
Spillback Cap Reductn 0 0 0 0 0 0 0
Storage Cap Reductn 0 0 0 0 0 0 0
Reduced v/c Ratio 0.43 0.47 0.58 0.23 0.54 0.57 0.30
Intersection Summary
m Volume for 95th percentile queue is metered by upstream signal.
Queues
2: 280 NB Off Ramp/280 NB On Ramp & San Bruno Avenue W 08/06/2019
2040 Plus Phase 1 02/21/2019 AM Peak Synchro 9 Report
Taylor McAdam Page 2
Lane Group EBL EBT WBT WBR NBL NBT NBR
Lane Group Flow (vph) 397 921 743 274 130 479 441
v/c Ratio 0.74 0.48 0.61 0.40 0.22 0.88 0.85
Control Delay 37.2 4.7 28.1 6.4 20.8 45.8 43.4
Queue Delay 0.0 0.1 0.0 0.0 0.0 0.0 0.0
Total Delay 37.2 4.7 28.1 6.4 20.8 45.8 43.4
Queue Length 50th (ft) 119 82 190 10 52 264 230
Queue Length 95th (ft) #175 96 260 68 92 #430 #358
Internal Link Dist (ft) 331 999 438
Turn Bay Length (ft) 130 230 50
Base Capacity (vph) 534 1926 1218 693 653 615 584
Starvation Cap Reductn 0 118 0 0 0 0 0
Spillback Cap Reductn 0 0 0 0 0 0 0
Storage Cap Reductn 0 0 0 0 0 0 0
Reduced v/c Ratio 0.74 0.51 0.61 0.40 0.20 0.78 0.76
Intersection Summary
# 95th percentile volume exceeds capacity, queue may be longer.
Queue shown is maximum after two cycles.

Queues
8: El Camino Real & 380 EB Off-Ramp/380 EB On-Ramp 08/06/2019
2040 Plus Phase 1 02/21/2019 AM Peak Synchro 9 Report
Taylor McAdam Page 3
Lane Group EBL EBT EBR NBT SBT SBR
Lane Group Flow (vph) 171 163 157 2833 1702 1610
v/c Ratio 1.19 0.92 0.81 0.72 0.40 1.13
Control Delay 181.1 87.1 60.1 5.5 2.0 77.7
Queue Delay 0.0 0.8 0.3 0.4 0.0 0.0
Total Delay 181.1 87.9 60.4 5.8 2.0 77.7
Queue Length 50th (ft) ~167 95 69 202 64 ~1310
Queue Length 95th (ft) #318 #245 #192 301 73 #1582
Internal Link Dist (ft) 1043 319 799
Turn Bay Length (ft) 520 500 500
Base Capacity (vph) 144 177 193 3934 4221 1429
Starvation Cap Reductn 0 0 0 502 0 0
Spillback Cap Reductn 0 1 1 0 131 0
Storage Cap Reductn 0 0 0 0 0 0
Reduced v/c Ratio 1.19 0.93 0.82 0.83 0.42 1.13
Intersection Summary
~ Volume exceeds capacity, queue is theoretically infinite.
Queue shown is maximum after two cycles.
# 95th percentile volume exceeds capacity, queue may be longer.
Queue shown is maximum after two cycles.
Queues
9: El Camino Real & 380 WB On-Ramp/380 WB Off-Ramp 08/06/2019
2040 Plus Phase 1 02/21/2019 AM Peak Synchro 9 Report
Taylor McAdam Page 4
Lane Group WBL WBR NBT NBR SBT SBR
Lane Group Flow (vph) 642 711 1145 1005 2226 309
v/c Ratio 0.91 0.82 0.34 0.76 0.61 0.26
Control Delay 63.3 39.5 11.7 6.2 9.4 1.2
Queue Delay 0.0 0.0 0.0 0.4 3.2 0.6
Total Delay 63.3 39.5 11.7 6.6 12.6 1.8
Queue Length 50th (ft) 250 230 162 51 279 0
Queue Length 95th (ft) 308 300 m190 m51 361 26
Internal Link Dist (ft) 799 345
Turn Bay Length (ft) 140 400 300
Base Capacity (vph) 833 963 3330 1329 3649 1188
Starvation Cap Reductn 0 0 0 67 1291 533
Spillback Cap Reductn 0 0 0 0 243 0
Storage Cap Reductn 0 0 0 0 0 0
Reduced v/c Ratio 0.77 0.74 0.34 0.80 0.94 0.47
Intersection Summary
m Volume for 95th percentile queue is metered by upstream signal.
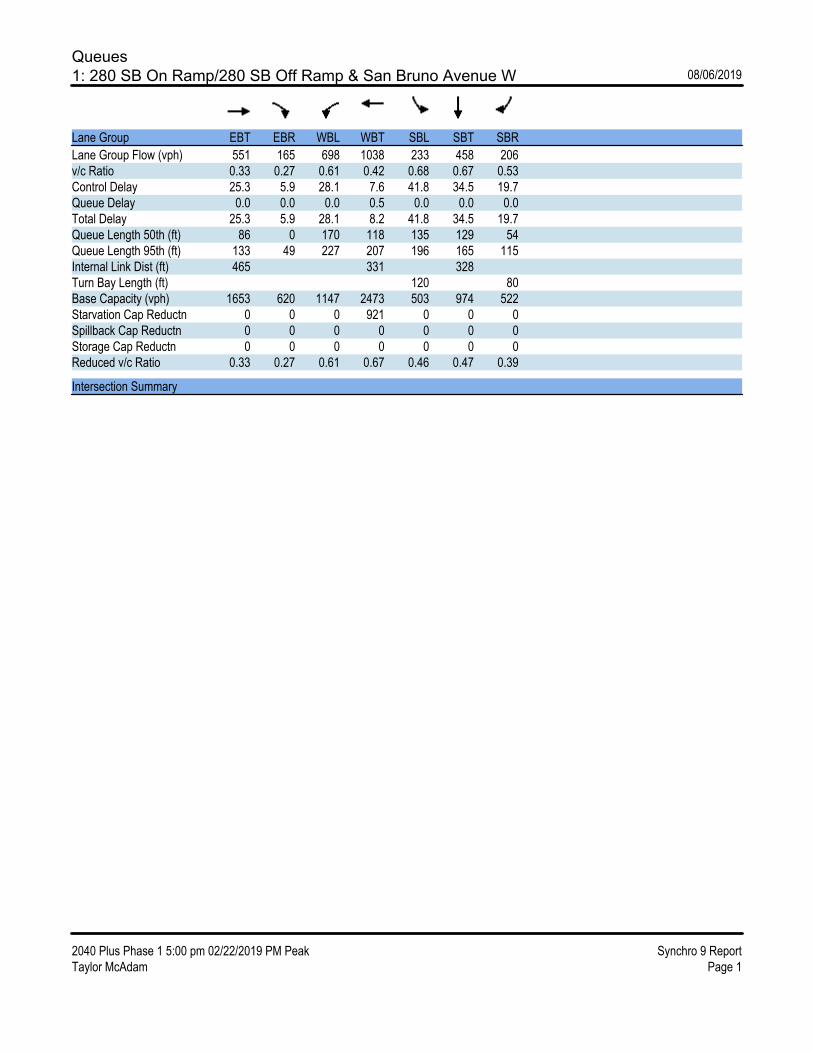
Queues
1: 280 SB On Ramp/280 SB Off Ramp & San Bruno Avenue W 08/06/2019
2040 Plus Phase 1 5:00 pm 02/22/2019 PM Peak Synchro 9 Report
Taylor McAdam Page 1
Lane Group EBT EBR WBL WBT SBL SBT SBR
Lane Group Flow (vph) 551 165 698 1038 233 458 206
v/c Ratio 0.33 0.27 0.61 0.42 0.68 0.67 0.53
Control Delay 25.3 5.9 28.1 7.6 41.8 34.5 19.7
Queue Delay 0.0 0.0 0.0 0.5 0.0 0.0 0.0
Total Delay 25.3 5.9 28.1 8.2 41.8 34.5 19.7
Queue Length 50th (ft) 86 0 170 118 135 129 54
Queue Length 95th (ft) 133 49 227 207 196 165 115
Internal Link Dist (ft) 465 331 328
Turn Bay Length (ft) 120 80
Base Capacity (vph) 1653 620 1147 2473 503 974 522
Starvation Cap Reductn 0 0 0 921 0 0 0
Spillback Cap Reductn 0 0 0 0 0 0 0
Storage Cap Reductn 0 0 0 0 0 0 0
Reduced v/c Ratio 0.33 0.27 0.61 0.67 0.46 0.47 0.39
Intersection Summary

Queues
2: 280 NB Off Ramp/280 NB On Ramp & San Bruno Avenue W 08/06/2019
2040 Plus Phase 1 5:00 pm 02/22/2019 PM Peak Synchro 9 Report
Taylor McAdam Page 2
Lane Group EBL EBT WBT WBR NBL NBT NBR
Lane Group Flow (vph) 174 790 1374 712 303 941 532
v/c Ratio 1.31 0.48 0.98 1.07 0.39 1.21 0.77
Control Delay 229.5 25.4 58.8 90.2 24.8 137.3 38.3
Queue Delay 0.0 2.6 0.0 0.0 0.0 0.0 0.0
Total Delay 229.5 28.0 58.8 90.2 24.8 137.3 38.3
Queue Length 50th (ft) ~96 237 595 ~620 172 ~1059 386
Queue Length 95th (ft) #173 294 #760 #863 252 #1338 550
Internal Link Dist (ft) 331 999 438
Turn Bay Length (ft) 130 230 50
Base Capacity (vph) 133 1649 1402 663 783 780 691
Starvation Cap Reductn 0 707 0 0 0 0 0
Spillback Cap Reductn 0 0 0 0 0 0 0
Storage Cap Reductn 0 0 0 0 0 0 0
Reduced v/c Ratio 1.31 0.84 0.98 1.07 0.39 1.21 0.77
Intersection Summary
~ Volume exceeds capacity, queue is theoretically infinite.
Queue shown is maximum after two cycles.
# 95th percentile volume exceeds capacity, queue may be longer.
Queue shown is maximum after two cycles.
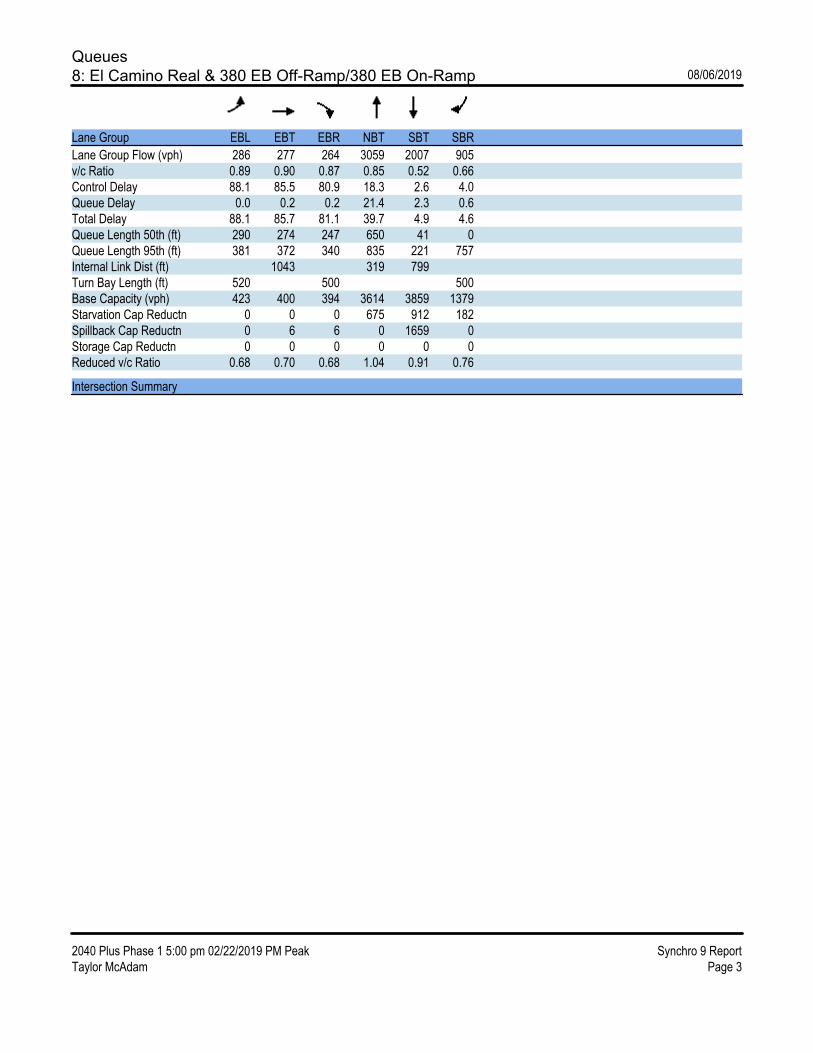
Queues
8: El Camino Real & 380 EB Off-Ramp/380 EB On-Ramp 08/06/2019
2040 Plus Phase 1 5:00 pm 02/22/2019 PM Peak Synchro 9 Report
Taylor McAdam Page 3
Lane Group EBL EBT EBR NBT SBT SBR
Lane Group Flow (vph) 286 277 264 3059 2007 905
v/c Ratio 0.89 0.90 0.87 0.85 0.52 0.66
Control Delay 88.1 85.5 80.9 18.3 2.6 4.0
Queue Delay 0.0 0.2 0.2 21.4 2.3 0.6
Total Delay 88.1 85.7 81.1 39.7 4.9 4.6
Queue Length 50th (ft) 290 274 247 650 41 0
Queue Length 95th (ft) 381 372 340 835 221 757
Internal Link Dist (ft) 1043 319 799
Turn Bay Length (ft) 520 500 500
Base Capacity (vph) 423 400 394 3614 3859 1379
Starvation Cap Reductn 0 0 0 675 912 182
Spillback Cap Reductn 0 6 6 0 1659 0
Storage Cap Reductn 0 0 0 0 0 0
Reduced v/c Ratio 0.68 0.70 0.68 1.04 0.91 0.76
Intersection Summary
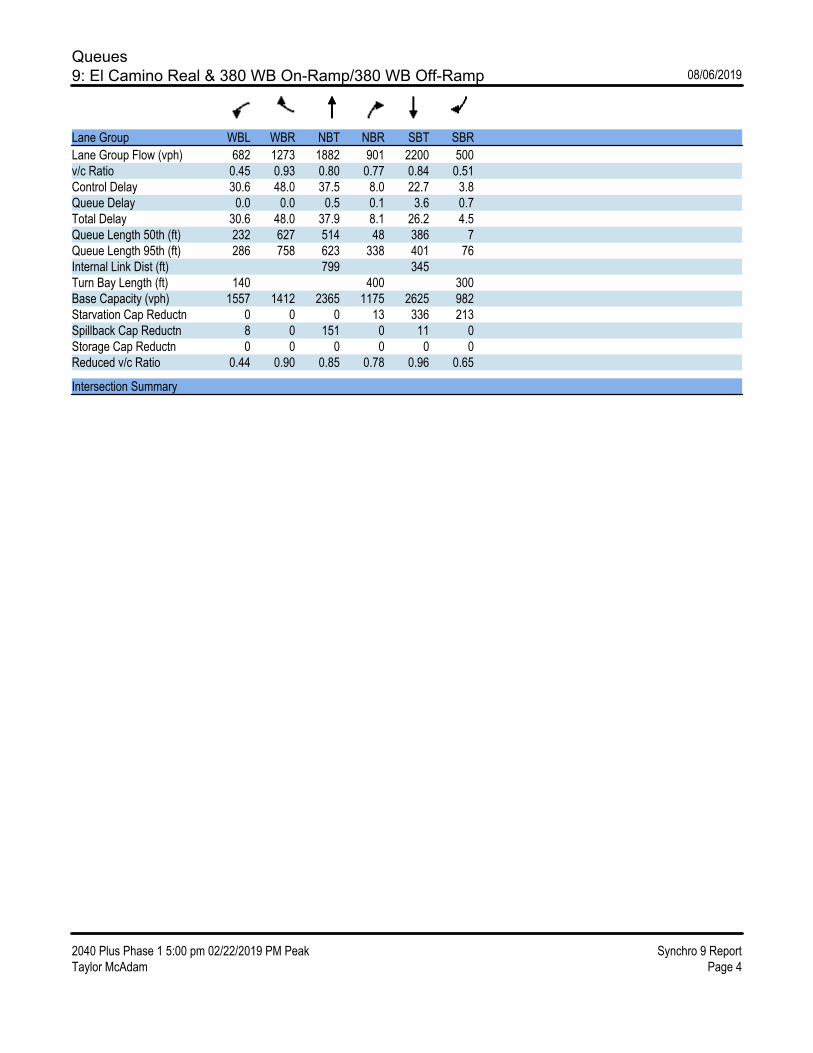
Queues
9: El Camino Real & 380 WB On-Ramp/380 WB Off-Ramp 08/06/2019
2040 Plus Phase 1 5:00 pm 02/22/2019 PM Peak Synchro 9 Report
Taylor McAdam Page 4
Lane Group WBL WBR NBT NBR SBT SBR
Lane Group Flow (vph) 682 1273 1882 901 2200 500
v/c Ratio 0.45 0.93 0.80 0.77 0.84 0.51
Control Delay 30.6 48.0 37.5 8.0 22.7 3.8
Queue Delay 0.0 0.0 0.5 0.1 3.6 0.7
Total Delay 30.6 48.0 37.9 8.1 26.2 4.5
Queue Length 50th (ft) 232 627 514 48 386 7
Queue Length 95th (ft) 286 758 623 338 401 76
Internal Link Dist (ft) 799 345
Turn Bay Length (ft) 140 400 300
Base Capacity (vph) 1557 1412 2365 1175 2625 982
Starvation Cap Reductn 0 0 0 13 336 213
Spillback Cap Reductn 8 0 151 0 11 0
Storage Cap Reductn 0 0 0 0 0 0
Reduced v/c Ratio 0.44 0.90 0.85 0.78 0.96 0.65
Intersection Summary
332 Pine Street | 4th Floor | San Francisco, CA 94104 | (415) 348-0300 | Fax (415) 773-1790 www.fehrandpeers.com
APPENDIX: BAYHILL SPECIFIC PLAN EIR LEVEL OF SERVICE CALCULATIONS
This appendix summarizes the level of service (LOS) transportation analysis of the Max Office and Phase 1 Projects proposed for the Bayhill Specific Plan. With the passage of SB 743 (September 27, 2013) and the subsequent adoption of revised California Environmental Quality Act (CEQA) Guidelines (December 28, 2018), level of service (LOS) can no longer be used as a criterion for identifying significant transportation impacts for most projects under CEQA effective July 1, 2020. Therefore, the findings included in this assessment are provided for informational and planning purposes.
Study Area Intersections are generally the critical capacity-controlling elements of suburban roadway networks. Therefore, the operations of critical intersections surrounding the project site are used as indicators of the adequacy of the vehicular circulation system. 15 intersections surrounding the Project site were selected by City of San Bruno staff for the evaluation of the Project. The intersections selected are deemed those most likely to be affected by the project and thus warranting analysis. The study intersections include:
1. I-280 Southbound Ramps/San Bruno Avenue2. I-280 Northbound Ramps/San Bruno Avenue3. Cherry Avenue/San Bruno Avenue4. Traeger Avenue/San Bruno Avenue5. Elm Avenue/San Bruno Avenue6. El Camino Real/San Bruno Avenue7. El Camino Real/Bayhill Drive8. I-380 Eastbound/El Camino Real9. I-380 Westbound/El Camino Real10. Cherry Avenue/Bayhill Drive11. Cherry Avenue/Sneath Lane12. I-280 Northbound Ramp/Sneath Lane13. I-280 Southbound Ramp/Sneath Lane14. El Camino Real/Tanforan Way/Commodore Drive15. El Camino Real /Sneath Lane
Bayhill Specific Plan Alternatives Analysis July 12, 2018 Page 2 of 15
Analysis Scenarios The analysis includes an evaluation of transportation conditions during a typical weekday AM and PM peak hour, occurring between 7:00 to 9:00 AM and 4:00 to 6:00 PM, when the surrounding transportation network is at its most congested. This report presents the analysis of the following scenarios:
Existing No Project– Based on recently collected traffic counts. Existing Plus Phase I Project– Traffic volumes from existing conditions plus traffic volume
estimates for the proposed Phase I Project. Existing Plus Max Office Project – Traffic volumes from existing conditions plus traffic
volume estimates for the proposed Max Office Project. Cumulative No Project– Traffic estimates for development patterns as proposed by 2040
(see Cumualtive traffic forecast section for additional details). Cumulative Plus Max Office Project– Traffic volumes from the Cumulative No Project
conditions plus traffic volume estimates for the proposed Max Office Project Cumulative Plus Max Housing Project– Traffic volumes from the Cumulative No Project
conditions plus traffic volume estimates for the proposed Max Housing Project
Cumulative Traffic Forecasts
As documented in the Data Collection and Assumptions letter (September 2017), the Bayhill Specific Plan will be evaluated for the future horizon year of 2040. 2040 forecasts were developed using the C/CAG-VTA Travel Demand Model. 2040 land uses were reviewed to confirm consistency with the proposed land uses in the City of San Bruno General Plan and Transit Corridors Plan.
Travel demand models provide volume outputs that need to be adjusted in order to develop volume forecasts for the scenario being tested. In principle, raw volume outputs from a travel demand model should rarely be applied directly in analysis, only being used after adjustments are made. Adjustments to forecasted volumes are usually based on the difference between or ratio of volumes observed in the field and the model’s own prediction of existing volumes.
The rationale for adjusting raw model volume outputs is that observed travel behavior is the result of a highly complex mixture of variables, only some of which are included in any given travel demand model, and so an adjustment is needed to account for variables not captured by the model itself. The adjustment takes the form of changing the model outputs to correct for discrepancies
Bayhill Specific Plan Alternatives Analysis July 12, 2018 Page 3 of 15
between actual field counts and estimated base year model volumes identified during the local calibration process, as it is assumed that the discrepancy will likely affect all scenarios in the same order of magnitude. This can be done several ways, as defined in the National Cooperative Highway Research Program Report 255: Highway Traffic Data for Urbanized Area Project Planning and Design, Transportation Research Board (December 1982). For the purpose of this assessment, the difference method was applied.
The difference method is the difference between the base year field count and the base year model volume, which is added to the output model volume to develop the forecasted volume for the scenario being tested. For example, if the base year model volume for a roadway segment was 650 ADT while the field count was 700 ADT, then the difference method would suggest the output model volume on that roadway segment should be increased by 50 ADT to develop the forecasted volume for the scenario being tested. The difference method adjustment is summarized in the formula below.
Scenario Forecast = Output Model Volume + (Field Count – Base Year Model Volume)
Study Methodology This section describes the study methodology for evaluating intersection operations and describes the significance criteria applied to identify significant traffic impacts for each alternative.
Analysis Methods
Intersection results will be summarized by Level of Service (LOS). LOS is a qualitative description of operations ranging from LOS A, when the roadway facility has excess capacity and vehicles experience little or no delay, to LOS F, where the volume of vehicles exceeds the capacity, resulting in long queues and excessive delays. Typically, LOS E represents “at-capacity” conditions and LOS F represents “over-capacity” conditions. Intersection LOS were established based on traffic analysis of the study intersections, conducted using a method documented by the Transportation Research Board (TRB) in the 2010 Highway Capacity Manual (HCM).
Study Intersections
The traffic analysis software Synchro was used for this study and was based on the City’s existing traffic model. For signalized intersections, the LOS is based on the average delay experienced by all vehicles passing through the intersection. This methodology uses various intersection
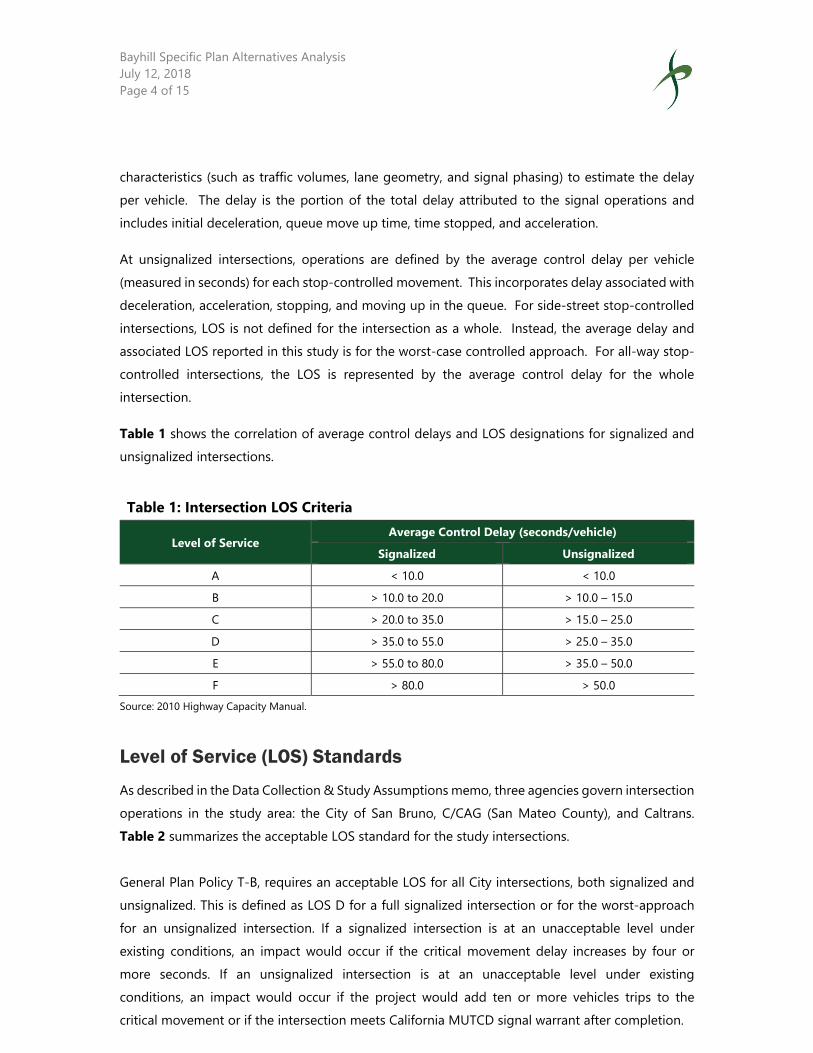
Bayhill Specific Plan Alternatives Analysis July 12, 2018 Page 4 of 15
characteristics (such as traffic volumes, lane geometry, and signal phasing) to estimate the delay per vehicle. The delay is the portion of the total delay attributed to the signal operations and includes initial deceleration, queue move up time, time stopped, and acceleration.
At unsignalized intersections, operations are defined by the average control delay per vehicle (measured in seconds) for each stop-controlled movement. This incorporates delay associated with deceleration, acceleration, stopping, and moving up in the queue. For side-street stop-controlled intersections, LOS is not defined for the intersection as a whole. Instead, the average delay and associated LOS reported in this study is for the worst-case controlled approach. For all-way stop-controlled intersections, the LOS is represented by the average control delay for the whole intersection.
Table 1 shows the correlation of average control delays and LOS designations for signalized and unsignalized intersections.
Table 1: Intersection LOS Criteria
Level of Service Average Control Delay (seconds/vehicle)
Signalized Unsignalized A < 10.0 < 10.0 B > 10.0 to 20.0 > 10.0 – 15.0C > 20.0 to 35.0 > 15.0 – 25.0D > 35.0 to 55.0 > 25.0 – 35.0E > 55.0 to 80.0 > 35.0 – 50.0F > 80.0 > 50.0
Source: 2010 Highway Capacity Manual.
Level of Service (LOS) Standards
As described in the Data Collection & Study Assumptions memo, three agencies govern intersection operations in the study area: the City of San Bruno, C/CAG (San Mateo County), and Caltrans. Table 2 summarizes the acceptable LOS standard for the study intersections.
General Plan Policy T-B, requires an acceptable LOS for all City intersections, both signalized and unsignalized. This is defined as LOS D for a full signalized intersection or for the worst-approach for an unsignalized intersection. If a signalized intersection is at an unacceptable level under existing conditions, an impact would occur if the critical movement delay increases by four or more seconds. If an unsignalized intersection is at an unacceptable level under existing conditions, an impact would occur if the project would add ten or more vehicles trips to the critical movement or if the intersection meets California MUTCD signal warrant after completion.
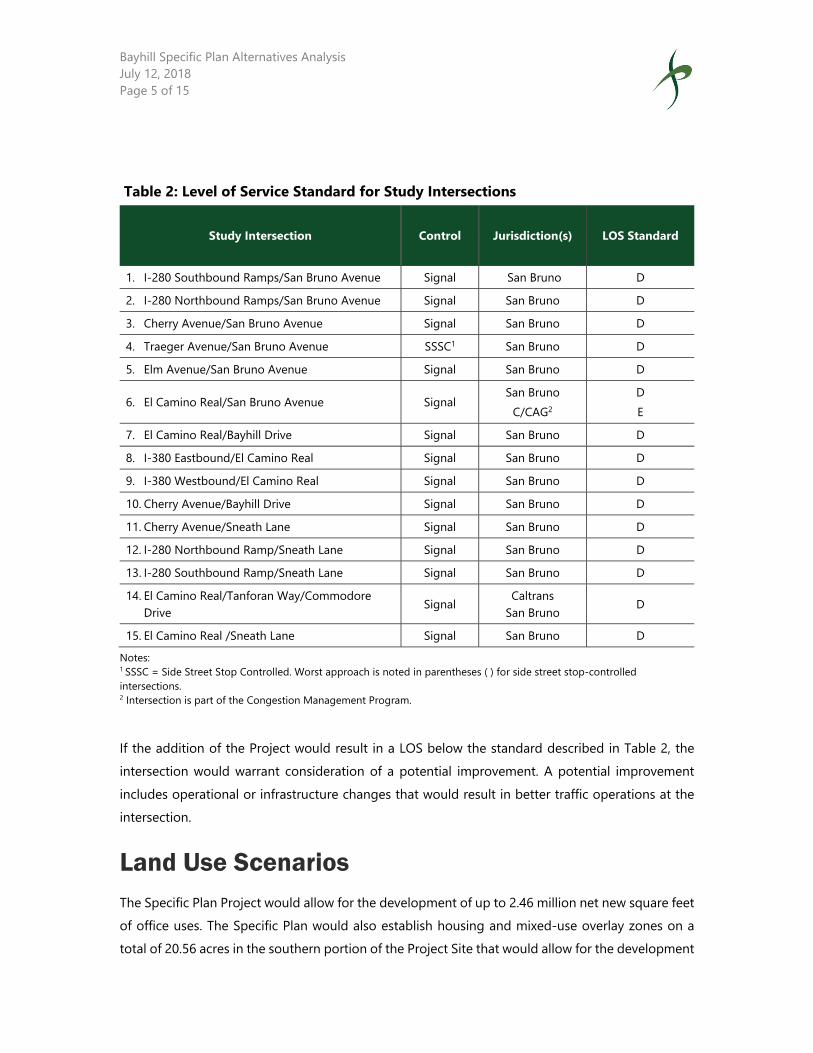
Bayhill Specific Plan Alternatives Analysis July 12, 2018 Page 5 of 15
Table 2: Level of Service Standard for Study Intersections
Study Intersection Control Jurisdiction(s) LOS Standard
1. I-280 Southbound Ramps/San Bruno Avenue Signal San Bruno D 2. I-280 Northbound Ramps/San Bruno Avenue Signal San Bruno D 3. Cherry Avenue/San Bruno Avenue Signal San Bruno D 4. Traeger Avenue/San Bruno Avenue SSSC1 San Bruno D 5. Elm Avenue/San Bruno Avenue Signal San Bruno D
6. El Camino Real/San Bruno Avenue Signal San Bruno C/CAG2
D E
7. El Camino Real/Bayhill Drive Signal San Bruno D 8. I-380 Eastbound/El Camino Real Signal San Bruno D 9. I-380 Westbound/El Camino Real Signal San Bruno D 10. Cherry Avenue/Bayhill Drive Signal San Bruno D 11. Cherry Avenue/Sneath Lane Signal San Bruno D 12. I-280 Northbound Ramp/Sneath Lane Signal San Bruno D 13. I-280 Southbound Ramp/Sneath Lane Signal San Bruno D 14. El Camino Real/Tanforan Way/Commodore
Drive Signal Caltrans San Bruno D
15. El Camino Real /Sneath Lane Signal San Bruno D Notes: 1 SSSC = Side Street Stop Controlled. Worst approach is noted in parentheses ( ) for side street stop-controlled intersections. 2 Intersection is part of the Congestion Management Program.
If the addition of the Project would result in a LOS below the standard described in Table 2, the intersection would warrant consideration of a potential improvement. A potential improvement includes operational or infrastructure changes that would result in better traffic operations at the intersection.
Land Use Scenarios The Specific Plan Project would allow for the development of up to 2.46 million net new square feet of office uses. The Specific Plan would also establish housing and mixed-use overlay zones on a total of 20.56 acres in the southern portion of the Project Site that would allow for the development
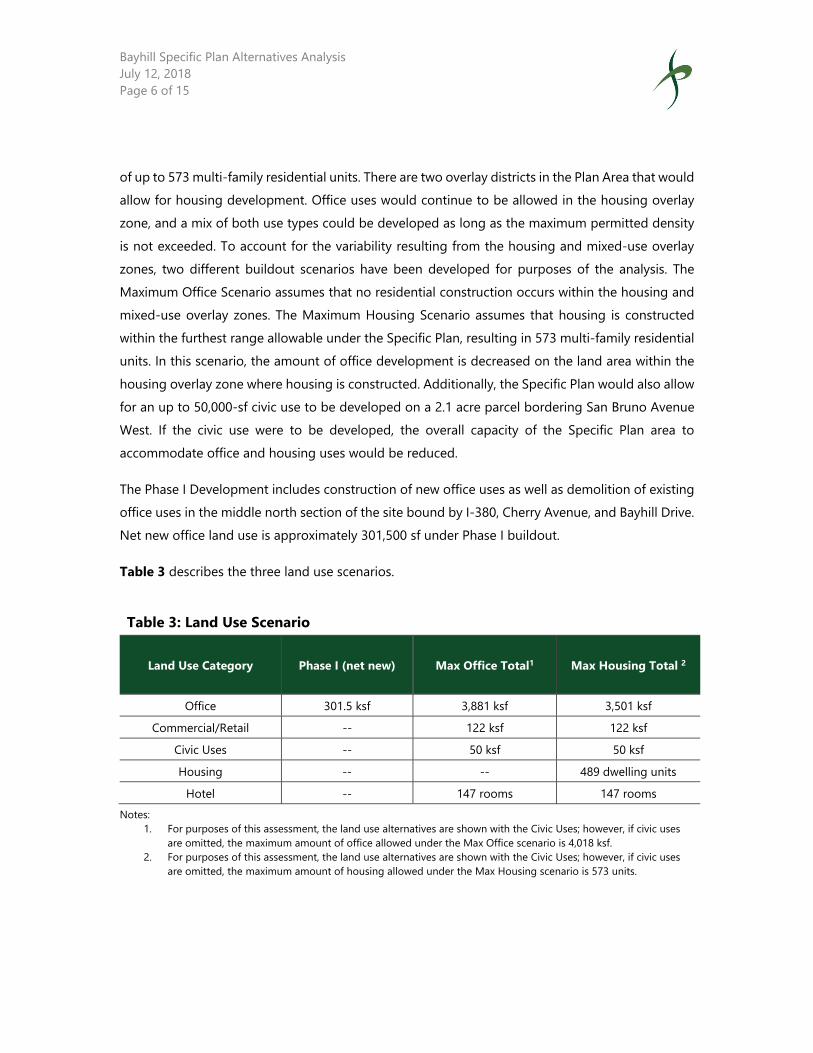
Bayhill Specific Plan Alternatives Analysis July 12, 2018 Page 6 of 15
of up to 573 multi-family residential units. There are two overlay districts in the Plan Area that would allow for housing development. Office uses would continue to be allowed in the housing overlay zone, and a mix of both use types could be developed as long as the maximum permitted density is not exceeded. To account for the variability resulting from the housing and mixed-use overlay zones, two different buildout scenarios have been developed for purposes of the analysis. The Maximum Office Scenario assumes that no residential construction occurs within the housing and mixed-use overlay zones. The Maximum Housing Scenario assumes that housing is constructed within the furthest range allowable under the Specific Plan, resulting in 573 multi-family residential units. In this scenario, the amount of office development is decreased on the land area within the housing overlay zone where housing is constructed. Additionally, the Specific Plan would also allow for an up to 50,000-sf civic use to be developed on a 2.1 acre parcel bordering San Bruno Avenue West. If the civic use were to be developed, the overall capacity of the Specific Plan area to accommodate office and housing uses would be reduced.
The Phase I Development includes construction of new office uses as well as demolition of existing office uses in the middle north section of the site bound by I-380, Cherry Avenue, and Bayhill Drive. Net new office land use is approximately 301,500 sf under Phase I buildout.
Table 3 describes the three land use scenarios.
Table 3: Land Use Scenario
Land Use Category Phase I (net new) Max Office Total1 Max Housing Total 2
Office 301.5 ksf 3,881 ksf 3,501 ksf Commercial/Retail -- 122 ksf 122 ksf
Civic Uses -- 50 ksf 50 ksf Housing -- -- 489 dwelling units
Hotel -- 147 rooms 147 rooms Notes:
1. For purposes of this assessment, the land use alternatives are shown with the Civic Uses; however, if civic usesare omitted, the maximum amount of office allowed under the Max Office scenario is 4,018 ksf.
2. For purposes of this assessment, the land use alternatives are shown with the Civic Uses; however, if civic usesare omitted, the maximum amount of housing allowed under the Max Housing scenario is 573 units.
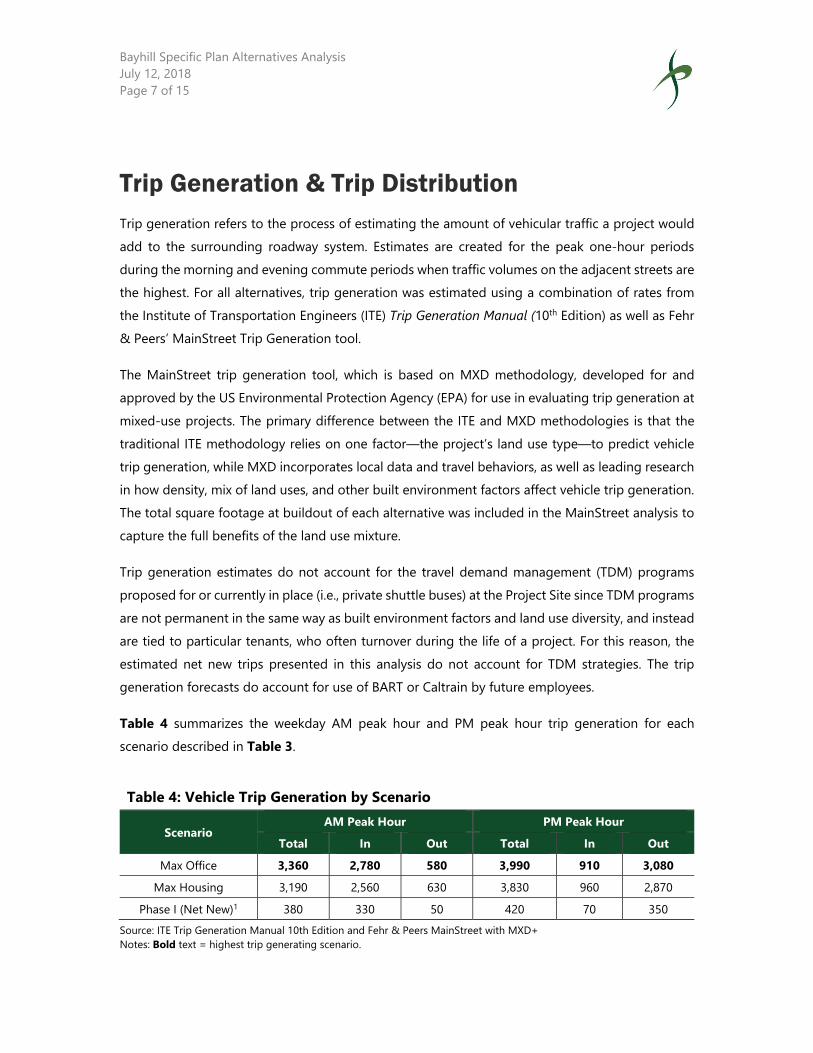
Bayhill Specific Plan Alternatives Analysis July 12, 2018 Page 7 of 15
Trip Generation & Trip Distribution Trip generation refers to the process of estimating the amount of vehicular traffic a project would add to the surrounding roadway system. Estimates are created for the peak one-hour periods during the morning and evening commute periods when traffic volumes on the adjacent streets are the highest. For all alternatives, trip generation was estimated using a combination of rates from the Institute of Transportation Engineers (ITE) Trip Generation Manual (10th Edition) as well as Fehr & Peers’ MainStreet Trip Generation tool.
The MainStreet trip generation tool, which is based on MXD methodology, developed for and approved by the US Environmental Protection Agency (EPA) for use in evaluating trip generation at mixed-use projects. The primary difference between the ITE and MXD methodologies is that the traditional ITE methodology relies on one factor—the project’s land use type—to predict vehicle trip generation, while MXD incorporates local data and travel behaviors, as well as leading research in how density, mix of land uses, and other built environment factors affect vehicle trip generation. The total square footage at buildout of each alternative was included in the MainStreet analysis to capture the full benefits of the land use mixture.
Trip generation estimates do not account for the travel demand management (TDM) programs proposed for or currently in place (i.e., private shuttle buses) at the Project Site since TDM programs are not permanent in the same way as built environment factors and land use diversity, and instead are tied to particular tenants, who often turnover during the life of a project. For this reason, the estimated net new trips presented in this analysis do not account for TDM strategies. The trip generation forecasts do account for use of BART or Caltrain by future employees.
Table 4 summarizes the weekday AM peak hour and PM peak hour trip generation for each scenario described in Table 3.
Table 4: Vehicle Trip Generation by Scenario
Scenario AM Peak Hour PM Peak Hour
Total In Out Total In Out Max Office 3,360 2,780 580 3,990 910 3,080
Max Housing 3,190 2,560 630 3,830 960 2,870 Phase I (Net New)1 380 330 50 420 70 350
Source: ITE Trip Generation Manual 10th Edition and Fehr & Peers MainStreet with MXD+ Notes: Bold text = highest trip generating scenario.
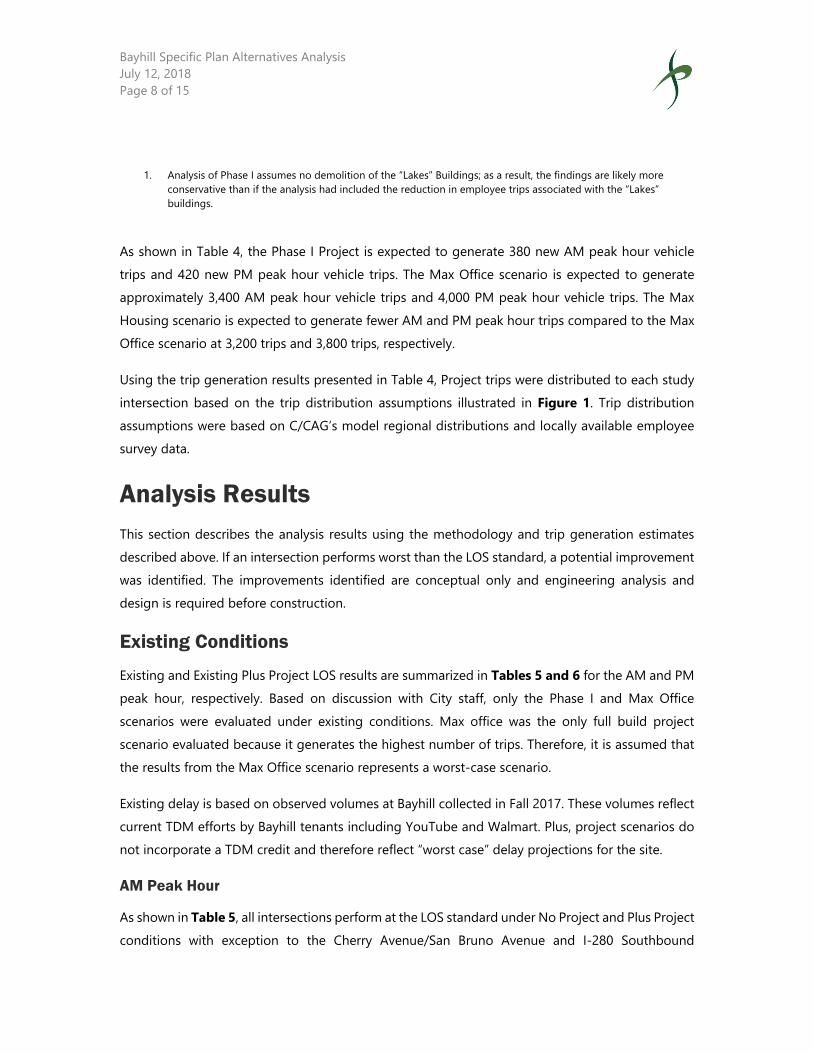
Bayhill Specific Plan Alternatives Analysis July 12, 2018 Page 8 of 15
1. Analysis of Phase I assumes no demolition of the “Lakes” Buildings; as a result, the findings are likely more conservative than if the analysis had included the reduction in employee trips associated with the “Lakes” buildings.
As shown in Table 4, the Phase I Project is expected to generate 380 new AM peak hour vehicle trips and 420 new PM peak hour vehicle trips. The Max Office scenario is expected to generate approximately 3,400 AM peak hour vehicle trips and 4,000 PM peak hour vehicle trips. The Max Housing scenario is expected to generate fewer AM and PM peak hour trips compared to the Max Office scenario at 3,200 trips and 3,800 trips, respectively.
Using the trip generation results presented in Table 4, Project trips were distributed to each study intersection based on the trip distribution assumptions illustrated in Figure 1. Trip distribution assumptions were based on C/CAG’s model regional distributions and locally available employee survey data.
Analysis Results This section describes the analysis results using the methodology and trip generation estimates described above. If an intersection performs worst than the LOS standard, a potential improvement was identified. The improvements identified are conceptual only and engineering analysis and design is required before construction.
Existing Conditions
Existing and Existing Plus Project LOS results are summarized in Tables 5 and 6 for the AM and PM peak hour, respectively. Based on discussion with City staff, only the Phase I and Max Office scenarios were evaluated under existing conditions. Max office was the only full build project scenario evaluated because it generates the highest number of trips. Therefore, it is assumed that the results from the Max Office scenario represents a worst-case scenario.
Existing delay is based on observed volumes at Bayhill collected in Fall 2017. These volumes reflect current TDM efforts by Bayhill tenants including YouTube and Walmart. Plus, project scenarios do not incorporate a TDM credit and therefore reflect “worst case” delay projections for the site.
AM Peak Hour
As shown in Table 5, all intersections perform at the LOS standard under No Project and Plus Project conditions with exception to the Cherry Avenue/San Bruno Avenue and I-280 Southbound
Bayhill Specific Plan Alternatives Analysis July 12, 2018 Page 9 of 15
Ramp/Sneath Lane intersections. The Cherry Avenue/San Bruno Avenue intersection operates above the LOS standard under No Project and Plus Phase I conditions; however, worsens to LOS E with the addition of the Max Office scenario. To improve conditions, a potential improvement would include modifying the signal cycle length to accommodate the additional vehicular traffic. The I-280 Southbound Ramp/Sneath Lane intersection operates under the LOS D standard under existing conditions. The addition of the Phase I and Max Office Project would worsen conditions; however, optimizing signal timing plans would result in improved intersection operations that operate at the LOS D standard.
PM Peak Hour
As shown in Table 6, all intersections perform at the LOS standard under No Project and Plus Project conditions with exception to the following intersections:
Cherry Avenue/San Bruno Avenue Traeger Avenue/San Bruno Avenue El Camino Real/San Bruno Avenue I-380 Westbound/El Camino Real
The Cherry Avenue/San Bruno Avenue, El Camino Real/San Bruno Avenue, and I-380 Westbound/El Camino Real intersections would operate at the LOS standard (LOS D) or better by modifying signal timings. The Traeger Avenue/San Bruno Avenue operates acceptable under No Project condition; however, the addition of the Phase I and Max Office Project would worsen the side street stop-controlled approach, such that the intersection would operate under the LOS D standard. To improve operations, the Traeger Avenue/San Bruno Avenue intersection should be signalized. Note, that the intersection currently meets the peak hour signal warrant for a traffic signal.
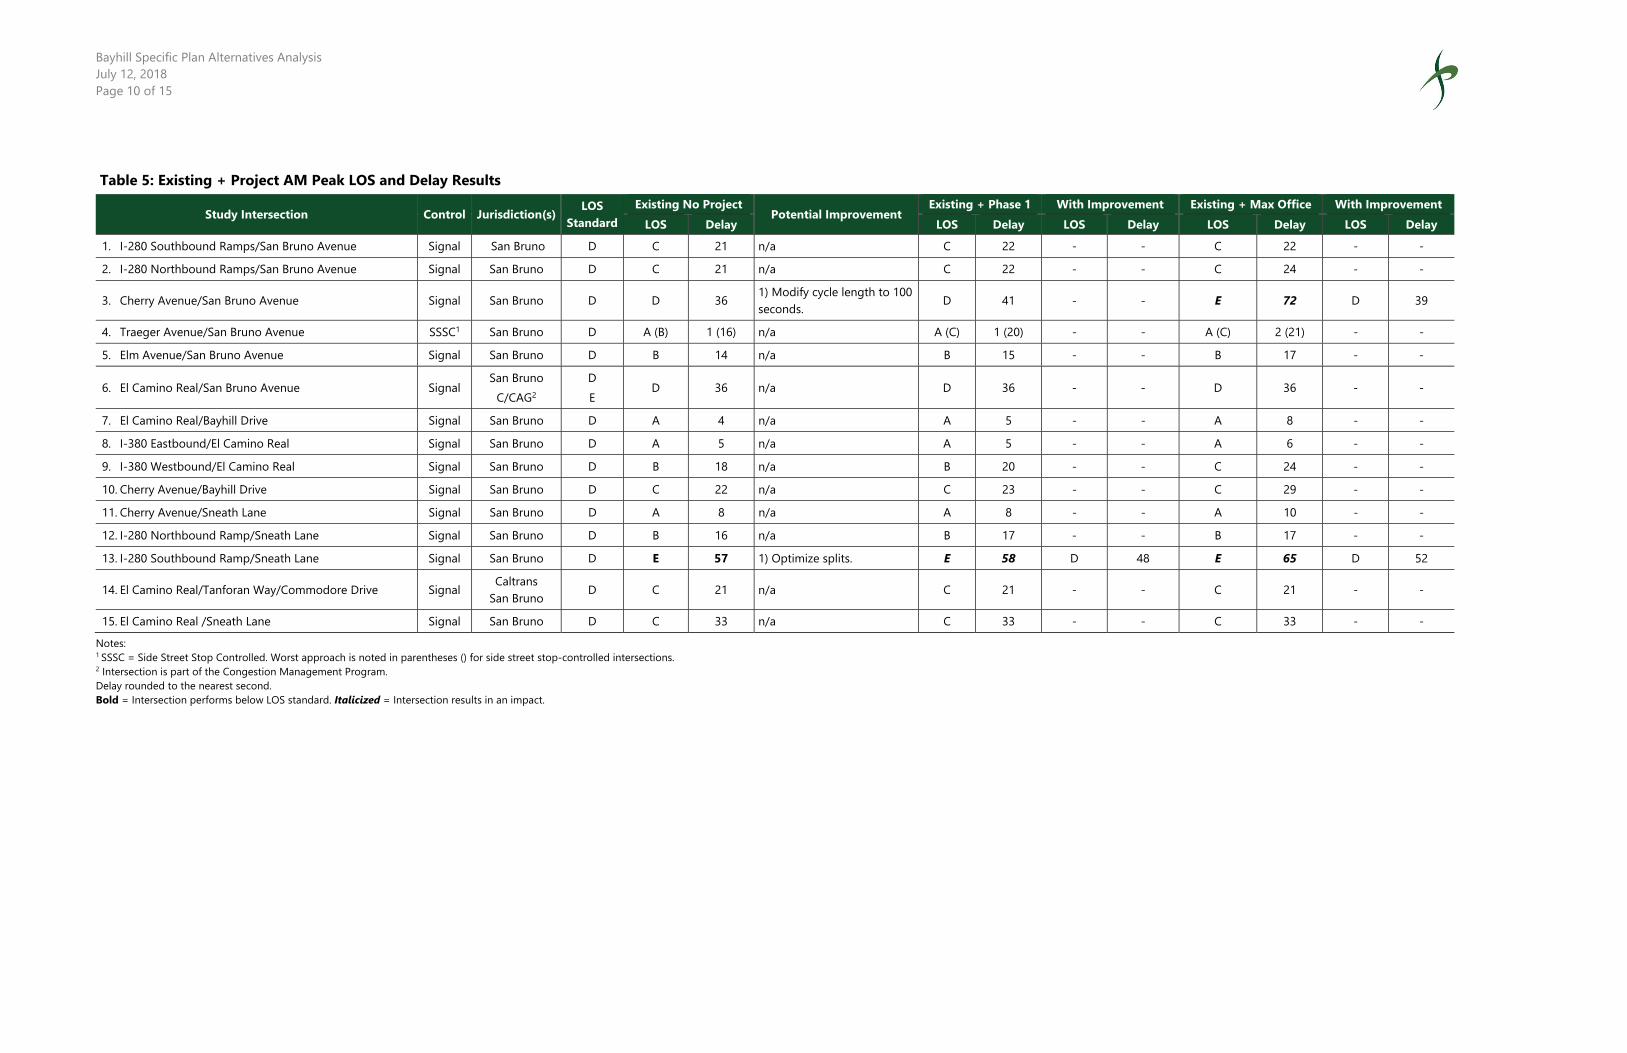
Bayhill Specific Plan Alternatives Analysis July 12, 2018 Page 10 of 15
Table 5: Existing + Project AM Peak LOS and Delay Results
Study Intersection Control Jurisdiction(s) LOS Standard
Existing No Project Potential Improvement Existing + Phase 1 With Improvement Existing + Max Office With Improvement LOS Delay LOS Delay LOS Delay LOS Delay LOS Delay
1. I-280 Southbound Ramps/San Bruno Avenue Signal San Bruno D C 21 n/a C 22 - - C 22 - - 2. I-280 Northbound Ramps/San Bruno Avenue Signal San Bruno D C 21 n/a C 22 - - C 24 - -
3. Cherry Avenue/San Bruno Avenue Signal San Bruno D D 36 1) Modify cycle length to 100 seconds. D 41 - - E 72 D 39
4. Traeger Avenue/San Bruno Avenue SSSC1 San Bruno D A (B) 1 (16) n/a A (C) 1 (20) - - A (C) 2 (21) - - 5. Elm Avenue/San Bruno Avenue Signal San Bruno D B 14 n/a B 15 - - B 17 - -
6. El Camino Real/San Bruno Avenue Signal San Bruno C/CAG2
D E D 36 n/a D 36 - - D 36 - -
7. El Camino Real/Bayhill Drive Signal San Bruno D A 4 n/a A 5 - - A 8 - - 8. I-380 Eastbound/El Camino Real Signal San Bruno D A 5 n/a A 5 - - A 6 - - 9. I-380 Westbound/El Camino Real Signal San Bruno D B 18 n/a B 20 - - C 24 - - 10. Cherry Avenue/Bayhill Drive Signal San Bruno D C 22 n/a C 23 - - C 29 - - 11. Cherry Avenue/Sneath Lane Signal San Bruno D A 8 n/a A 8 - - A 10 - - 12. I-280 Northbound Ramp/Sneath Lane Signal San Bruno D B 16 n/a B 17 - - B 17 - - 13. I-280 Southbound Ramp/Sneath Lane Signal San Bruno D E 57 1) Optimize splits. E 58 D 48 E 65 D 52
14. El Camino Real/Tanforan Way/Commodore Drive Signal Caltrans San Bruno D C 21 n/a C 21 - - C 21 - -
15. El Camino Real /Sneath Lane Signal San Bruno D C 33 n/a C 33 - - C 33 - - Notes: 1 SSSC = Side Street Stop Controlled. Worst approach is noted in parentheses () for side street stop-controlled intersections. 2 Intersection is part of the Congestion Management Program. Delay rounded to the nearest second. Bold = Intersection performs below LOS standard. Italicized = Intersection results in an impact.
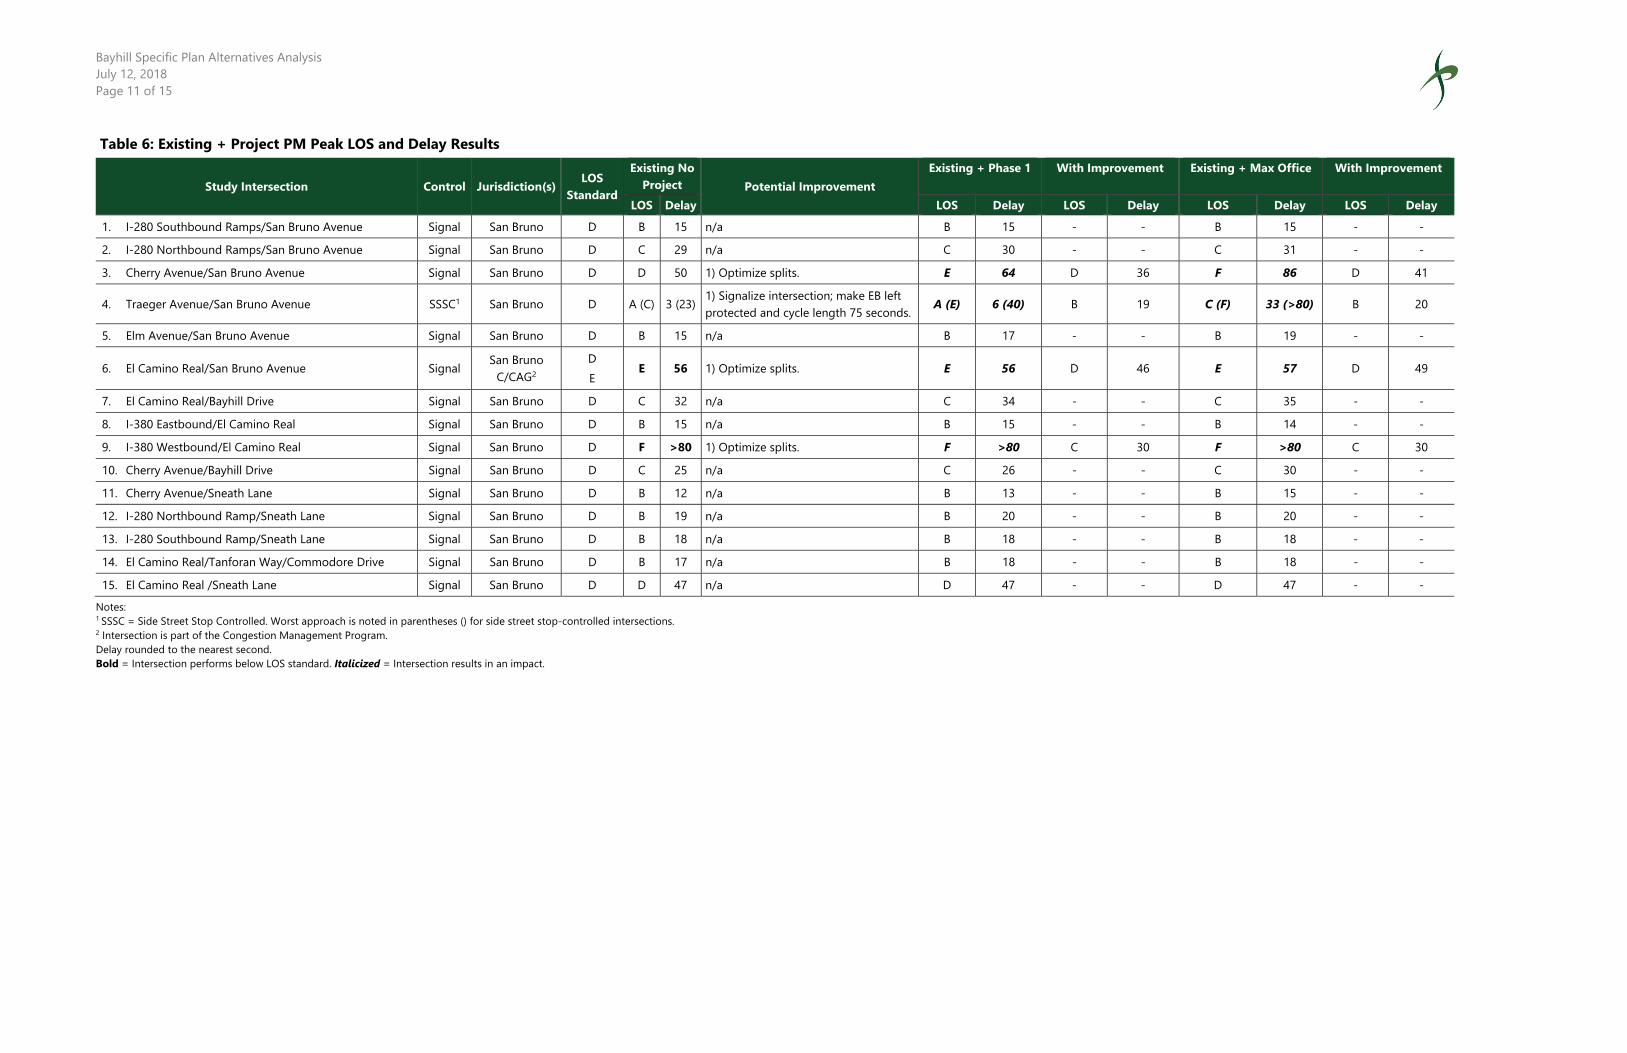
Bayhill Specific Plan Alternatives Analysis July 12, 2018 Page 11 of 15
Table 6: Existing + Project PM Peak LOS and Delay Results
Study Intersection Control Jurisdiction(s) LOS Standard
Existing No Project Potential Improvement
Existing + Phase 1 With Improvement Existing + Max Office With Improvement
LOS Delay LOS Delay LOS Delay LOS Delay LOS Delay 1. I-280 Southbound Ramps/San Bruno Avenue Signal San Bruno D B 15 n/a B 15 - - B 15 - - 2. I-280 Northbound Ramps/San Bruno Avenue Signal San Bruno D C 29 n/a C 30 - - C 31 - - 3. Cherry Avenue/San Bruno Avenue Signal San Bruno D D 50 1) Optimize splits. E 64 D 36 F 86 D 41
4. Traeger Avenue/San Bruno Avenue SSSC1 San Bruno D A (C) 3 (23) 1) Signalize intersection; make EB left protected and cycle length 75 seconds. A (E) 6 (40) B 19 C (F) 33 (>80) B 20
5. Elm Avenue/San Bruno Avenue Signal San Bruno D B 15 n/a B 17 - - B 19 - -
6. El Camino Real/San Bruno Avenue Signal San Bruno C/CAG2
D E E 56 1) Optimize splits. E 56 D 46 E 57 D 49
7. El Camino Real/Bayhill Drive Signal San Bruno D C 32 n/a C 34 - - C 35 - - 8. I-380 Eastbound/El Camino Real Signal San Bruno D B 15 n/a B 15 - - B 14 - - 9. I-380 Westbound/El Camino Real Signal San Bruno D F >80 1) Optimize splits. F >80 C 30 F >80 C 30 10. Cherry Avenue/Bayhill Drive Signal San Bruno D C 25 n/a C 26 - - C 30 - - 11. Cherry Avenue/Sneath Lane Signal San Bruno D B 12 n/a B 13 - - B 15 - - 12. I-280 Northbound Ramp/Sneath Lane Signal San Bruno D B 19 n/a B 20 - - B 20 - - 13. I-280 Southbound Ramp/Sneath Lane Signal San Bruno D B 18 n/a B 18 - - B 18 - - 14. El Camino Real/Tanforan Way/Commodore Drive Signal San Bruno D B 17 n/a B 18 - - B 18 - - 15. El Camino Real /Sneath Lane Signal San Bruno D D 47 n/a D 47 - - D 47 - -
Notes: 1 SSSC = Side Street Stop Controlled. Worst approach is noted in parentheses () for side street stop-controlled intersections. 2 Intersection is part of the Congestion Management Program. Delay rounded to the nearest second. Bold = Intersection performs below LOS standard. Italicized = Intersection results in an impact.
Bayhill Specific Plan Alternatives Analysis July 12, 2018 Page 12 of 15
Cumulative Conditions
Cumulative and Cumulative Plus Project LOS results are summarized in Tables 7 and 8 for the AM and PM peak hour, respectively. The Cumulative volumes do not incorporate a TDM credit and therefore reflect “worst case” delay projections for the site.
AM Peak Hour
As shown in Table 7, all intersections perform at the LOS standard under No Project and Plus Project conditions with exception to the following intersections.
Cherry Avenue/San Bruno Avenue Traeger Avenue/San Bruno Avenue I-280 Southbound Ramp/Sneath Lane
The Cherry Avenue/San Bruno Avenue intersection operates above the LOS standard under No Project conditions; however, worsens to LOS E with the addition of the Max Office and Max Housing scenarios. Modifying the intersection cycle length with the addition of the Project would improve operations to LOS D. At the Traeger Avenue/San Bruno intersection, the side street stop-controlled intersection deteriorates in the cumulative year. The addition of the Project worsens conditions due to the side street stop-controlled approach. To improve operations, the Traeger Avenue/San Bruno Avenue intersection should be signalized.
The I-280 Southbound Ramp/Sneath Lane intersection exceeds the LOS D standard at the intersection under No Project conditions. The addition of the project would worsen conditions. Intersection operations would slightly improve by modifying the northbound (off-ramp) approach to include a left turn-pocket, thru lane, and free right turn, and modifying the signal cycle length to 150 seconds. Implementing these potential improvements would not improve conditions such that the intersection operates at or better the LOS standard (LOS D).
PM Peak Hour
As shown in Table 8, all intersections perform at the LOS standard under No Project and Plus Project conditions with exception to the following intersections:
I-280 Northbound Ramps/San Bruno Avenue Cherry Avenue/San Bruno Avenue Traeger Avenue/San Bruno Avenue
Bayhill Specific Plan Alternatives Analysis July 12, 2018 Page 13 of 15
El Camino Real/San Bruno Avenue El Camino Real /Sneath Lane
To improve intersection operations, the following improvements could be considered at each of the intersections:
I-280 Northbound Ramps/San Bruno Avenue: Add a third westbound through lane with a turn pocket at the intersection and modify the signal cycle length to 130 seconds.
Cherry Avenue/San Bruno Avenue: Convert southbound through lane to a shared thru-right and add a westbound right turn only pocket. The signal cycle length should be modified to 150 seconds and the northbound and southbound left turn lanes should be modified to provide protected left turns.
Traeger Avenue/San Bruno Avenue: signalize the intersection and provide a protected eastbound left turn lane at San Bruno Avenue.
El Camino Real/San Bruno Avenue: optimize signal timings. El Camino Real /Sneath Lane: optimize signal timings and convert the eastbound and
westbound left turns into a protected left turn with a westbound leading phase.
The addition of the above improvements would improve intersection operations such that the intersections operate at or better than the LOS standard.
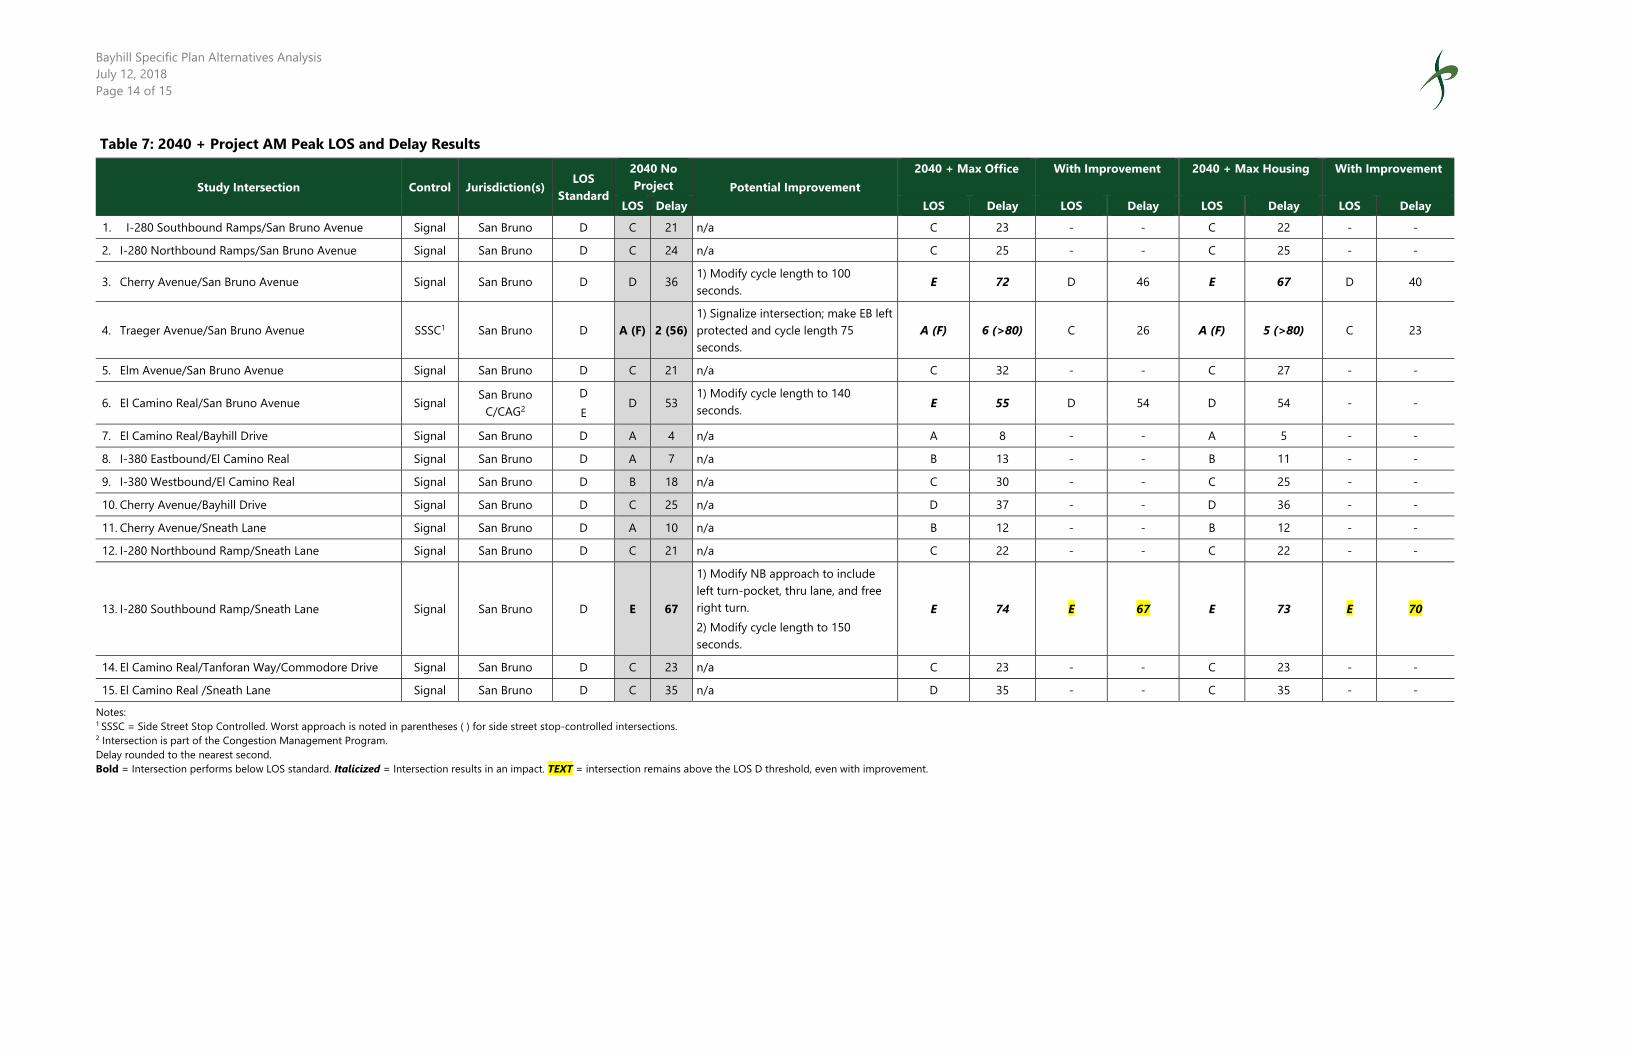
Bayhill Specific Plan Alternatives Analysis July 12, 2018 Page 14 of 15
Table 7: 2040 + Project AM Peak LOS and Delay Results
Study Intersection Control Jurisdiction(s) LOS Standard
2040 No Project Potential Improvement
2040 + Max Office With Improvement 2040 + Max Housing With Improvement
LOS Delay LOS Delay LOS Delay LOS Delay LOS Delay 1. I-280 Southbound Ramps/San Bruno Avenue Signal San Bruno D C 21 n/a C 23 - - C 22 - - 2. I-280 Northbound Ramps/San Bruno Avenue Signal San Bruno D C 24 n/a C 25 - - C 25 - -
3. Cherry Avenue/San Bruno Avenue Signal San Bruno D D 36 1) Modify cycle length to 100 seconds. E 72 D 46 E 67 D 40
4. Traeger Avenue/San Bruno Avenue SSSC1 San Bruno D A (F) 2 (56) 1) Signalize intersection; make EB left protected and cycle length 75 seconds.
A (F) 6 (>80) C 26 A (F) 5 (>80) C 23
5. Elm Avenue/San Bruno Avenue Signal San Bruno D C 21 n/a C 32 - - C 27 - -
6. El Camino Real/San Bruno Avenue Signal San Bruno C/CAG2
D E D 53 1) Modify cycle length to 140
seconds. E 55 D 54 D 54 - -
7. El Camino Real/Bayhill Drive Signal San Bruno D A 4 n/a A 8 - - A 5 - - 8. I-380 Eastbound/El Camino Real Signal San Bruno D A 7 n/a B 13 - - B 11 - - 9. I-380 Westbound/El Camino Real Signal San Bruno D B 18 n/a C 30 - - C 25 - - 10. Cherry Avenue/Bayhill Drive Signal San Bruno D C 25 n/a D 37 - - D 36 - - 11. Cherry Avenue/Sneath Lane Signal San Bruno D A 10 n/a B 12 - - B 12 - - 12. I-280 Northbound Ramp/Sneath Lane Signal San Bruno D C 21 n/a C 22 - - C 22 - -
13. I-280 Southbound Ramp/Sneath Lane Signal San Bruno D E 67
1) Modify NB approach to include left turn-pocket, thru lane, and free right turn. 2) Modify cycle length to 150 seconds.
E 74 E 67 E 73 E 70
14. El Camino Real/Tanforan Way/Commodore Drive Signal San Bruno D C 23 n/a C 23 - - C 23 - - 15. El Camino Real /Sneath Lane Signal San Bruno D C 35 n/a D 35 - - C 35 - -
Notes: 1 SSSC = Side Street Stop Controlled. Worst approach is noted in parentheses ( ) for side street stop-controlled intersections. 2 Intersection is part of the Congestion Management Program. Delay rounded to the nearest second. Bold = Intersection performs below LOS standard. Italicized = Intersection results in an impact. TEXT = intersection remains above the LOS D threshold, even with improvement.
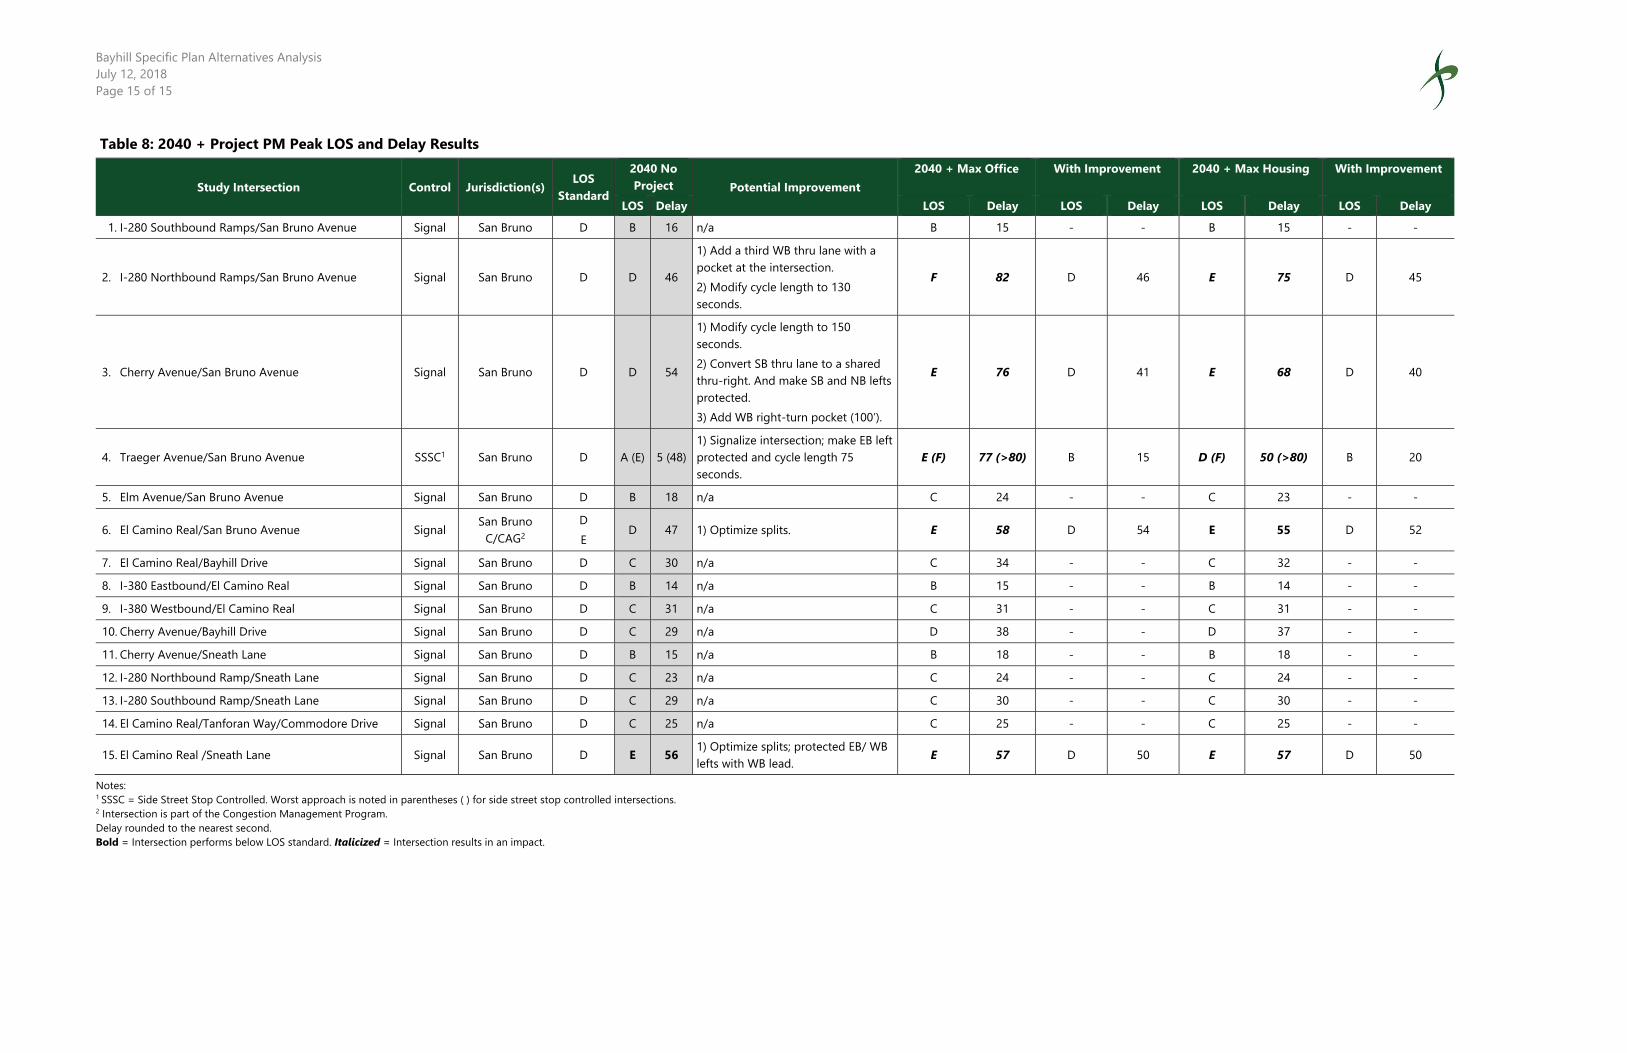
Bayhill Specific Plan Alternatives Analysis July 12, 2018 Page 15 of 15
Table 8: 2040 + Project PM Peak LOS and Delay Results
Study Intersection Control Jurisdiction(s) LOS Standard
2040 No Project Potential Improvement
2040 + Max Office With Improvement 2040 + Max Housing With Improvement
LOS Delay LOS Delay LOS Delay LOS Delay LOS Delay 1. I-280 Southbound Ramps/San Bruno Avenue Signal San Bruno D B 16 n/a B 15 - - B 15 - -
2. I-280 Northbound Ramps/San Bruno Avenue Signal San Bruno D D 46
1) Add a third WB thru lane with a pocket at the intersection. 2) Modify cycle length to 130 seconds.
F 82 D 46 E 75 D 45
3. Cherry Avenue/San Bruno Avenue Signal San Bruno D D 54
1) Modify cycle length to 150 seconds. 2) Convert SB thru lane to a shared thru-right. And make SB and NB lefts protected. 3) Add WB right-turn pocket (100’).
E 76 D 41 E 68 D 40
4. Traeger Avenue/San Bruno Avenue SSSC1 San Bruno D A (E) 5 (48) 1) Signalize intersection; make EB left protected and cycle length 75 seconds.
E (F) 77 (>80) B 15 D (F) 50 (>80) B 20
5. Elm Avenue/San Bruno Avenue Signal San Bruno D B 18 n/a C 24 - - C 23 - -
6. El Camino Real/San Bruno Avenue Signal San Bruno C/CAG2
D E D 47 1) Optimize splits. E 58 D 54 E 55 D 52
7. El Camino Real/Bayhill Drive Signal San Bruno D C 30 n/a C 34 - - C 32 - - 8. I-380 Eastbound/El Camino Real Signal San Bruno D B 14 n/a B 15 - - B 14 - - 9. I-380 Westbound/El Camino Real Signal San Bruno D C 31 n/a C 31 - - C 31 - - 10. Cherry Avenue/Bayhill Drive Signal San Bruno D C 29 n/a D 38 - - D 37 - - 11. Cherry Avenue/Sneath Lane Signal San Bruno D B 15 n/a B 18 - - B 18 - - 12. I-280 Northbound Ramp/Sneath Lane Signal San Bruno D C 23 n/a C 24 - - C 24 - - 13. I-280 Southbound Ramp/Sneath Lane Signal San Bruno D C 29 n/a C 30 - - C 30 - - 14. El Camino Real/Tanforan Way/Commodore Drive Signal San Bruno D C 25 n/a C 25 - - C 25 - -
15. El Camino Real /Sneath Lane Signal San Bruno D E 56 1) Optimize splits; protected EB/ WB lefts with WB lead. E 57 D 50 E 57 D 50
Notes: 1 SSSC = Side Street Stop Controlled. Worst approach is noted in parentheses ( ) for side street stop controlled intersections. 2 Intersection is part of the Congestion Management Program. Delay rounded to the nearest second. Bold = Intersection performs below LOS standard. Italicized = Intersection results in an impact.
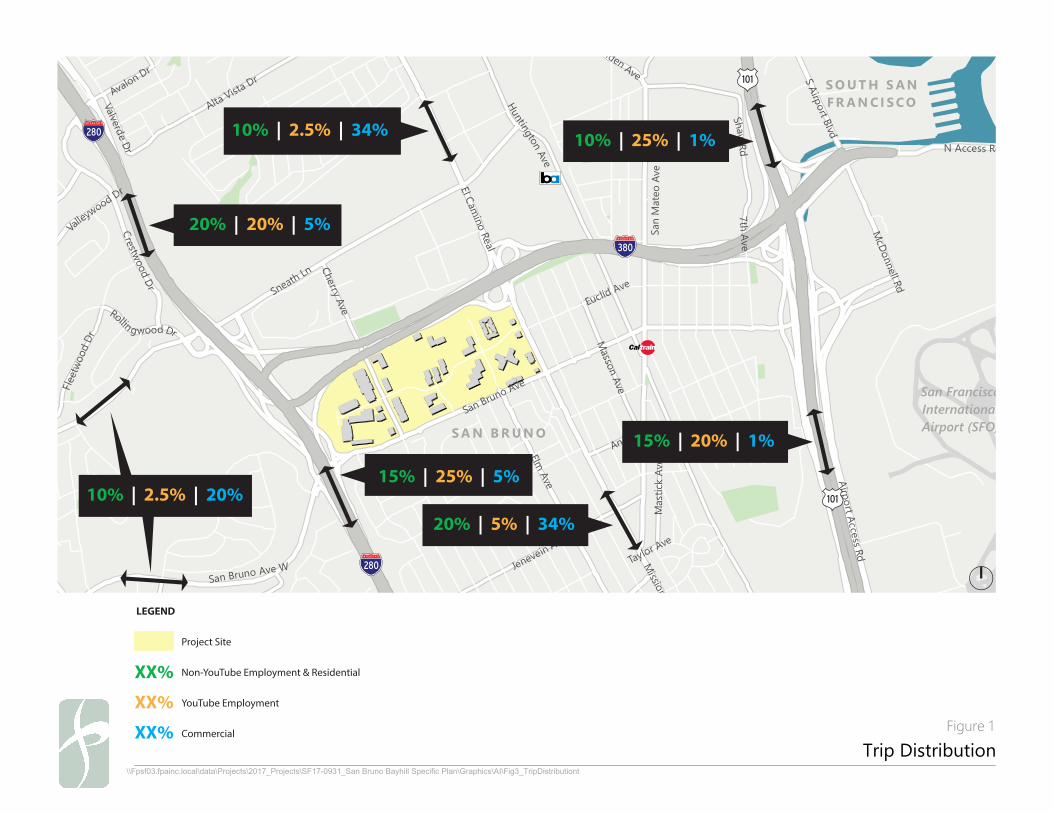
7th Ave
Taylor Ave
Rollin gwood Dr
Euclid Ave
San
Mat
eo A
ve
McDonnell Rd
Mission St
Valverde Dr
SL inden Ave
Valleywood Dr
Angus Ave W
N Access Rd
Avalon Dr
San Bruno Ave
Mas
tick
Ave
Fleet
wood
Dr Masson Ave
CrestwoodDr
Airport Access Rd
Cherry Ave
S Airport Blvd
ShawRd
Jenevein Ave
Alta Vista Dr
Elm Ave
HuntingtonAve
Sneath Ln
El Camino Real
San Bruno Ave W
S A N B R U N O
S O U T H S A NF R A N C I S C O
San FranciscoInternationalAirport (SFO)
Trip DistributionFigure 1
\\Fpsf03.fpainc.local\data\Projects\2017_Projects\SF17-0931_San Bruno Bayhill Specific Plan\Graphics\AI\Fig3_TripDistributiont
LEGEND
Project Site
Non-YouTube Employment & Residential
YouTube Employment
Commercial
XX%
XX%
XX%
101
101
280
280
380
10% | 25% | 1% 10% | 2.5% | 34%
15% | 20% | 1%
20% | 5% | 34%
10% | 2.5% | 20%
20% | 20% | 5%
15% | 25% | 5%

Recommended