A N N U A L R E P O R T 2 0 0 2
TRANSPAC INDUSTRIALHOLDINGS LIMITED
Brought to you by Global Reports

Printed by Xpress Print Pte Ltd (65) 6880 2388
Brought to you by Global Reports

CONTENTS
Corporate Information ....................................................................................................................... 1
Chairman’s Statement ........................................................................................................... ............. 2
Financial Review by the Investment Manager .................................................................................. 3
Top Fifteen Investments ................................................................................................................... 5
Corporate Governance Report .......................................................................................................... 8
Directors’ Report ............................................................................................................................... 13
Statement by Directors ...................................................................................................................... 18
Auditors’ Report ............................................................................................................................... . 19
Income Statement ............................................................................................................... ................ 21
Balance Sheet .................................................................................................................. ................... 22
Statement of Changes in Equity ........................................................................................................ 23
Cash Flow Statement ......................................................................................................................... 24
Notes to the Financial Statements ..................................................................................................... 25
Consolidated Financial Statements of Foodstar Holdings Pte Ltd
and Its Subsidiaries ............................................................................................................................ 40
Shareholding Statistics ........................................................................................................ ............... 69
Notice of Ninth Annual General Meeting ......................................................................................... 71
Proxy Form
Brought to you by Global Reports

Transpac Industrial Holdings Limited and Its Subsidiaries
1
Corporate
Information
Board of Directors
Lock Sai Hung (Chairman)
Cheng Wai Keung
Ng Ser Miang
Leong Ka Cheong Christopher
Andrew Jonathan Lebus
Liong Tong Kap
Company Secretaries
Tham Shook Han, FCIS
Madelyn Kwang Yeit Lam, ACIS
Investment Manager
Transpac Capital Pte Ltd
6 Shenton Way #20-09
DBS Building Tower Two
Singapore 068809
Audit Committee
Cheng Wai Keung (Chairman)
Ng Ser Miang
Liong Tong Kap
Nominating and Remuneration Committees
Lock Sai Hung
Cheng Wai Keung
Ng Ser Miang
Leong Ka Cheong Christopher
Andrew Jonathan Lebus
Liong Tong Kap
Registrars and Share Transfer Office
Lim Associates (Pte) Ltd
10 Collyer Quay #19-08
Ocean Building
Singapore 049315
Banker
The Development Bank of Singapore Ltd
Shenton Way Branch
6 Shenton Way
Singapore 068809
Auditors
PricewaterhouseCoopers
Certified Public Accountants
8 Cross Street #17-00
PWC Building
Singapore 048424
Partner in charge of audit:
Chua Kim Chiu
(with effect from financial year ended 31 Dec
2002)
Registered Office
6 Shenton Way #20-09
DBS Building Tower Two
Singapore 068809
Tel : 65 - 6224 1211
Fax : 65 - 6225 5538
Brought to you by Global Reports

Transpac Industrial Holdings Limited and Its Subsidiaries
2
Chairman’s
Statement
Against the backdrop of a weak global economic environment, the value of investments both private and
public have been adversely affected by depressed markets and scarce liquidity. The Company continues
to look for opportunities to divest or in some instances to build value within its existing portfolio with
a view to enhancing value for future divestment and is encouraged by the potential of some of its
investments in China —although this will take time.
The Company is a venture capital investment company providing capital to private companies, and its
income is primarily derived from the results of the realization and/or revaluation of investments. For the
financial year ended 31 December 2002, the Company recorded an operating loss after tax of S$1.1
million compared to an operating profit after tax of S$0.9 million for the previous year. The decline in
results was primarily related to a net change in the provision for diminution in value offset by an overall
gain in divestment of certain investments. These items are further explained in the Investment Manager’s
Report.
Dividend
The Board has proposed an exempt one-tier ordinary dividend of S$0.04 per share amounting to S$1.6
million for the year ended 31 December 2002. The Board has also proposed a special exempt one-tier
dividend of S$0.08 per share amounting to S$3.2 million for the year ended 31 December 2002. The
proposed ordinary and special dividends are subject to the approval of shareholders at the forthcoming
annual general meeting.
Under the new one-tier corporate taxation system effective 1 January 2003, the Company enjoys
greater flexibility in the payment of dividends. Accordingly, the Board has adopted a policy of distributing
special dividends as the Company’s profits from divestments permit.
Forward Looking Projections
The Board of Directors has noted that forecasting profitability for the Company, whose income derives
mainly from the realization and movements in the valuation of investments, is subject to volatility. The
valuation of investments is dependent on the economic environment, the portfolio companies’ performance
and the state of the equity markets. Accordingly, the Board and the Investment Manager have not
provided any specific forward looking guidance but have commented on the investment industry in
general as well as several general aspects of the Company’s portfolio.
Net Asset Value
The net asset value of the Company as at 31 December 2002 was S$3.14 per share, a decrease of 2 %
from that at 31 December 2001.
Lock Sai Hung
Chairman
26 March 2003
Brought to you by Global Reports

Transpac Industrial Holdings Limited and Its Subsidiaries
3
Financial Review by the
Investment Manager
1. Financial Performance
In the financial year 2002, the Company made one follow-on investment and several partial
divestments. At the end of the 2002, the Company’s investment portfolio had a carrying value
S$109.92 million compared to a cost of S$178.48 million and included 28 companies. Transpac
Capital Pte Ltd, the Investment Manager of the Company, believes the provision for diminution
in value reflected herein is sufficient.
Given the significant difficulties in the trade and industrial environment throughout the world, the
overall outlook for the investment industry is difficult. The equity markets continue to be depressed
with exits difficult to find. The listed securities markets are especially weak resulting in thin
trading opportunities and limiting exit opportunities for all investment managers. However, the
Investment Manager of the Company believes that a number of the investments in China will bring
significant value to the Company as they mature over the next several years.
The Company recorded a net loss after tax of S$1.1 million for the financial year ended 31
December 2002. The loss resulted primarily from a S$3.6 million provision for diminution in
value of a biotech investment. Due to a poor capital market environment, the biotech firm failed
to achieve an intended IPO and went through a private financing round at a low valuation. In line
with the Company’s valuation policy, the investment was written down to the valuation of the
new round, notwithstanding that the business continues to meet its targets and the investment
may well generate profits for the Company in the long run. The Company committed to a follow-
on investment of S$3.2 million along with the new investors. This commitment was partially
disbursed in 2002 with a balance of S$2.1 million to be funded in 2003. There were no other new
investments or follow-on investments for the financial year end 31 December 2002.
The Company substantially completed a divestment of an unquoted investment generating S$5.7
million in investment gains that was offset by a loss of S$1.3 million on the divestment of shares
in three quoted investments.
During the year Foodstar Holdings Pte Ltd (“Foodstar”), an investment with operations in China,
went through a restructuring to focus only on branded seasoning products, which the Investment
Manager believes will enhance the value of the business. Accordingly, Foodstar incurred a
restructuring charge of S$11.9 million and a loss of S$6.3 million from the discontinued non-
seasonings businesses, resulting in Foodstar suffering a net loss after tax of S$15.8 million. If this
loss were consolidated into the accounts of the Company, the Company’s loss for the financial
year ended 31 December 2002 would increase by S$8.6 million after taking into account minority
interest and consolidation adjustment. Notwithstanding the restructure charge and the losses on
discontinued operations, the Company’s share of Foodstar’s net asset value stands at S$36.1
million compared to the Company’s investment cost of S$36.9 million. Although there is a slight
shortfall in the share of net assets against cost as a result of the restructuring, the Investment
Manager believes that there has been no permanent impairment in the value of the Foodstar
Group. The Investment Manager believes that Foodstar will eventually provide value to the
Company. Despite poor market sentiments and harsh business environment, the Investment
Manager will persevere in its efforts to create exit opportunities for its investments and believe
that many of the companies in the portfolio especially in China have made significant progress and
will eventually provide substantial additional value to the Company which will flow through to
shareholders over time.
2. Risk Management
Operation Risk
The investments made by the Company are primarily in private companies, which are generally
illiquid in nature. In addition to general business risks in any investment, such investments can be
adversely affected by political instability as well as exchange controls, changes in taxation laws,
foreign investment policies and other restrictions and controls which may be imposed by the
relevant authorities of the countries in which investments are made.
Brought to you by Global Reports

Transpac Industrial Holdings Limited and Its Subsidiaries
4
At 31 December 2002, the Company’s investment portfolio comprised 28 investments of which
14 are located in China/Hong Kong; 3 in Indonesia; 2 in Malaysia; 2 in Singapore; 4 in Taiwan; 2
in USA and 1 in Thailand. In considering these investments, the Investment Manager has balanced
the reward potential against risk exposure. The geographical spread, the industrial diversity, the
stages of corporate development and the funds invested in each of these investments conformed to
the investment restrictions set out in the Prospectus and as amended by the Board of Directors.
Compliance with these restrictions is exercised by the Investment Manager, reviewed and verified
by the Company’s auditors, and reported to the Directors semi-annually.
Foreign Exchange Risk
The Company makes long-term investments and treats foreign exchange risks as part of the overall
risks to be considered in its investment decisions. The Company does not use any derivative
financial instruments to hedge these exposures.
Interest Rate Risk
The Company’s income and operating cash flows are generated from divestments proceeds and are
substantially independent of changes in market interest rates. The Company’s cash balances are
placed with financial institutions with recognised credit standing. The Company manages its
interest rate risk related to interest earned on available cash by placing cash balances in instruments
with varying maturities and interest rate terms. Preservation of capital is the primary investment
consideration.
Credit Risk
The Company has no significant concentrations of credit risk.
Liquidity Risk
The Company maintains sufficient cash to meet its operating needs.
Yours sincerely
Transpac Capital Pte Ltd
Leong Ka Cheong Christopher
President
26 March 2003
Brought to you by Global Reports

Transpac Industrial Holdings Limited and Its Subsidiaries
5
Top Fifteen Investments
15 Largest Investments as at 31 December 2002
Share of Net Assets
Underlying (at book value) Realised/
Earnings Attributable Unrealised
Directors’ % of For The To Surpluses/
Company Sector Cost Valuation Shareholding Year Investments (Provisions)
S$ S$ S$ S$ S$
Foodstar Holdings Pte Ltd Food 36,912,410 36,912,410 63.50 (8,567,428) #1 36,125,043 #1 0
Sesame Seed Group Limited Financial 19,964,927 ^ 19,964,927 50.00 (541,768) #2 19,340,417 #2 0
Services
Eastern Multimedia Co. Ltd Consumer 15,439,842 15,439,842 4.32 (2,546,994) #2 20,823,205 #2 0
Services
Chian Lin Electronics Co. Ltd Electronics 4,835,724 4,835,724 2.61 8,072 #2 2,065,286 #2 0
Components
Dahe Holding Pte Ltd Industrial 15,440,129 ^ 4,410,648 40.19 (434,204) #4 15,101,380 #4 (11,029,481) *1
Products
Hsu Fu Chi Holdings Ltd Food 3,517,704 3,517,704 7.07 2,160,026 #2 9,903,648 #2 0
Sino Automotive Parts Ltd Industrial 3,500,863 3,500,863 45.31 1,242,008 #2 6,093,507 #2 0
Products
Neo-Neon Holdings Ltd Industrial 3,398,139 3,398,139 16.11 4,761,503 #2 21,041,063 #2 0
Services
Hang Fung Gold Technology Consumer 3,925,910 3,359,752 *2 3.46 282,760 #3 4,428,332 #3 (566,158) *1
Limited Products
Ethypharm (HK) Ltd Healthcare 3,033,576 3,033,576 17.97 (106,403) #2 668,744 #2 0
Lee Chi International Holding Industrial 4,477,246 2,686,189 7.07 93,180 #4 4,099,304 #4 (1,791,057) *1
Ltd Components
Oculex Pharmaceuticals, Inc Healthcare 6,518,312 ^ 2,420,307 1.50 (399,592) #2 671,980 #2 (4,098,005) *1
Yangtze Cement Holdings Materials/ 6,973,418 1,743,355 6.63 (673) #4 7,068,496 #4 (5,230,063) *1
Pte Ltd Chemicals
Ikon Technologies Corporation Information 1,979,587 1,086,790 6.83 (101,649) #1 579,899 #1 (892,797) *1
Services
Atop Holdings Pte Ltd Consumer 2,474,856 1,033,675 9.20 (267,803) #2 1,698,091 #2 (1,441,181) *1
Products
Total 132,392,643 107,343,901 @
^ : Including Loans/Convertible Loans which is included in the value of net assets attributable to investments.
@ : Directors’ Valuation exclude a general provision for diminution in value of investments of S$1,721,568 as at 31 December 2002.
*1 : A Provision for Diminution in Value of Investment was made and this was charged to the income statement in the prior and current years.
*2 : Valuation of Quoted Equity Investment based on market value as at 31 December 2002.
#1 : Based on audited accounts for the year ended 31 December 2002.
#2 : Based on management accounts for the year ended 31 December 2002.
#3 : Based on audited accounts for the last financial year ended 31 March 2002.
#4 : Based on draft audited accounts for the year ended 31 December 2002.
Brought to you by Global Reports

Transpac Industrial Holdings Limited and Its Subsidiaries
6
Notes:
(i) For the financial year ended 31 December 2002, no dividends were received from the above-mentioned companies.
(ii) For Unquoted Investments, there were no extraordinary items related to the investments for the financial year ended 31 December 2002. During the year, an
addition provision was made for diminution in value of unquoted investments of S$3,656,808 and a write-back of provision on disposal of investment of
S$59,153.
(iii) For Quoted Equity Investments, there were no extraordinary items related to the investments for the financial year ended 31 December 2002.
Quoted Equity Investments listed on approved stock exchange were stated at market value as at 31 December 2002.
A revaluation gain of S$634,069 on quoted investments was written back to the Income Statement to offset the previous decrease recognised in the Income
Statement.
(iv) During the year, the Company realised a Profit on Disposal of Quoted Investments of S$109,412 from the divestment of LifeTec Group Limited and Loss on
Disposal of Quoted Investments of S$1,470,189 from the divestment of PT Bukaka Teknik Utama (S$1,089,584) and MeltroniX, Inc (S$380,605). The Company
also realised a Profit on Disposal of Unquoted Investments of S$5,713,330 from the divestment of Colburn Holdings Pte Ltd.
Brought to you by Global Reports

Transpac Industrial Holdings Limited and Its Subsidiaries
7
Distribution of Investments by Country and Industry
as at 31 December 2002
Total At * Valuation
S$ ‘000 China / Indonesia Malaysia Singapore Taiwan Thailand USA Total At Directors’ as %
Hong Kong Cost Valuation of NTA
Agriculture 10,693 10,693 – –
Consumer Products 6,401 6,401 4,393 3.50
Consumer Services 4,775 899 15,440 21,114 15,440 12.30
Electronics Components 4,836 4,836 4,836 3.85
Financial Services 19,965 2,000 21,965 21,965 17.50
Food 40,430 40,430 40,430 32.21
Healthcare 3,185 9 2,866 6,519 12,579 6,651 5.30
Industrial Components 4,477 5,700 10,177 2,686 2.14
Industrial Products 32,947 1,277 34,224 8,515 6.78
Industrial Services 6,001 1,110 7,111 3,897 3.11
Information Services 1,980 1,980 1,087 0.87
Materials/Chemicals 6,973 6,973 1,743 1.39
At Cost 115,902 16,578 2,176 2,009 26,733 2,866 12,219 178,483 111,643 88.95
At Directors’ Valuation 81,423 30 603 2,631 24,049 487 2,420 111,643
Valuation as % of NTA 64.88 0.02 0.48 2.10 19.16 0.38 1.93 88.95
* Excludes the general provision for diminution in value of investments of S$1.722 million as at 31 December 2002
Brought to you by Global Reports

Transpac Industrial Holdings Limited and Its Subsidiaries
8
Corporate Governance Report
Transpac Industrial Holdings Limited (“TIH” or “the Company”) is committed to maintaining a high
standard of corporate governance within the Company, which establishes and maintains an ethical
environment in the Company. The Company and its Investment Manager, Transpac Capital Pte Ltd
(the “Manager” or “Investment Manager”), believe that good corporate governance enhance the interests
of shareholders. This report describes the corporate governance processes and activities with specific
references made to the Code of Corporate Governance guidelines.
The management and operations of the Company have since its inception been delegated to its Investment
Manager via a 10 year Management Agreement. The Company has no executive or employees of its
own.
Board of Directors
The Manager provides detail financial and analytical reports along with any recommendations on matters
to be determined by the Board prior to the Board meetings.
The Board, which has met at least twice a year since inception and will meet at least four times a year
beginning in 2003, supervises the Manager of the Company. The Board meets to consider and decide on
the following Company matters:
� Review the Manager’s report on the performance of the Company’s investments and reviews
and approves the valuation of such investments by the Manager;
� Approval of quarterly results announcements;
� Approval of the annual report and accounts;
� Declaration of interim dividends and proposal of final dividends;
� Convening of shareholders’ meetings;
� Review and approve any changes to the investment policy of the Company that may be proposed
by the Manager from time to time (the Manager has sole discretion in investment/divestment
decisions in accordance with the stipulations of the Prospectus of the Company dated 12 March
1994.);
� Review the allocation of investments between the Company and other funds managed by the
Manager in accordance with the allocation policy of the Company as reflected in the Prospectus;
The Board consists of six members, three independent, two affiliated with significant shareholders and
one affiliated with the Investment Manager to which the management of the Company has been contracted
(and hence its representative is considered an executive director rather than non-executive director of the
Company). The collective experience of the directors and their objective judgement on corporate affairs
are valuable to the Company.
Brought to you by Global Reports
Transpac Industrial Holdings Limited and Its Subsidiaries
9
Nominating and Remuneration Committees and Remuneration Matters
As indicated above the Management of the Company has been contracted to an Investment Manager,
Transpac Capital Pte Ltd. TIH has no executive or employees of its own. Under such circumstances the
Audit Committee has recommended that the Board at large undertake the roles of the Nomination and
Remuneration Committees. The Board has agreed to such an arrangement.
Directors’ fees are paid in arrears after approval by shareholders at the Annual General Meeting. One-
third of the Directors retire at each Annual General Meeting according to length of service. All retiring
Directors shall be eligible for re-election. In 2002 and in prior years, directors’ fees were paid according
to the role undertaken. In 2003 and ongoing, it is expected that directors fees may incorporate a factor for
the number of meetings attended. The Board adheres to ethical principles of conduct that includes self-
assessment of its own performance.
In 2002 the fee schedule was:
Chairman S$30,000
Audit Committee Members S$20,000
Other Non-executive Directors S$12,000
Executive Director no compensation from the Company
TIH does not have an Employee Share Option Scheme for its Directors.
Key Information on Board Members
Details of each Director and their attendance at meetings are provided as follows:
1. The Chairman, Mr Lock Sai Hung has been on the Board since 1994 and assumed the chairmanship
of the Company in January 2002. He brings with him extensive experience in banking and
finance having spent most of his career with DBS Bank, where he was part of the Top Management
team. His career spanned the Economic Development Board, Esso (Petroleum Transport &
Services Inc) and Insurance Corporation of Singapore. He is currently a Director of Raffles
Hospital Pte Ltd, Dovechem Stolthaven Ltd (Audit & Remuneration Committees) and Neptune
Orient Lines Ltd (Audit & Remuneration Committees). Lock Sai Hung is a graduate of the
National University of Singapore with a BA (Hons) degree in Economics.
2. The Chairman of the Audit Committee, Mr Cheng Wai Keung is the Chairman and Managing
Director of the listed Wing Tai Holdings Limited. Currently he is the Chairman of Raffles
Holdings Limited and Neptune Orient Lines Ltd. Mr Cheng holds directorships in a number of
public and private companies, including GP Batteries International Ltd and Mapletree Investments
Pte Ltd. Mr Cheng graduated with a Bachelor of Science degree from Indiana University in 1971
and an MBA from the University of Chicago in 1973.
3. Mr Liong Tong Kap, an Audit Committee member, is Chief Investment Officer with NTUC
Income Insurance Cooperative Ltd. NTUC is a significant shareholder in TIH.
4. Mr Ng Ser Miang, an Audit Committee member, is Chairman of TIBS International Pte Ltd and
NTUC Choice Homes Co-operative Ltd. He is also a member of APEC Business Advisory
Council (ABAC).
5. Mr Andrew J Lebus is affiliated with Pantheon, which is a significant shareholder in TIH. Mr
Andrew Lebus has been involved with private equity over the last 17 years and is a partner with
Pantheon Ventures Limited and senior member of Pantheon’s investment team with responsibility
for international strategic development. In addition, he has special responsibility for Pantheon
International Participations PLC, the group’s flagship investment trust. Andrew, who has spent
eight years in the group’s Hong Kong office, also oversees Pantheon’s Asia activities, determining
investment strategy and overseeing selection and monitoring.
Brought to you by Global Reports

Transpac Industrial Holdings Limited and Its Subsidiaries
10
6. Dr Christopher Leong is the co-founder and President of Transpac Capital Pte Ltd, the Investment
Manager. The Investment Manager was founded in 1989 and is headquartered in Singapore with
offices in Beijing, Hong Kong, Shanghai and Taiwan and manages private equity funds in excess
of S$1 billion. From 1980 to 1986, Dr Leong was Managing Director of Amoy Canning
Corporation, a publicly listed company in Hong Kong in the food, paper packaging and property
development businesses. In 1973 Dr Leong found Convenience Foods in Hong Kong, which he
sold to RJR Nabisco in 1977. Dr Leong has also served as Senior Scientist at American Science
and Engineering in Cambridge, Massachusetts, 1970-71. Dr Leong received his PhD and SB and
degrees from Massachusetts Institute of Technology in 1970 and 1965 respectively and has also
studied food sciences at the Michigan State University.
Name of Director Date of Nature of Last date of Number of Number of
Appointment Appointment re-election/ Board Meetings Audit
Appointment attended in Committee
2002 Meetings
attended in
2002
Lock Sai Hung 11 August 1994 Non-Executive/ 16 May 2001 2 of 2 Not an audit
(Age: 61) Chairman/ commitee
Independent member
Christopher Leong 7 February 1994 Representing the 16 May 2002 2 of 2 2 of 2
Ka Cheong Investment Manager By invitation
(Age: 59) / Non-Independent of the Audit
Commitee
Cheng Wai Keung 17 February 1994 Chairman of Audit 16 May 2001 2 of 2 2 of 2
(Age: 53) Committee/
Non-Executive/
Independent
Ng Ser Miang 17 February 1994 Member of Audit 16 May 2002 1 of 2 2 of 2
(Age: 54) Committee/
Non-Executive/
Independent
Liong Tong Kap 12 April 2001 Member of Audit 16 May 2001 1 of 2 1 of 2
(Age: 48) Committee/
Non-Executive/
Non-Independent
Andrew Lebus 12 April 2001 Non-Executive/ 16 May 2001 2 of 2 Not an audit
(Age: 42) Non-Independent committee
member
Some of the Board members own shares in the Company or are affiliated with Companies that own
shares in the Company. This is disclosed in the Annual Report.
It should be noted that employees of the Investment Manager serve as directors on substantially all the
boards of portfolio companies as part and parcel of their duty in the monitoring of the performance of
these portfolio companies.
For example, Mr Harry Leong (director and SVP of the Investment Manager), Ms Cheryl Van Steenwyk
(director and CFO of the Investment Manager) and Mr Will Hoon (director and EVP of the Investment
Manager) serve on the Board of Foodstar Holdings Pte Ltd, a material investment of the Company.
They are not drawing any directors’ fees or receiving any remuneration from Foodstar. Mr Harry Leong
is the brother of Dr Christopher Leong (CEO of the Investment Manager and a director of the Company).
The Investment Manager reports the performance of the investments to the Board after reviews by the
Auditors and the Audit Committee of investment guideline compliance and valuation principles. Board
members are provided with financials together with the recommendation of the Investment Manager on
any changes on the valuation of TIH’s investment portfolio.
The Investment Manager prepares quarterly rather than monthly financials consistent with practices in
private equity and venture capital management. The Board of TIH together with its Investment Manager
is of the opinion that quarterly financial statements along with the Management Agreement, Prospectus,
and Articles of Association are sufficient in evaluating performance and defining responsibility that
ensures that Board procedures are followed and applicable rules and regulations are complied with.
Brought to you by Global Reports
Transpac Industrial Holdings Limited and Its Subsidiaries
11
Audit Committee
The Audit Committee comprises three directors, two of whom are independent and one of whom is
affiliated with a significant shareholder.
Prior to each Board meeting, the Audit Committee meets to review and consider the Manager’s reports
on investment guideline compliance and valuation prior to their presentation to the Board. Additionally,
the Audit Committee is responsible for the meeting with the Company’s auditors and reviewing its
systems of internal control. Among other things, the Audit Committee has directed that the auditors
review that the operations of the Company are in accordance with investment restrictions and investment
allocations as set out in the prospectus. The Audit Committee is also responsible for reviewing and
resolving any potential conflicts of interest between the Investment Manager and the Company.
The Audit Committee performs the following functions:
� Reviews the audit plans of the Company’s external auditors and ensures the adequacy of the
system of accounting controls and the co-operation given by the Manager to the auditors;
� Reviews the financial statements and the auditors’ report of the Company before their submission
to the Board of Directors;
� Reviews with the Manager the internal controls in respect of the Manager and the Company;
� Reviews legal and regulatory matters that may have a material impact on the financial statements,
related compliance policies and programmes and any reports received from regulators;
� Reviews the cost effectiveness and the independence and objectivity of the external auditors;
� Reviews the nature and extent of non-audit services provided by the external auditors;
� Reviews the assistance given by the Manager to the auditors;
� Nominates the external auditor; and
� Reviews interested person transactions in accordance with the requirements of the listing rules
of the Singapore Exchange.
Details of Audit Committee members and their attendance at meetings are provided on pages 9 and 10.
The Audit Committee having reviewed all non-audit services provided by PricewaterhouseCoopers, the
external auditors, are satisfied that the nature and extent of such services would not affect its independence
as the external auditors.
Brought to you by Global Reports

Transpac Industrial Holdings Limited and Its Subsidiaries
12
Internal Controls and Internal Audit
The day-to-day operation has been delegated to the Investment Manager in accordance with the
Prospectus of the Company and a related 10 year Management Agreement, and this has been disclosed
in the Company’s Annual Reports. The Investment Manager operates under a set of investment
strategy, criteria and guidelines stipulated in the Prospectus of the Company and whose changes are
subject to the approval of TIH’s Board of Directors. At the request of the Audit Committee, compliance
with these rules are checked semi-annually by the external auditors of TIH.
To avoid any potential conflict of interest, the external auditor of the Company is different from the
external auditor of the Investment Manager.
The Board believes that the system of internal control maintained by the Manager that was in place
throughout the financial year and up to the date of this report provides:
� Reasonable assurance against material financial misstatements;
� Maintenance of proper accounting records;
� Compliance with appropriate legislation, regulation and best practices; and
� Identification and containment of business risk.
The Investment Manager has adopted Internal Control Procedures (“ICP”) that are well documented and
updated regularly. The Investment Manager’s ICP include among other things, procedures for investments
and divestments, management of portfolio companies, compliance with financial, administration and
legal controls. The Board notes that no system of internal control can provide absolute assurance against
the occurrence of material errors, poor judgement in decision-making, human error, losses, fraud or other
irregularities. Accordingly, the Board and the Investment Manager have agreed that TIH does not need
to establish internal audit.
Shareholder Communication
The Board is mindful of the obligation to provide timely and fair disclosure of material information in
accordance with the Corporate Disclosure Policy of the Singapore Exchange.
The Board welcomes the views of shareholders on matters affecting the Company, whether at the
shareholders’ meetings or on an ad hoc basis.
Securities Transactions
In 1998, following the introduction of the Best Practices Guide by the Singapore Exchange Limited, the
Company adopted a Policy on Share Dealings including guidance on transactions in the Company’s
shares. The policy is applicable to Directors, the Investment Manager, and any key employees of the
Company and sets out the implications of insider trading and the recommendations of the Best Practices
Guide.
Brought to you by Global Reports

Transpac Industrial Holdings Limited and Its Subsidiaries
13
Directors’ Report
he directors present their report to the members together with the audited financial statements
of the Company and the separate consolidated financial statements of its subsidiaries for the
financial year ended 31 December 2002.
Directors
The directors in office at the date of this report are:
Lock Sai Hung (Chairman)
Cheng Wai Keung
Ng Ser Miang
Leong Ka Cheong Christopher
Andrew Jonathan Lebus
Liong Tong Kap
Principal activities
The principal activity of the Company is to invest for capital appreciation in equity securities of
growing private companies located in Asia including principally China/Hong Kong SAR, Taiwan,
Singapore, Malaysia, Thailand and Indonesia.
The principal activities of its legal subsidiary, Foodstar Holdings Pte Ltd (“Foodstar”), and its
subsidiaries (“Foodstar Group”), are those of investment holding, manufacture, sale and distribution
of food products.
There have been no significant changes in the nature of these activities during the financial year.
Results for the financial year
Results for the financial year for the Company and Foodstar Group which is 63.5% owned by the
Company are as follows:
The Foodstar
Company Group
$ $
Loss after tax before minority interests (1,086,568) (15,832,489)
Minority interests – 2,340,477
Net loss attributable to shareholders (1,086,568) (13,492,012)
Consolidated financial statements incorporating the financial statements of Foodstar Group have not
been prepared, in accordance with the Company’s accounting policy [see Note 2(b) to the financial
statements].
Consolidated loss after tax and minority interests of Transpac Industrial Holdings Limited would be
increased by approximately $8,567,428 for the financial year ended 31 December 2002 if consolidated
financial statements (incorporating the financial statements of Foodstar Group and after effecting
adjustments relating to intercompany balances) are prepared.
T
Brought to you by Global Reports

Transpac Industrial Holdings Limited and Its Subsidiaries
14
Material transfers to or from reserves and provisions
Details of material movements in reserves during the financial year are set out in the Statement of
Changes in Equity and notes to the financial statements.
Material movements in provisions during the financial year are set out in the notes to the financial
statements.
Acquisition and disposal of subsidiaries
During the financial year, the following subsidiary of Foodstar Group was incorporated.
Country of Company’s
incorporation effective equity Cost of
Name of company and business interest held investment Principal activities
Foodstar (China) China 63.5% RMB37,221,600 Investment holding
Investments
Company Limited
For information, the average exchange rates during the year ended 31 December 2002 were S$1 =
HK$4.37 and S$1 = RMB4.64.
There were no other acquisitions or disposals of interests in subsidiaries during the financial year.
Issue of shares and debentures
During the financial year:
(a) Foodstar Holdings Pte Ltd increased its authorised ordinary share capital from $28 million to
$45 million by the creation of 17 million new ordinary shares of par value of $1 each.
(b) Foodstar Holdings Pte Ltd increased its issued ordinary share capital from $25,405,441 to
$40,933,164 by converting shareholders’ loans into 15,527,723 ordinary shares of $1 each
issued as fully paid at a premium of $0.8247 per share for the purpose of enlarging its capital
base. The newly issued shares rank pari passu in all respects with the previously issued
shares.
(c) Foodstar (China) Investments Company Limited was incorporated with an initial paid-up
capital of RMB37,221,600 for the purpose of providing initial working capital.
There were no other issues of shares or debentures by any corporation in the Group during the
financial year.
Brought to you by Global Reports

Transpac Industrial Holdings Limited and Its Subsidiaries
15
Arrangements to enable directors to acquire shares and debentures
Neither at the end of nor at any time during the financial year was the Company a party to any
arrangement whose object is to enable the directors of the Company to acquire benefits by means of
the acquisition of shares and debentures of the Company or any other body corporate.
Directors’ interests in shares or debentures
The interests of the directors holding office at the end of the financial year in the ordinary shares of
the Company according to the register of directors’ shareholdings were as follows:
Holdings in which
Holdings registered director is deemed
in name of director to have an interest
Name of directors in Description At At At At
which interest held of shares 1.1.2002 31.12.2002 1.1.2002 31.12.2002
Cheng Wai Keung Ordinary shares 1,000 27,000 – –
of $0.50 each
Leong Ka Cheong Ordinary shares 163,001 163,002 – –
Christopher of $0.50 each
Ng Ser Miang Ordinary shares – – 150,000 –
of $0.50 each
There was no change in any of the above-mentioned interests between 31 December 2002 and 21
January 2003.
None of the directors of the Company at the end of the financial year had any interest in the shares or
debentures of any related corporation.
Dividends
Dividends paid, declared and proposed since the end of the Company’s preceding financial year are as
follows:
$
A final tax exempt dividend of 4 cents per share was paid on 12 June
2002 in respect of the financial year ended 31 December 2001 1,600,000
In respect of financial year ended 31 December 2002, the directors propose:
- a first and final exempt one-tier dividend of 4 cents per share; and 1,600,000
- a final special exempt one-tier dividend of 8 cents per share 3,200,000
Bad and doubtful debts
Before the financial statements of the Company were made out, the directors took reasonable steps
to ascertain the action taken in relation to the writing off of bad debts and providing for doubtful
debts of the Company, and have satisfied themselves that all known bad debts of the Company have
been written off and that adequate provision has been made for doubtful debts.
At the date of this report, the directors are not aware of any circumstances which would render any
amounts written off for bad debts or provided for doubtful debts in the Group inadequate to any
substantial extent.
Brought to you by Global Reports

Transpac Industrial Holdings Limited and Its Subsidiaries
16
Current assets
Before the financial statements of the Company were made out, the directors took reasonable steps
to ascertain that any current assets which were unlikely to realise their book values in the ordinary
course of business have been written down to their estimated realisable values or that adequate
provision has been made for the diminution in value of such current assets.
At the date of this report, the directors are not aware of any circumstances, not otherwise dealt with
in this report, which would render the values attributed to current assets in the consolidated financial
statements misleading.
Charges on assets and contingent liabilities
At the date of this report, no charges have arisen since the end of the financial year on the assets of
the Company or any corporation in the Group which secure the liability of any other person, nor
have any contingent liability arisen since the end of the financial year in the Company or any other
corporation in the Group.
Ability to meet obligations
No contingent or other liability of the Company or any other corporation in the Group has become
enforceable or is likely to become enforceable within the period of twelve months after the end of the
financial year which, in the opinion of the directors, will or may substantially affect the ability of the
Company and the Group to meet its obligations as and when they fall due.
Other circumstances affecting the financial statements
At the date of this report, the directors are not aware of any circumstances not otherwise dealt with
in this report or the consolidated financial statements which would render any amount stated in the
financial statements of the Company and the consolidated financial statements misleading.
Unusual items
In the opinion of the directors, the results of the operations of the Company and of the Group during
the financial year have not been substantially affected by any item, transaction or event of a material
and unusual nature, except for the exceptional loss of the Foodstar Group disclosed in Note 4 to the
financial statements of Foodstar Group.
Unusual items after the financial year
In the opinion of the directors, no item, transaction or event of a material and unusual nature has
arisen in the interval between the end of the financial year and the date of this report which would
affect substantially the results of the operations of the Company and of the Group for the financial
year in which this report is made.
Directors’ contractual benefits
Since the end of the previous financial year, no director has received or become entitled to receive a
benefit by reason of a contract made by the Company or a related corporation with the director or
with a firm of which he is a member, or with a company in which he has a substantial financial
interest.
Brought to you by Global Reports

Transpac Industrial Holdings Limited and Its Subsidiaries
17
Share options
No options were granted during the financial year to subscribe for unissued shares of the Company or
its subsidiaries.
15,527,723 shares were issued by the Company’s subsidiary, Foodstar Holdings Pte Ltd, during the
financial year by virtue of the exercise of options granted to shareholders at a current subscription
price of $1.8247 by the conversion of their loans to the Company at 1 January 2002 amounting to
$28,333,899. No other shares were issued during the financial year by virtue of the exercise of
options to take up unissued shares of the Company or its subsidiaries.
There were no unissued shares of the Company or its subsidiaries under option at the end of the
financial year.
Audit Committee
The Audit Committee (“Committee”) as at the date of this report is composed of three members, all
of whom are non-executive directors. The members of the Committee are:
Cheng Wai Keung (Chairman)
Ng Ser Miang
Liong Tong Kap
The Committee carried out its functions in accordance with section 210B(5) of the Singapore
Companies Act. In performing those functions, the Committee reviewed:
(a) the audit plan of the Company’s auditors and their evaluation of the system of internal
accounting controls arising from their audit examination;
(b) the scope and results of external audit procedures;
(c) the guidelines for corporate governance as set forth by the Singapore Exchange Limited; and
(d) the financial statements of the Company for the year ended 31 December 2002 before their
submission to the board of directors and the auditors’ report on those financial statements.
The Committee has nominated PricewaterhouseCoopers for re-appointment as auditors of the
Company at the forthcoming Annual General Meeting.
Auditors
The auditors, PricewaterhouseCoopers have expressed their willingness to accept re-appointment.
On behalf of the directors
LOCK SAI HUNG LEONG KA CHEONG CHRISTOPHER
Chairman Director
26 March 2003
Brought to you by Global Reports

Transpac Industrial Holdings Limited and Its Subsidiaries
18
Statement
by Directors
In the opinion of the directors, the financial statements set out on pages 21 to 68 give a true and fair
view of the state of affairs of the Company and of the Group at 31 December 2002 and of the results
of the business, and changes in equity, of the Company and of the Group and the cash flows of the
Company and the Group for the financial year then ended, and at the date of this statement there are
reasonable grounds to believe that the Company will be able to pay its debts as and when they fall
due.
In the opinion of the directors,
(a) it is preferable in the interests of the shareholders that the consolidated accounts (as defined
in section 209A of the Singapore Companies Act) be prepared other than as one set of
consolidated financial statements. As the principal activity of the Company is to invest
primarily in equity securities with the objective of realising substantial capital gain through
disposal of the investments, and the investment in Foodstar Holdings Pte Ltd and its
subsidiaries (“Foodstar Group”) is held with the same objective, we are of the view that
consolidated financial statements including Foodstar Group would not be meaningful to the
shareholders of the Company; and
(b) the consolidated financial statements so prepared are not significantly affected by
transactions and balances between the Company and its subsidiary companies except to the
extent stated in Note 12 to the financial statements.
On behalf of the directors
LOCK SAI HUNG LEONG KA CHEONG CHRISTOPHER
Chairman Director
26 March 2003
Brought to you by Global Reports

Transpac Industrial Holdings Limited and Its Subsidiaries
19
Auditors’ Report
We have audited the financial statements of Transpac Industrial Holdings Limited (“TIH”) for the
year ended 31 December 2002 as set out on pages 21 to 38 and the separate consolidated financial
statements of the Company’s legal subsidiary, Foodstar Holdings Pte Ltd and its subsidiaries for the
financial year ended 31 December 2002, as attached from pages 40 to 68. These financial statements
are the responsibility of the Company’s directors. Our responsibility is to express an opinion on
these financial statements based on our audit.
We conducted our audit in accordance with Singapore Standards on Auditing. Those Standards require
that we plan and perform the audit to obtain reasonable assurance whether the financial statements
are free of material misstatement. An audit includes examining, on a test basis, evidence supporting
the amounts and disclosures in the financial statements. An audit also includes assessing the
accounting principles used and significant estimates made by the directors, as well as evaluating the
overall financial statement presentation. We believe that our audit provides a reasonable basis for our
opinion.
In our opinion,
(a) the accompanying financial statements are properly drawn up in accordance with the
provisions of the Singapore Companies Act (the “Act”) and Singapore Statements of
Accounting Standard and so as to give a true and fair view of:
(i) the state of affairs of the Company and of the companies in the Group as at 31
December 2002 and of the results and cash flows of the Company and of the
companies in the Group for the year ended on that date; and
(ii) the other matters required by section 201 of the Act to be dealt with in the financial
statements and in the consolidated financial statements; and
(b) the accounting and other records, and the registers required by the Act to be kept by the
Company and by those subsidiaries incorporated in Singapore of which we are the auditors
have been properly kept in accordance with the provisions of the Act.
Without qualifying our opinion, we draw attention to Note 2(b) to the Company’s financial
statements. The Company’s presentation of consolidated accounts (as defined in section 209A of the
Act) by attaching the separate consolidated financial statements of its subsidiaries is not in
accordance with Statement of Accounting Standard No. 26 which requires the preparation of one set
of consolidated financial statements for the Company and its subsidiaries. As the principal activity
of the Company is to invest primarily in equity securities with the objective of realising substantial
capital gain through disposal of the investments, and the investment in Foodstar Holdings Pte Ltd
and its subsidiaries is held with the same objective, we are of the view that consolidation as one set of
financial statements would not be meaningful and accordingly, we concur with the Company’s
presentation of consolidated accounts.
Brought to you by Global Reports

Transpac Industrial Holdings Limited and Its Subsidiaries
20
We have considered the financial statements and auditors’ reports of all subsidiaries of which we have
not acted as auditors, being financial statements included (whether separately or consolidated with
other financial statements) in the consolidated financial statements. The names of these subsidiaries
are stated in Note 12 to the Company’s financial statements.
We are satisfied that the consolidated financial statements of the subsidiaries attached to the financial
statements of the Company are in form and content appropriate and proper for the purposes of the
preparation of the consolidated accounts (as defined in section 209A of the Act), and we have
received satisfactory information and explanations as required by us for those purposes.
The auditors’ reports on the financial statements of the subsidiaries were not subject to any
qualification and in respect of subsidiaries incorporated in Singapore did not include any comment
made under section 207(3) of the Act.
PricewaterhouseCoopers
Certified Public Accountants
Singapore
26 March 2003
Brought to you by Global Reports

Transpac Industrial Holdings Limited and Its Subsidiaries
21
Income Statement
INCOME STATEMENT
FOR THE FINANCIAL YEAR ENDED 31 DECEMBER 2002
Note 2002 2001
$ $
Proceeds from sale of investments
- Quoted equity investments 1,157,530 638,503
- Unquoted equity investments 5,774,555 1,353,078
6,932,085 1,991,581
Cost of investments sold
- Quoted equity investments 2,518,307 1,888,643
- Unquoted equity investments 61,225 1,406,696
2,579,532 3,295,339
Profit/(loss) on sale
- Quoted equity investments (1,360,777) (1,250,140)
- Unquoted equity investments 5,713,330 (53,618)
4,352,553 (1,303,758)
Net change in revaluation and provision
for diminution in value 3 (2,963,586) 4,172,295
Interest income 4 189,819 1,174,472
Dividends from unquoted equity investments 629,483 181,806
Operating expenses 5 (3,295,493) (3,313,392)
(Loss)/profit before tax (1,087,224) 911,423
Tax 7(a) 656 –
Net (loss)/profit (1,086,568) 911,423
(Loss)/earnings per share (cents) 8 (2.72) 2.28
The accompanying notes form an integral part of these financial statements.
Auditors’ Report – Pages 19 and 20.
Brought to you by Global Reports

Transpac Industrial Holdings Limited and Its Subsidiaries
22
Balance Sheet
BALANCE SHEET AS AT 31 DECEMBER 2002
Note 2002 2001
$ $
Current assets
Bank balances 281,537 367,515
Fixed deposits with banks and other
financial institutions 9 15,903,252 13,608,909
Receivables and prepayments 10 396,323 410,280
16,581,112 14,386,704
Non-current assets
Investments 11 109,921,192 114,890,880
Total assets 126,502,304 129,277,584
Current liabilities
Trade and other payables 14 751,125 763,837
Provision for taxation 7(b) 243,169 243,169
994,294 1,007,006
Non-current liability
Deferred taxation 15 – 76,000
Total liabilities 994,294 1,083,006
Net assets 125,508,010 128,194,578
Shareholders’ equity
Share capital 16 20,000,001 20,000,001
Retained profits 13,682,904 16,369,472
33,682,905 36,369,473
Capital reserve 91,825,105 91,825,105
125,508,010 128,194,578
Net tangible asset backing per share 22 3.14 3.20
The accompanying notes form an integral part of these financial statements.
Auditors’ Report – Pages 19 and 20.
Brought to you by Global Reports

Transpac Industrial Holdings Limited and Its Subsidiaries
23
Statement of
Changes in Equity
STATEMENT OF CHANGES IN EQUITY
FOR THE FINANCIAL YEAR ENDED 31 DECEMBER 2002
Retained
profits/
Share (accumulated Capital
Note capital losses) reserve Total
$ $ $ $
2002
Balance at 1 January 2002 20,000,001 16,369,472 91,825,105 128,194,578
Net loss and total recognised
losses for the year – (1,086,568) – (1,086,568)
Dividends for 2001 17 – (1,600,000) – (1,600,000)
Balance at 31 December 2002 20,000,001 13,682,904 91,825,105 125,508,010
2001
Balance at 1 January 2001
- as previously reported 20,000,001 15,458,049 91,825,105 127,283,155
- effect of adopting SAS10 (2000) – 1,200,000 – 1,200,000
- as restated 20,000,001 16,658,049 91,825,105 128,483,155
Net profit and total recognised
gains for the year – 911,423 – 911,423
Dividends for 2000 17 – (1,200,000) – (1,200,000)
Balance at 31 December 2001 20,000,001 16,369,472 91,825,105 128,194,578
The accompanying notes form an integral part of these financial statements.
Auditors’ Report – Pages 19 and 20.
Brought to you by Global Reports

Transpac Industrial Holdings Limited and Its Subsidiaries
24
Cash Flow Statement
CASH FLOW STATEMENT
FOR THE FINANCIAL YEAR ENDED 31 DECEMBER 2002
2002 2001
$ $
Cash flows from operating activities
(Loss) / profit before tax (1,087,224) 911,423
Adjustments for:
Revaluation surplus on quoted investments (634,069) (1,172,295)
Provision/(write-back) for diminution in value of
unquoted investments 3,597,655 (3,000,000)
Operating profit/(loss) before operating assets and liabilities 1,876,362 (3,260,872)
Net changes in operating assets and liabilities:
Net decrease in long term investments at cost 2,006,102 3,372,861
Decrease in receivables 13,957 67,418
(Decrease)/increase in payables (12,712) 10,607
Cash generated from operations 3,883,709 190,014
Tax (paid)/refund (75,344) 847
Net cash provided by operating activities 3,808,365 190,861
Cash outflow from financing activity
Dividends paid (1,600,000) (1,200,000)
Net change in cash and cash equivalents 2,208,365 (1,009,139)
Cash and cash equivalents at beginning of year 13,976,424 14,985,563
Cash and cash equivalents at end of year 16,184,789 13,976,424
Cash and cash equivalents
Cash and cash equivalents consist of balances
with banks as follows:
Bank balances 281,537 367,515
Fixed deposits with banks and other financial institutions 15,903,252 13,608,909
16,184,789 13,976,424
The accompanying notes form an integral part of these financial statements.
Auditors’ Report – Pages 19 and 20.
Brought to you by Global Reports
Transpac Industrial Holdings Limited and Its Subsidiaries
25
Notes to the Financial Statements
NOTES TO THE FINANCIAL STATEMENTS
FOR THE FINANCIAL YEAR ENDED 31 DECEMBER 2002
These notes form an integral part of and should be read in conjunction with the accompanying
financial statements.
1. General
The Company is incorporated and domiciled in Singapore and is listed on the Singapore
Exchange. The registered address of the Company is as follows: 6 Shenton Way #20-09, DBS
Building Tower 2, Singapore 068809.
The directors or shareholders holding at least 10% of the voting rights may petition for the
Company to be liquidated if it fails to distribute the equivalent of $200 million in gross cash
dividends, bonus shares or distribution in specie over a 12 year period from the date of
incorporation, 7 February 1994. As at 31 December 2002, the Company has distributed
$10,800,000.
The principal activity of the Company is to invest in equity or equity related instruments in
private companies in Asia to achieve capital appreciation.
2. Significant accounting policies
(a) Basis of preparation
The financial statements have been prepared in accordance with Singapore Statements
of Accounting Standard.
The financial statements have been prepared under the historical cost basis except for
the measurement at fair value of certain investments.
The financial statements are expressed in Singapore Dollars.
In 2002, the Company adopted SAS 12 (2001) Income Taxes.
(b) Basis of consolidation
The Company’s 63.5% equity investment in Foodstar Holding Pte Ltd (“Foodstar”)
and its subsidiary companies (“Foodstar Group”) has not been consolidated since the
directors are of the view that the investment in Foodstar Group was made with the
same objective as any other investment of the Company, namely realisation of capital
appreciation through disposal, and hence consolidation is not meaningful for
shareholders.
To comply with Singapore Companies Act, the Group’s consolidated accounts (as
defined in section 209A of the Companies Act) are presented by attaching the
separate consolidated financial statements of Foodstar Group to the financial
statements of the Company.
The consolidated accounts so prepared are not significantly affected by transactions
and balances between the Company and its subsidiaries, other than as disclosed in
Note 12.
(c) Investment in subsidiaries
Investment in subsidiaries is stated in the financial statements of the Company at cost
and a provision is made for any diminution in value that is other than temporary.
Loans convertible to ordinary shares are included in cost of investment.
Brought to you by Global Reports

Transpac Industrial Holdings Limited and Its Subsidiaries
26
(d) Investments
(i) Unquoted investments (including convertible loans) are stated at cost.
Unquoted investments of 20% to 50% of the equity of the investee companies
are not deemed to be associated companies because the Company does not
participate in or exercise significant influence over the commercial and financial
decisions of the investee companies. Provision is made where the directors are
of the view that there has been a diminution in value that is other than
temporary. Any appreciation in value (including foreign exchange gains on
convertible loans) is generally not recognised until it is realised.
(ii) Quoted investments that are listed on approved stock exchanges are stated at
market value at the balance sheet date.
(iii) An investment for which a market quotation is readily available, but which is
restricted as to sale or transfer, is valued as provided in (ii) above less a
discount as determined by the Investment Manager (Note 18). In determining
the amount of such discount, the Investment Manager gives consideration to
the nature and term of such restrictions and the relative volatility of the
market price of the investment concerned.
(iv) On a portfolio basis, a net increase in carrying values of quoted investments
arising from revaluation is credited to the Investment Revaluation Reserve
except that a net increase that offsets a previous decrease recognised in the
income statement is credited to the income statement. A net decrease is
charged to the income statement except that a net decrease that offsets a
previous increase recognised in the Investment Revaluation Reserve is charged
against the Investment Revaluation Reserve.
(v) From time to time, the directors may determine that provisions be held for
risks which are known to exist within the investment portfolio but which
cannot be attributable to specific investments. This is included in provision
for diminution in value of investments.
(vi) On disposal of investments, both quoted and unquoted, all profits and losses
(computed on the basis of the difference between the weighted average cost
and selling price) are taken to the income statement.
(e) Operating revenue and revenue recognition
Operating revenue consists of gross dividend income, gross interest income on fixed
deposits, other short term financial instruments, profit or loss on disposal of
investments.
Dividend income is recognised on the date it is declared payable by the investee
company. Interest income except for interest income on convertible loans is
recognised on an accrual basis. Interest income on convertible loans is recognised when
received.
(f) Foreign currencies
Amounts payable and receivable denominated in foreign currencies are translated into
Singapore dollars at exchange rates prevailing at the balance sheet date. Transactions
in foreign currencies during the year are converted into Singapore dollars at the
exchange rates prevailing at transaction dates. All exchange differences are taken to the
income statement.
(g) Taxation
The Company has been granted tax exemption for a period of 10 years commencing
20 June 1994 for:
(a) gain arising from divestment of shares acquired prior to listing of its investee
companies
Brought to you by Global Reports

Transpac Industrial Holdings Limited and Its Subsidiaries
27
(b) dividend income from foreign investee companies
(c) interest income from convertible loan stock in foreign investee companies.
Current tax is provided based on the tax payable on the non-exempt income for the
year that is chargeable to tax.
The Company adopted SAS 12 (2001) with effect from 1 January 2002. This change
has no impact on opening retained earnings of the Company.
Deferred tax is provided in full using the liability method on temporary differences
arising between the tax bases of assets and liabilities and their carrying amounts in the
financial statements. Deferred tax assets are recognised to the extent that it is
probable that future taxable profit will be available against which temporary
differences can be utilised.
Tax rates enacted or substantively enacted by the balance sheet date are used to
determine deferred income tax.
(h) Financial risk management
Financial risk factors
The Company is exposed to a variety of financial risks, primarily in equity market
prices and changes in foreign currency exchange rates in relation to its investment
portfolio and to a lesser extent, interest rates on the deposits placed with financial
institutions.
The Company has written investment restrictions (as disclosed in the prospectus for
the initial public offering of the Company) that seek to diversify its investment risk
(including currency risks) and contain these exposures to an acceptable level.
Compliance to these restrictions are reviewed on an ongoing basis by the Investment
Manager and reported to the directors semi-annually. The Company does not use any
derivative financial instruments to hedge these exposures.
(i) Foreign exchange risk
The Company has significant investments in companies throughout Asia. As
mentioned above, the Company manages this risk through its written
investment restrictions and ongoing monitoring by the Investment Manager.
(ii) Interest rate risk
The Company’s income and operating cash flows are substantially
independent of changes in market interest rates and has no significant interest-
bearing assets.
(iii) Credit risk
The Company has no significant concentrations of credit risk. The Company
ensures that cash are placed with financial institutions of recognised credit
standing.
(iv) Liquidity risk
The Company maintains sufficient cash to meet its operating needs.
(i) Comparatives
Where necessary, comparative figures have been adjusted to conform with changes in
the current presentation. Where applicable, the comparatives have been adjusted or
extended to take into account the requirements of the revised SAS 12 which the
Company implemented in 2002.
Brought to you by Global Reports

Transpac Industrial Holdings Limited and Its Subsidiaries
28
3. Net change in revaluation and provision for diminution in value
2002 2001
$ $
Revaluation deficit on quoted investments
written back (Note 13) 634,069 1,172,295
Provision for diminution in value of unquoted
investments (charged)/written back (Note 13) (3,656,808) 3,000,000
Provision for diminution in value of unquoted
investments written back on disposal (Note 13) 59,153 –
(2,963,586) 4,172,295
4. Interest income
2002 2001
$ $
Interest income from:
- Unquoted investments 123,718 965,961
- Fixed deposits 66,101 203,576
- Other – 4,935
189,819 1,174,472
5. Operating expenses
2002 2001
$ $
Auditors’ remuneration
- Audit fees* 61,415 67,369
- Other fees 19,601 29,139
Directors’ fees (Note 6) 100,658 70,849
Investment management fees 1,633,677 1,680,281
Investment monitoring fees 1,423,203 1,429,043
Foreign exchange gain (37,413) (92,430)
Other 94,352 129,141
3,295,493 3,313,392
* In addition to the above, the auditors’ remuneration for Foodstar Group is as follows:
2002 2001
$ $
- Auditors of the Company (42,781) 52,110
- Other auditors 202,217 229,129
The Company has no staff costs as its operations are fully managed by its Investment
Manager (Note 18).
Brought to you by Global Reports

Transpac Industrial Holdings Limited and Its Subsidiaries
29
6. Directors’ fees
Fees paid or payable to each of the seven non-executive directors of the Company fall within
the $0 - $50,000 range. No fee is paid or payable to the executive director.
7. Tax
(a) Tax expense
2002 2001
$ $
Tax expense on profit for the financial year:
Current income tax
- Withholding tax paid on foreign dividends 75,344 –
Overprovision in preceding financial years
- Deferred tax (76,000) –
(656) –
The Company is an approved venture company for venture capital investment activity
granted under Section 13H of the Singapore Income Tax Act, Cap 134 for a period of 10 years
commencing 20 June 1994. During the tax relief period, all gains arising from the divestment
of shares acquired before the public listing of its investee companies, foreign-sourced dividend
and interest income from convertible loan stock in foreign investee companies shall be tax-
exempt. All other income of the Company shall be subject to Singapore income tax.
This tax incentive is subject to certain conditions which have to be complied with during the
tax relief period.
The tax expense on profit differs from the amount that would arise using the Singapore
standard rate of income tax due to the following:
2002 2001
$ $
Profit before tax (1,087,224) 911,423
Tax calculated at a tax rate of 22% (2001: 24.5%) (239,189) 223,299
Exempt income (626,104) –
Income not subject to tax – (1,068,814)
Expenses not deductible for tax purposes 787,148 4,244
Deferred tax assets not recognised 78,145 841,271
– –
(b) Movement in provision for current tax
2002 2001
$ $
Provision for tax at beginning of the financial year 243,169 242,322
Income tax refunded – 847
Balance at the end of the financial year 243,169 243,169
Brought to you by Global Reports

Transpac Industrial Holdings Limited and Its Subsidiaries
30
8. Loss per share
Loss per share is calculated based on the loss of $1,086,568 (2001: profit after tax of
$911,423) and the number of ordinary shares in issue of 40,000,002 (2001: 40,000,002).
No diluted earnings per share is calculated as the Company does not have any warrants, share
options or any other contracts that may result in the issuance of ordinary shares in the
Company, outstanding at the end of the financial year.
9. Fixed deposits with banks and other financial institutions
2002 2001
The weighted average effective interest rate at the
balance sheet date was as follows:
Fixed deposits 0.4% 1.5%
Included in fixed deposits with banks and other financial institutions is an amount of
$294,343 placed with a bank in the name of the Investment Manager acting as the trustee.
This amount is pledged as security with the bank for the issue of standby letter of credit on
behalf of the Company.
10. Receivables and prepayments
2002 2001
$ $
Interest receivable 4,290 4,862
Prepayments for investment management fees 392,033 405,418
396,323 410,280
Brought to you by Global Reports

Transpac Industrial Holdings Limited and Its Subsidiaries
31
11. Investments
Investments are held for purposes of capital appreciation and are in:
(a) quoted equity;
(b) unquoted equity and convertible debt; and
(c) equity and convertible debt of an unconsolidated subsidiary.
Quoted
equity Unquoted Investment in
Investments Investments Subsidiary Total
$ $ $ $
2002
Cost
– equity 5,666,028 94,404,909 36,912,410 136,983,347
– non-equity – 41,499,202 – 41,499,202
5,666,028 135,904,111 36,912,410 178,482,549
Unrealised revaluation loss
(Note 13(a)) (2,196,963) – – (2,196,963)
Provision for diminution in
value (Note 13(b)) – (66,364,394) – (66,364,394)
Net book value 3,469,065 69,539,717 36,912,410 109,921,192
Market value 3,469,065
Fair value 69,539,717 36,912,410
2001
Cost
– equity 8,171,578 90,352,127 18,920,384 117,444,089
– non-equity – 45,052,536 17,992,026 63,044,562
8,171,578 135,404,663 36,912,410 180,488,651
Unrealised revaluation loss
(Note 13(a)) (2,831,032) – – (2,831,032)
Provision for diminution in
value (Noted 13(b)) – (62,766,739) – (62,766,739)
Net book value 5,340,546 72,637,924 36,912,410 114,890,880
Market value 5,340,546
Fair value 79,078,000 36,912,410
Brought to you by Global Reports

Transpac Industrial Holdings Limited and Its Subsidiaries
32
12. Interests in subsidiaries
The Company holds a 63.5% equity interest in Foodstar Holdings Pte Ltd (“Foodstar”) and
this is legally a subsidiary under the Companies Act. In accordance with the Company’s
accounting policy, this investment is stated at cost, including equity and loans convertible to
equity.
2002 2001
$ $
Unquoted equity shares at cost 36,912,410 18,920,384
Convertible loans – 17,992,026
36,912,410 36,912,410
Had consolidation been performed and taking into account consolidation adjustments, loss
after tax and loss after tax and minority interest for the financial year ended 31 December
2002 would be increased by approximately $15,832,489 (2001: profit increased by
$2,937,000) and $8,567,428 (2001: profit increased by $2,701,000) respectively and the net
assets attributable to the shareholders of the Company as at 31 December 2002 would have
been decreased by approximately $787,367 (2001: increased by $10,516,000).
Significant subsidiaries held by Foodstar as at 31 December 2002 are:
Foodstar’s
Country of effective equity
incorporation interest @@
Subsidiary companies Principal activities and business 2002 2001
% %
China Food Processing Dormant Hong Kong – 54.68
Group Ltd### SAR, China
China Food Processing Investment British Virgin 54.68 54.68
Holdings Co. Ltd** holding Islands
China Food Processing Investment British Virgin – 54.68
International Co Ltd## holding Islands
China Food Processing Investment holding Hong Kong – 54.68
(PRC) Ltd### SAR, China
Dalian FTZ Yue Hua Trading of specialty China – 100.00
International Trade fats
Co. Ltd###
Dunston Assets Investment holding British Virgin 100.00 100.00
Limited*** Islands
East West International Trading of frozen Hong Kong – 60.00
Limited### food products SAR, China
Fairlink Investment Investment holding Hong Kong 54.68 54.68
Limited** SAR, China
FMA Development Co Dormant British 100.00 100.00
Ltd## Virgin Islands
Brought to you by Global Reports

Transpac Industrial Holdings Limited and Its Subsidiaries
33
Foodstar’s
Country of effective equity
incorporation interest @@
Subsidiary companies Principal activities and business 2002 2001
% %
Foodstar (China) Investment China 100.00 –
Investments holding
Company Limited**
Foodstar Management Providing management Hong Kong 100.00 100.00
Company Limited* services to group SAR, China
companies
Foodstar Trading Providing management British Virgin 100.00 100.00
Company Limited*** services to group Islands
companies
Foodstar Trading Trading of food Hong Kong 100.00 100.00
(Hong Kong) products SAR, China
Company Limited*
Guangzhou Foodstar Providing marketing China 100.00 100.00
Marketing Services services and investment
Co Ltd** holding
G & K Holdings Ltd** Investment holding Hong Kong 100.00 100.00
SAR, China
Kaiping Guanghe Manufacture and sale China 100.00 100.00
Fermented Bean of fermented bean
Curd Co. Ltd* curd
Kaiping Jiashili Dried Manufacture and sale China 100.00 100.00
Fruit and Nuts Co. of dried fruit and nuts
Ltd*@
Kaiping Weixida Manufacture and sale China 100.00 100.00
Seasoning Co. Ltd* of seasonings
Nanjing Jilun Seasoning Manufacture and sale China 100.00 100.00
Product Co. Ltd* of seasonings
Shanghai Xinjing Manufacture and sale China 32.81 32.81
Western-Style Food of processed food
Co. Ltd**@
Silver Eagle Foods & Trading of food Hong Kong 70.00 70.00
Trading Company products SAR, China
Limited**@
Silver Eagle Foods Process and sale of China 70.00 70.00
(Shenzhen) Company agricultural products
Limited**@
Brought to you by Global Reports

Transpac Industrial Holdings Limited and Its Subsidiaries
34
Foodstar’s
Country of effective equity
incorporation interest @@
Subsidiary companies Principal activities and business 2002 2001
% %
Silver Eagle Frozen Manufacture and sale China 70.00 70.00
Foods Factory of food products
Limited**@
Top Network Limited*** Investment holding British Virgin 60.00 60.00
Islands
Welton Source (HK) Dormant Hong Kong 54.68 54.68
Limited** SAR, China
Welton Source Investment holding Hong Kong – 54.68
International Limited### SAR, China
Yue Hua Trading Dormant British Virgin 100.00 100.00
Limited## Islands
Guizhou Feng La Zhi Manufacture and sale China 80.00 80.00
Food Product Company of chilli related
Limited** products
* Audited by other members of the worldwide PricewaterhouseCoopers organisation.
** Audited by firms other than the auditors of the Company. None of these subsidiaries are significant as
defined under Clause 718 of the Listing Manual.
*** Not required to be audited under the legislation of the respective country of incorporation.
## Company de-registered in 2002.
### Company liquidated in 2002.
@ Company commenced cessation of business in 2002.
@@ The Company’s effective interest is 63.5% of Foodstar’s interest.
13. Provision for diminution in value of investments
(a) Quoted investments
In accordance with the Company’s accounting policy set out in Note 2(d)(iv), a net
increase in carrying values of quoted investments arising from revaluation is credited
to the Investment Revaluation Reserve, except that a net increase that offsets a
previous decrease recognised in the income statement is credited to the income
statement.
2002 2001
$ $
Balance at 1 January 2,831,032 4,003,327
Revaluation deficit on quoted investments
written back (Note 3) (634,069) (1,172,295)
Balance at 31 December (Note 11) 2,196,963 2,831,032
Brought to you by Global Reports

Transpac Industrial Holdings Limited and Its Subsidiaries
35
(b) Unquoted investments
The cost of investments is written off against provisions when the investments are
deemed to be of insignificant value. Provisions are released when the investments are
disposed of. Appreciation of value in unquoted investments above cost of the
investments are not taken up in the financial statements.
2002 2001
$ $
Balance at 1 January 62,766,739 65,766,739
Write-back of provision on disposal of investment
(Note 3) (59,153) –
Write-back of prior year provision (Note 3) – (3,000,000)
Additional provision for the year (Note 3) 3,656,808 –
Net movement for the year 3,597,655 (3,000,000)
Balance at 31 December (Note 11) 66,364,394 62,766,739
14. Trade and other payables
2002 2001
$ $
Monitoring fees payable 348,223 352,763
Directors fees payable 100,658 70,849
Other creditors 243,498 246,601
Accruals for operating expenses 58,746 93,624
751,125 763,837
15. Deferred Tax
Deferred tax liabilities
Provisions
2002 2001
$ $
At beginning of financial year 76,000 76,000
Tax credit to income statement (Note 7(a)) (76,000) –
At end of financial year – 76,000
Deferred tax assets are recognised for tax loss carried forward to the extent that realisation of
the related tax benefits through future taxable profits is probable. The Company has
unrecognised tax losses of approximately $11 million (2001: $9 million) which can be carried
forward and used to offset against future taxable income subject to meeting certain statutory
requirements.
Brought to you by Global Reports

Transpac Industrial Holdings Limited and Its Subsidiaries
36
16. Share Capital
2002 2001
$ $
Authorised
1,000,000,000 ordinary shares of $0.50 each 500,000,000 500,000,000
Issued and fully paid
40,000,002 ordinary shares of $0.50 each 20,000,001 20,000,001
17. Dividends
2002 2001
$ $
Ordinary dividends paid or proposed
Final tax exempt dividend of 4 cents per share paid
for the financial year ended 31 December 2001 1,600,000 –
Final tax exempt dividend of 3 cents per share
paid for financial year ended 31 December 2000 – 1,200,000
1,600,000 1,200,000
The Directors have proposed a first and final exempt one-tier dividend for 2002 of 4 cents per
share amounting to a total of $1,600,000. In addition, the directors propose a final special
exempt one-tier dividend of 8 cents per share amounting to a total of $3,200,000. These
financial statements do not reflect this dividend payable, which will be accounted for in the
shareholders’ equity as an appropriation of retained earnings in the year ending 31 December
2003.
18. Agreements
The Company entered into a Management Agreement on 12 March 1994 with Transpac
Capital Pte Ltd (“TCPL”) a company incorporated in Singapore, appointing TCPL as the
Manager. Leong Ka Cheong Christopher is also a director of TCPL. Under the terms of this
agreement, TCPL will have the sole responsibility and full discretionary authority to identify
investment opportunities and to manage the acquisition, holding and sale of the investments
under its management.
The Management Agreement will initially be effective for a period of ten years, and will
continue in effect thereafter for successive periods of five years unless terminated by the
Company or TCPL giving 30 days’ written notice.
The fees payable to TCPL in respect of investment advisory and other services are:
Management fee
Annual fee of 1.25% of the net asset value of the Company as at 30 June and 31 December of
each calendar year, payable semi-annually in advance on 1 October and 1 April of each
calendar year.
Monitoring fee
Annual fee of 1.25% of the base cost of investments made by the Company as at 30 June and
31 December of each calendar year, payable semi-annually in arrears on 1 October and 1 April
of each calendar year.
Brought to you by Global Reports
Transpac Industrial Holdings Limited and Its Subsidiaries
37
Performance incentive
Annual fee of 20% of the annual audited net profit after tax of the Company shall be credited
to the Performance Incentive Account.
The Investment Manager is entitled to be paid the Performance Incentive when:
(a) the credit balance in the Performance Incentive Account is in excess of $20,000,000;
and
(b) the net asset value of the Company is at least $200,000,000; and
(c) dividends are paid to shareholders.
The payment of the Performance Incentive shall be in the same form as the dividends to
shareholders.
Should the audited financial statements in any one year show a net loss after tax, an amount
equal to 20% of that loss shall be debited to the Performance Incentive Account. In the event
that there is a debit balance in the Performance Incentive Account, the Investment Manager is
not required to reimburse the Company except where the aggregate prior distributions of the
Performance Incentive exceeds the Investment Manager’s entitlement calculated upon:
(a) winding up of the Company; or
(b) termination of the investment management agreement.
19. Capital commitments
At 31 December 2002, the Company’s proposed investments in unquoted equity shares and
convertible loans were $ 6,594,144 (2001: $4,768,408).
20. Segment information
Primary segment – business
The principal activity of the Company is to invest primarily in the equity of growing private
companies located in Asia for capital appreciation. As the investee companies are engaged in
a variety of industries, it is not meaningful to segment the investments by industry sectors.
Secondary segment – geographical
The assets in each country consist principally of investments. Corresponding revenues
represent gains or losses on sale of investments, dividend income and interest income.
Unallocated assets consist of operating cash less general provision for diminution.
Unallocated revenues relates to interest income on unallocated cash.
With the exception of China, Hong Kong SAR, Taiwan and Singapore, no other individual
country contributed more than 10% of segment revenues or assets.
Brought to you by Global Reports

Transpac Industrial Holdings Limited and Its Subsidiaries
38
Segment revenues Segment assets
2002 2001 2002 2001
$ $ $ $
China/Hong Kong SAR 198,638 (1,084,205) 81,423,386 83,436,930
Indonesia (920,280) – 29,766 28,803
Malaysia – – 603,120 637,348
Taiwan – – 24,048,545 24,048,062
Thailand 460,179 181,806 486,986 488,201
Singapore 5,747,822 158,024 2,630,647 2,529,711
USA (380,605) 588,386 2,420,310 5,443,392
5,105,754 (155,989) 111,642,760 116,612,447
Unallocated 66,101 208,509 14,859,544 12,665,137
5,171,855 52,520 126,502,304 129,277,584
21. Fair values
Other than the fair values of investments as shown in Note 11, the carrying amounts of the
following financial assets and liabilities approximate their fair values: bank balances, fixed
deposits with banks and other financial institutions, receivables and prepayments, trade and
other payables.
22. Net tangible asset backing per share
Net tangible asset backing per share is calculated based on the net assets of $125,508,010
(2001: $128,194,578) and the number of ordinary shares in issue of 40,000,002 (2001:
40,000,002).
23. Contingent liabilities (unsecured)
As at 31 December 2002, there is a claim of RM565,978 (approximately S$260,000) plus a
penalty of an equivalent amount [total claim and penalty amounting to RM1,131,956
(approximately S$520,000)] against the Company in respect of a non-refundable deposit of
the same amount for alleged breach of contract by the Company. The Company has
disclaimed liability and is defending the action. Legal advice obtained indicates that it is
unlikely that any significant liability will arise, and no provision has been made in the
financial statements for the claim.
The directors are of the view that the above contingent liability is unlikely to have a material
adverse effect on the financial position of the Company.
24. Authorisation of financial statements
The Board of Directors of Transpac Industrial Holdings Limited authorised these financial
statements for issue on 26 March 2003.
Brought to you by Global Reports

Transpac Industrial Holdings Limited and Its Subsidiaries
39
The following pages 40 to 68 are the financial statements of Foodstar Holdings Pte Ltd and its
subsidiaries, which form part of the consolidated accounts (as defined in section 209A of the Singapore
Companies Act), of Transpac Industrial Holdings Limited.
Brought to you by Global Reports

Transpac Industrial Holdings Limited and Its Subsidiaries
40
Income Statements
INCOME STATEMENTS
FOR THE FINANCIAL YEAR ENDED 31 DECEMBER 2002
The Group The Company
Note 2002 2001 2002 2001
$ $ $ $
Revenue 3 71,215,744 91,369,925 11,340,212 7,352,804
Cost of sales (50,509,842) (63,432,742) – –
Gross profit 20,705,902 27,937,183 11,340,212 7,352,804
Other operating income 32,446 330,454 – –
Distribution expenses (10,247,093) (12,097,850) – –
Administrative expenses (10,925,705) (11,416,446) (239,270) (158,478)
Other operating expenses (2,189,987) (1,460,082) (18,197,502) (15,590,746)
Exceptional loss 4 (11,881,783) – – –
Operating (loss)/profit 5 (14,506,220) 3,293,259 (7,096,560) (8,396,420)
Finance income 6 319,451 4,191,556 67,555 2,606,008
Finance costs 7 (658,537) (1,030,258) (38,756) –
(Loss)/profit before tax (14,845,306) 6,454,557 (7,067,761) (5,790,412)
Tax 9 (987,183) (1,599,183) (1,325,962) (64,891)
(Loss)/profit from ordinary
activities before minority
interest (15,832,489) 4,855,374 (8,393,723) (5,855,303)
Minority interest 33 2,340,477 836,294 – –
(Loss)/profit after tax
attributable to the members
of the Company (13,492,012) 5,691,668 (8,393,723) (5,855,303)
The accompanying notes form an integral part of these financial statements.
Foodstar Holdings Pte Ltd and Its Subsidiaries
Brought to you by Global Reports

Transpac Industrial Holdings Limited and Its Subsidiaries
41
Balance Sheets
BALANCE SHEETS AS AT 31 DECEMBER 2002
The Group The Company
Note 2002 2001 2002 2001
$ $ $ $
Current assets
Cash and cash equivalents 10 26,260,340 34,381,719 200,562 5,551,677
Trade receivables 11 4,742,680 11,768,152 – –
Inventories 12 8,061,041 11,581,780 – –
Other current assets 13 3,979,127 4,450,989 795,700 1,404,181
Loan receivable 14 – – – –
43,043,188 62,182,640 996,262 6,955,858
Non-current assets
Investments in subsidiaries 15 – – 57,293,379 69,213,612
Investment in associate 16 1 1 – –
Property, plant and equipment 17 38,450,619 53,242,019 – –
Deferred expenditure 18 – 106,167 – –
Goodwill 19 146,332 173,285 – –
Trademarks 20 3,100,401 6,292,628 – –
Deferred tax assets 30 1,213,965 – – –
42,911,318 59,814,100 57,293,379 69,213,612
Total assets 85,954,506 121,996,740 58,289,641 76,169,470
Current liabilities
Trade payables 4,866,114 7,296,658 – –
Other payables 21 11,214,266 17,712,013 314,895 387,578
Payables to shareholders 23 – 28,333,899 – 28,333,899
Payable to a related party 24 179,847 192,079 – –
Provision for current tax 2,338,554 1,281,224 – –
Bank overdraft (unsecured) 10 – 260,750 – –
Other short-term loan (unsecured) 25 – 229,694 – –
Current portion of long-term
payables (unsecured) 26 419,000 754,729 – –
Finance lease liabilities 27 – 24,446 – –
Short-term bank loans (secured) 28 9,166,067 15,131,736 – –
Current portion of long-term
bank loans (secured) 28 – 36,869 – –
28,183,848 71,254,097 314,895 28,721,477
Non-current liabilities
Payable to subsidiary (non-trade) 29 – – – 5,152,427
Long-term payables (unsecured) 26 838,000 1,565,909 – –
Finance lease liabilities 27 – 17,219 – –
Long-term bank loans (secured) 28 – 336,356 – –
838,000 1,919,484 – 5,152,427
Total liabilities 29,021,848 73,173,581 314,895 33,873,904
Net assets 56,932,658 48,823,159 57,974,746 42,295,566
Share capital and reserves
Share capital 31 40,933,164 25,405,441 40,933,164 25,405,441
Share premium 17,196,615 4,390,439 17,196,615 4,390,439
Reserves 32 (1,239,948) 16,562,186 (155,033) 12,499,686
Interests of shareholders of
the Company 56,889,831 46,358,066 57,974,746 42,295,566
Minority interests 33 42,827 2,465,093 – –
56,932,658 48,823,159 57,974,746 42,295,566
The accompanying notes form an integral part of these financial statements.
Foodstar Holdings Pte Ltd and Its SubsidiariesFoodstar Holdings Pte Ltd and Its SubsidiariesFoodstar Holdings Pte Ltd and Its Subsidiaries
Brought to you by Global Reports

Transpac Industrial Holdings Limited and Its Subsidiaries
42
Consolidated Statement of
Changes in Equity
CONSOLIDATED STATEMENT OF CHANGES IN EQUITY
FOR THE FINANCIAL YEAR ENDED 31 DECEMBER 2002
Foreign Capital (Accumula-
Currency and ted Losses) /
Share Share Translation Other Retained
Note Capital Premium Reserves Reserves Earnings Total
$ $ $ $ $ $
Balance at 1 January
2002 25,405,441 4,390,439 9,085,150 (488,589) 7,965,625 46,358,066
Currency translation
differences – – (4,310,122) – – (4,310,122)
Net loss – – – – (13,492,012) (13,492,012)
Total recognised losses for
the financial year – – (4,310,122) – (13,492,012) (17,802,134)
Transfer from (accumulated
losses)/retained earnings – – – 417,690 (417,690) –
Issue of share capital 31 15,527,723 12,806,176 – – – 28,333,899
Balance at 31 December 2002 40,933,164 17,196,615 4,775,028 (70,899) (5,944,077) 56,889,831
Balance at 1 January 2001 25,405,441 4,390,439 6,318,830 (774,681) 2,560,049 37,900,078
Currency translation differences – – 2,766,320 – – 2,766,320
Net profit – – – – 5,691,668 5,691,668
Total recognised gains for the
financial year – – 2,766,320 – 5,691,668 8,457,988
Transfer from retained earnings – – – 286,092 (286,092) –
Balance at 31 December 2001 25,405,441 4,390,439 9,085,150 (488,589) 7,965,625 46,358,066
An analysis of the movements in each category within “Capital and other reserves” is presented in note
32.
The accompanying notes form an integral part of these financial statements.
Foodstar Holdings Pte Ltd and Its Subsidiaries
Brought to you by Global Reports
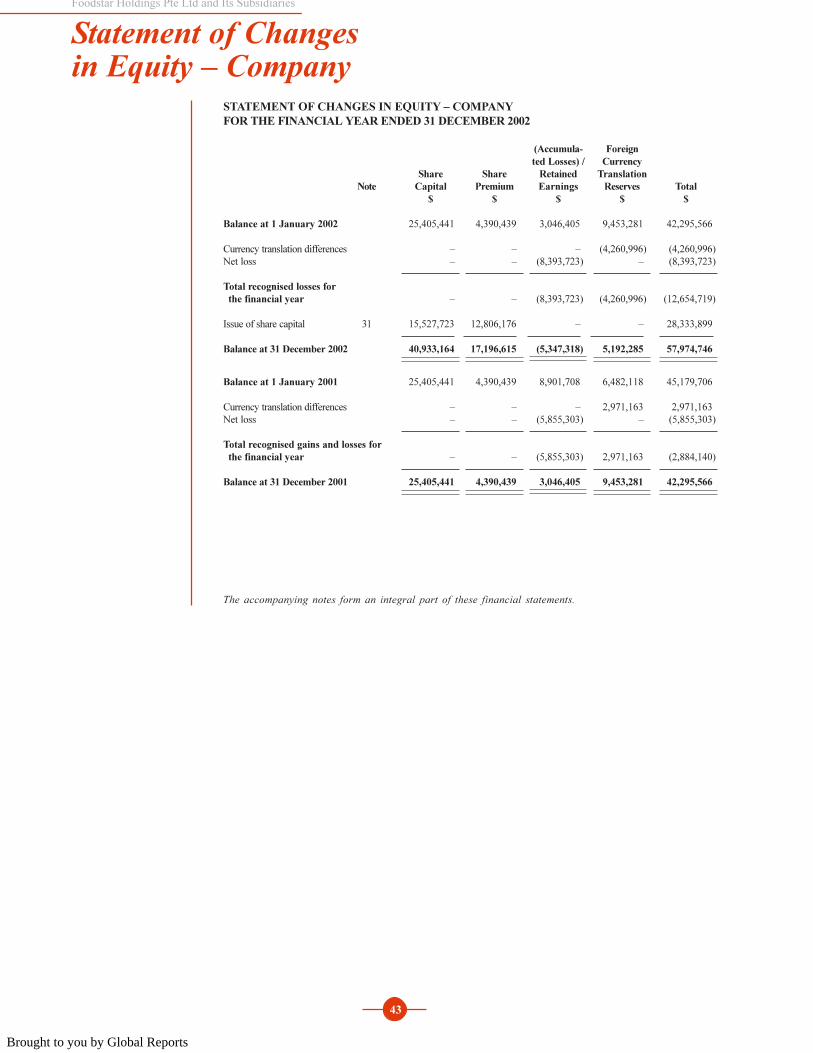
Transpac Industrial Holdings Limited and Its Subsidiaries
43
Statement of Changes
in Equity – Company
STATEMENT OF CHANGES IN EQUITY – COMPANY
FOR THE FINANCIAL YEAR ENDED 31 DECEMBER 2002
(Accumula- Foreign
ted Losses) / Currency
Share Share Retained Translation
Note Capital Premium Earnings Reserves Total
$ $ $ $ $
Balance at 1 January 2002 25,405,441 4,390,439 3,046,405 9,453,281 42,295,566
Currency translation differences – – – (4,260,996) (4,260,996)
Net loss – – (8,393,723) – (8,393,723)
Total recognised losses for
the financial year – – (8,393,723) (4,260,996) (12,654,719)
Issue of share capital 31 15,527,723 12,806,176 – – 28,333,899
Balance at 31 December 2002 40,933,164 17,196,615 (5,347,318) 5,192,285 57,974,746
Balance at 1 January 2001 25,405,441 4,390,439 8,901,708 6,482,118 45,179,706
Currency translation differences – – – 2,971,163 2,971,163
Net loss – – (5,855,303) – (5,855,303)
Total recognised gains and losses for
the financial year – – (5,855,303) 2,971,163 (2,884,140)
Balance at 31 December 2001 25,405,441 4,390,439 3,046,405 9,453,281 42,295,566
The accompanying notes form an integral part of these financial statements.
Foodstar Holdings Pte Ltd and Its SubsidiariesFoodstar Holdings Pte Ltd and Its SubsidiariesFoodstar Holdings Pte Ltd and Its Subsidiaries
Brought to you by Global Reports

Transpac Industrial Holdings Limited and Its Subsidiaries
44
Consolidated Cash Flow Statement
CONSOLIDATED CASH FLOW STATEMENT
FOR THE FINANCIAL YEAR ENDED 31 DECEMBER 2002
Note 2002 2001
$ $
Cash flows from operating activities
(Loss)/profit before tax (14,845,306) 6,454,557
Adjustments for:
Depreciation of property, plant and equipment 17 3,882,626 3,001,490
Provision for diminution in value of property,
plant and equipment 17 7,900,467 831,653
Loss on disposal of property, plant and equipment 5 20,546 56,908
Amortisation of goodwill, trademarks and deferred
expenditure 5 1,170,788 1,075,640
Interest expense 7 619,781 1,030,258
Interest income 6 (319,451) (801,983)
Provision for inventory write-down and doubtful
receivables 5 2,797,277 975,216
Write-off of trademarks, bad debts, inventories,
deferred expenditure and pre-operating expenditure 5 2,366,401 972,157
Write-back of provision for inventory write-down 5 (3,863) (50,110)
Operating cash flow before working capital change 3,589,266 13,545,786
Change in operating assets and liabilities
Inventories 2,125,793 1,167,787
Receivables 6,193,638 (1,506,811)
Due to related parties (12,232) (3,249,460)
Payables (8,928,291) 2,053,747
Currency translation adjustment (1,251,893) (625,795)
Cash generated from operations 1,716,281 11,385,254
Income tax paid (1,064,121) (866,141)
Net cash inflow from operating activities 652,160 10,519,113
Cash flows from investing activities
Acquisition of additional interest in subsidiaries – (12,915,498)
Payments for property, plant and equipment 17 (2,849,899) (11,265,296)
Payments for pre-operating expenditure – (7,918)
Payments for trademarks – (236,606)
Proceeds from disposal of property, plant and equipment 2,311,331 730,066
Net cash outflow from investing activities (538,568) (23,695,252)
Cash flows from financing activities
Dividend paid to minority shareholders of subsidiaries – (1,777,240)
Capital contribution from minority shareholder of
subsidiary 33 – 210,537
Repayment of bank loans (6,338,894) (119,211)
(Repayment of)/proceeds from other loans (1,293,332) 135,860
Interest received 319,451 801,983
Interest paid (619,781) (1,030,258)
Principal repayments of finance lease liabilities (41,665) (69,982)
Net cash outflow from financing activities (7,974,221) (1,848,311)
Net decrease in cash and cash equivalents held (7,860,629) (15,024,450)
Cash and cash equivalents at beginning of the financial year 34,120,969 49,145,419
Cash and cash equivalents at end of the financial year 10 26,260,340 34,120,969
The accompanying notes form an integral part of these financial statements.
Foodstar Holdings Pte Ltd and Its Subsidiaries
Brought to you by Global Reports

Transpac Industrial Holdings Limited and Its Subsidiaries
45
Notes to the Financial Statements
NOTES TO THE FINANCIAL STATEMENTS
FOR THE FINANCIAL YEAR ENDED 31 DECEMBER 2002
These notes form an integral part of and should be read in conjunction with the accompanying financial
statements.
1. General
The Company is domiciled and incorporated in Singapore. The address of its registered office is
as follows:
6 Shenton Way #20-09
DBS Building Tower Two
Singapore 068809
The principal activity of the Company is investment holding. The principal activities of the
subsidiaries consist of investment holding, manufacture, sale and distribution of food products.
2. Significant accounting policies
(a) Basis of preparation
The financial statements have been prepared in accordance with Singapore Statements of
Accounting Standard. The financial statements have been prepared under the historical cost
convention.
The financial statements are expressed in Singapore Dollars.
In 2002, the Company adopted SAS 12 (2001) Income Taxes.
(b) Basis of consolidation
The consolidated financial statements include the financial statements of the Company and
all its subsidiaries made up to the end of the financial year. Subsidiaries are those entities in
which the Group has an interest of more than one half of the voting rights or otherwise has
power to exercise control over the operations. Subsidiaries are consolidated from the date
on which control is transferred to the Group and are no longer consolidated from the date
on which control ceases. All intercompany transactions, balances and unrealised gains on
transactions between group companies are eliminated; unrealised losses are also eliminated
unless cost cannot be recovered. Where necessary, accounting policies for subsidiaries have
been changed to ensure consistency with the policies adopted by the Group.
(c) Foreign currencies
The Company’s functional currency is the Hong Kong (HK) dollar. Transactions in other
currencies during the financial year are translated into HK dollars at the rates of exchange
prevailing on the transaction dates. Monetary assets and liabilities denominated in other
currencies are translated into HK dollars at the rates of exchange prevailing at the balance
sheet date. All exchange differences arising are taken to the income statement.
For inclusion in the consolidated financial statements of the Group, the assets and liabilities
of foreign subsidiaries and associates are translated into HK dollars at the rates of exchange
prevailing at the balance sheet date. The results of foreign subsidiaries and associates are
translated into HK dollars at the average rates of exchange prevailing during the financial
year. The Group’s share of exchange differences arising from the translation of foreign
subsidiaries are taken directly to the foreign currency translation reserve.
Foodstar Holdings Pte Ltd and Its SubsidiariesFoodstar Holdings Pte Ltd and Its SubsidiariesFoodstar Holdings Pte Ltd and Its Subsidiaries
Brought to you by Global Reports
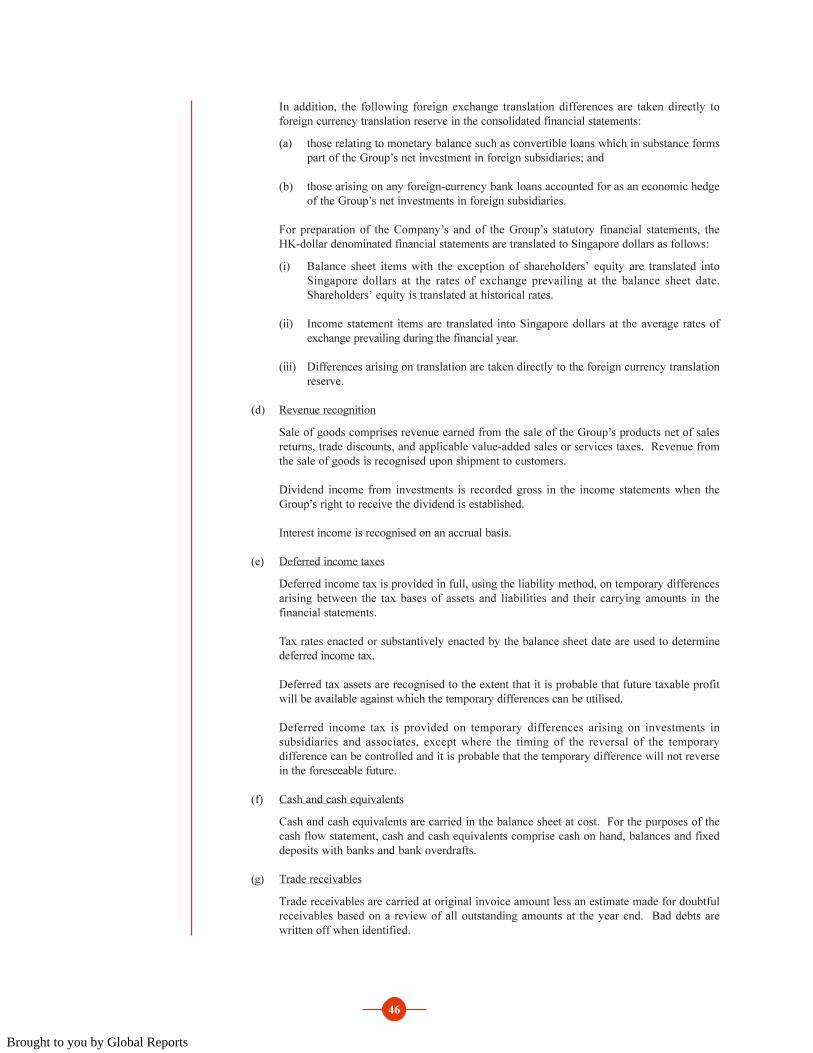
Transpac Industrial Holdings Limited and Its Subsidiaries
46
In addition, the following foreign exchange translation differences are taken directly to
foreign currency translation reserve in the consolidated financial statements:
(a) those relating to monetary balance such as convertible loans which in substance forms
part of the Group’s net investment in foreign subsidiaries; and
(b) those arising on any foreign-currency bank loans accounted for as an economic hedge
of the Group’s net investments in foreign subsidiaries.
For preparation of the Company’s and of the Group’s statutory financial statements, the
HK-dollar denominated financial statements are translated to Singapore dollars as follows:
(i) Balance sheet items with the exception of shareholders’ equity are translated into
Singapore dollars at the rates of exchange prevailing at the balance sheet date.
Shareholders’ equity is translated at historical rates.
(ii) Income statement items are translated into Singapore dollars at the average rates of
exchange prevailing during the financial year.
(iii) Differences arising on translation are taken directly to the foreign currency translation
reserve.
(d) Revenue recognition
Sale of goods comprises revenue earned from the sale of the Group’s products net of sales
returns, trade discounts, and applicable value-added sales or services taxes. Revenue from
the sale of goods is recognised upon shipment to customers.
Dividend income from investments is recorded gross in the income statements when the
Group’s right to receive the dividend is established.
Interest income is recognised on an accrual basis.
(e) Deferred income taxes
Deferred income tax is provided in full, using the liability method, on temporary differences
arising between the tax bases of assets and liabilities and their carrying amounts in the
financial statements.
Tax rates enacted or substantively enacted by the balance sheet date are used to determine
deferred income tax.
Deferred tax assets are recognised to the extent that it is probable that future taxable profit
will be available against which the temporary differences can be utilised.
Deferred income tax is provided on temporary differences arising on investments in
subsidiaries and associates, except where the timing of the reversal of the temporary
difference can be controlled and it is probable that the temporary difference will not reverse
in the foreseeable future.
(f) Cash and cash equivalents
Cash and cash equivalents are carried in the balance sheet at cost. For the purposes of the
cash flow statement, cash and cash equivalents comprise cash on hand, balances and fixed
deposits with banks and bank overdrafts.
(g) Trade receivables
Trade receivables are carried at original invoice amount less an estimate made for doubtful
receivables based on a review of all outstanding amounts at the year end. Bad debts are
written off when identified.
Brought to you by Global Reports

Transpac Industrial Holdings Limited and Its Subsidiaries
47
(h) Inventories
Inventories are stated at the lower of cost and net realisable value. Cost is determined on a
weighted average basis. The cost of finished goods and work-in-progress comprises raw
materials, direct labour and an appropriate proportion of overhead expenditure. Net
realisable value is the estimated selling price in the ordinary course of business, less the
costs of completion and selling expenses.
Provision is made where necessary for obsolete, slow-moving and defective inventories.
(i) Subsidiaries and associates
Investments in subsidiaries and associates that are intended to be held for the long term are
stated in the financial statements at cost less provision. This provision is made in
recognition of a diminution in the value of the investments which is other than temporary,
determined on an individual investment basis.
A subsidiary is an entity in which the Group has an interest of more than half of the voting
rights or otherwise has power to exercise control over the operations. The Group’s
subsidiaries are shown in note 15.
An associate is an entity, not being a subsidiary, in which the Group has between 20% and
50% of the voting rights and over which the Group has significant influence, but which it
does not control. The Group’s associate is shown in note 16.
The Group’s share of results of associates is included in the consolidated income statement.
The Group’s share of post-acquisition reserves of the associates is included in the
investments in associates in the consolidated balance sheet.
Profits or losses on disposal of investments in subsidiaries and associates are taken to the
income statements.
(j) Property, plant and equipment
Property, plant and equipment are stated at historical cost less accumulated depreciation
and provision for diminution in value.
When the carrying amount of an asset is greater than its estimated recoverable amount, it is
provided for immediately to its recoverable amount.
Fully depreciated assets are retained in the financial statements until they are no longer in
use.
No depreciation is provided on freehold or leasehold land with a lease term of over 50
years. Depreciation is calculated on a straight-line basis to write off the cost of other
property, plant and equipment over their expected useful lives. The estimated useful lives
are as follows:
Land-use rights 50 years (period of right to use land)
Leasehold buildings 40 years
Leasehold improvements 3 - 10 years
Plant 20 years
Machinery and equipment 3 - 14 years
Furniture and fittings 5 - 10 years
Motor vehicles 4 - 5 years
No depreciation is provided on construction-in-progress. Depreciation is provided only
when the construction is completed and the property, plant and equipment is brought into
use.
Brought to you by Global Reports

Transpac Industrial Holdings Limited and Its Subsidiaries
48
(k) Deferred expenditure
Deferred expenditure is stated at cost less accumulated amortisation. Amortisation is
calculated on a straight-line basis to write off the cost over its estimated useful life.
(l) Goodwill
Goodwill represents the excess of the fair value of the consideration given over the fair
value of the Group’s share of identifiable net assets of subsidiaries and associates when
acquired. Goodwill is amortised on a straight-line basis, through the consolidated income
statement, over its useful economic life up to a maximum of 10 years. Goodwill which is
assessed as having no continuing economic value is written off to the consolidated income
statement.
On the acquisition of a foreign subsidiary or associate, the goodwill arising is translated at
the rate of exchange prevailing at the date of acquisition.
The gain or loss on disposal of a subsidiary or associate includes the unamortised balance of
goodwill relating to the entity disposed of or, for pre 1 January 2001 acquisitions, the
goodwill charged to equity.
(m) Trademarks
The initial cost of acquiring trademarks is capitalised for amortisation in equal instalments
over their estimated useful lives of 10 years.
(n) Provisions
Provisions are recognised when the Group has a legal or constructive obligation as a result
of past events that it is probable an outflow of resources will be required to settle the
obligation, and a reliable estimate of the amount can be made.
(o) Employee benefits
Leave entitlement
Employee entitlements to annual leave are recognised when they accrue to employees. An
accrual is made for the estimated liability for annual leave as a result of services rendered by
employees up to the balance sheet date.
Post employment benefits
The Group, apart from legally required social security schemes, operates defined
contribution plans. The Group’s obligation is limited to the amount it contributes to the
funds. The expenses are disclosed under staff costs (note 8).
(p) Comparatives
Where necessary, comparative figures have been adjusted to conform with changes in
current presentation. Where applicable, comparative figures have been adjusted or extended
to take into account the requirements of the revised SAS 12 which the Group implemented
in 2002.
Brought to you by Global Reports

Transpac Industrial Holdings Limited and Its Subsidiaries
49
3. Revenue
The Group The Company
2002 2001 2002 2001
$ $ $ $
Sale of goods 71,215,744 91,369,925 – –
Dividend income – – 11,340,212 7,352,804
71,215,744 91,369,925 11,340,212 7,352,804
4. Exceptional loss
The Group
2002 2001
$ $
Provision for doubtful trade receivables (note 11) 21,816 –
Provision for other doubtful receivables (note 13) 127,195 –
Provision for inventory write-down (note 12) 574,968 –
Provision for diminution in value of property, plant and
equipment (note 17) 7,703,090 –
Write-off of trademarks (note 20) 1,826,732 –
Write-off of deferred expenditure (note 18) 108,502 –
Retrenchment benefits (note 8) 669,816 –
Provision for expenses relating to the cessation of activities 849,664 –
11,881,783 –
The exceptional loss is due to the cessation of activities of certain subsidiaries during the financial
year.
Brought to you by Global Reports

Transpac Industrial Holdings Limited and Its Subsidiaries
50
5. Operating (loss)/profit
The Group The Company
Note 2002 2001 2002 2001
$ $ $ $
Operating (loss)/profit
is arrived at after:
Charging:
Amortisation of goodwill 19 18,823 19,254 – –
Amortisation of deferred
expenditure 18 104,851 6,883 – –
Amortisation of trademarks 20 1,047,114 1,049,503 – –
Auditors’ remuneration
– Auditors of the Company (42,781) 52,110 (42,781) 52,110
– Other auditors 202,217 229,129 – –
Bad debts written off – 781,955 – –
Cost of inventories recognised
as an expense 49,074,022 50,936,963 – –
Depreciation of property,
plant and equipment
– Land-use rights 17 141,224 127,701 – –
– Leasehold building 17 631,725 380,290 – –
– Leasehold improvements 17 36,255 43,727 – –
– Plant 17 653,585 547,281 – –
– Machinery and equipment 17 1,710,982 1,176,226 – –
– Furniture and fittings 17 414,094 396,263 – –
– Motor vehicles 17 294,761 330,002 – –
Directors’ remuneration 89,245 89,814 – –
Loss on disposal of property,
plant and equipment 20,546 56,908 – –
Provision for doubtful trade
receivables 11 1,220,747 826,736 – –
Provision for other doubtful
receivables 13 127,195 – – –
Provision for inventory
write-down 12 1,449,335 148,480 – –
Provision for investments in
subsidiaries 15 – – 18,197,502 15,590,746
Provision for diminution in
value of property, plant
and equipment 17 7,900,467 831,653 – –
Rental expense - operating
leases 557,678 522,342 – –
Write-off of trademarks 20 1,826,732 – – –
Write-off of pre-operating
expenditure – 7,918 – –
Write-off of inventories – 182,284 – –
Write-off of deferred
expenditure 18 539,669 – – –
And crediting:
Write-back of provision for
inventory write-down 12 3,863 50,110 – –
Brought to you by Global Reports

Transpac Industrial Holdings Limited and Its Subsidiaries
51
6. Finance income
The Group The Company
2002 2001 2002 2001
$ $ $ $
Interest income
– Subsidiary – – 37,485 19,943
– Fixed deposits 319,451 801,983 30,070 33,495
Tax rebate from re-investment – 1,408,330 – 602,330
Net foreign exchange gain – 1,981,243 – 1,950,240
319,451 4,191,556 67,555 2,606,008
The tax rebate in the previous financial year was granted by the tax authorities in the People’s
Republic of China (“PRC”) to the Company, as a result of the re-investment of the dividend
income received by the Company from certain subsidiaries in PRC into other PRC subsidiaries.
Included in net foreign exchange gain of the Company and the Group in the previous financial
year was foreign exchange gain $1,918,226 arising from the translation of the amount payable to
shareholders (note 23) from the Singapore dollar to the Hong Kong dollar, the functional currency
of the Company.
7. Finance costs
The Group The Company
2002 2001 2002 2001
$ $ $ $
Interest expense
– Finance leases 1,854 8,674 – –
– Bank loans 597,084 906,986 – –
– Bank overdraft – 83,288 – –
– Related party (note 24) 7,716 14,758 – –
– Others 13,127 16,552 – –
Net foreign exchange loss 38,756 – 38,756 –
658,537 1,030,258 38,756 –
Brought to you by Global Reports

Transpac Industrial Holdings Limited and Its Subsidiaries
52
8. Staff costs
The Group
2002 2001
$ $
Wages and salaries 10,081,656 8,790,512
Employer’s contribution to defined contribution plans 17,122 17,614
Termination benefits 759,538 371,614
10,858,316 9,179,740
Number of persons employed at the end of the financial year:
The Group
2002 2001
Full time 2,011 2,173
Part time 52 84
2,063 2,257
The Company does not have any employees on its payroll because all daily operations have been
outsourced to a related party, the investment manager of the holding corporation for an annual fee
of $28,000 (2001: $24,000).
Included in termination benefits are retrenchment benefits of $669,816 (2001: $Nil) (note 4)
arising from the cessation of activities of certain subsidiaries during the financial year.
9. Tax
Tax expense
The Group The Company
2002 2001 2002 2001
$ $ $ $
Tax expense on results is made
up of:
Current income tax
Singapore 110 – 110 –
Foreign 2,462,557 1,610,660 1,360,406 76,368
2,462,667 1,610,660 1,360,516 76,368
Deferred tax (note 30) (1,249,217) – – –
1,213,450 1,610,660 1,360,516 76,368
Overprovision in current income
tax in preceding financial year
Singapore (34,554) (11,477) (34,554) (11,477)
Foreign (191,713) – – –
(226,267) (11,477) (34,554) (11,477)
987,183 1,599,183 1,325,962 64,891
Brought to you by Global Reports

Transpac Industrial Holdings Limited and Its Subsidiaries
53
The tax expense on results differs from the amount that would arise using the Singapore standard
rate of income tax due to the following:
The Group The Company
2002 2001 2002 2001
$ $ $ $
(Loss)/profit before tax (14,845,306) 6,454,557 (7,067,761) (5,790,412)
Tax calculated at a tax rate of
22% (2001: 24.5%) (3,265,967) 1,581,366 (1,554,907) (1,418,651)
Income not subject to tax (162,800) (723,640) (14,862) (638,472)
Effect of different tax rates in
other countries 589,393 (1,081,065) (1,134,327) (1,736,546)
Expenses not deductible for
tax purposes 4,568,612 675,096 4,064,612 3,870,037
Realisation of previously
unrecognised deferred tax assets:
– Tax losses (91,540) – – –
– Other temporary difference
(note 30) (1,013,176) – – –
Deferred tax assets tax losses
for the financial year not
recognised due to uncertainty
of realisation 588,928 1,158,903 – –
1,213,450 1,610,660 1,360,516 76,368
The subsidiaries in the People’s Republic of China are entitled to tax concessions whereby the
profits of the first two financial years beginning with the first profit- making year (after deducting
any past losses) are exempted from income tax and the profits of the subsequent three financial
years are taxed at half of the normal income tax rate of 24% that is reduced from the normal
income tax rate of 27%. For the financial year ended 31 December 2002, one profitable
subsidiary was exempted from income tax and two profitable subsidiaries’ tax rate was raised to
the normal income tax rate of 27% from 12%.
10. Cash and cash equivalents
Cash and cash equivalents consist of cash on hand and balances with banks, net of bank overdraft.
Cash and cash equivalents included in the cash flow statement comprise the following balance
sheet amounts:
The Group The Company
2002 2001 2002 2001
$ $ $ $
Cash and bank balances 22,042,737 24,847,713 200,562 231,059
Fixed deposits with banks 4,217,603 9,534,006 – 5,320,618
26,260,340 34,381,719 200,562 5,551,677
Less: Bank overdraft – (260,750) – –
26,260,340 34,120,969 200,562 5,551,677
Cash and bank balances in certain subsidiaries of $188,124 (2001: $694,881) are restricted to
specific use.
Fixed deposits with banks in certain subsidiaries of $Nil (2001: $726,954) have been pledged for
credit facilities granted to those subsidiaries (note 28).
Brought to you by Global Reports

Transpac Industrial Holdings Limited and Its Subsidiaries
54
11. Trade receivables
The Group
2002 2001
$ $
Trade receivables 7,133,487 13,548,255
Less: Provision for doubtful trade receivables (2,390,807) (1,780,103)
4,742,680 11,768,152
Movements in provision for doubtful trade receivables are as follows:
The Group
2002 2001
$ $
Balance at beginning of the financial year 1,780,103 867,045
Currency translation adjustment (102,821) 86,322
Provision during the financial year (note 5) 1,220,747 826,736
Bad debts written off against provision (507,222) –
Balance at end of the financial year 2,390,807 1,780,103
Included in the provision for doubtful trade receivables made during the financial year is an
amount of $21,816 (2001: $Nil) (note 4) arising from the cessation of activities of a subsidiary
during the financial year.
12. Inventories
The Group
2002 2001
$ $
At cost
Raw materials 2,879,855 5,272,784
Finished products 3,671,736 3,076,714
Work-in-progress 3,057,518 3,385,404
9,609,109 11,734,902
Less: Provision for inventory write-down (1,548,068) (153,122)
8,061,041 11,581,780
Movements in provision for inventory write-down are as follows:
The Group
2002 2001
$ $
Balance at beginning of the financial year 153,122 48,309
Currency translation adjustment (50,526) 6,443
Provision during the financial year (note 5) 1,449,335 148,480
Provision written back (note 5) (3,863) (50,110)
Balance at end of the financial year 1,548,068 153,122
Included in the provision for inventory write-down made during the financial year is an amount of
$574,968 (2001: $Nil) (note 4) arising from the cessation of activities of certain subsidiaries
during the financial year.
Brought to you by Global Reports
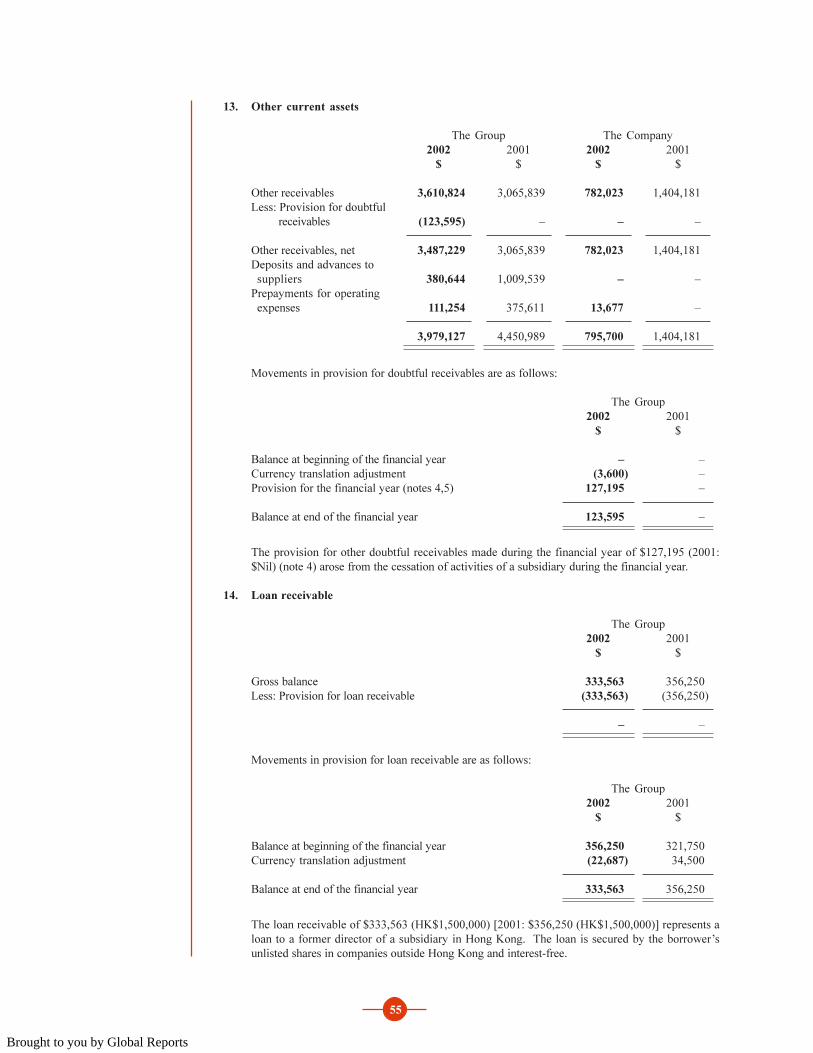
Transpac Industrial Holdings Limited and Its Subsidiaries
55
13. Other current assets
The Group The Company
2002 2001 2002 2001
$ $ $ $
Other receivables 3,610,824 3,065,839 782,023 1,404,181
Less: Provision for doubtful
receivables (123,595) – – –
Other receivables, net 3,487,229 3,065,839 782,023 1,404,181
Deposits and advances to
suppliers 380,644 1,009,539 – –
Prepayments for operating
expenses 111,254 375,611 13,677 –
3,979,127 4,450,989 795,700 1,404,181
Movements in provision for doubtful receivables are as follows:
The Group
2002 2001
$ $
Balance at beginning of the financial year – –
Currency translation adjustment (3,600) –
Provision for the financial year (notes 4,5) 127,195 –
Balance at end of the financial year 123,595 –
The provision for other doubtful receivables made during the financial year of $127,195 (2001:
$Nil) (note 4) arose from the cessation of activities of a subsidiary during the financial year.
14. Loan receivable
The Group
2002 2001
$ $
Gross balance 333,563 356,250
Less: Provision for loan receivable (333,563) (356,250)
– –
Movements in provision for loan receivable are as follows:
The Group
2002 2001
$ $
Balance at beginning of the financial year 356,250 321,750
Currency translation adjustment (22,687) 34,500
Balance at end of the financial year 333,563 356,250
The loan receivable of $333,563 (HK$1,500,000) [2001: $356,250 (HK$1,500,000)] represents a
loan to a former director of a subsidiary in Hong Kong. The loan is secured by the borrower’s
unlisted shares in companies outside Hong Kong and interest-free.
Brought to you by Global Reports

Transpac Industrial Holdings Limited and Its Subsidiaries
56
15. Investments in subsidiaries
The Company
2002 2001
$ $
Investments in unquoted equity shares at cost 63,528,528 59,513,092
Loans to subsidiaries - interest-free 27,088,628 26,832,795
Loan to subsidiary - interest-bearing 946,269 581,875
91,563,425 86,927,762
Less: Provision for investments in subsidiaries (34,270,046) (17,714,150)
57,293,379 69,213,612
The interest-bearing loan bears interest at prime rate plus 0.5% margin per annum.
The above loans to subsidiaries are unsecured and have no fixed terms of repayment.
Movements in provision for investments in subsidiaries are as follows:
The Company
2002 2001
$ $
Balance at beginning of the financial year 17,714,150 1,528,667
Currency translation adjustment (1,641,606) 594,737
Provision during the financial year (note 5) 18,197,502 15,590,746
Balance at end of the financial year 34,270,046 17,714,150
Details of the subsidiaries at 31 December 2002 are as follows:
Effective Cost of
Country of equity interest investment
incorporation held by the held by the Principal
Name of company and business Group Company activities
2002 2001 2002 2001
% % $ $
China Food Processing Hong Kong – 54.68 – # Dormant
Group Ltd ### SAR, China
China Food Processing BritishVirgin 54.68 54.68 # # Investment
Holdings Co. Ltd ** Islands holding
China Food Processing BritishVirgin – 54.68 – # Investment
International Co. Ltd ## Islands holding
China Food Processing Hong Kong – 54.68 – # Investment
(PRC) Ltd ### SAR, China holding
Dalian FTZ Yue Hua China – 100.00 – # Trading of
International Trade specialty fats
Co. Ltd ###
Dunston Assets BritishVirgin 100.00 100.00 2 2 Investment
Limited *** Islands holding
East West International Hong Kong – 60.00 – # Trading of
Limited ### SAR, China frozen food
products
Brought to you by Global Reports

Transpac Industrial Holdings Limited and Its Subsidiaries
57
Effective Cost of
Country of equity interest investment
incorporation held by the held by the Principal
Name of company and business Group Company activities
2002 2001 2002 2001
% % $ $
Fairlink Investment Hong Kong 54.68 54.68 # # Investment
Limited** SAR, China holding
FMA Development BritishVirgin 100.00 100.00 4 3 Dormant
Co. Ltd ## Islands
Foodstar (China) China 100.00 – 7,805,377 – Investment
Investments Company holding
Limited**
Foodstar Management Hong Kong 100.00 100.00 # # Providing
Company Limited* SAR, China management
services to
group
companies
Foodstar Trading BritishVirgin 100.00 100.00 2 2 Providing
Company Limited*** Islands management
services to
group
companies
Foodstar Trading Hong Kong 100.00 100.00 1 1 Trading of
(Hong Kong) SAR, China food products
Company Limited *
Guangzhou Foodstar China 100.00 100.00 # # Providing
Marketing Services marketing
Co. Ltd** services and
investment
holding
G & K Holdings Hong Kong 100.00 100.00 # # Investment
Ltd ** SAR, China holding
Kaiping Guanghe China 100.00 100.00 10,086,577 10,772,603 Manufacture and
Fermented Bean Curd sale of
Co. Ltd* fermented bean
curd
Kaiping Jiashili Dried China 100.00 100.00 8,364,649 8,933,561 Manufacture and
Fruit and Nuts Co. Ltd *@ sale of dried
fruit and nuts
Kaiping Weixida Seasoning China 100.00 100.00 22,544,867 24,078,228 Manufacture and
Co. Ltd* sale of
seasonings
Nanjing Jilun Seasoning China 100.00 100.00 13,888,961 14,833,602 Manufacture and
Product Co. Ltd * sale of
seasonings
Shanghai Xinjing Western- China 32.81 32.81 # # Manufacture and
Style Food Co. Ltd**@ sale of
processed food
Silver Eagle Foods & Hong Kong 70.00 70.00 # # Trading of food
Trading Company SAR, China products
Limited**@
Brought to you by Global Reports
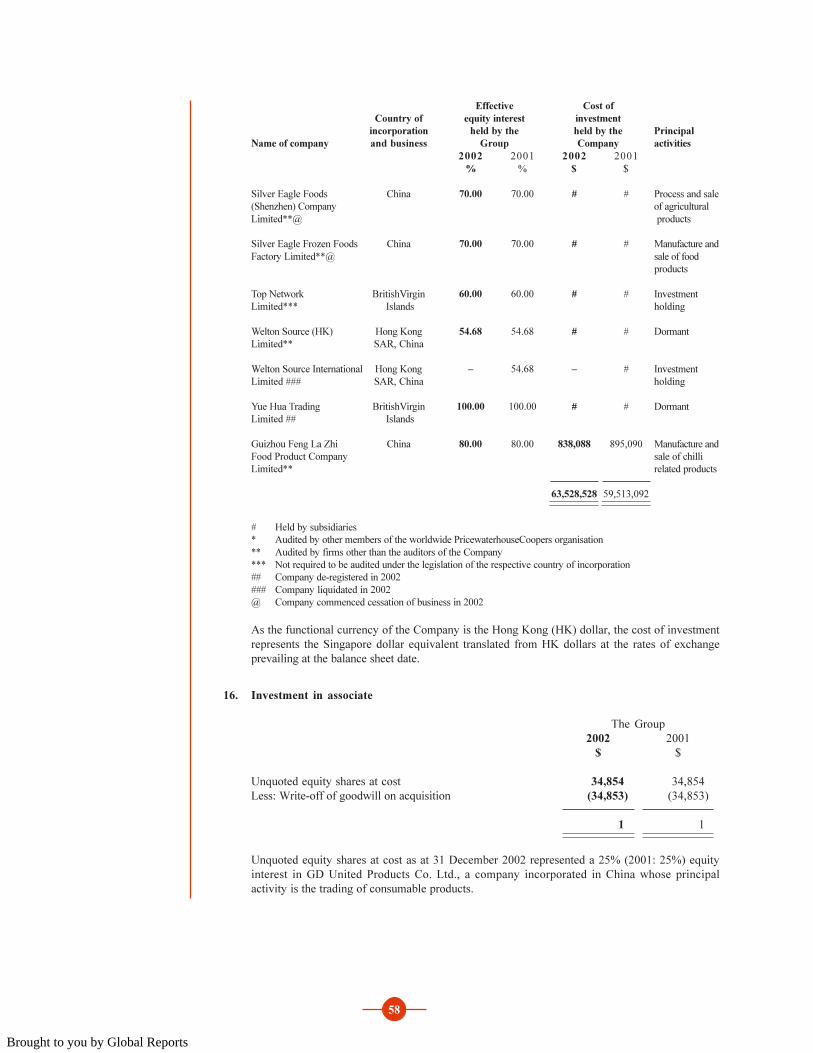
Transpac Industrial Holdings Limited and Its Subsidiaries
58
Effective Cost of
Country of equity interest investment
incorporation held by the held by the Principal
Name of company and business Group Company activities
2002 2001 2002 2001
% % $ $
Silver Eagle Foods China 70.00 70.00 # # Process and sale
(Shenzhen) Company of agricultural
Limited**@ products
Silver Eagle Frozen Foods China 70.00 70.00 # # Manufacture and
Factory Limited**@ sale of food
products
Top Network BritishVirgin 60.00 60.00 # # Investment
Limited*** Islands holding
Welton Source (HK) Hong Kong 54.68 54.68 # # Dormant
Limited** SAR, China
Welton Source International Hong Kong – 54.68 – # Investment
Limited ### SAR, China holding
Yue Hua Trading BritishVirgin 100.00 100.00 # # Dormant
Limited ## Islands
Guizhou Feng La Zhi China 80.00 80.00 838,088 895,090 Manufacture and
Food Product Company sale of chilli
Limited** related products
63,528,528 59,513,092
# Held by subsidiaries
* Audited by other members of the worldwide PricewaterhouseCoopers organisation
** Audited by firms other than the auditors of the Company
*** Not required to be audited under the legislation of the respective country of incorporation
## Company de-registered in 2002
### Company liquidated in 2002
@ Company commenced cessation of business in 2002
As the functional currency of the Company is the Hong Kong (HK) dollar, the cost of investment
represents the Singapore dollar equivalent translated from HK dollars at the rates of exchange
prevailing at the balance sheet date.
16. Investment in associate
The Group
2002 2001
$ $
Unquoted equity shares at cost 34,854 34,854
Less: Write-off of goodwill on acquisition (34,853) (34,853)
1 1
Unquoted equity shares at cost as at 31 December 2002 represented a 25% (2001: 25%) equity
interest in GD United Products Co. Ltd., a company incorporated in China whose principal
activity is the trading of consumable products.
Brought to you by Global Reports

Transpac Industrial Holdings Limited and Its Subsidiaries
59
17. Property, plant and equipment
Leasehold Machinery Furniture Construc-
Land-use Leasehold improve- and and Motor tion in-
rights buildings ments Plant equipment fittings Vehicles progress Total
$ $ $ $ $ $ $ $ $
The Group
Cost
At 1 January 2002 7,969,539 20,974,406 1,313,165 11,206,408 27,530,091 2,747,164 2,486,514 514,500 74,741,787
Currency translation
adjustment (493,076) (1,242,223) (56,203) (793,100) (1,562,307) (185,786) (150,647) (31,092) (4,514,434)
Additions – 81,471 3,865 110,921 691,211 800,572 155,295 1,006,564 2,849,899
Disposals (26,948) (436,345) (4,541) (904,128) (7,225,734) (185,853) (411,296) (1,050,945) (10,245,790)
Transfer to deferred
expenditure (431,167) (2,767,661) (961,503) 3,729,164 11,268 (290,574) – (11,268) (721,741)
At 31 December 2002 7,018,348 16,609,648 294,783 13,349,265 19,444,529 2,885,523 2,079,866 427,759 62,109,721
Accumulated
depreciation
At 1 January 2002 (501,216) (1,801,140) (140,615) (3,470,203) (6,897,524) (1,403,736) (1,629,258) – (15,843,692)
Currency translation
adjustment 35,873 131,253 9,661 222,380 431,083 90,894 102,314 – 1,023,458
Disposals – 23,182 3,051 573,387 1,948,064 122,686 361,843 – 3,032,213
Depreciation charge (141,224) (631,725) (36,255) (653,585) (1,710,982) (414,094) (294,761) – (3,882,626)
Transfer to deferred
expenditure – 10,348 7,114 (17,462) – 242,085 – – 242,085
At 31 December 2002 (606,567) (2,268,082) (157,044) (3,345,483) (6,229,359) (1,362,165) (1,459,862) – (15,428,562)
Provision for
diminution in value
At 1 January 2002 – (257,468) – (417,547) (4,971,494) (9,567) – – (5,656,076)
Currency translation
adjustment 829 117,080 2,673 56,656 261,057 4,685 1,323 – 444,303
Provision during the
financial year (29,393) (3,568,023) (94,739) (1,375,389) (2,632,615) (153,422) (46,886) – (7,900,467)
Write-off against
provision – – – 307,040 4,565,735 8,925 – – 4,881,700
At 31 December 2002 (28,564) (3,708,411) (92,066) (1,429,240) (2,777,317) (149,379) (45,563) – (8,230,540)
Net book value
At 31 December 2002 6,383,217 10,633,155 45,673 8,574,542 10,437,853 1,373,979 574,441 427,759 38,450,619
Net book value
At 31 December 2001 7,468,323 18,915,798 1,172,550 7,318,658 15,661,073 1,333,861 857,256 514,500 53,242,019
(a) Property with net book value of $10,970,462 (2001: $22,574,255) is pledged as security
for bank borrowings (note 28).
(b) Titles to leasehold buildings with net book value of $1,199,000 (2001: $1,676,000) are still
in the process of being transferred to the name of the subsidiaries.
(c) Property rights certificate for a leasehold building with net book value of $442,000 (2001:
$472,000) has not been obtained.
(d) Included in the provision for diminution in value of property, plant and equipment made
during the financial year is an amount of $7,703,090 (2001: $Nil) (note 4) arising from the
cessation of activities of certain subsidiaries during the financial year.
Brought to you by Global Reports

Transpac Industrial Holdings Limited and Its Subsidiaries
60
18. Deferred expenditure
Non-refundable utilities deposits
The Group
2002 2001
$ $
Balance at beginning of the financial year 106,167 106,041
Currency translation adjustment (3,478) 7,009
Additions 62,175 –
Transfer from property, plant and equipment 479,656 –
Amortisation during the financial year (note 5) (104,851) (6,883)
Write-off during the financial year (note 5) (539,669) –
Balance at end of the financial year – 106,167
Included in the write-off of deferred expenditure during the financial year is an amount of
$108,502 (2001: $Nil) (note 4) arising from the cessation of activities of a subsidiary during the
financial year.
19. Goodwill
The Group
2002 2001
$ $
Unamortised balance at beginning of the financial year 173,285 –
Currency translation adjustment (8,130) –
Acquisition of additional interests in subsidiaries – 192,539
Amortisation during the financial year (note 5) (18,823) (19,254)
Unamortised balance at end of the financial year 146,332 173,285
Cost 182,915 192,539
Accumulated amortisation (36,583) (19,254)
146,332 173,285
Brought to you by Global Reports

Transpac Industrial Holdings Limited and Its Subsidiaries
61
20. Trademarks
The Group
2002 2001
$ $
Cost 10,865,426 9,816,696
Currency translation adjustment (555,301) 1,048,730
Accumulated amortisation (2,444,336) (4,572,798)
Write-off during the financial year (notes 4, 5) (4,765,388) –
Net book value 3,100,401 6,292,628
Movements in accumulated amortisation are as follows:
The Group
2002 2001
$ $
Balance at beginning of the financial year 4,572,798 3,262,993
Currency translation adjustment (236,920) 260,302
Write-off during the financial year (notes 4,5) (2,938,656) –
Amortisation during the financial year (note 5) 1,047,114 1,049,503
Balance at end of the financial year 2,444,336 4,572,798
The write-off of trademarks during the financial year of $1,826,732 (2001: $Nil) (note 4) arose
from the cessation of activities of a subsidiary during the financial year.
Trademarks represent the licences to use certain registered brand names of processed food items
in the People’s Republic of China including Hong Kong. The costs of these trademarks were
established upon the injection of capital by the shareholders into the subsidiaries.
21. Other payables
The Group The Company
2002 2001 2002 2001
$ $ $ $
Advances and deposits received 178,096 801,192 – –
Accruals for operating expenses 2,624,077 3,931,819 235,857 387,578
Value-added tax payable 3,547,896 9,536,773 – –
Other creditors 3,193,400 2,436,067 79,038 –
Provision for staff welfare 194,195 1,006,162 – –
Provision for retrenchment
benefits relating to cessation of
activities 650,914 – – –
Provision for expenses relating to
cessation of activities 825,688 – – –
11,214,266 17,712,013 314,895 387,578
22. Holding and ultimate holding corporation
The holding and ultimate holding corporation is Transpac Industrial Holdings Limited, a listed
company incorporated in Singapore.
Brought to you by Global Reports

Transpac Industrial Holdings Limited and Its Subsidiaries
62
23. Payables to shareholders
The amount due to shareholders including the holding corporation in the previous financial year
represented convertible loans which were interest-free, unsecured and repayable on demand.
These loans were converted in the financial year, at the option of the shareholders, into ordinary
shares in the capital of the Company (note 31).
The Group The Company
2002 2001 2002 2001
$ $ $ $
Due to holding corporation – 17,992,026 – 17,992,026
Due to other shareholders – 10,341,873 – 10,341,873
– 28,333,899 – 28,333,899
24. Payable to a related party
The related party is the minority shareholder of the Group’s subsidiary.
The amount due to the related party is unsecured, bears interest at Hong Kong prime rate and is
repayable on demand.
25. Other short-term loan (unsecured)
The other short-term loan in the previous financial year was unsecured, interest-free and had
since been repaid.
26. Long-term payables (unsecured)
The Group
2002 2001
$ $
Long-term payables - interest-bearing – 531,028
Long-term payable - interest-free 1,257,000 1,789,610
Less: Amount due within 12 months (419,000) (754,729)
Amount due after 12 months 838,000 1,565,909
The interest-bearing long term payables as at 31 December 2001 included an amount of RMB1
million repayable in full on 28 February 2003 and an amount of HK$1,294,006 with no specific
repayment terms. The effective interest rate is disclosed in note 37(b).
The interest-free long-term payable includes an amount payable in relation to the purchase of
trademark by a subsidiary. The amount is repayable in five annual instalments of RMB2 million
each commencing in 2001.
Brought to you by Global Reports
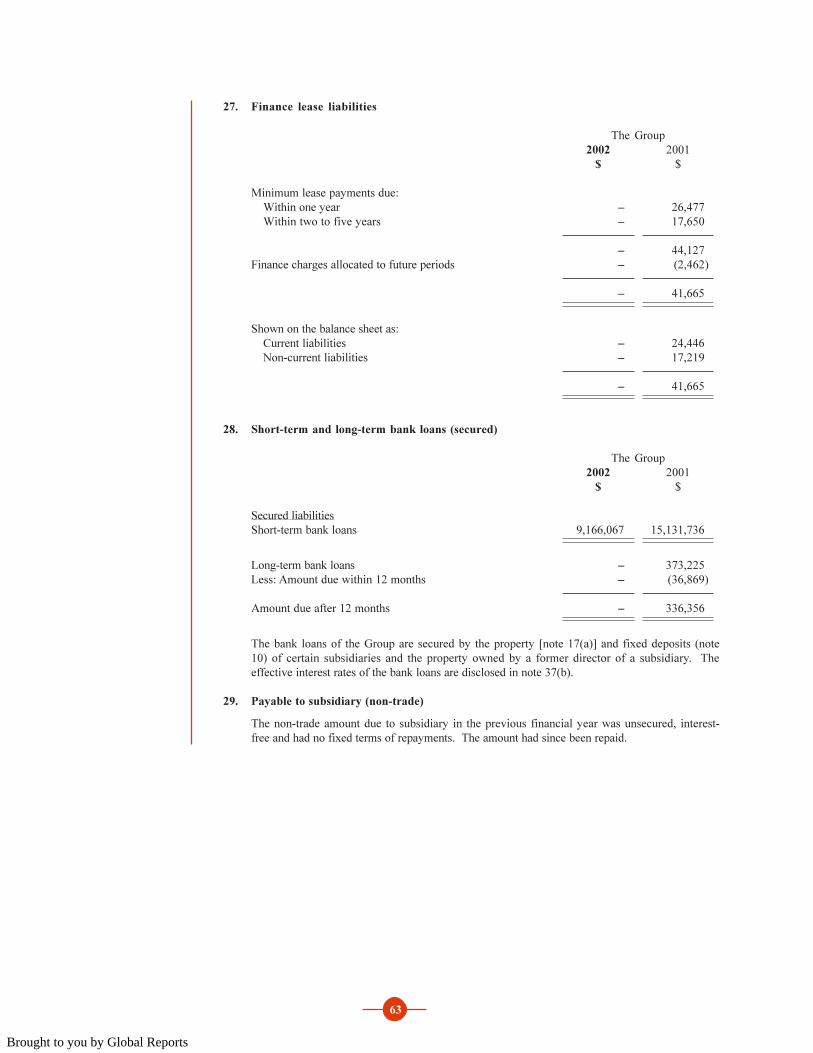
Transpac Industrial Holdings Limited and Its Subsidiaries
63
27. Finance lease liabilities
The Group
2002 2001
$ $
Minimum lease payments due:
Within one year – 26,477
Within two to five years – 17,650
– 44,127
Finance charges allocated to future periods – (2,462)
– 41,665
Shown on the balance sheet as:
Current liabilities – 24,446
Non-current liabilities – 17,219
– 41,665
28. Short-term and long-term bank loans (secured)
The Group
2002 2001
$ $
Secured liabilities
Short-term bank loans 9,166,067 15,131,736
Long-term bank loans – 373,225
Less: Amount due within 12 months – (36,869)
Amount due after 12 months – 336,356
The bank loans of the Group are secured by the property [note 17(a)] and fixed deposits (note
10) of certain subsidiaries and the property owned by a former director of a subsidiary. The
effective interest rates of the bank loans are disclosed in note 37(b).
29. Payable to subsidiary (non-trade)
The non-trade amount due to subsidiary in the previous financial year was unsecured, interest-
free and had no fixed terms of repayments. The amount had since been repaid.
Brought to you by Global Reports

Transpac Industrial Holdings Limited and Its Subsidiaries
64
30. Deferred tax assets
The Group
2002 2001
$ $
Balance at beginning of the financial year – –
Credited to income statement (note 9) 1,249,217 –
Currency translation adjustment (35,252) –
Balance at end of the financial year 1,213,965 –
Deferred tax assets are recognised for tax losses carried forward to the extent that realisation of
the related tax benefits through future taxable profits is probable. The Group has unrecognised
tax losses of $5,234,000 (2001: $3,712,000) which can be carried forward and used to offset
against future taxable income subject to meeting certain statutory requirements by those
companies with unrecognised tax losses in their respective countries of incorporation. The tax
losses have no expiry date.
The movement in the Group’s deferred tax assets (prior to offsetting of balances within the same
tax jurisdiction) during the financial year is as follows:
The Group
Deferred tax assets
Accelerated
accounting
depreciation Other Total
$ $ $
Balance at beginning of the financial year – – –
Credited to income statement 236,041 1,013,176 1,249,217
Currency translation adjustment (6,661) (28,591) (35,252)
Balance at end of the financial year 229,380 984,585 1,213,965
The deferred tax asset of $984,585 (2001: $Nil) relates to temporary difference arising from the
loss on disposal of certain plant and equipment of a subsidiary in the People’s Republic of China
(“PRC”). In accordance with the provision of the tax legislation in PRC, this loss is allowed for
deduction against taxable profit of the subsidiary in future financial years.
Brought to you by Global Reports

Transpac Industrial Holdings Limited and Its Subsidiaries
65
31. Share capital
(a) Authorised ordinary share capital
The total authorised number of ordinary shares is 45 million shares (2001: 28 million
shares) with a par value of $1 per share (2001: $1 per share).
(b) Issued ordinary share capital
2002 2001 2002 2001
Shares Shares $ $
Balance at beginning of
the financial year 25,405,441 25,405,441 25,405,441 25,405,441
Issued during the financial
year 15,527,723 – 15,527,723 –
Balance at end of the
financial year 40,933,164 25,405,441 40,933,164 25,405,441
During the financial year, the Company issued 15,527,723 ordinary shares of $1 each at a
premium of $0.8247 per share by conversion of its shareholders’ (including the holding
corporation) loans to the Company (note 23).
32. Reserves
The Group The Company
2002 2001 2002 2001
$ $ $ $
(a) Composition:
Capital reserve (1,372,379) (1,372,379) – –
General reserve 650,740 441,895 – –
Enterprise development
reserve 650,740 441,895 – –
Capital and other reserves (70,899) (488,589) – –
Foreign currency translation
reserves 4,775,028 9,085,150 5,192,285 9,453,281
(Accumulated losses)/
retained earnings (5,944,077) 7,965,625 (5,347,318) 3,046,405
(1,239,948) 16,562,186 (155,033) 12,499,686
Brought to you by Global Reports

Transpac Industrial Holdings Limited and Its Subsidiaries
66
(b) Movements in capital and other reserves:
The Group
2002 2001
$ $
Capital reserve
Balance at beginning and end of the financial year (1,372,379) (1,372,379)
General reserve
Balance at beginning of the financial year 441,895 298,849
Transfer from (accumulated losses)/retained earnings 208,845 143,046
Balance at end of the financial year 650,740 441,895
Enterprise development reserve
Balance at beginning of the financial year 441,895 298,849
Transfer from (accumulated losses)/retained earnings 208,845 143,046
Balance at end of the financial year 650,740 441,895
Capital reserve represents goodwill arising from acquisitions prior to 1 January 2001 which
had been charged in full directly to shareholders’ equity.
The general reserve and enterprise development reserve represent amounts set aside in
accordance with laws in the People’s Republic of China where certain subsidiaries operate.
Capital reserve, general reserve and enterprise development reserve are not distributable by
way of cash dividends.
33. Minority interests
The Group
2002 2001
$ $
Balance at beginning of the financial year 2,465,093 15,897,820
Currency translation adjustment (81,789) 191,516
Incorporation of new subsidiary – 210,537
Purchase of additional interests in subsidiaries – (12,998,486)
Share of loss after tax of subsidiaries (2,340,477) (836,294)
Balance at end of the financial year 42,827 2,465,093
Brought to you by Global Reports

Transpac Industrial Holdings Limited and Its Subsidiaries
67
34. Related party transactions
In addition to the related party information shown elsewhere in the financial statements, the
following significant transactions between the Group and related parties took place during the
financial year at terms agreed between the parties concerned:
The Group The Company
2002 2001 2002 2001
$ $ $ $
Dividend income received
from subsidiaries – – 11,340,212 7,352,804
Interest paid to the minority
shareholders of subsidiaries 7,716 14,758 – –
Interest income from subsidiary – – 37,485 19,943
Consideration paid to minority
shareholders of subsidiaries
for the purchase of additional
interests – 12,915,498 – –
35. Operating lease commitments
Commitments in relation to non-cancellable operating leases contracted for at the reporting dates
but not recognised as liabilities, are payable as follows:
The Group
2002 2001
$ $
Within one year 492,008 327,744
Within two to five years 708,320 302,266
After five years 38,782 1,103,291
1,239,110 1,733,301
36. Financial risk management
Financial risk factors
The Group’s activities expose it to a variety of financial risks, including the effects of changes in
market prices, foreign currency exchange rates and interest rates. The Group’s overall risk
management programme focuses on the unpredictability of financial markets and seeks to
minimise potential adverse effects on the financial performance of the Group.
(i) Foreign exchange risk
The Company’s functional currency is Hong Kong dollars. It operates in the People’s
Republic of China (including Hong Kong) and Singapore through subsidiaries and associates
and with the administrative head office in Singapore. Therefore the Group is exposed to
foreign exchange risk arising from various currency exposures primarily with respect to
Singapore dollars and Renminbi.
The Company has a number of investments in foreign subsidiaries, whose net assets are
exposed to currency translation risk with respect to Renminbi.
(ii) Interest rate risk
The Group’s income and operating cash flows are substantially independent of changes in
market interest rates. The Group has no significant interest-bearing assets. The Group’s
policy is to maintain significant percentage of its borrowings in fixed rate instruments.
Brought to you by Global Reports

Transpac Industrial Holdings Limited and Its Subsidiaries
68
(iii) Credit risk
The Group has no significant concentrations of credit risk. The Group has policies in place
to ensure that sales of products and services are made to customers with an appropriate
credit history.
(iv) Liquidity risk
Prudent liquidity risk management implies maintaining sufficient cash and the availability of
funding through an adequate amount of committed credit facilities. Due to the dynamic
nature of the underlying businesses, the Group maintains flexibility in funding by keeping
committed credit lines available.
37. Fair values and effective interest rates
(a) Carrying amounts and fair values
The fair values are based on cash flows using discounted rate at the borrowing rates which
the directors expect would be available to the Group at the balance sheet date.
The carrying amounts and fair values of long-term payables and long-term bank loans are as
follows:
The Group Carrying amounts Fair values
2002 2001 2002 2001
$ $ $ $
Long-term payables 1,257,000 2,320,638 1,198,123 1,933,827
Long-term bank loans – 373,225 – 373,225
Other than the long-term payables and long-term bank loans, the carrying amounts of the
following financial assets and financial liabilities approximate their fair values: cash and cash
equivalents, trade receivables and payables, other receivables and payables, loans to
subsidiaries, amount payable to subsidiary, short-term loans and finance lease liabilities.
(b) Effective interest rates
The weighted average effective interest rates at the balance sheet date were as follows:
The Group
2002 2001
% %
Fixed deposits (note 10) 0.92 1.65
Bank overdraft (note 10) – 7.13
Short-term bank loans (note 28) 5.18 5.76
Long-term bank loans (note 28) – 6.60
Long-term payables - interest-bearing portion (note 26) – 7.13
Finance lease liabilities (note 27) – 12.00
38. Authorisation of financial statements
These financial statements were authorised for issue in accordance with a resolution of the Board
of Directors of Foodstar Holdings Pte Ltd on 19 March 2003.
Brought to you by Global Reports

Transpac Industrial Holdings Limited and Its Subsidiaries
69
Shareholding Statistics
Authorised Share Capital – S$500,000,000
Issued and Fully Paid Capital – S$20,000,001
Class of Shares – Ordinary shares of S$0.50 each
Voting Rights – One (1) vote per share
STATISTICS OF SHAREHOLDINGS AS AT 26 MARCH 2003
DISTRIBUTION OF SHAREHOLDINGS
No. of No. of
Size of Holdings Shareholders % Shares %
1 – 999 5 0.08 1,502 0.00
1,000 – 10,000 6,299 97.36 10,137,000 25.34
10,001 – 1,000,000 162 2.50 9,438,000 23.60
1,000,001 and above 4 0.06 20,423,500 51.06
TOTAL 6,470 100.00 40,000,002 100.00
TWENTY LARGEST SHAREHOLDERS
No. Name No. of Shares %
1. DBS Nominees Pte Ltd 10,661,000 26.65
2. Raffles Nominees Pte Ltd 6,973,000 17.43
3. Citibank Nominees Singapore Pte Ld 1,508,000 3.77
4. G K Goh Stockbrokers Pte Ltd 1,281,500 3.20
5. HSBC (Singapore) Nominees Pte Ltd 726,000 1.81
6. Intraco Limited 600,000 1.50
7. Nomura Singapore Limited 530,000 1.32
8. United Overseas Bank Nominees Pte Ltd 452,000 1.13
9. Natsteel Ltd 400,000 1.00
10. Kim Leng Tee Investments Pte Ltd 331,000 0.83
11. Stone Robert Alexander 304,000 0.76
12. OCBC Securities Private Ltd 284,000 0.71
13. DBS Vickers Securities (S) Pte Ltd 275,000 0.69
14. Tan Wai See 259,000 0.65
15. Ho Pheng Theng Jeannette 220,000 0.55
16. Lim Kim Phang 215,000 0.54
17. Prima Investment Holdings (Singapore) Pte Ltd 200,000 0.50
18. Underwater World International Pte Ltd 200,000 0.50
19. Oversea-Chinese Bank Nominees Pte Ltd 164,000 0.41
20. Chen Wei Ching Vincent 120,000 0.30
TOTAL 25,703,500 64.25
Based on the information available to the Company as at 26 March 2003, approximately 63.33% of
the issued ordinary shares of the Company are held by the public and therefore, Rule 723 of the
Listing Manual issued by the Singapore Exchange Securities Trading Limited is complied with.
Brought to you by Global Reports

Transpac Industrial Holdings Limited and Its Subsidiaries
70
SUBSTANTIAL SHAREHOLDERS
(As shown in the Company’s Register of Substantial Shareholders as at 26 March 2003)
No. of Shares Held
Name of Percentage
Substantial Direct (%) of
No. Shareholders Interest Shareholding
1. NTUC Income Insurance Co-operative
Limited 6,761,000 16.90
2. Pantheon Asia Fund Limited* 5,341,000 13.35 *
Pantheon Asia Fund II Limited* 377,000 0.94 *
3. Public Bank (L) Ltd 2,000,000 5.00
* Pantheon Asia Fund Limited and Pantheon Asia Fund II Limited are both managed by Pantheon
Ventures (Guernsey) Limited. Their aggregated shareholdings amount to 14.29%.
DIRECTORS’ SHAREHOLDINGS
(As shown in the Company’s Register of Directors’ Shareholdings as at 21 January 2003)
No. of Shares Shareholdings in
Registered which Director
Description in Name of is Deemed to
Name of Director of Shares Director have an Interest
Cheng Wai Keung Ordinary 27,000 –
shares of
S$0.50 each
Leong Ka Cheong Ordinary 163,002#
–
Christopher shares of
S$0.50 each
# Out of 163,002 shares held by Leong Ka Cheong Christopher, 163,000 shares and 1 share are/is
registered in the names of his respectives nominees, DBS Vickers Securities (S) Pte Ltd and Ms Cheryl
Van Steenwyk.
Brought to you by Global Reports
Transpac Industrial Holdings Limited and Its Subsidiaries
71
Notice of Ninth
Annual General Meeting
NOTICE IS HEREBY GIVEN that the Ninth Annual General Meeting of Transpac Industrial
Holdings Limited will be held at Moor Function Room, 4th Floor, Swissotel The Stamford and
Raffles The Plaza, 2 Stamford Road, Singapore 178882 on Wednesday, the 14th day of May 2003 at
2.30 p.m. for the following purposes :-
1. To receive the Directors’ Report and the Audited Accounts for
the financial year ended 31 December 2002, together with the
Auditors’ Report thereon.
2. To declare a first and final exempt one-tier ordinary dividend of
S$0.04 per share for the financial year ended 31 December 2002.
3. To declare a first and final special exempt one-tier dividend of
S$0.08 per share for the financial year ended 31 December 2002.
4. To re-elect Mr Andrew Jonathan Lebus as Director under Article
100.
5. To re-elect Mr Liong Tong Kap as Director under Article 100.
6. To approve the increase of Directors’ Fees from S$59,665 to
S$100,658.
7. In the event that Resolution 6 is not passed, to approve the
Directors’ Fees of S$59,665.
8. To re-appoint Messrs PricewaterhouseCoopers as auditors and
to authorise the Directors to fix their remuneration.
9. To transact any other business that may be transacted at an
Annual General Meeting.
(Resolution 1)
(Resolution 2)
(Resolution 3)
(Resolution 4)
(Resolution 5)
(Resolution 6)
(Resolution 7)
(Resolution 8)
NOTICE OF BOOK CLOSURE DATES AND DIVIDEND PAYMENT DATE
NOTICE IS ALSO HEREBY GIVEN that the Transfer Books and Register of Members of the
Company will be closed on 28 and 29 May 2003 for the purpose of determining shareholders’
entitlements to the proposed first and final exempt one-tier ordinary dividend of S$0.04 per share
and the proposed first and final special exempt one-tier dividend of S$0.08 per share in respect of the
financial year ended 31 December 2002.
Duly completed transfers received by the Company’s Share Registrars, Lim Associates (Pte) Ltd at
10 Collyer Quay #19-08, Ocean Building, Singapore 049315 up to 5.00 p.m. on 27 May 2003 will be
registered to determined the shareholders’ entitlements to the dividends.
Members whose Securities Accounts with The Central Depository (Pte) Limited are credited with
shares at 5.00 p.m. on 27 May 2003 will be entitled to the proposed final dividends.
The dividends, if approved by the shareholders at the Ninth Annual General Meeting, will be paid on
11 June 2003.
BY ORDER OF THE BOARD
Tham Shook Han
Madelyn Kwang Yeit Lam
Company Secretaries
Singapore, 25 April 2003
Brought to you by Global Reports

Transpac Industrial Holdings Limited and Its Subsidiaries
72
Notes:
1. A member entitled to attend and vote at this meeting is entitled to appoint not more than two
proxies to attend and vote in his stead.
2. Where a member appoints two proxies, he shall specify the proportion of his shareholding to be
represented by each proxy. If no such proportion or number is specified, the first named proxy may
be treated as representing 100 per cent of the shareholding and any second named proxy as an
alternate to the first named.
3. A proxy need not be a member of the Company.
4. A corporation which is a member of the Company may authorise by resolution of its directors or
other governing body, such person as it thinks fit to act as its representative at the meeting.
5. The instrument appointing a proxy must be deposited at the registered office of the Company, at 6
Shenton Way #20-09 DBS Building Tower Two, Singapore 068809 not less than 48 hours before the
time appointed for holding the meeting.
6. Mr Andrew Jonathan Lebus is a non-executive director of the Company.
7. Mr Liong Tong Kap is a non-executive director of the Company.
8. In respect of Resolutions 6 and 7, the Directors’ Fees both current and after the proposed increase
are set out as follows:-
Current (S$) After (S$)
Chairman 15,000 p.a. 30,000 p.a.
Audit Committee Members 12,500 p.a. 20,000 p.a.
Other Directors 7,500 p.a. 12,000 p.a.
The increase is proposed in view of the increased number of Board meetings and as guided by the
Survey by the Institute of Directors on the fees payable to non-executive Directors of other
Singapore Listed companies.
Brought to you by Global Reports

Transpac Industrial Holdings Limited and Its Subsidiaries
73
Proxy Form
I/We, _______________________________________________________________________________________________________
of __________________________________________________________________________________________________________
being *a member/members of TRANSPAC INDUSTRIAL HOLDINGS LIMITED (the “Company”), hereby appoint
NRIC/ Proportion of
Name Address Passport Number Shareholdings (%)
*and/or
as *my/our *proxy/proxies to vote for *me/us on *my/our behalf and, if necessary, to demand a poll, at the Ninth Annual General
Meeting of the Company, to be held at Moor Function Room, 4th Floor, Swissotel The Stamford and Raffles The Plaza, 2 Stamford
Road, Singapore 178882 on Wednesday, the 14th day of May 2003, at 2.30 p.m. and at any adjournment thereof.
(Please indicate with an “X” in the spaces provided whether you wish your vote(s) to be cast for or against the resolutions as set
out in the Notice of Ninth Annual General Meeting. In the absence of specific directions, the *proxy/proxies will vote or abstain as
*he/they may think fit, as *he/they will on any other matter arising at the Ninth Annual General Meeting.)
No. Resolutions For Against
1. To receive the Directors’ Report and the Audited Accounts for the financial
year ended 31 December 2002, together with the Auditors’ Report thereon.
2. To declare a first and final exempt one-tier ordinary dividend of S$0.04 per share
for the financial year ended 31 December 2002.
3. To declare a first and final special exempt one-tier dividend of S$0.08 per
share for the financial year ended 31 December 2002.
4. To re-elect Mr Andrew Jonathan Lebus as Director under Article 100.
5. To re-elect Mr Liong Tong Kap as Director under Article 100.
6. To approve the increase of Directors’ Fees from S$59,665 to S$100,658.
7. In the event that Resolution 6 is not passed, to approved the Directors’ Fees of
S$59,665.
8 To re-appoint Messrs PricewaterhouseCoopers as auditors and to authorise the
Directors to fix their remuneration.
Dated this day of 2003.
Signature(s) of member(s)/Common Seal
�
IMPORTANT:
1. For investors who have used their CPF moneys to buy
shares in the capital of Transpac Industrial Holdings
Limited, this Report is forwarded to them at the request of
their CPF Approved Nominees and is sent solely FOR
INFORMATION ONLY.
2. This proxy form is not valid for use by CPF investors and
shall be ineffective for all intents and purposes if used or
purported to be used by them.
Total Number of
Ordinary Shares Held
Brought to you by Global Reports

Notes:-
IMPORTANT
1. A member of the Company entitled to attend and vote at the above meeting is entitled to appoint
one or two proxies to attend and vote in his/her stead. A proxy need not be a member of the
Company.
2. Where a member appoint two proxies, he shall specify the proportion of his shareholding to be
represented by each proxy. If no such proportion or number is specified, the first named proxy may
be treated as representing 100 per cent of the shareholding and any second named proxy as an
alternate to the first named.
3. This instrument of proxy must be signed by the appointor or his/her duly authorised attorney or, if
the appointor is a body corporate, signed by a duly authorised officer or its attorney or affixed with
its common seal thereto.
4. A body corporate which is a member may also appoint by resolution of its directors or other
governing body such person as it thinks fit to act as its authorised representative in accordance with
its Articles of Association and Section 179 of the Companies Act, Chapter 50 of Singapore.
5. This instrument appointing a proxy or proxies, (together with the power of attorney (if any) under
which it is signed or a certified copy thereof), must be deposited at the registered office of the
Company at 6 Shenton Way #20-09 DBS Building Tower Two Singapore 068809, not less than 48
hours before the time fixed for holding the Annual General Meeting.
6. Please insert the total number of shares held by you. If you have shares entered against your name
on the Depository Register (as defined in Section 130A of the Companies Act, Chapter 50 of
Singapore), you should insert that number of shares. If you have shares entered against your name
in the Depository Register and registered in your name in the Register of Members, you should
insert the aggregate number of shares. If no number is inserted, this instrument of proxy will be
deemed to relate to all the shares held by you.
7. The Company shall be entitled to reject this instrument of proxy if it is incomplete, improperly
completed or illegible or where the true intentions of the appointor are not ascertainable from the
instructions of the appointor specified in this instrument of proxy. In addition, in the case of
members whose shares are deposited with The Central Depository (Pte) Limited (“CDP”), the
Company may reject any instrument of proxy lodged if such member is not shown to have shares
entered against his name in the Depository Register as at 48 hours before the time appointed for
the holding of the Annual General Meeting as certified by CDP to the Company.
* Delete Accordingly
Brought to you by Global Reports
Recommended