Transfer Viva
Empathic Visualisation Algorithm (EVA)
Outline
Multi-dimensional Visualisation Overview of EVA Achievements so far What’s happening now Future Work
Data
Large Multiple dimensions (>3) Non-physical nature Hidden information Quantitative (or transformed to
quantitative)
Types of Variables
Nominal (equal or not equal) Ordinal (obeys a < relation) Quantitative (can do arithmetic)
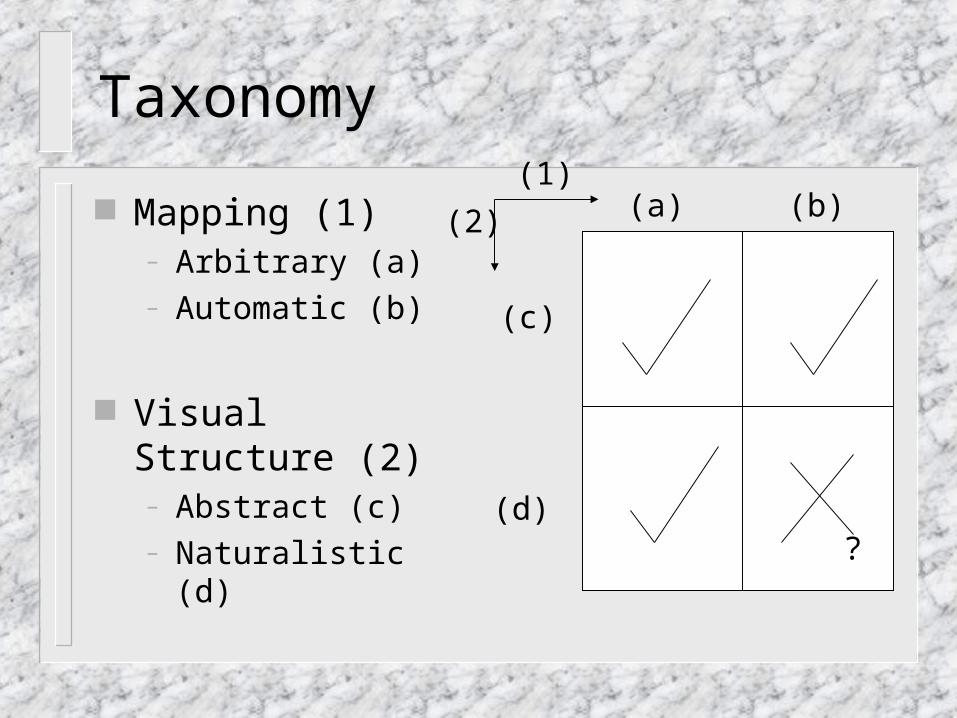
Taxonomy
Mapping (1)– Arbitrary (a)– Automatic (b)
Visual Structure (2)– Abstract (c)– Naturalistic (d)
?
(1)
(2) (a) (b)
(c)
(d)
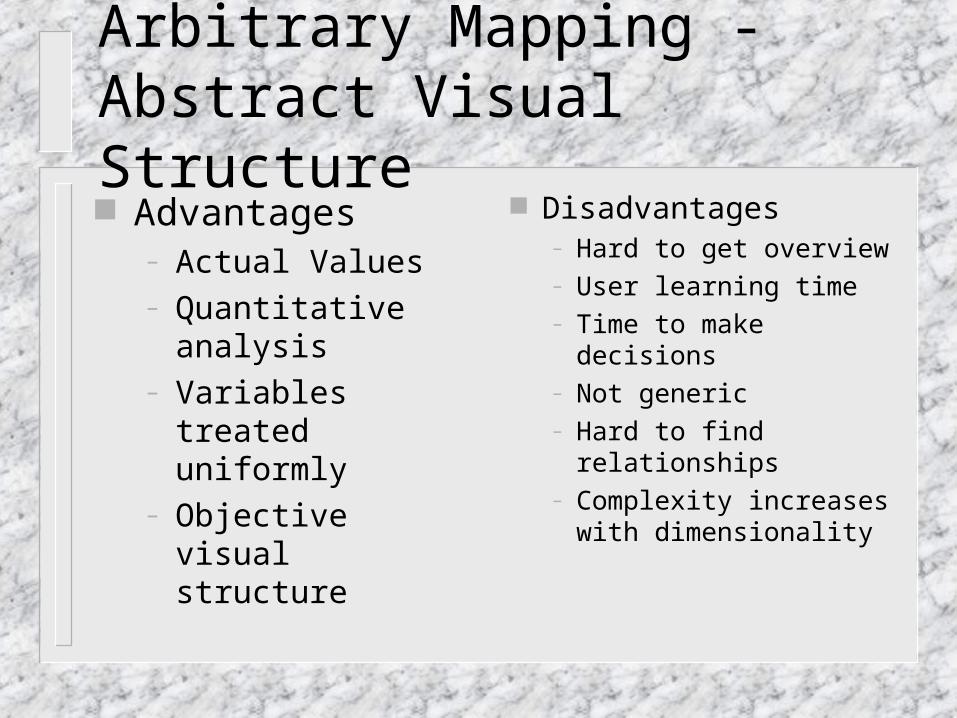
Arbitrary Mapping - Abstract Visual Structure Advantages
– Actual Values– Quantitative analysis– Variables treated
uniformly– Objective visual
structure
Disadvantages– Hard to get overview– User learning time– Time to make
decisions– Not generic– Hard to find
relationships– Complexity increases
with dimensionality
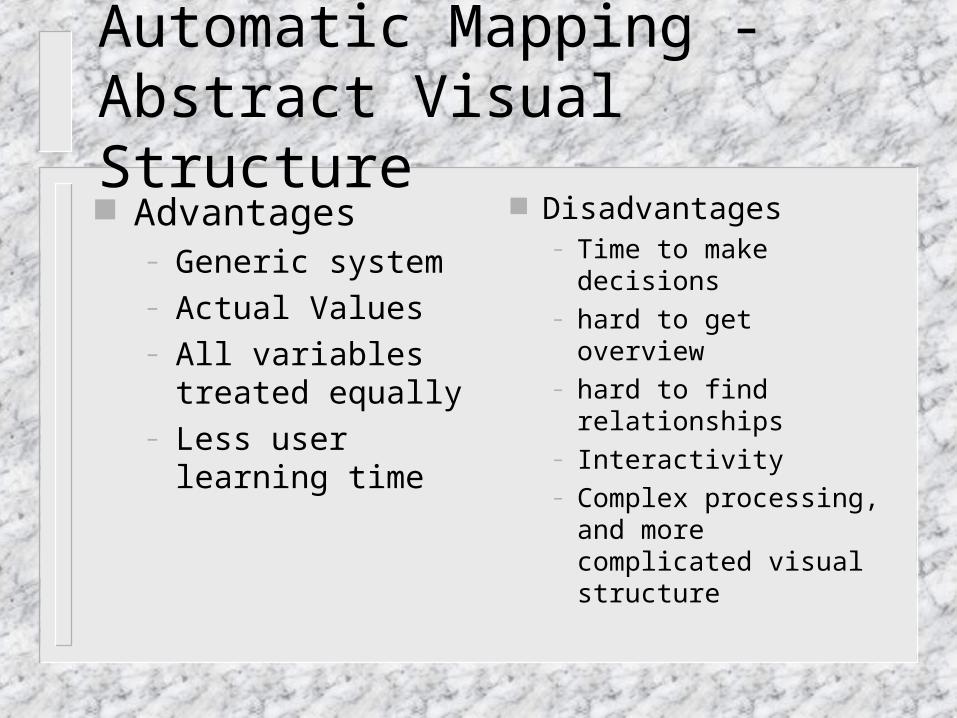
Automatic Mapping - Abstract Visual Structure Advantages
– Generic system– Actual Values– All variables treated
equally– Less user learning time
Disadvantages – Time to make
decisions– hard to get overview– hard to find
relationships– Interactivity– Complex processing,
and more complicated visual structure
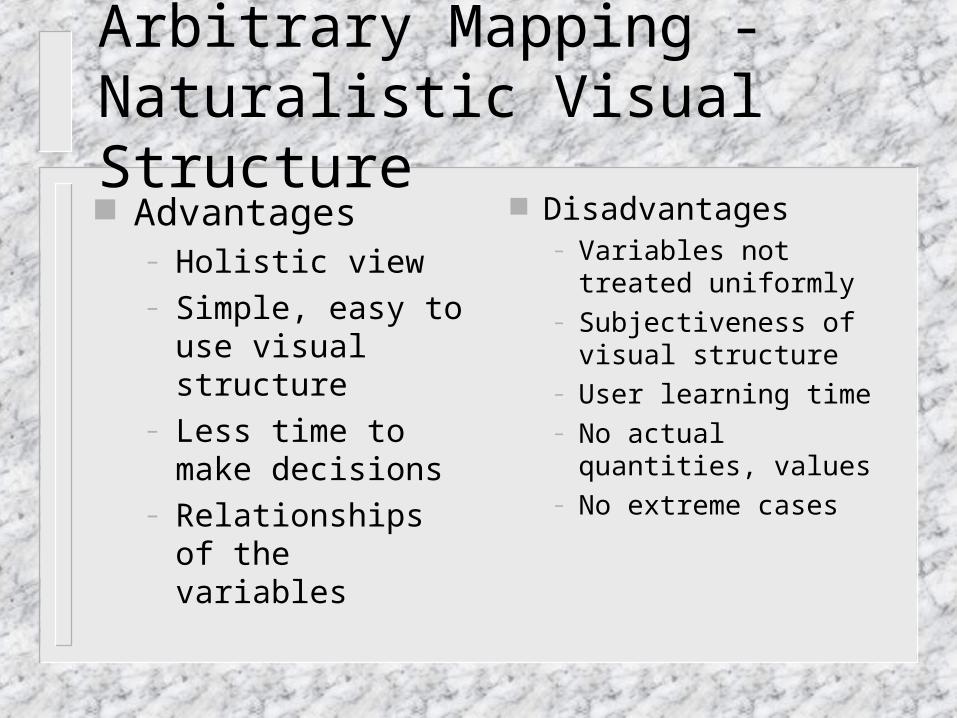
Arbitrary Mapping - Naturalistic Visual Structure Advantages
– Holistic view– Simple, easy to use
visual structure– Less time to make
decisions– Relationships of the
variables
Disadvantages– Variables not treated
uniformly– Subjectiveness of
visual structure– User learning time– No actual quantities,
values– No extreme cases
Automatic Mapping - Naturalistic Visual Structure: EVA interrelationships of data variables,
encapsulated in one visual structure Gross information about the data (overall
view) Simple, easy to understand visual structure Learning time minimised Background of users irrelevant May enable decisions on the fly
...
Generic system Complexity of visual structure doesn’t
increase with dimensionality
From Data to Naturalistic Visual Structure an Automatic Mapping
Fundamentals of method
n*k data matrix X (row individual, k observations)
Objective:– salient features– overall view– Naturalistic, Automatic
“Value System” Goal of method: Visual Homomorphism
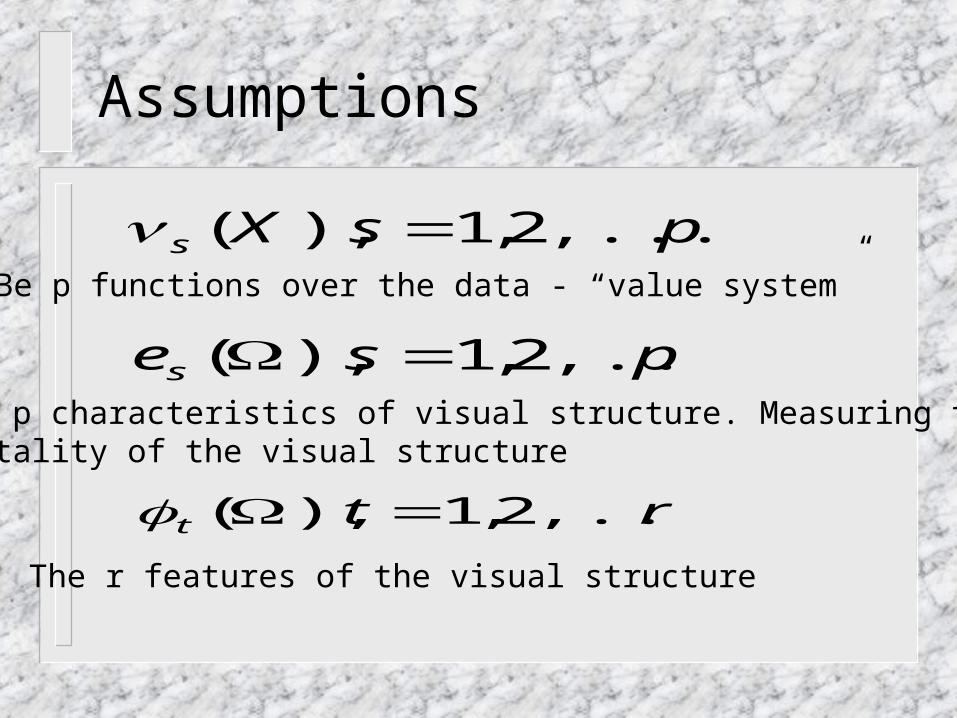
Assumptions
psXs ,...,2,1),( Be p functions over the data - “value system”
pses ,...2,1),( Be p characteristics of visual structure. Measuring the totality of the visual structure
rtt ,...,2,1),( The r features of the visual structure
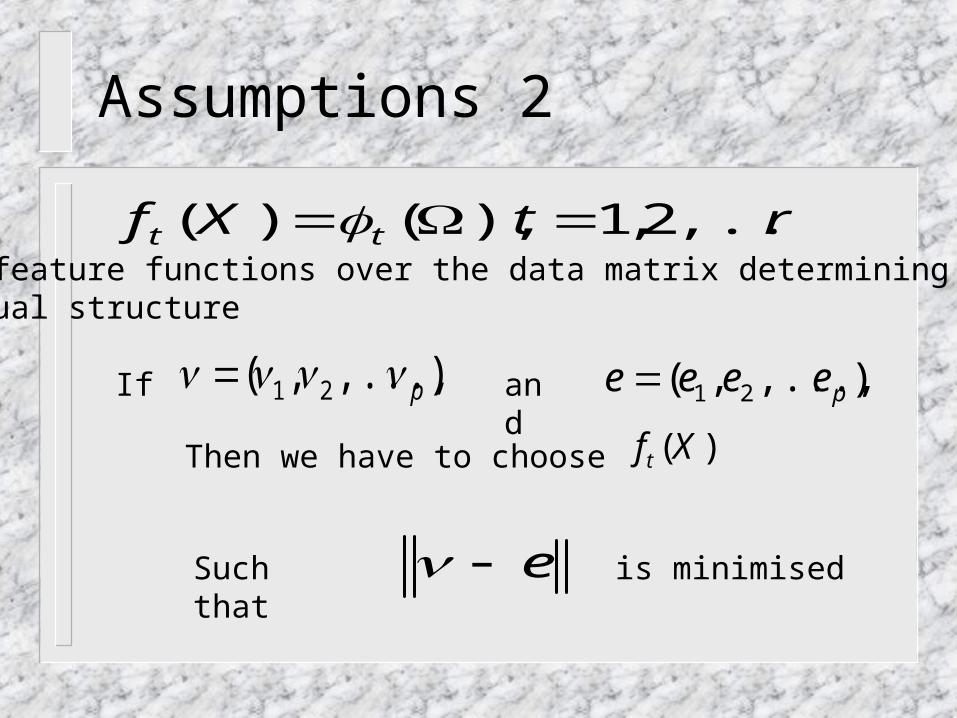
Assumptions 2
rtXf tt ,...,2,1),()( Be feature functions over the data matrix determining the visual structure
If ),...,,( 21 p and ),...,,( 21 peeee
Then we have to choose )(Xft
Such that e is minimised
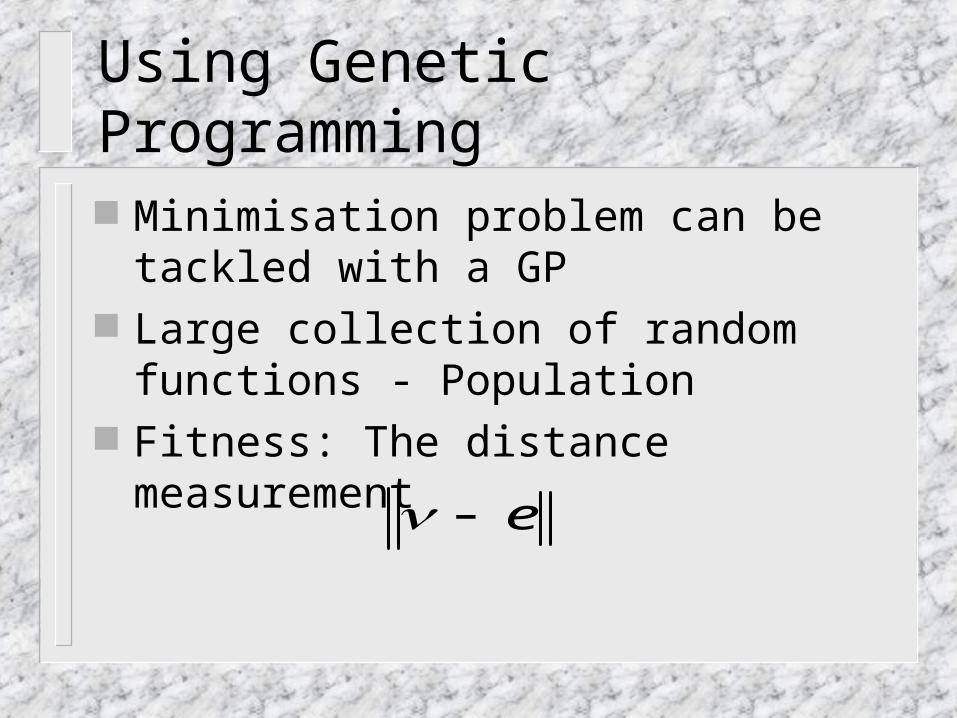
Using Genetic Programming
Minimisation problem can be tackled with a GP
Large collection of random functions - Population
Fitness: The distance measurement
e

Summary
User identifies the “value system” System decides on the visual structure and
its features System identifies the characteristics of the
visual structure Fitness function is defined GP parameters, and run
Achievements so far
Literature survey on Information Visualisation
GP survey System implemented Successfully tested using circles
– users needed no learning time – users made decisions immediately– users noticed small changes
Conclusions
Can subjects extract information from the visual representation of the data set? Yes
Can this visualisation method act as an aid to the decision making process? Yes
Under process
Experiment using faces Face: the epitome of a naturalistic visual
structure At final stage
Future Work
For current experiment, test method for:– generalisability– convergence (experimentally)
Final experiment (also using faces)– different application (data set)– divide users to experts/non_experts– test it with different number of characteristics– Measure time to make decisions– Test ‘readability’ of visual structure

Time Plan
Finish the first test by end of January Finish the main, final experiment by
beginning of July Write up
Recommended