1
Title: Transcriptional dynamics of bread wheat in response to 1 nitrate and phosphate supply reveal functional divergence of 2 genetic factors involved in nitrate and phosphate signaling 3
Running title: Wheat transcriptional responses to nitrate and 4 phosphate 5 6 7 Authors: Indeewari Dissanayake1, Joel Rodriguez-Medina2, Siobhan M. Brady2, Miloš 8 Tanurdžić1* 9 10 11 Affiliations: 12 1School of Biological Sciences, The University of Queensland, QLD 4072, Australia 13 14 2 Department of Plant Biology and Genome Center, University of California Davis, 15 CA95616, USA 16 17 *Corresponding author 18 19 Contact information: 20 Email of corresponding author [email protected] 21 22 23 24 25 26 27 28 29 30 31 32 33 34 35 36 37 38 39 40 41
author/funder. All rights reserved. No reuse allowed without permission. The copyright holder for this preprint (which was not peer-reviewed) is the. https://doi.org/10.1101/551069doi: bioRxiv preprint

2
Abstract 42
43
Nitrate (N) and phosphate (P) levels are sensed by plant cells and signaled via local and 44
systemic signaling pathways to modulate plant growth and development. Understanding the 45
genetic basis of these signaling mechanisms is key to future improvement of nutrient use 46
efficiency. While major progress has been made in understanding N and P signaling 47
pathways and their interaction in the model plant Arabidopsis, understanding of 48
transcriptional responses to N and P in a major monocot crop wheat is lacking. Therefore, 49
we investigated gene expression dynamics of wheat roots in response to N and/or P provision 50
using RNA-Seq. We found that nitrate presence is the major trigger for most of the 51
transcriptional response to occur within 24 h, however, we also identified a large array of 52
synergistic transcriptional responses to concomitant supply of N and P. Through gene co-53
expression analysis, we identified gene co-expression modules prominent in nitrate signaling 54
and metabolism in wheat. Importantly, we identified likely instances of functional 55
divergence in major N-responsive transcription factors families HRS1/HHO and TGA of 56
wheat from their rice/Arabidopsis homologues. Our work broadens the understanding of 57
wheat N and P transcriptional responses and aids in prioritizing gene candidates for 58
production of wheat varieties that are efficient in nitrogen usage. 59
60
61
Key words: Nitrate, phosphate, wheat, transcriptomics, gene co-expression networks, 62
HRS1/HHO, TGA 63
64
65
66
67
68
69
70
71
author/funder. All rights reserved. No reuse allowed without permission. The copyright holder for this preprint (which was not peer-reviewed) is the. https://doi.org/10.1101/551069doi: bioRxiv preprint

3
Introduction 72
73
Plant development is a highly plastic process, necessitated by the plants’ need to cope with 74
changes in the environment. Availability of nutrients in the soil, for example, modulates 75
plant form and function by changing the root system architecture or shifting the plant’s 76
metabolism. Nitrogen and phosphorus are plant macronutrients absorbed in the form of 77
nitrates (Crawford and Glass 1998) and orthophosphates (Pi) (Schachtman et al. 1998; 78
Marschner 2011) respectively. Many soil types lack in both available nitrate (Schlesinger, 79
1994; Vance 2001) and phosphate (Beadle 1953; Bieleski 1973). Therefore, nitrogen and 80
phosphorus fertilizers are applied to arable lands in large amounts globally where the excess 81
fertilizer usage contributes to environmental pollution (X. Zhang et al. 2015; Tilman et al. 82
2002). Hence, understanding the mechanisms mediating plant responses to nutrient supply 83
as well as to nutrient deficiency is critical for the production of new resilient and productive 84
crops that are efficient in nitrogen and phosphorus usage. 85
86
Studies on the dicotyledonous model plant Arabidopsis thaliana have been key to unraveling 87
the effects of nitrate and phosphate supply/starvation on plant biology and showed that 88
changes in levels of available nitrate and phosphate trigger signaling pathways that modulate 89
root development (Forde 2014; Chiou and Lin 2011). Transcription factors such as NLP7 90
(Castaings et al. 2009; Marchive et al. 2013), PHR1 (Rubio et al. 2001, Nilsson et al. 2007) 91
and HRS1 (Medici et al. 2015) and their downstream targets play crucial roles in nitrate and 92
phosphate signaling. For example, NLP7 regulates genes involved in nitrate signaling and 93
nitrate assimilation upon nitrate resupply (Castaings et al. 2009; Marchive et al. 2013) while 94
PHR1 regulates phosphate starvation responses (Rubio et al. 2001, Nilsson et al. 2007). 95
Importantly, these studies have shown that nitrate and phosphate signaling are intricately 96
regulated at the transcriptional, post-transcriptional and post-translational levels (reviewed 97
in Krapp et al. 2014; Briat et al. 2015). Moreover, plant hormones such as auxin, cytokinin 98
and strigolactone are implicated in nitrate and phosphate signaling pathways (reviewed in 99
Krouk 2017; Kapulnik and Koltai 2016; Guan 2017). For example, auxin plays a major role 100
in the lateral root development in response to local nitrate availability through nitrate-101
mediated regulation of components in the auxin signaling pathway such as auxin receptor 102
AFB3 (Vidal et al. 2010) and auxin response factor ARF8 (Lavenus et al. 2013). 103
104
author/funder. All rights reserved. No reuse allowed without permission. The copyright holder for this preprint (which was not peer-reviewed) is the. https://doi.org/10.1101/551069doi: bioRxiv preprint

4
Several lines of evidence suggest nitrate and phosphate signaling pathways connect through 105
the ubiquitin E3 ligase NLA (NITRATE LIMITATION ADAPTATION) and GARP family 106
transcription factor HRS1 (HYPERSENSITIVE TO LOW PI-ELICITED PRIMARY ROOT 107
SHORTENING 1) (Kant et al. 2011; Medici et al. 2015). For example, Arabidopsis 108
HRS1/HHO gene family contains seven members and these genes are orthologous to rice 109
NIGT1 (Nitrate-Inducible, GARP-type Transcriptional Repressor 1) (Sawaki et al. 2013). 110
The Arabidopsis HRS1/HHO gene family and rice NIGT1 are MYB-related transcription 111
factors from the GOLDEN2-like subgroup of GARP family transcription factors (H. Liu et 112
al. 2009; Sawaki et al. 2013). Arabidopsis, HRS1 and HHO1 are up-regulated in response to 113
nitrate supply within 6 minutes (Krouk et al. 2010), while in rice NIGT1 is induced within 1 114
h (Sawaki et al. 2013). HRS1/HHO gene family members have been identified as 115
transcriptional repressors regulating nitrate starvation responses (Maeda et al. 2018; Kiba, 116
et al, 2018). AtHHO2 and AtHHO3 are transcriptionally induced by nitrate albeit to a lesser 117
extent than AtHRS1/HHO1 (Maeda et al. 2018) while AtHHO5 and AtHHO6 were validated 118
as nitrate responsive transcription factors (Varala et al. 2018). 119
120
While Arabidopsis HRS1 was first characterized by its mutant root phenotype in response to 121
phosphate starvation (H. Liu et al. 2009), later studies reported Arabidopsis HRS1 and its 122
close paralogue HHO1 (Krouk et al. 2010) as well as rice NIGT1 (Sawaki et al. 2013) as 123
being rapidly and specifically transcriptionally induced by nitrate. This was the first 124
evidence that N and P signaling pathways may, in effect, crosstalk, and recently AtHRS1 125
was, indeed, shown to be at the nexus of nitrate and phosphate signaling (Medici et al. 2015; 126
Maeda et al. 2018; Kiba et al., 2018) whereby HRS1 is regulated transcriptionally by nitrate 127
and post-transcriptionally by phosphate. Therefore, delineating exclusive responses to 128
nitrate or phosphate from the responses to the concomitant supply of nitrate and phosphate 129
will facilitate better understanding on the coordination of plant nitrate and phosphate 130
signaling and homeostasis. 131
132
Interestingly, it has been reported that the phenotypic changes in root system architecture in 133
response to nitrate and phosphate are different in Arabidopsis relative to monocot species 134
such as rice and maize (Smith and I. De Smet 2012; Niu et al. 2013; Shahzad and Amtmann 135
2017). These phenotypically different responses could be due to underlying gene regulatory 136
mechanisms. Indeed, compelling evidence shows orthologues of a gene performing opposite 137
functions in Arabidopsis and rice. For example, SPX-Major Facility Superfamily3 proteins 138
author/funder. All rights reserved. No reuse allowed without permission. The copyright holder for this preprint (which was not peer-reviewed) is the. https://doi.org/10.1101/551069doi: bioRxiv preprint
5
are implicated in vacuolar transport of phosphate and behave as phosphate influx 139
transporters in Arabidopsis (J. Liu et al. 2015) while they are phosphate efflux transporters 140
in rice (C. Wang et al. 2015). 141
142
Wheat is a major cereal crop accounting for an annual production of 749 million metric tons 143
in 2016 (Food and Agriculture Organization statistics), being second in production to maize 144
(1 billion metric tons in 2016). The hexaploid genetic structure of bread wheat renders it an 145
interesting, yet complex genetic system to study due to its two recent duplication events 146
(Marcussen et al. 2014). Evidence for independent regulation of three subgenomes in 147
hexaploid wheat (Pfeifer et al. 2014; Powell et al. 2017) have been reported. Here, we aim 148
to determine the effects of nitrate and/or phosphate supply on transcriptional dynamics in 149
wheat. Our results show transcriptional reprogramming by nitrate and phosphate provision 150
and delineate the transcriptional responses to nitrate provision that are dependent or 151
independent of phosphate. Moreover, we could also identify instances where wheat gene 152
families of transcription factors involved in nitrate and phosphate signaling such as TGA 153
(TGACG SEQUENCE-SPECIFIC BINDING PROTEIN) and HRS1/HHO 154
(HYPERSENSITIVE TO LOW PI-ELICITED PRIMARY ROOT SHORTENING 1/HRS1-155
HOMOLOG) have functionally diverged from their rice or Arabidopsis homologues. 156
Altogether, our results may contribute to prioritizing gene candidates for future wheat 157
nutrient use efficiency breeding efforts. 158
159
Results and discussion 160
Nitrate and/or phosphate provision affects wheat root system 161
architecture 162
163
To investigate transcriptome dynamics in response to N and P supply, we first determined if 164
growth under N and/or P deplete or replete conditions had any effect on wheat root system 165
architecture. To this end, we measured root system parameters and in planta N and P content. 166
To maximize root responses to N and/or P supply, we grew Triticum aestivum (cultivar 167
Chinese spring) plants in water for 11 days. This led to a two-fold and four-fold decrease in 168
nitrogen and phosphorus content in the roots, respectively, relative to plants grown in full 169
strength nutrient solution (see materials and methods) (Figure S1). We then supplied the 170
author/funder. All rights reserved. No reuse allowed without permission. The copyright holder for this preprint (which was not peer-reviewed) is the. https://doi.org/10.1101/551069doi: bioRxiv preprint

6
plants with nutrient solutions which differed in nitrate and phosphate concentrations (0.5 171
mM or 0 mM phosphate, and/or 2 mM or 0 mM nitrate). We therefore used four treatment 172
combinations (-P-N, -P+N, +P-N and +P+N), here denoted as pn, pN, Pn and PN, 173
respectively. After further growing the plants under these four conditions for seven days we 174
were able to detect changes in root system architecture (Figure 1A). 175
176
Following N and/or P supply for 7 days, we measured N and P content in roots and shoots 177
of 18 days old plants (Figure 1E-F). As expected, N content was significantly higher in roots 178
and shoots of plants grown in pN and PN conditions than in Pn and pn (Figure 1E). 179
Phosphorus content was significantly higher in roots and shoots of plants grown in Pn and 180
PN conditions, than in the plants grown in pN and pn conditions. Interestingly, the 181
phosphorus content was also significantly lower in Pn treated plants than in PN treated plants 182
(Figure 1F). This result first suggested that presence of nitrogen may facilitate phosphorus 183
uptake/redistribution because an equal amount of phosphate was supplied in Pn and PN 184
treatments. 185
186
Plant root system architecture is modulated by nutrient resources available through nutrient 187
sensing and signaling (Kellermeier et al. 2014; Shahzad and Amtmann 2017). We measured 188
three root system parameters (primary root length, the number of lateral roots and lateral 189
root density on the primary root) of 18 day old plants, as described above. The three root 190
system parameters were significantly different among treatments (Figure 1A-D): single (pN, 191
Pn) or combined (pn) nutrient deficiency led to increased primary root length (Figure 1B) 192
and increased number of lateral roots on the primary root (Figure 1C), relative to the nutrient 193
replete (PN) condition. Single nutrient deficiency also led to increased lateral root density, 194
suggestive of root foraging for nitrate and phosphate. However, both PN and pn treatments 195
resulted in similar lateral root densities (Figure 1D). These results showed that wheat roots 196
under single P/N deficient conditions employ strategies for increasing root mass by both 197
increasing main root length and the number of lateral roots. They also suggest that N 198
availability supersedes the effect of P availability. 199
200
Previous studies of Arabidopsis root responses to phosphate deficiency reported shorter 201
primary roots and increased lateral root density. This is thought to be a mechanism for 202
efficient top-soil foraging (Péret et al. 2014), although the responses may vary depending on 203
the severity and the exposure time to the phosphate deficiency (Niu et al. 2013; Tian et al. 204
author/funder. All rights reserved. No reuse allowed without permission. The copyright holder for this preprint (which was not peer-reviewed) is the. https://doi.org/10.1101/551069doi: bioRxiv preprint

7
2014) and the genetic background since some natural accessions of Arabidopsis thaliana 205
show difference in P response (Chevalier et al. 2003; Shahzad et al. 2018). Similarly, root 206
responses to nitrate deficiency vary depending on the severity of deficiency as well as the 207
distribution of nitrate (homogeneous vs local distribution in soil) (Gruber et al. 2013, 208
reviewed in Giehl et al. 2013). Under severe nitrate deficiency conditions, both primary and 209
lateral root growth were retarded in Arabidopsis (Giehl et al. 2013; Gruber et al. 2013; Giehl 210
and Wirén 2014). Studies on rice reported increased seminal root length and decreased 211
lateral root density (Sun et al. 2014) due to nitrate or phosphate deficiency. Our results on 212
wheat primary root length under single nutrient deficiency are in agreement with those 213
reported in the study on rice (Sun et al. 2014; Yu et al. 2016), however they differ in lateral 214
root density where nitrate or phosphate deficiency caused increased lateral root density in 215
wheat. This could be due to the differences in the nitrogen and phosphorus concentrations 216
used in our experiment and the study by Sun et al. 2014. 217
218 219
author/funder. All rights reserved. No reuse allowed without permission. The copyright holder for this preprint (which was not peer-reviewed) is the. https://doi.org/10.1101/551069doi: bioRxiv preprint

8
220
221
Analysis of differential gene expression reveals major combinatorial 222
effects of nitrate and phosphate provision on transcriptional dynamics 223
224 Since rapid transcriptomic changes have been observed in response to nitrate (Krouk et al. 225
2010; K.-H. Liu et al. 2017), and phosphate supply (Gutiérrez-Alanís et al. 2017; Secco et 226
al. 2013), we focused on exploring the dynamics of wheat root transcriptional responses 227
within the first 24 h of nitrate and/or phosphate supply. Moreover, considering the emerging 228
evidence of a connection between nitrate and phosphate signaling pathways (Maeda et al. 229
2018; Kiba et al., 2018) as well as our results on root system architecture changes in wheat 230
2 cm
PN pN pnPn
PN pN Pn pn0
20
40
60
Treatments
Prim
ary
root
leng
th [c
m]
cb
aa
PN pN Pn pn0
20
40
60
80
Treatments
No.
LR
on
prim
ary
root
b
a aa
PN pN Pn pn0.0
0.5
1.0
1.5
2.0
Treatments
LR d
ensi
ty [L
R/c
m]
b
aa
b
PN pN Pn pn PN pN Pn pn0.0
0.5
1.0
1.5
SamplesP
hosp
horu
s [%
dry
wei
ght]
a
cb
c
a
c
b
c
Root Shoot
PN pN Pn pn PN pN Pn pn0
2
4
6
Samples
Nitr
ogen
[% d
ry w
eigh
t]
a ab b
a a
b b
Root Shoot
A B
C
D
E
F
Figure 1. The wheat root responses to nitrate and/or phosphate supply. (A) Root system architecture of wheat plants treated with nitrate and/or phosphate. Comparison of wheat root system parameters (B) primary root length, (C) number of lateral roots (LR) on the primary root, (D) lateral root (LR) density on the primary root (n=15, error bars indicate standard error of mean). Comparison of (E) Nitrogen content, (F) Phosphorus content of total root and total shoot tissue (n=3, error bars indicate standard error of mean). Figures 1A-F are results from 18-day old wheat plants that were grown in indicated nutrient regimes for seven days, letters denote significance based on two-way ANOVA followed by Tukey HSD (P<0.05) in Figures 1B-F.
author/funder. All rights reserved. No reuse allowed without permission. The copyright holder for this preprint (which was not peer-reviewed) is the. https://doi.org/10.1101/551069doi: bioRxiv preprint

9
roots in response to combinatorial nitrate and phosphate treatment, we used an experimental 231
setup that enabled delineating combinatorial effects of nitrate and phosphate on the root 232
transcriptome from the effects due to nitrate- or phosphate-only. 233
234 To characterize transcriptomic responses to P and N provision, we collected root samples at 235
1 h, 2 h, 4 h and 24 h following nutrient supply and quantified gene expression using RNA-236
Seq. Out of 110790 wheat high confidence genes in IWGSC RefSeq version 1.0 annotation, 237
94253 (85.03%) had non-zero total read count across samples. We herein denote these 94253 238
genes as “expressed” under at least one of the conditions. 239
240
We considered the numbers of differentially expressed genes (FDR < 0.05) between a 241
treatment (PN or Pn or pN) and reference (pn) at four time points (Figure 2A). Only 25 genes 242
(0.02% of expressed genes) responded to phosphate supply in the absence of nitrate (Pn) 243
within the first 24 h (Table S8). These 25 genes included the SPX domain containing gene 244
most similar to SPX DOMAIN GENE 3 in Arabidopsis (TraesCS2D01G177100, orthologous 245
to ATSPX3 (AT2G45130)) down-regulated at 1 h; three phosphate transporter genes 246
(TraesCS4B01G317200, TraesCS4A01G416500 and TraesCSU01G070800 (orthologous to 247
ATPT1 (PHOSPHATE TRANSPORTER 1, AT5G43350)) down-regulated at 2 h, and CLE 248
gene family members (TraesCS1D01G401200 and TraesCS1B01G421600, up-regulated at 249
24 h). Transcriptional repression of both ATSPX3 (Duan et al. 2008) and ATPT1 (Puga et al. 250
2014) by PHR1 under P sufficient conditions has been reported in Arabidopsis (reviewed in 251
Gu et al. 2016). This result suggests that despite few wheat genes are regulated by phosphate 252
in the absence of nitrate, at least some components of the PHR1 signaling module are 253
conserved in function between wheat and Arabidopsis and respond rapidly to phosphate 254
supply independent of nitrate. Even though IPS1 and miR399 are also well known targets of 255
PHR1, these genes could not be assessed using RNA-Seq since these ncRNA loci are not 256
present in the current wheat high confidence gene annotation. 257
258
Following N supply in the absence of P (pN treatment) for 1 h, 16 genes (0.01% of expressed 259
genes) were differentially expressed (Figure 2A, Table S8), only two of which were up-260
regulated (Table S2). This changed dramatically at later time points with thousands of genes 261
being differentially expressed under pN treatment (Figure 2A, Table S2), starting with the 262
the 2 h time point. These results show the progression of a transcriptional cascade related to 263
nitrate signaling and metabolism (further discussed below). 264
author/funder. All rights reserved. No reuse allowed without permission. The copyright holder for this preprint (which was not peer-reviewed) is the. https://doi.org/10.1101/551069doi: bioRxiv preprint

10
265
Strikingly, when nitrate and phosphate were supplied concomitantly (PN), massive 266
transcriptome changes occur as early as 1 h, with 3372 genes (3.5% of expressed genes) 267
differentially expressed (1514 up-regulated, 1858 down-regulated) (Figure 2A, Table S2). 268
This transcriptional response subsides at 2 h and 4 h with 1350 (1.4% of expressed genes) 269
and 1581 (1.6% of expressed genes) genes differentially expressed, respectively. Another 270
wave of transcriptional response could then be detected at 24 h, with 4618 genes (4.8% of 271
expressed genes) differentially expressed (2080 up-regulated and 2538 down-regulated) in 272
response to PN treatment (Figure 2A, Table S2, Table S8). Altogether, by considering gene 273
expression across the three treatments (pN, Pn and PN relative to pn) and the four time 274
points, 10229 genes (10.8% of expressed genes) (Table S8) were identified as differentially 275
expressed at least in one treatment-time point combination. 276
277
To identify sub-groups within 10229 differentially expressed genes based on the similarity 278
in expression profiles in an unsupervised manner, we carried out a hierarchical clustering 279
analysis (Figure 2B). Intriguingly, Pearson correlation-based clustering of variance-280
stabilized read counts showed that treatments at 1 h induce gene expression changes forming 281
a separate cluster from rest of the treatment-time combinations. This observation implies 282
that early responses to P and N are distinct from the transcriptomic responses at later time 283
points. Furthermore, if P and N signaling pathways were mutually independent, we would 284
expect to see the clustering based on treatment, regardless of the time points. However, the 285
clustering pattern suggests that wheat root responses to P supply are dependent on the supply 286
of N. Our results indicate the combinatorial effects of nitrate and phosphate provision in 287
modulating gene expression and validate our approach that took into account the interaction 288
effects in response to P and N supply. 289
290
To identify the contribution from time factor and treatment to the variation in expression 291
profiles we analyzed multi-dimensional scaling (MDS) plots (Figure 2C, 2D, Figure S2A). 292
The first four dimensions explain 85.7% of the variance (Figure S2A) where first two 293
dimensions essentially recapitulate the patterns observed with hierarchical clustering (Figure 294
2C). While dimension 3 accounts for variance due to time factor, dimension 4 explains 295
variance due to presence or absence of nitrate (Figure 2D). Considering both the overlap of 296
differentially expressed genes (Figure 2A) and the clustering pattern of the treatment 297
comparisons (Figure 2B-2D) we conclude that while concomitant supply of nitrate and 298
author/funder. All rights reserved. No reuse allowed without permission. The copyright holder for this preprint (which was not peer-reviewed) is the. https://doi.org/10.1101/551069doi: bioRxiv preprint

11
phosphate have a synergistic effect on the transcriptomic dynamics occurring at 1 h, at later 299
time points, the presence of nitrate is required for most of the transcriptional response to 300
occur. 301
302
While the bulk of gene expression changes that require supply of both P and N (PN 303
treatment) happen by 1 h (Figure 2A), the number of genes that respond to N supply 304
regardless of P status (the overlap between pN and PN treatments) gradually increases over 305
time from 9 to 3069 genes (Figure 2A). If a gene is differentially expressed in more than one 306
treatment, directionality of fold change (up- or down-regulation) could indicate whether the 307
gene is transcriptionally regulated the same way by the different treatments. To this end, 308
directionality of fold change (up/down regulation with respect to pn condition) remained the 309
same in all the genes that were differentially expressed in both pN and PN conditions at a 310
given time point (the overlap between pN and PN treatments), except for 311
TraesCS6A01G165100, which was transcriptionally upregulated by N (PN and pN), 312
however the supply of P in the absence of N (Pn) led to its down-regulation at 4 h after 313
treatment (Table S8). This gene is annotated as a nicotianamine synthase in wheat. 314
Congruent with our observations, previous studies have reported up-regulation of 315
nicotianamine synthase genes in response to nitrate supply in Arabidopsis (R. Wang et al. 316
2000; R. Wang et al. 2003). However, in the study by (Shukla et al. 2017), they reported up-317
regulation of NICOTIANAMINE SYNTHASE 2 in response to excess phosphate levels (20 318
mM phosphate and 3.9 mM nitrate) in Arabidopsis. Our results show that wheat 319
nicotianamine synthase TraesCS6A01G165100 is regulated similarly only in the presence 320
of N. This suggests that TraesCS6A01G165100 is regulated by phosphate in a nitrate 321
dependent manner. Since nicotianamine synthase is involved in iron transport (Schuler et al. 322
2012), our results suggest nitrate and phosphate-dependent effects on iron distribution 323
through nicotianamine synthase. 324
author/funder. All rights reserved. No reuse allowed without permission. The copyright holder for this preprint (which was not peer-reviewed) is the. https://doi.org/10.1101/551069doi: bioRxiv preprint

12
325 326
327
The majority of the studies characterizing nitrate-induced transcriptional responses in 328
Arabidopsis have been carried out in the presence of sufficient phosphate. Considering the 329
emerging evidence of crosstalk between nitrate and phosphate signaling (Kant et al. 2011; 330
Medici et al. 2015, Maeda et al. 2018), our approach enables delineation of the responses to 331
nitrate that are dependent or independent of presence of phosphate. To that end, we 332
performed GO term enrichment analysis using genes that were differentially expressed 333
exclusively in pN vs pn or in PN vs pn treatments at each of the four time points (Table 1, 334
Table S3). 335
336
Z-score normalized expression
PN
pN
3357
7
9 6
Pn4
1 h
PN
pN
322
874
1024 4
Pn2
2 h
PN
pN
553
582
10271
Pn2
4 h
PN
pN
1549
1867
30654
Pn5
24 h
1
A
B C
D
pn_1hpN_1hPn_1h
PN_1h
pn_24h
pN_24h
Pn_24h
PN_24h
pn_2h
pN_2h
Pn_2h
PN_2h
pn_4h
pN_4h
Pn_4h
PN_4h
Dimension_1
Dim
ensi
on_2
time
aaaa
1h
2h
4h
24h
Dimensions 1 and 2
pn_1h
pN_1hPn_1h
PN_1h
pn_24h
pN_24h
Pn_24hPN_24h
pn_2h
pN_2h
Pn_2hPN_2hpn_4h
pN_4h
Pn_4h
PN_4h
Dimension_5
Dim
ensi
on_6
time
aaaa
1h
2h
4h
24h
Dimensions 5 and 6
pn_1h
pN_1h
Pn_1h
PN_1h
pn_24h
pN_24h
Pn_24h
PN_24h
pn_2h
pN_2h
Pn_2h
PN_2h
pn_4h
pN_4h
Pn_4h
PN_4h
Dimension_3
Dim
ensi
on_4
time
aaaa
1h
2h
4h
24h
Dimensions 3 and 4
pn_1h
pN_1h
Pn_1h
PN_1hpn_24hpN_24h
Pn_24h
PN_24hpn_2h
pN_2h
Pn_2h
PN_2h
pn_4h pN_4h
Pn_4hPN_4h
Dimension_7
Dim
ensi
on_8
time
aaaa
1h
2h
4h
24h
Dimensions 7 and 8
Dim
ensi
on 2
Dimension 1
N-absent
N-present
pn_1hpN_1hPn_1h
PN_1h
pn_24h
pN_24h
Pn_24h
PN_24h
pn_2h
pN_2h
Pn_2h
PN_2h
pn_4h
pN_4h
Pn_4h
PN_4h
Dimension_1
Dim
ensi
on_2
time
aaaa
1h
2h
4h
24h
Dimensions 1 and 2
pn_1h
pN_1hPn_1h
PN_1h
pn_24h
pN_24h
Pn_24hPN_24h
pn_2h
pN_2h
Pn_2hPN_2hpn_4h
pN_4h
Pn_4h
PN_4h
Dimension_5
Dim
ensi
on_6
time
aaaa
1h
2h
4h
24h
Dimensions 5 and 6
pn_1h
pN_1h
Pn_1h
PN_1h
pn_24h
pN_24h
Pn_24h
PN_24h
pn_2h
pN_2h
Pn_2h
PN_2h
pn_4h
pN_4h
Pn_4h
PN_4h
Dimension_3
Dim
ensi
on_4
time
aaaa
1h
2h
4h
24h
Dimensions 3 and 4
pn_1h
pN_1h
Pn_1h
PN_1hpn_24hpN_24h
Pn_24h
PN_24hpn_2h
pN_2h
Pn_2h
PN_2h
pn_4h pN_4h
Pn_4hPN_4h
Dimension_7
Dim
ensi
on_8
time
aaaa
1h
2h
4h
24h
Dimensions 7 and 8
Dim
ensi
on 4
Dimension 3
N- present
N-absent
Figure 2. Combinatorial effects of nitrate and phosphate provision in modulating gene expression. (A)Venn diagrams showing the overlap of differentially expressed (DE) genes among different treatment comparisons with respect to pn treatment within a time point. (B) Hierarchical clustering of the DE genes based on z-score normalized expression values. Multi-dimensional scaling plots representing variance as vectors in the first four dimensions (C) dimensions 1 and 2; (D) dimensions 3 and 4.
author/funder. All rights reserved. No reuse allowed without permission. The copyright holder for this preprint (which was not peer-reviewed) is the. https://doi.org/10.1101/551069doi: bioRxiv preprint

13
After 2 h of N supply in the absence of P (pN treatment at 2 h), the over-represented GO 337
terms in the differentially expressed gene set were related to hormonal regulation (“cytokinin 338
metabolism”, “response to auxin stimulus”) (Table 1, Table S3). Specifically, the genes that 339
were up-regulated and assigned to “cytokinin metabolism” GO category at 2 h in response 340
to pN treatment were identified as cytokinin oxidase in wheat (Table S3). This observation 341
is of interest, since cytokinin has been identified as a key hormone in systemic nitrate 342
signaling (Sakakibara et al. 2006) in Arabidopsis. Cytokinin is involved in lateral root 343
development in response to systemic nitrate status by acting as a reporter of nitrate demand 344
of the whole plant (Ruffel et al. 2011; Ruffel et al. 2016). Nitrate is capable of inducing 345
cytokinin oxidases (R. Wang et al. 2003; Scheible et al. 2004), which in turn regulates 346
cytokinin levels by negative feedback mechanisms (Kieber and Schaller 2018). A recent 347
study suggested a role for cytokinin oxidases in modulating shoot meristem growth triggered 348
by nitrate supply (Landrein et al. 2018). Therefore, up-regulation of cytokinin oxidases 349
indicates that by two hours after N supply (in the absence of phosphate) N signaling already 350
is likely to affect cytokinin levels in the roots and, consequently, cytokinin signals moving 351
to the shoot. The genes that were up-regulated in pN treatment and assigned “response to 352
auxin stimulus” GO term are homologous to SAUR-like auxin responsive family genes in 353
Arabidopsis (Table S3). Up-regulation of SAUR-like auxin responsive family members may 354
suggest that by two hours of nitrate supply, auxin levels are also changing in the roots as 355
SAUR gene family members are rapidly induced by auxin (McClure et al. 1989; Abel and 356
Theologis 1996). At 4 h, biological processes related to amino acid biosynthesis are enriched 357
in the pN up-regulated gene set (Table 1) and these results are in agreement with previous 358
reports on transcriptomic responses to nitrate in the presence of phosphate (R. Wang et al. 359
2003; Scheible et al. 2004). However, our results show that in wheat, these processes occur 360
independent of P status. 361
362
Interestingly, cell wall structure related processes such as “cellulose biosynthesis” and 363
“microfibril organization” were enriched in the down-regulated gene sets in response to pN, 364
specially at 24 h (Table1, Table S3). This may suggest that upon nitrate supply, cell division 365
and expansion which ensures longer roots in the search for nitrate is reduced. Five genes 366
(TraesCS5D01G401900, TraesCS5A01G095200, TraesCS5A01G392000, 367
TraesCS5B01G396900 and TraesCS5D01G107900) specifically down-regulated in 368
response to nitrate supply at 24 h were assigned GO terms of “cellulose microfibril 369
organization” and “cell growth” (Table S3) and have been annotated as COBRA-like 370
author/funder. All rights reserved. No reuse allowed without permission. The copyright holder for this preprint (which was not peer-reviewed) is the. https://doi.org/10.1101/551069doi: bioRxiv preprint

14
proteins in wheat. COBRA is a plant-specific glycosylphosphatidylinositol-anchored protein 371
and is upregulated in cells entering the zone of elongation (Roudier 2002) in Arabidopsis. 372
The involvement of COBRA gene family members in shaping up plant root system 373
architecture has been studied in Arabidopsis (Brady et al. 2006; Schindelman et al., 2001; 374
Benfey and Scheres 2000). The five COBRA-like wheat genes that are specifically down-375
regulated at 24 h of nitrate supply are orthologous to COBRA and COBRA-Like 4 in 376
Arabidopsis and BRITTLE STALK-2 (Bk2), BRITTLE STALK-LIKE-3 (Bk2L3) and 377
BRITTLE STALK-LIKE-4 (Bk2L4) in maize (Figure S2B). Bk2L4 is down-regulated within 378
2 h of nitrate starvation, while Bk2L3 remained unresponsive to nitrate starvation (Brady et 379
al. 2006). While both wheat and maize COBRA gene orthologues respond to nitrate (supply 380
or starvation), it is intriguing that the down-regulation of wheat Bk2L3/4 orthologues in 381
response to nitrate supply happens only in the absence of phosphate at 24 h. 382
383
The biological processes enriched in the up-regulated gene category at 1 h in response to PN 384
include carbon metabolism and transport of ions such as nitrate and calcium (Table 1, Table 385
S3). Some of the processes, such as “RNA processing” and “pentose phosphate shunt”, were 386
previously reported to be enriched among the genes up-regulated in response to nitrate 387
supply in the presence of phosphate (R. Wang et al. 2003; Scheible et al. 2004; Krouk et al. 388
2010). Interestingly all the genes that were assigned GO term “malate transport” were 389
annotated as aluminum activated malate transporter family members in wheat (Table S3). 390
Some of these genes (TraesCS7B01G127200, TraesCS7B01G116000, 391
TraesCS7A01G208700, TraesCS7D01G211100) were up-regulated while some 392
(TraesCS6B01G270300, TraesCS6D01G236500, TraesCS2D01G399700, 393
TraesCS2B01G420600) were down-regulated as early as 1 h (Table 1, Table S3). Later in 394
the time course, aluminum activated malate transporter genes were found up-regulated by 395
PN treatment at 2 h and 24 h. Interestingly, wheat aluminum activated malate transporters 396
have been found to be permeable not only to malate, but also to nitrate and chloride (Piñeros 397
et al. 2008; W.-H. Zhang et al. 2008). Moreover, AtALMT1 (ALUMINUM ACTIVATED 398
MALATE TRANSPORTER 1) is a key regulator in modulating root development under 399
phosphate deficiency (Mora-Macías et al. 2017; Balzergue et al. 2017). Therefore, our 400
results suggest involvement of aluminum activated malate transporters in response to nitrate 401
and phosphate, although their precise function (as nitrate transporter or functioning in P 402
starvation induced root development) remains unresolved. 403
404
author/funder. All rights reserved. No reuse allowed without permission. The copyright holder for this preprint (which was not peer-reviewed) is the. https://doi.org/10.1101/551069doi: bioRxiv preprint

15
Moreover, wheat genes annotated as ubiquitin carboxyl-terminal hydrolases were enriched 405
in GO term categories “ubiquitin dependent protein catabolic process” and “protein 406
deubiquitination” (Table 1, Table S3). The Arabidopsis homologues of these genes are 407
members of ubiquitin specific protease (UBP) family (Table S3). While UBP14 is involved 408
in the adaptation of root development to local phosphate availability (W.-F. Li et al. 2010), 409
none of the Arabidopsis homologs in these GO categories were UBP14 (Table S3). 410
Interestingly, nicotianamine synthase genes and Yellow Stripe like (YSL) genes were 411
present in the over-represented GO categories “nicotianamine biosynthetic process” and 412
“transmembrane transport”. Considering nicotianamine synthase (Koen et al. 2013) and 413
YSL genes (Waters et al. 2006; Kumar et al. 2017) are involved in plant iron homeostasis, 414
these results may suggest the changes in the iron homeostasis are affected by concomitant 415
supply of N and P. Moreover, wheat phosphate transporters which are homologous to AtPT1 416
and AtPT1;4 were down-regulated at 4 h, suggesting that plants experience phosphate 417
sufficient conditions by this time, thereby repressing the phosphate transporters. While four 418
cytokinin oxidase genes were present in the “cytokinin metabolic process” category for 419
genes up-regulated at 24 h (Table S3), these genes were not present in the cytokinin oxidase 420
gene set that were responding to pN, suggesting the activity of some wheat cytokinin 421
oxidases may depend on the presence of phosphate. 422
423
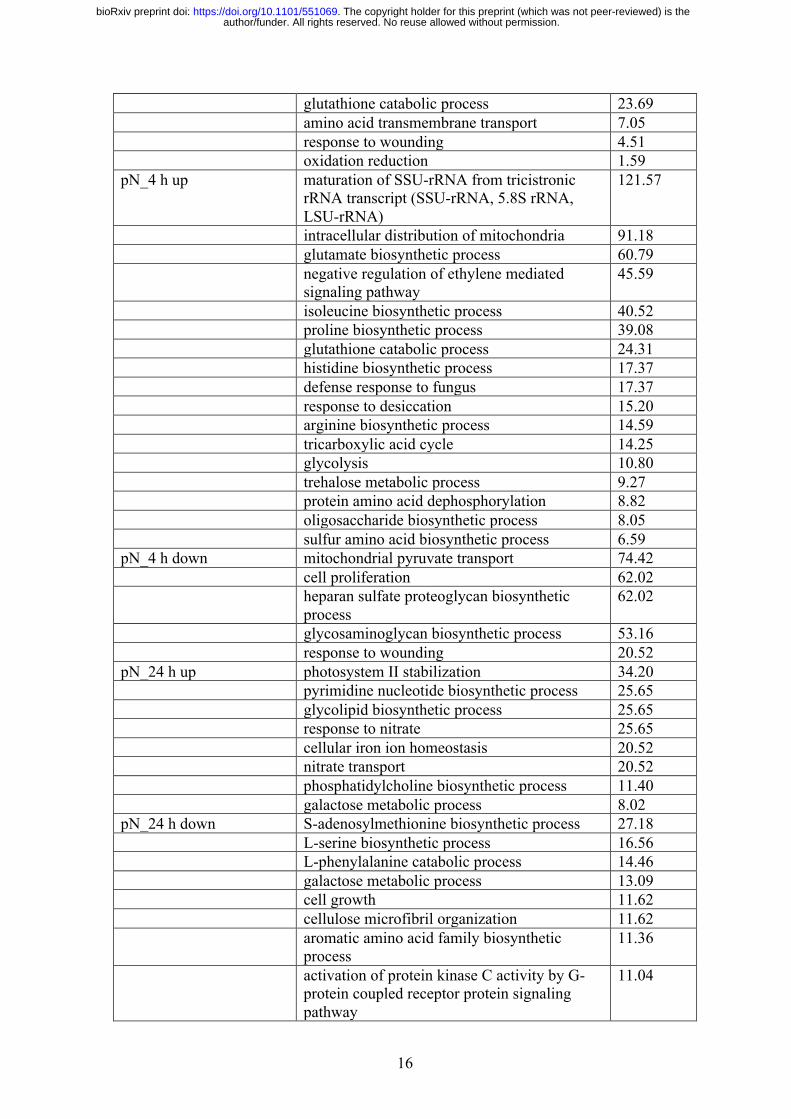
Table 1. Lowest level GO terms enriched in pN vs pn and PN vs pn treatment comparisons, 424
along with the fold enrichment (All GO terms shown were enriched with FDR P<0.05). 425
426
Treatment-time combination
GO category Fold enrichment
pN_1 h down phosphatidylcholine biosynthetic process
1151.16
pN_2 h up glutamate biosynthetic process 138.48 nitrate transport 69.24 histidine biosynthetic process 39.57 NAD biosynthetic process 27.70 chloride transport 24.44 cytokinin metabolic process 15.39 zinc ion transmembrane transport 14.58 regulation of cyclin-dependent protein kinase
activity 14.20
response to auxin stimulus 4.48 pN_2 h down L-phenylalanine catabolic process 30.15 fatty acid beta-oxidation 29.61
author/funder. All rights reserved. No reuse allowed without permission. The copyright holder for this preprint (which was not peer-reviewed) is the. https://doi.org/10.1101/551069doi: bioRxiv preprint
16
glutathione catabolic process 23.69 amino acid transmembrane transport 7.05 response to wounding 4.51 oxidation reduction 1.59 pN_4 h up maturation of SSU-rRNA from tricistronic
rRNA transcript (SSU-rRNA, 5.8S rRNA, LSU-rRNA)
121.57
intracellular distribution of mitochondria 91.18 glutamate biosynthetic process 60.79 negative regulation of ethylene mediated
signaling pathway 45.59
isoleucine biosynthetic process 40.52 proline biosynthetic process 39.08 glutathione catabolic process 24.31 histidine biosynthetic process 17.37 defense response to fungus 17.37 response to desiccation 15.20 arginine biosynthetic process 14.59 tricarboxylic acid cycle 14.25 glycolysis 10.80 trehalose metabolic process 9.27 protein amino acid dephosphorylation 8.82 oligosaccharide biosynthetic process 8.05 sulfur amino acid biosynthetic process 6.59 pN_4 h down mitochondrial pyruvate transport 74.42 cell proliferation 62.02 heparan sulfate proteoglycan biosynthetic
process 62.02
glycosaminoglycan biosynthetic process 53.16 response to wounding 20.52 pN_24 h up photosystem II stabilization 34.20 pyrimidine nucleotide biosynthetic process 25.65 glycolipid biosynthetic process 25.65 response to nitrate 25.65 cellular iron ion homeostasis 20.52 nitrate transport 20.52 phosphatidylcholine biosynthetic process 11.40 galactose metabolic process 8.02 pN_24 h down S-adenosylmethionine biosynthetic process 27.18 L-serine biosynthetic process 16.56 L-phenylalanine catabolic process 14.46 galactose metabolic process 13.09 cell growth 11.62 cellulose microfibril organization 11.62 aromatic amino acid family biosynthetic
process 11.36
activation of protein kinase C activity by G-protein coupled receptor protein signaling pathway
11.04
author/funder. All rights reserved. No reuse allowed without permission. The copyright holder for this preprint (which was not peer-reviewed) is the. https://doi.org/10.1101/551069doi: bioRxiv preprint

17
cellulose biosynthetic process 8.76 zinc ion transmembrane transport 6.97 chitin catabolic process 5.74 nicotinamide nucleotide metabolic process 5.27 hemicellulose metabolic process 3.51 cellular cell wall macromolecule metabolic
process 3.46
PN_1 h up protein sumoylation 55.90 glutamate biosynthetic process 55.90 intracellular distribution of mitochondria 55.90 ribosomal large subunit assembly 37.27 phosphatidylserine biosynthetic process 27.95 nitrate transport 20.96 glutamyl-tRNA aminoacylation 15.24 gluconeogenesis 13.97 threonyl-tRNA aminoacylation 12.42 pentose-phosphate shunt 9.58 malate transport 9.32 NAD biosynthetic process 8.38 chloride transport 8.22 histidine biosynthetic process 7.99 protein deubiquitination 6.82 fructose 6-phosphate metabolic process 6.78 glycolysis 6.25 calcium ion transmembrane transport 6.21 trehalose biosynthetic process 5.99 sodium ion transport 5.59 ubiquitin-dependent protein catabolic process 2.01 RNA processing 1.93 PN_1 h down L-serine biosynthetic process 8.77 glucosylceramide catabolic process 8.77 malate transport 7.79 regulation of cyclin-dependent protein kinase
activity 5.99 L-phenylalanine catabolic process 5.10 oligopeptide transport 4.73 xyloglucan metabolic process 4.11 plant-type cell wall organization 3.51 response to oxidative stress 3.36 PN_2 h up malate transport 47.96 zinc ion transmembrane transport 30.29 regulation of response to stimulus 25.03 plant-type cell wall organization 14.39 PN_2 h down transmembrane transport 3.07 PN_4 h up rRNA methylation 98.23 nitrogen compound transport 42.10 pseudouridine synthesis 12.63 metal ion transport 5.59 ammonium transport 28.07
author/funder. All rights reserved. No reuse allowed without permission. The copyright holder for this preprint (which was not peer-reviewed) is the. https://doi.org/10.1101/551069doi: bioRxiv preprint

18
PN_4 h down abscisic acid biosynthetic process 87.09 allantoin catabolic process 87.09 phosphate transport 38.42 valyl-tRNA aminoacylation 34.83 sulfate transport 15.83 L-phenylalanine catabolic process 14.25 respiratory electron transport chain 9.11 ATP synthesis coupled proton transport 7.46 recognition of pollen 3.61 PN_24 h up glutamate biosynthetic process 71.39 threonine biosynthetic process 42.83 acetyl-CoA biosynthetic process from
pyruvate 21.42 phosphatidylcholine biosynthetic process 21.42 isoleucine biosynthetic process 19.04 L-methionine salvage from
methylthioadenosine 17.13 trehalose biosynthetic process 13.77 nicotianamine biosynthetic process 12.24 malate transport 10.71 tricarboxylic acid cycle 10.71 cytokinin metabolic process 9.52 sulfate transport 7.79 glycolysis 7.33 nucleoside metabolic process 5.91 lipid transport 4.56 PN_24 h down cellular iron ion homeostasis 35.08 mitochondrial pyruvate transport 21.05 oligopeptide transport 7.10 amino acid transmembrane transport 6.26 drug transmembrane transport 3.76 lipid metabolic process 2.04 oxidation reduction 1.38
427
Gene co-expression network analysis reveals gene modules involved 428 in nitrate signaling in wheat 429 430
Correlation based methods using similarity of gene expression profiles to infer functions of 431
the genes through guilt-by-association principle have been widely employed in systems 432
biology research (Wolfe et al. 2005; Lee et al. 2010; Usadel et al. 2009; R. De Smet and 433
Marchal 2010; Banf and Rhee 2017). To perform gene co-expression analysis using 434
WGCNA (Langfelder and Horvath 2008), we selected 8300 genes with the highest variance 435
in gene expression across the entire dataset (top 10%). The gene co-expression module-436
author/funder. All rights reserved. No reuse allowed without permission. The copyright holder for this preprint (which was not peer-reviewed) is the. https://doi.org/10.1101/551069doi: bioRxiv preprint

19
treatment (“module-trait”) relationships that resulted from weighted gene co-expression 437
analysis are shown in Figure 3A and were used to identify modules for further analyses. 438
439
To delineate the independent effects of nitrate or phosphate on gene co-expression from 440
those due to combined nutrients, we selected the modules that showed significant correlation 441
coefficient values in a treatment-dependent pattern. This resulted in a sub-network with ten 442
modules (tan, lightcyan, brown, midnightblue, black, cyan, salmon, red, green and 443
greenyellow modules) (Figure 3A). We identified the top 5 hub genes in each module based 444
on intramodular connectivity. In three of the modules in the sub-network, homeologues of a 445
gene were among the hub genes where black module contained homeologue triad of a 446
dirigent protein, salmon module contained a homeologue triad of a putative LOB domain 447
containing protein and brown module contained homeologue duplet of a high affinity nitrate 448
transporter (Table S4). The functional annotation for these hub genes identified based on 449
intramodular connectivity are shown in Figure 3B. Moreover, to identify the biological 450
processes enriched in each module we carried out a GO term enrichment analysis on the 451
modules. The top 5 GO terms enriched in each module are listed in Table S4. According to 452
this analysis, the brown module contains genes with a function related to nitrate signaling 453
and/or transport (Figure 3B, Table S4). The genes in the brown module also showed 454
expression profiles with higher expression under pN and PN treatments throughout the time 455
course (Figure 3C). 456
457
Based on the principle of guilt-by-association, we predicted the transcription factors co-458
expressed with the genes in the brown module could play a regulatory role in nitrate 459
signaling/metabolism. According to the annotation available for the wheat genome 460
(International Wheat Genome Sequencing Consortium (IWGSC) et al. 2018), the brown 461
module contained 23 transcription factors/transcription factor-like proteins which included 462
homeologue triads of MYB transcription factors (TraesCS2A01G488200, 463
TraesCS2B01G515800, TraesCS2D01G488500 and TraesCS5A01G401600, 464
TraesCS5B01G406300, TraesCS5D01G411800), transcription factor-like proteins 465
(TraesCS1A01G276600, TraesCS1B01G285800, TraesCS1D01G276100) (Table S5). Out 466
of these 23 transcription factors, the two homeologue triads TraesCS5A01G401600, 467
TraesCS5B01G406300, TraesCS5D01G411800 and TraesCS1A01G276600, 468
TraesCS1B01G285800, TraesCS1D01G276100 have Arabidopsis orthologues that are 469
members of HRS1/HHO and TGA gene families, respectively. Since some HRS1/HHO 470
author/funder. All rights reserved. No reuse allowed without permission. The copyright holder for this preprint (which was not peer-reviewed) is the. https://doi.org/10.1101/551069doi: bioRxiv preprint

20
(Medici et al. 2015) and TGA (Álvarez et al. 2014) family members are involved in nitrate 471
signaling and metabolism, we decided to further probe the role of these two homeologue 472
triads in the context of nitrate signaling in wheat. 473
474
475
Module−trait relationships
−1
−0.5
0
0.5
1
PN_1hPN_2hPN_4h
PN_24h
pN_1hpN_2hpN_4h
pN_24h
Pn_1h
Pn_2h
Pn_4h
Pn_24h
pn_1h
pn_2h
pn_4h
pn_24h
MEturquoise
MEpurple
MEtan
MEblue
MEblack
MEmagenta
MEbrown
MEcyan
MEsalmon
MElightcyan
MEred
MEgreen
MEgreenyellow
MEpink
MEmidnightblue
MEyellow
MEgrey
−0.46(9e−04)
0.099(0.5)
0.14(0.4)
0.13(0.4)
−0.41(0.004)
0.063(0.7)
0.13(0.4)
0.1(0.5)
−0.42(0.003)
0.2(0.2)
0.15(0.3)
0.15(0.3)
−0.33(0.02)
0.16(0.3)
0.19(0.2)
0.1(0.5)
−0.2(0.2)
0.031(0.8)
−0.059(0.7)
−0.015(0.9)
−0.15(0.3)
−0.1(0.5)
−0.16(0.3)
−0.05(0.7)
−0.21(0.1)
0.037(0.8)
−0.13(0.4)
0.65(6e−07)
−0.12(0.4)
−0.017(0.9)
−0.086(0.6)
0.59(9e−06)
−0.35(0.01)
−0.14(0.3)
−0.22(0.1)
−0.25(0.08)
0.0021(1)
−0.19(0.2)
−0.3(0.04)
−0.13(0.4)
−0.11(0.4)
0.3(0.04)
0.16(0.3)
0.39(0.007)
0.011(0.9)
0.25(0.08)
0.2(0.2)
0.38(0.008)
−0.12(0.4)
0.029(0.8)
−0.027(0.9)
−0.00054(1)
0.092(0.5)
−0.055(0.7)
−0.18(0.2)
0.11(0.5)
−0.027(0.9)
0.049(0.7)
−0.12(0.4)
0.013(0.9)
0.24(0.1)
−0.074(0.6)
0.00079(1)
0.068(0.6)
−0.18(0.2)
−0.065(0.7)
0.03(0.8)
0.64(1e−06)
−0.17(0.2)
−0.049(0.7)
−0.011(0.9)
0.65(6e−07)
−0.2(0.2)
−0.14(0.4)
−0.14(0.4)
0.042(0.8)
−0.16(0.3)
−0.13(0.4)
−0.13(0.4)
0.013(0.9)
−0.25(0.09)
−0.19(0.2)
−0.12(0.4)
0.39(0.006)
−0.19(0.2)
−0.2(0.2)
−0.18(0.2)
0.42(0.003)
−0.21(0.1)
−0.062(0.7)
−0.031(0.8)
0.45(0.001)
−0.17(0.2)
−0.098(0.5)
0.0076(1)
0.44(0.002)
0.034(0.8)
0.28(0.06)
0.36(0.01)
0.28(0.05)
−0.32(0.03)
0.29(0.04)
0.36(0.01)
0.2(0.2)
−0.33(0.02)
−0.081(0.6)
−0.055(0.7)
−0.26(0.07)
−0.26(0.07)
−0.12(0.4)
−0.09(0.5)
−0.3(0.04)
−0.069(0.6)
0.21(0.1)
0.14(0.3)
0.6(6e−06)
−0.29(0.05)
0.18(0.2)
0.11(0.5)
0.22(0.1)
−0.026(0.9)
−0.22(0.1)
−0.17(0.2)
−0.034(0.8)
−0.18(0.2)
−0.22(0.1)
−0.19(0.2)
−0.07(0.6)
−0.024(0.9)
0.18(0.2)
0.16(0.3)
0.33(0.02)
−0.15(0.3)
0.13(0.4)
0.047(0.8)
0.36(0.01)
−0.21(0.1)
−0.1(0.5)
−0.18(0.2)
−0.13(0.4)
−0.015(0.9)
−0.15(0.3)
−0.14(0.3)
−0.12(0.4)
0.31(0.04)
0.37(0.009)
0.28(0.05)
−0.21(0.2)
−0.0052(1)
0.39(0.007)
0.22(0.1)
−0.29(0.05)
−0.12(0.4)
0.078(0.6)
−0.071(0.6)
−0.37(0.01)
0.021(0.9)
−0.05(0.7)
−0.18(0.2)
−0.38(0.008)
0.23(0.1)
0.14(0.3)
−0.17(0.3)
−0.43(0.002)
0.38(0.008)
0.062(0.7)
−0.19(0.2)
−0.44(0.002)
0.25(0.09)
0.15(0.3)
−0.12(0.4)
−0.2(0.2)
0.41(0.004)
0.18(0.2)
−0.098(0.5)
−0.16(0.3)
−0.21(0.1)
0.19(0.2)
0.076(0.6)
−0.6(7e−06)
0.0047(1)
0.16(0.3)
0.031(0.8)
−0.52(2e−04)
0.0016(1)
0.22(0.1)
0.17(0.2)
−0.0094(0.9)
0.18(0.2)
0.15(0.3)
0.097(0.5)
0.06(0.7)
0.021(0.9)
0.29(0.05)
0.018(0.9)
−0.36(0.01)
0.023(0.9)
0.18(0.2)
0.023(0.9)
−0.46(9e−04)
−0.086(0.6)
0.38(0.007)
0.061(0.7)
−0.26(0.08)
0.0078(1)
0.38(0.008)
0.052(0.7)
−0.26(0.07)
0.31(0.03)
−0.14(0.3)
−0.27(0.06)
−0.11(0.4)
0.29(0.05)
−0.15(0.3)
0.048(0.7)
−0.15(0.3)
0.18(0.2)
−0.17(0.2)
0.1(0.5)
−0.084(0.6)
0.32(0.03)
−0.15(0.3)
0.078(0.6)
−0.081(0.6)
0.28(0.05)
−0.1(0.5)
−0.19(0.2)
0.3(0.04)
0.25(0.09)
−0.1(0.5)
−0.37(0.01)
0.34(0.02)
0.13(0.4)
−0.22(0.1)
−0.26(0.08)
0.084(0.6)
0.22(0.1)
−0.26(0.08)
−0.26(0.07)
0.16(0.3)
0.46(9e−04)
−0.12(0.4)
−0.2(0.2)
−0.049(0.7)
0.46(0.001)
−0.13(0.4)
−0.23(0.1)
−0.032(0.8)
0.36(0.01)
−0.16(0.3)
−0.18(0.2)
−0.042(0.8)
0.34(0.02)
−0.2(0.2)
−0.23(0.1)
−0.046(0.8)
−0.24(0.1)
−0.19(0.2)
0.094(0.5)
0.13(0.4)
−0.15(0.3)
−0.13(0.4)
0.22(0.1)
0.037(0.8)
0.077(0.6)
−0.068(0.6)
0.087(0.6)
0.18(0.2)
0.11(0.5)
−0.27(0.06)
0.0095(0.9)
0.12(0.4)
TurquoisePurpleTanBlueBlack
MagentaBrownCyan
SalmonLightcyan
RedGreen
GreenyellowPink
MidnightblueYellowGrey
A
B C
Glutathione S-transferase
GDSL esteraseGermin-like protein
High affinitynitrate transporter
Aldose-1 epimerase
Protein kinaseWound responsivefamily protein
Ammonium transporter
LOB domain containing protein
Dirigent protein Nor
mal
ized
logF
C
Pn pN PN
10.0
0.0
-10.0
author/funder. All rights reserved. No reuse allowed without permission. The copyright holder for this preprint (which was not peer-reviewed) is the. https://doi.org/10.1101/551069doi: bioRxiv preprint

21
476
Wheat HRS1/HHO and TGA family members show functional 477
divergence from Arabidopsis orthologues in response to nitrate 478
479 Given the role of the HRS1/HHO gene family in response to N and P in Arabidopsis and rice 480
(Medici et al. 2015; Maeda et al. 2018; Kiba et al., 2018), we explored gene expression 481
dynamics of the wheat HRS1/HHO gene family in response to nitrate and phosphate supply. 482
Firstly, we identified putative wheat HRS1/HHO orthologues by protein sequence alignment 483
using reciprocal BLAST. This confirmed that all the wheat HRS1/HHO sequences contain 484
the conserved G2-like DNA binding domain (Figure S3A). A maximum likelihood-built 485
gene tree showed that a single wheat homeologue triad falls within the AtHRS1 and 486
OsNIGT1 clade, another homeologue triad groups within the AtHHO4 clade, while three 487
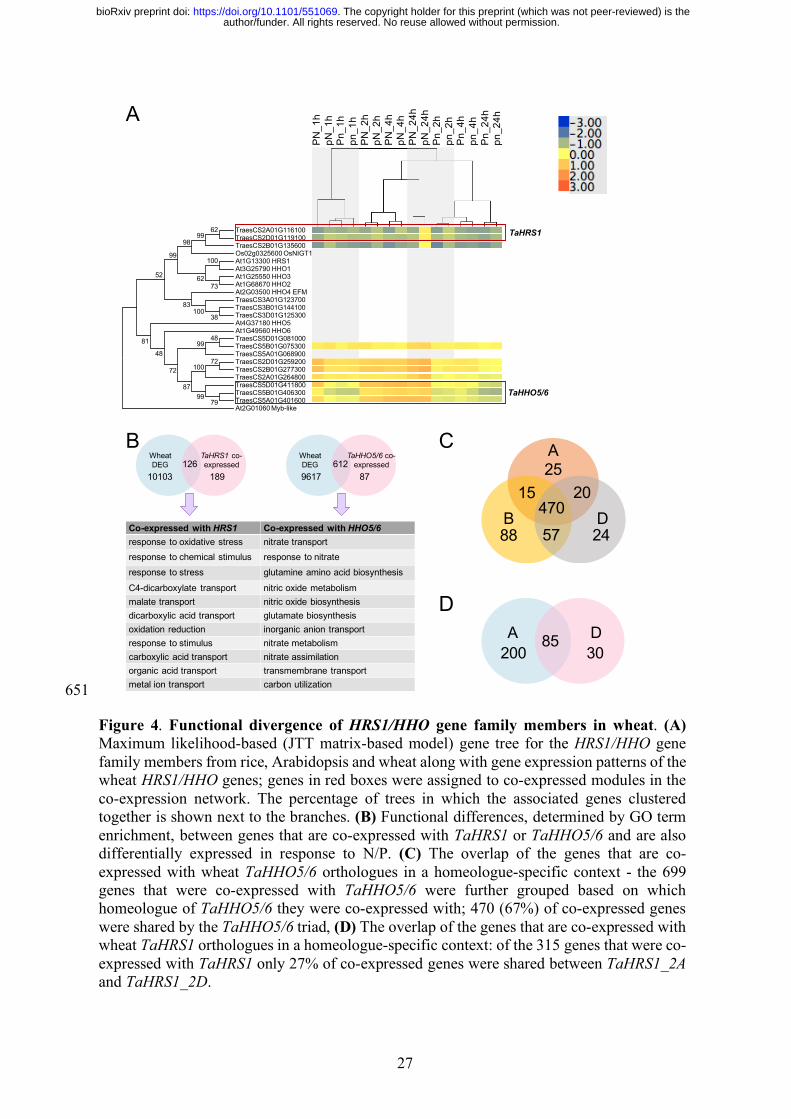
homeologue triads cluster within the AtHHO5/HHO6 clade (Figure 4A). Of those 15 wheat 488
HRS1/HHO orthologues, only 10 genes were found to be differentially expressed in at least 489
one treatment-time combination in our dataset (Figure 4A). 490
Interestingly, the three wheat HRS1 (TaHRS1) genes (TraesCS2A01G116100, 491
TraesCS2B01G135600, TraesCS2D01G119100) showed up-regulation only at 24 h in 492
response to nitrate supply in the absence of phosphate. This delayed transcriptional response 493
was unexpected of TaHRS1, as previous studies on rice (Sawaki et al. 2013) and Arabidopsis 494
(Krouk et al. 2010) have reported HRS1/NIGT1 to be up-regulated within 1 h of nitrate 495
supply. However, the seven wheat genes that are closely related to AtHHO5/HHO6 496
(TaHHO5/6 genes) (TraesCS5B01G075300, TraesCS2D01G259200, 497
TraesCS2B01G277300, TraesCS2A01G264800, TraesCS5D01G411800, 498
Figure 3. Weighted gene co-expression network (WGCNA) analysis identified gene modules involved in nitrate signaling in wheat. (A) Heatmap showing expression between network modules and the treatments (traits). Module eigengenes were calculated using WGCNA package and each cell shows the corresponding correlation value and its P-value. Color scale corresponds to the correlation values. Cells outlined in black represent the module-trait relationships selected for further analysis. (B) The hub genes were identified based on intramodular connectivity. (C) Gene expression profile for the Brown module; Y axis represents the normalized log fold change (logFC) values where expression was measured as treatment/reference (i.e. pn) for a given time point; mean (black or gold or orange line) is shown for all the genes (shaded lines) in the module.
author/funder. All rights reserved. No reuse allowed without permission. The copyright holder for this preprint (which was not peer-reviewed) is the. https://doi.org/10.1101/551069doi: bioRxiv preprint

22
TraesCS5B01G406300, TraesCS5A01G401600) showed up-regulation upon nitrate supply 499
at early time points, and remained induced for the rest of the 24 h of treatment (Figure 4A). 500
Specifically, all TaHHO5/6 genes but TraesCS5B01G075300, were up-regulated by PN 501
treatment at 1 h, and remained up-regulated in PN and pN conditions at later time points. 502
TraesCS5B01G075300 was up-regulated in PN and pN treatments from 2-24 h (Table S8). 503
This pattern of gene expression indicated that N regulation of the wheat HRS1/HHO gene 504
family may have functionally diverged from that of Arabidopsis and rice, and, consequently, 505
the downstream genetic targets of TaHRS1 and TaHHO5/6 may also be regulated in a 506
different manner. 507
It has been estimated that a plant gene can be directly regulated by 6-40 transcription factors 508
(Pal et al. 2017). We therefore tested the hypothesis that TaHRS1 and TaHHO5/6 differ in 509
their transcriptional responses to N at least in partly due to having different transcription 510
factor binding motifs (TFBM) present within their promoters. We used MEME (Bailey et 511
al. 2009) to identify enriched promoter motifs followed by TOMTOM (Khan et al. 2018) 512
TFBM comparison analysis of DNA regions 1 kb upstream from transcription start site and 513
identified 11 plant TFBM within the promoter of TaHRS1 genes (TraesCS2A01G116100, 514
TraesCS2B01G135600, TraesCS2D01G119100) (Table S7). These 11 TFBM included 515
KANADI, ERF10, homeodomain-like superfamily proteins and Myb-like transcription 516
factors. Except ERF10, the 10 transcription factors predicted to bind to TaHRS1 promoters 517
all belong to the G2-like transcription factor family (Table S7). On the other hand, the same 518
analysis of the nine TaHHO5/6 gene promoters (TraesCS5B01G075300, 519
TraesCS2D01G259200, TraesCS2B01G277300, TraesCS2A01G264800, 520
TraesCS5D01G411800, TraesCS5B01G406300, TraesCS5A01G401600, 521
TraesCS5D01G081000, TraesCS5A01G068900) identified 118 plant TFBM (Table S7). 522
Among these 118 TFBM, Dof, MADS box and G2-like TFBMs were the most abundant 523
types (Figure S5C, Table S7). All but two G2-like TFBM identified in TaHRS1 promoters 524
were also present in TaHHO5/6 promoters (Table S7). The larger diversity of TFBM within 525
the promoters of the TaHHO5/6 genes may result in increased responsiveness to a wider 526
array of signals. On the other hand, apparent lack of similar level of TFBM diversity within 527
TaHRS1 promoters may also be due to failure to properly identify wheat-specific TFBM 528
using currently available tools and database of plant TFBM. 529
In order to identify the regulators of TaHRS1 and TaHHO6 we used a different approach 530
where we attempted to infer regulatory networks from gene expression data as implemented 531
author/funder. All rights reserved. No reuse allowed without permission. The copyright holder for this preprint (which was not peer-reviewed) is the. https://doi.org/10.1101/551069doi: bioRxiv preprint

23
in GENIE3 (Huynh-Thu et al. 2010). Using this tree-based ensemble approach on the gene 532
expression matrix containing 8300 genes (top 10% genes by expression variance, see above) 533
and the 389 transcription factors (as annotated by the (International Wheat Genome 534
Sequencing Consortium (IWGSC) et al. 2018)) present within the 8300 genes, 22 predicted 535
regulators were found to be regulating both members of the homeologue duplet of TaHRS1 536
(TraesCS2A01G116100, TraesCS2D01G119100) (Table S6). Similarly, 29 regulators were 537
commonly predicted for the homeologue triad of TaHHO5/6 (TraesCS5D01G411800, 538
TraesCS5B01G406300 and TraesCS5A01G401600 ) (Table S6). These genes we refer to as 539
“common regulators” herein. While the majority (10 regulators, Fisher’s exact test P = 1.7e-540
31) of the predicted common regulators were shared between homeologues for TaHRS1 or 541
TaHHO6 (Table S6), there were genes that regulated one of the TaHRS1 or TaHHO6 542
homeologues, but not all (Figure 6). Interestingly, the predicted common regulators of 543
TaHRS1 and TaHHO6 included wheat homologues of AtNLP7 and AtLBD37. In 544
Arabidopsis, NLP7 is a direct transcriptional regulator of HRS1/HHO family members in 545
response to nitrate (Medici et al. 2015; Marchive et al. 2013) while the role of LBD37 in 546
HRS1/HHO regulation remains unclear (Kiba et al., 2018; Rubin et al. 2009), even though 547
its involvement in regulation of early nitrate responses has been confirmed (Rubin et al. 548
2009; Varala et al. 2018), suggesting that LBD37 may act upstream of at least some 549
HRS1/HHO family members. Altogether, our results suggest that TaHRS1/HHO also 550
require NLP7 and LBD37, while the unique regulators of TaHRS1 and TaHHO5/6 possibly 551
contribute to differences in the downstream activity of TaHRS1 and TaHHO5/6. 552
553
We further investigated this apparent functional divergence within the wheat HRS1/HHO 554
gene family using co-expression network analysis. Out of the 15 TaHRS1/HHO homologues, 555
only five genes (TraesCS2A01G116100, TraesCS2D01G119100, TraesCS5D01G411800, 556
TraesCS5B01G406300 and TraesCS5A01G401600) showed significant co-expression 557
correlation and were assigned to gene co-expression modules (Figure 4A). 558
TraesCS2A01G116100 and TraesCS2D01G119100, which are closely related to OsNIGT1 559
(AtHRS1), were assigned to turquoise and black modules respectively. The TaHHO5/6 genes 560
(TraesCS5D01G411800, TraesCS5B01G406300 and TraesCS5A01G401600) were 561
assigned to the brown co-expression module. Since TraesCS2A01G116100 was assigned to 562
the turquoise module, we included the turquoise module in our co-expression sub-network. 563
The GO term enrichment analysis identified nicotianamine metabolism and biogenic amine 564
metabolism processes enriched in the black module (containing the TaHRS1 gene 565
author/funder. All rights reserved. No reuse allowed without permission. The copyright holder for this preprint (which was not peer-reviewed) is the. https://doi.org/10.1101/551069doi: bioRxiv preprint

24
TraesCS2D01G119100), while processes related to oxidative stress were enriched in the 566
turquoise module (containing the TaHRS1 gene TraesCS2A01G116100) (Table S4). As 567
noted above, the brown module, containing the three TaHHO5/6 homeologues, showed 568
statistically significant enrichment of the GO terms of nitrogen signaling and/or transport 569
(Figure 3B, Table S4). 570
571
Furthermore, when we compared the wheat HRS1 and HHO5/6 co-expressed genes to the 572
list of differentially expressed genes, 612 out of 699 HHO5/6 co-expressed genes (88%) 573
were found differentially expressed in response to N/P treatments. The GO term enrichment 574
analysis of these 612 genes identified over-represented processes related to nitrate signaling 575
and metabolism (Figure 4B). On the other hand, the 126 (40%) genes at the intersect of genes 576
co-expressed with TaHRS1 and the differentially expressed genes do not show any 577
enrichment for processes related to nitrate signaling and metabolism (Figure 4B). These 578
results together with our gene expression profiling results support our hypothesis that the 579
N/P responses in wheat are more likely to be mediated by the TaHHO5/6 gene regulatory 580
network(s) than the TaHRS1 one(s). 581
582
In order to identify candidate direct TaHRS1- or TaHHO5/6-target gene interactions, we 583
considered the GENIE3 predictions. We then considered the putative common targets of 584
TraesCS2A01G116100 and TraesCS2D01G119100 (TaHRS1) predicted by the GENIE3 585
analysis, and found that a significant portion of 205 predicted targets (65%, 133 targets, 586
Fisher’s exact test P = 3.6e-85) were also differentially expressed, while only a small 587
proportion of them (14 genes, 7%, Fisher’s exact test P = 1.7e-15) were shared with the 588
TaHRS1 co-expressed genes (Table S6, Figure S5A). Moreover, most of the predicted 589
targets of TaHRS1 showed similar expression dynamics as TaHRS1, whose marked up-590
regulation was observed only at 24 h in response to pN treatment. Despite this, the GO terms 591
enrichment analysis of the 205 predicted HRS1 target genes also showed enrichment for GO 592
terms “nicotianamine metabolism” and “cellular amine metabolic process”. This further 593
supports the notion that TaHRS1 genes may be regulating a class of genes which are 594
functionally different from their counterparts in Arabidopsis. Nicotianamine metabolism 595
plays a crucial role in metal ions transport (Fe and Zn) in plants (Schuler et al. 2012; 596
Takahashi et al. 2003; Hofmann 2012). Nicotianamine has been considered a metal ion 597
chelator that enables proper distribution of metal ions among source and sink tissues 598
(Schuler et al. 2012; Conte and Walker 2011), while contributing to prevent metal ion 599
author/funder. All rights reserved. No reuse allowed without permission. The copyright holder for this preprint (which was not peer-reviewed) is the. https://doi.org/10.1101/551069doi: bioRxiv preprint

25
toxicity (Wiren N et al. 1999). Up-regulation of nicotianamine synthase genes have been 600
reported in response to nitrate supply which has been thought to be a response to facilitate 601
transport of Fe required for synthesis of nitrate assimilatory enzymes such as nitrate 602
reductase and nitrite reductase (R. Wang et al. 2003). While nicotianamine synthase gene 603
NAS3 was induced under P starvation (Bournier et al. 2013), NAS2 was up-regulated under 604
excess P condition (Shukla et al. 2017). Therefore, nitrate or phosphate treatments trigger 605
changes in the nicotianamine levels which may lead to precise regulation of metal ion 606
transport. Considering the gene expression dynamics of TaHRS1 homeologue triad, the 607
GENIE3-predicted targets of TraesCS2A01G116100, TraesCS2D01G119100 , the 608
biological processes enriched in the black and turquoise co-expression modules, and the 609
biological processes enriched in the predicted targets of TaHRS1, we propose that TaHRS1 610
may be regulating nitrate-dependent metal ion transport in the absence of phosphate. 611
612
Similar to the results of the WGCNA analysis, GENIE3 identified a larger set of predicted 613
common gene targets of TraesCS5D01G411800, TraesCS5B01G406300 and 614
TraesCS5A01G401600 (TaHHO5/6) than TaHRS1 (Table S6) with 754 predicted 615
TaHHO5/6 targets. While 644 out of 754 predicted targets (85%, Fisher’s exact test P = 0) 616
were differentially expressed in at least one treatment-time combination, a much larger 617
proportion (537 genes) of the TaHHO5/6 predicted targets were also co-expressed with 618
TaHHO5/6 genes (71%, Fisher’s exact test P = 0) (Figure S5B, Table S6). GO term 619
enrichment analysis on these 754 predicted TaHHO5/6 targets revealed that processes such 620
as “response to nitrate”, “nitrate transport”, “glutamate biosynthetic process” were enriched. 621
622
This result corroborates our hypothesis of the possible functional convergence in the 623
background of genetic divergence of some of the TaHRS1/HHO family members in 624
mediating nitrate transcriptional responses and the regulatory roles these two transcription 625
factors play in wheat P/N responses. Altogether our results suggest that, TaHRS1 and 626
AtHRS1 are functionally divergent, while TaHHO5 and AtHRS1 show functional 627
convergence while being genetically divergent. These differences may be due to TaHHO5/6 628
rapid induction by nitrate that initiates a transcriptional response cascade as a primary 629
response to nitrate supply. Meanwhile, TaHRS1 is induced later in the time course and 630
regulates secondary processes, such as metal ion transport. However, it should also be noted 631
that these putative transcription factor – target relationships are predicted based on gene 632
author/funder. All rights reserved. No reuse allowed without permission. The copyright holder for this preprint (which was not peer-reviewed) is the. https://doi.org/10.1101/551069doi: bioRxiv preprint

26
expression dynamics and the post-transcriptional level regulation by TaHRS1/HHO 633
members may be different. 634
635
In line with their divergent regulation and predicted function as transcription factors, the set 636
of genes that are co-expressed with either the two TaHRS1 or the three TaHHO5/6 637
homeoalleles are different, despite their homeologue relationships. For example, 638
TraesCS2A01G116100 and TraesCS2D01G119100, the TaHRS1 homeoalleles, share 85 co-639
expressed genes (85/315 or only 27%) (Figure 4D). Meanwhile, the TaHHO5/6 homeoallele 640
triad (TraesCS5D01G411800, TraesCS5B01G406300 and TraesCS5A01G401600) shares 641
470 co-expressed genes (66% of genes co-expressed with the entire TaHHO5/6 triad) while 642
another 92 genes (13%) are co-expressed with either two of the three TaHHO5/6 643
homeoalleles (Figure 4C). This suggests that presence of active homeoalleles may increase 644
the complexity of wheat gene regulatory networks. 645
646
Altogether, these results suggest that TaHHO5/6 orthologues are functionally more related 647
to AtHRS1 and OsNIGT1(Figure 4B), while TaHRS1 may have a different role in mediating 648
N/P responses in wheat, in line with its delayed transcriptional responses (Figure 4A). 649
650
author/funder. All rights reserved. No reuse allowed without permission. The copyright holder for this preprint (which was not peer-reviewed) is the. https://doi.org/10.1101/551069doi: bioRxiv preprint
27
651
Wheat DEG
10103126
TaHRS1 co-expressed
189
Wheat DEG9617
612TaHHO5/6 co-
expressed87
Co-expressed with HRS1 Co-expressed with HHO5/6response to oxidative stress nitrate transportresponse to chemical stimulus response to nitrateresponse to stress glutamine amino acid biosynthesis
C4-dicarboxylate transport nitric oxide metabolismmalate transport nitric oxide biosynthesisdicarboxylic acid transport glutamate biosynthesisoxidation reduction inorganic anion transportresponse to stimulus nitrate metabolismcarboxylic acid transport nitrate assimilationorganic acid transport transmembrane transportmetal ion transport carbon utilization
A
B C
D
A25
88B D1547057 24
20
A D200
8530
TraesCS2A01G116100 TraesCS2D01G119100 TraesCS2B01G135600 Os02g0325600 OsNIGT1 At1G13300 HRS1 At3G25790 HHO1 At1G25550 HHO3 At1G68670 HHO2 At2G03500 HHO4 EFM TraesCS3A01G123700 TraesCS3B01G144100 TraesCS3D01G125300 At4G37180 HHO5 At1G49560 HHO6 TraesCS5D01G081000 TraesCS5B01G075300 TraesCS5A01G068900 TraesCS2D01G259200 TraesCS2B01G277300 TraesCS2A01G264800 TraesCS5D01G411800 TraesCS5B01G406300 TraesCS5A01G401600 At2G01060 Myb-like
100
7999
73
72100
87
6299
98
62
99
4899
72
48
81
52
83
38100
PN_1h
pN_1h
Pn_1h
pn_1h
PN_2h
pN_2h
PN_4h
pN_4h
PN_24h
pN_24h
Pn_2h
pn_2h
Pn_4h
pn_4h
Pn_24h
pn_24h
TaHRS1
TaHHO5/6
Figure 4. Functional divergence of HRS1/HHO gene family members in wheat. (A) Maximum likelihood-based (JTT matrix-based model) gene tree for the HRS1/HHO gene family members from rice, Arabidopsis and wheat along with gene expression patterns of the wheat HRS1/HHO genes; genes in red boxes were assigned to co-expressed modules in the co-expression network. The percentage of trees in which the associated genes clustered together is shown next to the branches. (B) Functional differences, determined by GO term enrichment, between genes that are co-expressed with TaHRS1 or TaHHO5/6 and are also differentially expressed in response to N/P. (C) The overlap of the genes that are co-expressed with wheat TaHHO5/6 orthologues in a homeologue-specific context - the 699 genes that were co-expressed with TaHHO5/6 were further grouped based on which homeologue of TaHHO5/6 they were co-expressed with; 470 (67%) of co-expressed genes were shared by the TaHHO5/6 triad, (D) The overlap of the genes that are co-expressed with wheat TaHRS1 orthologues in a homeologue-specific context: of the 315 genes that were co-expressed with TaHRS1 only 27% of co-expressed genes were shared between TaHRS1_2A and TaHRS1_2D.
author/funder. All rights reserved. No reuse allowed without permission. The copyright holder for this preprint (which was not peer-reviewed) is the. https://doi.org/10.1101/551069doi: bioRxiv preprint
28
The TGA gene family members are transcription factors characterized by the presence of 652
bZIP_1 signature DNA binding domain and their ability to bind to the TGAGC promoter 653
motif (Lebel et al. 1998; Gatz 2013). In Arabidopsis, 10 TGA gene family members have 654
been identified (Jakoby et al. 2002). TGA family members were first identified to be 655
involved in pathogenesis related processes (Subramaniam et al. 2001; Fan and Dong 2002), 656
however, TGA1 and TGA4 have been shown to regulate root development in response to 657
nitrate (Álvarez et al. 2014). None of the other Arabidopsis TGA family members have been 658
found to be involved in nitrate signaling/metabolism (Álvarez et al. 2014). Our analysis 659
showed that the TGA gene family in wheat consists of at least 38 members (as identified 660
through reciprocal BLAST), all of which possess the conserved bZIP_1 DNA binding 661
domain (Figure S3B-C). Out of 9 wheat TGA genes (TraesCS3A01G372400, 662
TraesCS3D01G365200, TraesCS3B01G404800, TraesCS1A01G276600, 663
TraesCS1B01G285800, TraesCS1D01G276100, TraesCS4A01G183400, 664
TraesCS4B01G135000 and TraesCS4D01G129900) that form a separate clade with three 665
members of the rice TGA family, 8 genes were differentially expressed in at least one 666
treatment-time combination (Figure 5A). Since only TraesCS1A01G276600, 667
TraesCS1B01G285800 and TraesCS1D01G276100 were assigned to modules in WGCNA 668
analysis and differentially expressed, we focused more on these three genes. Based on 669
sequence homology, TraesCS1A01G276600, TraesCS1B01G285800 and 670
TraesCS1D01G276100, (constituting a homeologue triad) were found to be most closely 671
related to Os05g0443900 (Liguleless2), through a reciprocal BLAST (Figure 5A, Figure S4). 672
Since AtTGA9/10 are the closest Arabidopsis TGA family members to 673
TraesCS1A01G276600, TraesCS1B01G285800 and TraesCS1D01G276100 on the gene tree 674
(Figure 5A, Figure S4), we refer to TraesCS1A01G276600, TraesCS1B01G285800 and 675
TraesCS1D01G276100 triad as TaTGA9/10 herein. In contrast to Arabidopsis, we did not 676
detect differential expression of wheat TGA1/4 homologues (TraesCS2A01G526300, 677
TraesCS2B01G556600, TraesCS2D01G529000), and they were not assigned to modules in 678
the WGCNA network. However, we detected TaTGA9/10 orthologues as differentially 679
expressed (up-regulated under PN condition throughout the time course and under pN 680
condition 2-24 h (Table S8)) and co-expressed with nitrate signaling/metabolism related 681
genes in the brown module (Figure 4C). This may suggest possible sub-functionalization of 682
wheat TGA members in regulating nitrate signaling/metabolism. Similar to the TaHHO5/6 683
homeologue triad, when the TaTGA9/10 co-expressed genes were considered in a 684
homeologue-specific context, 454 genes out of 517 genes (88% of co-expressed genes with 685
author/funder. All rights reserved. No reuse allowed without permission. The copyright holder for this preprint (which was not peer-reviewed) is the. https://doi.org/10.1101/551069doi: bioRxiv preprint

29
TaTGA9/10 triad) were co-expressed with all three TaTGA9/10 genes (Figure 5B). Since the 686
TaTGA9/10 triad was loosely annotated as “transcription factor like proteins”, our gene co-687
expression analysis identified putative functions of this homeologue triad in the context of 688
nitrate signaling/metabolism. And our results suggest that in wheat, TaTGA9/10 triad is 689
functionally convergent with AtTGA1/4 despite being genetically divergent. 690
Moreover, our GENIE3 analysis predicted 1107 common putative target genes downstream 691
of TaTGA9/10 genes (Table S6). These are enriched for processes such as “nitrate 692
assimilation”, “malate transport” and “glutamate biosynthetic processes”, with 850 of the 693
1107 (76.7%, Fisher’s exact P = 0) targets also differentially expressed in at least one of the 694
treatment-time combinations, while 447 targets (40.3%, Fisher’s exact P = 0) were co-695
expressed with TaTGA9/10. Intriguingly, phosphate transporters (12 genes homologous to 696
AtPT1 and AtPHO1) and SPX domain containing proteins (8 genes homologous to 697
AtSPX2/3, AtPHT5;1) were also among the predicted TaTGA9/10 targets (Table S6), out of 698
which 4 phosphate transporter genes and 3 SPX domain containing genes were co-expressed 699
as well. Indeed it has been reported that most phosphate transporters and phosphate 700
starvation induced genes, including SPX1/3/4 and PHO1, possess TGAGC motif (Baek et 701
al. 2017). Our results suggest that TaTGA9/10 participates in the nitrate dependent regulation 702
of phosphate starvation responses and transport, and as such, likely plays a role in integrating 703
nitrate and phosphate signals. 704
705
706
author/funder. All rights reserved. No reuse allowed without permission. The copyright holder for this preprint (which was not peer-reviewed) is the. https://doi.org/10.1101/551069doi: bioRxiv preprint

30
707
708
Considering the evidence for possible functional divergence of TaHRS1/HHO and TaTGA 709
gene family members, with TaHHO5/6 and TaTGA9/10 being prominent in wheat nitrate 710
signaling/metabolism by regulating hundreds of target genes, we expected that a 711
transcriptional network of TaHRS1/HHO and TaTG9/10 members and their regulators 712
would be important in identifying regulatory mechanisms underpinning TaHRS1/HHO and 713
TaTGA9/10 transcriptional responses to N and P provision. To this end, we used the GENIE3 714
TraesCS5B01G265300 TraesCS5D01G273500 TraesCS5A01G265600 Os09g0489500 AT5G06839 AtTGA10 Os09g0280500 TraesCS5A01G174200 TraesCS5D01G178800 Os06g0614100 Os02g0194900 TraesCS6D01G154400 TraesCS6A01G165800 TraesCS6B01G193200 AT1G08320 AtTGA9 TraesCS3A01G372400 TraesCS3D01G365200 TraesCS3B01G404800 Os01g0859500 TraesCS1B01G285800 TraesCS1D01G276100 TraesCS1A01G276600 Os05g0443900 Os11g0152700 Os12g0152900 TraesCS4A01G183400 TraesCS4B01G135000 TraesCS4D01G129900 AT5G65210 AtTGA1 AT5G10030 AtTGA4 AT1G22070 AtTGA3 AT1G77920 AtTGA7 Os04g0637000 Os08g0176900 TraesCS2D01G529000 TraesCS2A01G526300 TraesCS2B01G556600 Os05g0492000 TraesCS1D01G105300 TraesCS1A01G096300 TraesCS1B01G127400 AT5G06950 AtTGA2 AT3G12250 AtTGA6 AT5G06960 AtTGA5 Os03g0318600 Os07g0687700 TraesCS4A01G126300 TraesCS4D01G180200 TraesCS4B01G178600 TraesCS2B01G113200 TraesCS2D01G096800 TraesCS2A01G097500 Os01g0279900 TraesCS3A01G190700 TraesCS3B01G220400 TraesCS3D01G194800 TraesCS3B01G365100 TraesCS3D01G327600 TraesCS3A01G334100 Os01g0808100 AT1G68640 AtTGA8 PAN Os01g0882200 Os10g0566200 Os06g0265400 TraesCS7B01G114300 TraesCS7D01G209800 TraesCS7A01G207100 SELMODRAFT 231689 EFJ28227
99
98
9697
89
80
7791
7377
6999
82
6980
9879
61
5995
69
55
53
5087
98
39
3942
58
36
48
3596
91
35
3499
68
86
3398
76
30
30
1929
18
18
17
17
41
43
39
27
16
1553
19
13
15
8
6
7
PN_1h
pN_1h
Pn_1h
pn_1h
PN_2h
pN_2h
PN_4h
pN_4h
PN_24h
pN_24h
Pn_2h
pn_2h
Pn_4h
pn_4h
Pn_24h
pn_24h
TaTGA9/10
A2
12B D2045417 7
5
Wheat DEG9746
483TaTGA9/10
co-expressed34
Co-expressed with TaTGA9/10nitric oxide metabolismnitric oxide biosynthesistransmembrane transport
nitrate metabolismnitrate assimilationcarbon utilizationglucose metabolisminorganic anion transport
A B
C
Figure 5. Functional divergence of TGA gene family members in wheat. (A) Segment of the maximum likelihood based (JTT matrix-based model) gene tree for the TGA family members from rice, Arabidopsis and wheat along with gene expression patterns of wheat TGA orthologues; genes in red boxes were assigned to co-expressed modules in the coexpression network. The percentage of trees in which the associated genes clustered together is shown next to the branches; full gene tree is in Figure S4. (B) The overlap of the genes that are co-expressed with TaTGA9/10 orthologues in a homeologue-specific context; the 517 genes that were co-expressed with TaTGA9/10 were further grouped based on which homeologue of TaTGA9/10 they were co-expressed with; 88% of co-expressed genes were shared by TaTGA9/10 triad. (C) Genes that are both co-expressed with TaTGA9/10 and differentially expressed are involved in nitrate signaling and metabolism.
author/funder. All rights reserved. No reuse allowed without permission. The copyright holder for this preprint (which was not peer-reviewed) is the. https://doi.org/10.1101/551069doi: bioRxiv preprint

31
predictions to identify putative regulatory relationships between transcriptional regulators of 715
TaHRS1 homeologue duplet, TaHHO5/6 homeologue triad, TaTGA9/10 homeologue triad 716
(Figure 6, Table S9). Indeed, we found that wheat NLP7 genes (TraesCS6A01G102400, 717
TraesCS6B01G130800 and TraesCS6D01G091000) were among regulators shared between 718
TaHRS1, TaHHO5/6 and TaTGA9/10 highlighting the central regulatory role played by 719
NLP7 genes in wheat nitrate responses. In addition to wheat NLP7 genes, 720
TraesCS6A01G287700 (Dof zinc finger protein homologous to AT2G37590) and a 721
homeologue triad (TraesCS2A01G488200, TraesCS2B01G515800 and 722
TraesCS2D01G488500) of a MYB-like transcription family protein homologous to 723
AT5G06800, a MYB-HTH transcriptional regulator family protein, were also shared 724
regulators of TaHRS1, TaHHO5/6 and TaTGA9/10 (Figure 6, Table S9), suggesting that 725
these transcription factors play a role in regulating wheat nitrate responses. While 726
AT2G37590 and AT5G06800 have not been characterized in the context of nitrate regulation, 727
gene co-expression data from Arabidopsis suggest that AT5G06800 is co-expressed with 728
AtHRS1 (Obayashi et al. 2018). Moreover, the targets of wheat LBD37 genes 729
(TraesCS4B01G078800, TraesCS2B01G212400, TraesCS4D01G077600 and 730
TraesCS4A01G236200) also included TaHRS1, TaHHO5/6 and TaTGA9/10 (Figure 6, 731
Table S9). These results are consistent with observations made about NLP7 (Medici et al. 732
2015; Marchive et al. 2013) and LBD37 (Rubin et al. 2009; Varala et al. 2018) regulatory 733
roles in Arabidopsis. TaHHO5/6 and TaTGA9/10 expression dynamics were also consistent 734
with their being regulated by each other, as predicted by the GENIE3 analysis. However, the 735
exact nature of this cross-regulation remains unresolved due to a lack of fine scale temporal 736
resolution in our dataset. 737
In our transcriptional regulatory network, we could also identify regulators that were 738
predicted to be regulating only TaHRS1 or TaHHO5/6 or TaTGA9/10 (Figure 6, Table S9). 739
For example, wheat genes homologous to AtLBD41 and AtRAV2 were predicted to be 740
specifically regulating only the TaHHO5/6 triad, while genes homologous to AtNAC058 and 741
AtWRKY24 were predicted to be specifically regulating TaTGA9/10 triad (Figure 6, Table 742
S9). Although these regulatory relationships are predicted based on gene expression and 743
therefore any post-transcriptional/translational effects are likely missed, our results suggest 744
that the regulatory roles played by genes such as NLP7 and LBD37 are conserved in wheat, 745
while identifying candidate genes, such as TraesCS2A01G488200, TraesCS2B01G515800 746
and TraesCS2D01G488500, which may play a central role in regulating wheat nitrate 747
author/funder. All rights reserved. No reuse allowed without permission. The copyright holder for this preprint (which was not peer-reviewed) is the. https://doi.org/10.1101/551069doi: bioRxiv preprint

32
responses. 748
749
750
751 752
753
Plants sense multiple nutritional signals and show coordinated responses to these signals as 754
suggested by the emerging evidence for crosstalk between nutrient signaling mechanisms 755
such as those between nitrate and phosphate signaling (Kellermeier et al. 2014; Medici et 756
al. 2015). Hence, studying the combined effects exerted by nitrate and phosphate on the 757
transcriptional response within wheat roots identified the synergistic effects of N and P 758
supply on gene expression as early as 1 h post-treatment, while also identifying other, 759
mutually independent transcriptional responses in wheat. Using recent wheat genome 760
annotation, we identified instances of likely functional divergence in transcription factor 761
gene families prominent in nitrate signaling and metabolism. Analysis of gene co-expression 762
HB7_5A
HRA1_3A
OBP1_2A
HB5_4B
LBD37_4A
HRA1_3D
bZIP48_5A
WRKY35_1D
ERF71_5B
WRKY22_7B
HB1_5B
MYBS1_7A
ERF72_1D
MYB111_3A
bZIP25_5A
TaHRS1_2A
bHLH39_3D
LBD37_4D
bHLH39_3A CSP1_2D
NAC058_4D
HB5_4ATaHRS1_2D
EMB3114_4D
ERF_3A
HSFA6B_1A bHLH100_3B
TaHHO5/6_5A
LBD41_2D
Dof_2B
MYB20_5ALBD37_4B
WRKY62_2B
ERF73_4A
NLP7_6ANLP7_6B
LBD40_3B
TaHHO5/6_5B LBD41_2A
RL3_4D
RAV2_3B
NLP7_6D
TaHHO5/6_5D
NAC1L_2A
WRKY62_2D
bZIP48_5D
HRA1_3B
Dof_2D
WRKY35_1B
RVE1_6A
LBD37_2B
TaTGA9/10_1B
ERF74_4A
WRKY50_3A
DREB1A_5D
TaTGA9/10_1D
TaTGA9/10_1A RL6_5B
MYB_HTH_2D
Dof_6AMYB_HTH_2A
WRKY72_7D
MYB_HTH_2B
MYB111_3BERF71_1A
ERF_1B
NAC058_4B
WRKY24_3D
NAC058_4A
bZIP14_2B
bHLH_4B
WRKY72_7D MYBS1_4A
Figure 6. Predicted relationships between TaHRS1, TaHHO5/6, TaTGA9/10 and their regulators. The node colors correspond to the module color on WGCNA network, except genes belonging to black module are represented in light purple for clarity. Edges represent a weight measure >0.005 as calculated by GENIE3. The nodes are named based on their sequence homology to Arabidopsis.
author/funder. All rights reserved. No reuse allowed without permission. The copyright holder for this preprint (which was not peer-reviewed) is the. https://doi.org/10.1101/551069doi: bioRxiv preprint

33
networks identified gene modules that are involved in wheat nitrate signaling and 763
metabolism which begins to unravel the complex and intricate nutrient signaling components 764
in wheat and will be helpful in prioritizing candidate genes to increase nutrient use efficiency 765
in wheat. 766
767
Materials and methods 768
769
Plant growth and treatment 770
Surface sterilized wheat seeds (variety Chinese spring) were pre-imbibed at 4 0C overnight 771
and transferred on to moistened rock wool plugs in a hydroponics system and the plants were 772
grown at 24 0C in a growth chamber at 16 h photoperiod. The seedlings were grown in water 773
for 11 days before treating them with nutrients. After 11 days, water was replaced with 774
nutrient solutions of varying nitrate and phosphate concentrations. Composition of the 775
nutrient solutions is available in Table S10. Briefly, the plants were subjected to 0.5 mM (P-776
sufficient) or 0 mM (P-deficient) phosphate in the form of KH2PO4 and 2 mM (N-sufficient) 777
or 0 mM (N-deficient) nitrate in the form of Ca(NO3)2. The nutrient solution was changed 778
once in every three days and for RNA extraction, total roots were harvested after 1 h, 2 h, 4 779
h and 24 h of transferring to the nutrient solution, snap-frozen in liquid nitrogen and stored 780
at -80 0C. The plant root measurements were taken after 7 days of treatment. Four – six of 781
18-da old wheat seedlings that were grown in nutrient solutions were used for in planta 782
nutrient content measurements. Nitrogen content was analyzed by combustion. Phosphorus 783
content was analyzed by ICPOES on samples open-vessel digested using 5:1 mixture of 784
nitric and perchloric acids. 785
786
RNA extraction and library preparation 787 788 Samples were collected in triplicate per treatment-time point combination and each sample 789
contained root tissue from four - six plants. Total RNA was extracted from 48 samples using 790
TRI-reagent (SIGMA-ALDRICH) according to manufacturer’s instruction. The RNA 791
samples were treated with DNase I (NEW ENGLAND BIOLABS) and poly-A RNA 792
selection was carried out using Dynabeads mRNA purification kit (THERMOFISHER 793
SCIENTIFIC) according to manufacturer’s instructions. RNA-Seq library preparation was 794
carried out using NEBNext Ultra RNAlibrary prep kit for Illumina (NEW ENGLAND 795
author/funder. All rights reserved. No reuse allowed without permission. The copyright holder for this preprint (which was not peer-reviewed) is the. https://doi.org/10.1101/551069doi: bioRxiv preprint

34
BIOLABS) and 48 RNA-Seq libraries were sequenced using 75x2 setting on Illumina 796
HiSeq2500 platform to obtain at least 20 million 75 bp paired end reads per sample (Table 797
S1). 798
799
RNA-Seq data analysis 800 801 Data pre-processing: 802
Each RNA-Seq library had more than 20 million reads and initial quality control was carried 803
out using FastQC package (Andrews, 2010). The libraries were pre-processed to remove 804
adapter sequences and low quality reads using Trimmomatic (Bolger et al. 2014). Wheat 805
transcript file was generated through RSEM (B. Li and Dewey 2011) using IWGSC wheat 806
RefSeqv1.0 genome assembly (161010_Chinese_Spring_v1.0_pseudomolecules.fasta) and 807
annotation (iwgsc_refseqv1.0_HighConf_2017Mar13.gff3) (International Wheat Genome 808
Sequencing Consortium (IWGSC) et al. 2018). Next, the transcripts were used to take the 809
read counts for each transcript/gene using Salmon – a quasi-mapping based algorithm (Patro 810
et al. 2017). The samples had average mapping percentage of 68% (Table S1). 811
812
Differential gene expression analysis: 813
Differential gene expression analysis was performed using DESeq2 version 1.18.1 (Love et 814
al. 2014) using a design formula (~time + treatment + treatment:time) that takes into account 815
the contrast between two treatment levels throughout the time course as well at a FDR<0.05. 816
A complete list of differentially expressed genes at each treatment-time point along with the 817
log fold change and adjusted P values is available in Table S8. The differentially expressed 818
gene lists were compared using BioVenn (Hulsen et al. 2008). For the non-redundant list of 819
differentially expressed genes, the z-score normalized variance stabilized expression values 820
were used to generate hierarchical clustering based heat map using pheatmap R package 821
(Kolde, 2013). 822
823
GO term enrichment analysis: 824
GO term analysis was carried out using BinGO app for Cytoscape (Maere et al. 2005) for a 825
custom made wheat GO term annotation database for IWGSCRefseqv1.0 (International 826
Wheat Genome Sequencing Consortium (IWGSC) et al. 2018). The most terminal GO terms 827
that are enriched in the hierarchy were considered for further analyses. Fold enrichment was 828
calculated as (x/X)/(n/N) where x is the number of genes (from the list) assigned to a GO 829
author/funder. All rights reserved. No reuse allowed without permission. The copyright holder for this preprint (which was not peer-reviewed) is the. https://doi.org/10.1101/551069doi: bioRxiv preprint

35
category, X is the total number of genes (in the gene list) that were assigned to any GO 830
category, n is the number of genes (in the genome) assigned to the considered GO category 831
and N is the total number of genes (in the genome) that were assigned to GO categories. 832
Over-represented GO terms at FDR < 0.05 were considered for further analyses. 833
834
Gene co-expression network analysis: 835
Variance stabilized count data of the expressed genes were considered and the genes were 836
ranked by variance of gene expression across all conditions. The top 8300 (top 10%) genes 837
were selected for gene co-expression network analysis using WGCNA package version 838
1.64.1 (Langfelder and Horvath 2008). Signed network with soft-thresholding power of 12 839
was generated. The co-expression network was visualized in Cytoscape version 3.5.1 840
(Shannon et al. 2003). GO term enrichment analysis for the selected modules was carried 841
out using BinGO app for Cytoscape (Maere et al. 2005). 842
843
Gene tree construction 844
The wheat orthologues for HRS1/HHO and TGA gene family members were identified by a 845
reciprocal tBLASTx search with a E value cutoff of 10-5.The amino acid sequences of the 846
HRS1/HHO and TGA gene family orthologues from Arabidopsis, rice and wheat were 847
aligned using ClustalW (Thompson et al. 1994) and phylogenetic tree construction was done 848
using maximum likelihood method (JTT matrix-based model) (Jones et al. 1992) for 1000 849
bootstrap replicates using the MEGA6.06 (Tamura et al. 2013). 850
851
Promoter motif analysis 852
For the considered genes in wheat, 1000 bp upstream region nucleotide sequences were 853
extracted and used for MEME algorithm for motif discovery (version 5.0.1) (Bailey et al. 854
2009) with default parameters and -nmotifs 30. The results from MEME motif search were 855
then used to run TOMTOM algorithm for motif comparison (version 5.0.1) (Bailey et al. 856
2009) against JASPAR non-redundant core plant PFM database (release 7, 2018) (Khan et 857
al. 2018). 858
To search for the conserved domains in putative wheat TGA family members, the amino 859
acid sequences were extracted for the TGA family members and these sequences were used 860
to perform MEME algorithm for motif discovery (version 5.0.1) (Bailey et al. 2009) with 861
protein sequence alphabet. 862
863
author/funder. All rights reserved. No reuse allowed without permission. The copyright holder for this preprint (which was not peer-reviewed) is the. https://doi.org/10.1101/551069doi: bioRxiv preprint
36
GENIE3 analysis 864
Variance stabilized count data of the expressed genes were considered and the genes were 865
ranked by variance of gene expression across all conditions. The top 8300 (top 10%) genes 866
were selected for GENIE3 analysis using GENIE3 version 1.4.0 (Huynh-Thu et al. 2010). 867
There were 389 genes that were annotated as transcription factors or transcription factor like 868
proteins with evidence from GO-, Pfam- or Interpro-IDs among the selected 8300 genes. 869
Random forest method was used to infer the network with default paramaters with gene 870
expression matrix for 8300 genes and a list of transcription factor genes as the input. The 871
regulatory relationships that had a weight measure >0.005 were considered for downstream 872
analyses which included GO term enrichment analysis (as described above) for predicted 873
target genes of TaHRS1, TaHHO5/6 and TaTGA9/10 and gene regulatory network 874
visualization using Cytoscape version 3.5.1 (Shannon et al. 2003). 875
876
Gene list overlaps 877
Fisher’s exact test for overlap between gene lists was performed through GeneOverlap R 878
package (Shen and Senai, 2013). Overlap was considered significant if the adjusted P value 879
< 0.05. 880
881
Author Contributions: M.T. and I.D. conceived the project. I.D. carried out the 882
experiments, collected the samples and prepared the RNA-Seq libraries. I.D. carried out data 883
analyses with contributions from J.R-M. I.D., J.R-M., S.B. and M.T. interpreted the data. 884
I.D. and M.T. wrote the manuscript with input from S.B. and J.R-M. 885
886
References 887
888 Abel, S. and Theologis, A. (1996). Early genes and auxin action. PLANT PHYSIOLOGY 889 111:9–17. 890
Álvarez, J.M., Riveras, E., Vidal, E.A., Gras, D.E., Contreras-López, O., Tamayo, K.P., 891 Aceituno, F., et al. (2014). Systems approach identifies TGA1 and TGA4 transcription 892 factors as important regulatory components of the nitrate response of Arabidopsis 893 thalianaroots. The Plant Journal 80:1–13. 894
Baek, D., Chun, H.J., Yun, D.-J. and Kim, M.C. (2017). Cross-talk between Phosphate 895 Starvation and Other Environmental Stress Signaling Pathways in Plants. Molecules and 896 cells 40:697–705. 897
Bailey, T.L., Boden, M., Buske, F.A., Frith, M., Grant, C.E., Clementi, L., Ren, J., et al. 898
author/funder. All rights reserved. No reuse allowed without permission. The copyright holder for this preprint (which was not peer-reviewed) is the. https://doi.org/10.1101/551069doi: bioRxiv preprint

37
(2009). MEME SUITE: tools for motif discovery and searching. Nucleic acids research 899 37:W202–8. 900
Balzergue, C., Dartevelle, T., Godon, C., Laugier, E., Meisrimler, C., Teulon, J.-M., Creff, 901 A., et al. (2017). Low phosphate activates STOP1-ALMT1 to rapidly inhibit root cell 902 elongation. Nature Communications 8:15300. 903
Banf, M. and Rhee, S.Y. (2017). Computational inference of gene regulatory networks: 904 Approaches, limitations and opportunities. BBA - Gene Regulatory Mechanisms 1860:41–905 52. 906
Beadle, N.C.W. (1953). The Edaphic Factor in Plant Ecology With a Special Note on Soil 907 Phosphates. Ecology 34:426–428. 908
Benfey, P.N. and Scheres, B. (2000). Root development. Current Biology 10:R813–5. 909
Bieleski, R.L. (1973). Phosphate Pools, Phosphate Transport, and Phosphate Availability. 910 Annual Review of Plant Physiology 24:225–252. 911
Bolger, A.M., Lohse, M. and Usadel, B. (2014). Trimmomatic: a flexible trimmer for 912 Illumina sequence data. Bioinformatics (Oxford, England) 30:2114–2120. 913
Bournier, M., Tissot, N., Mari, S., Boucherez, J., Lacombe, E., Briat, J.-F. and Gaymard, 914 F. (2013). Arabidopsis ferritin 1 (AtFer1) gene regulation by the phosphate starvation 915 response 1 (AtPHR1) transcription factor reveals a direct molecular link between iron and 916 phosphate homeostasis. The Journal of biological chemistry 288:22670–22680. 917
Brady, S.M., Song, S., Dhugga, K.S., Rafalski, J.A. and Benfey, P.N. (2006). Combining 918 Expression and Comparative Evolutionary Analysis. The COBRA Gene Family. PLANT 919 PHYSIOLOGY 143:172–187. 920
Briat, J.-F., Rouached, H., Tissot, N., Gaymard, F. and Dubos, C. (2015). Integration of P, 921 S, Fe, and Zn nutrition signals in Arabidopsis thaliana: potential involvement of 922 PHOSPHATE STARVATION RESPONSE 1 (PHR1). Frontiers in Plant Science 6:290–923 16. 924
Castaings, L., Camargo, A., Pocholle, D., Gaudon, V., Texier, Y., Boutet-Mercey, S., 925 Taconnat, L., et al. (2009). The nodule inception-like protein 7 modulates nitrate sensing 926 and metabolism in Arabidopsis. The Plant Journal 57:426–435. 927
Chevalier, F., Pata, M., Nacry, P., Doumas, P. and Rossignol, M. (2003). Effects of 928 phosphate availability on the root system architecture: large-scale analysis of the natural 929 variation between Arabidopsis accessions. Plant, Cell & Environment 26:1839–1850. 930
Chiou, T.-J. and Lin, S.-I. (2011). Signaling network in sensing phosphate availability in 931 plants. Annual review of plant biology 62:185–206. 932
Conte, S.S. and Walker, E.L. (2011). Transporters contributing to iron trafficking in plants. 933 Molecular Plant 4:464–476. 934
Crawford, N.M. and Glass, A.D.M. (1998). Molecular and physiological aspects of nitrate 935 uptake in plants. Trends in plant science 3:389–395. 936
author/funder. All rights reserved. No reuse allowed without permission. The copyright holder for this preprint (which was not peer-reviewed) is the. https://doi.org/10.1101/551069doi: bioRxiv preprint
38
De Smet, R. and Marchal, K. (2010). Advantages and limitations of current network 937 inference methods. Nature reviews. Microbiology 8:717–729. 938
Duan, K., Yi, K., Dang, L., Huang, H., Wu, W. and Wu, P. (2008). Characterization of a 939 sub-family of Arabidopsis genes with the SPX domain reveals their diverse functions in 940 plant tolerance to phosphorus starvation. The Plant Journal 54:965–975. 941
Fan, W. and Dong, X. (2002). In vivo interaction between NPR1 and transcription factor 942 TGA2 leads to salicylic acid-mediated gene activation in Arabidopsis. The Plant Cell 943 14:1377–1389. 944
Food and Agriculture Organization Statistics. Available at: 945 http://faostat3.fao.org/download/Q/QC/E. 946
Forde, B.G. (2014). Nitrogen signalling pathways shaping root system architecture: an 947 update. Current Opinion in Plant Biology 21:30–36. 948
Gatz, C. (2013). From Pioneers to Team Players: TGA Transcription Factors Provide a 949 Molecular Link Between Different Stress Pathways. Molecular plant-microbe interactions 950 : MPMI 26:151–159. 951
Giehl, R.F.H. and Wirén, von, N. (2014). Root nutrient foraging. PLANT PHYSIOLOGY 952 166:509–517. 953
Giehl, R.F.H., Gruber, B.D. and Wirén, von, N. (2013). It’s time to make changes: 954 modulation of root system architecture by nutrient signals. Journal of Experimental Botany 955 65:769–778. 956
Gruber, B.D., Giehl, R.F.H., Friedel, S. and Wirén, von, N. (2013). Plasticity of the 957 Arabidopsis root system under nutrient deficiencies. PLANT PHYSIOLOGY 163:161–179. 958
Gu, M., Chen, A., Sun, S. and Xu, G. (2016). Complex Regulation of Plant Phosphate 959 Transporters and the Gap between Molecular Mechanisms and Practical Application: What 960 Is Missing? Molecular Plant 9:396–416. 961
Guan, P. (2017). Dancing with Hormones: A Current Perspective of Nitrate Signaling and 962 Regulation in Arabidopsis. Frontiers in Plant Science 8:1697. 963
Gutiérrez-Alanís, D., Yong-Villalobos, L., Jiménez-Sandoval, P., Alatorre-Cobos, F., 964 Oropeza-Aburto, A., Mora-Macías, J., Sánchez-Rodríguez, F., et al. (2017). Phosphate 965 Starvation-Dependent Iron Mobilization Induces CLE14 Expression to Trigger Root 966 Meristem Differentiation through CLV2/PEPR2 Signaling. Developmental Cell 41:555–967 570.e3. 968
Hofmann, N.R. (2012). Nicotianamine in zinc and iron homeostasis. The Plant Cell 969 24:373–373. 970
Hulsen, T., de Vlieg, J. and Alkema, W. (2008). BioVenn - a web application for the 971 comparison and visualization of biological lists using area-proportional Venn diagrams. 972 BMC Genomics 9:488. 973
Huynh-Thu, V.A., Irrthum, A., Wehenkel, L. and Geurts, P. (2010). Inferring regulatory 974
author/funder. All rights reserved. No reuse allowed without permission. The copyright holder for this preprint (which was not peer-reviewed) is the. https://doi.org/10.1101/551069doi: bioRxiv preprint

39
networks from expression data using tree-based methods. Isalan, M. (ed.). PLoS ONE 975 5:e12776. 976
International Wheat Genome Sequencing Consortium (IWGSC), IWGSC RefSeq principal 977 investigators:, Keller, B., IWGSC whole-genome assembly principal investigators:, 978 Distelfeld, A., Eversole, K., Whole-genome sequencing and assembly:, et al. (2018). 979 Shifting the limits in wheat research and breeding using a fully annotated reference 980 genome. Science (New York, N.Y.) 361:eaar7191. 981
Jakoby, M., Weisshaar, B., Dröge-Laser, W., Vicente-Carbajosa, J., Tiedemann, J., Kroj, 982 T. and Parcy, F. (2002). bZIP transcription factors in Arabidopsis. Trends in plant science 983 7:106–111. 984
Jones, D.T., Taylor, W.R. and Thornton, J.M. (1992). The rapid generation of mutation 985 data matrices from protein sequences. Bioinformatics (Oxford, England) 8:275–282. 986
Kant, S., Peng, M. and Rothstein, S.J. (2011). Genetic regulation by NLA and 987 microRNA827 for maintaining nitrate-dependent phosphate homeostasis in arabidopsis. 988 PLoS Genetics 7:e1002021–11. 989
Kapulnik, Y. and Koltai, H. (2016). Fine-tuning by strigolactones of root response to low 990 phosphate. Journal of Integrative Plant Biology 58:203–212. 991
Kellermeier, F., Armengaud, P., Seditas, T.J., Danku, J., Salt, D.E. and Amtmann, A. 992 (2014). Analysis of the Root System Architecture of Arabidopsis Provides a Quantitative 993 Readout of Crosstalk between Nutritional Signals. The Plant Cell 26:1480–1496. 994
Khan, A., Fornes, O., Stigliani, A., Gheorghe, M., Castro-Mondragon, J.A., van der Lee, 995 R., Bessy, A., et al. (2018). JASPAR 2018: update of the open-access database of 996 transcription factor binding profiles and its web framework. Nucleic acids research 997 46:D1284–D1284. 998
Kiba, T., Inaba, J., Kudo, T., Ueda, N., Konishi, M., Mitsuda, N., Takiguchi, Y., Kondou, 999 Y., Yoshizumi, T., Ohme-Takagi, M., Matsui, M., Yano, K., Yanagisawa, S. and 1000 Sakakibara, H. (2018). Repression of Nitrogen Starvation Responses by Members of the 1001 Arabidopsis GARP-Type Transcription Factor NIGT1/HRS1 Subfamily. The Plant Cell 1002 30:925–945. 1003
Kieber, J.J. and Schaller, G.E. (2018). Cytokinin signaling in plant development. 1004 Development (Cambridge, England) 145:dev149344. 1005
Koen, E., Besson-Bard, A., Duc, C., Astier, J., Gravot, A., Richaud, P., Lamotte, O., et al. 1006 (2013). Arabidopsis thaliana nicotianamine synthase 4 is required for proper response to 1007 iron deficiency and to cadmium exposure. Plant science : an international journal of 1008 experimental plant biology 209:1–11. 1009
Krapp, A., David, L.C., Chardin, C., Girin, T., Marmagne, A., Leprince, A.-S., Chaillou, 1010 S., et al. (2014). Nitrate transport and signalling in Arabidopsis. Journal of Experimental 1011 Botany 65:789–798. 1012
Krouk, G. (2017). Hormones and nitrate: a two-way connection. Plant Molecular Biology 1013 91:599–606. 1014
author/funder. All rights reserved. No reuse allowed without permission. The copyright holder for this preprint (which was not peer-reviewed) is the. https://doi.org/10.1101/551069doi: bioRxiv preprint

40
Krouk, G., Mirowski, P., LeCun, Y., Shasha, D.E. and Coruzzi, G.M. (2010). Predictive 1015 network modeling of the high-resolution dynamic plant transcriptome in response to 1016 nitrate. Genome biology 11:R123. 1017
Kumar, R.K., Chu, H.-H., Abundis, C., Vasques, K., Rodriguez, D.C., Chia, J.-C., Huang, 1018 R., et al. (2017). Iron-Nicotianamine Transporters Are Required for Proper Long Distance 1019 Iron Signaling. PLANT PHYSIOLOGY 175:1254–1268. 1020
Landrein, B., Formosa-Jordan, P., Malivert, A., Schuster, C., Melnyk, C.W., Yang, W., 1021 Turnbull, C., et al. (2018). Nitrate modulates stem cell dynamics in Arabidopsis shoot 1022 meristems through cytokinins. Proceedings of the National Academy of Sciences of the 1023 United States of America 115:1382–1387. 1024
Langfelder, P. and Horvath, S. (2008). WGCNA: an R package for weighted correlation 1025 network analysis. BMC bioinformatics 9:559. 1026
Lavenus, J., Goh, T., Roberts, I., Guyomarc’h, S., Lucas, M., De Smet, I., Fukaki, H., et al. 1027 (2013). Lateral root development in Arabidopsis: fifty shades of auxin. Trends in plant 1028 science 18:450–458. 1029
Lebel, E., Heifetz, P., Thorne, L., Uknes, S., Ryals, J. and Ward, E. (1998). Functional 1030 analysis of regulatory sequences controlling PR-1 gene expression in Arabidopsis. The 1031 Plant Journal 16:223–233. 1032
Lee, I., Ambaru, B., Thakkar, P., Marcotte, E.M. and Rhee, S.Y. (2010). Rational 1033 association of genes with traits using a genome-scale gene network for Arabidopsis 1034 thaliana. Nature biotechnology 28:149–156. 1035
Li, B. and Dewey, C.N. (2011). RSEM: accurate transcript quantification from RNA-Seq 1036 data with or without a reference genome. BMC bioinformatics 12:323. 1037
Li, W.-F., Perry, P.J., Prafulla, N.N. and Schmidt, W. (2010). Ubiquitin-specific protease 1038 14 (UBP14) is involved in root responses to phosphate deficiency in Arabidopsis. 1039 Molecular Plant 3:212–223. 1040
Liu, H., Yang, H., Wu, C., Feng, J., Liu, X., Qin, H. and Wang, D. (2009). Overexpressing 1041 HRS1 confers hypersensitivity to low phosphate-elicited inhibition of primary root growth 1042 in Arabidopsis thaliana. Journal of Integrative Plant Biology 51:382–392. 1043
Liu, J., Yang, L., Luan, M., Wang, Y., Zhang, C., Zhang, B., Shi, J., et al. (2015). A 1044 vacuolar phosphate transporter essential for phosphate homeostasis in Arabidopsis. 1045 Proceedings of the National Academy of Sciences of the United States of America 1046 112:E6571–8. 1047
Liu, K.-H., Niu, Y., Konishi, M., Wu, Y., Du, H., Chung, H.S., Li, L., et al. (2017). 1048 Discovery of nitrate–CPK–NLP signalling in central nutrient–growth networks. Nature 1049 Publishing Group 545:311–316. 1050
Love, M.I., Huber, W. and Anders, S. (2014). Moderated estimation of fold change and 1051 dispersion for RNA-seq data with DESeq2. Genome biology 15:550. 1052
Maeda, Y., Konishi, M., Kiba, T., Sakuraba, Y., Sawaki, N., Kurai, T., Ueda, Y., et al. 1053
author/funder. All rights reserved. No reuse allowed without permission. The copyright holder for this preprint (which was not peer-reviewed) is the. https://doi.org/10.1101/551069doi: bioRxiv preprint

41
(2018). A NIGT1-centred transcriptional cascade regulates nitrate signalling and 1054 incorporates phosphorus starvation signals in Arabidopsis. Nature Communications:1–14. 1055
Maere, S., Heymans, K. and Kuiper, M. (2005). BiNGO: a Cytoscape plugin to assess 1056 overrepresentation of gene ontology categories in biological networks. Bioinformatics 1057 (Oxford, England) 21:3448–3449. 1058
Marchive, C., Roudier, F., Castaings, L., Bréhaut, V., Blondet, E., Colot, V., Meyer, C., et 1059 al. (2013). Nuclear retention of the transcription factor NLP7 orchestrates the early 1060 response to nitrate in plants. Nature Communications 4:1713–9. 1061
Marcussen, T., Sandve, S.R., Heier, L., Spannagl, M., Pfeifer, M., International Wheat 1062 Genome Sequencing Consortium,, Jakobsen, K.S., et al. (2014). Ancient hybridizations 1063 among the ancestral genomes of bread wheat. Science (New York, N.Y.) 345:1250092–1064 1250092. 1065
Marschner, H. (2011). Marschner's Mineral Nutrition of Higher Plants. 3rd ed. Academic 1066 Press. 1067
McClure, B.A., Hagen, G., Brown, C.S., Gee, M.A. and Guilfoyle, T.J. (1989). 1068 Transcription, organization, and sequence of an auxin-regulated gene cluster in soybean. 1069 The Plant Cell 1:229–239. 1070
Medici, A., Marshall-Colon, A., Ronzier, E., Szponarski, W., Wang, R., Gojon, A., 1071 Crawford, N.M., et al. (2015). AtNIGT1/HRS1 integrates nitrate and phosphate signals at 1072 the Arabidopsis root tip. Nature Communications 6:1–11. 1073
Mora-Macías, J., Ojeda-Rivera, J.O., Gutiérrez-Alanís, D., Yong-Villalobos, L., Oropeza-1074 Aburto, A., Raya-González, J., Jiménez-Domínguez, G., et al. (2017). Malate-dependent 1075 Fe accumulation is a critical checkpoint in the root developmental response to low 1076 phosphate. Proceedings of the National Academy of Sciences 114:E3563–E3572. 1077
Nilsson, L., Müller, R. and Nielsen, T.H. (2007). Increased expression of the MYB-related 1078 transcription factor, PHR1, leads to enhanced phosphate uptake in Arabidopsis thaliana. 1079 Plant, Cell & Environment 30:1499–1512. 1080 1081
Niu, Y.F., Chai, R.S., Jin, G.L., Wang, H., Tang, C.X. and Zhang, Y.S. (2013). Responses 1082 of root architecture development to low phosphorus availability: a review. Annals of 1083 botany 112:391–408. 1084
Obayashi, T., Aoki, Y., Tadaka, S., Kagaya, Y. and Kinoshita, K. (2018). ATTED-II in 1085 2018: A Plant Coexpression Database Based on Investigation of the Statistical Property of 1086 the Mutual Rank Index. Plant and Cell Physiology 59:440–440. 1087
Pal, S., Kisko, M., Dubos, C., Lacombe, B., Berthomieu, P., Krouk, G. and Rouached, H. 1088 (2017). TransDetect identifies a new regulatory module controlling phosphate 1089 accumulation. PLANT PHYSIOLOGY:pp.00568.2017–11. 1090
Patro, R., Duggal, G., Love, M.I., Irizarry, R.A. and Kingsford, C. (2017). Salmon 1091 provides fast and bias-aware quantification of transcript expression. Nature methods 1092 14:417–419. 1093
author/funder. All rights reserved. No reuse allowed without permission. The copyright holder for this preprint (which was not peer-reviewed) is the. https://doi.org/10.1101/551069doi: bioRxiv preprint

42
Péret, B., Desnos, T., Jost, R., Kanno, S., Berkowitz, O. and Nussaume, L. (2014). Root 1094 architecture responses: in search of phosphate. PLANT PHYSIOLOGY 166:1713–1723. 1095
Pfeifer, M., Kugler, K.G., Sandve, S.R., Zhan, B., Rudi, H., Hvidsten, T.R., International 1096 Wheat Genome Sequencing Consortium,, et al. (2014). Genome interplay in the grain 1097 transcriptome of hexaploid bread wheat. Science (New York, N.Y.) 345:1250091–1250091. 1098
Piñeros, M.A., Cançado, G.M.A. and Kochian, L.V. (2008). Novel properties of the wheat 1099 aluminum tolerance organic acid transporter (TaALMT1) revealed by electrophysiological 1100 characterization in Xenopus Oocytes: functional and structural implications. PLANT 1101 PHYSIOLOGY 147:2131–2146. 1102
Powell, J.J., Fitzgerald, T.L., Stiller, J., Berkman, P.J., Gardiner, D.M., Manners, J.M., 1103 Henry, R.J., et al. (2017). The defence-associated transcriptome of hexaploid wheat 1104 displays homoeolog expression and induction bias. Plant biotechnology journal 15:533–1105 543. 1106
Puga, M.I., Mateos, I., Charukesi, R., Wang, Z., Franco-Zorrilla, J.M., de Lorenzo, L., 1107 Irigoyen, M.L., et al. (2014). SPX1 is a phosphate-dependent inhibitor of PHOSPHATE 1108 STARVATION RESPONSE 1 in Arabidopsis. Proceedings of the National Academy of 1109 Sciences 111:14947–14952. 1110
Roudier, F. (2002). The COBRA Family of Putative GPI-Anchored Proteins in 1111 Arabidopsis. A New Fellowship in Expansion. PLANT PHYSIOLOGY 130:538–548. 1112
Rubin, G., Tohge, T., Matsuda, F., Saito, K. and Scheible, W.-R. (2009). Members of the 1113 LBD family of transcription factors repress anthocyanin synthesis and affect additional 1114 nitrogen responses in Arabidopsis. The Plant Cell 21:3567–3584. 1115
Ruffel, S., Krouk, G., Ristova, D., Shasha, D., Birnbaum, K.D. and Coruzzi, G.M. (2011). 1116 Nitrogen economics of root foraging: transitive closure of the nitrate-cytokinin relay and 1117 distinct systemic signaling for N supply vs. demand. Proceedings of the National Academy 1118 of Sciences of the United States of America 108:18524–18529. 1119
Ruffel, S., Poitout, A., Krouk, G., Coruzzi, G.M. and Lacombe, B. (2016). Long-distance 1120 nitrate signaling displays cytokinin dependent and independent branches. Journal of 1121 Integrative Plant Biology 58:226–229. 1122
Sakakibara, H., Takei, K. and Hirose, N. (2006). Interactions between nitrogen and 1123 cytokinin in the regulation of metabolism and development. Trends in plant science 1124 11:440–448. 1125
Sawaki, N., Tsujimoto, R., Shigyo, M., Konishi, M., Toki, S., Fujiwara, T. and 1126 Yanagisawa, S. (2013). A Nitrate-Inducible GARP Family Gene Encodes an Auto-1127 Repressible Transcriptional Repressor in Rice. Plant and Cell Physiology 54:506–517. 1128
Schachtman, D., Reid, R. and Ayling, S. (1998). Phosphorus Uptake by Plants: From Soil 1129 to Cell. PLANT PHYSIOLOGY 116:447–453. 1130
Scheible, W.-R., Morcuende, R., Czechowski, T., Fritz, C., Osuna, D., Palacios-Rojas, N., 1131 Schindelasch, D., et al. (2004). Genome-wide reprogramming of primary and secondary 1132 metabolism, protein synthesis, cellular growth processes, and the regulatory infrastructure 1133
author/funder. All rights reserved. No reuse allowed without permission. The copyright holder for this preprint (which was not peer-reviewed) is the. https://doi.org/10.1101/551069doi: bioRxiv preprint

43
of Arabidopsis in response to nitrogen. PLANT PHYSIOLOGY 136:2483–2499. 1134
Schindelman, G., Morikami, A., Jung, J., Baskin, T.I., Carpita, N.C., Derbyshire, P., 1135 McCann, M.C. and Benfey, P.N. (2001). COBRA encodes a putative GPI-anchored 1136 protein, which is polarly localized and necessary for oriented cell expansion in 1137 Arabidopsis. :1–14. 1138
Schuler, M., Rellán-Álvarez, R., Fink-Straube, C., Abadía, J. and Bauer, P. (2012). 1139 Nicotianamine Functions in the Phloem-Based Transport of Iron to Sink Organs, in Pollen 1140 Development and Pollen Tube Growth in Arabidopsis. The Plant Cell 24:2380–2400. 1141
Secco, D., Jabnoune, M., Walker, H., Shou, H., Wu, P., Poirier, Y. and Whelan, J. (2013). 1142 Spatio-Temporal Transcript Profiling of Rice Roots and Shoots in Response to Phosphate 1143 Starvation and Recovery. The Plant Cell 25:4285–4304. 1144
Shahzad, Z. and Amtmann, A. (2017). Food for thought: how nutrients regulate root 1145 system architecture. Current Opinion in Plant Biology 39:80–87. 1146
Shahzad, Z., Kellermeier, F., Armstrong, E.M., Rogers, S., Lobet, G., Amtmann, A. and 1147 Hills, A. (2018). EZ-Root-VIS: A Software Pipeline for the Rapid Analysis and Visual 1148 Reconstruction of Root System Architecture. PLANT PHYSIOLOGY 177:1368–1381. 1149
Shannon, P., Markiel, A., Ozier, O., Baliga, N.S., Wang, J.T., Ramage, D., Amin, N., et al. 1150 (2003). Cytoscape: a software environment for integrated models of biomolecular 1151 interaction networks. Genome Research 13:2498–2504. 1152
Li Shen and Mount Sinai (2013). GeneOverlap: Test and visualize gene overlaps. R 1153 package version 1.8.0. http://shenlab-sinai.github.io/shenlab-sinai/ 1154
Shukla, D., Rinehart, C.A. and Sahi, S.V. (2017). Comprehensive study of excess 1155 phosphate response reveals ethylene mediated signaling that negatively regulates plant 1156 growth and development. Nature Publishing Group 7:3074. 1157
Smith, S. and De Smet, I. (2012). Root system architecture: insights from Arabidopsis and 1158 cereal crops. Philosophical transactions of the Royal Society of London. Series B, 1159 Biological sciences 367:1441–1452. 1160
Subramaniam, R., Desveaux, D., Spickler, C., Michnick, S.W. and Brisson, N. (2001). 1161 Direct visualization of protein interactions in plant cells. Nature biotechnology 19:769–1162 772. 1163
Sun, H., Tao, J., Liu, S., Huang, S., Chen, S., Xie, X., Yoneyama, K., et al. (2014). 1164 Strigolactones are involved in phosphate- and nitrate-deficiency-induced root development 1165 and auxin transport in rice. Journal of Experimental Botany 65:6735–6746. 1166
Takahashi, M., Terada, Y., Nakai, I., Nakanishi, H., Yoshimura, E., Mori, S. and 1167 Nishizawa, N.K. (2003). Role of Nicotianamine in the Intracellular Delivery of Metals and 1168 Plant Reproductive Development. Plant Cell 15:1263. 1169
Tamura, K., Stecher, G., Peterson, D., Filipski, A. and Kumar, S. (2013). MEGA6: 1170 Molecular Evolutionary Genetics Analysis version 6.0. Molecular biology and evolution 1171 30:2725–2729. 1172
author/funder. All rights reserved. No reuse allowed without permission. The copyright holder for this preprint (which was not peer-reviewed) is the. https://doi.org/10.1101/551069doi: bioRxiv preprint

44
Thompson, J.D., Higgins, D.G. and Gibson, T.J. (1994). CLUSTAL W: improving the 1173 sensitivity of progressive multiple sequence alignment through sequence weighting, 1174 position-specific gap penalties and weight matrix choice. Nucleic acids research 22:4673–1175 4680. 1176
Tian, H., De Smet, I. and Ding, Z. (2014). Shaping a root system: regulating lateral versus 1177 primary root growth. Trends in plant science 19:426–431. 1178
Tilman, D., Cassman, K.G., Matson, P.A., Naylor, R. and Polasky, S. (2002). Agricultural 1179 sustainability and intensive production practices. Nature 418:671–677. 1180
Usadel, B., Obayashi, T., Mutwil, M., Giorgi, F.M., Bassel, G.W., Tanimoto, M., Chow, 1181 A., et al. (2009). Co-expression tools for plant biology: opportunities for hypothesis 1182 generation and caveats. Plant, Cell & Environment 32:1633–1651. 1183
Vance, C.P. (2001). Symbiotic nitrogen fixation and phosphorus acquisition. Plant 1184 nutrition in a world of declining renewable resources. PLANT PHYSIOLOGY 127:390–1185 397. 1186
Wang, C., Yue, W., Ying, Y., Wang, S., Secco, D., Liu, Y., Whelan, J., et al. (2015). Rice 1187 SPX-Major Facility Superfamily3, a Vacuolar Phosphate Efflux Transporter, Is Involved 1188 in Maintaining Phosphate Homeostasis in Rice. PLANT PHYSIOLOGY 169:2822–2831. 1189
Wang, R., Guegler, K., LaBrie, S.T. and Crawford, N.M. (2000). Genomic analysis of a 1190 nutrient response in Arabidopsis reveals diverse expression patterns and novel metabolic 1191 and potential regulatory genes induced by nitrate. The Plant Cell 12:1491–1509. 1192
Wang, R., Okamoto, M., Xing, X. and Crawford, N.M. (2003). Microarray analysis of the 1193 nitrate response in Arabidopsis roots and shoots reveals over 1,000 rapidly responding 1194 genes and new linkages to glucose, trehalose-6-phosphate, iron, and sulfate metabolism. 1195 PLANT PHYSIOLOGY 132:556–567. 1196
Waters, B.M., Chu, H.-H., Didonato, R.J., Roberts, L.A., Eisley, R.B., Lahner, B., Salt, 1197 D.E., et al. (2006). Mutations in Arabidopsis yellow stripe-like1 and yellow stripe-like3 1198 reveal their roles in metal ion homeostasis and loading of metal ions in seeds. PLANT 1199 PHYSIOLOGY 141:1446–1458. 1200
Wiren N, von, Klair, S., Bansal, S., Briat, J., Khodr, H., Shioiri, T., Leigh, R., et al. (1999). 1201 Nicotianamine chelates both FeIII and FeII. Implications for metal transport in plants. 1202 PLANT PHYSIOLOGY 119:1107–1114. 1203
Wolfe, C.J., Kohane, I.S. and Butte, A.J. (2005). Systematic survey reveals general 1204 applicability of ‘guilt-by-association’ within gene coexpression networks. BMC 1205 bioinformatics 6:227. 1206
Yu, P., Gutjahr, C., Li, C. and Hochholdinger, F. (2016). Genetic Control of Lateral Root 1207 Formation in Cereals. Trends in plant science 21:951–961. 1208
Zhang, W.-H., Ryan, P.R., Sasaki, T., Yamamoto, Y., Sullivan, W. and Tyerman, S.D. 1209 (2008). Characterization of the TaALMT1 Protein as an Al3+-Activated Anion Channel in 1210 Transformed Tobacco (Nicotiana tabacum L.) Cells. Plant and Cell Physiology 49:1316–1211 1330. 1212
author/funder. All rights reserved. No reuse allowed without permission. The copyright holder for this preprint (which was not peer-reviewed) is the. https://doi.org/10.1101/551069doi: bioRxiv preprint

45
Zhang, X., Davidson, E.A., Mauzerall, D.L., Searchinger, T.D., Dumas, P. and Shen, Y. 1213 (2015). Managing nitrogen for sustainable development. Nature 528:51–59. 1214
1215
Supplementary Figures 1216
1217
1218
1219
1220
PN_Roo
t
pn_R
oot
PN_Sho
ot
pn_S
hoot
0
1
2
3
4
5
Samples
Nitr
ogen
[% d
ry w
eigh
t]
****
****
PN_Roo
t
pn_R
oot
PN_Sho
ot
pn_S
hoot
0.0
0.5
1.0
1.5
Samples
Pho
spho
rus
[% d
ry w
eigh
t]
***
***
A B
Figure S1. (A) Nitrogen and (B) Phosphorus content (as a percentage of dry weight) in 11 days old wheat roots and shoots that were grown in deionized water (pn) or full strength nutrient solution (PN: 2 mM nitrate and 0.5 mM phosphate) (n=3, error bars indicate standard error of mean, significance P<0.05).
author/funder. All rights reserved. No reuse allowed without permission. The copyright holder for this preprint (which was not peer-reviewed) is the. https://doi.org/10.1101/551069doi: bioRxiv preprint
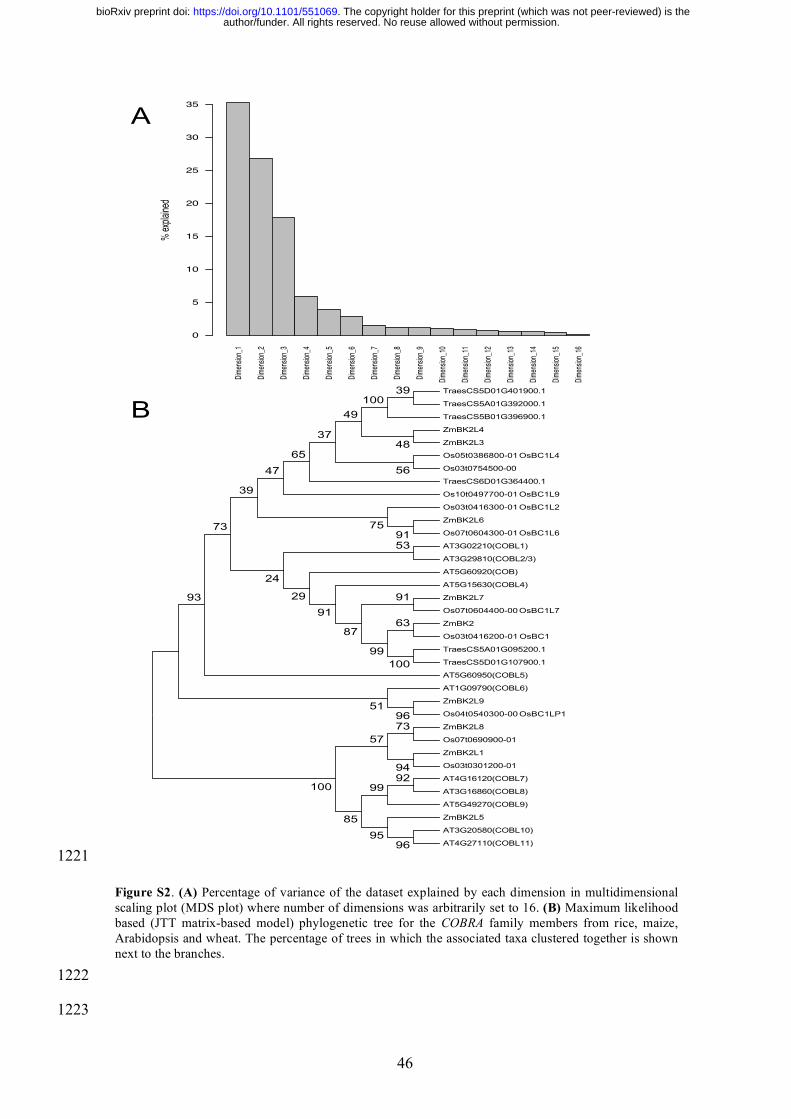
46
1221
1222
1223
Dimen
sion_
1
Dimen
sion_
2
Dimen
sion_
3
Dimen
sion_
4
Dimen
sion_
5
Dimen
sion_
6
Dimen
sion_
7
Dimen
sion_
8
Dimen
sion_
9
Dimen
sion_
10
Dimen
sion_
11
Dimen
sion_
12
Dimen
sion_
13
Dimen
sion_
14
Dimen
sion_
15
Dimen
sion_
16
Eigenvalues − Percentage Explained
% exp
lained
0
5
10
15
20
25
30
35
TraesCS5D01G401900.1
TraesCS5A01G392000.1
TraesCS5B01G396900.1
ZmBK2L4
ZmBK2L3
Os05t0386800-01 OsBC1L4
Os03t0754500-00
TraesCS6D01G364400.1
Os10t0497700-01 OsBC1L9
Os03t0416300-01 OsBC1L2
ZmBK2L6
Os07t0604300-01 OsBC1L6
AT3G02210(COBL1)
AT3G29810(COBL2/3)
AT5G60920(COB)
AT5G15630(COBL4)
ZmBK2L7
Os07t0604400-00 OsBC1L7
ZmBK2
Os03t0416200-01 OsBC1
TraesCS5A01G095200.1
TraesCS5D01G107900.1
AT5G60950(COBL5)
AT1G09790(COBL6)
ZmBK2L9
Os04t0540300-00 OsBC1LP1
ZmBK2L8
Os07t0690900-01
ZmBK2L1
Os03t0301200-01
AT4G16120(COBL7)
AT3G16860(COBL8)
AT5G49270(COBL9)
ZmBK2L5
AT3G20580(COBL10)
AT4G27110(COBL11)
100
96
96
95
9492
99
91
91
85
75
73
63
99
87
91
57
100
56
53
51
93
48
39100
49
37
6547
39
29
24
73
A
B
Figure S2. (A) Percentage of variance of the dataset explained by each dimension in multidimensional scaling plot (MDS plot) where number of dimensions was arbitrarily set to 16. (B) Maximum likelihood based (JTT matrix-based model) phylogenetic tree for the COBRA family members from rice, maize, Arabidopsis and wheat. The percentage of trees in which the associated taxa clustered together is shown next to the branches.
author/funder. All rights reserved. No reuse allowed without permission. The copyright holder for this preprint (which was not peer-reviewed) is the. https://doi.org/10.1101/551069doi: bioRxiv preprint

47
1224
1225
1226
B
C
A
Figure S3. (A) The amino acid sequence alignment for AtHRS1, OsNIGT1 and members of wheat HRS1/HHO family; the conserved G2-like DNA binding domain is indicated with the black bar. (B) The amino acid sequence alignment for AtTGA1, AtTGA4, AtTGA9 and wheat orthologues for TGA1/4 and TGA9/10; the conserved bZIP_1 signature domain is indicated with the black bar. (C) The most enriched motif in putative TaTGA family members.
author/funder. All rights reserved. No reuse allowed without permission. The copyright holder for this preprint (which was not peer-reviewed) is the. https://doi.org/10.1101/551069doi: bioRxiv preprint

48
1227
1228
1229
TraesCS5B01G265300 TraesCS5D01G273500 TraesCS5A01G265600 Os09g0489500 AT5G06839 AtTGA10 Os09g0280500 TraesCS5A01G174200 TraesCS5D01G178800 Os06g0614100 Os02g0194900 TraesCS6D01G154400 TraesCS6A01G165800 TraesCS6B01G193200 AT1G08320 AtTGA9 TraesCS3A01G372400 TraesCS3D01G365200 TraesCS3B01G404800 Os01g0859500 TraesCS1B01G285800 TraesCS1D01G276100 TraesCS1A01G276600 Os05g0443900 Os11g0152700 Os12g0152900 TraesCS4A01G183400 TraesCS4B01G135000 TraesCS4D01G129900 AT5G65210 AtTGA1 AT5G10030 AtTGA4 AT1G22070 AtTGA3 AT1G77920 AtTGA7 Os04g0637000 Os08g0176900 TraesCS2D01G529000 TraesCS2A01G526300 TraesCS2B01G556600 Os05g0492000 TraesCS1D01G105300 TraesCS1A01G096300 TraesCS1B01G127400 AT5G06950 AtTGA2 AT3G12250 AtTGA6 AT5G06960 AtTGA5 Os03g0318600 Os07g0687700 TraesCS4A01G126300 TraesCS4D01G180200 TraesCS4B01G178600 TraesCS2B01G113200 TraesCS2D01G096800 TraesCS2A01G097500 Os01g0279900 TraesCS3A01G190700 TraesCS3B01G220400 TraesCS3D01G194800 TraesCS3B01G365100 TraesCS3D01G327600 TraesCS3A01G334100 Os01g0808100 AT1G68640 AtTGA8 PAN Os01g0882200 Os10g0566200 Os06g0265400 TraesCS7B01G114300 TraesCS7D01G209800 TraesCS7A01G207100 SELMODRAFT 231689 EFJ28227
99
98
9697
89
80
7791
7377
6999
82
6980
9879
61
5995
69
55
53
5087
98
39
3942
58
36
48
3596
91
35
3499
68
86
3398
76
30
30
1929
18
18
17
17
41
43
39
27
16
1553
19
13
15
8
6
7
PN_1h
pN_1h
Pn_1h
pn_1h
PN_2h
pN_2h
PN_4h
pN_4h
PN_24h
pN_24h
Pn_2h
pn_2h
Pn_4h
pn_4h
Pn_24h
pn_24h
TaTGA9/10
Figure S4. Maximum likelihood based (JTT matrix-based model) phylogenetic tree for the TGA family orthologues from rice, Arabidopsis and wheat along with gene expression patterns of wheat orthologues; genes in red boxes were assigned to brown module in WGCNA.
author/funder. All rights reserved. No reuse allowed without permission. The copyright holder for this preprint (which was not peer-reviewed) is the. https://doi.org/10.1101/551069doi: bioRxiv preprint

49
1230
1231
1232
1233
Targets
19411
DEG & co-expressed
115
Targets
251503
DEG & co-expressed
109
TaHRS1 TaHHO5/6
0 2 4 6 8 10 12 14 16
AP2-MBDlike
ARF
ARR-B
B3
BBR-BPC
bHLH
bZIP
C2H2
CPP
Dof
ERF
FAR
G2-like
HD-ZIP
MADSbox
MYB
MYB-related
NAC
Trihelix
WRKY
ZF-HD
TFfamilydistribution amongTaHHO5/6TFBM
A
C
B
Figure S5. The overlap between targets predicted by GENIE3 with genes that are both differentially expressed and co-expressed with, (A) TaHRS1 or (B) TaHHO5/6. (C) Distribution of TaHHO5/6 transcription factor binding motifs (TFBM) based on transcription factor (TF) family.
author/funder. All rights reserved. No reuse allowed without permission. The copyright holder for this preprint (which was not peer-reviewed) is the. https://doi.org/10.1101/551069doi: bioRxiv preprint
Recommended