81
67
7
traffic review 2008

The 2008 Traffic Review provides an extensive overview of Amsterdam Airport Schiphol’s key traffic and transport figures. For more information about previous years, please visitour website www.schipholgroup.com
Data from this publication may be published provided the source is quoted.
February 2009
Foreword

Traffic Review 2008
Contents
0203
Summary .................................................................................................................................................. 4
Traffic and transport summary ........................................................................................................ 6
Traffic and transport summary per continent .......................................................................... 7
Air transport movements ............................................................................................... 8
Air transport movements, monthly and annual totals ..................................................... 10
Air transport movements, per hour of the day ................................................................... 11
Punctuality of passenger services ................................................................................................ 11
Air transport movements, main countries .............................................................................. 12
Origins and destinations Europe .................................................................................................. 14
Origins and destinations intercontinental .............................................................................. 16
Air transport movements per type ............................................................................................. 18
Air transport movements, main airlines ................................................................................... 20
New airlines ............................................................................................................................................. 21
Passengers ......................................................................................................................................... 22
Passengers, monthly and annual totals .................................................................................... 24
Passengers, main countries ............................................................................................................. 25
Passengers, main origins and destinations ............................................................................. 26
Passenger profile ................................................................................................................................. 27
Cargo .......................................................................................................................................................... 28
Cargo, monthly and annual totals .............................................................................................. 30
Cargo, main origins and destinations ........................................................................................ 31
Other airports ............................................................................................................................... 32
Other airports, annual totals ......................................................................................................... 33
Infrastructure ................................................................................................................................... 34
Definitions .............................................................................................................................................. 36
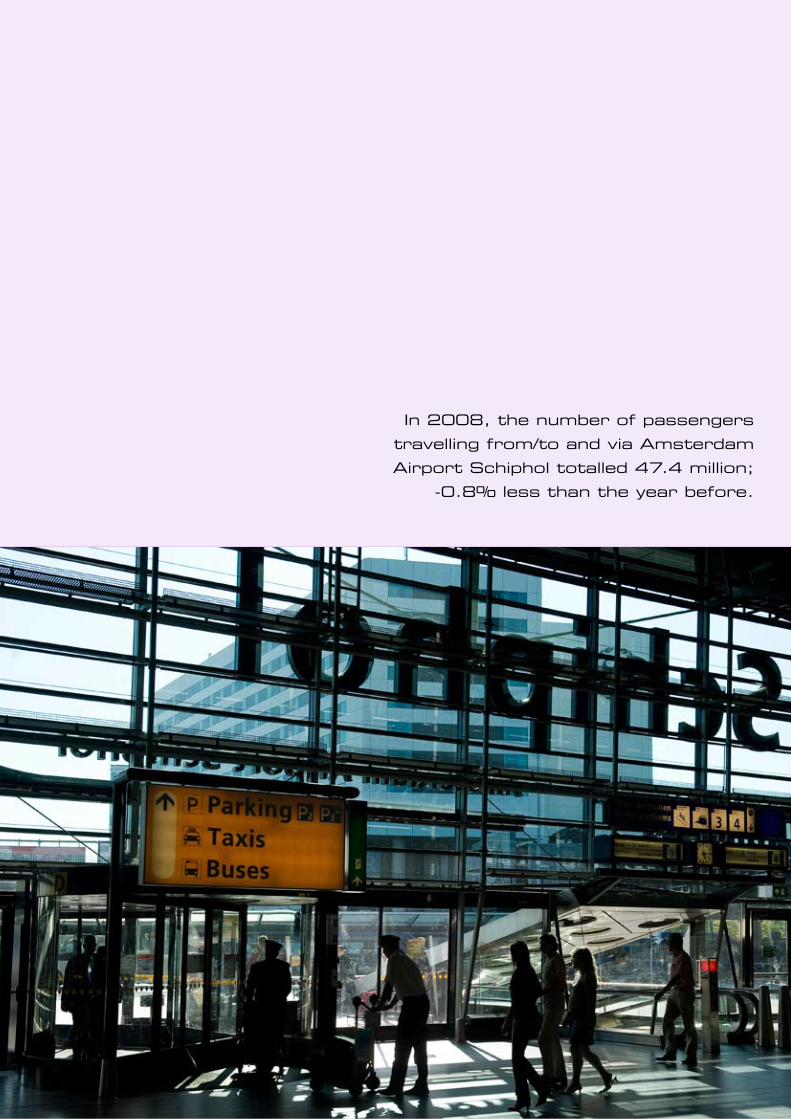
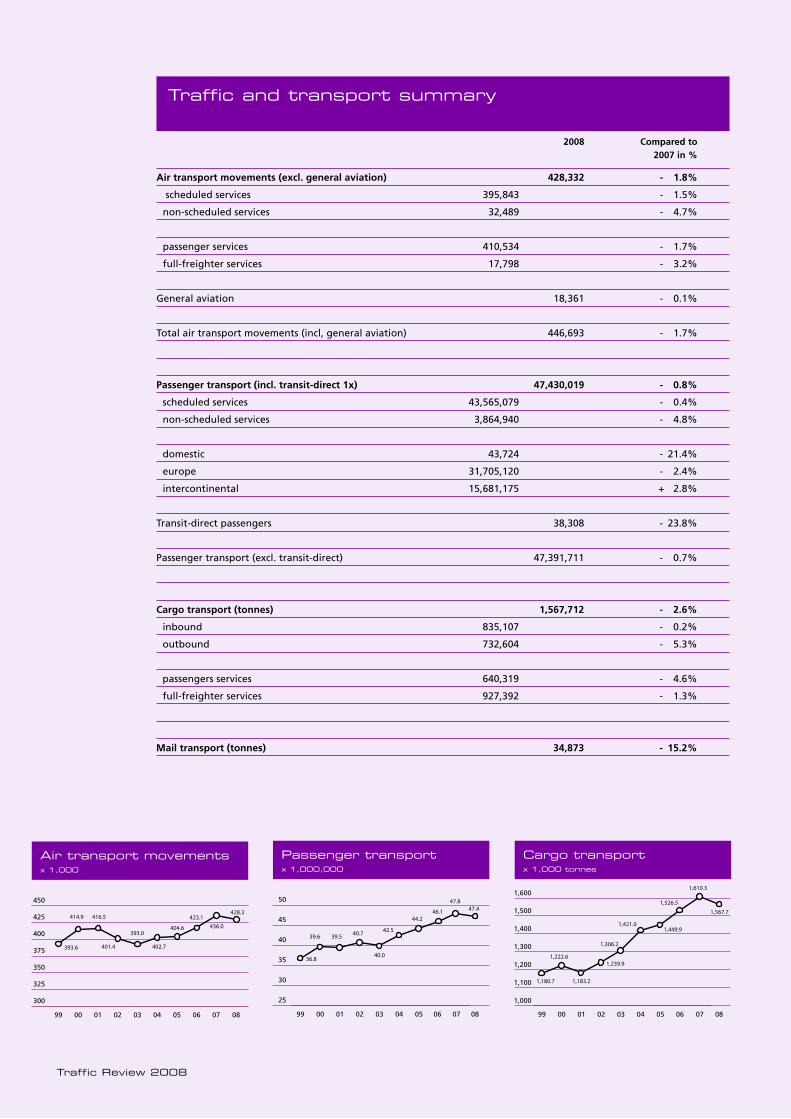
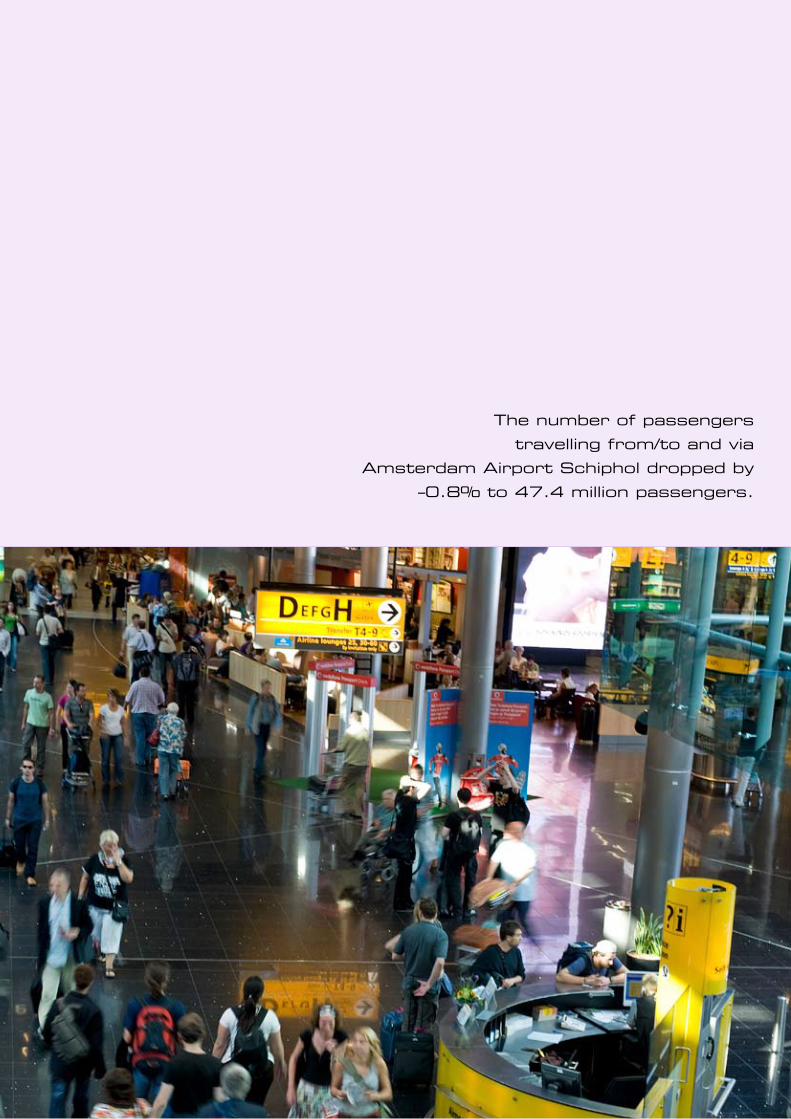
In 2008, the number of passengers travelling from/to and via Amsterdam Airport Schiphol totalled 47.4 million;
-0.8% less than the year before.
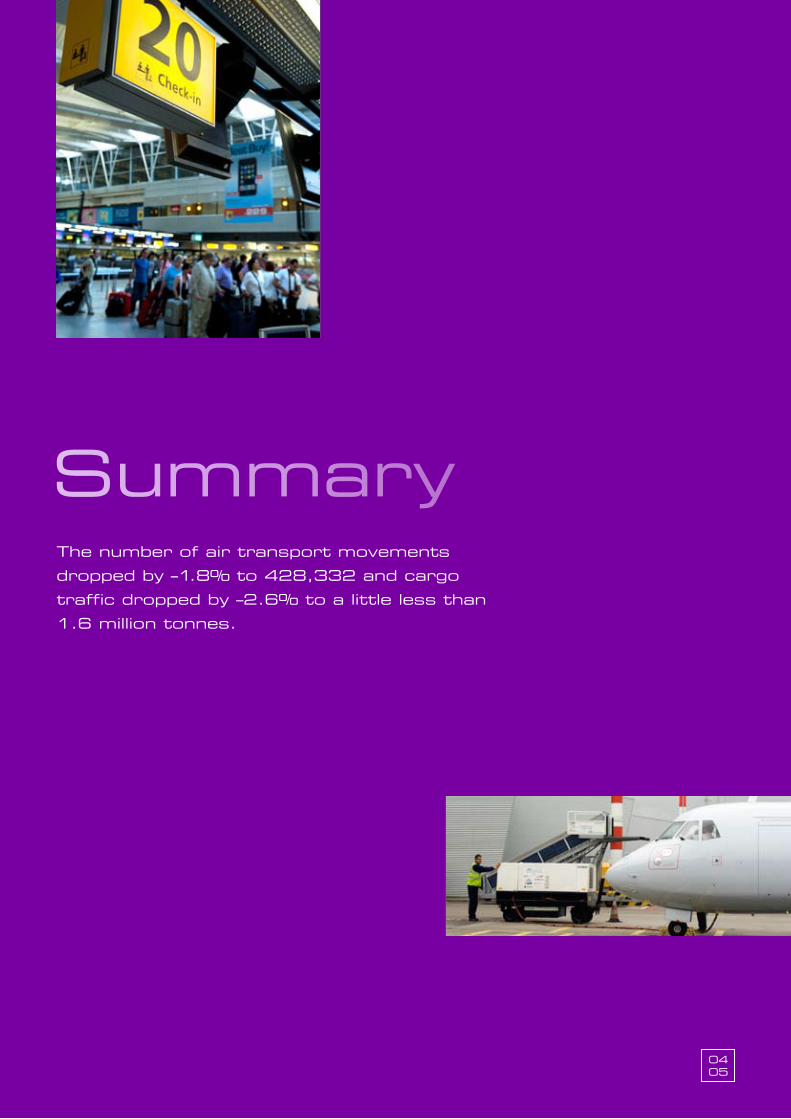
The number of air transport movements dropped by –1.8% to 428,332 and cargo traffic dropped by –2.6% to a little less than 1.6 million tonnes.
0405
Summary
2008 Compared to 2007 in %
Air transport movements (excl. general aviation) 428,332 - 1.8%
scheduled services 395,843 - 1.5%
non-scheduled services 32,489 - 4.7%
passenger services 410,534 - 1.7%
full-freighter services 17,798 - 3.2%
General aviation 18,361 - 0.1%
Total air transport movements (incl, general aviation) 446,693 - 1.7%
Passenger transport (incl. transit-direct 1x) 47,430,019 - 0.8%
scheduled services 43,565,079 - 0.4%
non-scheduled services 3,864,940 - 4.8%
domestic 43,724 - 21.4%
europe 31,705,120 - 2.4%
intercontinental 15,681,175 + 2.8%
Transit-direct passengers 38,308 - 23.8%
Passenger transport (excl. transit-direct) 47,391,711 - 0.7%
Cargo transport (tonnes) 1,567,712 - 2.6%
inbound 835,107 - 0.2%
outbound 732,604 - 5.3%
passengers services 640,319 - 4.6%
full-freighter services 927,392 - 1.3%
Mail transport (tonnes) 34,873 - 15.2%
Traffic and transport summary
Traffic Review 2008
0605 07040302010099
300
325
350
375
400
425
450
08
Air transport movementsx 1,000
25
30
35
40
45
50
05 06 07 08040302010099
passenger transportx 1,000,000
1,000
1,100
1,200
1,300
1,400
1,500
1,600
Cargo transportx 1,000 tonnes
393.6
414.9 416.5
401.4
393.0
402.7
404.6
423.1
436.0
428.3
36.8
47.4
39.6 39.5 40.7
40.0
42.5
44.246.1
47.8
05 06 07 08040302010099
1,180.7
1,222.6
1,183.2
1,239.9
1,306.2
1,421.01,449.9
1,526.5
1,610.3
1,567.7
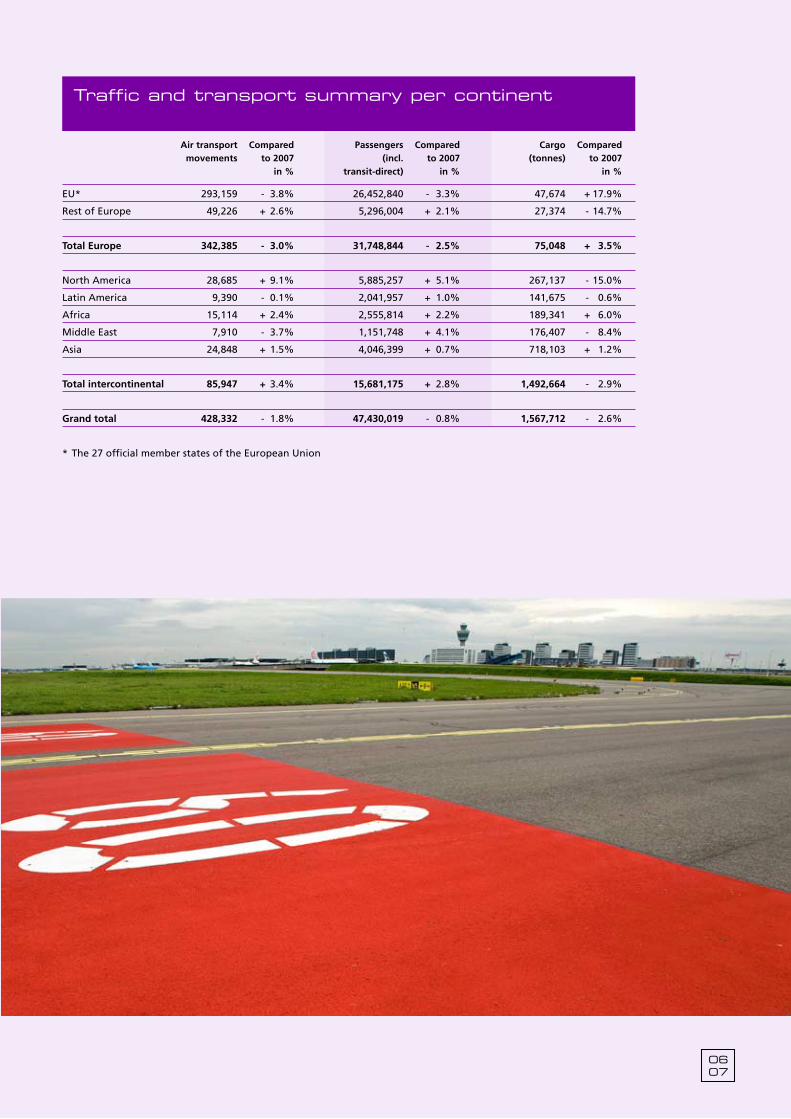
Traffic and transport summary per continent
Air transport Compared Passengers Compared Cargo Compared movements to 2007 (incl. to 2007 (tonnes) to 2007 in % transit-direct) in % in %
EU* 293,159 - 3.8% 26,452,840 - 3.3% 47,674 + 17.9%
Rest of Europe 49,226 + 2.6% 5,296,004 + 2.1% 27,374 - 14.7%
Total Europe 342,385 - 3.0% 31,748,844 - 2.5% 75,048 + 3.5%
North America 28,685 + 9.1% 5,885,257 + 5.1% 267,137 - 15.0%
Latin America 9,390 - 0.1% 2,041,957 + 1.0% 141,675 - 0.6%
Africa 15,114 + 2.4% 2,555,814 + 2.2% 189,341 + 6.0%
Middle East 7,910 - 3.7% 1,151,748 + 4.1% 176,407 - 8.4%
Asia 24,848 + 1.5% 4,046,399 + 0.7% 718,103 + 1.2%
Total intercontinental 85,947 + 3.4% 15,681,175 + 2.8% 1,492,664 - 2.9%
Grand total 428,332 - 1.8% 47,430,019 - 0.8% 1,567,712 - 2.6%
* The 27 official member states of the European Union
0607
Air transport
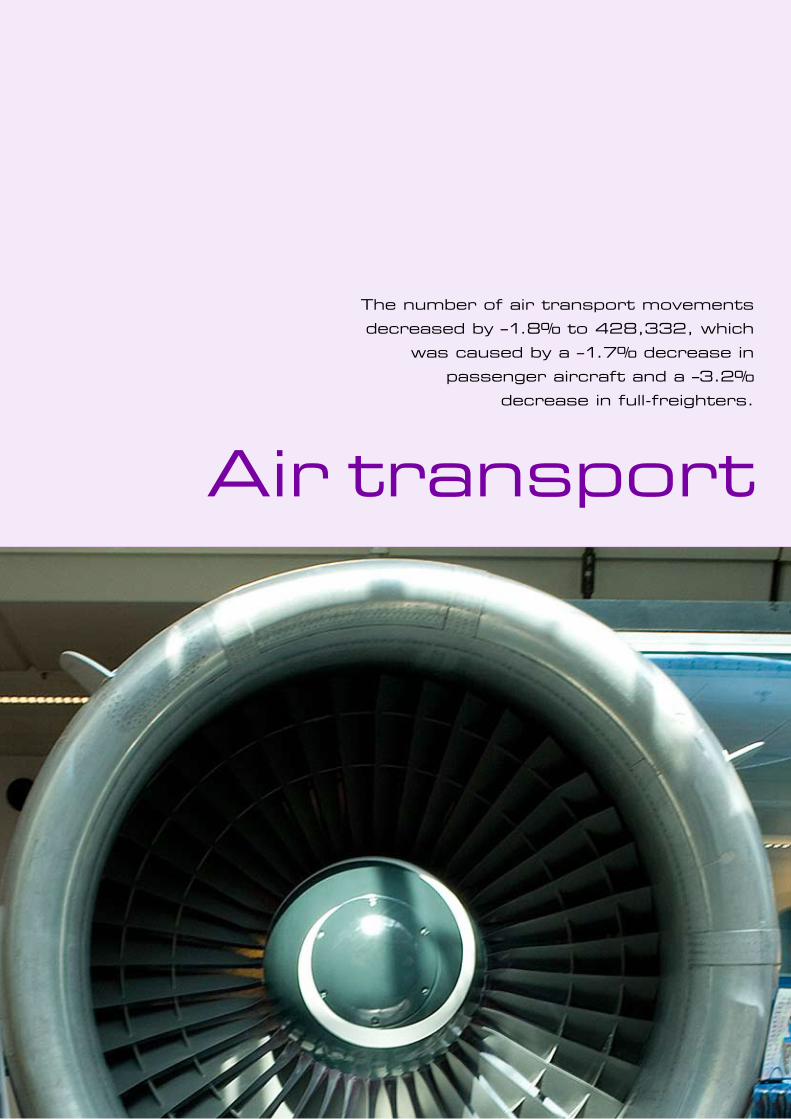
The number of air transport movements decreased by –1.8% to 428,332, which
was caused by a –1.7% decrease in passenger aircraft and a –3.2%
decrease in full-freighters.
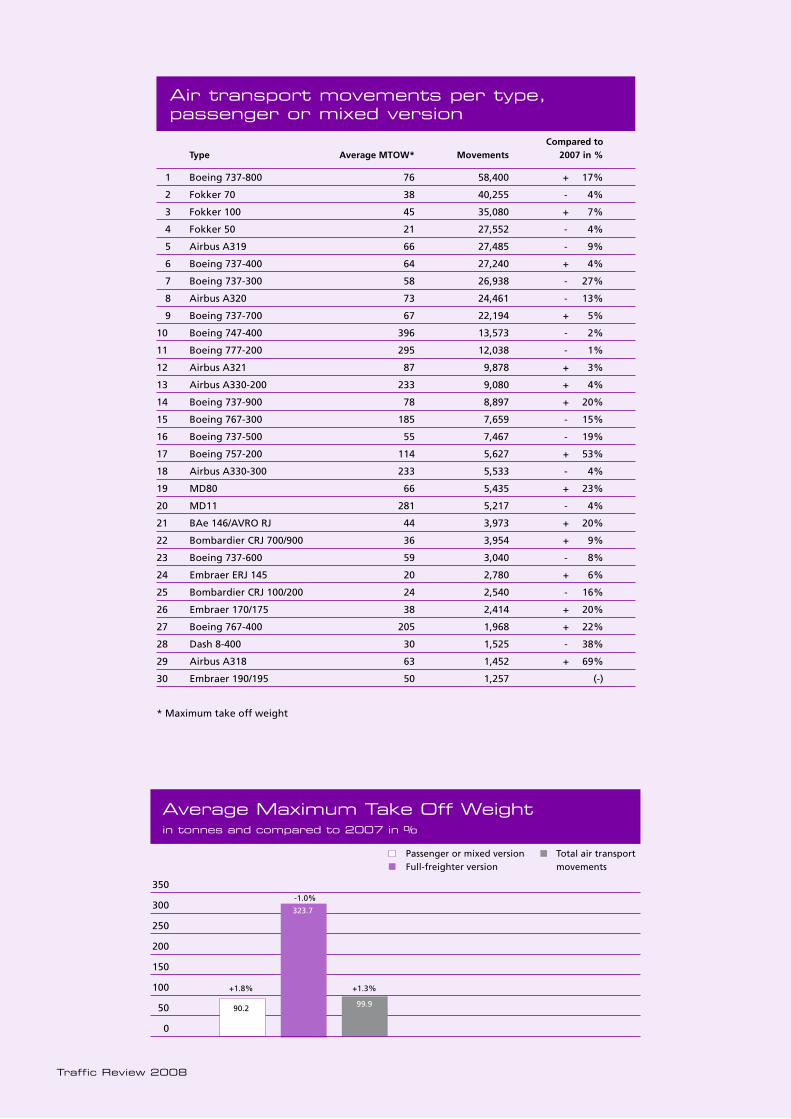
The average Maximum Take-Off Weight (MTOW) increased by 1.2 tonnes to 99.9 tonnes due to a +1.8% increase in the average MTOW of passenger or mixed aircraft and a decrease of -1.0% of the average MTOW of full-freighters.
0809
movements
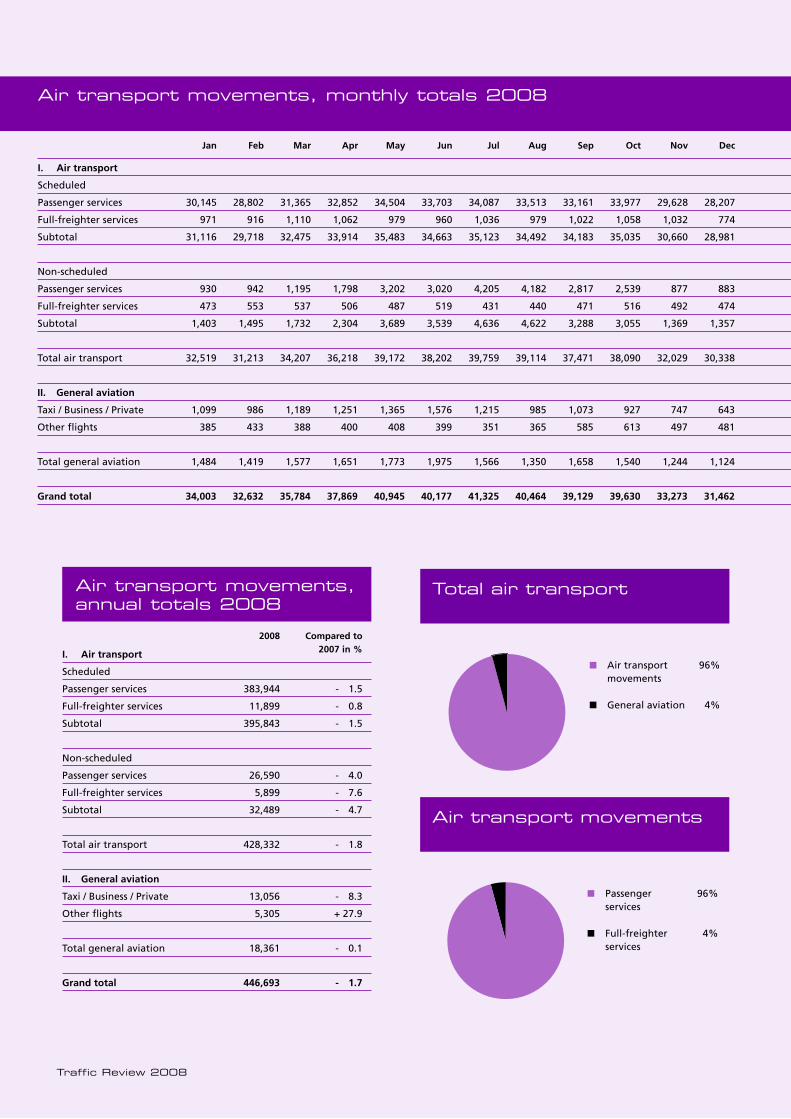
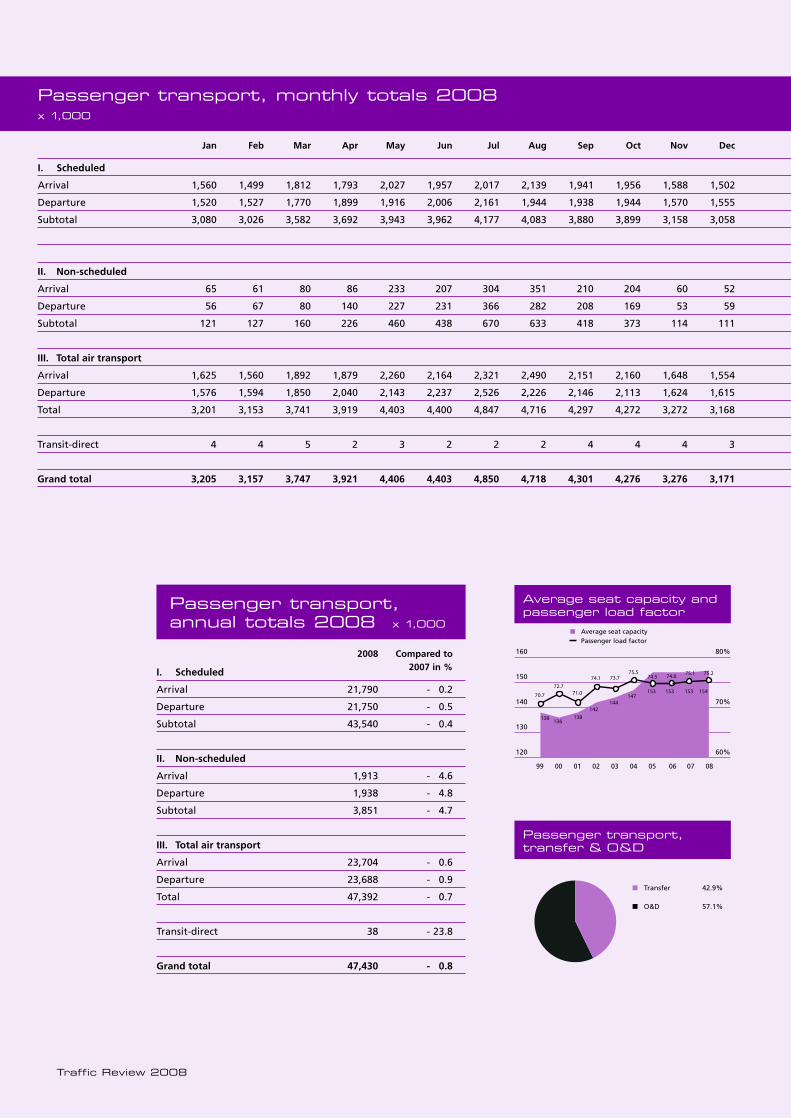
Jan Feb Mar Apr May Jun Jul Aug Sep Oct Nov Dec
I. Air transport
Scheduled
Passenger services 30,145 28,802 31,365 32,852 34,504 33,703 34,087 33,513 33,161 33,977 29,628 28,207
Full-freighter services 971 916 1,110 1,062 979 960 1,036 979 1,022 1,058 1,032 774
Subtotal 31,116 29,718 32,475 33,914 35,483 34,663 35,123 34,492 34,183 35,035 30,660 28,981
Non-scheduled
Passenger services 930 942 1,195 1,798 3,202 3,020 4,205 4,182 2,817 2,539 877 883
Full-freighter services 473 553 537 506 487 519 431 440 471 516 492 474
Subtotal 1,403 1,495 1,732 2,304 3,689 3,539 4,636 4,622 3,288 3,055 1,369 1,357
Total air transport 32,519 31,213 34,207 36,218 39,172 38,202 39,759 39,114 37,471 38,090 32,029 30,338
II. General aviation
Taxi / Business / Private 1,099 986 1,189 1,251 1,365 1,576 1,215 985 1,073 927 747 643
Other flights 385 433 388 400 408 399 351 365 585 613 497 481
Total general aviation 1,484 1,419 1,577 1,651 1,773 1,975 1,566 1,350 1,658 1,540 1,244 1,124
Grand total 34,003 32,632 35,784 37,869 40,945 40,177 41,325 40,464 39,129 39,630 33,273 31,462
Air transport movements, monthly totals 2008
2008 Compared to 2007 in %I. Air transport
Scheduled
Passenger services 383,944 - 1.5
Full-freighter services 11,899 - 0.8
Subtotal 395,843 - 1.5
Non-scheduled
Passenger services 26,590 - 4.0
Full-freighter services 5,899 - 7.6
Subtotal 32,489 - 4.7
Total air transport 428,332 - 1.8
II. General aviation
Taxi / Business / Private 13,056 - 8.3
Other flights 5,305 + 27.9
Total general aviation 18,361 - 0.1
Grand total 446,693 - 1.7
Air transport movements, annual totals 2008
Traffic Review 2008
Total air transport
Air transport movements
General aviation
Air transport 96%movements
General aviation 4%
Passenger 96%services
Full-freighter 4%services
Taxi / Business / 67%Private
Training flights 1%
Other flights 33%
Total air transport
Air transport movements
General aviation
Air transport 96%movements
General aviation 4%
Passenger 96%services
Full-freighter 4%services
Taxi / Business / 67%Private
Training flights 1%
Other flights 33%
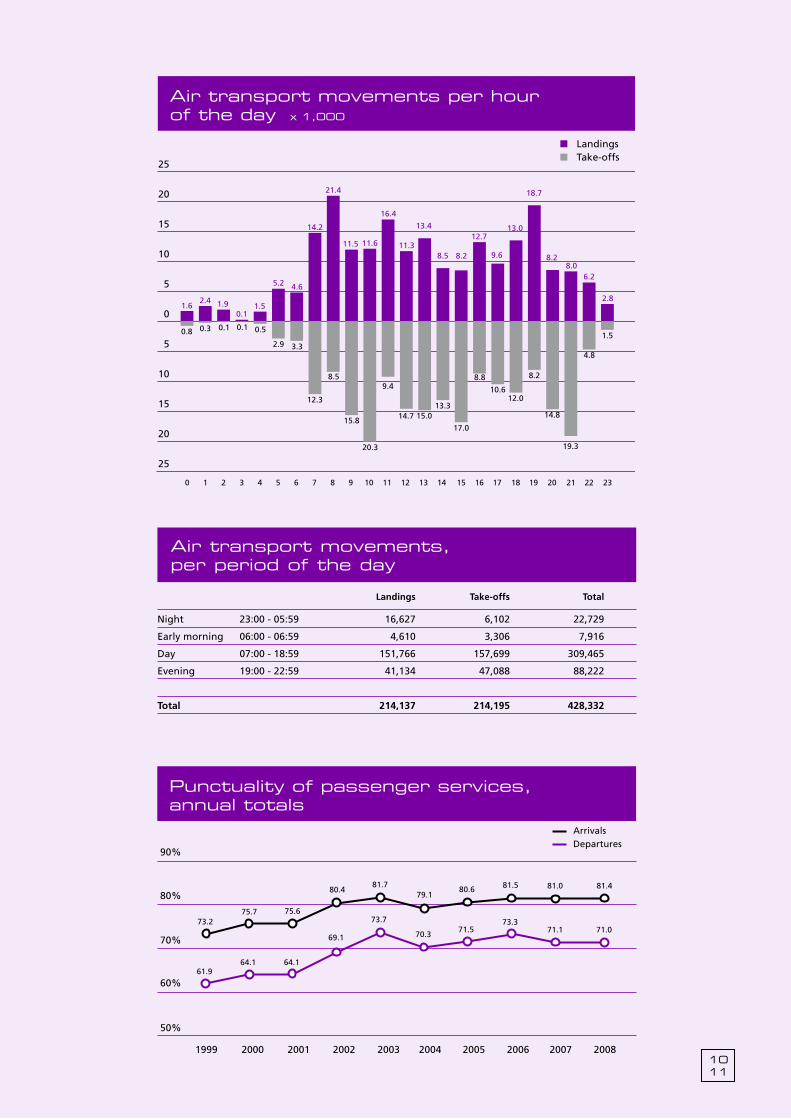
1011
14.2
1.62.4 1.9
0.11.5
5.2 4.6
21.4
11.5 11.6
16.4
11.3
13.4
8.5 8.2
12.7
9.6
13.0
18.7
8.28.0
6.2
2.8
Air transport movements per hour of the day x 1,000
LandingsTake-offs
0
5
10
15
20
25
25
20
15
10
5
0 1 2 3 4 5 6 7 8 9 10 11 12 13 14 15 16 17 18 19 20 21 22 23
0
5
10
15
20
25
0
5
10
15
20
250.8 0.3 0.1 0.1 0.5
2.9 3.3
12.3
8.5
15.8
20.3
9.4
14.7 15.013.3
17.0
8.8
10.612.0
8.2
14.8
19.3
4.8
1.5
2007 200820062005200420032002200120001999
punctuality of passenger services, annual totals
ArrivalsDepartures
60%
50%
70%
80%
90%
73.275.7 75.6
61.964.1 64.1
69.1
80.481.7
73.7
70.371.5
73.371.1 71.0
79.180.6 81.5 81.0 81.4
Landings Take-offs Total
Night 23:00 - 05:59 16,627 6,102 22,729
Early morning 06:00 - 06:59 4,610 3,306 7,916
Day 07:00 - 18:59 151,766 157,699 309,465
Evening 19:00 - 22:59 41,134 47,088 88,222
Total 214,137 214,195 428,332
Air transport movements, per period of the day
Traffic Review 2008
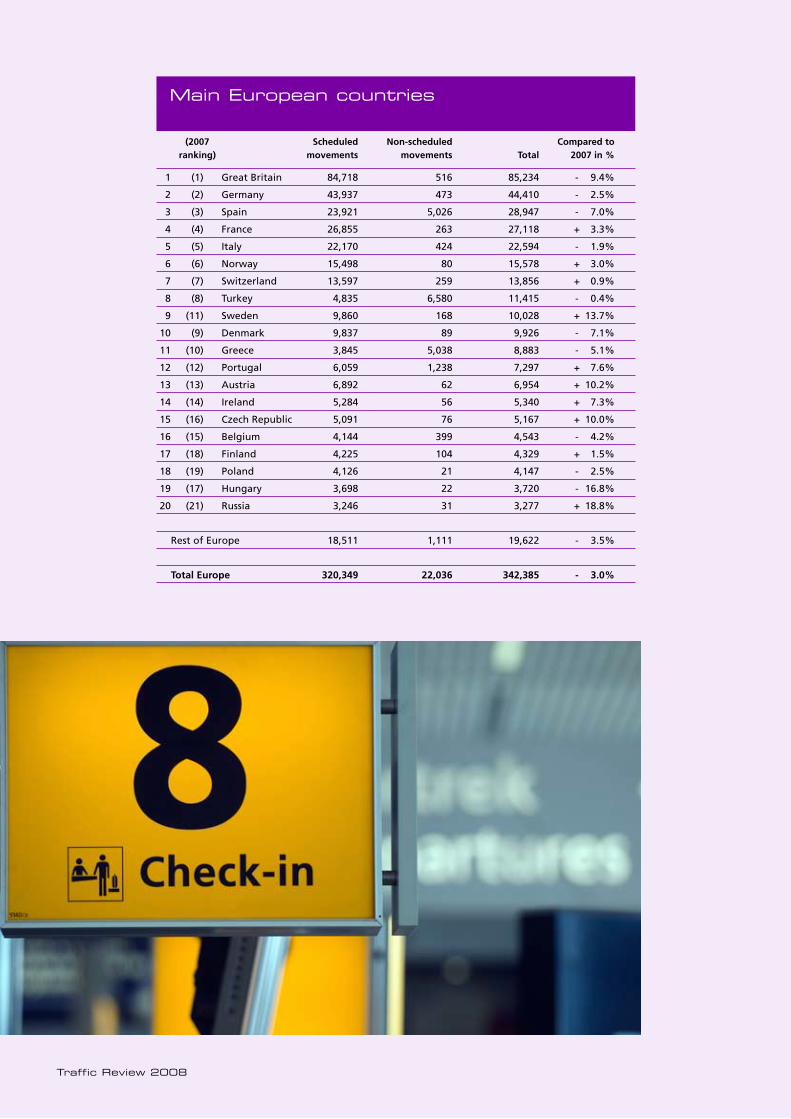
(2007 Scheduled Non-scheduled Compared to ranking) movements movements Total 2007 in %
1 (1) Great Britain 84,718 516 85,234 - 9.4%
2 (2) Germany 43,937 473 44,410 - 2.5%
3 (3) Spain 23,921 5,026 28,947 - 7.0%
4 (4) France 26,855 263 27,118 + 3.3%
5 (5) Italy 22,170 424 22,594 - 1.9%
6 (6) Norway 15,498 80 15,578 + 3.0%
7 (7) Switzerland 13,597 259 13,856 + 0.9%
8 (8) Turkey 4,835 6,580 11,415 - 0.4%
9 (11) Sweden 9,860 168 10,028 + 13.7%
10 (9) Denmark 9,837 89 9,926 - 7.1%
11 (10) Greece 3,845 5,038 8,883 - 5.1%
12 (12) Portugal 6,059 1,238 7,297 + 7.6%
13 (13) Austria 6,892 62 6,954 + 10.2%
14 (14) Ireland 5,284 56 5,340 + 7.3%
15 (16) Czech Republic 5,091 76 5,167 + 10.0%
16 (15) Belgium 4,144 399 4,543 - 4.2%
17 (18) Finland 4,225 104 4,329 + 1.5%
18 (19) Poland 4,126 21 4,147 - 2.5%
19 (17) Hungary 3,698 22 3,720 - 16.8%
20 (21) Russia 3,246 31 3,277 + 18.8%
Rest of Europe 18,511 1,111 19,622 - 3.5%
Total Europe 320,349 22,036 342,385 - 3.0%
Main European countries
1213
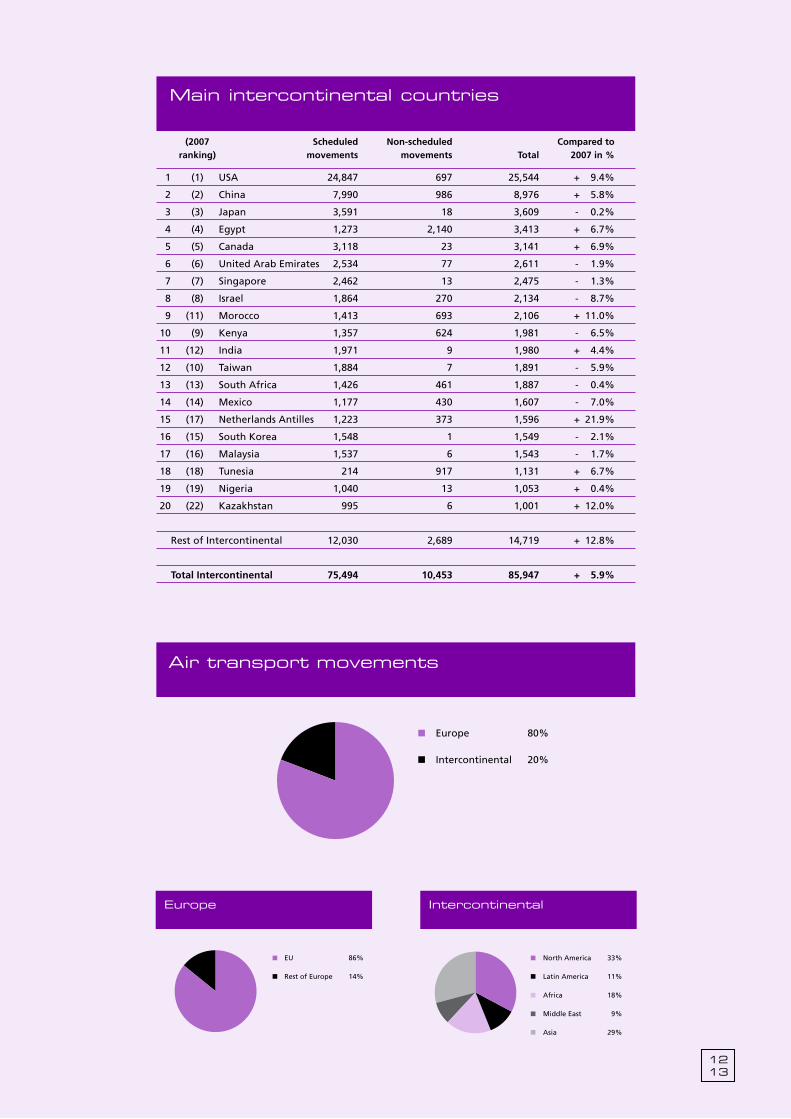
(2007 Scheduled Non-scheduled Compared to ranking) movements movements Total 2007 in %
1 (1) USA 24,847 697 25,544 + 9.4%
2 (2) China 7,990 986 8,976 + 5.8%
3 (3) Japan 3,591 18 3,609 - 0.2%
4 (4) Egypt 1,273 2,140 3,413 + 6.7%
5 (5) Canada 3,118 23 3,141 + 6.9%
6 (6) United Arab Emirates 2,534 77 2,611 - 1.9%
7 (7) Singapore 2,462 13 2,475 - 1.3%
8 (8) Israel 1,864 270 2,134 - 8.7%
9 (11) Morocco 1,413 693 2,106 + 11.0%
10 (9) Kenya 1,357 624 1,981 - 6.5%
11 (12) India 1,971 9 1,980 + 4.4%
12 (10) Taiwan 1,884 7 1,891 - 5.9%
13 (13) South Africa 1,426 461 1,887 - 0.4%
14 (14) Mexico 1,177 430 1,607 - 7.0%
15 (17) Netherlands Antilles 1,223 373 1,596 + 21.9%
16 (15) South Korea 1,548 1 1,549 - 2.1%
17 (16) Malaysia 1,537 6 1,543 - 1.7%
18 (18) Tunesia 214 917 1,131 + 6.7%
19 (19) Nigeria 1,040 13 1,053 + 0.4%
20 (22) Kazakhstan 995 6 1,001 + 12.0%
Rest of Intercontinental 12,030 2,689 14,719 + 12.8%
Total Intercontinental 75,494 10,453 85,947 + 5.9%
Main intercontinental countries
Air transport movements
Europe
Intercontinental
EU 86%
Rest of Europe 14%
North America 33%
Latin America 11%
Africa 18%
Middle East 9%
Asia 29%
Europe 80%
Intercontinental 20%
Air transport movements
Europe 80%
Intercontinental 20%
Air transport movements
Europe
Intercontinental
EU 86%
Rest of Europe 14%
North America 33%
Latin America 11%
Africa 18%
Middle East 9%
Asia 29%
Europe 80%
Intercontinental 20%
Air transport movements
Europe 80%
Intercontinental 20%
Air transport movements
Europe
Intercontinental
EU 86%
Rest of Europe 14%
North America 33%
Latin America 11%
Africa 18%
Middle East 9%
Asia 29%
Europe 80%
Intercontinental 20%
Air transport movements
Europe 80%
Intercontinental 20%
CONSEqUENT RANKING
Traffic Review 2008
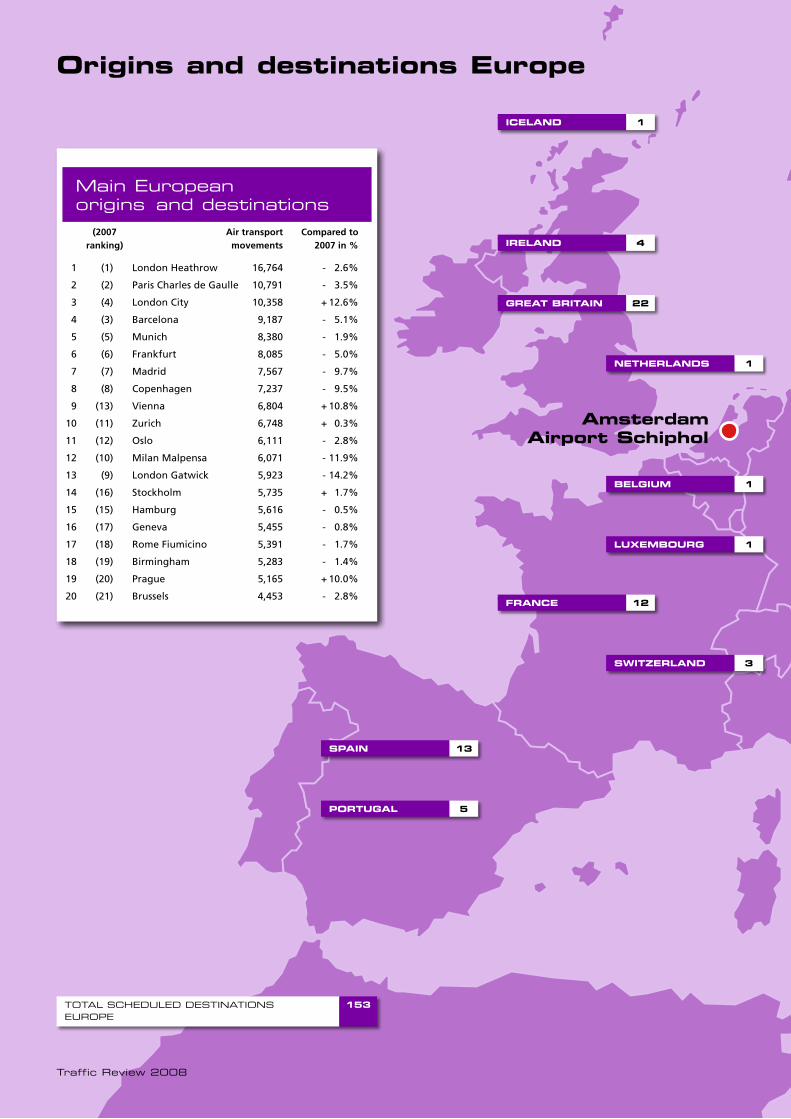
Origins and destinations Europe
Amsterdam Airport Schiphol
Main European origins and destinations
(2007 Air transport Compared to ranking) movements 2007 in %
1 (1) London Heathrow 16,764 - 2.6%
2 (2) Paris Charles de Gaulle 10,791 - 3.5%
3 (4) London City 10,358 + 12.6%
4 (3) Barcelona 9,187 - 5.1%
5 (5) Munich 8,380 - 1.9%
6 (6) Frankfurt 8,085 - 5.0%
7 (7) Madrid 7,567 - 9.7%
8 (8) Copenhagen 7,237 - 9.5%
9 (13) Vienna 6,804 + 10.8%
10 (11) Zurich 6,748 + 0.3%
11 (12) Oslo 6,111 - 2.8%
12 (10) Milan Malpensa 6,071 - 11.9%
13 (9) London Gatwick 5,923 - 14.2%
14 (16) Stockholm 5,735 + 1.7%
15 (15) Hamburg 5,616 - 0.5%
16 (17) Geneva 5,455 - 0.8%
17 (18) Rome Fiumicino 5,391 - 1.7%
18 (19) Birmingham 5,283 - 1.4%
19 (20) Prague 5,165 + 10.0%
20 (21) Brussels 4,453 - 2.8%
BElgIum 1
luxEmBOurg 1
FrAnCE 12
SwItzErlAnD 3
nEthErlAnDS 1
grEAt BrItAIn 22
IrElAnD 4
ICElAnD 1
SPAIn 13
POrtugAl 5
TOTAl SChEDulED DESTInATIOnS EuROpE
153
1415
gErmAny 11 POlAnD 2
CzECh rEPuBlIC 1
AuStrIA 1
SlOvEnIA 1
ukrAInE 1
ArmEnIA 1
hungAry 1
CrOAtIA 4
SErBIA 1
mACEDOnIA 1
grEECE 15
ItAly 16
mAltA 1
rOmAnIA 1
BulgArIA 3
gEOrgIA 1
turkEy 8
CyPruS 2
lIthuAnIA 1
lAtvIA 1
EStOnIA 1
ruSSIA 2
DEnmArk 2
SwEDEn 4
nOrwAy 6 FInlAnD 1
Traffic Review 2008
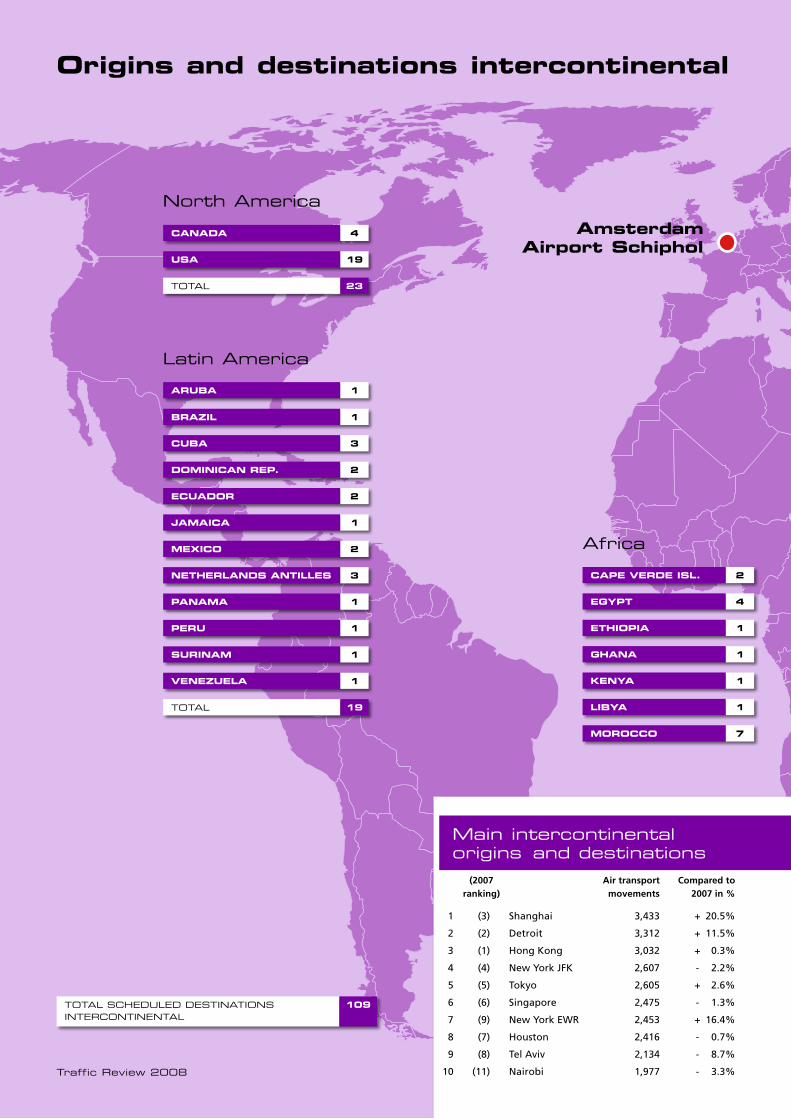
Origins and destinations intercontinental
Amsterdam Airport Schiphol
Main intercontinental origins and destinations
(2007 Air transport Compared to ranking) movements 2007 in %
1 (3) Shanghai 3,433 + 20.5%
2 (2) Detroit 3,312 + 11.5%
3 (1) Hong Kong 3,032 + 0.3%
4 (4) New York JFK 2,607 - 2.2%
5 (5) Tokyo 2,605 + 2.6%
6 (6) Singapore 2,475 - 1.3%
7 (9) New York EWR 2,453 + 16.4%
8 (7) Houston 2,416 - 0.7%
9 (8) Tel Aviv 2,134 - 8.7%
10 (11) Nairobi 1,977 - 3.3%
CAnADA 4
uSA 19
north America
TOTAl 23
CAPE vErDE ISl. 2
EgyPt 4
EthIOPIA 1
ghAnA 1
kEnyA 1
lIByA 1
mOrOCCO 7
Africa
TOTAl SChEDulED DESTInATIOnS InTERCOnTInEnTAl
109
AruBA 1
CuBA 3
ECuADOr 2
jAmAICA 1
mExICO 2
PAnAmA 1
PEru 1
SurInAm 1
vEnEzuElA 1
TOTAl 19
DOmInICAn rEP. 2
nEthErlAnDS AntIllES 3
latin America
BrAzIl 1
1617
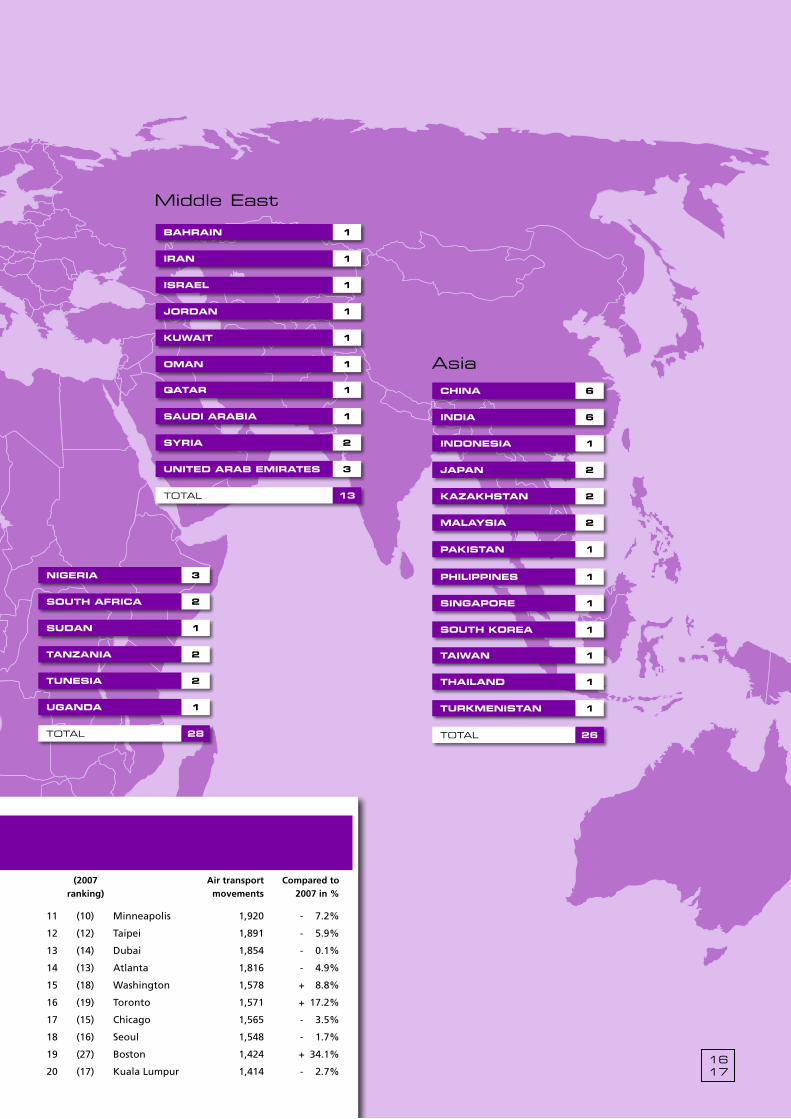
Origins and destinations intercontinental
Main intercontinental origins and destinations
(2007 Air transport Compared to ranking) movements 2007 in %
11 (10) Minneapolis 1,920 - 7.2%
12 (12) Taipei 1,891 - 5.9%
13 (14) Dubai 1,854 - 0.1%
14 (13) Atlanta 1,816 - 4.9%
15 (18) Washington 1,578 + 8.8%
16 (19) Toronto 1,571 + 17.2%
17 (15) Chicago 1,565 - 3.5%
18 (16) Seoul 1,548 - 1.7%
19 (27) Boston 1,424 + 34.1%
20 (17) Kuala Lumpur 1,414 - 2.7%
nIgErIA 3
SOuth AFrICA 2
SuDAn 1
tAnzAnIA 2
tunESIA 2
ugAnDA 1
TOTAl 28
BAhrAIn 1
IrAn 1
ISrAEl 1
jOrDAn 1
kuwAIt 1
OmAn 1
QAtAr 1
SAuDI ArABIA 1
SyrIA 2
unItED ArAB EmIrAtES 3
Middle East
TOTAl 13
ChInA 6
InDIA 6
InDOnESIA 1
jAPAn 2
kAzAkhStAn 2
mAlAySIA 2
PhIlIPPInES 1
PAkIStAn 1
SIngAPOrE 1
SOuth kOrEA 1
tAIwAn 1
thAIlAnD 1
turkmEnIStAn 1
Asia
TOTAl 26
Traffic Review 2008
Compared to Type Average MTOW* Movements 2007 in %
1 Boeing 737-800 76 58,400 + 17%
2 Fokker 70 38 40,255 - 4%
3 Fokker 100 45 35,080 + 7%
4 Fokker 50 21 27,552 - 4%
5 Airbus A319 66 27,485 - 9%
6 Boeing 737-400 64 27,240 + 4%
7 Boeing 737-300 58 26,938 - 27%
8 Airbus A320 73 24,461 - 13%
9 Boeing 737-700 67 22,194 + 5%
10 Boeing 747-400 396 13,573 - 2%
11 Boeing 777-200 295 12,038 - 1%
12 Airbus A321 87 9,878 + 3%
13 Airbus A330-200 233 9,080 + 4%
14 Boeing 737-900 78 8,897 + 20%
15 Boeing 767-300 185 7,659 - 15%
16 Boeing 737-500 55 7,467 - 19%
17 Boeing 757-200 114 5,627 + 53%
18 Airbus A330-300 233 5,533 - 4%
19 MD80 66 5,435 + 23%
20 MD11 281 5,217 - 4%
21 BAe 146/AVRO RJ 44 3,973 + 20%
22 Bombardier CRJ 700/900 36 3,954 + 9%
23 Boeing 737-600 59 3,040 - 8%
24 Embraer ERJ 145 20 2,780 + 6%
25 Bombardier CRJ 100/200 24 2,540 - 16%
26 Embraer 170/175 38 2,414 + 20%
27 Boeing 767-400 205 1,968 + 22%
28 Dash 8-400 30 1,525 - 38%
29 Airbus A318 63 1,452 + 69%
30 Embraer 190/195 50 1,257 (-)
* Maximum take off weight
Air transport movements per type, passenger or mixed version
0
50
100
150
200
250
300
350
Average Maximum Take Off Weight in tonnes and compared to 2007 in %
Passenger or mixed versionFull-freighter version
Total air transport movements
90.2
+1.8%
323.7
-1.0%
99.9
+1.3%
1819
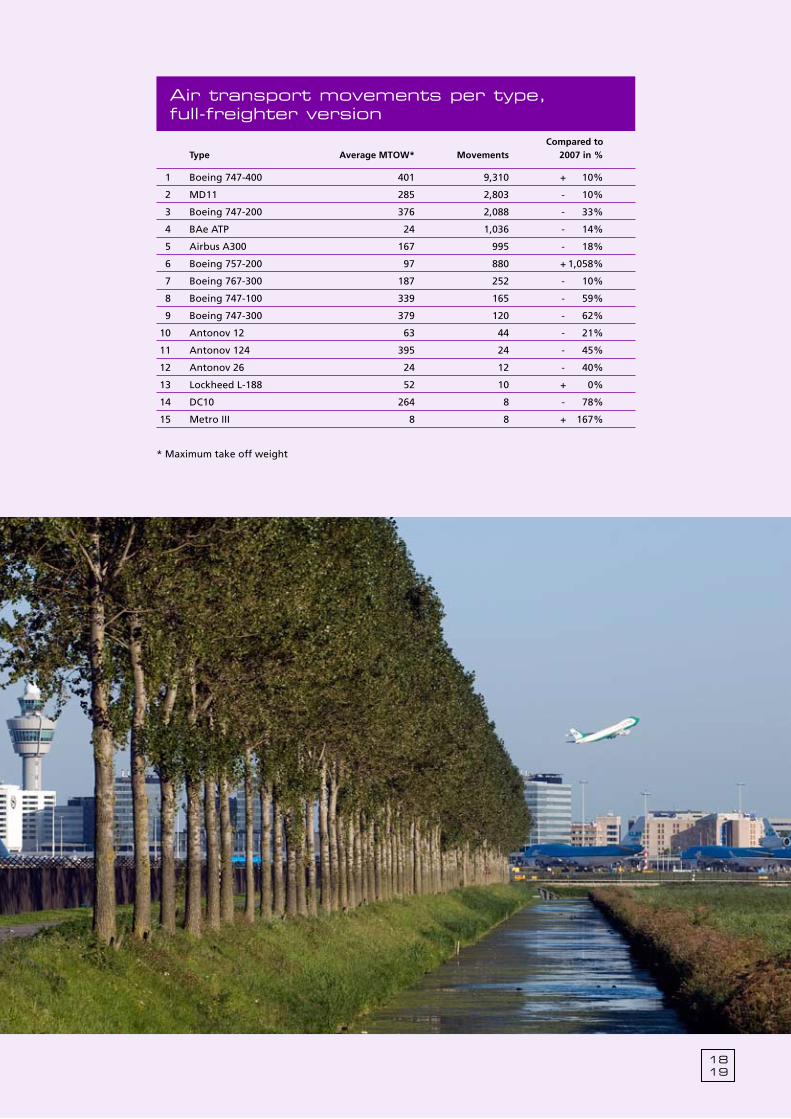
Compared to Type Average MTOW* Movements 2007 in %
1 Boeing 747-400 401 9,310 + 10%
2 MD11 285 2,803 - 10%
3 Boeing 747-200 376 2,088 - 33%
4 BAe ATP 24 1,036 - 14%
5 Airbus A300 167 995 - 18%
6 Boeing 757-200 97 880 + 1,058%
7 Boeing 767-300 187 252 - 10%
8 Boeing 747-100 339 165 - 59%
9 Boeing 747-300 379 120 - 62%
10 Antonov 12 63 44 - 21%
11 Antonov 124 395 24 - 45%
12 Antonov 26 24 12 - 40%
13 Lockheed L-188 52 10 + 0%
14 DC10 264 8 - 78%
15 Metro III 8 8 + 167%
* Maximum take off weight
Air transport movements per type, full-freighter version
Traffic Review 2008
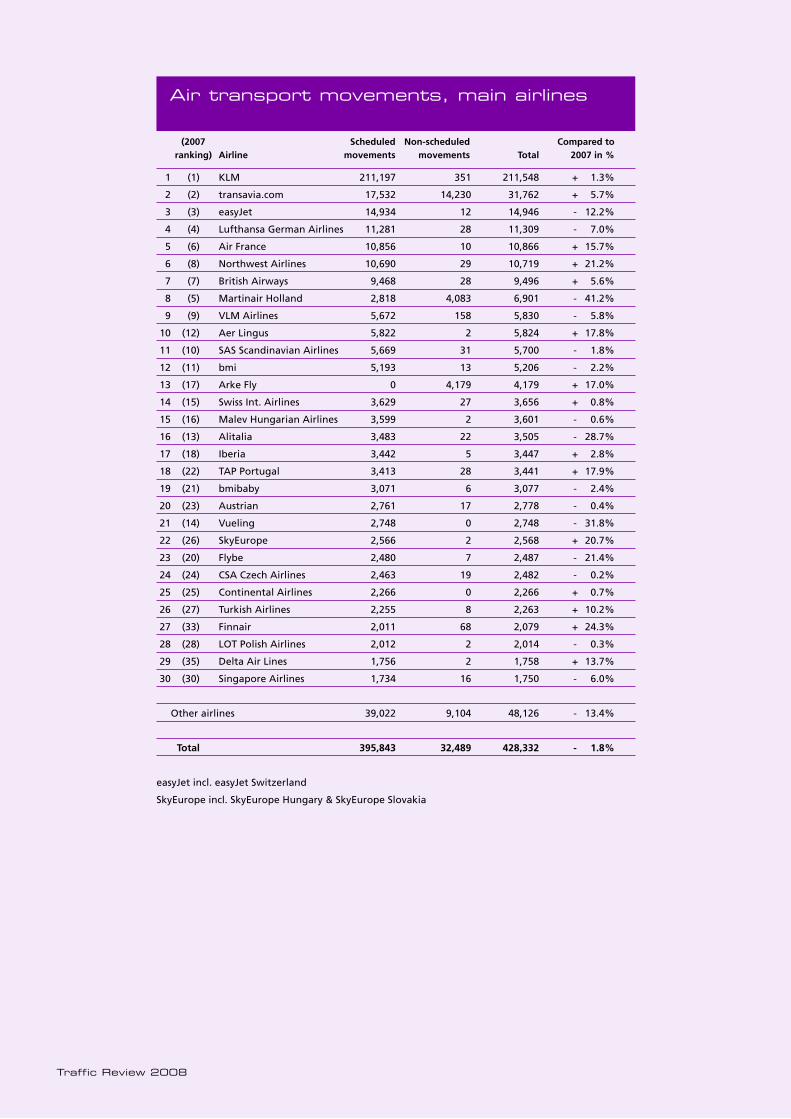
(2007 Scheduled Non-scheduled Compared to ranking) Airline movements movements Total 2007 in %
1 (1) KLM 211,197 351 211,548 + 1.3%
2 (2) transavia.com 17,532 14,230 31,762 + 5.7%
3 (3) easyJet 14,934 12 14,946 - 12.2%
4 (4) Lufthansa German Airlines 11,281 28 11,309 - 7.0%
5 (6) Air France 10,856 10 10,866 + 15.7%
6 (8) Northwest Airlines 10,690 29 10,719 + 21.2%
7 (7) British Airways 9,468 28 9,496 + 5.6%
8 (5) Martinair Holland 2,818 4,083 6,901 - 41.2%
9 (9) VLM Airlines 5,672 158 5,830 - 5.8%
10 (12) Aer Lingus 5,822 2 5,824 + 17.8%
11 (10) SAS Scandinavian Airlines 5,669 31 5,700 - 1.8%
12 (11) bmi 5,193 13 5,206 - 2.2%
13 (17) Arke Fly 0 4,179 4,179 + 17.0%
14 (15) Swiss Int. Airlines 3,629 27 3,656 + 0.8%
15 (16) Malev Hungarian Airlines 3,599 2 3,601 - 0.6%
16 (13) Alitalia 3,483 22 3,505 - 28.7%
17 (18) Iberia 3,442 5 3,447 + 2.8%
18 (22) TAP Portugal 3,413 28 3,441 + 17.9%
19 (21) bmibaby 3,071 6 3,077 - 2.4%
20 (23) Austrian 2,761 17 2,778 - 0.4%
21 (14) Vueling 2,748 0 2,748 - 31.8%
22 (26) SkyEurope 2,566 2 2,568 + 20.7%
23 (20) Flybe 2,480 7 2,487 - 21.4%
24 (24) CSA Czech Airlines 2,463 19 2,482 - 0.2%
25 (25) Continental Airlines 2,266 0 2,266 + 0.7%
26 (27) Turkish Airlines 2,255 8 2,263 + 10.2%
27 (33) Finnair 2,011 68 2,079 + 24.3%
28 (28) LOT Polish Airlines 2,012 2 2,014 - 0.3%
29 (35) Delta Air Lines 1,756 2 1,758 + 13.7%
30 (30) Singapore Airlines 1,734 16 1,750 - 6.0%
Other airlines 39,022 9,104 48,126 - 13.4%
Total 395,843 32,489 428,332 - 1.8%
easyJet incl. easyJet Switzerland
SkyEurope incl. SkyEurope Hungary & SkyEurope Slovakia
Air transport movements, main airlines
2021
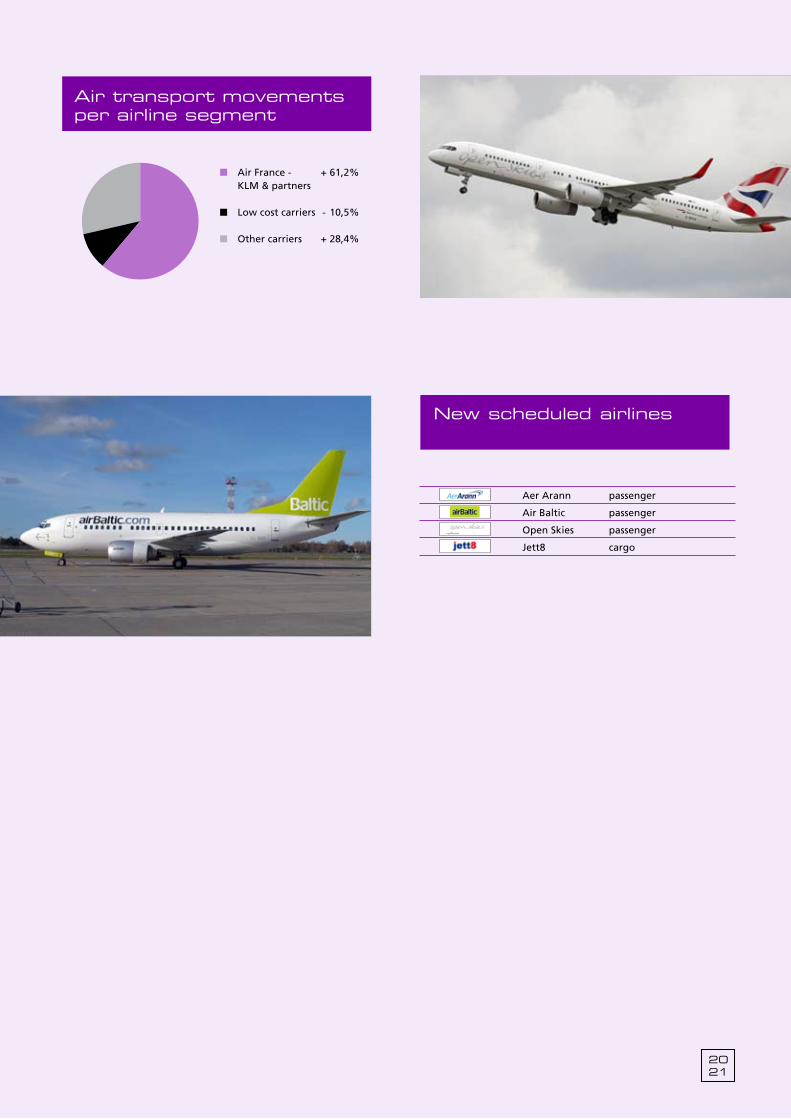
Air transport movements by airline segment in 1,000
0
100
200
300
400
500
Air France - KLM & partnersLow cost carriers
Other carriers
240.683
40.748
123.163
Air transport movements per airline segment
Air France - + 61,2%KLM & partners
Low cost carriers 10,5%
Other carriers + 28,4%
-
Aer Arann passenger
Air Baltic passenger
Open Skies passenger
Jett8 cargo
new scheduled airlines
Traffic Review 2008
The number of passengers travelling from/to and via
Amsterdam Airport Schiphol dropped by –0.8% to 47.4 million passengers.
The passenger decrease is composed by a decrease in Origin & Destination (O&D) passengers (-3.4%) and an increase in transfer passengers (+3.0%). The busiest day of the year was recorded on 20 July, with almost 170 thousand passengers (excl. transit direct).
2223
passengers
Traffic Review 2008
Jan Feb Mar Apr May Jun Jul Aug Sep Oct Nov Dec
I. Scheduled
Arrival 1,560 1,499 1,812 1,793 2,027 1,957 2,017 2,139 1,941 1,956 1,588 1,502
Departure 1,520 1,527 1,770 1,899 1,916 2,006 2,161 1,944 1,938 1,944 1,570 1,555
Subtotal 3,080 3,026 3,582 3,692 3,943 3,962 4,177 4,083 3,880 3,899 3,158 3,058
II. Non-scheduled
Arrival 65 61 80 86 233 207 304 351 210 204 60 52
Departure 56 67 80 140 227 231 366 282 208 169 53 59
Subtotal 121 127 160 226 460 438 670 633 418 373 114 111
III. Total air transport
Arrival 1,625 1,560 1,892 1,879 2,260 2,164 2,321 2,490 2,151 2,160 1,648 1,554
Departure 1,576 1,594 1,850 2,040 2,143 2,237 2,526 2,226 2,146 2,113 1,624 1,615
Total 3,201 3,153 3,741 3,919 4,403 4,400 4,847 4,716 4,297 4,272 3,272 3,168
Transit-direct 4 4 5 2 3 2 2 2 4 4 4 3
Grand total 3,205 3,157 3,747 3,921 4,406 4,403 4,850 4,718 4,301 4,276 3,276 3,171
passenger transport, monthly totals 2008 x 1,000
2008 Compared to 2007 in %I. Scheduled
Arrival 21,790 - 0.2
Departure 21,750 - 0.5
Subtotal 43,540 - 0.4
II. Non-scheduled
Arrival 1,913 - 4.6
Departure 1,938 - 4.8
Subtotal 3,851 - 4.7
III. Total air transport
Arrival 23,704 - 0.6
Departure 23,688 - 0.9
Total 47,392 - 0.7
Transit-direct 38 - 23.8
Grand total 47,430 - 0.8
passenger transport, annual totals 2008 x 1,000
120
130
140
150
160
05 06 07040302010099 08
Average seat capacity and passenger load factor
60%
70%
80%
Average seat capacityPassenger load factor
138136
138
142144
147153 153 153 154
70.7
72.771.0
74.1 73.775.5
74.5 74.6 75.1 75.2
passenger transport, transfer & O&D
Transfer 42.9%
O&D 57.1%
2425
(2007 Passengers Compared to ranking) 2008 2007 in %
1 (1) Great Britain 7,252,514 - 7.4%
2 (2) Spain 3,932,758 - 6.0%
3 (3) Germany 2,645,221 + 2.5%
4 (4) Italy 2,309,607 - 4.1%
5 (5) France 2,179,636 + 3.6%
6 (6) Turkey 1,689,995 - 2.6%
7 (8) Norway 1,414,727 + 3.4%
8 (9) Switzerland 1,335,796 + 3.1%
9 (7) Greece 1,332,148 - 5.0%
10 (10) Denmark 992,268 - 4.7%
11 (11) Sweden 938,312 + 0.2%
12 (12) Portugal 863,487 + 3.3%
13 (13) Ireland 664,627 + 1.1%
14 (14) Austria 564,752 + 7.4%
15 (16) Czech Republic 446,652 + 10.1%
16 (15) Finland 427,181 - 3.6%
17 (20) Russia 341,158 + 20.9%
18 (18) Poland 330,046 - 1.5%
19 (19) Romania 301,694 + 0.4%
20 (17) Hungary 293,302 - 20.7%
Main European countries
(2007 Passengers Compared to ranking) 2008 2007 in %
1 (1) USA 5,024,729 + 5.2%
2 (2) China 1,011,047 + 0.9%
3 (3) Canada 857,799 + 4.2%
4 (5) Egypt 596,531 + 7.6%
5 (4) Japan 544,512 - 3.6%
6 (6) India 513,317 + 6.4%
7 (9) Netherlands Antilles 432,461 + 10.7%
8 (10) Singapore 402,998 + 3.2%
9 (8) Thailand 402,407 - 2.0%
10 (13) United Arab Emirates 394,936 + 8.0%
11 (12) South Africa 393,466 + 6.6%
12 (11) Malaysia 383,783 + 1.2%
13 (14) Mexico 305,417 + 1.8%
14 (7) Kenya 298,358 - 27.4%
15 (15) Israel 277,090 - 0.4%
16 (16) Surinam 270,302 + 1.6%
17 (21) Morocco 242,760 + 20.1%
18 (20) Philippines 242,436 + 11.2%
19 (17) Brazil 240,373 - 3.6%
20 (18) Nigeria 239,927 + 1.0%
Main intercontinental countries
Europe vs ICA Europe Intercontinental
Europe 67%
Intercontinental 33%
passengers
Europe 66,9%
Intercontinental 33,1%
EU 83,3%
Rest of Europe 16,7%
North America 37,5%
Latin America 13,0%
Africa 16,3%
Middle East 7,3%
Asia 25,8%
Europe vs ICA Europe Intercontinental
Europe 67%
Intercontinental 33%
passengers
Europe 66,9%
Intercontinental 33,1%
EU 83,3%
Rest of Europe 16,7%
North America 37,5%
Latin America 13,0%
Africa 16,3%
Middle East 7,3%
Asia 25,8%
Europe vs ICA Europe Intercontinental
Europe 67%
Intercontinental 33%
passengers
Europe 66,9%
Intercontinental 33,1%
EU 83,3%
Rest of Europe 16,7%
North America 37,5%
Latin America 13,0%
Africa 16,3%
Middle East 7,3%
Asia 25,8%
Traffic Review 2008
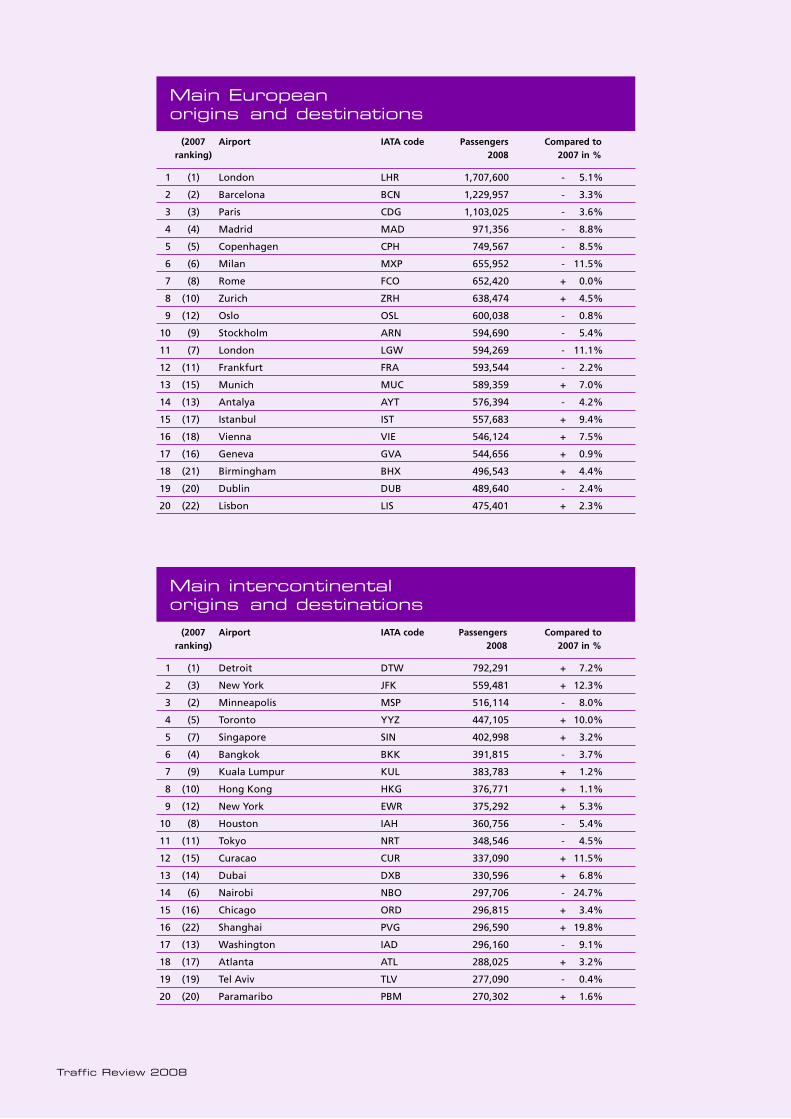
(2007 Airport IATA code Passengers Compared to ranking) 2008 2007 in %
1 (1) London LHR 1,707,600 - 5.1%
2 (2) Barcelona BCN 1,229,957 - 3.3%
3 (3) Paris CDG 1,103,025 - 3.6%
4 (4) Madrid MAD 971,356 - 8.8%
5 (5) Copenhagen CPH 749,567 - 8.5%
6 (6) Milan MXP 655,952 - 11.5%
7 (8) Rome FCO 652,420 + 0.0%
8 (10) Zurich ZRH 638,474 + 4.5%
9 (12) Oslo OSL 600,038 - 0.8%
10 (9) Stockholm ARN 594,690 - 5.4%
11 (7) London LGW 594,269 - 11.1%
12 (11) Frankfurt FRA 593,544 - 2.2%
13 (15) Munich MUC 589,359 + 7.0%
14 (13) Antalya AYT 576,394 - 4.2%
15 (17) Istanbul IST 557,683 + 9.4%
16 (18) Vienna VIE 546,124 + 7.5%
17 (16) Geneva GVA 544,656 + 0.9%
18 (21) Birmingham BHX 496,543 + 4.4%
19 (20) Dublin DUB 489,640 - 2.4%
20 (22) Lisbon LIS 475,401 + 2.3%
Main European origins and destinations
(2007 Airport IATA code Passengers Compared to ranking) 2008 2007 in %
1 (1) Detroit DTW 792,291 + 7.2%
2 (3) New York JFK 559,481 + 12.3%
3 (2) Minneapolis MSP 516,114 - 8.0%
4 (5) Toronto YYZ 447,105 + 10.0%
5 (7) Singapore SIN 402,998 + 3.2%
6 (4) Bangkok BKK 391,815 - 3.7%
7 (9) Kuala Lumpur KUL 383,783 + 1.2%
8 (10) Hong Kong HKG 376,771 + 1.1%
9 (12) New York EWR 375,292 + 5.3%
10 (8) Houston IAH 360,756 - 5.4%
11 (11) Tokyo NRT 348,546 - 4.5%
12 (15) Curacao CUR 337,090 + 11.5%
13 (14) Dubai DXB 330,596 + 6.8%
14 (6) Nairobi NBO 297,706 - 24.7%
15 (16) Chicago ORD 296,815 + 3.4%
16 (22) Shanghai PVG 296,590 + 19.8%
17 (13) Washington IAD 296,160 - 9.1%
18 (17) Atlanta ATL 288,025 + 3.2%
19 (19) Tel Aviv TLV 277,090 - 0.4%
20 (20) Paramaribo PBM 270,302 + 1.6%
Main intercontinental origins and destinations
2627
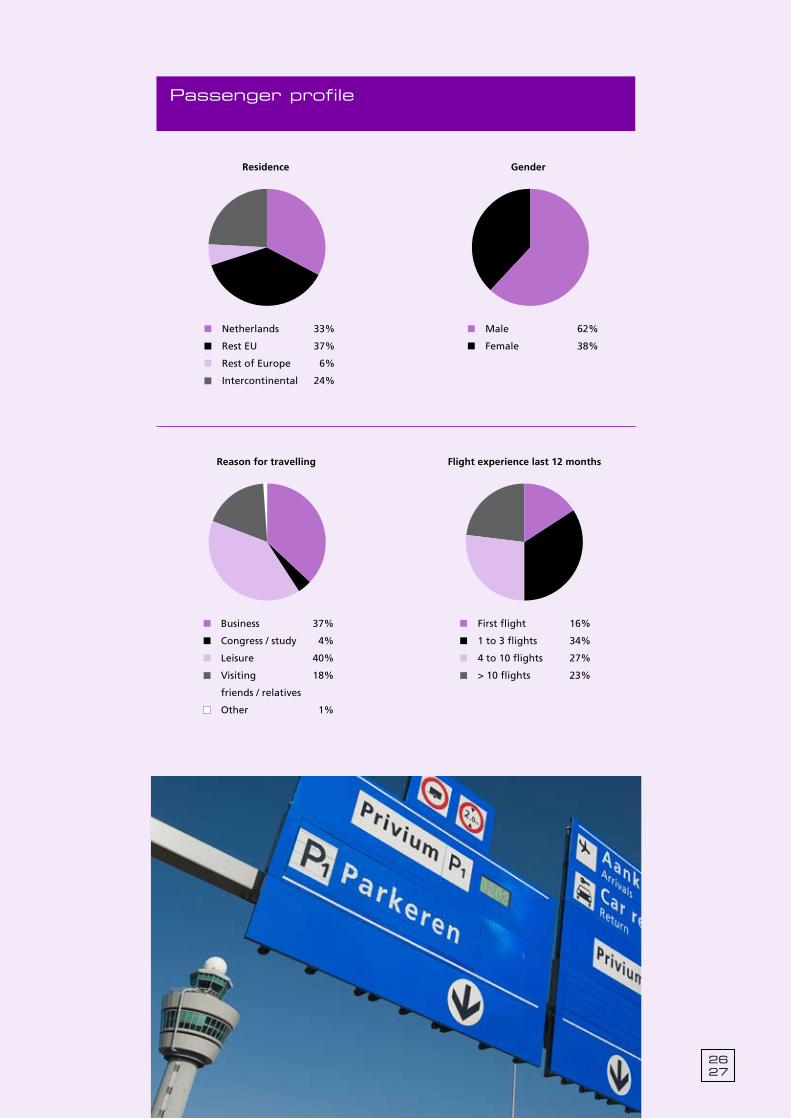
passenger profile
Europe vs ICA Eu vs Rest Europe ICA continents
Europe 68%
Intercontinental 32%
EU 82%
Rest of Europe 18%
North America 38%
Latin America 13%
Africa 16%
Middle East 8%
Asia 25%
passenger profile
Netherlands 33%
Rest EU 37%
Rest of Europe 6%
Intercontinental 24%
Male 62%
Female 38%
Business 37%
Congress / study 4%
Leisure 40%
Visiting 18%
friends / relatives
Other 1%
First flight 16%
1 to 3 flights 34%
4 to 10 flights 27%
> 10 flights 23%
Residence Gender Reason for travelling Flight experience last 12 months
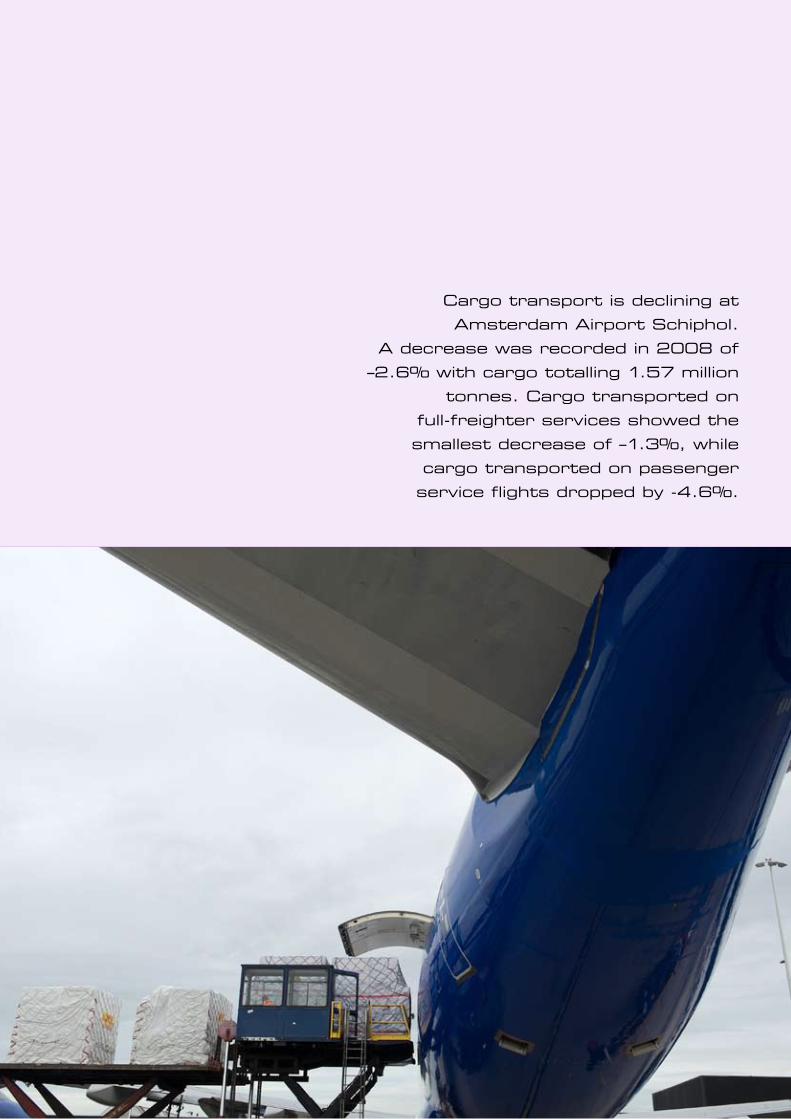
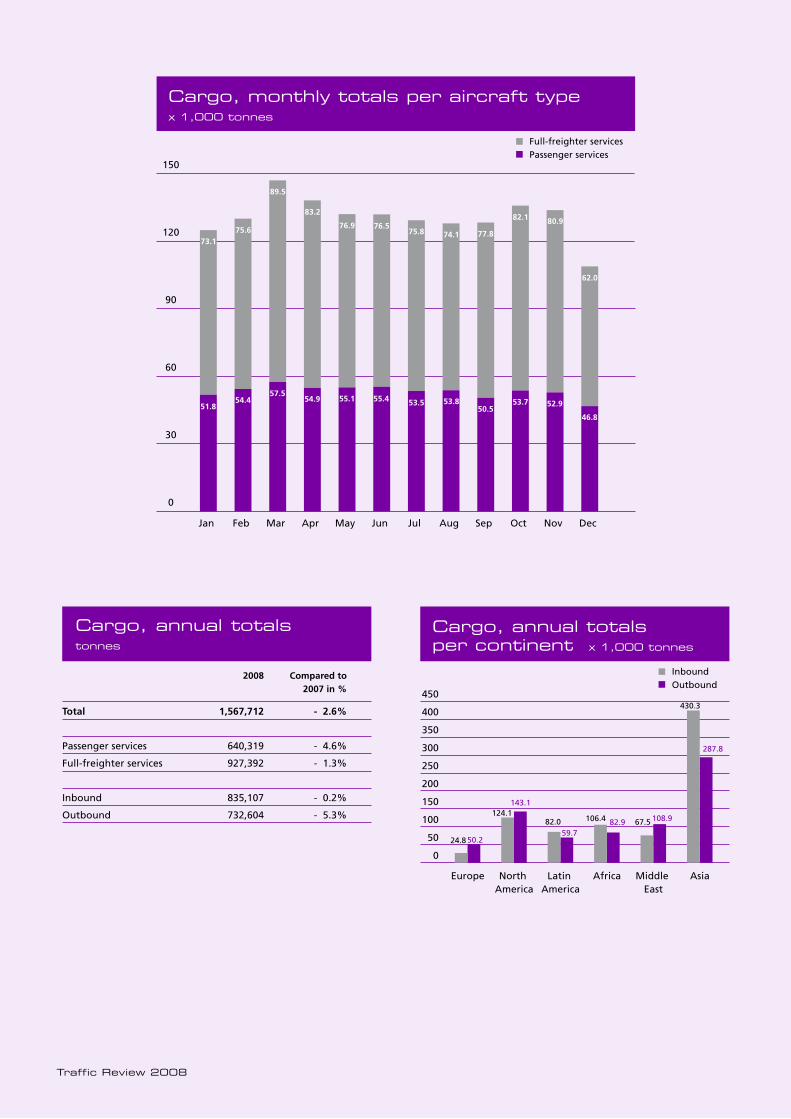
Cargo transport is declining at Amsterdam Airport Schiphol.
A decrease was recorded in 2008 of –2.6% with cargo totalling 1.57 million
tonnes. Cargo transported on full-freighter services showed the smallest decrease of –1.3%, while cargo transported on passenger service flights dropped by -4.6%.

Although an overall decrease of cargo was observed, there still was growth for some regions: Europe (+3.5%), Asia (+1.2%) and Africa (+6.0%).The second largest region north America (-15.0%) showed a significant drop as well as the Middle East (-8.4%). The busiest month in 2008 was March, with 147 thousand tonnes.
2829
Cargo
Traffic Review 2008
0
30
60
90
120
150
0
30
60
90
120
150
DecNovOctSepAugJulJunMayAprMarFebJan
Cargo, monthly totals per aircraft type x 1,000
Full-freighter aircraftPassenger aircraft
DecNovOctSepAugJulJunMayAprMarFebJan
Cargo, monthly totals per aircraft typex 1,000 tonnes
Full-freighter servicesPassenger services
0
30
60
90
120
150
73.175.6
89.5
83.2
76.9 76.575.8 74.1 77.8
82.1 80.9
62.0
51.854.4
57.554.9 55.1 55.4 53.5 53.8
50.553.7 52.9
46.8
Cargo, annual totalsper continent x 1,000 tonnes
0
50
100
150
200
250
300
350
400
450
AsiaMiddle East
AfricaLatin America
North America
Europe
InboundOutbound
24.8
124.182.0 106.4 67.5
430.3
287.8
108.9
50.2
143.1
59.782.9
2008 Compared to 2007 in %
Total 1,567,712 - 2.6%
Passenger services 640,319 - 4.6%
Full-freighter services 927,392 - 1.3%
Inbound 835,107 - 0.2%
Outbound 732,604 - 5.3%
Cargo, annual totalstonnes
3031
(2007 IATA code 2008 Compared to ranking) 2007 in %
1 (1) Shanghai PVG 188,530 + 16.7%
2 (2) Hong Kong HKG 106,959 + 7.8%
3 (3) Dubai DXB 75,253 - 4.0%
4 (6) Nairobi NBO 72,267 + 9.4%
5 (5) Tokyo NRT 69,220 + 3.5%
6 (4) Singapore SIN 55,944 - 16.4%
7 (7) Seoul ICN 48,688 - 11.1%
8 (9) Kuala Lumpur KUL 39,664 - 3.4%
9 (13) Johannesburg JNB 36,978 + 0.2%
10 (11) Chicago ORD 34,011 - 12.0%
11 (8) Atlanta ATL 32,670 - 24.1%
12 (10) Tel Aviv TLV 29,457 - 27.6%
13 (16) Houston IAH 29,371 - 5.6%
14 (15) Mexico City MEX 26,398 - 15.6%
15 (12) New York JFK 26,216 - 31.9%
16 (20) quito UIO 26,204 + 16.3%
17 (17) Osaka KIX 25,359 - 16.3%
18 (14) Taipei TPE 24,504 - 21.8%
19 (18) Beijing PEK 24,115 - 11.5%
20 (22) Bangkok BKK 22,857 + 9.6%
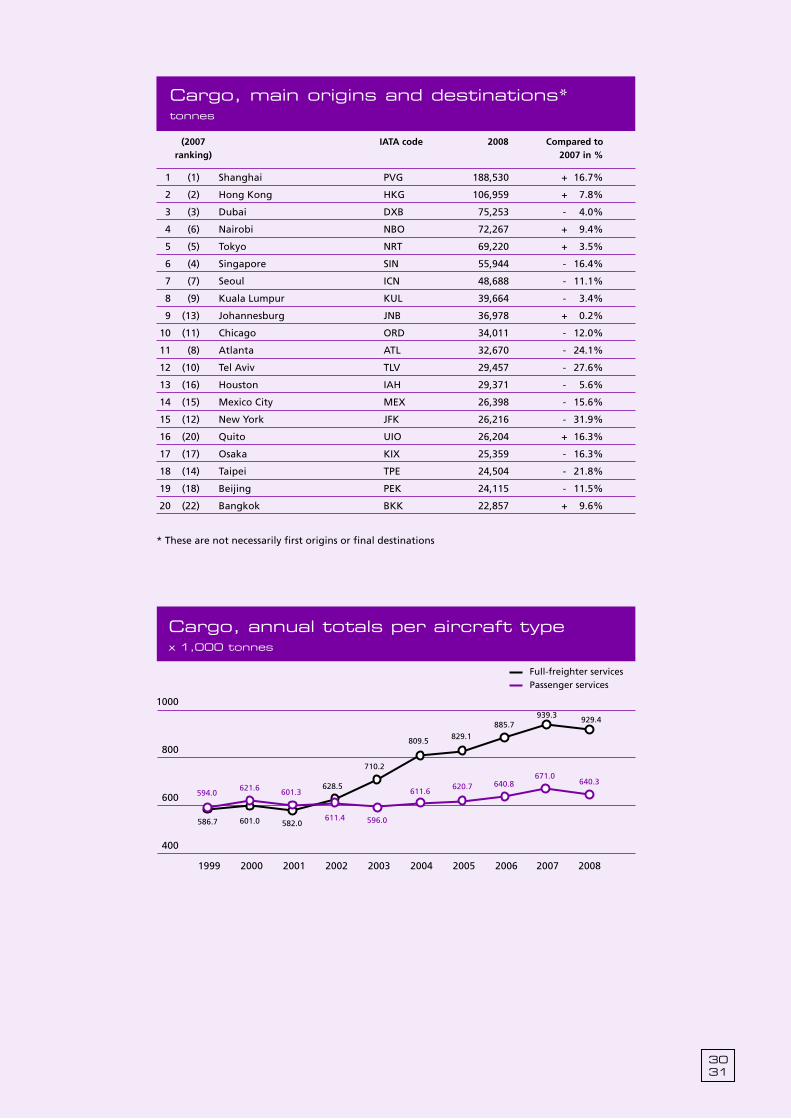
* These are not necessarily first origins or final destinations
Cargo, main origins and destinations*
tonnes
Cargo, annual totals per aircraft type x 1,000 tonnes
Full-freighter servicesPassenger services
400
600
800
1000
2006 20072005200420032002200120001999 2008400
600
800
1000
594.0621.6 601.3
628.5
710.2
809.5
611.6
596.0611.4582.0601.0586.7
829.1885.7
939.3
620.7 640.8671.0
929.4
640.3
Despite a decrease of –0.8% (-0.7% excl. Transit-direct) in passenger numbers, Amsterdam Airport Schiphol retained its fifth place in the ranking of top ten European airports. Amsterdam
Airport Schiphol managed to maintain the third largest cargo airport in
Europe, despite its decrease in cargo transport of –2.6%.
Statistical Annual Review 2005
Other airports
3233
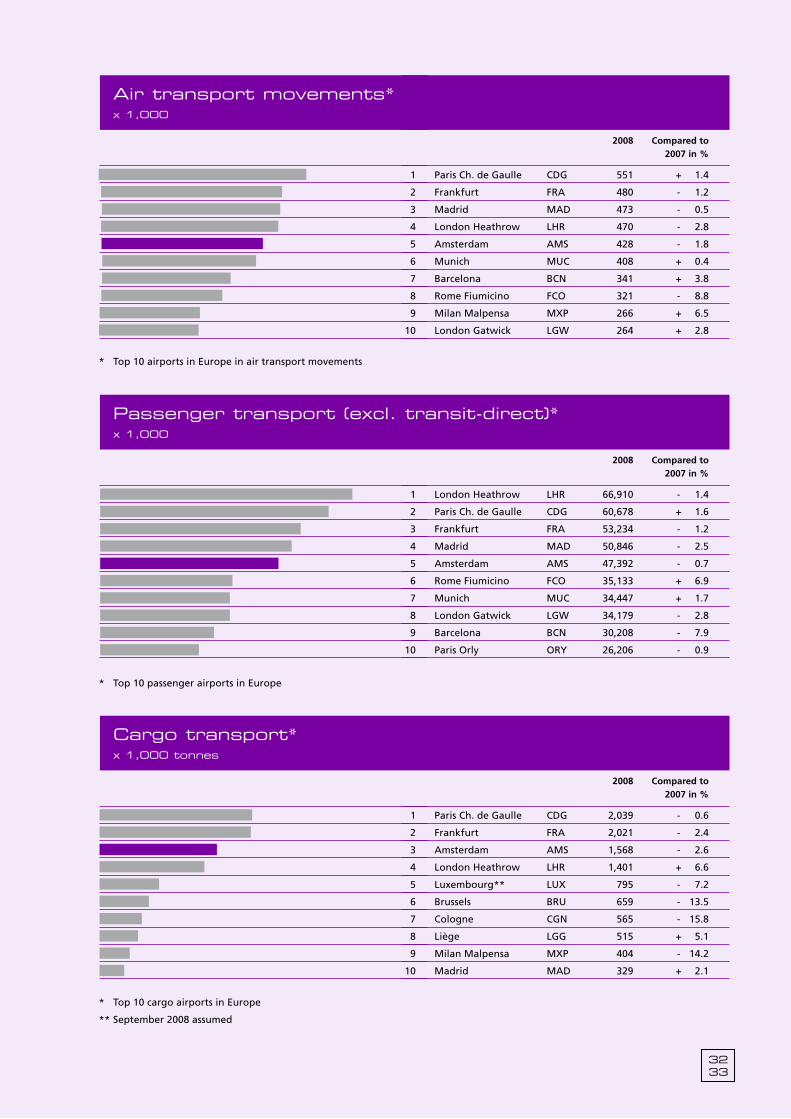
2008 Compared to 2007 in %
1 Paris Ch. de Gaulle CDG 551 + 1.4
2 Frankfurt FRA 480 - 1.2
3 Madrid MAD 473 - 0.5
4 London Heathrow LHR 470 - 2.8
5 Amsterdam AMS 428 - 1.8
6 Munich MUC 408 + 0.4
7 Barcelona BCN 341 + 3.8
8 Rome Fiumicino FCO 321 - 8.8
9 Milan Malpensa MXP 266 + 6.5
10 London Gatwick LGW 264 + 2.8
2008 Compared to 2007 in %
1 London Heathrow LHR 66,910 - 1.4
2 Paris Ch. de Gaulle CDG 60,678 + 1.6
3 Frankfurt FRA 53,234 - 1.2
4 Madrid MAD 50,846 - 2.5
5 Amsterdam AMS 47,392 - 0.7
6 Rome Fiumicino FCO 35,133 + 6.9
7 Munich MUC 34,447 + 1.7
8 London Gatwick LGW 34,179 - 2.8
9 Barcelona BCN 30,208 - 7.9
10 Paris Orly ORY 26,206 - 0.9
passenger transport (excl. transit-direct)*x 1,000
2008 Compared to 2007 in %
1 Paris Ch. de Gaulle CDG 2,039 - 0.6
2 Frankfurt FRA 2,021 - 2.4
3 Amsterdam AMS 1,568 - 2.6
4 London Heathrow LHR 1,401 + 6.6
5 Luxembourg** LUX 795 - 7.2
6 Brussels BRU 659 - 13.5
7 Cologne CGN 565 - 15.8
8 Liège LGG 515 + 5.1
9 Milan Malpensa MXP 404 - 14.2
10 Madrid MAD 329 + 2.1
Cargo transport* x 1,000 tonnes
Air transport movements* x 1,000
* Top 10 cargo airports in Europe
** September 2008 assumed
* Top 10 passenger airports in Europe
* Top 10 airports in Europe in air transport movements
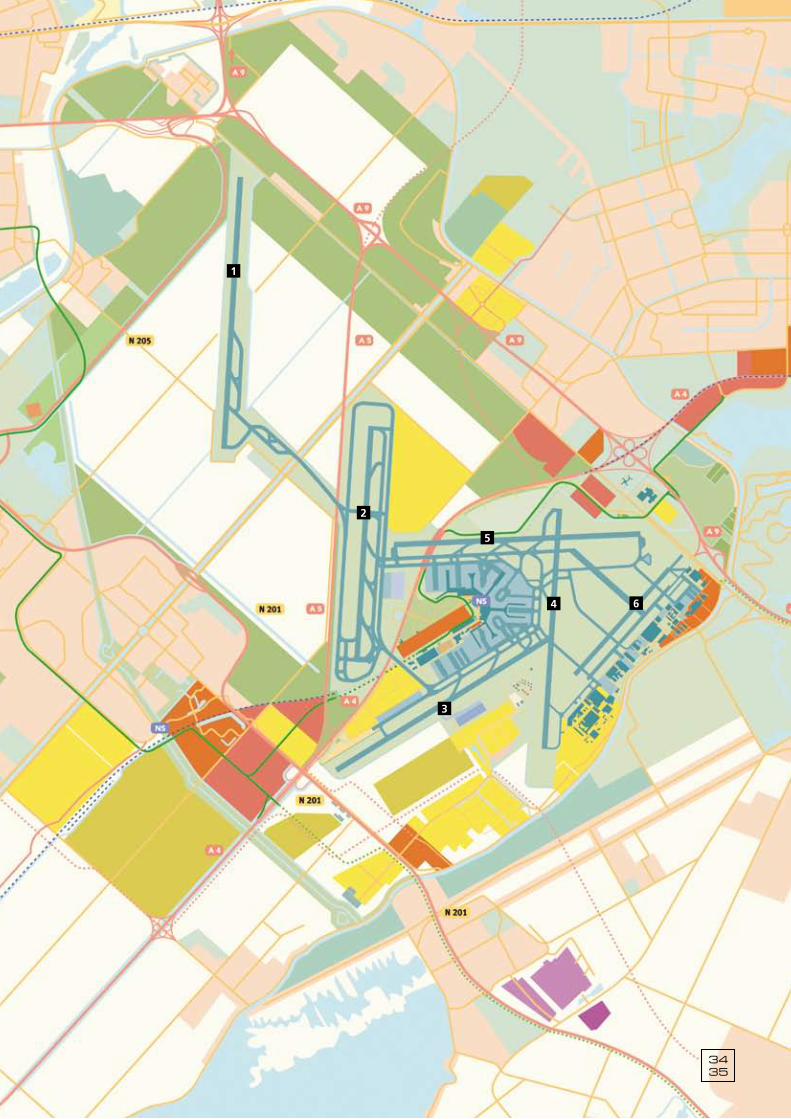
Infrastructure
Traffic Review 2008
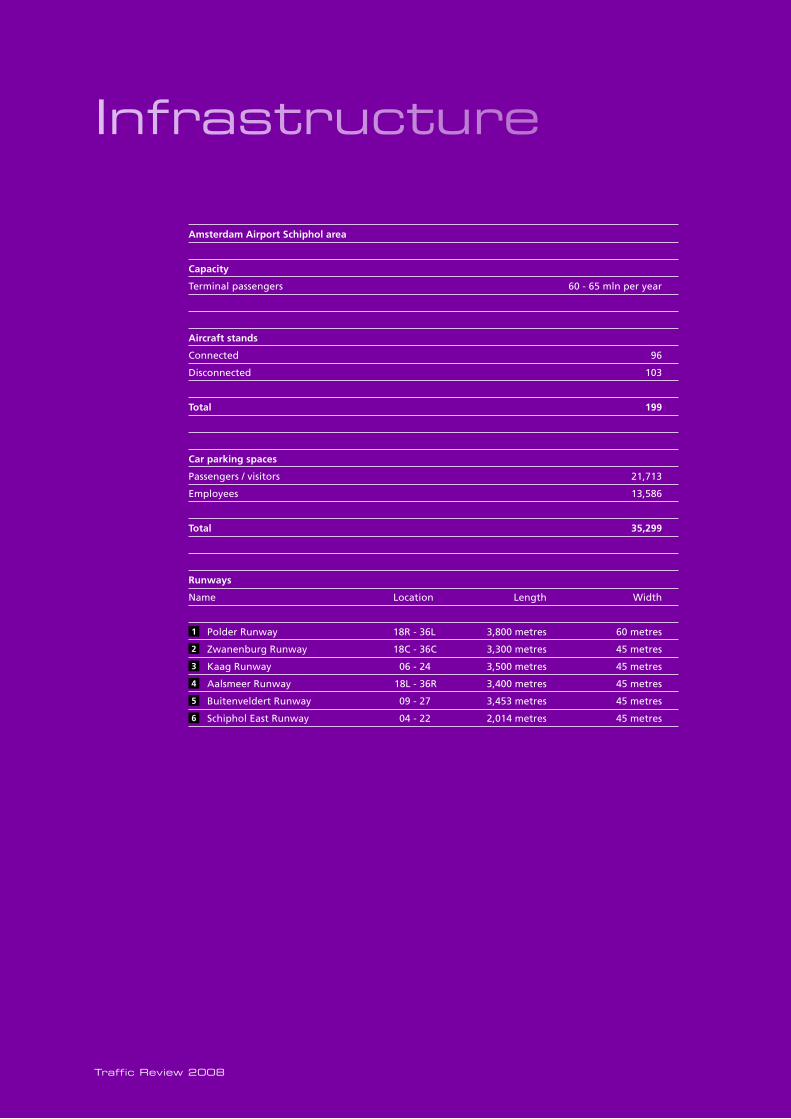
Amsterdam Airport Schiphol area
Capacity
Terminal passengers 60 - 65 mln per year
Aircraft stands
Connected 96
Disconnected 103
Total 199
Car parking spaces
Passengers / visitors 21,713
Employees 13,586
Total 35,299
Runways
Name Location Length Width
Polder Runway 18R - 36L 3,800 metres 60 metres
Zwanenburg Runway 18C - 36C 3,300 metres 45 metres
Kaag Runway 06 - 24 3,500 metres 45 metres
Aalsmeer Runway 18L - 36R 3,400 metres 45 metres
Buitenveldert Runway 09 - 27 3,453 metres 45 metres
Schiphol East Runway 04 - 22 2,014 metres 45 metres
1
2
3
4
5
6
3435
1
2
3
4
5
6
Traffic Review 2008
Air transport movementsAn air transport movement means a landing or take-off. Air transport movement in
scheduled traffic means a movement in commercial traffic according to an official
timetable. Air transport movement in non-scheduled traffic means a non-scheduled
movement in commercial traffic (charters, relief services, etc.; taxi flights excluded).
Cargo transportBoth paying and non paying cargo, including military mail and express cargo.
Goods leaving the airport on the same aircraft as the one by which they have arrived
(transit-direct) are left out of account, as well as trucking cargo.
mail transportMail handled exclusively by TNT Post Group N.V. excluding mail leaving the airport
on the same aircraft as the one by which it has arrived (transit-direct).
Passenger load factorThe passenger load factor means the number of passengers (including 2x transit-direct)
expressed in a percentage of the number of available seats.
Passenger transportAll passengers on scheduled- and non- scheduled flights including service passengers
and infants. Passengers on taxi-, photo- and sightseeing flights are excluded.
O&D passengers
Originating and destinating passengers. Those whose journey by air starts or ends
at Amsterdam Airport Schiphol.
Transfer passengers
Those who change planes within 24 hours without leaving the customs area
are counted both arriving and departing.
Transit-direct passengers
Those who leave the airport on the same flight number as the one by which they arrived,
without leaving the customs area are not counted incoming or outgoing,
but stated separately.
PunctualityPunctuality is the percentage of flights departing/ arriving whithin no more than
15 minutes of its scheduled time on/off blocks, regarding passenger flights only.
mtOwMaximum take-off weight of an aircraft.
Definitions
Recommended