Xiao Jiang
Trade Expansion and Employment Generation: How Mercantilist Does China Have to Be?
October 2011 Working Paper 09/2011 Department of Economics The New School for Social Research
The views expressed herein are those of the author(s) and do not necessarily reflect the views of the New School for Social Research. © 2011 by Xiao Jiang. All rights reserved. Short sections of text may be quoted without explicit permission provided that full credit is given to the source.
1
Trade Expansion and Employment Generation: How Mercantilist Does
China Have To Be?
Xiao Jiang
We conduct an input-output analysis of China’s employment changes due
to changes in trade structure on sectoral level. We find that between 2002
and 2007 China generated about 71 million jobs due to trade expansion.
We also estimate the additional amount of trade that would be needed if
China were using trade surplus as the main tool to absorb its excess labor.
We find that given the enormous magnitude of this estimated amount, this
“mercantilist” approach to excess labor absorption is not feasible. Finally,
using Spearman rank correlation analysis, we find that the ranking of
China’s sectors’ employment generation capacities is inversely related to
the ranking of these sectors’ trade performances. This suggests that the
“mercantilist” approach to excess labor absorption is not only infeasible
but also inefficient. We end the paper by suggesting a more balanced
growth path for China.
Keywords: international trade, labor, China, input-output, factor-content,
growth, employment multipliers
JEL Classifications: F13, F16, J21
1. Introduction
China's economic transformation since its implementation of open-market reforms in
1978 has received much attention, with most of the focus on China’s enormous success in
foreign trade. In 1989 China was still an import surplus country. By 2009, China was the
largest exporting country in the world in terms of export value1. Particularly after 2000,
China's total foreign trade volume and trade surplus grew at an astonishing annual rate.
The theoretical relation between foreign trade and employment has been an issue of
concern to economists for centuries. Much trade theory assumes the resources of a
country are given and fully employed before it enters into international trade.
International trade is presumed therefore to allocate resources more efficiently through
changes in relative prices. Another and older strain of literature sees international trade as
a “vent-for-surplus.” Smith (1776) was the pioneer of this theory and Myint (1958,1977)
wrote extensively on this concept. Contrary to conventional trade theories, this line of
Working paper. Do not quote or circulate without the author’s permission.
Department of Economics, New School for Social Research, New York. USA. Email:
[email protected] 1 WTO (2011). Note that the European Union as a whole is ranked as number one, but
China is ranked number one as a single country.
2
thought sees a country entering into trade while possessing some surplus productive
capacities, including labor. Hence, foreign trade creates additional effective demand for a
country to absorb its surpluses. More recently, Blecker (1997) views the “vent-for-
surplus” as a mechanism for a country to exploit economies of scale through an expanded
increased market resulting from liberalized foreign trade. Elmslie (1996, 2002) argues
that “surpluses” are “vented” through foreign trade by deepening the division of labor
within a country. Both of these explanations seem, on the surface, consistent with China’s
experience of the past 20 years.
As Myint points out2, “vent-for-surplus” can have both pro-free-trade and anti-
free-trade implications. On one hand, countries (such as China) with sizable surplus
productive capacities -- that are more or less costless when used for export production --
would benefit from trade. On the other hand, countries (such as most of the developed
countries) whose productive structures are already well developed will have costly
switching from domestic to export production due to the need for “re-specialization.” For
these countries, free trade would not be beneficial.
In light of this discussion of “vent-for-surplus”, the effect of trade on labor (which
is an important part of surplus productive capacity) is explored empirically in the
literatures. Wood (1995) conducted the factor-content calculation of the change in labor
demand in developed countries due to trade. According to his calculation, for developed
countries, trade drastically reduces demand for unskilled labors but has somewhat
positive effects on skilled labor demand, which in turn contributes to the widening of
domestic inequality. Kucera and Milberg (2003) use input-output analysis to calculate the
effect of trade expansion on manufacturing employment for OECD countries. Their
results demonstrate that, contrary to the conventional theoretical view that trade would
result a mixture of winners and losers in a country, trade expansion causes job loss to
nearly all manufacture sectors in OECO countries. Henceforth, their results reinforce the
recent phenomenon of “de-industrialization” of the West.
These empirical works tend to focus on developed countries. But countries that
“vent” the surplus – some of the largest developing countries – are not sufficiently
studied. Thus, this paper firstly intends to fill this gap by analyzing the employment
implications of China's remarkable trade expansion. Using a standard input-output
method, we find that the growth in international trade has been responsible for the
creation of more than 70 million jobs in China over the period between 2002 and 2007.
Despite this impressive trade performance, China continues to have a considerable
surplus of labor. China is a country with the highest population in the world, and its
economic restructuring has resulted in an enormous migration of labor from rural areas to
cities and from agriculture to manufacturing. The result has been a considerable amount
of excess labor. By some estimates, this surplus labor reached 226 million by 2009.3
In this paper we also address the hypothetical question of how much additional
trade surplus China would need in order to absorb a reasonable portion of its excess
2 Myint (1958, p. 322)
3 See section 3.1 of this paper.
3
labor. The exercise itself begs the question of the merits of a mercantilist4 approach to
job-creation. But recent history has shown China has used trade and FDI promotion,
exchange rates and labor market regulations to serve the goal of surplus labor absorption,
so the question is not outside the realm of debate in contemporary Chinese political
economy. But the question is admittedly an extreme one, and so we subsequently turn to
the question of whether such an approach is feasible. If not, we must ask what else can
be done to address the ongoing problem of surplus labor in China.
This paper is divided into four sections. In Section two we provide an overview of
China's trade performance over 2000-2010. In Section three we introduce the input-
output model used to calculate employment changes due to trade expansion. In the fourth
section we estimate the amount of “excess labor” in China and then invert the algorithm
used in section three in order to calculate the additional trade that would be needed if
trade were the sole means to employ all the excess labor. The fourth section concludes
with some policy discussion based on calculations of sectoral employment multipliers.
We argue that trade alone cannot realistically solve China’s problem of excess labor, but
that other forms of macroeconomic stimulus would be much more effective in attaining
full employment in China.
2. Trade Expansions and Job Creation
2.1. China’s Foreign Trade Performance, 2002-2007
China's total foreign trade (exports plus imports) increased from 355 million Yuan in
1978 (the year of economic reform) to 166,740.2 million Yuan in 2007, that is from 10%
of GDP in 1978 to 66.3% in 2007. Exports grew from 167.6 million Yuan in 1978 to
93,455.6 million Yuan in 2007, and imports rose from 187.4 Yuan in 1978 to 73,284.6
Yuan in 2007 (See figure 15 for 1990 to 2007).
4 Mercantilism – a historical belief that positive trade balance is the solution for most
economic problems. 5 Figure 1 and 2 are compiled by the author.
4
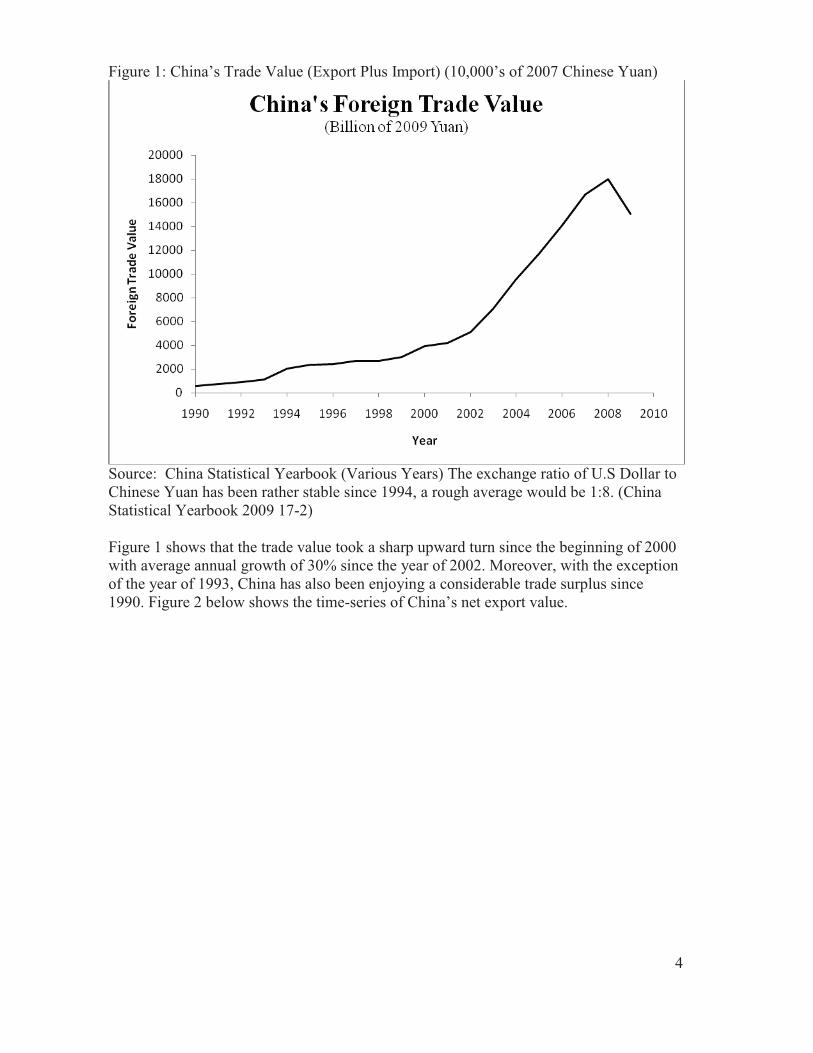
Figure 1: China’s Trade Value (Export Plus Import) (10,000’s of 2007 Chinese Yuan)
Source: China Statistical Yearbook (Various Years) The exchange ratio of U.S Dollar to
Chinese Yuan has been rather stable since 1994, a rough average would be 1:8. (China
Statistical Yearbook 2009 17-2)
Figure 1 shows that the trade value took a sharp upward turn since the beginning of 2000
with average annual growth of 30% since the year of 2002. Moreover, with the exception
of the year of 1993, China has also been enjoying a considerable trade surplus since
1990. Figure 2 below shows the time-series of China’s net export value.
5
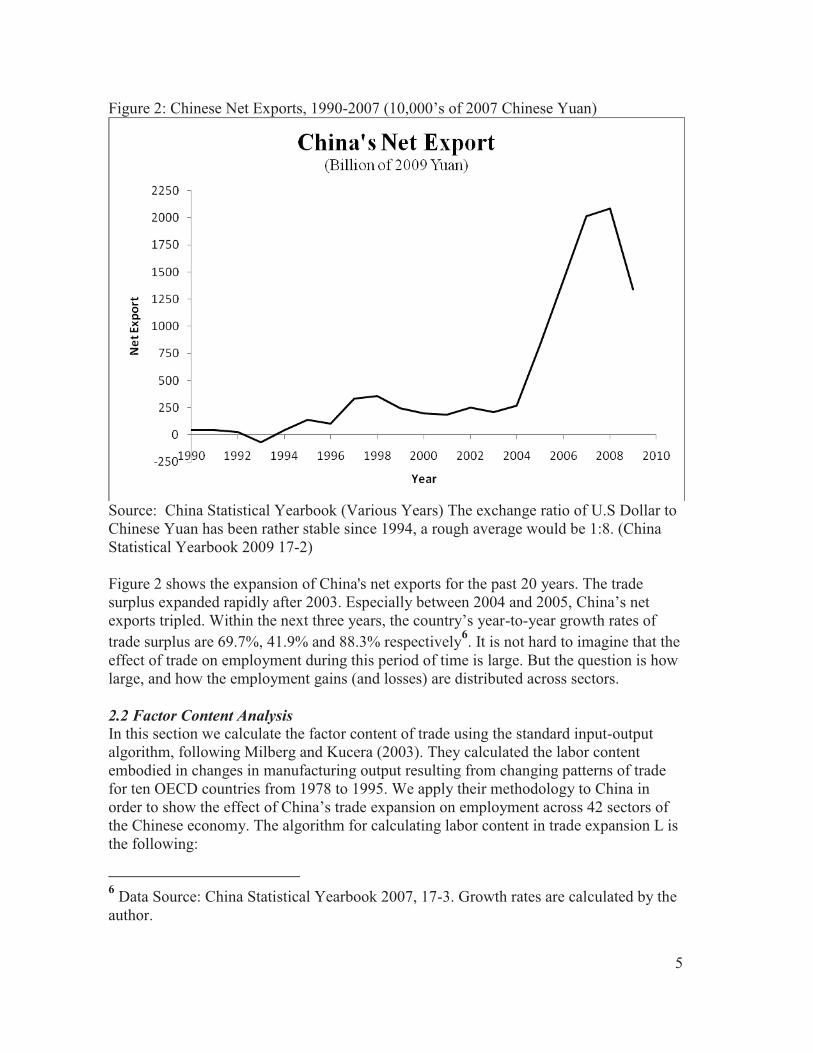
Figure 2: Chinese Net Exports, 1990-2007 (10,000’s of 2007 Chinese Yuan)
Source: China Statistical Yearbook (Various Years) The exchange ratio of U.S Dollar to
Chinese Yuan has been rather stable since 1994, a rough average would be 1:8. (China
Statistical Yearbook 2009 17-2)
Figure 2 shows the expansion of China's net exports for the past 20 years. The trade
surplus expanded rapidly after 2003. Especially between 2004 and 2005, China’s net
exports tripled. Within the next three years, the country’s year-to-year growth rates of
trade surplus are 69.7%, 41.9% and 88.3% respectively6. It is not hard to imagine that the
effect of trade on employment during this period of time is large. But the question is how
large, and how the employment gains (and losses) are distributed across sectors.
2.2 Factor Content Analysis In this section we calculate the factor content of trade using the standard input-output
algorithm, following Milberg and Kucera (2003). They calculated the labor content
embodied in changes in manufacturing output resulting from changing patterns of trade
for ten OECD countries from 1978 to 1995. We apply their methodology to China in
order to show the effect of China’s trade expansion on employment across 42 sectors of
the Chinese economy. The algorithm for calculating labor content in trade expansion L is
the following:
6 Data Source: China Statistical Yearbook 2007, 17-3. Growth rates are calculated by the
author.
6
L E[(I A) 1T ] (1)
In equation 1, A is China's input coefficient matrix; I is the identity matrix; and (I - A)-1
is
therefore the Leontief inverse matrix, in which, where each element aij indicates input
requirement for ith sector if there were a unit increase of the final-use (consumption,
foreign trade, or investment) of the output of the jth sector. ˆ E is the diagonal matrix of
labor coefficients (employment per unit of output), and L is the vector of employment
changes resulting from the changing structure of foreign trade. T, the trade expansion
vector, is defined as follows:
T (X 2007 M 2007) (X 2002 M 2002
)(D2007/ D2002
) (2)
where X and M are export and import values; and D is the vector of domestic demand
which is domestic production plus imports, and superscripts indicate the first and last
years of the sample. T is the difference between the net exports at the end of the period
and the counterfactual level of net exports that would have resulted by the end of that
period had the proportion between net exports and domestic final demand – the
propensity of trade relative to final demand – remained constant in each sector. In other
words, the trade expansion vector is the net exports resulting from the change in the
structure or pattern of trade during the time period being studied.
Vector L is therefore the result of two matrix multiplications. The Leontief
inverse matrix multiplied by the trade expansion vector T produces a vector in which
each element indicates the additional production required to achieve the amount of trade
expansion for each sector. And the ˆ E matrix multiplied by this vector gives the change in
employment in each sector solely due to trade expansion.
2.3. Chinese Input-Output and Employment Data, 2002-2007
Beginning in 1987, China's National Bureau of Statistics (various years) has compiled
and published input-output tables every 5 years. But only in 2002 did China's input-
output tables begin to have 42 sectors that are mostly consistent with international
standards for sector specifications. The A matrix used in this paper is adopted directly
from China's 2007 direct input coefficients table.
Both the 2002 and 2007 input-output tables contain the “Basic Matrix”, which is
the flow of funds matrix from which the direct input coefficients table, A, is derived. All
the values in this matrix are calculated based on producer's prices in the relevant year.
The basic matrix contains the vector of imports, exports, and domestic outputs. Since
they are calculated at the relevant year's producer price, 2007 imports, exports and
domestic output values have to be deflated to 2002 producer's price. We use the producer
price index, published annually in China's Statistical Yearbook. This allows the
calculation of real 2007 exports, imports, and domestic outputs in 2002 producer prices.
Adding the vector of real imports to the real domestic output vector give us D, the
demand vector measured in producers’ prices. With this information, we can now
calculate the trade expansion vector T as well as the Leontief inverse matrix.

7
We turn now to the construction of the diagonal labor coefficients matrix, ˆ E . The
Chinese employment data are not readily available in a format that is consistent with the
42-sector input-output table. The Chinese population is administratively divided into two
categories: urban and rural residents. For decades, citizens with rural residency did not
participate in any detailed national statistical surveys. Only in recent years has data on
rural residents been published, but they are compiled with a different standard. Still today
only urban employment data are available in a format useful for the present analysis. In
the past 20 years, China has experienced an enormous rural-urban migration due to its
market opening and industrialization. Nonetheless, it has been extremely difficult for
rural residents to change their official status to "urban". As a consequence, it is likely that
a large amount of employees across all sectors are holding "rural" residencies, and thus
employment data on urban residents understate actual employment (Chow, 2008).
Despite this data problem, it is still possible to estimate labor coefficients with the
available data. First, the basic matrix includes a vector called "total employee
compensation." We call this vector E. Second, the China’s National Bureau of Human
Resources publishes data on average annual wages by sector. From 2000 to 2002 the
breakdown is 32 sectors, and after 2002, this is expanded to coverage across 128 sectors.
With the use of the sector specification concordance form made available by National
Bureau of Statistics (2008), we are able to aggregate the 128 sectors into the 42 sectors
that are consistent with sectoral breakdown of the input-output tables. By doing so, we
are able to obtain the vector of sectoral average annual wages in 2003, W03. Using this
vector, we estimate 2002 sectoral average annual wages, W02, by deflating W03 by the rate
of increase of total average annual wages from 2002 to 2003 (0.129%). This allows us to
calculate E*W02-1
as the labor coefficients estimates for 2002 by sector -- consistent with
the sectoral breakdown in the input-output table. Note that we are making an assumption
here about the homogeneity of rural and urban labor and by implication that there is no
wage discrimination between urban workers and rural workers. This assumption is
reasonable especially for primary and secondary industries in which labor tends to be
relatively homogenous and low-skilled. However, this assumption might result in an
underestimation of labor in tertiary industries.
Finally, the labor coefficient vector is defined as follows:
EW02
1Q02
1
(3)
where Q02-1
is the vector of total output taken from the 2002 basic matrix. Since Q02-1
is
calculated in producer prices in units of 10,000 Yuan like every vector in the basic matrix,
the calculated labor coefficients are essentially the numbers of workers required to
produce 10,000 Yuan worth of output for each sector in 2002. The diagonalization of
this vector will give us the ˆ E matrix. With the ˆ E matrix, we are then able to calculate
the employment change vector, L, as defined in (1).
2.4. Employment calculations
8
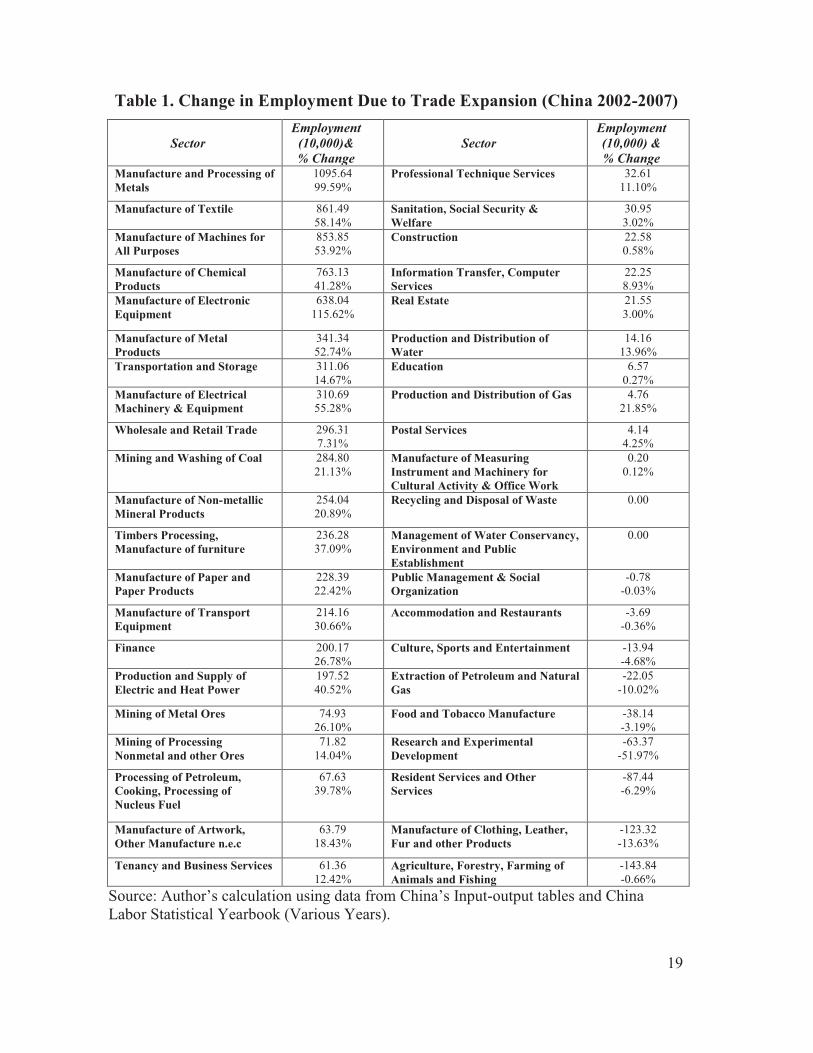
Calculations of the employment from trade expansion by sector is presented in Table 1,
which lists sectors in descending order of jobs created. According to this calculation,
during the period from 2002 to 2007, China's trade expansion has generated about 70.9
million jobs in total. As indicated above, the particular algorithm used here controls the
counterfactual level of trade surplus by imposing a constant trade propensity, that is a
constant ratio of trade to output. One can imagine that the employment generated by the
trade surplus as a whole would be much bigger given the rapid overall economic growth
China has experienced since 2000.
– Table 1 about here –
Amongst the 42 sectors, only 9 sectors lost employment as a result of trade, and
none of the sectors has lost more than 1.5 million jobs. Total employment losses amount
to 4.97 million. On the other hand, 31 sectors have gained employments, and 16 of the
sectors have gained at least two million jobs. Total employment gain amounts to 75.9
million. It is rather clear from the results that almost all the manufacturing sectors fall
within the employment-gaining category, and most of the high job-gaining sectors are
manufacturing sectors. This result corresponds to the findings of manufacture
employment losses in developed countries due to deindustrialization (Milberg and
Kucera’s, 2003). Blecker (1989) discussed the possibility that “countries with
competitive advantage and chronic trade surpluses can export unemployment to their
deficit-ridden trading partners.” (Blecker, 1989, p. 396) China has run a trade surplus for
more than 20 years; at the same time, its population structure along with its economic
reforms have “freed-up” enormous amount of underutilitized capacity and cheap labor to
the market sphere which made Chinese exports extremely competitive in international
market (Freeman, 2004). From this perspective, the results, especially on manufacturing
sectors, might be viewed as the amount Chinese unemployment has been “exported” to
its deficit-ridden trading partners.
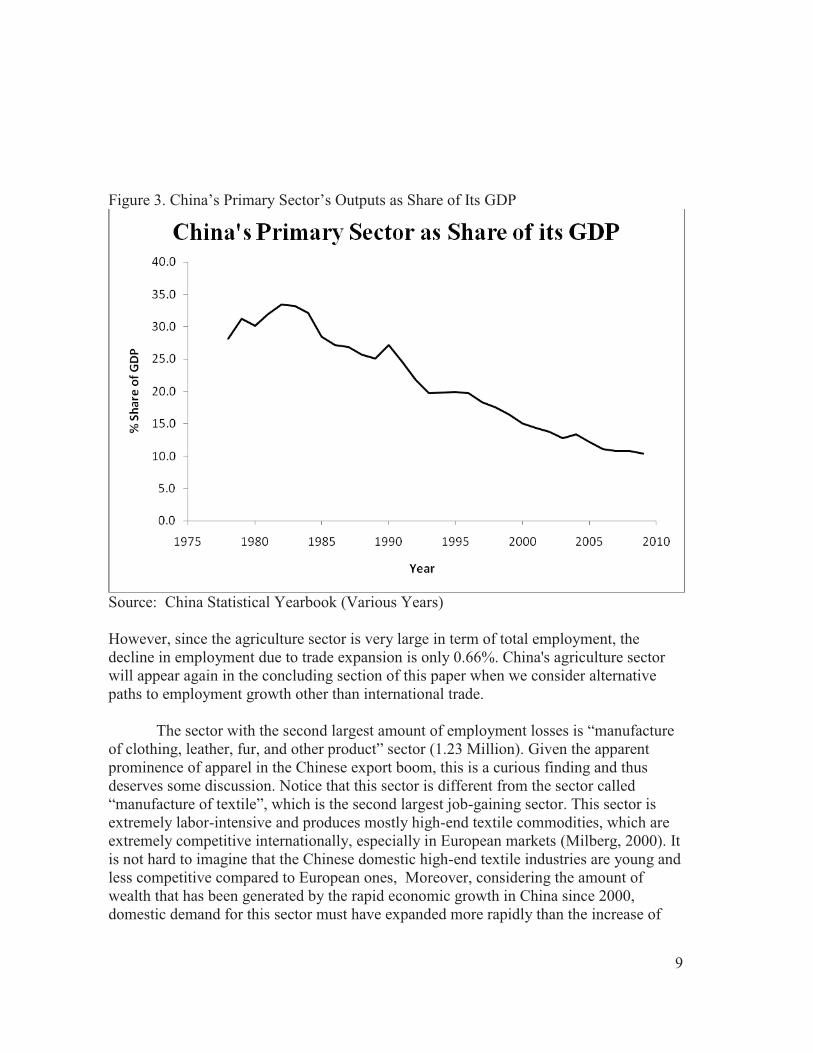
Regarding the 9 job-losing sectors, the “agriculture, forestry, farming of animals
and fishing” sector is the one that has lost the most (1.44 million). The Chinese economy
has historically been an agricultural economy. Yet throughout modern history, Chinese
economic policies have been particularly hostile toward the agriculture sector. For
example, China was one of the very few countries in the world to impose a high tax
(about 50%) on agriculture production, and for decades, Chinese farmers were burdened
with various fees from local governments (Li et al. 1998). The economic boom since the
1990s has favored the Chinese manufacturing sector. As the result, the agriculture sector
has suffered the problem of abandoned farmland7, and this problem was particularly
apparent in the late 1990s and beginning of 2000s. This is also evident from figure 3
below where one can observe the decline of China’s primary sector’s output as a share of
its GDP.
7 The phenomenon caused by farmers leaving their farmlands to become manufacture
wage-labors in cities.
9
Figure 3. China’s Primary Sector’s Outputs as Share of Its GDP
Source: China Statistical Yearbook (Various Years)
However, since the agriculture sector is very large in term of total employment, the
decline in employment due to trade expansion is only 0.66%. China's agriculture sector
will appear again in the concluding section of this paper when we consider alternative
paths to employment growth other than international trade.
The sector with the second largest amount of employment losses is “manufacture
of clothing, leather, fur, and other product” sector (1.23 Million). Given the apparent
prominence of apparel in the Chinese export boom, this is a curious finding and thus
deserves some discussion. Notice that this sector is different from the sector called
“manufacture of textile”, which is the second largest job-gaining sector. This sector is
extremely labor-intensive and produces mostly high-end textile commodities, which are
extremely competitive internationally, especially in European markets (Milberg, 2000). It
is not hard to imagine that the Chinese domestic high-end textile industries are young and
less competitive compared to European ones, Moreover, considering the amount of
wealth that has been generated by the rapid economic growth in China since 2000,
domestic demand for this sector must have expanded more rapidly than the increase of
10
trade surplus for this sector. Only in this case do we expect to see an employment loss.
What we see in Table 1 is the employment loss due to the change in trade structure
instead of simply due to a change in net exports. This argument is evident in the input-
output data, which shows that, for this sector, the trade surplus has doubled between 2002
and 2007, but total domestic demand for this sector’s output in 2007 is 2.5 times 20028.
Our calculations show that China's trade expansion has successfully generated
millions of jobs and reduced their burden of unemployment. But what is the size of the
labor pool China would need to absorb if it were to attain anything close to full
employment? Is it possible to use additional foreign trade to absorb at least a reasonable
portion of them? These questions will be addressed in the next section.
3. How Mercantilist Does China Have To Be?
The change of ownership structure as part of China's open market reform has resulted in a
serious problem of unemployment and underemployment. (Jefferson and Rawski 1992),
This have become a major concern of the central government since the late 1990s. Given
the scale of employment that has been created by trade expansion, we can use our input-
output framework to assess how much additional trade surplus would be needed from the
world in order to absorb China’s excess labor. Would the world have enough demand to
be able to sustain such a “vent-for-surplus”? We address this question by first providing
an overview of China's employment in the past 20 years, and then, using the same input-
output model used above to estimate the trade surplus vector.
3.1 Unemployment in China: An Alternative Estimate
Unemployment is a tricky concept to define and measure in the case of China. Up until
the mid-1990s, the labor market in China was relatively well protected from the
turbulence of economic reform. Prior to the mid-1990s, managers of state-owned-
enterprises were prohibited from firing employees, and college graduates were placed in
state jobs by the government (Chow, 2007). As one can imagine, during that period of
time, the problem was not unemployment, but labor market inefficiency. The situation
took a radical turn when the government changed the ownership structure of state-owned-
enterprises during the 1990s. What immediately followed was a massive wave of layoffs.
The workers laid off from the previously fully state-owned enterprises are called “xia
gang”, and they are not officially counted as unemployed because they are still associated
with the enterprises where they were employed. But they have no work to do, and the
state provides them only with very limited xia gang benefits. The number of xia gang
workers is rather large according to official figures. For example, the number of state
workers was 113 million in 1995, and as of 2007, it fell to 64 million. (China Labor
Statistical Yearbook, 2008) Furthermore, due to the lack of relevant skills and education,
the “xia gang” population tends to be either discouraged from the labor market and retire
8 For 2002 and 2007, Net Exports for this sector are 2.3 x 10⁷ Yuan and 4.8 x 10⁷ Yuan,
but Domestic Production are 7.1 x 10⁷ Yuan and 1.8 x 10⁸ Yuan, both adjusted to 2002
producer’s price.

11
early, or left to pick up various part-time jobs. Furthermore, the migrant workers from
countryside have also over-saturated the urban low-skilled labor market.
According to official unemployment data, the unemployment rates from 1995 to
2007 ranged between 2.9% and 4.3% (China Labor Statistical Yearbook, 2007, Table 2-
1). In light of the discussion above, we posit that the official data understate the
unemployment situation, and perhaps to a very large extent. According to Cai et al.
(2008), an individual is only counted as unemployed when he or she registers for
unemployment benefits with the state; the bureau of statistics does not conduct
representative sample surveys to estimate unemployment. As a result of this way of
defining and measuring unemployment, a large amount of xia gang and underemployed
workers are not reflected in the statistics, which results in an understatement of the
employment problem in China. Cai et al. (2008) develop an alternative measure of
Chinese unemployment, defined as the difference between the so-called economically
active urban population9 (EAUP) and the employed urban population. (Cai et al. 2008)
This measure is problematic due to its urban bias, as discussed above. Given the
difficulties involved in measuring unemployment, we propose to measure the “excess
labor” instead of unemployment. Excess labor is the population that is capable of
working but is not. The amount of excess labor will be more than actual unemployment
because it includes those who are capable of working but not willing to work; however,
this number does not omit rural residents. Our research question now becomes: how
much additional trade surplus would China need if it were to absorb the excess labor in
the economy?
We estimate excess labor (EL) as follow:
EL PP16
Pelders PStudents TE (4)
EL is the amount of excess labor, which is total population over the age of 16 years, P+16 ,
minus the population over the age of 60 years, Pelders, minus the population between 16
and 60 years old who are at school, Pstudents, and minus the total amount of people who
are employed in the economy (TE) estimated as in section 2.3.
In 2007, the population above 16 years of age was1.04 billion, and the population
above 60 was 153 million10
. Population above 16 in school is approximated by the sum
of high school, undergraduate and post-graduate students in 2007, that is 52.8 million11
.
The total employment figure does not need to depend on official (urban-biased) data. It
can be estimated using the input-output data and the China Labor Statistical Yearbook
dataset, and applying the same algorithm as described in Section 2.3. This gives a sum
total of employment for all sectors in 2007 of 603.3 million. The estimated excess labor,
9 Urban population that are above 16, willing and able to work.
10 Downloaded at http://news.163.com/08/0229/14/45SJQDUR000120GU.html.
11 China Statistical Yearbook (2008).
12
therefore, is 225.965 million. This number is much larger than both official and the Cai et
al. (2008) estimation of unemployment.
3.2 Estimation Method and Results
It is tempting to estimate the amount of additional trade surplus that would be needed if
China were to absorb all the excess labor by applying the same algorithm, but solving it
backwards. However, we suspect that the results will not be very meaningful for two
main reasons. First, one can imagine the amount of trade surplus that is needed to absorb
226 million workers is going to be so large as to be completely unsustainable given
reasonable levels of world demand. Second, the trade surplus is simply a component of
final demand, along with consumption, investment, and government spending. No
country, no matter how mercantilist, would use foreign trade to absorb all of its excess
labor. Hence, we ask the question differently: how much additional trade surplus would
China need to absorb a reasonable portion of its excess labor? We use the proportion of
employment that is directly generated by foreign trade in 2007 as this reasonable
proportion.
We begin with the inverse of the model in section one:
Ts (I A) ˆ E 1 LE (5)
LE is the vector of excess labor to be absorbed. Again, due to the lack of appropriate
sectoral data, the vector LE must estimated; in other words, the total amount of excess
employment has to be distributed among the sectors for them to absorb. There are
numerous ways to go about it, but it is most reasonable to distribute the excess labor in
accordance to its employment-related trade-performance, as follows: First, compute the
amount of employment, , resulting from the change of trade surpluses between 2007
and 2002:
ˆ E (I A) 1 (NE 07 NE 02
) (6)
Expression (6) is simply the algorithm that appeared in Section 2.2, but this time the
difference in net exports is not the trade expansion vector; instead, it is the actual change
in the value of net exports. In other words, simply measures the amount of
employment in each sector resulting from the actual growth or decline of the trade
surplus. The estimated is a vector of employment, with some values being negative.
Since we want to use the job-creating sectors to absorb excess labor, we eliminate all the
job-losing sectors and turn into *. Finally, we compute a vector of percentages, ,
as follows:
* ( * i) 1 (7)
where i is a vector of 1’s (the summation vector). Premultiplying by * produces the
vector sum. Each element in is the corresponding sector’s share of the total amount of
employment generated due to the increase in the trade surplus. A sector with a high share
must be a sector that has high employment-related trade performance. In other words,
13
this sector not only does well with trade surpluses, but also has a high employment
multiplier12
. And finally, the excess labor is simply distributed as below:
LE EL
i
TE
(8)
where v is the fraction of excess labor that needs to be absorbed by the trade surplus, and
is equal to the portion of total employment that is directly generated by trade in the past.
We are depicting a scenario in which a semi-central planning government
designates each sector of the economy a share of a given fraction of excess labor to
absorb based on that sector’s past performance in generating employment through trade.
There are certainly many other ways we can go about distributing the excess labor. This
distribution makes sense for a trade surplus country like China. Furthermore, since we are
interested in seeing the general scale of additional trade surplus that would be needed
instead of the specific sectoral results, this way of splitting up the excess labor will
produce numbers that are at least informative and meaningful.
At this point, we have all the data needed to make calculations using (6). As one
can imagine, the job-creating sectors need to have enormous amounts of additional trade
surplus. The total amount of additional trade surplus needed is approximately 265 billion
measured in 2007 U.S dollar. Thus to answer our question, if trade were used to absorb
the estimated excess labor in China, the trade surplus has to effectively double over its
2007 level.
The result overstates the problem. First, the input-output algorithm estimation
does not take overall economic growth into account. The rapid growth of the Chinese
economy over time would reduce the burden of excess labor absorption required from the
foreign sector. Second, given the fact that each sector has its distinct labor coefficient and
output multiplier, a different distribution of excess labor across the sectors would produce
potentially very different estimates for the volume of needed additional trade surplus.
What we have presented here is an extreme, mercantilist, case. Third, the self-estimated
total employment likely has some margin of error -- for example, it does not reflect the
underground economy which is known to be rather large in China. By some estimates
(Schneider, 2002), it has reached to almost 20% of its GNP by the beginning of 2000s.
Nevertheless, the result seems to suggest that given the extent of the excess labor
problem in China, using trade as an instrument to absorb a fraction of that where the
fraction is the share of employment from trade in 2007 is not even feasible for that it
would require China to almost double its already enormous trade surplus in 2007.
Between 2002 and 2007, China indeed has successfully created jobs through foreign
12
Employment multiplier measures a sector’s capability of generating employments
given a unit of increase of its final demand. This concept will be discussed in details in
section three.
14
trade expansion. However, if foreign trade were used as an instrument for even a
reasonable proportion of excess labor absorption, how mercantilist would China have to
be? Our estimation suggests that demand from the rest of the world simply cannot sustain
this agenda. Hence, to resolve the problem of excess labors, the government has to look
into some alternatives other than foreign trade.
4. Non-mercantilist Job Creation: Multiplier Analysis, Policies and Concluding
Remarks
If the world cannot sustain a highly mercantilist approach to excess labor absorption,
what alternatives does China have? This is quite an open-ended question, which many
industrial policy specialists have been tackling (Cai, 2008; Lin, 2003). In this section, we
will provide some insights to this question based on the analytical framework adopted in
this paper, the input-output approach.
The foreign trade surplus is of course simply one component of final demand,
along with consumption, investment, and government spending. Therefore, in a static
model, an increase in any component of final demand would generate employment.
Realistically speaking then, trade is not the only solution. But what is the technical
relationship between final demand and employment generation? In an input-output
framework, with given technical coefficients, the capacity for employment generation for
each sector depends on two factors: one, the degree of labor intensity; and two, the extent
of the entire economy's dependence on this particular sector13
. The variable that captures
both factors for each sector is the employment multiplier, M,14
defined as follows:
Me [(I A) 1]T i ˆ E (9)
No new notation is introduced in this algorithm. Again, i is the summation vector; and ˆ E is the diagonal matrix of labor coefficients. Here we use end-year (2007) labor
coefficients instead of 2002. The logic behind this algorithm is rather simple. [(I - A)-1
]Ti
gives the vector of column sums15
for the Leontief inverse. Each column sum represents
the amount of outputs generated in the entire economy given one unit increase of the
corresponding sector’s final demand. The computation captures the extent of the entire
economy’s dependence on the respective sector's output. This vector then multiplied by ˆ E transforms the column sums into physical employment numbers, giving the amount of
employment the entire economy can generate for each unit increase of final demand for
each respective sector, that is, the employment multipliers.
The calculated employment multipliers are reported in Table 2 sorted in
descending order. If we compare Table 2 with Table 1, we realize that sectors that do
13
This is called the degree of indirect effect. See Miller (2009). 14
For a detailed theoretical discussion of multiplier analysis, please see Miller (2009)
Chapter 6. 15
Noticing that the transpose turns row sums into column sums.
15
well with trade expansion job-generation are not sectors with high employment
multipliers. To see this relation more precisely, we compute two Spearman rank
correlation coefficients. The first is the rank correlation between the vector of
employments generated through trade expansion (which was calculated in Section 2.4)
and the corresponding vector of employment multipliers. The result is -0.28, which
means the rankings of these two vectors are negatively correlated16
. The second is the
rank correlation between the vector of by sector percentage changes of employments and
the vector of employment multipliers. This calculation therefore takes into account the
relative growth (or reduction) of each sector’s initial employment size. This coefficient is
again negative and even larger (-0.33). We conclude from the analysis that the sectors
that tend create more jobs (both in absolute and relative terms) due to trade expansion
from 2002 to 2007 mostly tend to be the sectors with lower employment multipliers. This
analysis suggests that the strategy of letting the sectors with high trade performance to
absorb excess labor is highly inefficient for the purpose of job creation.
–Table 2 about here –
Among those sectors with high employment multipliers, the agriculture sector
again stands out as the outlier with extremely high employment multiplier relative to
other sectors. Chinese agriculture sector is highly labor-intensive due to technological
backwardness (Chow, 2007). Recall from above that this is also the sector that has lost
the most employment due to changes in the trade structure. The other sectors that are on
top of the list in table 3 are all service sectors with high labor intensities, and most of the
sectors have either very limited or no foreign trade content due to the characteristics of
their outputs. As we move down on the list, we start to see more and more of the export-
oriented – and capital intensive – sectors.
It is well documented that China's development strategy has emphasized heavy on
capital-intensive industries to sustain steady and rapid GDP growth (Chow, 2007;
Kroeber, 2006). For example, enterprises in those industries have favorable tax treatment
and easy access to low-interest credit. The rapid development of these sectors allowed
them to become internationally competitive very quickly (Cai et al. 2008, Chow, 2007),
which explains the high trade performance we observed in Section one above. The other
side of the story is that those labor-intensive primary sectors have lagged behind in the
process of Chinese economic development. Not only they do these sectors not receive
favorable tax and loan treatment, but there also exist many institutional barriers to entry
in these sectors. Putting aside the agricultural sector, all of the top ten high employment
multiplier sectors are heavily, if not entirely, monopolized by the state. The sector that is
most problematic is again the agricultural sector for reasons that have been discussed in
section 2.4, and this sector happens to be the sector with the highest employment
multiplier. The problem with agriculture caught the central government's attentions in the
mid-1990s. In the beginning of 2000s, the government started to experiment by imposing
extremely low taxes on agricultural income in several poor and agricultural provinces. In
16
Spearman rank correlation coefficient is bounded between 1 and -1, where 1 indicates
perfect correlation and -1 indicates perfect inverse correlation.
16
2006, the government completely removed agriculture taxes for the entire country, and
started to provide subsidies to farmers. Given its high employment multiplier, we expect
those favorable agriculture policies to be effective in generating employment in the future.
Lastly, a few words shall be said on China’s service sectors. Over the past 30 years, the
tertiary sector in China has grown drastically from 23.9% of it GDP in 1978 to 43.4% as
of 2009 (China Statistical Yearbook, 2009). Its contribution to the overall employment
creation is indeed significantly positive, but such contribution does not come about via
the channel of trade due to the fact that many of the tertiary outputs are non-tradable by
nature.
To conclude we return to our central research question: What should China do to
resolve the problem of excess labor? We saw in Section one that its trade expansion in
the 2000s successfully generated millions of jobs domestically, and the counterpart of
this story is that millions of jobs have been lost due to de-industrialization for developed
countries. However, due to the extent of excess labor, as well as the low employment
multipliers associated with those high trade performing sectors, using foreign trade as the
main instrument to absorb excess labor may be impossible given the limits of foreign
demand. The multiplier analysis suggests that the government should focus on sectors
that are highly labor-intensive, especially the agriculture sector. What this entails is a
change in the economic policy path China has been following since its reform, namely,
from capital-intensive industrial development to a more balanced development path with
higher growth in primary sectors and less growth in heavy industry. Regarding the
agriculture sector, China has already been moving in this direction. (Lin, 2003) Tax
policy should induce agricultural investment demand, which along with the new
agricultural subsidies (as government spending) will produce the final demand increase
and trigger the employment multiplier effects. Indeed, in the past decade, China has
magically achieved the goal of steady and rapid GDP growth, astonishing the rest of the
world. The next goal in China's economic transformation should be to achieve more
balanced growth and social harmony.17
Mercantilist trade expansion should have its
historical beginning and end.
Acknowledgement
I am grateful to William Milberg and Duncan Foley and participants in the New School-
UMass conference and the Western Economics Association conference for discussion of
the topic and comments on a previous draft. I am also grateful to Mr. Zhaohui Gu who
played an indispensable role in collecting and organizing the Chinese data. All errors are
my sole responsibility.
17
Ironically, Harmonious Society is the political goal the new Chinese administration
propagates.
17
References
1. Balasubramanyam, N., and X. Fu. 2005. Exports, foreign direct investment and
employment: the case of China. The World Economy 28, no. 4: 607-625.
2. Blecker, R. 1997. The ‘Unnatural and Retrograde Order’: Adam Smith’s Theories
of Trade and Development Reconsidered. Economica., 64: 527-37.
3. Blecker, R. 1989. International Competition, Income Distribution and Economic
Growth, Cambridge Journal of Economics 13, no. 3: 395-412
4. Cai, F., A. Park, and Y. Zhao. 2008. Chapter 6: The Chinese Labor Market in the
Reform Era. In Loren, B., and T. Rawski. eds. China’s Great Economic
Transformation. New York: Cambridge University Press.
5. China’s Input-Output Tables (2002, 2007), National Bureau of Statistics, Beijing.
6. China Statistical Yearbook (2008), National Bureau of Statistics, Beijing.
7. China Labor Statistical Yearbook (2002,2003), National Bureau of Human
Resources, Beijing.
8. Chow, G. 2007. China’s Economic Transformation. MA and Oxford: Blackwell
Publishing.
9. Elmslie, B. 2002. Vent for Surplus: A Case of Mistaken Identity. Southern
Economic Journal 68, no. 3: 712-720.
10. Elmslie, B. 1996. The Role of Joint Products in Adam Smith’s Explanation of the
“Vent-for-Surplus” Doctrine. History of Political Economy 28, no. 3: 513-23.
11. Freeman, R. 2006. The Great Doubling: The Challenge of the New Global Labor
Market. Harvard University working paper, August.
12. Jefferson, G., and T. Rawski. 1992. Unemployment, Underemployment, and
Employment Policy in China’s Cities. Modern China 18, no.1: 42-71.
13. Kroeber, A. 2006. China’s Industrial and Foreign Trade Policies: What Are They
and How Successful Have They been? Conference Paper for China’s political
economy in comparative and theoretical perspectives conference, University of
Indiana, May.
14. Kucera, D., and W. Milberg. 2003. Trade Expansion and Employment in the
OECD: New Factor Content Calculations for 1978-1995. Weltwirtschaftliches
Archive 139, no. 4: 601-624.
18
15. Kucera, D., and W. Milberg. 2000. Gender Segregation and Gender Bias in
Manufacturing Trade: Revisiting the Wood Asymmetry. World Development, 28:
1191-1210.
16. Li, G., S. Rozelle, and L. Brandt. 1998. Tenure, Land Rights, and Farmer
Investment Incentives in China. Agriculture Economics, 19: 63-71.
17. Lin, J., C. Fang, and Z. Li. 2003 The China Miracle. Hong Kong: The Chinese
University Press.
18. Miller, R., and P. Blair. 2009. Input-Output Analysis. 2nd Edition. New York:
Cambridge University Press.
19. Myint, H. 1977. Adam Smith’s Theory of International Trade in the Perspective
of Economic Development. Economica 44, no. 175: 231-248.
20. Myin, H. 1958. The “Classical Theory” of International Trade and the
Underdeveloped Countries. The Economic Journal 68, no. 270: 317-337.
21. Schneider, F. 2002. Size and measurement of the informal economy in 110
countries around the world. Paper presented at Workshop of Australian National
Tax Centre, ANU, Canberra, Australia, July 17.
22. Smith, A. 1776. An Inquiry into the Nature and Causes of the Wealth of Nations.
edited by E. Cannan. London: Methuen. (Reprint in 1904.)
19
Table 1. Change in Employment Due to Trade Expansion (China 2002-2007)
Sector
Employment
(10,000)&
% Change
Sector
Employment
(10,000) &
% Change
Manufacture and Processing of
Metals
1095.64
99.59%
Professional Technique Services 32.61
11.10%
Manufacture of Textile 861.49
58.14%
Sanitation, Social Security &
Welfare
30.95
3.02%
Manufacture of Machines for
All Purposes
853.85
53.92%
Construction 22.58
0.58%
Manufacture of Chemical
Products
763.13
41.28%
Information Transfer, Computer
Services
22.25
8.93%
Manufacture of Electronic
Equipment
638.04
115.62%
Real Estate 21.55
3.00%
Manufacture of Metal
Products
341.34
52.74%
Production and Distribution of
Water
14.16
13.96%
Transportation and Storage 311.06
14.67%
Education 6.57
0.27%
Manufacture of Electrical
Machinery & Equipment
310.69
55.28%
Production and Distribution of Gas 4.76
21.85%
Wholesale and Retail Trade 296.31
7.31%
Postal Services 4.14
4.25%
Mining and Washing of Coal 284.80
21.13%
Manufacture of Measuring
Instrument and Machinery for
Cultural Activity & Office Work
0.20
0.12%
Manufacture of Non-metallic
Mineral Products
254.04
20.89%
Recycling and Disposal of Waste 0.00
Timbers Processing,
Manufacture of furniture
236.28
37.09%
Management of Water Conservancy,
Environment and Public
Establishment
0.00
Manufacture of Paper and
Paper Products
228.39
22.42%
Public Management & Social
Organization
-0.78
-0.03%
Manufacture of Transport
Equipment
214.16
30.66%
Accommodation and Restaurants -3.69
-0.36%
Finance 200.17
26.78%
Culture, Sports and Entertainment -13.94
-4.68%
Production and Supply of
Electric and Heat Power
197.52
40.52%
Extraction of Petroleum and Natural
Gas
-22.05
-10.02%
Mining of Metal Ores 74.93
26.10%
Food and Tobacco Manufacture -38.14
-3.19%
Mining of Processing
Nonmetal and other Ores
71.82
14.04%
Research and Experimental
Development
-63.37
-51.97%
Processing of Petroleum,
Cooking, Processing of
Nucleus Fuel
67.63
39.78%
Resident Services and Other
Services
-87.44
-6.29%
Manufacture of Artwork,
Other Manufacture n.e.c
63.79
18.43%
Manufacture of Clothing, Leather,
Fur and other Products
-123.32
-13.63%
Tenancy and Business Services 61.36
12.42%
Agriculture, Forestry, Farming of
Animals and Fishing
-143.84
-0.66%
Source: Author’s calculation using data from China’s Input-output tables and China
Labor Statistical Yearbook (Various Years).

20
Table 2. Employment Multipliers
Sector Employment
Multiplier Sector
Employment
Multiplier
Agriculture, Forestry, Farming of
Animals and Fishing 1.09E-04 Accommodation and Restaurants
1.64E-05
Public Management & Social
Organization 4.00E-05 Manufacture of Paper and Paper
Products 1.60E-05
Education 3.90E-05 Wholesale and Retail Trade 1.46E-05
Postal Services 3.67E-05
Manufacture of Machines for
General and Special Purposes 1.38E-05
Management of Water
Conservancy, Environment and
Public Establishment 3.44E-05
Manufacture of Measuring
Instrument and Machinery for
Cultural Activity & Office Work 1.36E-05
Mining of Processing Nonmetal
and other Ores 2.76E-05 Tenancy and Business Services
1.28E-05
Research and Experimental
Development 2.66E-05 Manufacture of Transport
Equipment 1.11E-05
Sanitation, Social Security &
Social Welfare 2.63E-05 Manufacture of Chemical
Products 1.09E-05
Production and Distribution of
Water 2.42E-05 Manufacture of Electrical
Machinery & Equipment 9.30E-06
Manufacture of Artwork, Other
Manufacture n.e.c 2.26E-05 Production and Distribution of
Gas 9.11E-06
Manufacture of Clothing, Leather,
Fur and other Products 2.25E-05 Transportation and Storage
9.03E-06
Construction 2.23E-05
Manufacture of Electronic
Equipment 8.85E-06
Mining and Washing of Coal 2.15E-05 Food and Tobacco Manufacture 8.36E-06
Timbers Processing, Manufacture
of furniture 2.10E-05 Extraction of Petroleum and
Natural Gas 8.22E-06
Manufacture of Non-metallic
Mineral Products 1.98E-05 Finance
7.32E-06
Manufacture of Textile 1.87E-05
Manufacture and Processing of
Metals 6.61E-06
Mining of Metal Ores 1.82E-05
Production and Supply of
Electric and Heat Power 5.91E-06
Professional Technique Services 1.79E-05
Information Transfer, Computer
Services 5.40E-06
Culture, Sports and
Entertainment 1.74E-05
Real Estate 5.17E-06
Resident Services and Other
Services 1.73E-05
Processing of Petroleum,
Cooking, Processing of Nucleus
Fuel 5.03E-06
Manufacture of Metal Products 1.66E-05 Recycling and Disposal of Waste 9.38E-07
Source: Author’s calculation using data from China’s Input-output tables (Various Years).
Recommended