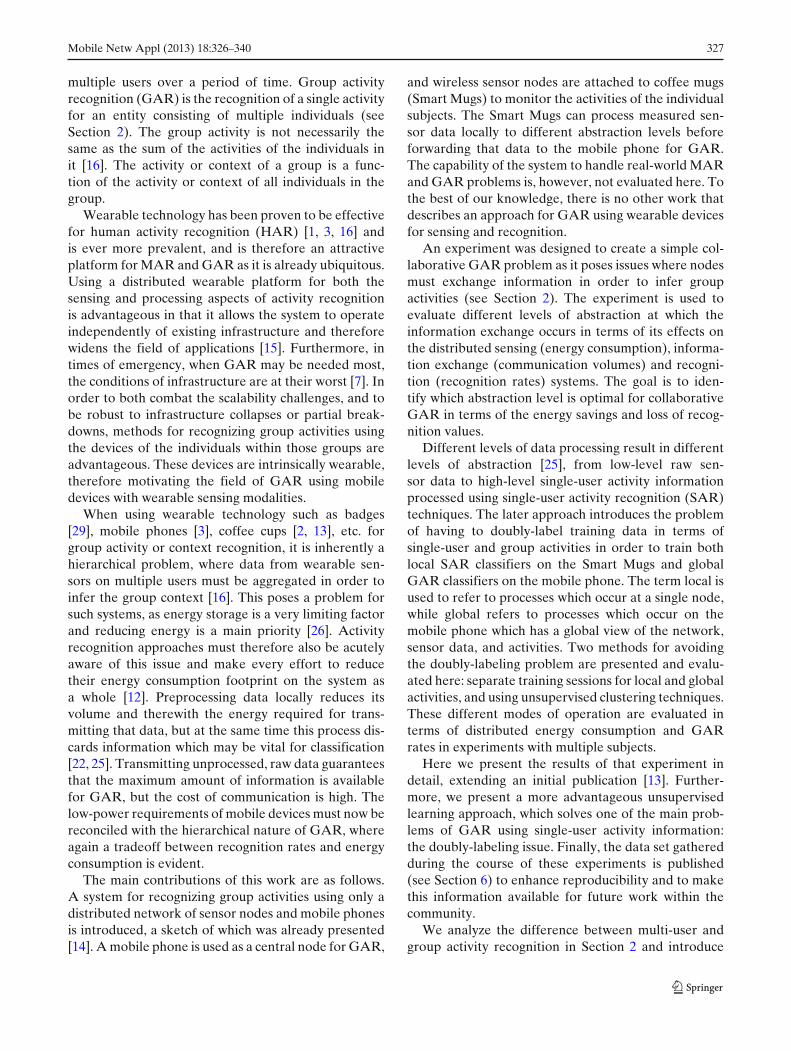
Mobile Netw Appl (2013) 18:326–340DOI 10.1007/s11036-012-0415-x
Towards Collaborative Group Activity RecognitionUsing Mobile Devices
Dawud Gordon · Jan-Hendrik Hanne ·Martin Berchtold · Ali Asghar Nazari Shirehjini ·Michael Beigl
Published online: 19 October 2012© Springer Science+Business Media New York 2012
Abstract In this paper, we present a novel approachfor distributed recognition of collaborative group ac-tivities using only mobile devices and their sensors.Information must be exchanged between nodes foreffective group activity recognition (GAR). Here weinvestigated the effects of exchanging that informa-tion at different data abstraction levels with respectto recognition rates, power consumption, and wirelesscommunication volumes. The goal is to identify thetradeoff between energy consumption and recognitionaccuracy for GAR problems. For the given set of activ-ities, using locally extracted features for global, groupactivity recognition is advantageous as energy con-sumption was reduced by 10 % without experiencingany significant loss in recognition rates. Using locallyclassified single-user activities, however, caused a 47 %loss in recognition capabilities, making this approachunattractive. Local clustering proved to be effective for
D. Gordon (B) · A. A. N. Shirehjini · M. BeiglKarlsruhe Institute of Technology (KIT),Vincenz-Prießnitz-Strasse 1, 76137 Karlsruhe, Germanye-mail: [email protected]
A. A. N. Shirehjinie-mail: [email protected]
M. Beigle-mail: [email protected]
J.-H. HanneTechnische Universität Braunschweig, Pockelsstrasse 12,38106 Braunschweig, Germanye-mail: [email protected]
M. BerchtoldAGT Group GmbH, Hilperstrasse 20a,64295 Darmstadt, Germanye-mail: [email protected]
recognizing group activities, by greatly reducing powerconsumption while incurring a loss of only 2.8 % inrecognition accuracy.
Keywords Group activity recognition ·Context recognition · Distributed systems ·Multi-user · Wearable
1 Introduction
Context and activity recognition provide intelligent de-vices in the environment with the ability to act proac-tively in the interest of users [23]. Many of us now carryaround one or more intelligent devices constantly, andthe number of intelligent systems in our environmentsuch as entertainment systems, vending machines andinformational displays is steadily increasing [2, 29]. Im-plicit pro-active interaction based on situational aware-ness is increasingly more important in order to preventus from entering a state of permanent distraction andinformational overload [12]. This state is a result of con-stantly having to administrate and respond to the myr-iad of intelligent devices in our immediate environment[3]. One vision within pervasive and ubiquitous com-puting sees environments progressing from single-user,private devices to include multi-user devices runningprivate applications for those users who are present. Achallenge then becomes not only recognizing the con-text of the single user interacting with the device as withmobile phones [3], but now attempting to recognize theactivity of a group of individuals interacting with thesystem or the environment [13].
In this work we define multi-user activity recogni-tion (MAR) as the recognition of distinct activities of
Mobile Netw Appl (2013) 18:326–340 327
multiple users over a period of time. Group activityrecognition (GAR) is the recognition of a single activityfor an entity consisting of multiple individuals (seeSection 2). The group activity is not necessarily thesame as the sum of the activities of the individuals init [16]. The activity or context of a group is a func-tion of the activity or context of all individuals in thegroup.
Wearable technology has been proven to be effectivefor human activity recognition (HAR) [1, 3, 16] andis ever more prevalent, and is therefore an attractiveplatform for MAR and GAR as it is already ubiquitous.Using a distributed wearable platform for both thesensing and processing aspects of activity recognitionis advantageous in that it allows the system to operateindependently of existing infrastructure and thereforewidens the field of applications [15]. Furthermore, intimes of emergency, when GAR may be needed most,the conditions of infrastructure are at their worst [7]. Inorder to both combat the scalability challenges, and tobe robust to infrastructure collapses or partial break-downs, methods for recognizing group activities usingthe devices of the individuals within those groups areadvantageous. These devices are intrinsically wearable,therefore motivating the field of GAR using mobiledevices with wearable sensing modalities.
When using wearable technology such as badges[29], mobile phones [3], coffee cups [2, 13], etc. forgroup activity or context recognition, it is inherently ahierarchical problem, where data from wearable sen-sors on multiple users must be aggregated in order toinfer the group context [16]. This poses a problem forsuch systems, as energy storage is a very limiting factorand reducing energy is a main priority [26]. Activityrecognition approaches must therefore also be acutelyaware of this issue and make every effort to reducetheir energy consumption footprint on the system asa whole [12]. Preprocessing data locally reduces itsvolume and therewith the energy required for trans-mitting that data, but at the same time this process dis-cards information which may be vital for classification[22, 25]. Transmitting unprocessed, raw data guaranteesthat the maximum amount of information is availablefor GAR, but the cost of communication is high. Thelow-power requirements of mobile devices must now bereconciled with the hierarchical nature of GAR, whereagain a tradeoff between recognition rates and energyconsumption is evident.
The main contributions of this work are as follows.A system for recognizing group activities using only adistributed network of sensor nodes and mobile phonesis introduced, a sketch of which was already presented[14]. A mobile phone is used as a central node for GAR,
and wireless sensor nodes are attached to coffee mugs(Smart Mugs) to monitor the activities of the individualsubjects. The Smart Mugs can process measured sen-sor data locally to different abstraction levels beforeforwarding that data to the mobile phone for GAR.The capability of the system to handle real-world MARand GAR problems is, however, not evaluated here. Tothe best of our knowledge, there is no other work thatdescribes an approach for GAR using wearable devicesfor sensing and recognition.
An experiment was designed to create a simple col-laborative GAR problem as it poses issues where nodesmust exchange information in order to infer groupactivities (see Section 2). The experiment is used toevaluate different levels of abstraction at which theinformation exchange occurs in terms of its effects onthe distributed sensing (energy consumption), informa-tion exchange (communication volumes) and recogni-tion (recognition rates) systems. The goal is to iden-tify which abstraction level is optimal for collaborativeGAR in terms of the energy savings and loss of recog-nition values.
Different levels of data processing result in differentlevels of abstraction [25], from low-level raw sen-sor data to high-level single-user activity informationprocessed using single-user activity recognition (SAR)techniques. The later approach introduces the problemof having to doubly-label training data in terms ofsingle-user and group activities in order to train bothlocal SAR classifiers on the Smart Mugs and globalGAR classifiers on the mobile phone. The term local isused to refer to processes which occur at a single node,while global refers to processes which occur on themobile phone which has a global view of the network,sensor data, and activities. Two methods for avoidingthe doubly-labeling problem are presented and evalu-ated here: separate training sessions for local and globalactivities, and using unsupervised clustering techniques.These different modes of operation are evaluated interms of distributed energy consumption and GARrates in experiments with multiple subjects.
Here we present the results of that experiment indetail, extending an initial publication [13]. Further-more, we present a more advantageous unsupervisedlearning approach, which solves one of the main prob-lems of GAR using single-user activity information:the doubly-labeling issue. Finally, the data set gatheredduring the course of these experiments is published(see Section 6) to enhance reproducibility and to makethis information available for future work within thecommunity.
We analyze the difference between multi-user andgroup activity recognition in Section 2 and introduce
328 Mobile Netw Appl (2013) 18:326–340
a definition for these terms, and a categorization ofGAR and MAR approaches into cooperative and col-laborative recognition problems. We then provide ex-plicit, formal definitions of cooperative and collabora-tive single-user, multi-user and group activity recogni-tion problems. A brief survey of related work based onthese definitions and categorizations is then presentedin Section 3.
The rest of this paper is organized as follows: Section2 provides a formal definition of SAR, MAR and GARand describes their characteristics. Related work is thendescribed in Section 3. Section 4 describes the GAR ap-proach and the system proposed in this paper, followedby a description of the experiment in Section 5. Thedata set which represents a portion of the contributionof this work is described in Section 6. Section 7 presentsresults that are analyzed and discussed in Section 8. InSection 9, we conclude the paper and present plans forfuture work.
2 Single-user, multi-user and group activities
In this work we differentiate between single-user activ-ity recognition (SAR), multi-user activity recognition(MAR) and group activity recognition (GAR), whichare all forms of human activity recognition (HAR).The research here is focused on wearable systems, butresults should be generalizable to other approachessuch as video or audio recognition systems. Theseterms, specifically MAR and GAR, have been multiplydefined across related work, sometimes synonymously[28] while other times defined in a contradictory man-ner by different works (compare [16] and [22]). Here anew definition of MAR and GAR is presented with afurther classification into collaborative or cooperativerecognition.
For all types of HAR, labels from the label spaceare usually assigned to areas of the activity space insuch a way as to make the activities for all labelsmutually exclusive. Although this does not have to be
the case, overlapping activities create a different kindof recognition problem which must be addressed.
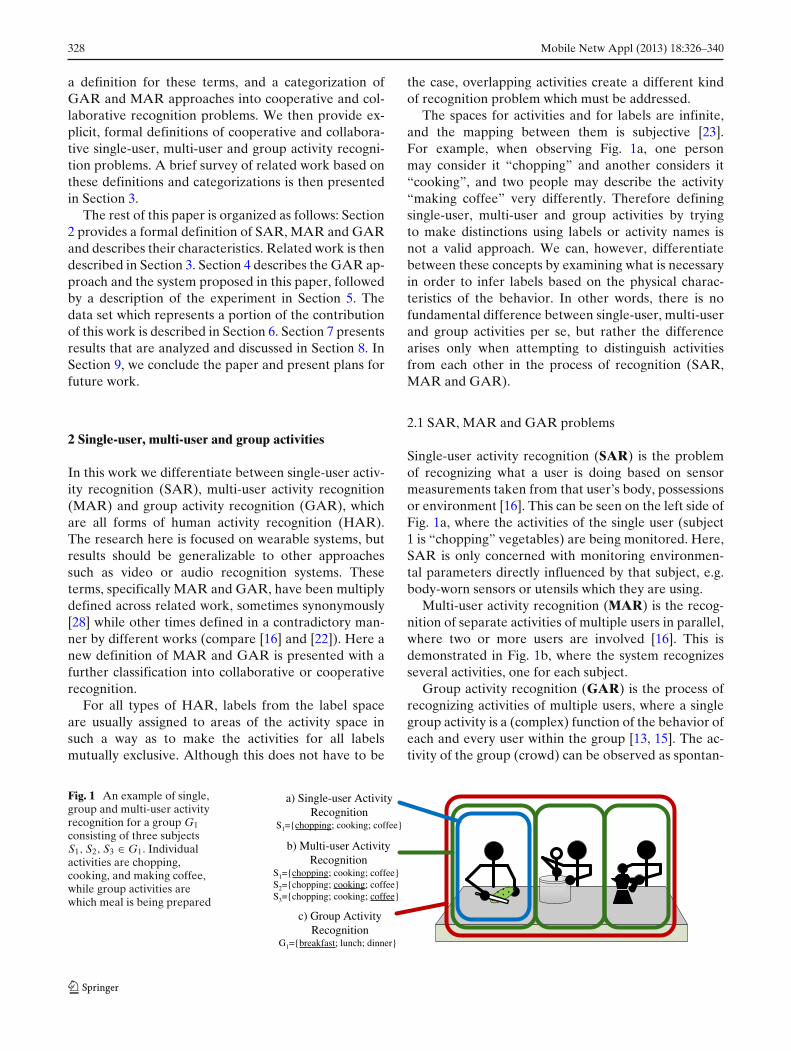
The spaces for activities and for labels are infinite,and the mapping between them is subjective [23].For example, when observing Fig. 1a, one personmay consider it “chopping” and another considers it“cooking”, and two people may describe the activity“making coffee” very differently. Therefore definingsingle-user, multi-user and group activities by tryingto make distinctions using labels or activity names isnot a valid approach. We can, however, differentiatebetween these concepts by examining what is necessaryin order to infer labels based on the physical charac-teristics of the behavior. In other words, there is nofundamental difference between single-user, multi-userand group activities per se, but rather the differencearises only when attempting to distinguish activitiesfrom each other in the process of recognition (SAR,MAR and GAR).
2.1 SAR, MAR and GAR problems
Single-user activity recognition (SAR) is the problemof recognizing what a user is doing based on sensormeasurements taken from that user’s body, possessionsor environment [16]. This can be seen on the left side ofFig. 1a, where the activities of the single user (subject1 is “chopping” vegetables) are being monitored. Here,SAR is only concerned with monitoring environmen-tal parameters directly influenced by that subject, e.g.body-worn sensors or utensils which they are using.
Multi-user activity recognition (MAR) is the recog-nition of separate activities of multiple users in parallel,where two or more users are involved [16]. This isdemonstrated in Fig. 1b, where the system recognizesseveral activities, one for each subject.
Group activity recognition (GAR) is the process ofrecognizing activities of multiple users, where a singlegroup activity is a (complex) function of the behavior ofeach and every user within the group [13, 15]. The ac-tivity of the group (crowd) can be observed as spontan-
Fig. 1 An example of single,group and multi-user activityrecognition for a group G1consisting of three subjectsS1, S2, S3 ∈ G1. Individualactivities are chopping,cooking, and making coffee,while group activities arewhich meal is being prepared
a) Single-user ActivityRecognition
S1={chopping; cooking; coffee}
b) Multi-user ActivityRecognition
S1={chopping; cooking; coffee}S2={chopping; cooking; coffee}S3={chopping; cooking; coffee}
c) Group ActivityRecognition
G1={breakfast; lunch; dinner}
Mobile Netw Appl (2013) 18:326–340 329
ious emergent behavior, generated from the activitiesand interactions of the individuals within it [6, 27, 30].Figure 1c shows this where without knowledge of allof the users, it is improbable that the system will inferthe correct activity, as the activities of each user areambiguous with respect to the group activities (e.g.“chopping” could be preparation of any meal). Onlythe 3-equation-problem given by observing all subjectsprovides enough evidence for accurate inference.
In the same way that multiple sensors placed on thehuman body, each sensing only “arm”, “leg” or “hip”parameters can be used to infer the activity of the entireperson (SAR) [1, 3], we propose that sparse sensingof the actors within the group can be used to inferthe activity of the group as a whole [13, 15]. This isanalogous to treating the group of individuals as anorganism in and of itself, rather than the sum of itsparts. Although group activities are to the individualsin the group as single-user activities to the limbs of theuser, the same methods can not necessarily be applied.Interactions between humans are far more complexthan those between e.g. “knee” and “hip,” and there-fore their relationship to the behavior generated is farmore complex as well. Further research is required tounderstand what can and can not be used from SARfor GAR.
2.2 Cooperative and collaborative recognition
For MAR and GAR problems we define two distinctclasses: cooperative recognition problems and collab-orative recognition problems. Cooperative and collab-orative here do not refer to the type of human in-teractions occurring between the the users, but ratherthe type of interaction required between the subjectactivity models in order to recognize behavior.
Cooperative recognition problems are those in whichonly sensors local to a single individual are required toinfer the activity. Based on these sensors, a model canbe constructed in order to recognize behavior based onreadings. This can be conducted independently of otherindividuals in the environment. The activity models,however, may be imperfect which can cause errorsin recognition. Using information about neighboringactivity (e.g. if one subject is “chopping” then othersubjects may be more likely to be “cooking”) can helpto correct these errors, therefore the cooperative natureof the recognition approach.
Collaborative recognition problems are those in whichthe activity being performed is fundamentally depen-dent on information from multiple subjects. This class
of problems requires that data from multiple individ-uals be fused in order to infer their activity, while notrestricting whether or not it is one activity per user(MAR) or one activity per group (GAR). Since recog-nition is not possible without fusion, meaning activitiescannot be modeled without observing multiple users,this class is referred as “collaborative.”
An example Imagine an indoor track and field areain which we are monitoring activities. Now imagine asingle subject using that track whose activity we aremonitoring, and let’s say he or she can only performone of three things: “run,” “walk” and take a “break”.This is a SAR problem since we are monitoring a singlesubject (see Fig. 1a) and cooperative problem, sincesensor information from that user is used to infer theiractivity. If they were to be wearing multiple sensingdevices, where each device is not capable of inferringactivity on its own, we could then refer to this as beingcollaborative SAR problem.
Now imagine the same situation but one more sub-ject enters the track, where the two do not know eachother, are of different skill levels, etc., so that they arenot in any way interacting. This is now a MAR problem(see Fig. 1b) and a cooperative problem since we arerecognizing individual activities for multiple subjects,where the dependence of each recognition problem isonly on the sensors of that subject.
Going one step further, imagine the same situation,except where the two are now acquaintances and takea “break” together at some point, during which wedon’t know what they do, but only that they do ittogether. Now the system must recognize “run,” “walk”and “break” for both subjects (MAR), but because wecannot be sure if they are taking a break we must nowobserve both subjects in order to find out, making thisa collaborative MAR problem. Notice how two of theactivities “run” and “walk” do not change, but depend-ing on what you are trying to distinguish them from, itis either a collaborative or a cooperative problem.
Now imagine the same situation with more users(no effect with respect to MAR/GAR, cooperative/collaborative), where they are all members of a team,meaning all individuals perform one of the activities inunison. Combining all activities together where whenevery one is walking the single group activity is “walk”converts a cooperative MAR problem in a GAR prob-lem due to the fact that we are recognizing a sin-gle activity for the group (see Fig. 1c). Similarly, thegroup activity could be obtained by observing only onesubject, since what he or she is doing is also whatthe group is doing, therefore it is a cooperative GARproblem.
330 Mobile Netw Appl (2013) 18:326–340
Finally, observing the last example where a teamperforms the activities “run,” “walk” and “break,” andchanging it such that the team takes breaks together buteach individual has a varying skill level such that theactivity “walk and run” is possible, this fundamentallychanges the nature of the recognition problem. Now,all members of the group must be observed since itcannot be assumed that if one subject is walking thatthe group is walking and so on. By adding one activ-ity, the problem becomes one of collaborative GAR.Once again notice that the difference between coop-erative and collaborative problems is not an intrinsicproperty of the activities, but rather of the recognitionproblem.
2.3 Formalization
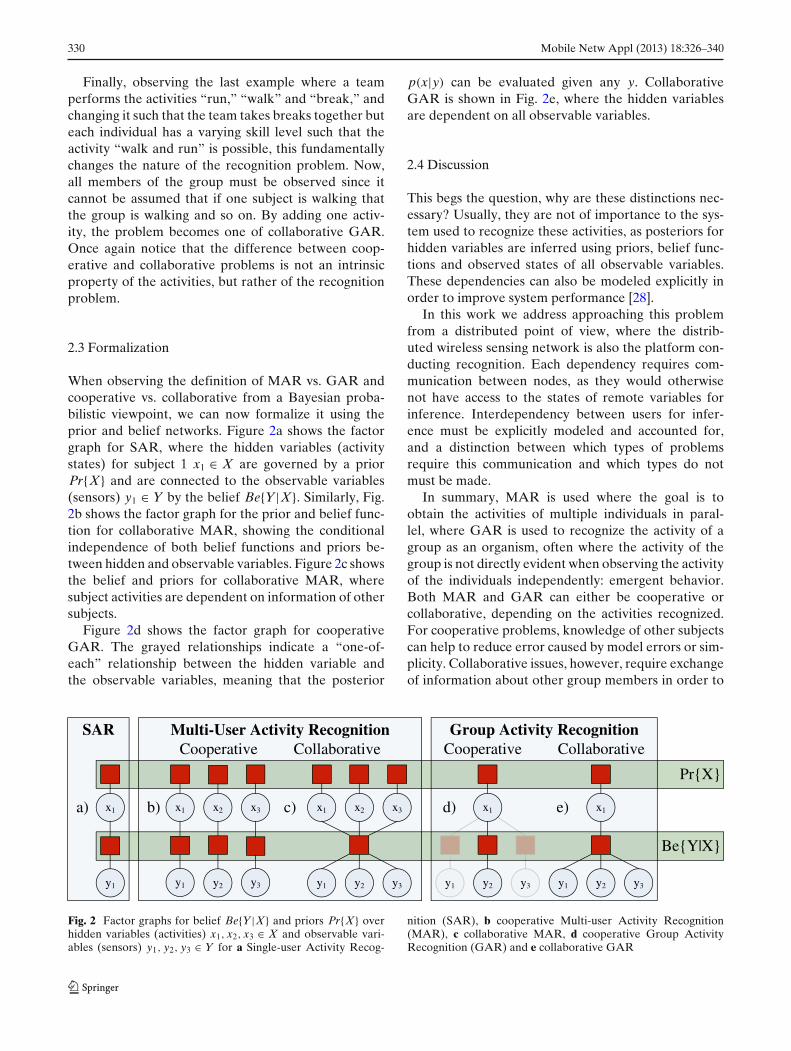
When observing the definition of MAR vs. GAR andcooperative vs. collaborative from a Bayesian proba-bilistic viewpoint, we can now formalize it using theprior and belief networks. Figure 2a shows the factorgraph for SAR, where the hidden variables (activitystates) for subject 1 x1 ∈ X are governed by a priorPr{X} and are connected to the observable variables(sensors) y1 ∈ Y by the belief Be{Y|X}. Similarly, Fig.2b shows the factor graph for the prior and belief func-tion for collaborative MAR, showing the conditionalindependence of both belief functions and priors be-tween hidden and observable variables. Figure 2c showsthe belief and priors for collaborative MAR, wheresubject activities are dependent on information of othersubjects.
Figure 2d shows the factor graph for cooperativeGAR. The grayed relationships indicate a “one-of-each” relationship between the hidden variable andthe observable variables, meaning that the posterior
p(x|y) can be evaluated given any y. CollaborativeGAR is shown in Fig. 2e, where the hidden variablesare dependent on all observable variables.
2.4 Discussion
This begs the question, why are these distinctions nec-essary? Usually, they are not of importance to the sys-tem used to recognize these activities, as posteriors forhidden variables are inferred using priors, belief func-tions and observed states of all observable variables.These dependencies can also be modeled explicitly inorder to improve system performance [28].
In this work we address approaching this problemfrom a distributed point of view, where the distrib-uted wireless sensing network is also the platform con-ducting recognition. Each dependency requires com-munication between nodes, as they would otherwisenot have access to the states of remote variables forinference. Interdependency between users for infer-ence must be explicitly modeled and accounted for,and a distinction between which types of problemsrequire this communication and which types do notmust be made.
In summary, MAR is used where the goal is toobtain the activities of multiple individuals in paral-lel, where GAR is used to recognize the activity of agroup as an organism, often where the activity of thegroup is not directly evident when observing the activityof the individuals independently: emergent behavior.Both MAR and GAR can either be cooperative orcollaborative, depending on the activities recognized.For cooperative problems, knowledge of other subjectscan help to reduce error caused by model errors or sim-plicity. Collaborative issues, however, require exchangeof information about other group members in order to
Group Activity RecognitionCooperative Collaborative
Multi-User Activity RecognitionCooperative Collaborative
SAR
x1
y1
x1
y1
x2
y2
x3
y3 y1
x1
y2 y3
a) x1
y1
x2
y2
x3
y3 y1
x1
y2 y3
b) c) d) e)
Pr{X}
Be{Y|X}
Fig. 2 Factor graphs for belief Be{Y|X} and priors Pr{X} overhidden variables (activities) x1, x2, x3 ∈ X and observable vari-ables (sensors) y1, y2, y3 ∈ Y for a Single-user Activity Recog-
nition (SAR), b cooperative Multi-user Activity Recognition(MAR), c collaborative MAR, d cooperative Group ActivityRecognition (GAR) and e collaborative GAR
Mobile Netw Appl (2013) 18:326–340 331
model the activities. In the remainder of this work wefocus on collaborative recognition problems which poseissues for distributed, in-network recognition which arenovel. Specifically, the level of abstraction at whichthe information exchange occurs is evaluated in termsof its effects on the distributed sensing (energy con-sumption) and recognition (accuracy) systems, as wellas the information exchange (communication volumes)between them.
3 Related work
The majority of all context and activity recognitionwork is focused on human subjects and concentrateson single-user activity and context recognition. Tradi-tionally, this is conducted using body-worn accelerationsensors [1, 12] which forward sampled data to a centralserver for classification. Other approaches range fromembedded recognition [12, 26], where emphasis is onthe tradeoff between energy expenditure and recogni-tion quality, to server based approaches which optimizeclassification results using crowd-sourcing [3].
First simple attempts at recognizing the activity ofa group as a whole were pioneered with the ActiveBadge [29] and MediaCup [2] projects, where the
status of a user (including meetings or gatherings)was updated based on their location and the loca-tion of others. These approaches where not learning-based, but rather static code which recognized activitiesmostly based on location, proximity, and some sensormeasurements.
Other approaches use audio classification to recog-nize multi-user group activities, such as concurrentchatting activities [18], or for classifying roles of individ-uals in conversations [9]. These methods have proveneffective, but rely heavily on infrastructure for recogni-tion. Theoretically, embedded GAR approaches usingaudio sensors would be possible [26], but the authorsare unaware of research in this direction.
Camera-based systems are well suited to collectinginformation about multiple individuals within the fieldof vision. This advantage has been put to use for thepurpose of group activity recognition, for example formonitoring activities of groups of individuals in a prisonyard [8] or cargo and logistics activities [11, 21]. An-other great example of uniquely group-related activi-ties, is recognition of American Football plays basedon TV feeds [20]. There, Li et al. track individual tra-jectories and activities of single users, and then use thisinformation to recognize which play is being orches-trated. The large drawbacks of video-based systems is
Table 1 Analysis and comparison of existing multi-user and group activity approaches
Reference Application Activity Dependency Architecture Sensor Issuesdomain type type tech.
Chang et al. [8] Prisoner activity GAR Collaborative Centralized Video Dependent on infrastructure,recognition video requires instrumentation
Want et al. [29] Office activities MAR/ Collaborative Centralized Multiple Dependent on infrastructure,GAR static logic, not capable
of learning, domain specificBeigl et al. [2] Office activities MAR/ Collaborative Centralized Wearable Dependent on infrastructure,
GAR static logic, not capableof learning, domain specific
Hsu et al. [18] Human GAR Collaborative Centralized Audio Dependent on infrastructure,conversation domain specific
Wirz et al. [30], Pedestrian MAR/ Collaborative Centralized Wearable Domain specific, focusedRoggen et al. [22] flocking GAR on group affiliation
Hwang et al. [19] Behavioral MAR Collaborative Centralized Wearable Application-specific outliersingularities detection
Gu et al. [16], ADLs in home MAR Collaborative Centralized Wearable Dependent on infrastructure,Wang et al. [28] applicability for GAR unclear
Li et al. [20] American football GAR Collaborative Centralized Video Dependent on infrastructure,plays video requires instrumentation
Gong et al. [11], Logistics and MAR Cooperative Centralized Video Dependent on infrastructure,Loy et al. [21] public places video requires instrumentation,
highly domain specificDong et al. [9] Conversational MAR Cooperative Centralized Audio Dependent on infrastructure,
roles application for HAR unclearPresent work Generic (office) GAR Collaborative Distributed Wearable
[13, 14] activities
332 Mobile Netw Appl (2013) 18:326–340
that they require pre-instrumentation of recognitionenvironments, and commonly require infrastructure toconnect sensors and processing architectures.
Research into MAR and GAR using wearable sen-sors has only recently been introduced to the scientificcommunity, an overview of which can be found inTable 1. Gu et al. [16] and Wang et al. [28] combinepatterns of individual activities to recognize concurrentmulti-user activities using probabilistic methods. Herethe activities which are recognized range from single-user activities as well as concurrent and conflictingmulti-user activities, making this approach collabora-tive in nature.
Wirz et al. approach recognition of cluster forma-tions and flow patterns in groups of pedestrians [30].The work presented here expands on that done byRoggen et al. [22], where the concept of “behav-ioral primitives” are introduced as single-user activities.Here, group membership for each subject is monitored(MAR), but also crowd behavior is addressed (GAR),both of which can only be evaluated with knowledge ofother group members (collaborative). Similarly Hwanget al. track behavioral singularities in children on fieldtrips, where the behavioral singularity is tracked foreach child (MAR), but can only be calculated in com-parison with other subjects (collaborative).
Sigg et al. [25] researched the optimal context ab-straction level for prediction of future contexts. Thiswas also addressed for a different application, namelysensor control for embedded SAR using prediction[12]. Since GAR using wearable sensors is inherently ahierarchical problem, these same issues are also presenthere as well, but with focus on GAR instead of contextprediction. A case study on GAR to evaluate the op-timal context abstraction level for GAR using sensorsfrom wearable devices was presented in a preliminaryposter abstract [14]. A requirements analysis for dis-tributed recognition in peer-to-peer networks of mobiledevices was also presented [15]. Preliminary results
provided insight into the power-accuracy trade-off forGAR, and uncovered several novel research questions[13].
4 System design
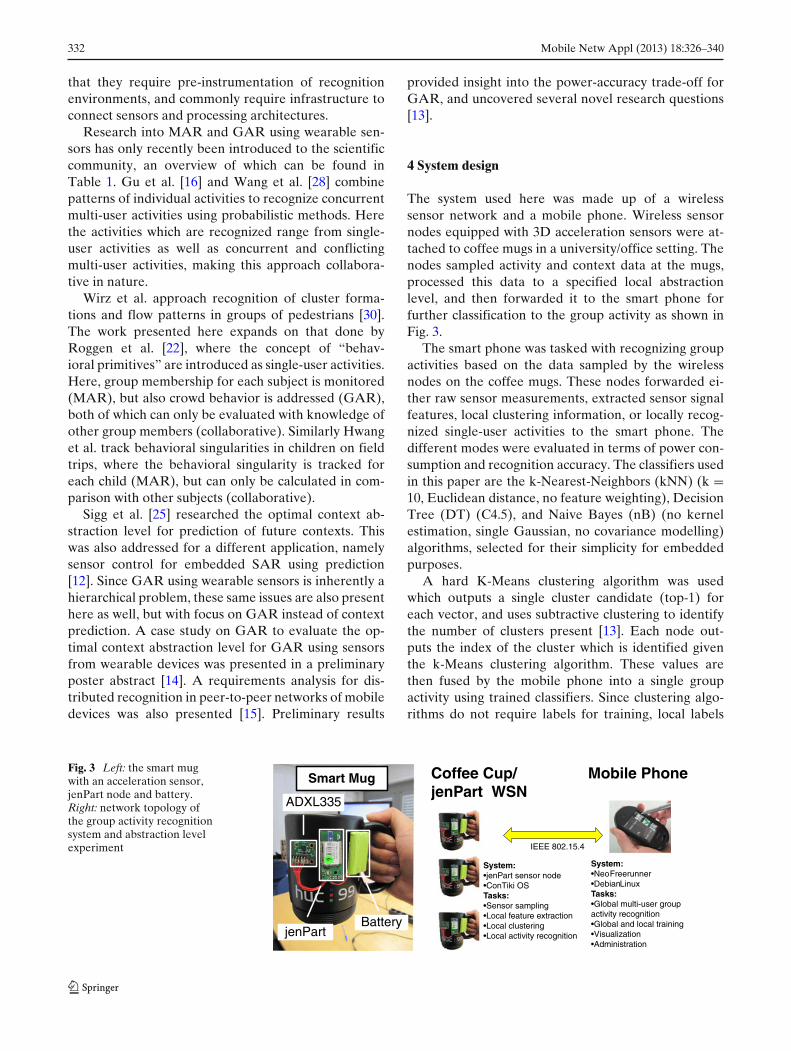
The system used here was made up of a wirelesssensor network and a mobile phone. Wireless sensornodes equipped with 3D acceleration sensors were at-tached to coffee mugs in a university/office setting. Thenodes sampled activity and context data at the mugs,processed this data to a specified local abstractionlevel, and then forwarded it to the smart phone forfurther classification to the group activity as shown inFig. 3.
The smart phone was tasked with recognizing groupactivities based on the data sampled by the wirelessnodes on the coffee mugs. These nodes forwarded ei-ther raw sensor measurements, extracted sensor signalfeatures, local clustering information, or locally recog-nized single-user activities to the smart phone. Thedifferent modes were evaluated in terms of power con-sumption and recognition accuracy. The classifiers usedin this paper are the k-Nearest-Neighbors (kNN) (k =10, Euclidean distance, no feature weighting), DecisionTree (DT) (C4.5), and Naive Bayes (nB) (no kernelestimation, single Gaussian, no covariance modelling)algorithms, selected for their simplicity for embeddedpurposes.
A hard K-Means clustering algorithm was usedwhich outputs a single cluster candidate (top-1) foreach vector, and uses subtractive clustering to identifythe number of clusters present [13]. Each node out-puts the index of the cluster which is identified giventhe k-Means clustering algorithm. These values arethen fused by the mobile phone into a single groupactivity using trained classifiers. Since clustering algo-rithms do not require labels for training, local labels
Fig. 3 Left: the smart mugwith an acceleration sensor,jenPart node and battery.Right: network topology ofthe group activity recognitionsystem and abstraction levelexperiment
jenPart
ADXL335
Battery
Smart Mug Coffee Cup/jenPart WSN
Mobile Phone
System:•jenPart sensor node•ConTiki OSTasks:•Sensor sampling•Local feature extraction•Local clustering•Local activity recognition
System:•Neo Freerunner•DebianLinuxTasks:•Global multi-user group activity recognition•Global and local training•Visualization•Administration
IEEE 802.15.4
Mobile Netw Appl (2013) 18:326–340 333
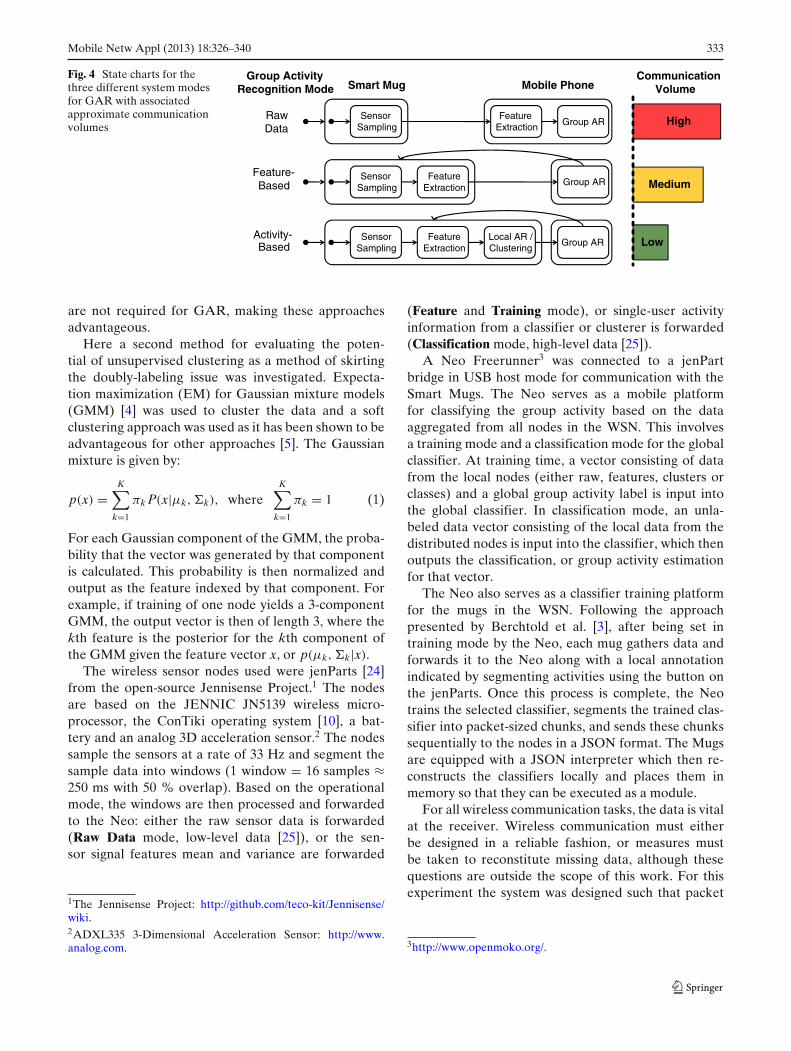
Fig. 4 State charts for thethree different system modesfor GAR with associatedapproximate communicationvolumes
Communication Volume
Sensor Sampling
Feature Extraction Group AR
Sensor Sampling
Group ARFeature
Extraction
Sensor Sampling
Group ARFeature
ExtractionLocal AR /Clustering
Mobile PhoneSmart MugGroup Activity
Recognition Mode
RawData
Feature-Based
Activity-Based
High
Medium
Low
are not required for GAR, making these approachesadvantageous.
Here a second method for evaluating the poten-tial of unsupervised clustering as a method of skirtingthe doubly-labeling issue was investigated. Expecta-tion maximization (EM) for Gaussian mixture models(GMM) [4] was used to cluster the data and a softclustering approach was used as it has been shown to beadvantageous for other approaches [5]. The Gaussianmixture is given by:
p(x) =K∑
k=1
πk P(x|μk, �k), whereK∑
k=1
πk = 1 (1)
For each Gaussian component of the GMM, the proba-bility that the vector was generated by that componentis calculated. This probability is then normalized andoutput as the feature indexed by that component. Forexample, if training of one node yields a 3-componentGMM, the output vector is then of length 3, where thekth feature is the posterior for the kth component ofthe GMM given the feature vector x, or p(μk, �k|x).
The wireless sensor nodes used were jenParts [24]from the open-source Jennisense Project.1 The nodesare based on the JENNIC JN5139 wireless micro-processor, the ConTiki operating system [10], a bat-tery and an analog 3D acceleration sensor.2 The nodessample the sensors at a rate of 33 Hz and segment thesample data into windows (1 window = 16 samples ≈250 ms with 50 % overlap). Based on the operationalmode, the windows are then processed and forwardedto the Neo: either the raw sensor data is forwarded(Raw Data mode, low-level data [25]), or the sen-sor signal features mean and variance are forwarded
1The Jennisense Project: http://github.com/teco-kit/Jennisense/wiki.2ADXL335 3-Dimensional Acceleration Sensor: http://www.analog.com.
(Feature and Training mode), or single-user activityinformation from a classifier or clusterer is forwarded(Classification mode, high-level data [25]).
A Neo Freerunner3 was connected to a jenPartbridge in USB host mode for communication with theSmart Mugs. The Neo serves as a mobile platformfor classifying the group activity based on the dataaggregated from all nodes in the WSN. This involvesa training mode and a classification mode for the globalclassifier. At training time, a vector consisting of datafrom the local nodes (either raw, features, clusters orclasses) and a global group activity label is input intothe global classifier. In classification mode, an unla-beled data vector consisting of the local data from thedistributed nodes is input into the classifier, which thenoutputs the classification, or group activity estimationfor that vector.
The Neo also serves as a classifier training platformfor the mugs in the WSN. Following the approachpresented by Berchtold et al. [3], after being set intraining mode by the Neo, each mug gathers data andforwards it to the Neo along with a local annotationindicated by segmenting activities using the button onthe jenParts. Once this process is complete, the Neotrains the selected classifier, segments the trained clas-sifier into packet-sized chunks, and sends these chunkssequentially to the nodes in a JSON format. The Mugsare equipped with a JSON interpreter which then re-constructs the classifiers locally and places them inmemory so that they can be executed as a module.
For all wireless communication tasks, the data is vitalat the receiver. Wireless communication must eitherbe designed in a reliable fashion, or measures mustbe taken to reconstitute missing data, although thesequestions are outside the scope of this work. For thisexperiment the system was designed such that packet
3http://www.openmoko.org/.
334 Mobile Netw Appl (2013) 18:326–340
loss was not an issue under the controlled conditions ofusage, but in a real deployment this must be addressed(see Figs. 3 and 4).
5 Experiment
This experiment was designed to evaluate differentlevels of data abstraction carried out by the mugs interms of energy consumption, communication volumesand GAR rates. To this end the experiment representsa collaborative GAR problem where single-user activ-ities map to group activities in such a way as to beambiguous for individual subjects, but explicit whenobserving all subjects (see Section 2). Processing datato the activity abstraction level [25] poses the problemof having to doubly-label the training data in termsof local, single-user activity labels and global, groupactivity labels. This must either be done using videorecordings and offline annotation (time consuming) ormultiple annotators in real time, both of which are tooelaborate to allow easy deployment in new scenarios.
To counteract this, two methods of skirting thedoubly-labeling issue are employed and evaluated.First, local classifiers and global classifiers are trainedin two sessions where each session must only be la-beled with local or global activities respectively. Sec-ond, local activity classifiers are replaced with a hard,top-1, unsupervised k-means clustering, and soft, prob-abilistic clustering [5], which does not require localactivity labels, and can therefore be trained on thesame data basis as the group activity classifier. Al-though the system was implemented on the distrib-uted heterogeneous platform, the classification resultswere generated offline using the WEKA toolkit [17]for analytical purposes but were cross-checked withonline results.
5.1 Activity recognition experiment
During the course of this experiment, three subjectsperformed seven different activities, three of whichwere group activities and four of which were single-user activities involving the Smart Mugs. In total, over45 min of data were collected, making over 22,700sample windows, although some data was discarded atrandom to ensure that experimental data was indepen-dently and identically distributed (i.i.d.). The experi-ments were conducted in a meeting room in a universitysetting over the course of a single day. In the first phase,local classifiers were trained and evaluated, followed bythe global classifiers in the second.
5.1.1 Phase 1: local single-user classif iers
In the first phase of the evaluation, each user performeda set of activities, each one for a duration from ap-proximately 2–15 min with the mug in training mode,meaning features and labels were extracted locally anduploaded to the Neo. The activities were local to themugs, and were not performed as part of group activi-ties, as doubly labeling local and group activities in realtime is impractical. The local single-user activities wereas follows: the subject has placed the mug on the table(or other surface), the subject is holding the mug intheir hand, the subject is drinking from the mug, andthe subject is gesticulating.
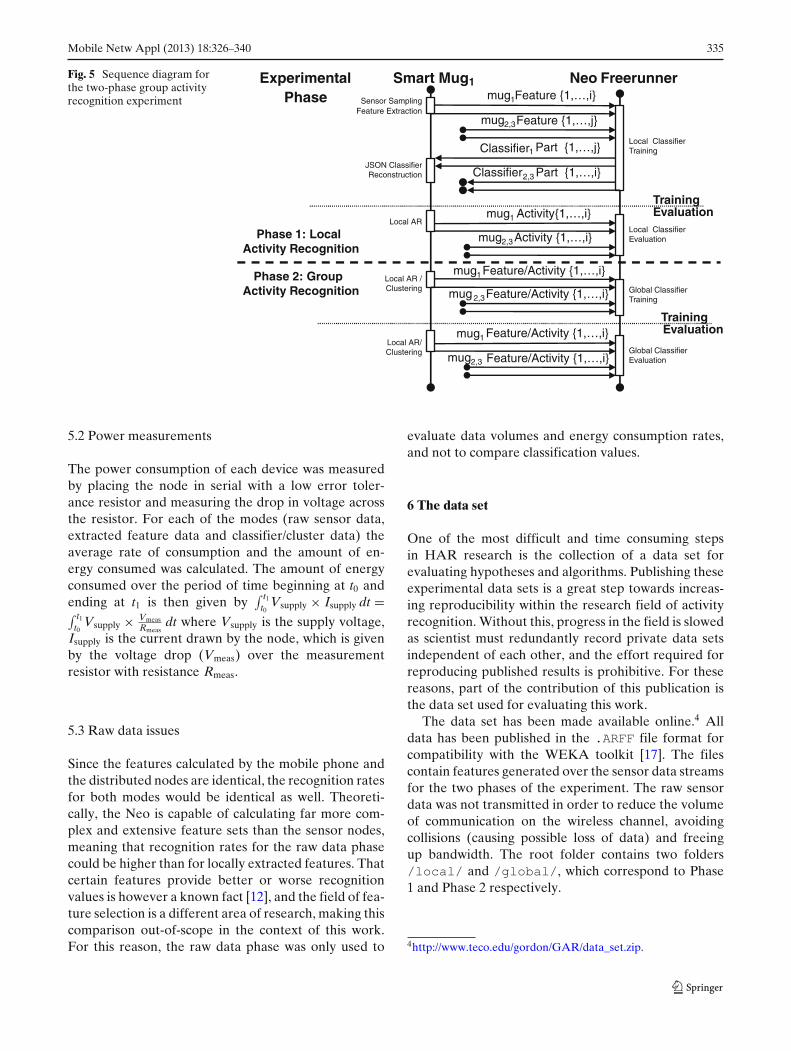
After each activity was performed for the specifiedperiod of time, a button press on the node updated thelabel on the feature vector sent to the Neo and thenext activity was performed. The first half of the datagenerated in this phase was used to train the local clas-sifiers, and the second half was used to evaluate theirperformance. After all local activities were performed,the local classifiers were trained and communicated tothe Smart Mug using JSON packets. The procedure ofthe process conducted in phase 1 is displayed in theupper portion of the sequence diagram in Fig. 5.
5.1.2 Phase 2: global group training and evaluation
The evaluation of the global classifier was conductedoffline using the data generated in this phase, whereagain half of the data was used for training and theother for performance evaluation. The subjects con-ducted the following activities together for 4–5 mineach using the same mugs they trained in the previousphase: Meeting, Presentation (users 1, 2 and 3) andCoffee break. The mappings of group to single-useractivities are as follows: meeting consists of all subjectseither setting their mugs on the table, holding them intheir hand or drinking. In a presentation one subjectwill be gesticulating or holding their mug while othersare either holding, drinking from, or have set the mugsdown, and in a coffee break all are either holding,gesticulating with, or drinking from their mugs.
During this period, the nodes transmitted the fulllocally extracted feature vector, as well as the local clas-sifications of the single-user activities listed previously.The raw sensor data was ignored for reasons whichwill be explained later. The process flow for phase twois shown in the lower portion of Fig. 5 where featurevectors and local activity classifications are transmittedsimultaneously to train global classifiers for each datatype respectively.
Mobile Netw Appl (2013) 18:326–340 335
Fig. 5 Sequence diagram forthe two-phase group activityrecognition experiment
Smart Mug1 Neo FreerunnerExperimental Phase
Training
mug1Feature {1,…,i}
Local ClassifierTrainingClassifier1
mug1 Activity{1,…,i}Local AR
Global Classifier Training
Phase 1: Local Activity Recognition
Phase 2: Group Activity Recognition
Evaluation
Local AR /Clustering
TrainingEvaluation
mug2,3
Classifier2,3 Part {1,…,i}
mug2,3
mug1 Feature/Activity {1,…,i}
mug2,3
Local AR/Clustering
mug1
mug2,3
Local ClassifierEvaluation
Global ClassifierEvaluation
Sensor SamplingFeature Extraction
JSON ClassifierReconstruction
Part {1,…,j}
Activity {1,…,i}
Feature/Activity {1,…,i}
Feature/Activity {1,…,i}
Feature/Activity {1,…,i}
Feature {1,…,j}
5.2 Power measurements
The power consumption of each device was measuredby placing the node in serial with a low error toler-ance resistor and measuring the drop in voltage acrossthe resistor. For each of the modes (raw sensor data,extracted feature data and classifier/cluster data) theaverage rate of consumption and the amount of en-ergy consumed was calculated. The amount of energyconsumed over the period of time beginning at t0 andending at t1 is then given by
∫ t1t0
Vsupply × Isupply dt =∫ t1t0
Vsupply × VmeasRmeas
dt where Vsupply is the supply voltage,Isupply is the current drawn by the node, which is givenby the voltage drop (Vmeas) over the measurementresistor with resistance Rmeas.
5.3 Raw data issues
Since the features calculated by the mobile phone andthe distributed nodes are identical, the recognition ratesfor both modes would be identical as well. Theoreti-cally, the Neo is capable of calculating far more com-plex and extensive feature sets than the sensor nodes,meaning that recognition rates for the raw data phasecould be higher than for locally extracted features. Thatcertain features provide better or worse recognitionvalues is however a known fact [12], and the field of fea-ture selection is a different area of research, making thiscomparison out-of-scope in the context of this work.For this reason, the raw data phase was only used to
evaluate data volumes and energy consumption rates,and not to compare classification values.
6 The data set
One of the most difficult and time consuming stepsin HAR research is the collection of a data set forevaluating hypotheses and algorithms. Publishing theseexperimental data sets is a great step towards increas-ing reproducibility within the research field of activityrecognition. Without this, progress in the field is slowedas scientist must redundantly record private data setsindependent of each other, and the effort required forreproducing published results is prohibitive. For thesereasons, part of the contribution of this publication isthe data set used for evaluating this work.
The data set has been made available online.4 Alldata has been published in the .ARFF file format forcompatibility with the WEKA toolkit [17]. The filescontain features generated over the sensor data streamsfor the two phases of the experiment. The raw sensordata was not transmitted in order to reduce the volumeof communication on the wireless channel, avoidingcollisions (causing possible loss of data) and freeingup bandwidth. The root folder contains two folders/local/ and /global/, which correspond to Phase1 and Phase 2 respectively.
4http://www.teco.edu/gordon/GAR/data_set.zip.
336 Mobile Netw Appl (2013) 18:326–340
6.1 Data set from phase 1
In the folder /local/, there are two files for each user,one containing training data and one containing testingdata. Each file contains a set of vectors of length 7, eachcontaining the average and variance for each axis of theaccelerometer, and an activity label. The activities inthese files are the local single-user activity labels fromPhase 1. The identity of each feature in the vector isgiven by the header of each file, for example:
@relation subject_1_train@attribute mean_x numeric@attribute mean_y numeric@attribute mean_z numeric@attribute var_x numeric@attribute var_y numeric@attribute var_z numeric@attribute label{table,wave,drink,hold}@data
6.2 Data set from phase 2
Folder /global/ contains the data from Phase 2of the experiment. In the folder /global/singlevectors/, the files features_train.arff and*_test.arff contain the combined data for all threesubjects in one single vector. These vectors have alength 19, with 18 features (six from each subject) andactivity label. The labels here are Phase 2 activities, i.e.group activities. Again, the identity of each dimensionof the feature vector is given by the header.
Local single-user classification vectors from fromPhase 2 are stored in six files in the folder /multiplevectors/. The file names begin with the classifiername (j48, knn, nb) followed by _train.arff or_test.arff. Each dimension in the vector representsthe activity of the subject indexed by that dimension.These are generated by classifying each vector of theglobal feature data with the classifiers trained usingthe data from Phase 1. The value of each position isa Phase 1 single-user activity, where the labels in thisfile are group activities. Since no doubly-labeling wasdone, information about the exact correctness of theseclassifications is not known.
The data set presented here has been normalizedusing a min-max normalization. The minimum andmaximum cannot be taken from the entire set. Thetesting data is used to simulate and evaluate onlineoperation of the system. This data would therefore notbe available at the point where the min and max valueshave to be fixed for the system. In order to correctlymodel this, the minimum and maximum values fornormalization where acquired from the training dataonly, and used to normalize the entire data set.
7 Results
The results are two fold, first the classification rates forlocal and group activities are presented, followed bythe evaluation of the communication load and powerconsumption of the nodes. The implications of theseresults and the insights they provide into the field ofcollaborative GAR will be discussed in Section 8.
7.1 Classification results
The classification results will be presented in two parts.First the local single-user classification rates achievedby the mugs themselves of their local activities are pre-sented, followed by the recognition rates of the globalclassifier for GAR based on local features and localactivities will be presented.
7.1.1 Phase 1: local classif ication
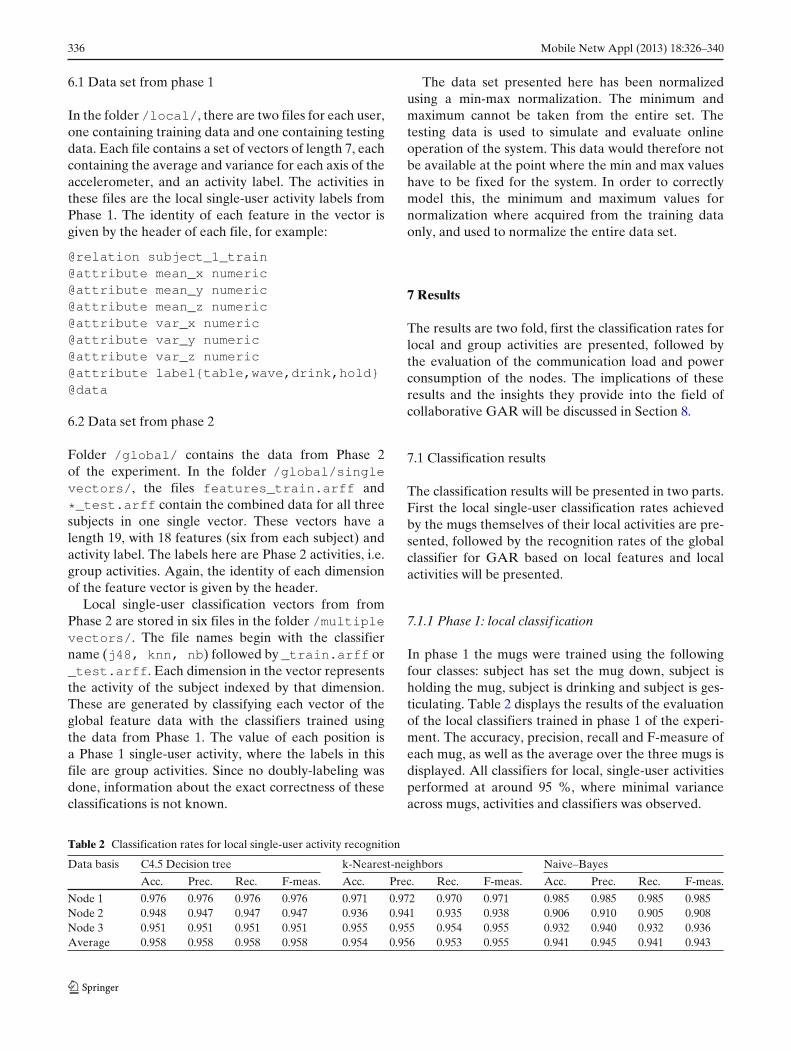
In phase 1 the mugs were trained using the followingfour classes: subject has set the mug down, subject isholding the mug, subject is drinking and subject is ges-ticulating. Table 2 displays the results of the evaluationof the local classifiers trained in phase 1 of the experi-ment. The accuracy, precision, recall and F-measure ofeach mug, as well as the average over the three mugs isdisplayed. All classifiers for local, single-user activitiesperformed at around 95 %, where minimal varianceacross mugs, activities and classifiers was observed.
Table 2 Classification rates for local single-user activity recognition
Data basis C4.5 Decision tree k-Nearest-neighbors Naive–Bayes
Acc. Prec. Rec. F-meas. Acc. Prec. Rec. F-meas. Acc. Prec. Rec. F-meas.
Node 1 0.976 0.976 0.976 0.976 0.971 0.972 0.970 0.971 0.985 0.985 0.985 0.985Node 2 0.948 0.947 0.947 0.947 0.936 0.941 0.935 0.938 0.906 0.910 0.905 0.908Node 3 0.951 0.951 0.951 0.951 0.955 0.955 0.954 0.955 0.932 0.940 0.932 0.936Average 0.958 0.958 0.958 0.958 0.954 0.956 0.953 0.955 0.941 0.945 0.941 0.943
Mobile Netw Appl (2013) 18:326–340 337
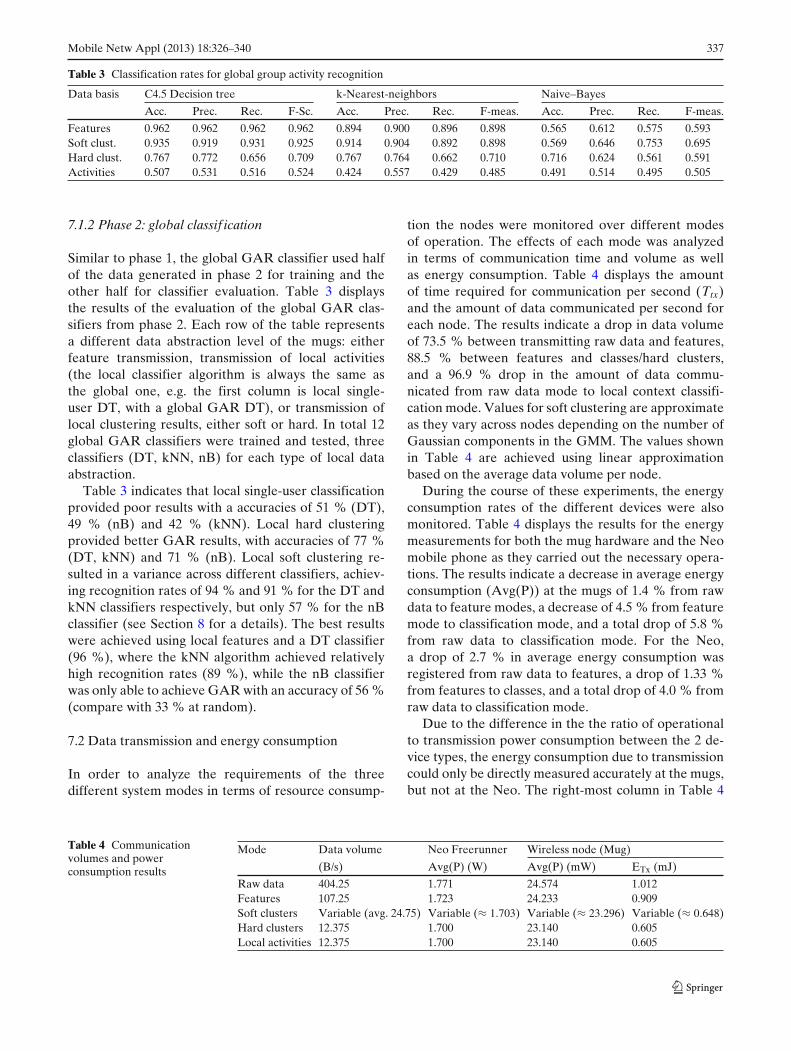
Table 3 Classification rates for global group activity recognition
Data basis C4.5 Decision tree k-Nearest-neighbors Naive–Bayes
Acc. Prec. Rec. F-Sc. Acc. Prec. Rec. F-meas. Acc. Prec. Rec. F-meas.
Features 0.962 0.962 0.962 0.962 0.894 0.900 0.896 0.898 0.565 0.612 0.575 0.593Soft clust. 0.935 0.919 0.931 0.925 0.914 0.904 0.892 0.898 0.569 0.646 0.753 0.695Hard clust. 0.767 0.772 0.656 0.709 0.767 0.764 0.662 0.710 0.716 0.624 0.561 0.591Activities 0.507 0.531 0.516 0.524 0.424 0.557 0.429 0.485 0.491 0.514 0.495 0.505
7.1.2 Phase 2: global classif ication
Similar to phase 1, the global GAR classifier used halfof the data generated in phase 2 for training and theother half for classifier evaluation. Table 3 displaysthe results of the evaluation of the global GAR clas-sifiers from phase 2. Each row of the table representsa different data abstraction level of the mugs: eitherfeature transmission, transmission of local activities(the local classifier algorithm is always the same asthe global one, e.g. the first column is local single-user DT, with a global GAR DT), or transmission oflocal clustering results, either soft or hard. In total 12global GAR classifiers were trained and tested, threeclassifiers (DT, kNN, nB) for each type of local dataabstraction.
Table 3 indicates that local single-user classificationprovided poor results with a accuracies of 51 % (DT),49 % (nB) and 42 % (kNN). Local hard clusteringprovided better GAR results, with accuracies of 77 %(DT, kNN) and 71 % (nB). Local soft clustering re-sulted in a variance across different classifiers, achiev-ing recognition rates of 94 % and 91 % for the DT andkNN classifiers respectively, but only 57 % for the nBclassifier (see Section 8 for a details). The best resultswere achieved using local features and a DT classifier(96 %), where the kNN algorithm achieved relativelyhigh recognition rates (89 %), while the nB classifierwas only able to achieve GAR with an accuracy of 56 %(compare with 33 % at random).
7.2 Data transmission and energy consumption
In order to analyze the requirements of the threedifferent system modes in terms of resource consump-
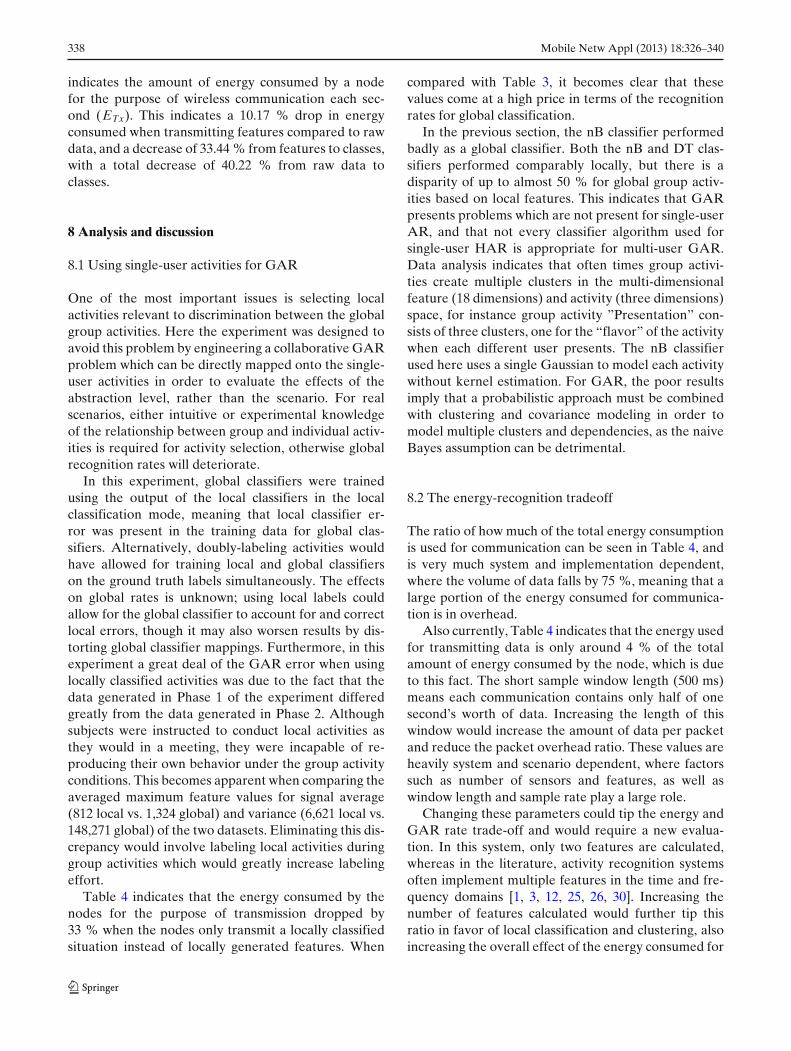
tion the nodes were monitored over different modesof operation. The effects of each mode was analyzedin terms of communication time and volume as wellas energy consumption. Table 4 displays the amountof time required for communication per second (Ttx)and the amount of data communicated per second foreach node. The results indicate a drop in data volumeof 73.5 % between transmitting raw data and features,88.5 % between features and classes/hard clusters,and a 96.9 % drop in the amount of data commu-nicated from raw data mode to local context classifi-cation mode. Values for soft clustering are approximateas they vary across nodes depending on the number ofGaussian components in the GMM. The values shownin Table 4 are achieved using linear approximationbased on the average data volume per node.
During the course of these experiments, the energyconsumption rates of the different devices were alsomonitored. Table 4 displays the results for the energymeasurements for both the mug hardware and the Neomobile phone as they carried out the necessary opera-tions. The results indicate a decrease in average energyconsumption (Avg(P)) at the mugs of 1.4 % from rawdata to feature modes, a decrease of 4.5 % from featuremode to classification mode, and a total drop of 5.8 %from raw data to classification mode. For the Neo,a drop of 2.7 % in average energy consumption wasregistered from raw data to features, a drop of 1.33 %from features to classes, and a total drop of 4.0 % fromraw data to classification mode.
Due to the difference in the the ratio of operationalto transmission power consumption between the 2 de-vice types, the energy consumption due to transmissioncould only be directly measured accurately at the mugs,but not at the Neo. The right-most column in Table 4
Table 4 Communicationvolumes and powerconsumption results
Mode Data volume Neo Freerunner Wireless node (Mug)
(B/s) Avg(P) (W) Avg(P) (mW) ETx (mJ)
Raw data 404.25 1.771 24.574 1.012Features 107.25 1.723 24.233 0.909Soft clusters Variable (avg. 24.75) Variable (≈ 1.703) Variable (≈ 23.296) Variable (≈ 0.648)Hard clusters 12.375 1.700 23.140 0.605Local activities 12.375 1.700 23.140 0.605
338 Mobile Netw Appl (2013) 18:326–340
indicates the amount of energy consumed by a nodefor the purpose of wireless communication each sec-ond (ETx). This indicates a 10.17 % drop in energyconsumed when transmitting features compared to rawdata, and a decrease of 33.44 % from features to classes,with a total decrease of 40.22 % from raw data toclasses.
8 Analysis and discussion
8.1 Using single-user activities for GAR
One of the most important issues is selecting localactivities relevant to discrimination between the globalgroup activities. Here the experiment was designed toavoid this problem by engineering a collaborative GARproblem which can be directly mapped onto the single-user activities in order to evaluate the effects of theabstraction level, rather than the scenario. For realscenarios, either intuitive or experimental knowledgeof the relationship between group and individual activ-ities is required for activity selection, otherwise globalrecognition rates will deteriorate.
In this experiment, global classifiers were trainedusing the output of the local classifiers in the localclassification mode, meaning that local classifier er-ror was present in the training data for global clas-sifiers. Alternatively, doubly-labeling activities wouldhave allowed for training local and global classifierson the ground truth labels simultaneously. The effectson global rates is unknown; using local labels couldallow for the global classifier to account for and correctlocal errors, though it may also worsen results by dis-torting global classifier mappings. Furthermore, in thisexperiment a great deal of the GAR error when usinglocally classified activities was due to the fact that thedata generated in Phase 1 of the experiment differedgreatly from the data generated in Phase 2. Althoughsubjects were instructed to conduct local activities asthey would in a meeting, they were incapable of re-producing their own behavior under the group activityconditions. This becomes apparent when comparing theaveraged maximum feature values for signal average(812 local vs. 1,324 global) and variance (6,621 local vs.148,271 global) of the two datasets. Eliminating this dis-crepancy would involve labeling local activities duringgroup activities which would greatly increase labelingeffort.
Table 4 indicates that the energy consumed by thenodes for the purpose of transmission dropped by33 % when the nodes only transmit a locally classifiedsituation instead of locally generated features. When
compared with Table 3, it becomes clear that thesevalues come at a high price in terms of the recognitionrates for global classification.
In the previous section, the nB classifier performedbadly as a global classifier. Both the nB and DT clas-sifiers performed comparably locally, but there is adisparity of up to almost 50 % for global group activ-ities based on local features. This indicates that GARpresents problems which are not present for single-userAR, and that not every classifier algorithm used forsingle-user HAR is appropriate for multi-user GAR.Data analysis indicates that often times group activi-ties create multiple clusters in the multi-dimensionalfeature (18 dimensions) and activity (three dimensions)space, for instance group activity ”Presentation” con-sists of three clusters, one for the “flavor” of the activitywhen each different user presents. The nB classifierused here uses a single Gaussian to model each activitywithout kernel estimation. For GAR, the poor resultsimply that a probabilistic approach must be combinedwith clustering and covariance modeling in order tomodel multiple clusters and dependencies, as the naiveBayes assumption can be detrimental.
8.2 The energy-recognition tradeoff
The ratio of how much of the total energy consumptionis used for communication can be seen in Table 4, andis very much system and implementation dependent,where the volume of data falls by 75 %, meaning that alarge portion of the energy consumed for communica-tion is in overhead.
Also currently, Table 4 indicates that the energy usedfor transmitting data is only around 4 % of the totalamount of energy consumed by the node, which is dueto this fact. The short sample window length (500 ms)means each communication contains only half of onesecond’s worth of data. Increasing the length of thiswindow would increase the amount of data per packetand reduce the packet overhead ratio. These values areheavily system and scenario dependent, where factorssuch as number of sensors and features, as well aswindow length and sample rate play a large role.
Changing these parameters could tip the energy andGAR rate trade-off and would require a new evalua-tion. In this system, only two features are calculated,whereas in the literature, activity recognition systemsoften implement multiple features in the time and fre-quency domains [1, 3, 12, 25, 26, 30]. Increasing thenumber of features calculated would further tip thisratio in favor of local classification and clustering, alsoincreasing the overall effect of the energy consumed for
Mobile Netw Appl (2013) 18:326–340 339
communication on the total energy consumed by thesystem.
8.3 Using clustering for GAR
Although the results of GAR using local hard clus-tering were significantly lower than using local fea-tures (77 % as opposed to 96 %, 20 % drop), clus-tering is quite promising. Clustering does not requirea separate phase for local training as local labels arenot required (unsupervised learning), and reduces theenergy consumption due to transmission by 33 %.The 20 % drop in GAR rates is prohibitive for mostapplications.
Soft probabilistic clustering, which showed signi-ficant promise for other applications [5], proved to bean effective tool here. The GAR rates in Table 3 indi-cates an accuracy of 94 % for soft clustering, comparedto the maximum of 96 % when using features. Thisindicates a loss of recognition accuracy of 2.8 % fromGAR using features to GAR using soft clustering, whilemaintaining energy savings at approximately 29 %. Theimplications of these results are two-fold. Dependingon the number of clusters identified, a parameter whichcan be controlled by the system designer, the resultingimpact on energy reserves can be varied as well. Theamount of data communicated is proportionate to thenumber of Gaussian components, therefore less clus-ters means lower consumptions.
Conversely, it stands to reason that increasing thenumber of clusters increases the quality of the in-formation transferred, thereby increasing recognitionrates. In this specific instance, between 1 and 3 clusterswere detected per node, with a total of 6 clusters.This configuration generated power consumption val-ues only slightly greater than hard clustering (doublethe data volume), but already produced high recogni-tion values. Soft clustering allows the application de-signer to tune the tradeoff between energy consump-tion and recognition by increasing or decreasing thenumber of clusters. The range for tuning is given by therecognition rate using raw data (features, in this case96 %) which is the maximum, with the minimum beingthe values for hard clustering (here 77 % accuracy).
Using local activities reduces cost, but also reducesGAR accuracy by an unacceptable 47 %. Hard cluster-ing maintained the cost reductions but with an accuracyloss of 20 %, the advantage being that unsupervisedlearning does not require single-user labels. Soft clus-tering enables high recognition rates without requiringlocal labels, representing a real and viable solution tothe doubly labeling problem. In this instance a loss
of only 3 % of recongition could be achieved withoutrequireing local labels.
8.4 Generalization of results
As a strong caveat, the absolute values for GAR ratesand energy consumptions cannot be assumed for othercollaborative GAR problems. The activities here weredesigned to present a collaborative GAR problem forexperimentation, and to be fairly straight-forward torecognize. Results for different scenarios, as is also thecase with SAR and MAR, would depend on a multitudeof factors such as sensing modalities, type and numberof activities, amount of training data, etc.. What can begeneralized, however, are the relative rates for energyconsumption, communication volumes and recognitionrates with respect to the abstraction levels under similarconditions.
9 Conclusion
This paper introduced a system for group activityrecognition using only wearable and mobile devices forboth sensing and recognition purposes. The problemsof multi-user (MAR) and group activity recognition(GAR) where defined and further classified into co-operative and collaborative problems, where informa-tion exchange between nodes was analyzed. An exper-iment was designed to investigate the effects of theabstraction level for information exchange on energyconsumption and recognition rates.
The experiment was conducted in an office scenariowhere nodes attached to mugs were used to monitoruser’s activities and perform collaborative group activ-ity recognition on a mobile phone. Different levels ofcontext preprocessing at the mugs were examined andevaluated in terms of power consumption and activityrecognition rates. Specifically, using raw data, signalfeatures, locally classified single-user activities and lo-cal clustering were examined as the basis for GAR andevaluated in terms of the cost of transmission incurredas well as GAR rates. The dataset was presented as partof the scientific contribution of this work.
Results indicate that for the given set of activities,the optimal recognition was achieved using locally ex-tracted features, with GAR accuracy of 96 % and a10 % drop in the amount of energy consumed for thepurpose of wireless communication. Locally classifyingactivities and using these to classify the global groupactivity reduced power consumption by a further 33 %to 40 % total, but incurred a 47 % drop in global multi-user GAR rates due to subjects’ inability to recreate
340 Mobile Netw Appl (2013) 18:326–340
their own behavior under different conditions. Usinglocal hard clustering showed potential by maintainingthe reduced power consumption at 40 %, but still in-cured a recognition drop of 20 %.
The investigations presented here into soft clusteringfor GAR showed two major insights. First, probabilisticsoft clustering using Gaussian mixtures can be usedto tweak the tradeoff between accuracy and powerconsumption of the GAR application. Second, by re-ducing power consumption (here only twice the com-munication volume compared to local activities, savingapproximately 36 %) and maintaining high GAR accu-racy (only a loss of 2.8 %), probabilistic soft clusteringrepresents a method for tackling the doubly-labelingissue which is intrinsic in GAR.
References
1. Bao L, Intille SS (2004) Activity recognition from user-annotated acceleration data. In: Pervasive, pp 1–17
2. Beigl M, Gellersen H-W, Schmidt A (2001) Mediacups: expe-rience with design and use of computer-augmented everyday.Comput Netw 35:401–409
3. Berchtold M, Budde M, Gordon D, Schmidtke H, BeiglM (2010) ActiServ: activity recognition service for mobilephones. In: ISWC’10: Proceedings of the 14th internationalsymposium on wearable computers. IEEE Computer Society,Seoul, pp 83–90
4. Bishop CM (2006) Pattern ecognition and machine learning.Springer, 1st edn. Corr. 2nd printing edn, October 2006
5. Blanke U, Schiele B (2009) Daily routine recognition throughactivity spotting. In: Proceedings of the 4th internationalsymposium on location and context awareness, LoCA ’09.Springer, Berlin, pp 192–206
6. Blumer H (1951) Collective behavior. Irvington Publishers7. Boin A, McConnell A (2007) Preparing for critical infrastruc-
ture breakdowns: the limits of crisis management and theneed for resilience. JCCM 15(1):50–59
8. Chang M-C, Krahnstoever N, Lim S, Yu T (2010) Grouplevel activity recognition in crowded environments acrossmultiple cameras. In: IEEE conference on advanced videoand signal based surveillance. IEEE Computer Society, LosAlamitos
9. Dong W, Lepri B, Cappelletti A, Pentland AS, Pianesi F,Zancanaro M (2007) Using the influence model to recognizefunctional roles in meetings. In: Proceedings of the 9th in-ternational conference on multimodal interfaces, ICMI ’07.ACM. New York, pp 271–278
10. Dunkels A, Grönvall B, Voigt T (2004) Contiki—a light-weight and flexible operating system for tiny networked sen-sors. In: Proceedings of the 1st IEEE workshop on embeddednetworked sensors (Emnets-I). Tampa, Florida, USA
11. Gong S, Xiang T (2003) Recognition of group activitiesusing dynamic probabilistic networks. In: Proceedings ofthe 9th IEEE international conference on computer vision,ICCV ’03, vol 2. IEEE Computer Society, Washington, DC,p 742
12. Gordon D, Czerny J, Miyaki T, Beigl M (2012) Energy-efficient activity recognition using prediction. In: 16th in-
ternational symposium on wearable computers (ISWC),pp 29–36
13. Gordon D, Hanne J-H, Berchtold M, Miyaki T, Beigl M(2011) Recognizing group activities using wearable sensors.In: 8th annual international mobile and ubiquitous systems:networking services, MobiQuitous. MobiQuitous ’11
14. Gordon D, Hanne J-H, Berchtold M, Miyaki T, Beigl M(2011) An experiment in hierarchical recognition of groupactivities using wearable sensors. In: Proceedings of the 7thconference on modeling and using context (CONTEXT).Springer, pp 108–114
15. Gordon D, Scholz M, Ding Y, Beigl M (2011) Global peer-to-peer classification in mobile ad-hoc networks: a requirementsanalysis. In: Proceedings of the 7th conference on Modelingand using context (CONTEXT). Springer, pp 108–114
16. Gu T, Wu Z, Wang L, Tao X, Lu J (2009) Mining emergingpatterns for recognizing activities of multiple users in perva-sive computing. In: The 6th annual international conferenceon mobile and ubiquitous systems, pp 1–10
17. Hall M, Frank E, Holmes G, Pfahringer B, Reutemann P,Witten IH (2009) The weka data mining software: an update.SIGKDD Explor Newsl 11:10–18
18. Hsu JY-J, Lian C-C, Jih W-R (2011) Probabilistic models forconcurrent chatting activity recognition. ACM Trans IntellSyst Technol 2:4:1–4:20
19. Hwang I, Jang H, Park T, Choi A, Lee Y, Hwang C, ChoiY, Nachman L, Song J (2012) Leveraging childrens behav-ioral distribution and singularities in new interactive environ-ments: study in kindergarten field trips. In: 10th internationalconference on pervasive computing
20. Li R, Chellappa R, Zhou SK (2009) Learning multi-modaldensities on discriminative temporal interaction manifold forgroup activity recognition. In: IEEE conference on computervision and pattern recognition, CVPR 2009, pp 2450–2457
21. Loy CC, Xiang T, Gong S (2010) Time-delayed correlationanalysis for multi-camera activity understanding. Int J Com-put Vision 90(1):106–129
22. Roggen D, Wirz M, Tröster G, Helbing D (2011) Recognitionof crowd behavior from mobile sensors with pattern analysisand graph clustering methods. Networks 6(3):521–524
23. Schmidt A (2003) Ubiquitous computing—computing in con-text. PhD thesis, Lancaster University
24. Scholl PM, Van Laerhoven K, Gordon D, Scholz M, BerningM (2012) Jnode: a sensor network platform that supports dis-tributed inertial kinematic monitoring. In: 9th internationalconference on networked sensing systems (INSS)
25. Sigg S, Gordon D, von Zengen G, Beigl M, Haseloff S, DavidK (2011) Investigation of context prediction accuracy fordifferent context abstraction levels. IEEE Trans Mob Com-put 11(6):1047–1059
26. Stäger M, Lukowicz P, Tröster G (2007) Power and accuracytrade-offs in sound-based context recognition systems. Perva-sive Mob Comput 3:300–327
27. Sumpter DJT (2006) The principles of collective animal be-haviour. Phil Trans R Soc B 361(1465):5–22
28. Wang L, Gu T, Tao X, Chen H, Lu J (2011) Recognizingmulti-user activities using wearable sensors in a smart home.Pervasive Mob Comput 7(3):287–298
29. Want R, Hopper A (1992) Active badges and personal in-teractive computing objects. IEEE Trans Consumer Electron38(1):10–20
30. Wirz M, Roggen D, Tröster G (2009) Decentralized detec-tion of group formations from wearable acceleration sensors.In: IEEE on proceedings of the international conference oncomputational science and engineering, pp 952–959
Recommended