TMRS Board MeetingAsset Smoothing
Mark Randalland
Joe Newton
September 25, 2009
Agenda
What is asset smoothing? How does asset smoothing really apply to a retirement
system? Key components of asset smoothing
• Smoothing Period• Corridor• Amortization Period
What do other Systems use? Measuring Risk versus Reward
2
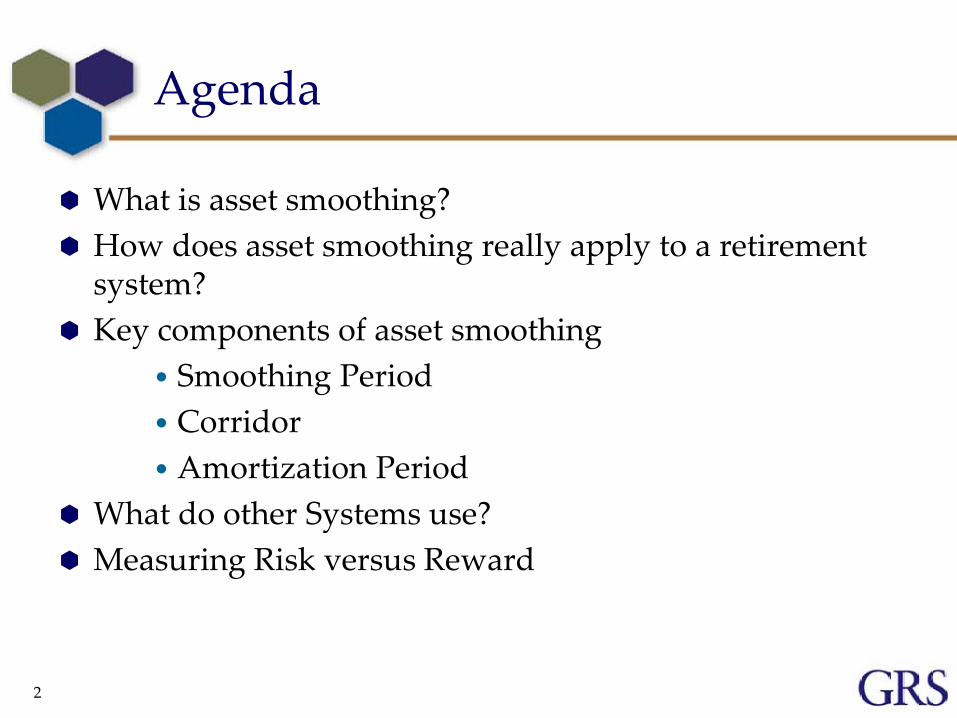
Dow Jones Industrial Average: Over the last year
3
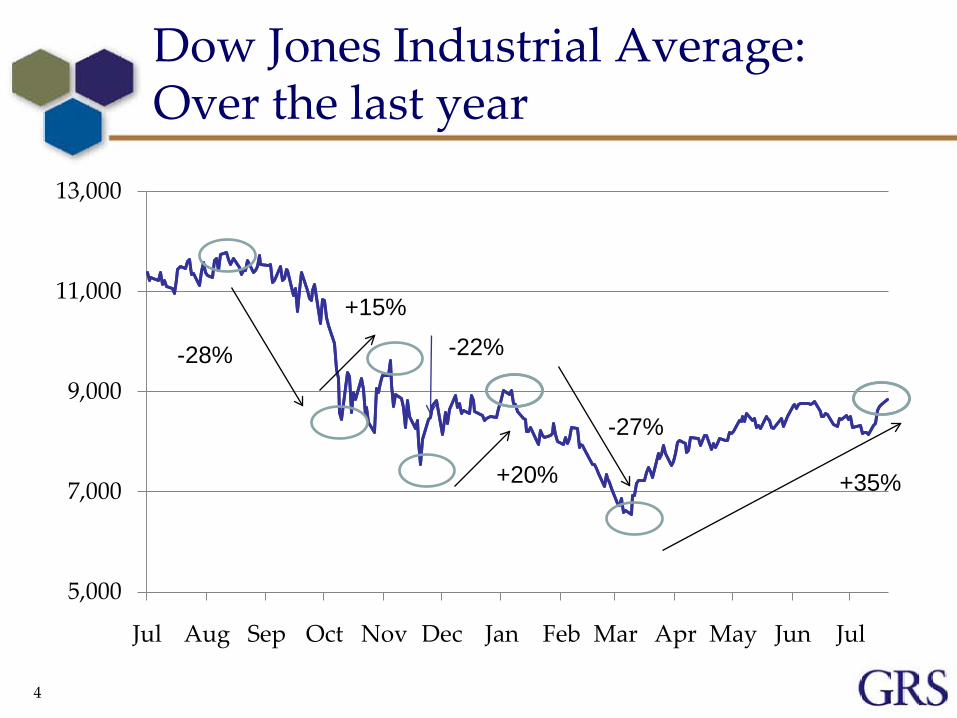
Dow Jones Industrial Average: Over the last year
5,000
7,000
9,000
11,000
13,000
Jul Aug Sep Oct Nov Dec Jan Feb Mar Apr May Jun Jul
-28%
4
+35%
-27%
+20%
-22%
+15%
Asset Smoothing
Annual fluctuation in the investment performance is averaged over a period of years
Smoothing is a method used to focus the decision making process on the long term►Consistency in funding►Consistency in reporting►Consistency in benefit provisions
However, smoothing does not impact long term costs or funded positions►Only impacts timing
5
66
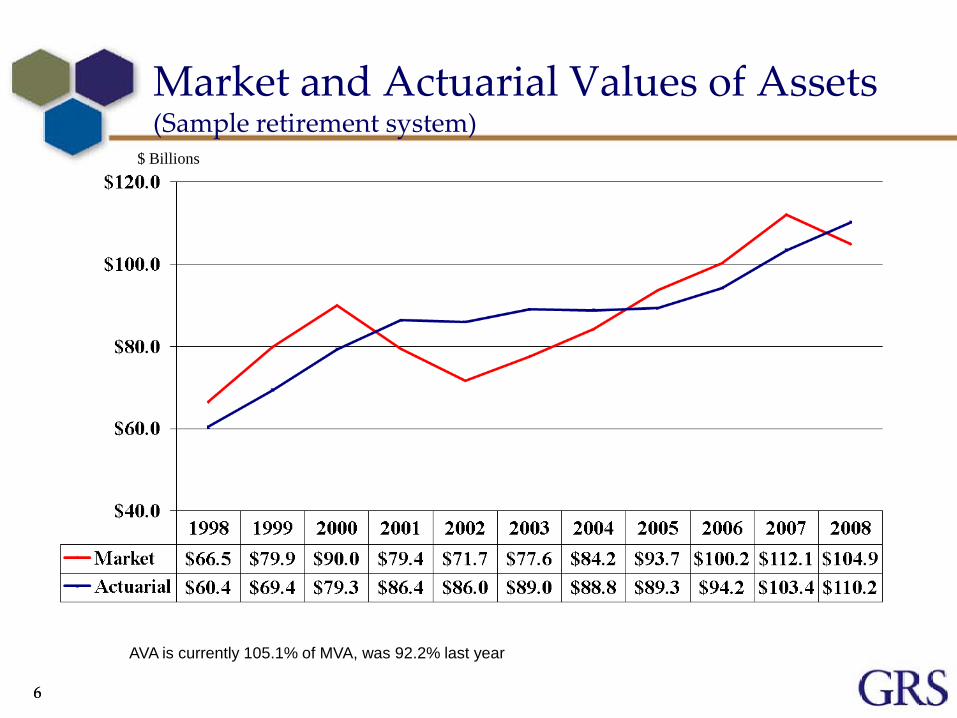
Market and Actuarial Values of Assets(Sample retirement system)
AVA is currently 105.1% of MVA, was 92.2% last year
$ Billions
77
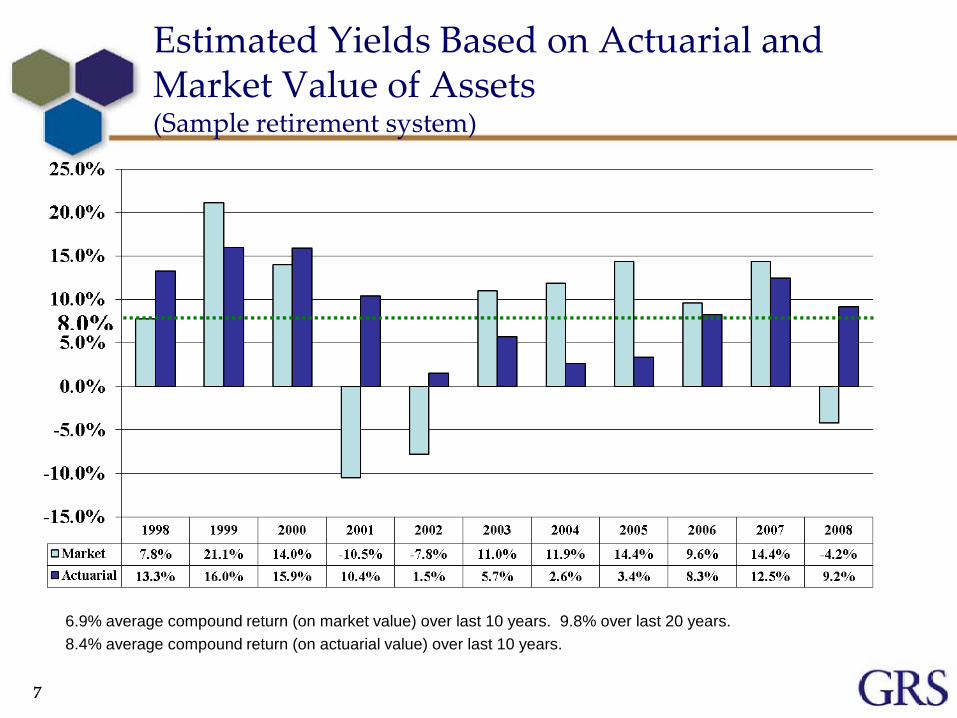
Estimated Yields Based on Actuarial and Market Value of Assets(Sample retirement system)
6.9% average compound return (on market value) over last 10 years. 9.8% over last 20 years.8.4% average compound return (on actuarial value) over last 10 years.
8
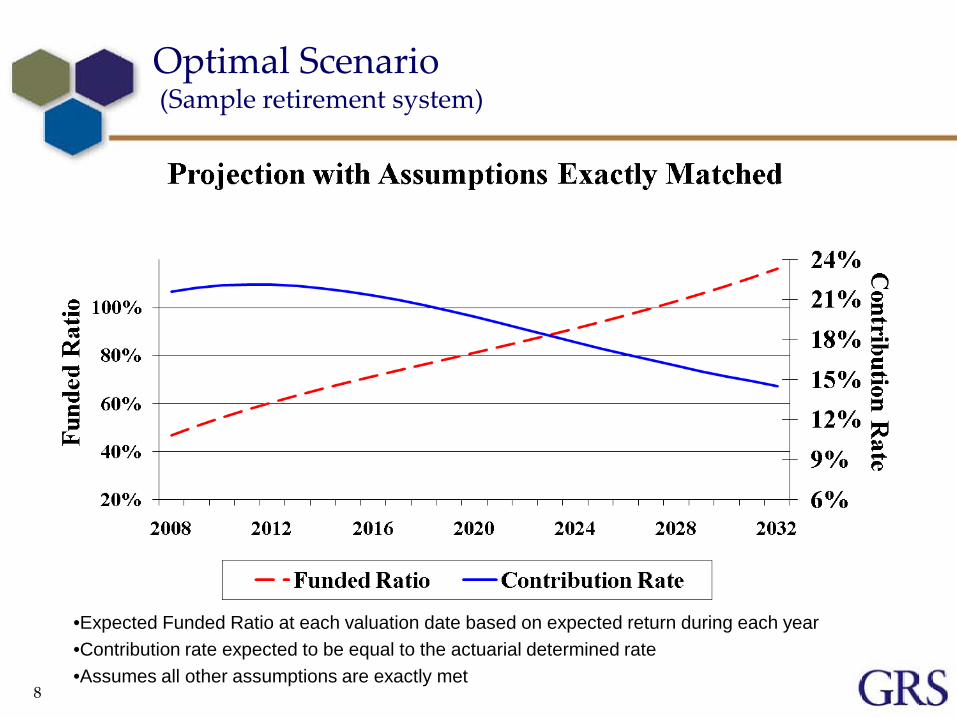
Optimal Scenario(Sample retirement system)
•Expected Funded Ratio at each valuation date based on expected return during each year•Contribution rate expected to be equal to the actuarial determined rate•Assumes all other assumptions are exactly met
9
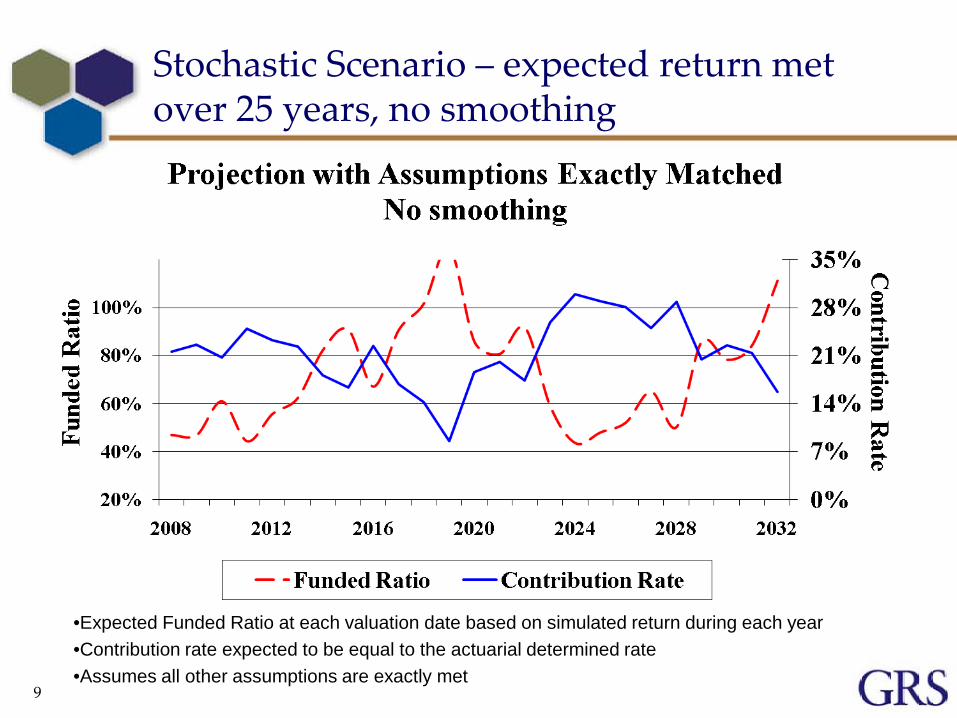
Stochastic Scenario – expected return met over 25 years, no smoothing
•Expected Funded Ratio at each valuation date based on simulated return during each year•Contribution rate expected to be equal to the actuarial determined rate•Assumes all other assumptions are exactly met
10
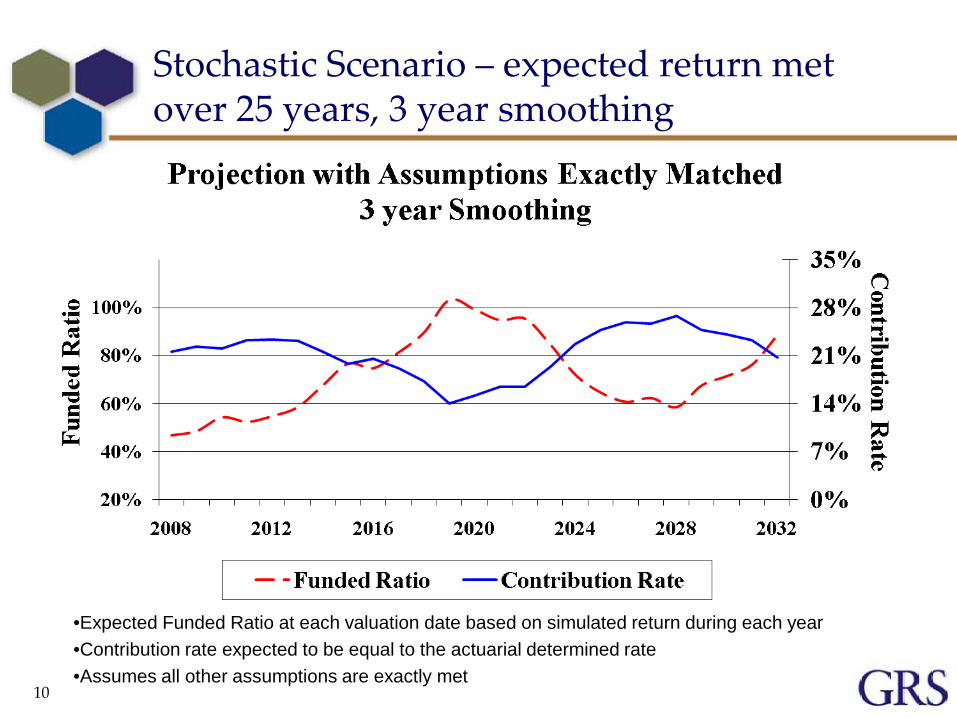
Stochastic Scenario – expected return met over 25 years, 3 year smoothing
•Expected Funded Ratio at each valuation date based on simulated return during each year•Contribution rate expected to be equal to the actuarial determined rate•Assumes all other assumptions are exactly met
11
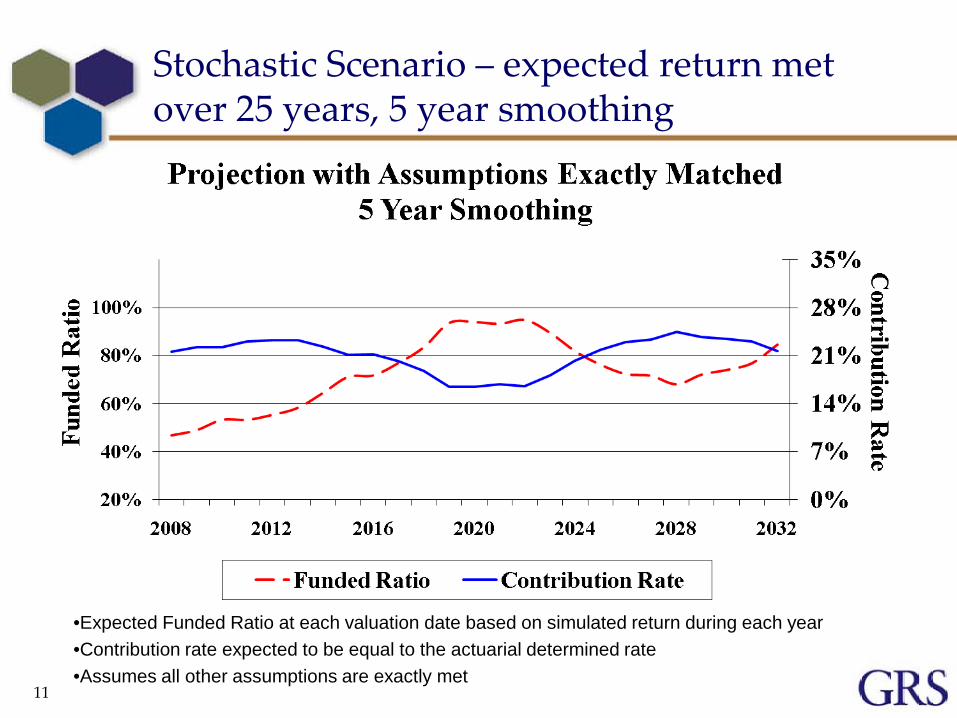
Stochastic Scenario – expected return met over 25 years, 5 year smoothing
•Expected Funded Ratio at each valuation date based on simulated return during each year•Contribution rate expected to be equal to the actuarial determined rate•Assumes all other assumptions are exactly met
12
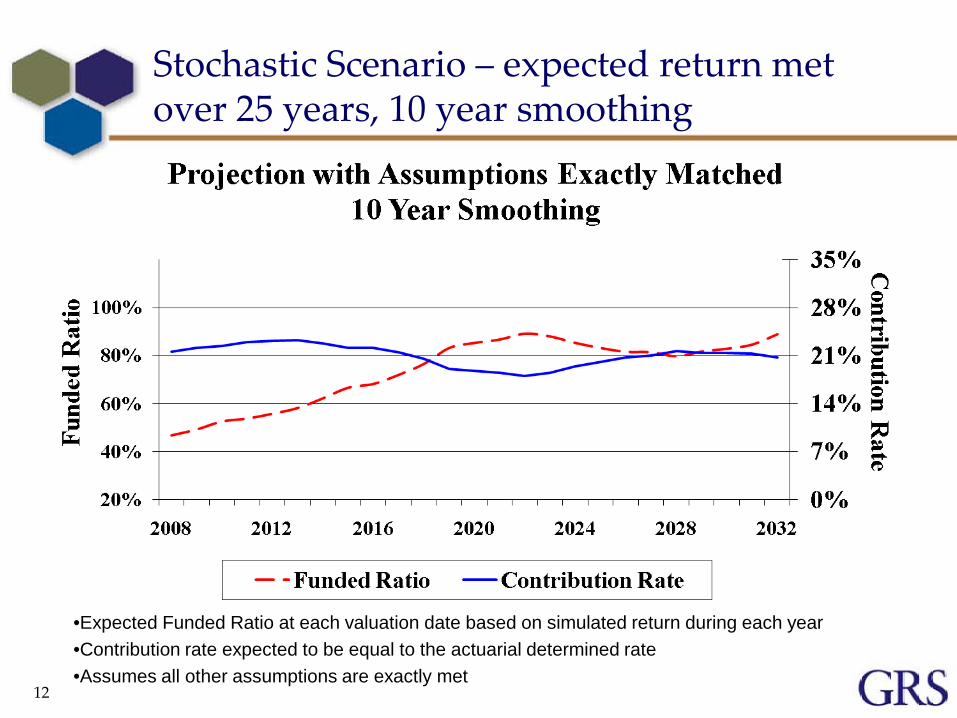
Stochastic Scenario – expected return met over 25 years, 10 year smoothing
•Expected Funded Ratio at each valuation date based on simulated return during each year•Contribution rate expected to be equal to the actuarial determined rate•Assumes all other assumptions are exactly met
13
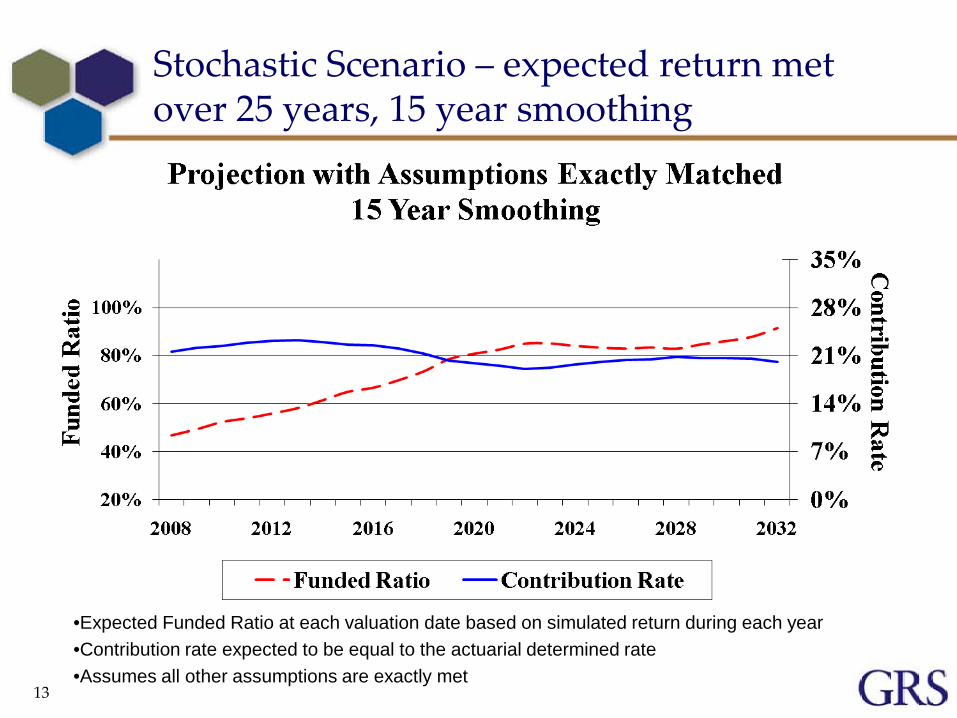
Stochastic Scenario – expected return met over 25 years, 15 year smoothing
•Expected Funded Ratio at each valuation date based on simulated return during each year•Contribution rate expected to be equal to the actuarial determined rate•Assumes all other assumptions are exactly met
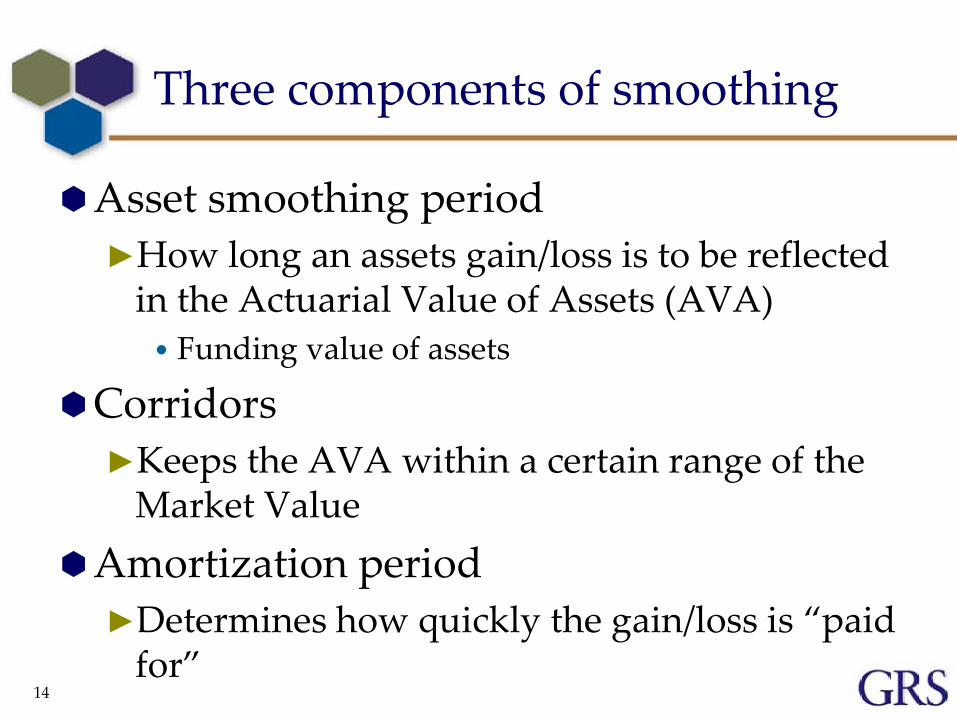
Three components of smoothing
Asset smoothing period►How long an assets gain/loss is to be reflected
in the Actuarial Value of Assets (AVA) • Funding value of assets
Corridors►Keeps the AVA within a certain range of the
Market ValueAmortization period
►Determines how quickly the gain/loss is “paid for”
14
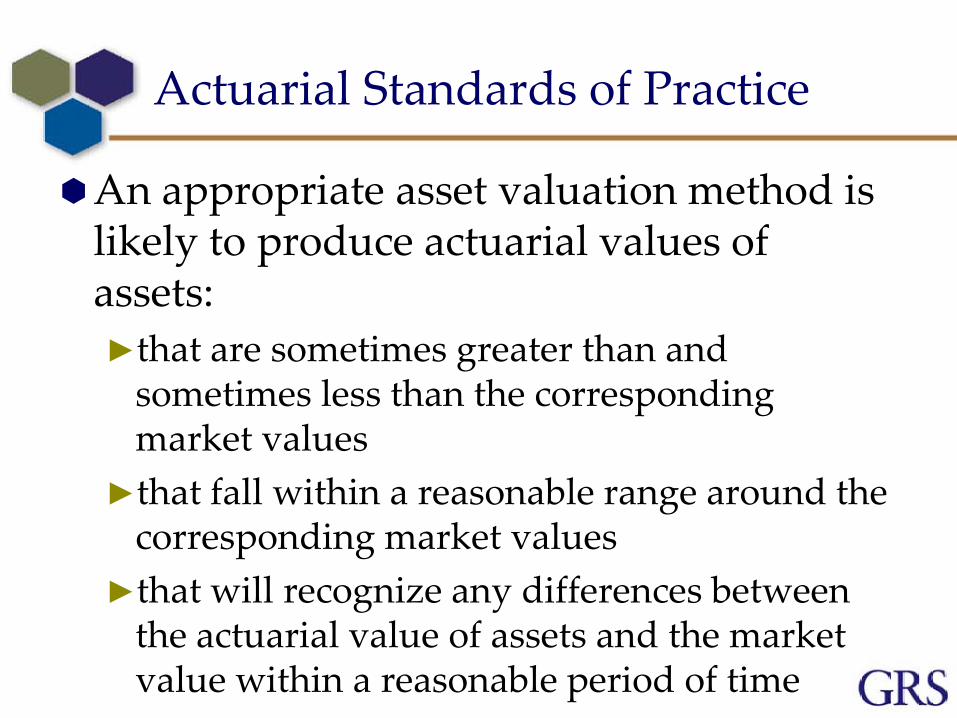
Actuarial Standards of Practice
An appropriate asset valuation method is likely to produce actuarial values of assets: ►that are sometimes greater than and
sometimes less than the corresponding market values
►that fall within a reasonable range around the corresponding market values
►that will recognize any differences between the actuarial value of assets and the market value within a reasonable period of time
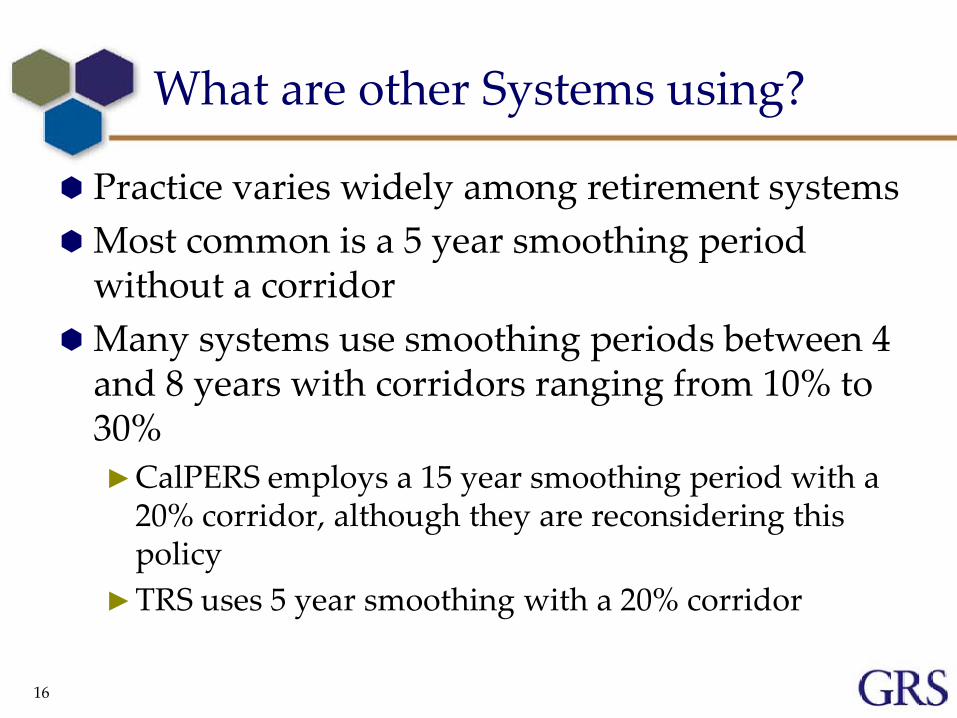
What are other Systems using?
Practice varies widely among retirement systems Most common is a 5 year smoothing period
without a corridor Many systems use smoothing periods between 4
and 8 years with corridors ranging from 10% to 30%►CalPERS employs a 15 year smoothing period with a
20% corridor, although they are reconsidering this policy
►TRS uses 5 year smoothing with a 20% corridor
16
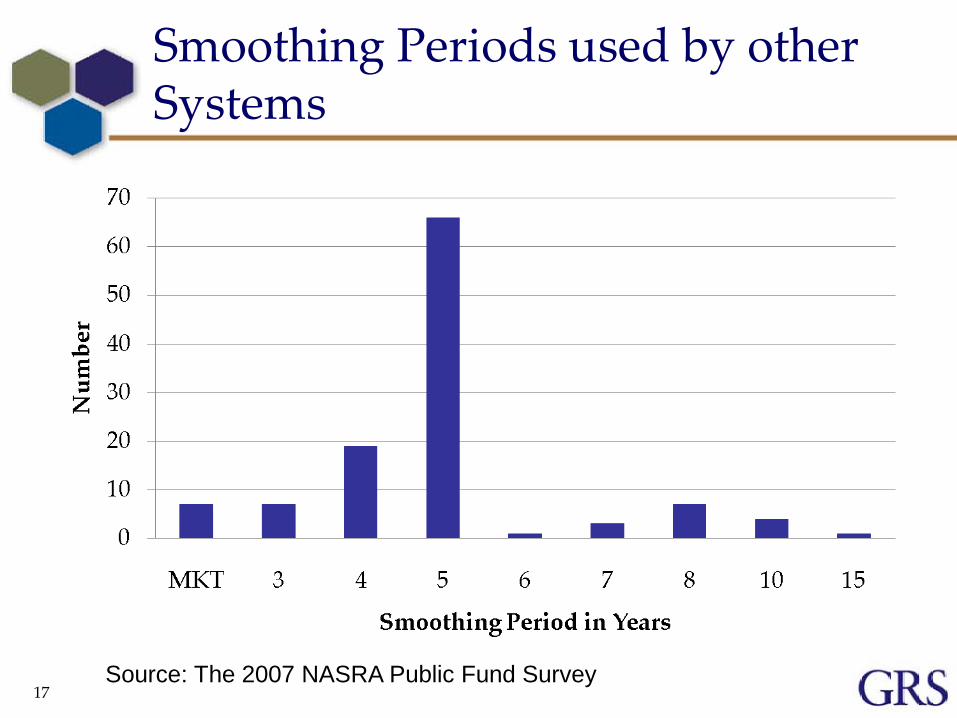
Smoothing Periods used by other Systems
17Source: The 2007 NASRA Public Fund Survey
Correlation of Smoothing Periods and Corridors
Some Retirement Systems establish an asset ‘corridor’ (Example: using a 20% corridor – Funding Value cannot be greater than 120% of Market Value or lower than 80% of Market Value)
The longer the smoothing period, the stronger the need for a tighter corridor
The shorter the smoothing period, the less need for a tight corridor and perhaps no corridor is needed
Corridor can be “hard” or “soft”► Recognize “all” or “some”
18
1919
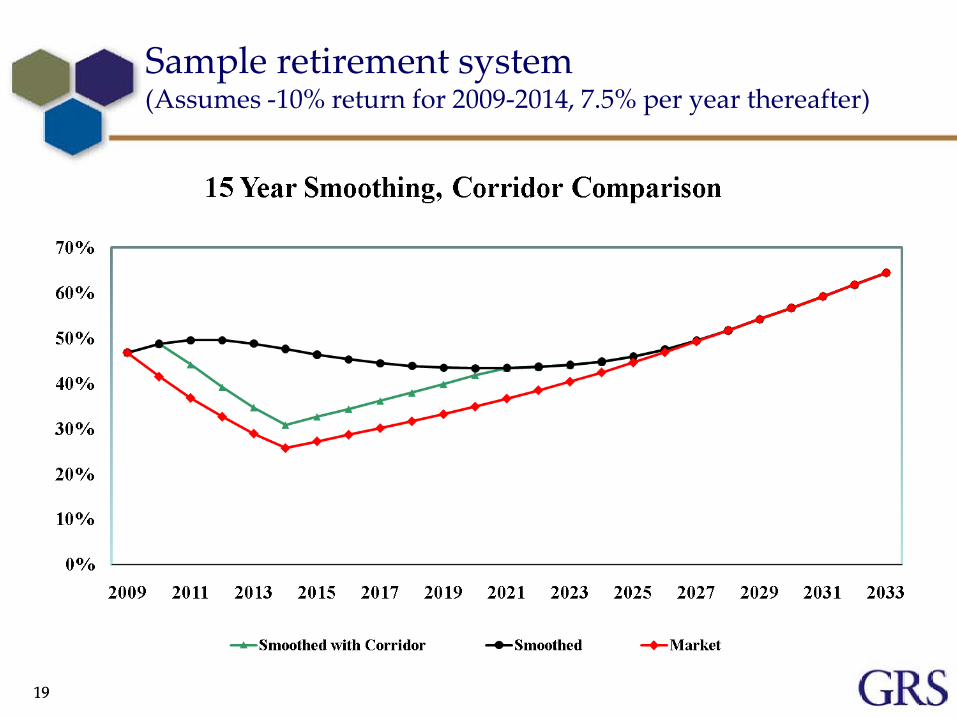
Sample retirement system (Assumes -10% return for 2009-2014, 7.5% per year thereafter)
Ramifications of a Corridor
Provides some downside protection to the funded status
More volatility in contribution rates Objective of stable contribution rates more
difficult to achieve Once funding value exceeds corridor, effect of
asset smoothing is negated
20
Reward vs. Risk/Cost
When deciding between methods/policies, a given reward will come with a certain level of risk►increased risk should be offset by a greater
rewardIn choosing a smoothing method, the
reward is less volatility in the contribution rate►But what is the risk?►And what is the cost?
21
2222
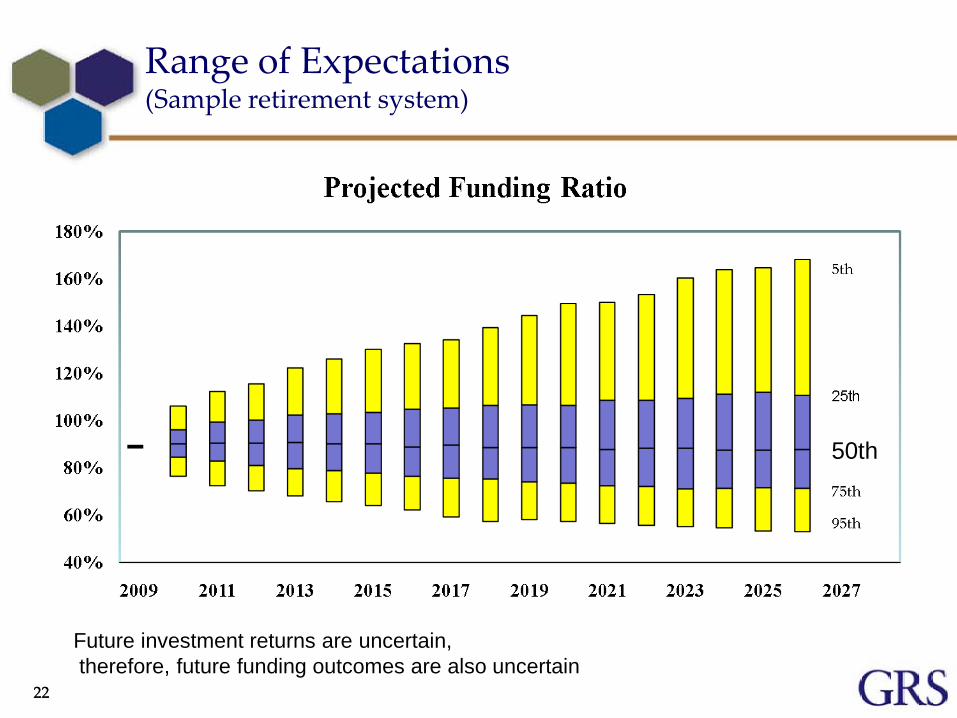
Range of Expectations(Sample retirement system)
50th
Future investment returns are uncertain,therefore, future funding outcomes are also uncertain
2323
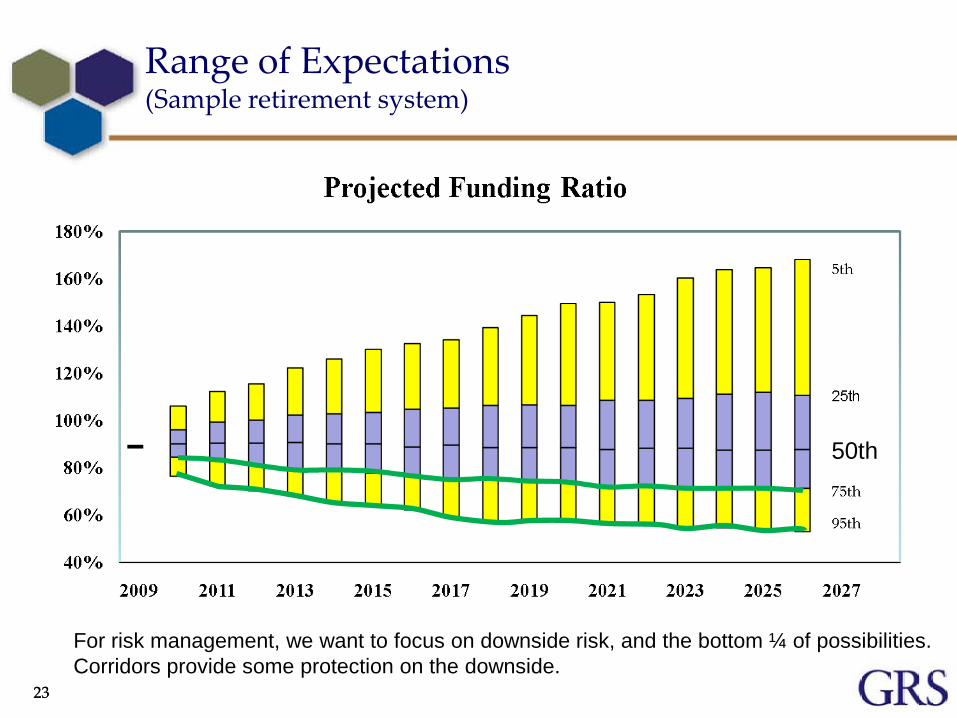
Range of Expectations(Sample retirement system)
50th
For risk management, we want to focus on downside risk, and the bottom ¼ of possibilities.Corridors provide some protection on the downside.
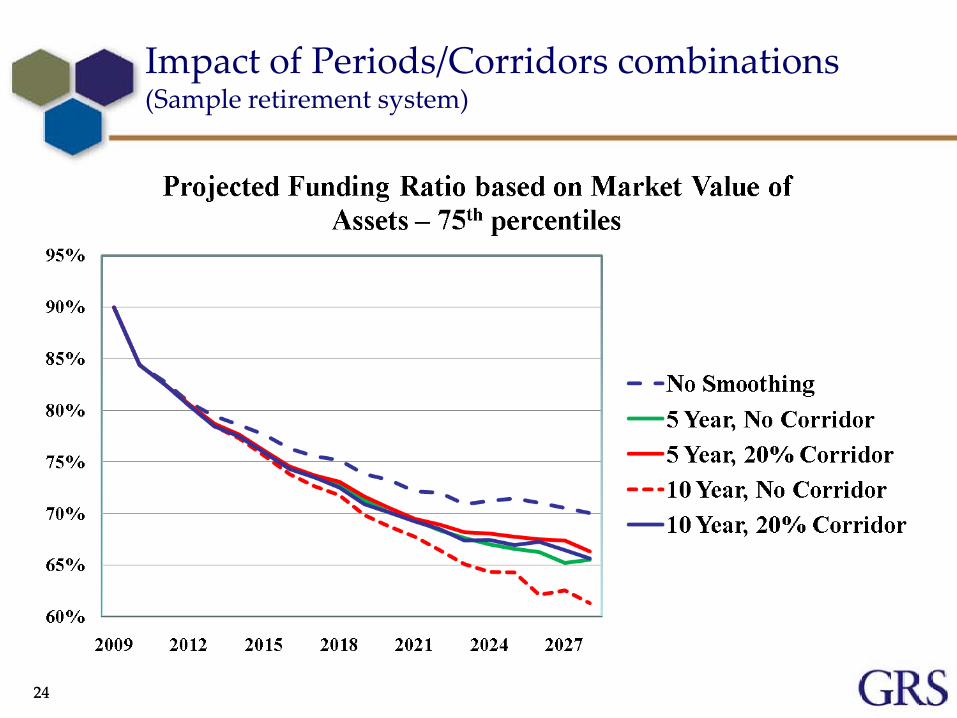
2424
Impact of Periods/Corridors combinations(Sample retirement system)
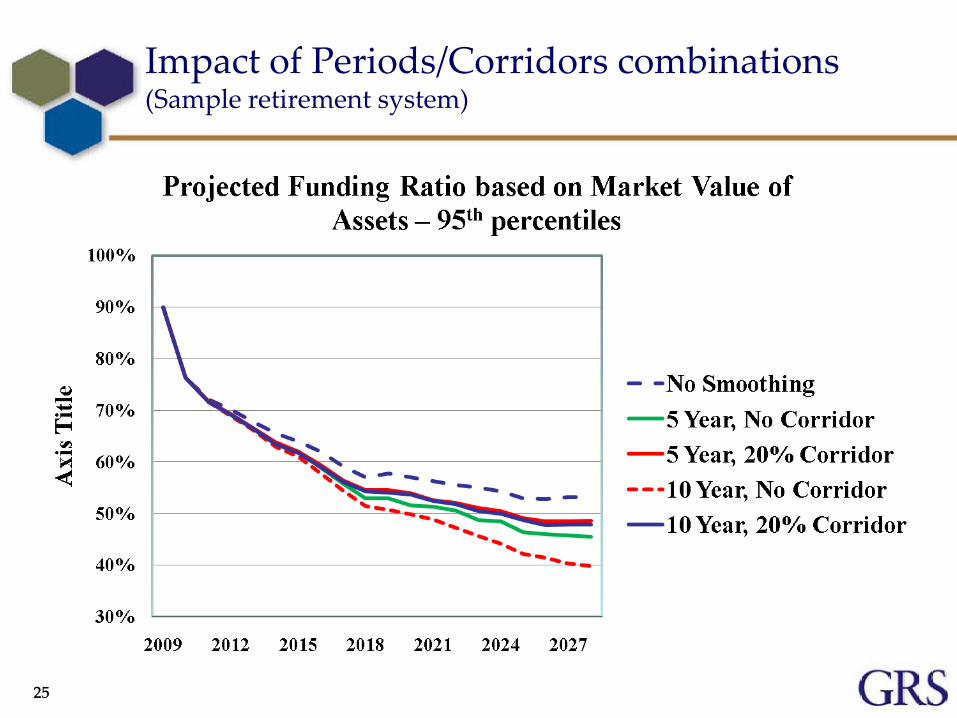
2525
Impact of Periods/Corridors combinations(Sample retirement system)
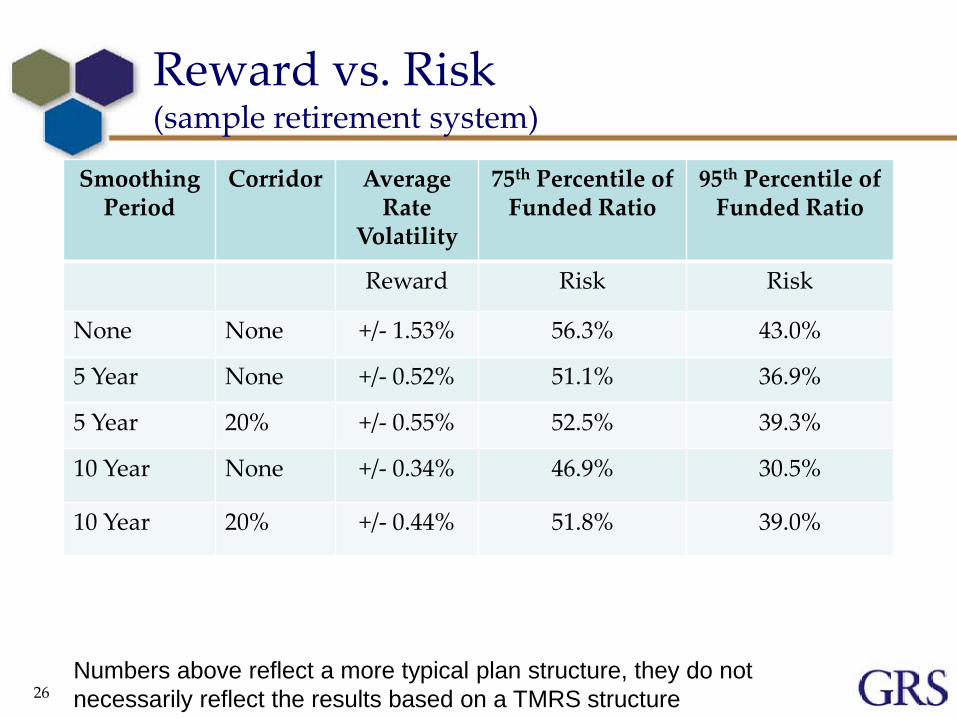
Reward vs. Risk(sample retirement system)
Smoothing Period
Corridor Average Rate
Volatility
75th Percentile ofFunded Ratio
95th Percentile ofFunded Ratio
Reward Risk Risk
None None +/- 1.53% 56.3% 43.0%
5 Year None +/- 0.52% 51.1% 36.9%
5 Year 20% +/- 0.55% 52.5% 39.3%
10 Year None +/- 0.34% 46.9% 30.5%
10 Year 20% +/- 0.44% 51.8% 39.0%
26Numbers above reflect a more typical plan structure, they do not necessarily reflect the results based on a TMRS structure
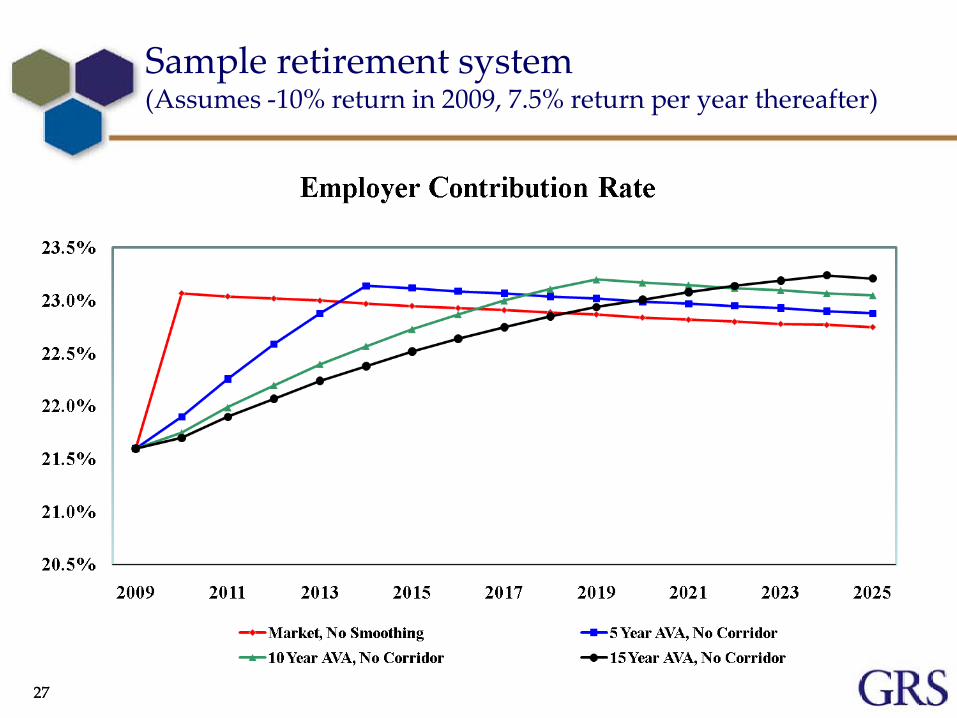
2727
Sample retirement system (Assumes -10% return in 2009, 7.5% return per year thereafter)
2828
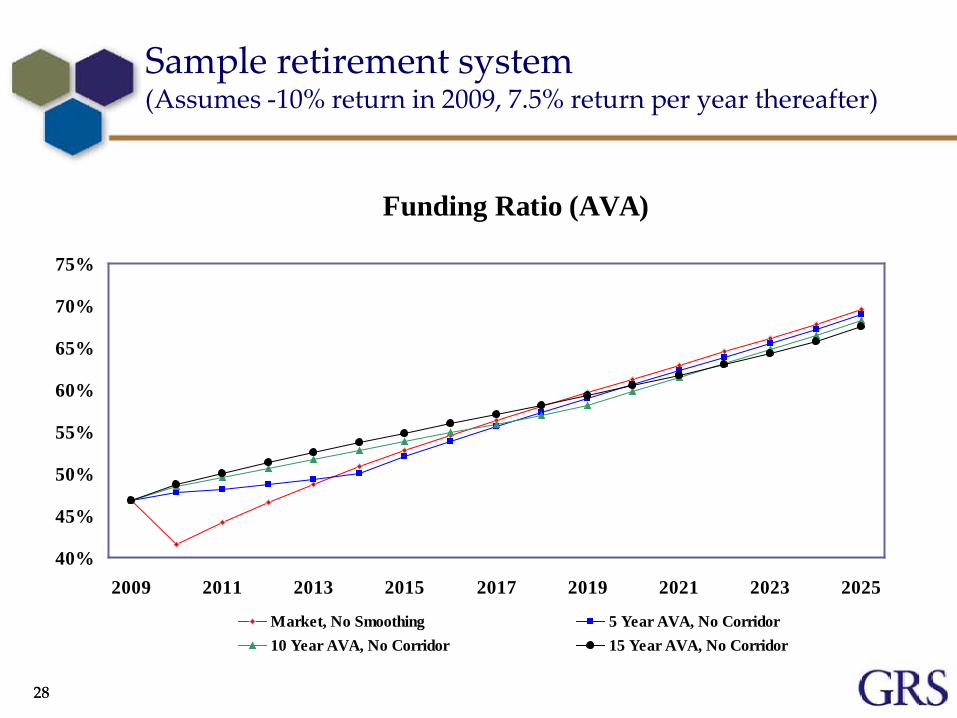
Sample retirement system (Assumes -10% return in 2009, 7.5% return per year thereafter)
Funding Ratio (AVA)
40%
45%
50%
55%
60%
65%
70%
75%
2009 2011 2013 2015 2017 2019 2021 2023 2025
Market, No Smoothing 5 Year AVA, No Corridor10 Year AVA, No Corridor 15 Year AVA, No Corridor
2929
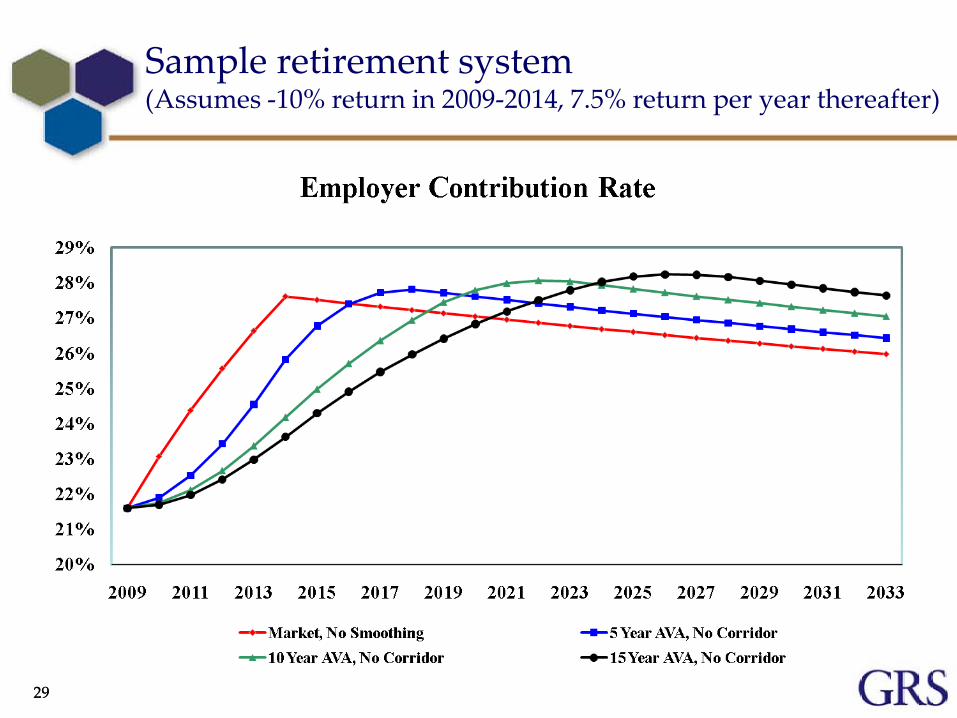
Sample retirement system (Assumes -10% return in 2009-2014, 7.5% return per year thereafter)
3030
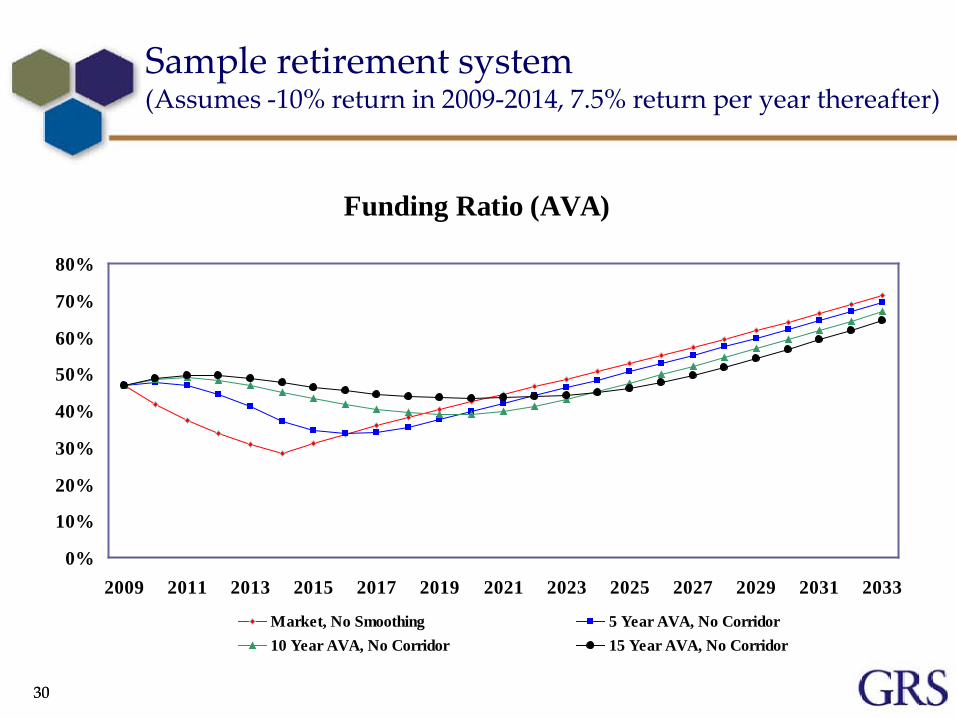
Sample retirement system (Assumes -10% return in 2009-2014, 7.5% return per year thereafter)
Funding Ratio (AVA)
0%
10%
20%
30%
40%
50%
60%
70%
80%
2009 2011 2013 2015 2017 2019 2021 2023 2025 2027 2029 2031 2033
Market, No Smoothing 5 Year AVA, No Corridor10 Year AVA, No Corridor 15 Year AVA, No Corridor
3131
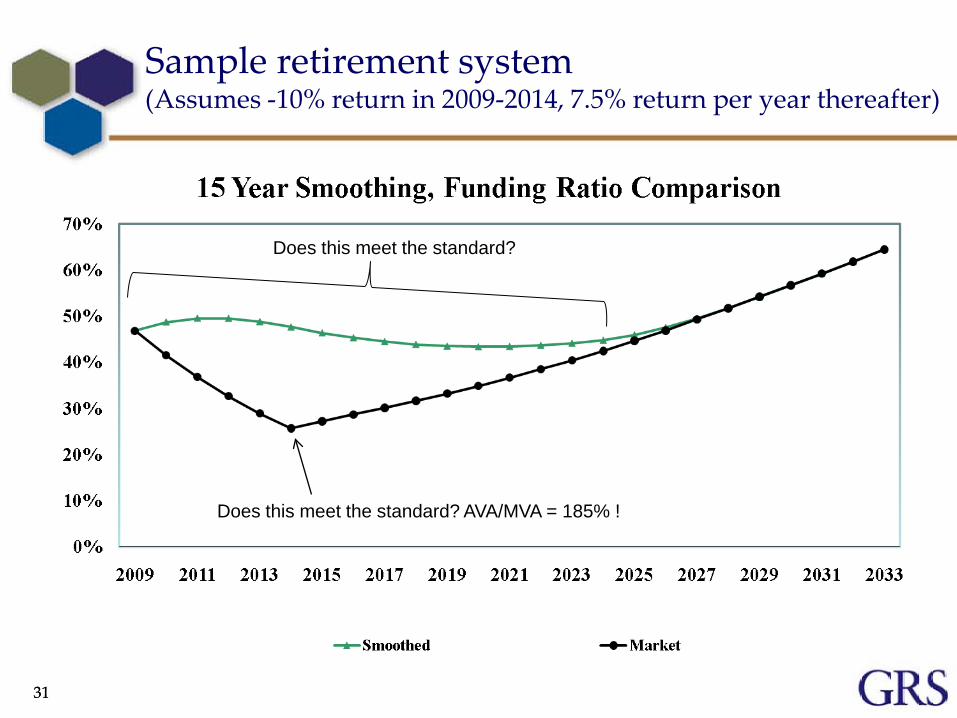
Sample retirement system (Assumes -10% return in 2009-2014, 7.5% return per year thereafter)
Does this meet the standard?
Does this meet the standard? AVA/MVA = 185% !
3232
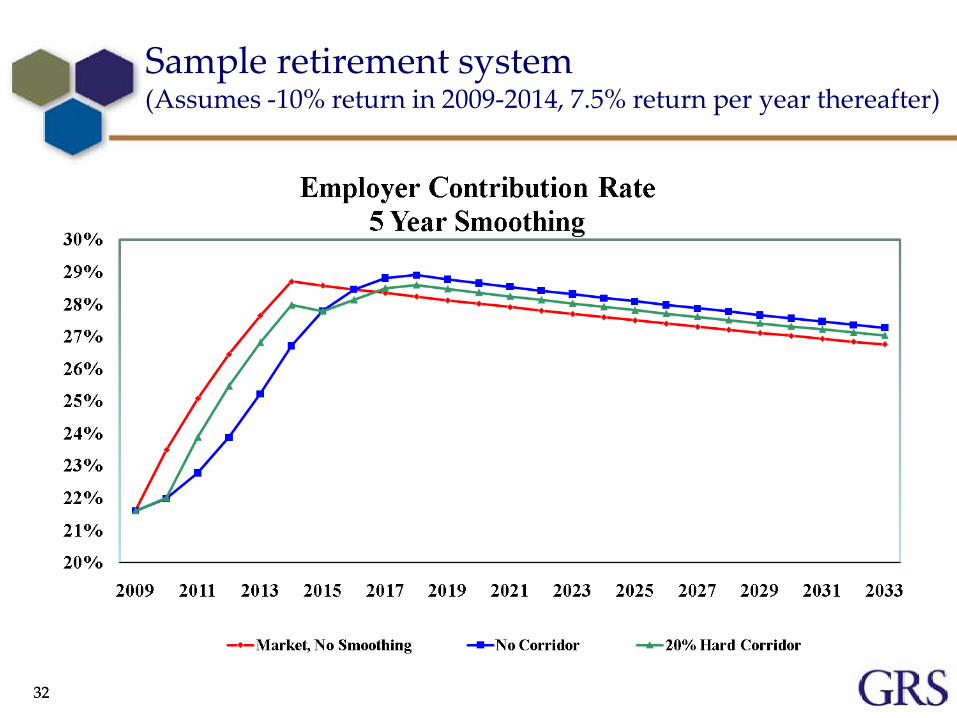
Sample retirement system (Assumes -10% return in 2009-2014, 7.5% return per year thereafter)
Reward vs. Risk/Cost
The reward is less volatility in the contribution rate
The risk is more downside exposureThe cost is paying more later with interest
if there is no recovery
33
In Summary
Pension Plan funding is a long term financial arrangement
Using the market value of assets as of a specific date may place too much emphasis on the short term►Emotion and short term budgets may then
control the decision making process• Can cause over-reaction and instability
34
In Summary
Assets Smoothing is a method used to focus the decision making process on the long term►Consistency in funding►Consistency in reporting►Consistency in benefit provisions
35
Recommended