1
www.pmi.org.in/events/pmnc17/
Title : Analytics in Agile Project Management Theme: Project Management Leadership > In a Rapidly Changing World
Keywords: Agile, Metrics, Analytics, Regression Model
Abstract: In the Information revolution era, Knowledge Work project became a common trade. We observe
Interactions and collaboration involved in the knowledge work project make the requirement less predictable
and more uncertain. Agility brings the adaptability and flexibility which leads to successful execution of the
knowledge work project. However, Agility gives the predictions on the short iterations and it makes difficult to
build the long term visibility of the project strategy. Incorporating the Analytics in the agile methodology can be
used to predict the long term visibility of the projects. With Analytics, we can adopt the different agile
framework for large scale enterprise projects and it will increase the probability of project success. It will
eventually helpful to economic of growth of the Nation.
Table of Contents
Introduction: .......................................................................................................................................................2
Why Agile ? ........................................................................................................................................................2
Agile Attributes:..................................................................................................................................................3
Agile Metrics.......................................................................................................................................................4
Business Metrics ...........................................................................................................................................5
Project Metrics ...............................................................................................................................................6
Process Metrics .............................................................................................................................................7
What is Analytics : .............................................................................................................................................7
Analytics Techniques for Agile Metrics. .........................................................................................................8
Case Study .........................................................................................................................................................8
Conclusion :..................................................................................................................................................... 11
References ...................................................................................................................................................... 12
2
www.pmi.org.in/events/pmnc17/
Introduction:
In the current Information revolution era of Knowledge work project, Project work become less predictable and
more uncertain. Agile Project Management methodology is developed in the response of this problem.
Moreover, It is essential to apply the analytics in Knowledge work project for better governance and increase
the project success. Applying the adequate "Analytics" plays stellar role for success of the knowledge work
projects.
Outline of the paper is as under:
Why Agile ?
Agile Attributes
Agile Metrics
What is Analytics ?
Analytics Techniques for Agile Metrics ?
Case Study
Conclusion
Why Agile ?
We are in Information revolution era and information revolution relies on Ideas for betterment of the people,
society, environment, services, goods etc. Ideas are main sources of the projects. Ideas are generated by the
Knowledge workers. Knowledge workers are the people with expertise in subject matter who share their
knowledge and participate in analysis and development of the work.
As knowledge worker project become more common, organization found that the communication and
collaboration involved in these projects made the work more uncertain and less definable then the industrial
work.
Let me take the opportunity to summarize the Key Attributes of Knowledge work Project:
• Exact Outcome is not known in advance
• Output is based on knowledge
3
www.pmi.org.in/events/pmnc17/
• Empirical Process
With the attributes of Knowledge work projects, Fix mindset paradigm no longer works and the shift to growth
mindset begin. Fix mindset people , always think that project requirements must be determined at the start
and they shouldn't change. For the Fix mindset people, Project fails if the plan fails. For Growth Mindset
people, Project real requirements are unknown and will be continuously developed and enhance from
continuous learning. For growth mindset people continuous focus towards the betterment of outcome. In
order to build the growth mindset People, Project Team must be treated as volunteers because these team
can live and take their "means of production": their knowledge. Also like volunteers, knowledge workers do
not want to be ordered around. Knowledge workers want to engage , want to participate , want to know
what they are doing , want to know what impact they are generating. They feel to be challenged as their
efforts are much appreciated. Conversations do not begin with our requirements but with other parties’
requirement. What are their values? What are their goals? The starting point may be the definition of results.
In Summary, Agile and Agility is your established set of habits and attitude towards the work done to generate
the business value for betterment of people.
Agile Attributes:
I have been conducting various sessions on agile and attending the various conference. When I asked the
people about the what is agile ? Many of us believes that agile helps us to deliver the customer value faster
than waterfall project management methodology.
Let me summarize the Agile Attributes here.
Fast Delivery & Feedback : Agile approach to this scenario by developing some of the value added features
first and taking those things to the customer and collecting the feedback before developing the rest of the
future. It helps us to collect the fast feedback and our perceptions about the requirement. If the things are
going in right direction then we are able to deliver the fast delivery to customer.
Increment Development : Incremental is all about building the things incrementally and delivering the part of
feature and customer start using it.
Iterative Development : Iterative development is all about the visualizing the solutions and taking the
customer feedback before finalizing it. Rather than making the final piece or module , we make first level of
end to end flow of some features and we take the customer feedback and we expect the customer feedback
will improve our existing products.. With these iterations , we come up with the product which fulfils customer
expectations.
4
www.pmi.org.in/events/pmnc17/
Adaptive Planning : In agile environment, we will start with top level direction based on our vision. We make
a granule plan for the short term duration. When we move forward, we elaborate our plan. Agile talks about
rolling wave planning.
Changing Requirement: In knowledge work projects, requirement are going to change. Instead of criticize
on changing requirement, we will welcome change. Because we know that sooner we know better product we
can build.
Stakeholder Engagement: In Traditional Project management, we emphasis more on Stakeholder
management. In agile, we will make stakeholder as a part of the development. Stakeholder is not the second
party in agile. We may engage them by way of inviting them in software requirement workshop, design
workshop, product demo etc.
Emergent Design : Many of us believe that if we have 100 features that we have the design for all the
features…you can't start the development till the time you can't have the baseline architecture. Agile no do
it…In Agile design is regular activity. Code is clean from insight design will emerge.
Collaborative - Self Organize & Directed Team : Agile environment, we don’t believe the project manager is
the resource manager, he identifies the task and assign to developer and resource leveling and planning. All
the work will be done by the collaborative team. Team is one unit to deliver the business value .They need to
figure out what is to be needed to make the development process work best for them.
Less Documentation: Agile approach to documentations is "Just Enough, Just in time and Just because".
"Just Enough" to cover it needs. This keeps most of the our efforts focused on emerging system. "Just in
time" we don’t have to spend extra time to keep it updated as our requirement and design change "Just
because" It is easier and preferable to produce it than to face the consequences of not doing so.
Internal Quality: In order to sustain development speed, teams must build quality into both their process and
their code. Building quality into their process allows a team to improve it by removing the waste it creates or
requires. One way to do this is to define acceptance test before writing code by bringing the customer,
developer, and tester together. This improves the conversations that take place around the requirements and
it helps the developers understand what functionality they need to write.
Agile Metrics.
Let us try to understand the Metrics before going for Agile Matrices A Metric is a standard for measuring or evaluating something.
5
www.pmi.org.in/events/pmnc17/
• A measure is a quantity , a proportion , or qualitative comparison of some kind.
o Quantity : "There are 25 defects in QA Testing"
o Proportion : "This release there are 15 percent less Unit Test Effectiveness"
o Qualitative : "Release version is more stable as compare to old version"
Metrics are crucial for governance as well as monitoring as
• It helps
• Organization to select and justify the projects
• To access the risk
• Give continuous feedback
• To Build a healthy code base
• To be able to do frequent releases
• Issues early.
In Agile, The Project Metrics are categorized in to in three major parts
Business Metrics
Return of Investment ROI : It measures the profitability of an investment by calculating the ratio of the
benefits received from the projects and money invested. It is useful metrics, However, it may not tell the true
value about the project as it will not take into account the effects of inflation and cost of the borrowing money.
Net Present Value : In order to assess the value of the projects in terms of today's money, we calculate its
NPV. NPV defined as the present value of the revenue stream over a series of time periods. NPV is usually
helpful to comparing the projects, that involve the different timeframes or that are expected to start delivering
value at different timeframe. However, we have to guess the inflation and interest rate will be in future and
those guess may not correct in most of the cases.
Internal Rate of Return : Rate at which "the project inflows(revenue) and outflows(cost) are equal" We don't
have to guess what the future interest and inflation rates will be, as we do for NPV.
Customer Satisfaction : Agile First Principles emphasis on Customer Satisfaction - "Our highest priority is to
satisfy the customer with early and frequent delivery". In Agile Customer Satisfaction, it is not just ask the
customer to provide the rating of the sprint/release or ask customer to fill the feedback form about the
delivery. It’s surely beyond this. Customer Satisfaction will be highly rely on how customer is responding
during the Sprint Review Meeting, how customer is responding to team problems, how customer reaction for
any bugs in release, how customer sharing the future product road map with the team. Agile leader require
6
www.pmi.org.in/events/pmnc17/
these skills to understand the customer pulse and do the preventive actions to increase the customer
satisfaction.
Project Metrics
Velocity : A cycle measures its rate of progress in pedals, an agile team measures the rate of progress with
velocity. Velocity is expressed as the number of story points (or ideal days) completed per iteration.
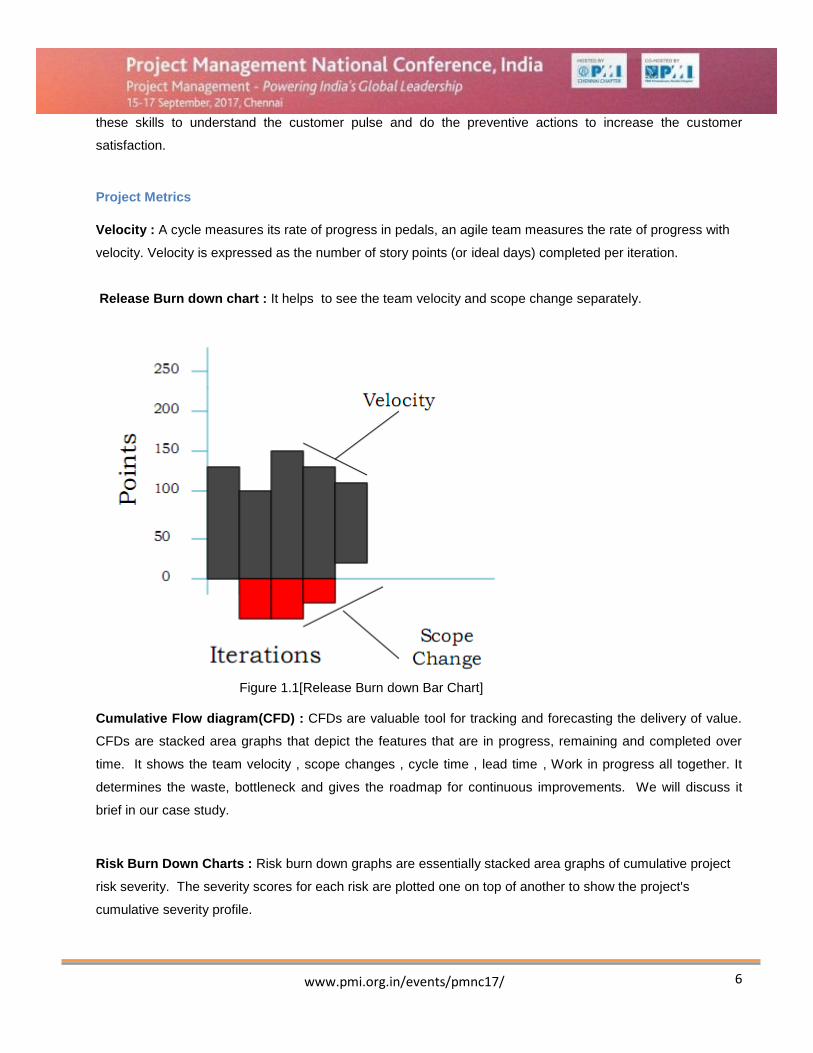
Release Burn down chart : It helps to see the team velocity and scope change separately.
Figure 1.1[Release Burn down Bar Chart] Cumulative Flow diagram(CFD) : CFDs are valuable tool for tracking and forecasting the delivery of value.
CFDs are stacked area graphs that depict the features that are in progress, remaining and completed over
time. It shows the team velocity , scope changes , cycle time , lead time , Work in progress all together. It
determines the waste, bottleneck and gives the roadmap for continuous improvements. We will discuss it
brief in our case study.
Risk Burn Down Charts : Risk burn down graphs are essentially stacked area graphs of cumulative project
risk severity. The severity scores for each risk are plotted one on top of another to show the project's
cumulative severity profile.
7
www.pmi.org.in/events/pmnc17/
Agile Earned Value Management(EVM) : We have a common tool like "S" curve to track the project
spending, "Gantt Chart" to monitor the project schedule. To assess the overall health of a project, what we
really need is a single diagram that can show the project status in terms of the schedule and cost both. EVM
is created to fill this gap. EVM is essential metrics of Agile projects. One of the key benefits of earned value
metrics is that they are a leading indicator. Earned value is a visual representation.
Process Metrics
Lead Time & Cycle Time : Lead time is a diagnostic tools that can be used to help identify and diagnosis
problem. Lead Time measures how long something will take to go through the entire process, from
requirement gathering to production deployment. Cycle Time is the subset of the lead time that measures
how long something to go through part of the process, such as coding to testing.
WIP : Work in progress is the task that started but has not been completed.
What is Analytics :
Analytics can range from a simple exploration into how many projects of a particular portfolio were made last
year to a complex neural network model predicting which projects to target for successful completion. In
layman’s terms it can be defined as “the analysis of data to draw hidden insights to aid decision making”.
Two kinds of analytics
1) Descriptive analytics
2) Predictive analytics.
Descriptive analytics describes what has happened in the past. Predictive analytics predicts what will happen
in the future.
Common Terminology: Dependent Variable: Variable which are predicted is called the Dependent variable.
Independent Variable: Variable used to making the predictions is called Independent.
Training Dataset: Datasets used to build the models is called the training data sets.
Model: The processing of discovering the patters and relationship between Dependent and Independent
variables is called the modeling process.
Validation Dataset: Data sets used to validate the accuracy of the model is called the Validation datasets.
Patterns will be applied to the validation data sets to check the validity of the models.
8
www.pmi.org.in/events/pmnc17/
Techniques of Predictive analytics : Linear Regression: It is a method of predicting the target variable from predictor variable.
Logistic Regression: Binary response. Is the sprint goal achieved or not? It is the effective technique then
business problem is binary response. It is the similar to linear regression but the main difference is what they
predict.
Decision Tree: It's a model that can be viewed as a tree. Decision Tree algorithm based on partitioning the
data into smaller subsets which have a higher and lower level of purity and parent population.
Analytics Techniques for Agile Metrics.
Velocity: It will be measured using the descriptive analytics. It is the sum of story points or ideal hours
completed during the iterations. Usually, Initial iterations velocity measured based on previous performance
of the team. It can be predicted using linear regression model. During the project execution, velocity can
predicted based on average velocity of the previous iterations.
Release burn down charts: It will be measured using the descriptive analytics. Usually, at the start of the
team estimate total story points which needs to deliver in the release. Team decides the iteration length and
based on team's capacity team commits to deliver the # of story points in the each iteration.
Lead Time and Cycle Time: It can be measured using descriptive analytics. Lead time is the total time which
includes the story created to move production and Cycle time is the subset of the lead time. Lead time and
cycle time is the leading metrics.
Cumulative Flow Diagram: It is the leading metrics and will be predict with linear regression model. It will
forecast the end date of the release also help us to determine where the bottleneck. We will discuss more on
cumulative flow diagram in our case study.
Case Study
As we understand, Knowledge work projects are highly dynamic in nature due to uncertainty and less
predictability. To overcome the challenges, Organization PMO wants to build the effective model for agile
project governance. Every PMO's key goal is to improve the customer satisfaction and it can be done by
9
www.pmi.org.in/events/pmnc17/
increasing throughput and reducing lead time. For enterprise projects, it is essential to effectively use the
cumulative flow diagram as it serves many goals like
• Determine Bottleneck
• Reduce Lead Time
• Minimize Waste
• Improve throughput
Here, the goal of this case study is the definition of measures to assess the flow of agile development with the
goals of increasing throughput and creating the transparency of the current status of product development;
and the evaluation of the visualization combined with the proposed measures in an industrial context.
This case study was SPEC India in India. The case study was already able to illustrate how the regression
model applied on measurement could quantify the decision making, and how the measures could be used to
determine the bottleneck in development flow. PMO imposed this measures quickly to their project managers.
However, the qualification of the measurement evaluated when collecting the data over the period.
In case study, first we provide the brief over view of the cumulative flow diagram, second, we illustrate the
how regression model will apply to the measures and analysis of the validity and the results will be presented.
Third, practical implication of the analysis.
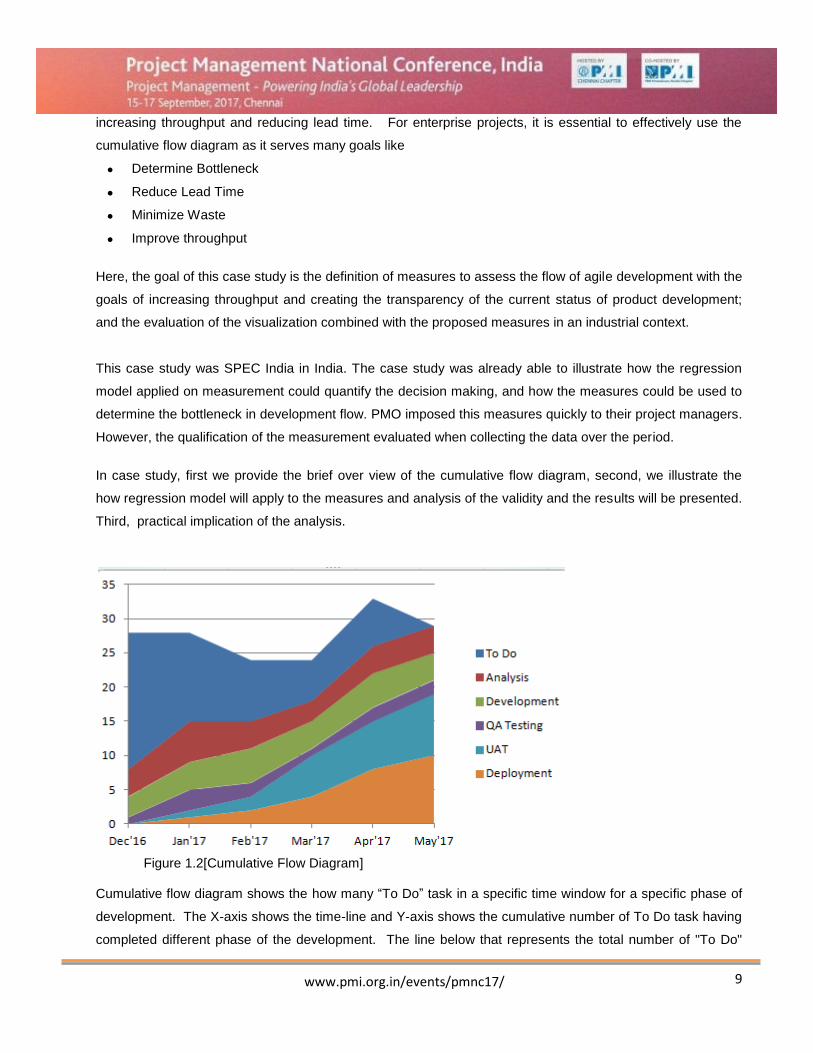
Figure 1.2[Cumulative Flow Diagram] Cumulative flow diagram shows the how many “To Do” task in a specific time window for a specific phase of
development. The X-axis shows the time-line and Y-axis shows the cumulative number of To Do task having
completed different phase of the development. The line below that represents the total number of "To Do"
10
www.pmi.org.in/events/pmnc17/
tasks for which analysis is finished and that were handed over to the Development phase. The area in
between those two lines is the number of "To Do Analysis" to be "To Do Development". For example, In
Figure 1.2[Cumulative Flow diagram] Dec'2016 incoming To Do task is handed over for analysis phase. In the
end of the release the "To Do" task moved to the Development.
Here, work in progress is defined as a number of "To Do in Analysis" in a phase at a specific time. The
difference of the number of "To Do" in two phase (n and n+1) represent the current work in progress level at a
specific points. Work in progress for specific time can be calculated as a
Wn,t = Tn,t − Tn+1,t (1)
Let us determine, which phase in the flow is the bottleneck? A bottleneck would persists if the "To Do Task"
would exists if the requirement come into phase (phase n) in higher rate than it handover to the next
phase(n+1). In above Figure.1.2[Cumulative Flow Diagram] bottle neck can be found, That is, the rate in
which "To Do Task" are handed over from Analysis to Development seems to be higher than from
Development to test. This indicates that the test phase is a bottleneck. Bottleneck is the activity that lies below
the widening band.
To quantify the bottleneck we propose linear regression to measure the rate of requirements flow for each
phase. In our scenarios the dependent variables are month and cumulative number of "To Do Tasks". The
linear function represents the best fit to the observed data set. To determine the linear function the least
square method is commonly used. Furthermore, when the linear regression model is created, it can be
observed that there is a difference between the actual observations and the regression line, referred to as the
estimation error.
This leads to the following formula: 𝑦 = 𝑓(𝑥) = 𝛽0 + 𝛽1 ∗ 𝑥 + 𝑒 (2) When conducting the actual prediction of the parameters, β0 and β1 are estimated as those represent the
linear regression function. For the analysis of the bottlenecks the predicted variable β1 is important,
representing the slope of the linear functions. The measure for the bottleneck is thus defined as follows: If the
slope of phase n (slope is referred to as βn ) is higher than the slope of the subsequent phases (βn+p) then
phase n is a bottleneck in the process. Though, it is important to note that the cause of the bottleneck is not
necessarily to be found in phase n. To show the results of the measurement to management we propose to
draw bar-plots of the slope which are well suited to illustrate the severity of the difference between phases.
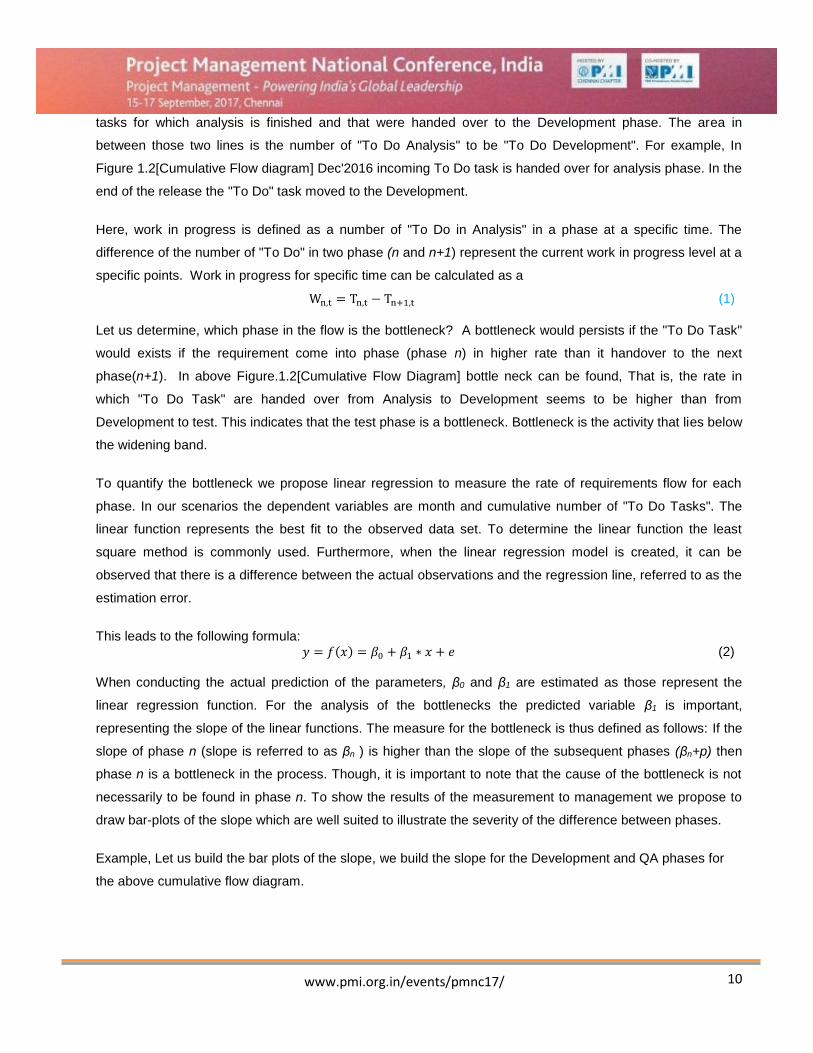
Example, Let us build the bar plots of the slope, we build the slope for the Development and QA phases for
the above cumulative flow diagram.
11
www.pmi.org.in/events/pmnc17/
Figure no. 1.3 [Bar Plots with Regression slope] It will quantify the statement, If the slope of phase n (slope is referred to as βn ) is higher than the slope of the
subsequent phases (βn+p) then phase n is a bottleneck in the process. Development phase slop is higher
than the Test phase so Test phase is bottle neck.
Conclusion :
Agile Project Management methodology is the best fits for knowledge work projects in every industry. In
order to increase the success of the agile projects, we have to define and measure the adequate metrics
periodically. Agile metrics provide the early alarm for any risk and any things which move the project to off
tracks. Moreover, For enterprise scale agile projects, it is essential to do the forecast for key metrics which
helps to minimize the project risk and increase the project success. In order to make the adequate forecast
you have to drive the projects with data and past experience and journey. The presented case study is used
to measure the “Cumulative Flow diagram” which the key leading Matrices for any kind of agile projects. Our
12
www.pmi.org.in/events/pmnc17/
attempts to develop a regression model to quantity the bottlenecks in the development flow. It eventually
removes the waste and continuously improves the throughput.
References [1] Mike Griffiths, PMI – ACP , PMP, PMI – ACP Exam Prep, www.rmcl.com
[2] Ken Schwaber, Agile Project Management with Scru.
[3] Charles Jensen, Data Analytics: Beginners Guide for Business and Science.
[4] Saket Bansal, iZenBridge Consultancy: https://www.izenbridge.com/videogallery/pmi-acp-lesson-1-what-
is-agile-part-1-izenbridge/
[5] K. Petersen , C. Wohlin, Measuring the Flow in Lean Software Development, “Blekinge Institute of
Technology” , Sweden.
Recommended