Thrust-fault growth and segment linkage in the active Ostler fault zone,
New Zealand
Kenneth Davisa, Douglas W. Burbanka,*, Donald Fisherb, Shamus Wallacec,1, David Nobesc
aDepartment of Geological Sciences, University of California at Santa Barbara, Santa Barbara, CA 93106, USAbDepartment of Geosciences, Pennsylvania State University, University Park, PA 16802, USA
cDepartment of Geological Sciences, University of Canterbury, Private Bag 4800, Christchurch, New Zealand
Received 23 September 2003; received in revised form 19 April 2005; accepted 19 April 2005
Available online 6 July 2005
Abstract
Thrust faulting is a fundamental mode of crustal deformation, yet many of the key geometrical attributes of thrust faults and the controls on
fault rupture, growth, and linkage remain poorly resolved. Numerous surface-rupturing thrust faults cut through upper Quaternary glacial
outwash terraces within the Ostler Fault zone, an active thrust system in the Southern Alps, New Zealand. We use these deformed marker
surfaces to define the three-dimensional deformation field associated with their surface expression and to map displacement and length on
w40 fault segments. Displacement transfer across two fault segment arrays occurs in distinctly different styles. In one, displacement is
transferred between en echelon fault segments to produce a smooth, linear displacement gradient. In the other, large-scale folding and a
population of small faults transfer displacement between two non-overlapping fault segments, with a residual displacement minimum within
the transfer zone. Size distribution of fault-segment length and maximum displacement follow a power-law scaling relationship. Maximum
displacement (Dmax) scales linearly with and representsw1% of segment trace length (L). Dmax/L data from the segments of the Ostler Fault
zone display similar scaling to a global fault dataset. This similarity is surprising, given that the observed displacements along the Ostler
Fault represent only 20 ky of slip on fault segments that are likely to be many times older.
q 2005 Published by Elsevier Ltd.
Keywords: Distributed strain; Fault populations; Fault scaling; Displacement–length scaling; Ostler Fault; MacKenzie Basin
1. Introduction
The development of fault zones is a fundamental process
in tectonics, with implications ranging from interpretation
of seismic data to estimating brittle strain (Scholz, 1990).
Nevertheless, the ways in which faults rupture, grow, and
link remain poorly resolved. Extensive datasets from normal
fault systems (Dawers and Anders, 1995; Manighetti et al.,
2001; Walsh et al., 2003) have been used to examine fault
populations with a large range in scale and relatively
uniform tectonic and lithologic boundary conditions,
thereby providing reliable tests of fault-growth models and
fault-scaling laws for normal faults. Some of the more
0191-8141/$ - see front matter q 2005 Published by Elsevier Ltd.
doi:10.1016/j.jsg.2005.04.011
* Corresponding author. Tel.: C1 805 893 7858; fax: C1 805 893 8649.
E-mail address: [email protected] (D.W. Burbank).1 Present address: Tonkin and Taylor, PO Box 1009, Nelson, New
Zealand.
detailed studies consider systems of faults that are very well
exposed, but are only a few meters in length (Soliva and
Benedicto, 2004). At the scale of small outcrops, fully three-
dimensional exposures can permit reliable documentation
of distributed displacement within isolated, linked, and
breached faults and ramps. Few temporal data are com-
monly available with such studies, and the reliability of
extrapolating from metric scales to the larger spatial arrays
of faults is usually unknown.
Few studies, moreover, investigate the detailed character
of thrust-fault populations or their along-strike fault-
displacement patterns. Most studies utilize cross-sections
through ancient thrust faults, and their ability to resolve
along-strike variations in displacement is limited as hanging
wall cutoffs are commonly eroded and only exposed near
the fault terminations (e.g. Elliott, 1976). Due to scarce data,
key questions about thrust-fault growth and scaling remain
unresolved. (1) How does displacement vary along the strike
of a thrust fault? (2) How is displacement distributed and
transferred among multiple segments (Fig. 1) within a fault
Journal of Structural Geology 27 (2005) 1528–1546
www.elsevier.com/locate/jsg
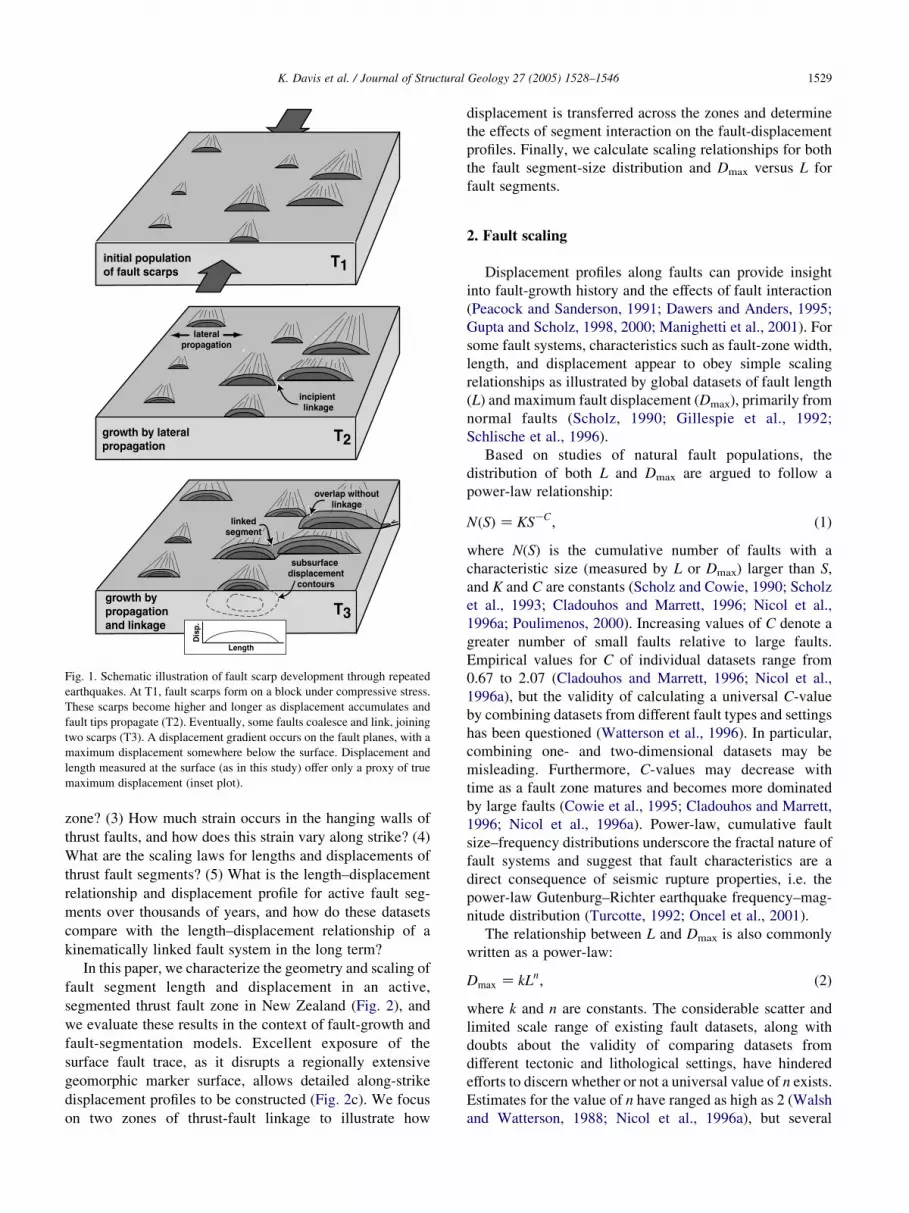
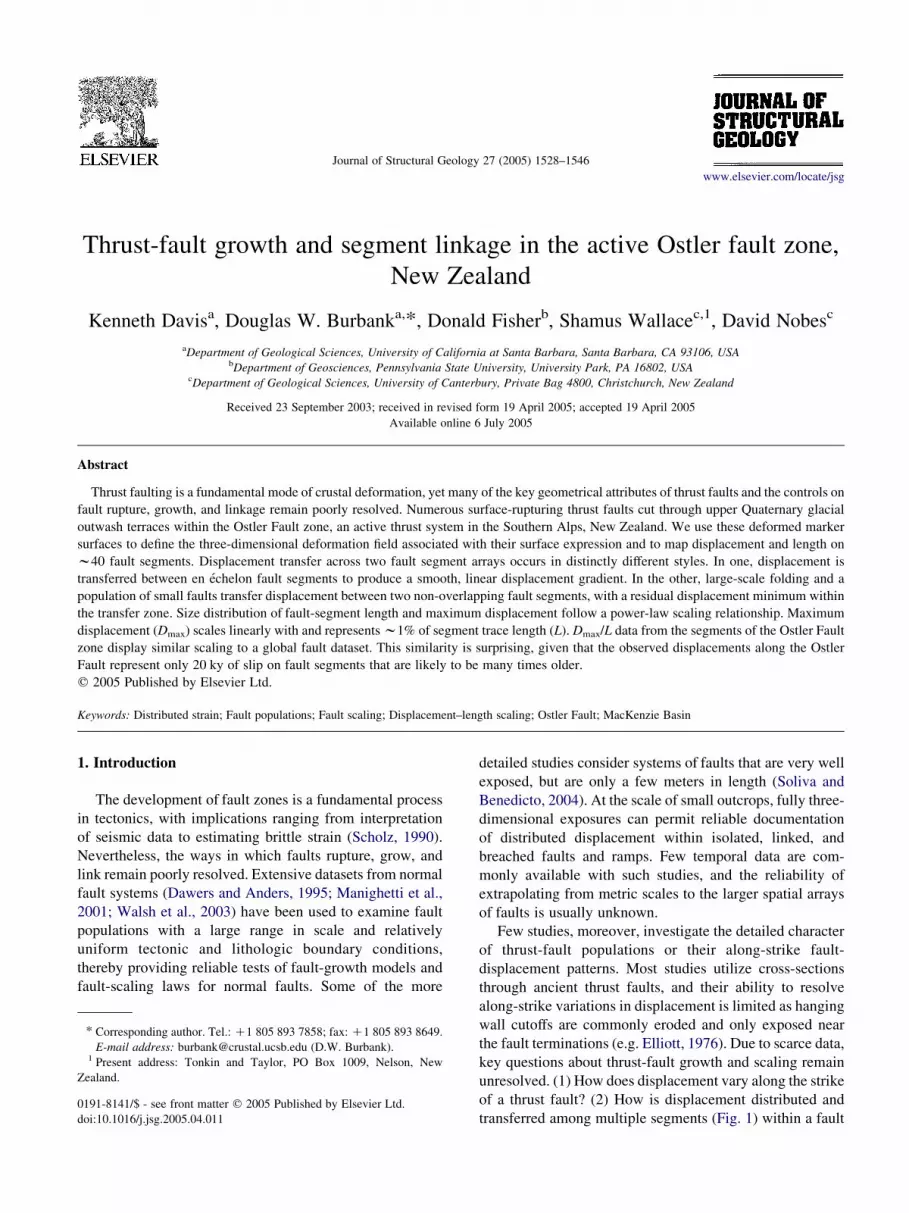
Fig. 1. Schematic illustration of fault scarp development through repeated
earthquakes. At T1, fault scarps form on a block under compressive stress.
These scarps become higher and longer as displacement accumulates and
fault tips propagate (T2). Eventually, some faults coalesce and link, joining
two scarps (T3). A displacement gradient occurs on the fault planes, with a
maximum displacement somewhere below the surface. Displacement and
length measured at the surface (as in this study) offer only a proxy of true
maximum displacement (inset plot).
K. Davis et al. / Journal of Structural Geology 27 (2005) 1528–1546 1529
zone? (3) How much strain occurs in the hanging walls of
thrust faults, and how does this strain vary along strike? (4)
What are the scaling laws for lengths and displacements of
thrust fault segments? (5) What is the length–displacement
relationship and displacement profile for active fault seg-
ments over thousands of years, and how do these datasets
compare with the length–displacement relationship of a
kinematically linked fault system in the long term?
In this paper, we characterize the geometry and scaling of
fault segment length and displacement in an active,
segmented thrust fault zone in New Zealand (Fig. 2), and
we evaluate these results in the context of fault-growth and
fault-segmentation models. Excellent exposure of the
surface fault trace, as it disrupts a regionally extensive
geomorphic marker surface, allows detailed along-strike
displacement profiles to be constructed (Fig. 2c). We focus
on two zones of thrust-fault linkage to illustrate how
displacement is transferred across the zones and determine
the effects of segment interaction on the fault-displacement
profiles. Finally, we calculate scaling relationships for both
the fault segment-size distribution and Dmax versus L for
fault segments.
2. Fault scaling
Displacement profiles along faults can provide insight
into fault-growth history and the effects of fault interaction
(Peacock and Sanderson, 1991; Dawers and Anders, 1995;
Gupta and Scholz, 1998, 2000; Manighetti et al., 2001). For
some fault systems, characteristics such as fault-zone width,
length, and displacement appear to obey simple scaling
relationships as illustrated by global datasets of fault length
(L) and maximum fault displacement (Dmax), primarily from
normal faults (Scholz, 1990; Gillespie et al., 1992;
Schlische et al., 1996).
Based on studies of natural fault populations, the
distribution of both L and Dmax are argued to follow a
power-law relationship:
NðSÞZKSKC; (1)
where N(S) is the cumulative number of faults with a
characteristic size (measured by L or Dmax) larger than S,
and K and C are constants (Scholz and Cowie, 1990; Scholz
et al., 1993; Cladouhos and Marrett, 1996; Nicol et al.,
1996a; Poulimenos, 2000). Increasing values of C denote a
greater number of small faults relative to large faults.
Empirical values for C of individual datasets range from
0.67 to 2.07 (Cladouhos and Marrett, 1996; Nicol et al.,
1996a), but the validity of calculating a universal C-value
by combining datasets from different fault types and settings
has been questioned (Watterson et al., 1996). In particular,
combining one- and two-dimensional datasets may be
misleading. Furthermore, C-values may decrease with
time as a fault zone matures and becomes more dominated
by large faults (Cowie et al., 1995; Cladouhos and Marrett,
1996; Nicol et al., 1996a). Power-law, cumulative fault
size–frequency distributions underscore the fractal nature of
fault systems and suggest that fault characteristics are a
direct consequence of seismic rupture properties, i.e. the
power-law Gutenburg–Richter earthquake frequency–mag-
nitude distribution (Turcotte, 1992; Oncel et al., 2001).
The relationship between L and Dmax is also commonly
written as a power-law:
Dmax Z kLn; (2)
where k and n are constants. The considerable scatter and
limited scale range of existing fault datasets, along with
doubts about the validity of comparing datasets from
different tectonic and lithological settings, have hindered
efforts to discern whether or not a universal value of n exists.
Estimates for the value of n have ranged as high as 2 (Walsh
and Watterson, 1988; Nicol et al., 1996a), but several
Fig. 2. The Ostler Fault zone (OFZ). (a) Map showing the primary surface trace of the OFZ and approximate extent of Torlesse meta-sedimentary basement and
Tertiary uplifts in the MacKenzie Basin. Unshaded area is primarily Quaternary till and glacial outwash deposits. Inset shows location of the OFZ on the
eastern side of the Southern Alps. (b) Shaded relief image from 10-m TOPSARDEM of the east-vergent OFZ. Locations of the Benmore and Gladstone arrays,
which were studied in detail, are boxed. LR: Lake Ruataniwha; LO: Lake Ohau; MO: Mt Ostler; WB: Willowbank Saddle. (c) Oblique aerial photograph of
three fault scarps between Lake Ruataniwha and Mt Ostler displacing glacial outwash surfaces. Note the succession of terraces on the outwash surface (T3a–
T3d) formed by downcutting of the Ohau River. The largest of the scarps, in the foreground, has a vertical offset of w15 m.
K. Davis et al. / Journal of Structural Geology 27 (2005) 1528–15461530
theoretical and empirical studies suggest that the scaling is
approximately linear (nZ1) (Cowie and Scholz, 1992b;
Dawers et al., 1993; Scholz et al., 1993; Clark and Cox,
1996; Schlische et al., 1996; Manighetti et al., 2001).
Although controversy exists concerning whether scaling for
larger faults (O100 m) is non-linear (Nicol et al., 1996a),
this relationship has led to fault growth models (Fig. 1)
where faults begin as isolated cracks and grow self-similarly
until they interact with neighbors in zones of overlap at
which point lateral growth is retarded until linkage removes
the slip deficit (Gupta and Scholz, 2000). An alternative
growth model involves early establishment of fault lengths
with subsequent increases in maximum displacements that
shift the fault population in the long term away from the
K. Davis et al. / Journal of Structural Geology 27 (2005) 1528–1546 1531
trend defined by the slip distribution of earthquakes (Walsh
et al., 2002).
Theoretical models of dislocations in elastic–plastic
solids predict a quasi-elliptical (Pollard and Segall, 1987)
or bell-shaped (Cowie and Scholz, 1992a) along-strike
displacement profile with zero displacement at the crack tips
and maximum displacement near the center of the crack.
Although theoretical models successfully predict some
basic displacement profile characteristics, data from real
faults show significant variability in profile shape and
location of maximum displacement (Dawers and Anders,
1995; Manighetti et al., 2001). Mechanical interaction and
linkage among fault segments have a first-order effect on the
accumulation of fault displacement and may account for a
large portion of this observed variability in displacement
profile shape (Cartwright et al., 1995; Gupta and Scholz,
2000). Spatial arrays of fault-displacement profiles can
serve to delineate the mechanism of fault-segment inter-
action and linkage in natural fault systems (Fig. 1), where
mechanical interaction of segments can produce smooth
gradients of total displacement along a fault zone (Childs
et al., 1995; Dawers and Anders, 1995; Crider and Pollard,
1998; Manighetti et al., 2001; Soliva and Benedicto, 2004).
Because most previous fault-scaling studies have focused
on normal fault populations, the behavior of thrust fault
systems remains poorly explored. In this study, we exploit a
particularlywell-exposed thrust-fault system todevelop statis-
tics on fault length, displacement, and displacement transfer.
3. Study area
The Ostler fault zone (OFZ) is located in the inter-
montane Mackenzie Basin on the east flank of the Southern
Alps, New Zealand (Fig. 2). Of the w40 mm/yr of oblique
convergence between the Pacific and Australian plates, most
deformation is accommodated by the Alpine Fault, west of
the Southern Alps (Walcott, 1998; Tippett and Hovius,
2000; Norris and Cooper, 2001). Approximately one-third
of the predicted relative plate motion occurring on the South
Island is partitioned into structures east of the Southern Alps
(Tippett and Hovius, 2000), such as the OFZ.
Bedrock in the vicinity of the Mackenzie Basin is
predominately Torlesse greywacke, which crops out at the
surface in the Ben Ohau Range west of the OFZ. In the
basin, up to 1 km of Cenozoic sediment lies above bedrock
(Read, 1984; Long et al., 2000). These sediments include
semi-indurated Neogene sand and gravel and poorly
indurated Pleistocene glacial outwash. Depth and character
of sediments in the basin are highly variable and represent a
poorly known control on the fault mechanics of the OFZ.
The geomorphic surface of the Mackenzie Basin is
dominated by glacial outwash plains and fluvial terraces
from at least three Pleistocene glaciations (Read, 1984;
Blick et al., 1989). All the fluvial terraces utilized in this
study originated as straths beveled across either Tertiary
strata or older Quaternary fill. Coarse gravels, ranging in
thickness from a few meters to several tens of meters,
subsequently covered the straths. These regionally exten-
sive surfaces are blanketed in shortgrass, mostly undis-
sected, and intricately textured with outwash channels
(Fig. 2c). In short, they provide a pristine marker of
deformation on the OFZ. Since these surfaces were created
during the last glaciation, downcutting has occurred on
major streams such as the Ohau River and produced flights
of terraces that have been subsequently deformed by the
OFZ (Fig. 2c). In addition to the last-glacial surfaces, older
uplifts are present on the hanging wall of the OFZ. These
uplifts are more dissected than the last-glacial outwash
surfaces, but in some cases, original planar terrace surfaces
are preserved on them. Loess is present in variable amounts
on both the last-glacial surfaces and older uplifts, and is
typically 0–0.5 m thick.
The dataset used in this study was collected from a series
of NNE-trending fault scarps that displace these outwash
surfaces. Scarps range in height from less than a meter to
w100 m, although the largest scarps are not well exposed
where they cut older glacial surfaces and are not included in
the dataset. The scarps are mostly west-side-up and are
interpreted to have formed by surface rupture and fault-
related folding on east-vergent thrust faults (Fig. 2).
Because few cross-sections of faults are exposed in the
field area, fault dip measurements were collected where
scarps could be aligned across multiple river terraces. These
offsets define an average fault dip near the surface of 50G98
(nZ4), which is consistent with dips measured from
migrated ground-penetrating radar profiles (Nobes et al.,
2003). Numerous outwash channels that cross the fault trace
exhibit no lateral offset and indicate that strike-slip motion
is negligible. Fault segments of the OFZ display varying
states of interaction with linked, overlapping, or spatially
isolated fault traces (Soliva and Benedicto, 2004).
Off-fault deformation is also observed in the OFZ.
Warped geomorphic surfaces reveal fault-related folding in
the hanging wall of some fault segments, especially those
farther from the mountain front where basin sediments are
presumably thicker. Typical folds are gentle (interlimb
angle w170–1758), upright to slightly east-vergent, and
have wavelengths of w100–500 m. On a larger scale,
geomorphic surfaces in the hanging wall are backtilted over
w1–5 km west of the fault trace, suggesting rotation on a
listric fault that steepens to the east.
All the preserved geomorphic surfaces are younger
than the initiation of faulting on the OFZ. Therefore, on a
given geomorphic surface, a fault scarp only records the
displacement that accumulated after formation of the
surface. The measured fault trace length, however, likely
represents the total length since the segment originated.
Evidence for Holocene deformation on the Ostler Fault is
abundant, and trenching studies indicate that paleoseismic
events occurred w3000 and w6000 years before present
(Van Dissen et al., 1993). Although little evidence exists to
K. Davis et al. / Journal of Structural Geology 27 (2005) 1528–15461532
determine whether the entire OFZ ruptured in each of the
past earthquakes, we consider the entire system to be
kinematically linked. Many of the individual fault traces at
the surface probably merge downward into a single slip
surface. Consequently, what may appear to be an isolated
fault trace at the surface might more properly be considered
a fault segment.
Based on estimates of surface ages from Read (1984), we
calculate average displacement rates for two areas based on
the maximum fault displacement observed at the surface.
The O120 ka Willowbank Saddle surface (Fig. 2) is offset
w100 m from the basin floor, yielding a maximum vertical
displacement rate of 0.8 mm/yr, whereas the O22 ka
Benmore surface is offset 15 m, with a maximum vertical
displacement rate of 0.7 mm/yr. These rates are slightly
lower, but similar to geodetic observations of a w1 mm/yr
rock-uplift rate of the hanging wall from fold growth or fault
creep on some segments of the fault (Blick et al., 1989).
Of the ca. 38 mm/yr relative plate motion in the South
Island (DeMets et al., 1994), only w27 mm/yr is accom-
modated on or near the Alpine Fault, with the remaining
w11 mm/yr distributed in the Pacific Plate along a wide
zone east of the Alpine Fault (Norris and Cooper, 2001).
Therefore, if geologic shortening rates across the OFZ
calculated from terrace surface offsets are about 0.7–1 mm/
yr (assuming fault dip of w508), the OFZ may accommo-
date up to w5–10% of the intra-Pacific Plate deformation.
4. Methods
Forty fault scarps were surveyed using a Trimble 4700
differential GPS with centimeter-scale vertical and hori-
zontal precision. Simultaneous tandem surveys along the
top and base of each scarp provided horizontal and vertical
coordinates every 1–3 m that were, in turn, used to generate
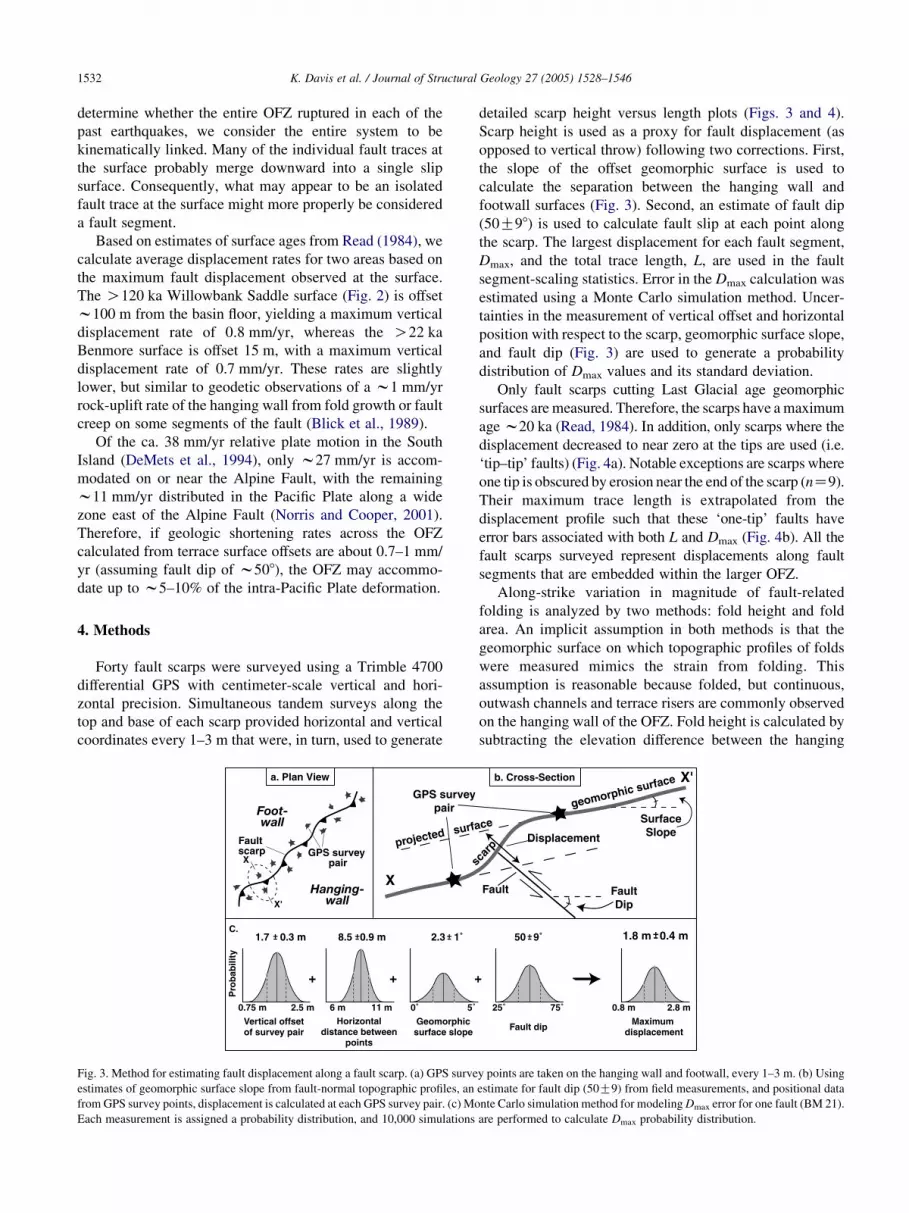
Fig. 3. Method for estimating fault displacement along a fault scarp. (a) GPS surve
estimates of geomorphic surface slope from fault-normal topographic profiles, an
from GPS survey points, displacement is calculated at each GPS survey pair. (c) Mo
Each measurement is assigned a probability distribution, and 10,000 simulations
detailed scarp height versus length plots (Figs. 3 and 4).
Scarp height is used as a proxy for fault displacement (as
opposed to vertical throw) following two corrections. First,
the slope of the offset geomorphic surface is used to
calculate the separation between the hanging wall and
footwall surfaces (Fig. 3). Second, an estimate of fault dip
(50G98) is used to calculate fault slip at each point along
the scarp. The largest displacement for each fault segment,
Dmax, and the total trace length, L, are used in the fault
segment-scaling statistics. Error in the Dmax calculation was
estimated using a Monte Carlo simulation method. Uncer-
tainties in the measurement of vertical offset and horizontal
position with respect to the scarp, geomorphic surface slope,
and fault dip (Fig. 3) are used to generate a probability
distribution of Dmax values and its standard deviation.
Only fault scarps cutting Last Glacial age geomorphic
surfaces aremeasured. Therefore, the scarps have amaximum
agew20 ka (Read, 1984). In addition, only scarps where the
displacement decreased to near zero at the tips are used (i.e.
‘tip–tip’ faults) (Fig. 4a). Notable exceptions are scarps where
one tip is obscured by erosion near the end of the scarp (nZ9).
Their maximum trace length is extrapolated from the
displacement profile such that these ‘one-tip’ faults have
error bars associated with both L and Dmax (Fig. 4b). All the
fault scarps surveyed represent displacements along fault
segments that are embedded within the larger OFZ.
Along-strike variation in magnitude of fault-related
folding is analyzed by two methods: fold height and fold
area. An implicit assumption in both methods is that the
geomorphic surface on which topographic profiles of folds
were measured mimics the strain from folding. This
assumption is reasonable because folded, but continuous,
outwash channels and terrace risers are commonly observed
on the hanging wall of the OFZ. Fold height is calculated by
subtracting the elevation difference between the hanging
y points are taken on the hanging wall and footwall, every 1–3 m. (b) Using
estimate for fault dip (50G9) from field measurements, and positional data
nte Carlo simulation method for modeling Dmax error for one fault (BM 21).
are performed to calculate Dmax probability distribution.
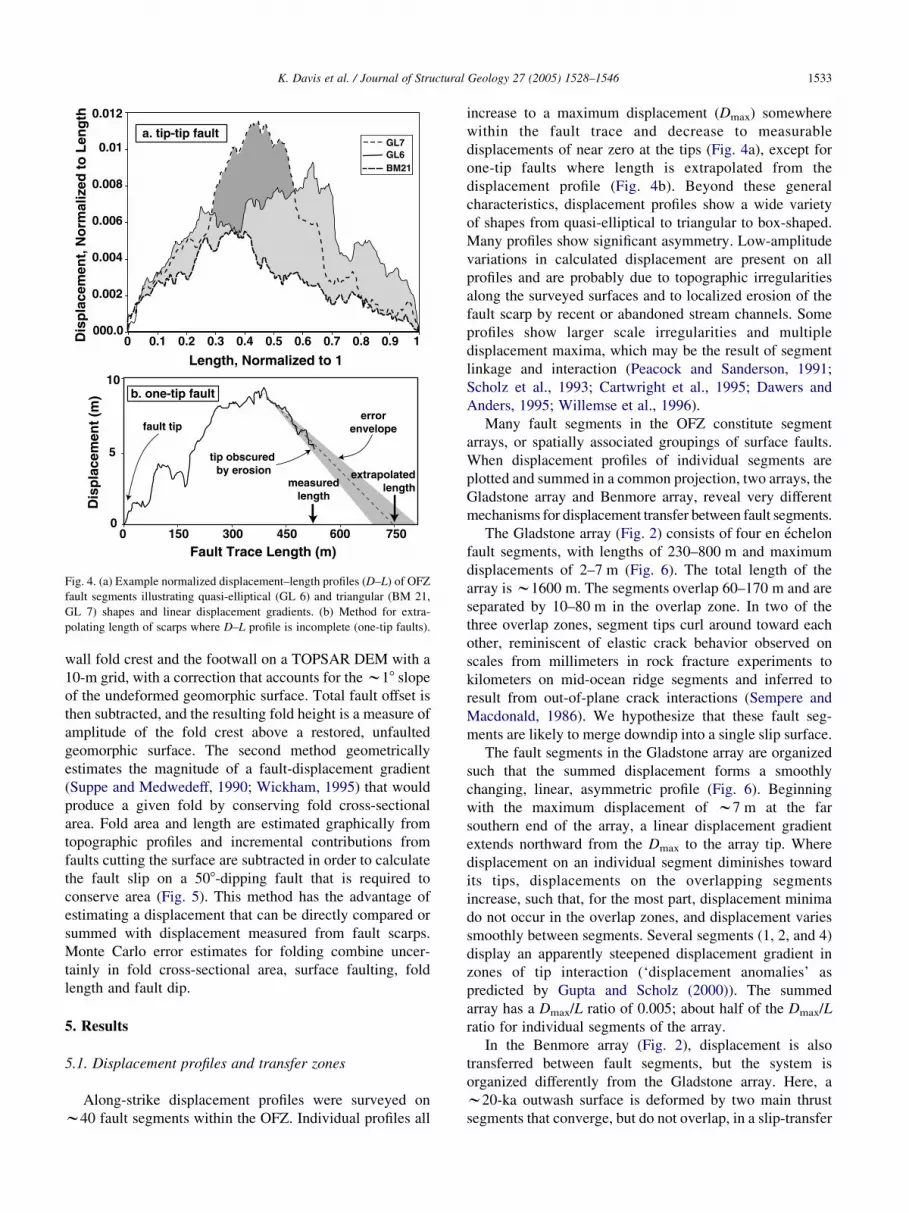
Fig. 4. (a) Example normalized displacement–length profiles (D–L) of OFZ
fault segments illustrating quasi-elliptical (GL 6) and triangular (BM 21,
GL 7) shapes and linear displacement gradients. (b) Method for extra-
polating length of scarps where D–L profile is incomplete (one-tip faults).
K. Davis et al. / Journal of Structural Geology 27 (2005) 1528–1546 1533
wall fold crest and the footwall on a TOPSAR DEM with a
10-m grid, with a correction that accounts for thew18 slope
of the undeformed geomorphic surface. Total fault offset is
then subtracted, and the resulting fold height is a measure of
amplitude of the fold crest above a restored, unfaulted
geomorphic surface. The second method geometrically
estimates the magnitude of a fault-displacement gradient
(Suppe and Medwedeff, 1990; Wickham, 1995) that would
produce a given fold by conserving fold cross-sectional
area. Fold area and length are estimated graphically from
topographic profiles and incremental contributions from
faults cutting the surface are subtracted in order to calculate
the fault slip on a 508-dipping fault that is required to
conserve area (Fig. 5). This method has the advantage of
estimating a displacement that can be directly compared or
summed with displacement measured from fault scarps.
Monte Carlo error estimates for folding combine uncer-
tainly in fold cross-sectional area, surface faulting, fold
length and fault dip.
5. Results
5.1. Displacement profiles and transfer zones
Along-strike displacement profiles were surveyed on
w40 fault segments within the OFZ. Individual profiles all
increase to a maximum displacement (Dmax) somewhere
within the fault trace and decrease to measurable
displacements of near zero at the tips (Fig. 4a), except for
one-tip faults where length is extrapolated from the
displacement profile (Fig. 4b). Beyond these general
characteristics, displacement profiles show a wide variety
of shapes from quasi-elliptical to triangular to box-shaped.
Many profiles show significant asymmetry. Low-amplitude
variations in calculated displacement are present on all
profiles and are probably due to topographic irregularities
along the surveyed surfaces and to localized erosion of the
fault scarp by recent or abandoned stream channels. Some
profiles show larger scale irregularities and multiple
displacement maxima, which may be the result of segment
linkage and interaction (Peacock and Sanderson, 1991;
Scholz et al., 1993; Cartwright et al., 1995; Dawers and
Anders, 1995; Willemse et al., 1996).
Many fault segments in the OFZ constitute segment
arrays, or spatially associated groupings of surface faults.
When displacement profiles of individual segments are
plotted and summed in a common projection, two arrays, the
Gladstone array and Benmore array, reveal very different
mechanisms for displacement transfer between fault segments.
The Gladstone array (Fig. 2) consists of four en echelon
fault segments, with lengths of 230–800 m and maximum
displacements of 2–7 m (Fig. 6). The total length of the
array isw1600 m. The segments overlap 60–170 m and are
separated by 10–80 m in the overlap zone. In two of the
three overlap zones, segment tips curl around toward each
other, reminiscent of elastic crack behavior observed on
scales from millimeters in rock fracture experiments to
kilometers on mid-ocean ridge segments and inferred to
result from out-of-plane crack interactions (Sempere and
Macdonald, 1986). We hypothesize that these fault seg-
ments are likely to merge downdip into a single slip surface.
The fault segments in the Gladstone array are organized
such that the summed displacement forms a smoothly
changing, linear, asymmetric profile (Fig. 6). Beginning
with the maximum displacement of w7 m at the far
southern end of the array, a linear displacement gradient
extends northward from the Dmax to the array tip. Where
displacement on an individual segment diminishes toward
its tips, displacements on the overlapping segments
increase, such that, for the most part, displacement minima
do not occur in the overlap zones, and displacement varies
smoothly between segments. Several segments (1, 2, and 4)
display an apparently steepened displacement gradient in
zones of tip interaction (‘displacement anomalies’ as
predicted by Gupta and Scholz (2000)). The summed
array has a Dmax/L ratio of 0.005; about half of the Dmax/L
ratio for individual segments of the array.
In the Benmore array (Fig. 2), displacement is also
transferred between fault segments, but the system is
organized differently from the Gladstone array. Here, a
w20-ka outwash surface is deformed by two main thrust
segments that converge, but do not overlap, in a slip-transfer
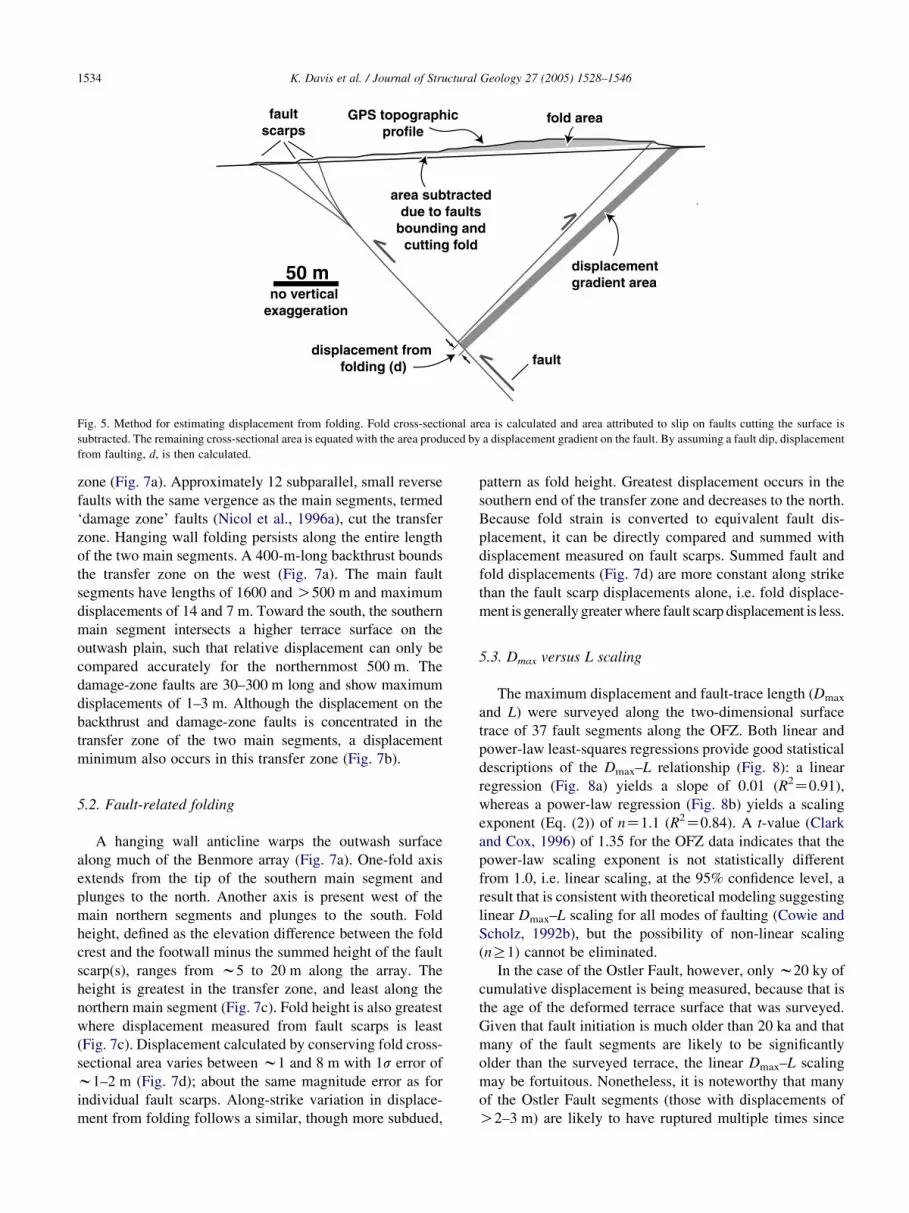
Fig. 5. Method for estimating displacement from folding. Fold cross-sectional area is calculated and area attributed to slip on faults cutting the surface is
subtracted. The remaining cross-sectional area is equated with the area produced by a displacement gradient on the fault. By assuming a fault dip, displacement
from faulting, d, is then calculated.
K. Davis et al. / Journal of Structural Geology 27 (2005) 1528–15461534
zone (Fig. 7a). Approximately 12 subparallel, small reverse
faults with the same vergence as the main segments, termed
‘damage zone’ faults (Nicol et al., 1996a), cut the transfer
zone. Hanging wall folding persists along the entire length
of the two main segments. A 400-m-long backthrust bounds
the transfer zone on the west (Fig. 7a). The main fault
segments have lengths of 1600 and O500 m and maximum
displacements of 14 and 7 m. Toward the south, the southern
main segment intersects a higher terrace surface on the
outwash plain, such that relative displacement can only be
compared accurately for the northernmost 500 m. The
damage-zone faults are 30–300 m long and show maximum
displacements of 1–3 m. Although the displacement on the
backthrust and damage-zone faults is concentrated in the
transfer zone of the two main segments, a displacement
minimum also occurs in this transfer zone (Fig. 7b).
5.2. Fault-related folding
A hanging wall anticline warps the outwash surface
along much of the Benmore array (Fig. 7a). One-fold axis
extends from the tip of the southern main segment and
plunges to the north. Another axis is present west of the
main northern segments and plunges to the south. Fold
height, defined as the elevation difference between the fold
crest and the footwall minus the summed height of the fault
scarp(s), ranges from w5 to 20 m along the array. The
height is greatest in the transfer zone, and least along the
northern main segment (Fig. 7c). Fold height is also greatest
where displacement measured from fault scarps is least
(Fig. 7c). Displacement calculated by conserving fold cross-
sectional area varies between w1 and 8 m with 1s error of
w1–2 m (Fig. 7d); about the same magnitude error as for
individual fault scarps. Along-strike variation in displace-
ment from folding follows a similar, though more subdued,
pattern as fold height. Greatest displacement occurs in the
southern end of the transfer zone and decreases to the north.
Because fold strain is converted to equivalent fault dis-
placement, it can be directly compared and summed with
displacement measured on fault scarps. Summed fault and
fold displacements (Fig. 7d) are more constant along strike
than the fault scarp displacements alone, i.e. fold displace-
ment is generally greaterwhere fault scarp displacement is less.
5.3. Dmax versus L scaling
The maximum displacement and fault-trace length (Dmax
and L) were surveyed along the two-dimensional surface
trace of 37 fault segments along the OFZ. Both linear and
power-law least-squares regressions provide good statistical
descriptions of the Dmax–L relationship (Fig. 8): a linear
regression (Fig. 8a) yields a slope of 0.01 (R2Z0.91),
whereas a power-law regression (Fig. 8b) yields a scaling
exponent (Eq. (2)) of nZ1.1 (R2Z0.84). A t-value (Clark
and Cox, 1996) of 1.35 for the OFZ data indicates that the
power-law scaling exponent is not statistically different
from 1.0, i.e. linear scaling, at the 95% confidence level, a
result that is consistent with theoretical modeling suggesting
linear Dmax–L scaling for all modes of faulting (Cowie and
Scholz, 1992b), but the possibility of non-linear scaling
(nR1) cannot be eliminated.
In the case of the Ostler Fault, however, only w20 ky of
cumulative displacement is being measured, because that is
the age of the deformed terrace surface that was surveyed.
Given that fault initiation is much older than 20 ka and that
many of the fault segments are likely to be significantly
older than the surveyed terrace, the linear Dmax–L scaling
may be fortuitous. Nonetheless, it is noteworthy that many
of the Ostler Fault segments (those with displacements of
O2–3 m) are likely to have ruptured multiple times since
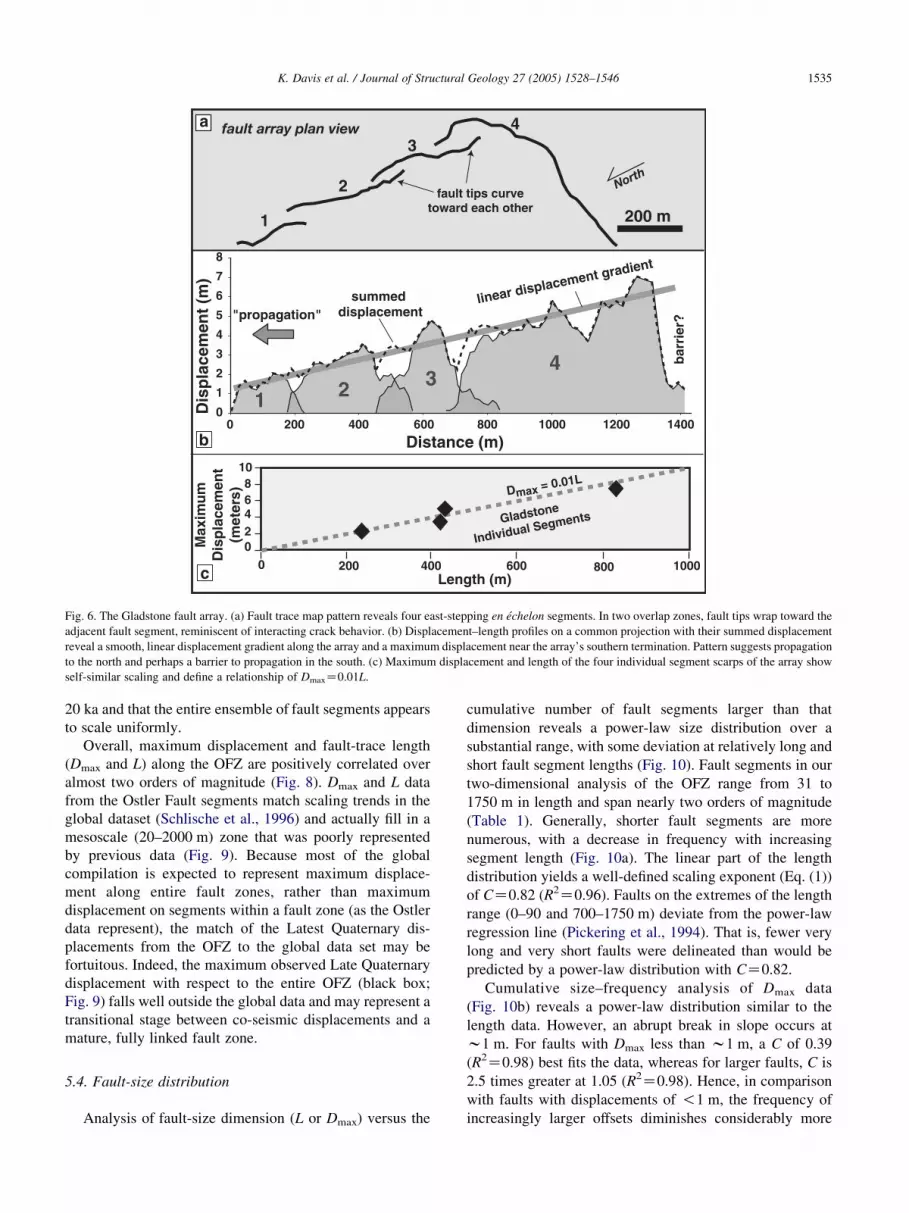
Fig. 6. The Gladstone fault array. (a) Fault trace map pattern reveals four east-stepping en echelon segments. In two overlap zones, fault tips wrap toward the
adjacent fault segment, reminiscent of interacting crack behavior. (b) Displacement–length profiles on a common projection with their summed displacement
reveal a smooth, linear displacement gradient along the array and a maximum displacement near the array’s southern termination. Pattern suggests propagation
to the north and perhaps a barrier to propagation in the south. (c) Maximum displacement and length of the four individual segment scarps of the array show
self-similar scaling and define a relationship of DmaxZ0.01L.
K. Davis et al. / Journal of Structural Geology 27 (2005) 1528–1546 1535
20 ka and that the entire ensemble of fault segments appears
to scale uniformly.
Overall, maximum displacement and fault-trace length
(Dmax and L) along the OFZ are positively correlated over
almost two orders of magnitude (Fig. 8). Dmax and L data
from the Ostler Fault segments match scaling trends in the
global dataset (Schlische et al., 1996) and actually fill in a
mesoscale (20–2000 m) zone that was poorly represented
by previous data (Fig. 9). Because most of the global
compilation is expected to represent maximum displace-
ment along entire fault zones, rather than maximum
displacement on segments within a fault zone (as the Ostler
data represent), the match of the Latest Quaternary dis-
placements from the OFZ to the global data set may be
fortuitous. Indeed, the maximum observed Late Quaternary
displacement with respect to the entire OFZ (black box;
Fig. 9) falls well outside the global data and may represent a
transitional stage between co-seismic displacements and a
mature, fully linked fault zone.
5.4. Fault-size distribution
Analysis of fault-size dimension (L or Dmax) versus the
cumulative number of fault segments larger than that
dimension reveals a power-law size distribution over a
substantial range, with some deviation at relatively long and
short fault segment lengths (Fig. 10). Fault segments in our
two-dimensional analysis of the OFZ range from 31 to
1750 m in length and span nearly two orders of magnitude
(Table 1). Generally, shorter fault segments are more
numerous, with a decrease in frequency with increasing
segment length (Fig. 10a). The linear part of the length
distribution yields a well-defined scaling exponent (Eq. (1))
of CZ0.82 (R2Z0.96). Faults on the extremes of the length
range (0–90 and 700–1750 m) deviate from the power-law
regression line (Pickering et al., 1994). That is, fewer very
long and very short faults were delineated than would be
predicted by a power-law distribution with CZ0.82.
Cumulative size–frequency analysis of Dmax data
(Fig. 10b) reveals a power-law distribution similar to the
length data. However, an abrupt break in slope occurs at
w1 m. For faults with Dmax less than w1 m, a C of 0.39
(R2Z0.98) best fits the data, whereas for larger faults, C is
2.5 times greater at 1.05 (R2Z0.98). Hence, in comparison
with faults with displacements of !1 m, the frequency of
increasingly larger offsets diminishes considerably more
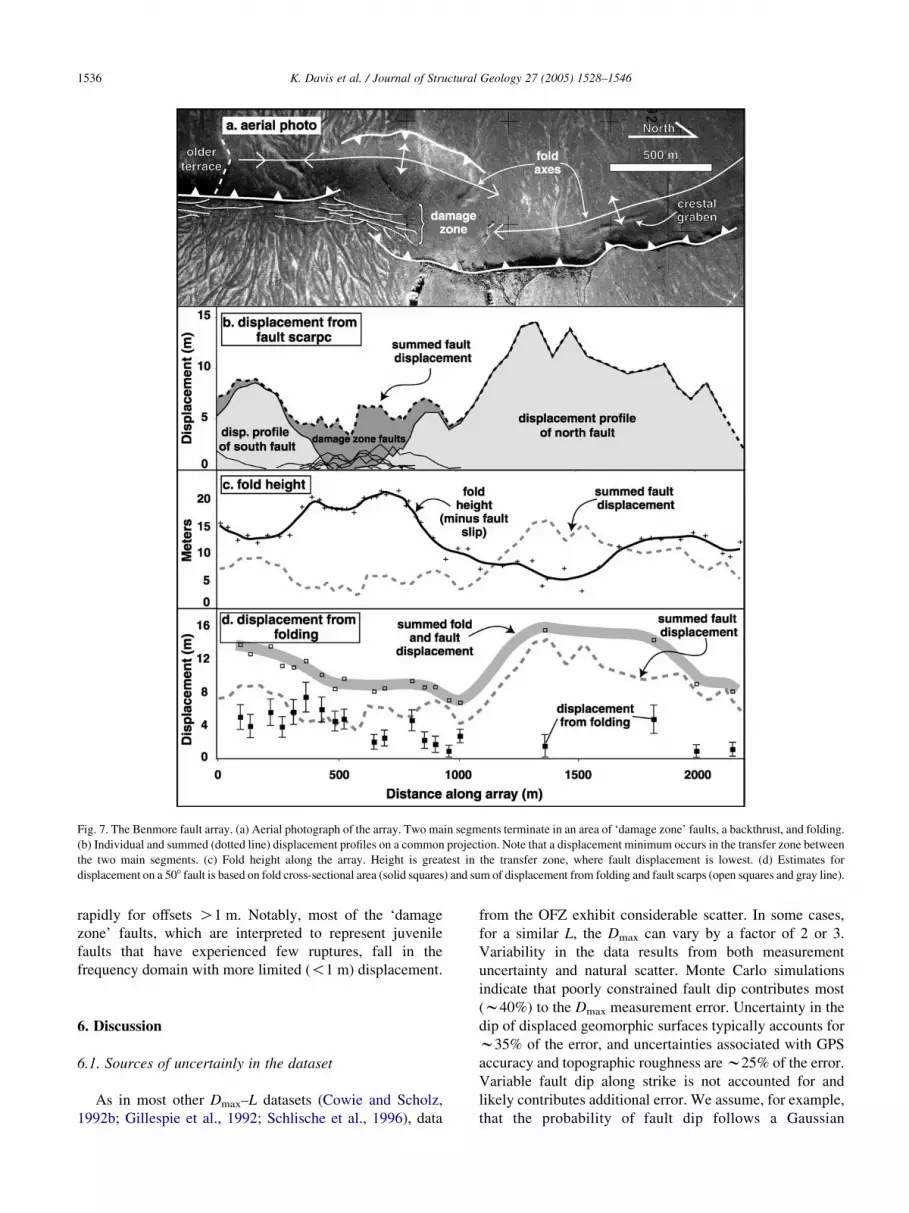
Fig. 7. The Benmore fault array. (a) Aerial photograph of the array. Two main segments terminate in an area of ‘damage zone’ faults, a backthrust, and folding.
(b) Individual and summed (dotted line) displacement profiles on a common projection. Note that a displacement minimum occurs in the transfer zone between
the two main segments. (c) Fold height along the array. Height is greatest in the transfer zone, where fault displacement is lowest. (d) Estimates for
displacement on a 508 fault is based on fold cross-sectional area (solid squares) and sum of displacement from folding and fault scarps (open squares and gray line).
K. Davis et al. / Journal of Structural Geology 27 (2005) 1528–15461536
rapidly for offsets O1 m. Notably, most of the ‘damage
zone’ faults, which are interpreted to represent juvenile
faults that have experienced few ruptures, fall in the
frequency domain with more limited (!1 m) displacement.
6. Discussion
6.1. Sources of uncertainly in the dataset
As in most other Dmax–L datasets (Cowie and Scholz,
1992b; Gillespie et al., 1992; Schlische et al., 1996), data
from the OFZ exhibit considerable scatter. In some cases,
for a similar L, the Dmax can vary by a factor of 2 or 3.
Variability in the data results from both measurement
uncertainty and natural scatter. Monte Carlo simulations
indicate that poorly constrained fault dip contributes most
(w40%) to the Dmax measurement error. Uncertainty in the
dip of displaced geomorphic surfaces typically accounts for
w35% of the error, and uncertainties associated with GPS
accuracy and topographic roughness arew25% of the error.
Variable fault dip along strike is not accounted for and
likely contributes additional error. We assume, for example,
that the probability of fault dip follows a Gaussian
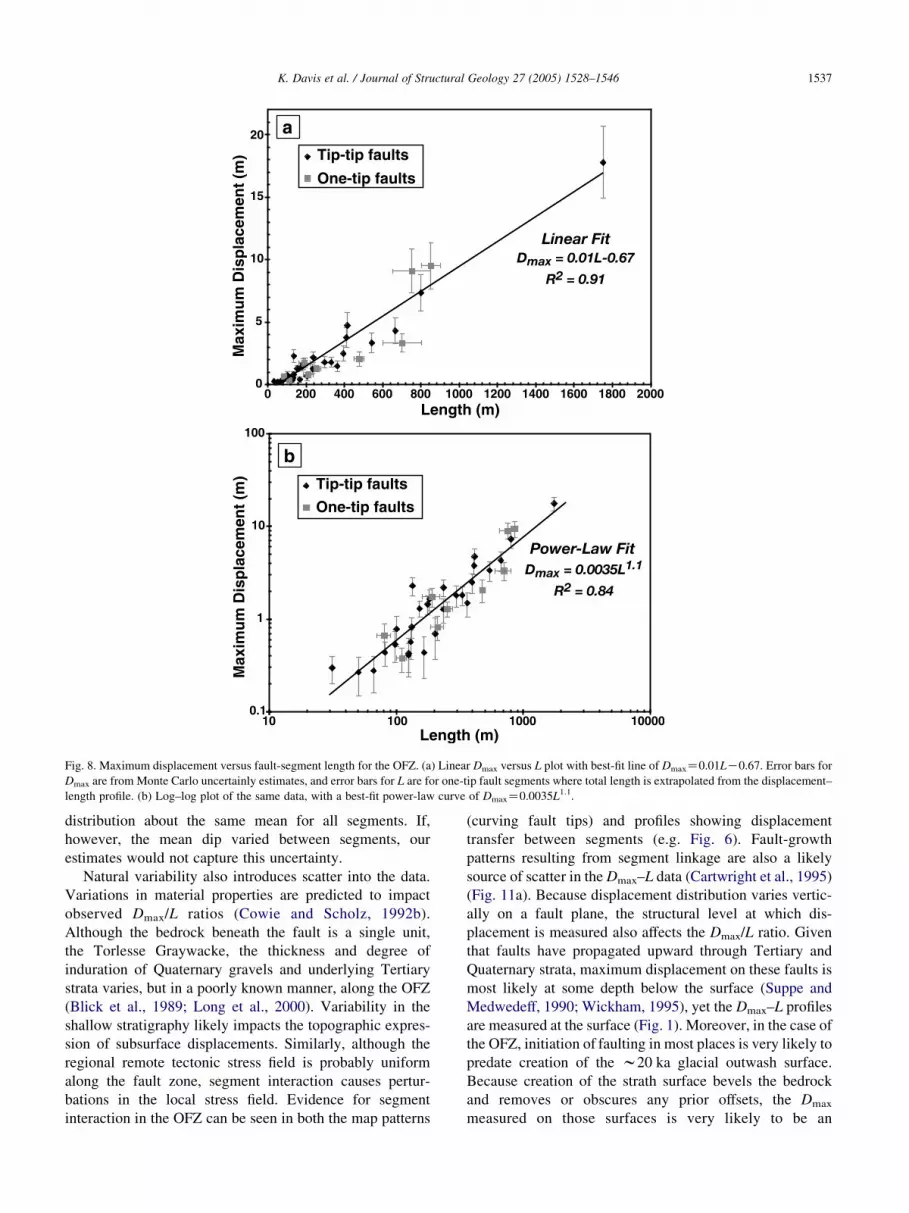
Fig. 8. Maximum displacement versus fault-segment length for the OFZ. (a) Linear Dmax versus L plot with best-fit line of DmaxZ0.01LK0.67. Error bars for
Dmax are from Monte Carlo uncertainly estimates, and error bars for L are for one-tip fault segments where total length is extrapolated from the displacement–
length profile. (b) Log–log plot of the same data, with a best-fit power-law curve of DmaxZ0.0035L1.1.
K. Davis et al. / Journal of Structural Geology 27 (2005) 1528–1546 1537
distribution about the same mean for all segments. If,
however, the mean dip varied between segments, our
estimates would not capture this uncertainty.
Natural variability also introduces scatter into the data.
Variations in material properties are predicted to impact
observed Dmax/L ratios (Cowie and Scholz, 1992b).
Although the bedrock beneath the fault is a single unit,
the Torlesse Graywacke, the thickness and degree of
induration of Quaternary gravels and underlying Tertiary
strata varies, but in a poorly known manner, along the OFZ
(Blick et al., 1989; Long et al., 2000). Variability in the
shallow stratigraphy likely impacts the topographic expres-
sion of subsurface displacements. Similarly, although the
regional remote tectonic stress field is probably uniform
along the fault zone, segment interaction causes pertur-
bations in the local stress field. Evidence for segment
interaction in the OFZ can be seen in both the map patterns
(curving fault tips) and profiles showing displacement
transfer between segments (e.g. Fig. 6). Fault-growth
patterns resulting from segment linkage are also a likely
source of scatter in the Dmax–L data (Cartwright et al., 1995)
(Fig. 11a). Because displacement distribution varies vertic-
ally on a fault plane, the structural level at which dis-
placement is measured also affects the Dmax/L ratio. Given
that faults have propagated upward through Tertiary and
Quaternary strata, maximum displacement on these faults is
most likely at some depth below the surface (Suppe and
Medwedeff, 1990; Wickham, 1995), yet the Dmax–L profiles
are measured at the surface (Fig. 1). Moreover, in the case of
the OFZ, initiation of faulting in most places is very likely to
predate creation of the w20 ka glacial outwash surface.
Because creation of the strath surface bevels the bedrock
and removes or obscures any prior offsets, the Dmax
measured on those surfaces is very likely to be an
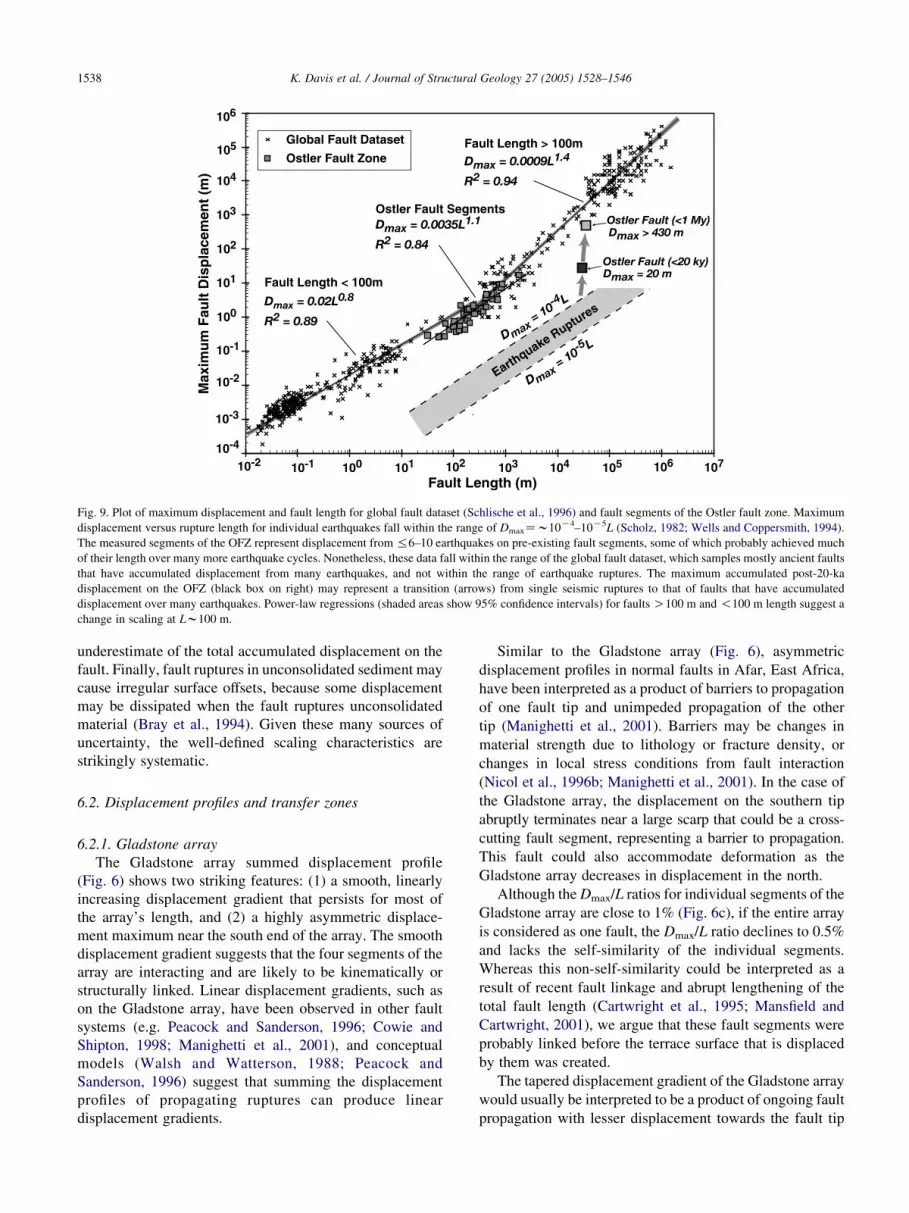
Fig. 9. Plot of maximum displacement and fault length for global fault dataset (Schlische et al., 1996) and fault segments of the Ostler fault zone. Maximum
displacement versus rupture length for individual earthquakes fall within the range of DmaxZw10K4–10K5L (Scholz, 1982; Wells and Coppersmith, 1994).
The measured segments of the OFZ represent displacement from%6–10 earthquakes on pre-existing fault segments, some of which probably achieved much
of their length over many more earthquake cycles. Nonetheless, these data fall within the range of the global fault dataset, which samples mostly ancient faults
that have accumulated displacement from many earthquakes, and not within the range of earthquake ruptures. The maximum accumulated post-20-ka
displacement on the OFZ (black box on right) may represent a transition (arrows) from single seismic ruptures to that of faults that have accumulated
displacement over many earthquakes. Power-law regressions (shaded areas show 95% confidence intervals) for faults O100 m and !100 m length suggest a
change in scaling at Lw100 m.
K. Davis et al. / Journal of Structural Geology 27 (2005) 1528–15461538
underestimate of the total accumulated displacement on the
fault. Finally, fault ruptures in unconsolidated sediment may
cause irregular surface offsets, because some displacement
may be dissipated when the fault ruptures unconsolidated
material (Bray et al., 1994). Given these many sources of
uncertainty, the well-defined scaling characteristics are
strikingly systematic.
6.2. Displacement profiles and transfer zones
6.2.1. Gladstone array
The Gladstone array summed displacement profile
(Fig. 6) shows two striking features: (1) a smooth, linearly
increasing displacement gradient that persists for most of
the array’s length, and (2) a highly asymmetric displace-
ment maximum near the south end of the array. The smooth
displacement gradient suggests that the four segments of the
array are interacting and are likely to be kinematically or
structurally linked. Linear displacement gradients, such as
on the Gladstone array, have been observed in other fault
systems (e.g. Peacock and Sanderson, 1996; Cowie and
Shipton, 1998; Manighetti et al., 2001), and conceptual
models (Walsh and Watterson, 1988; Peacock and
Sanderson, 1996) suggest that summing the displacement
profiles of propagating ruptures can produce linear
displacement gradients.
Similar to the Gladstone array (Fig. 6), asymmetric
displacement profiles in normal faults in Afar, East Africa,
have been interpreted as a product of barriers to propagation
of one fault tip and unimpeded propagation of the other
tip (Manighetti et al., 2001). Barriers may be changes in
material strength due to lithology or fracture density, or
changes in local stress conditions from fault interaction
(Nicol et al., 1996b; Manighetti et al., 2001). In the case of
the Gladstone array, the displacement on the southern tip
abruptly terminates near a large scarp that could be a cross-
cutting fault segment, representing a barrier to propagation.
This fault could also accommodate deformation as the
Gladstone array decreases in displacement in the north.
Although the Dmax/L ratios for individual segments of the
Gladstone array are close to 1% (Fig. 6c), if the entire array
is considered as one fault, the Dmax/L ratio declines to 0.5%
and lacks the self-similarity of the individual segments.
Whereas this non-self-similarity could be interpreted as a
result of recent fault linkage and abrupt lengthening of the
total fault length (Cartwright et al., 1995; Mansfield and
Cartwright, 2001), we argue that these fault segments were
probably linked before the terrace surface that is displaced
by them was created.
The tapered displacement gradient of the Gladstone array
would usually be interpreted to be a product of ongoing fault
propagation with lesser displacement towards the fault tip
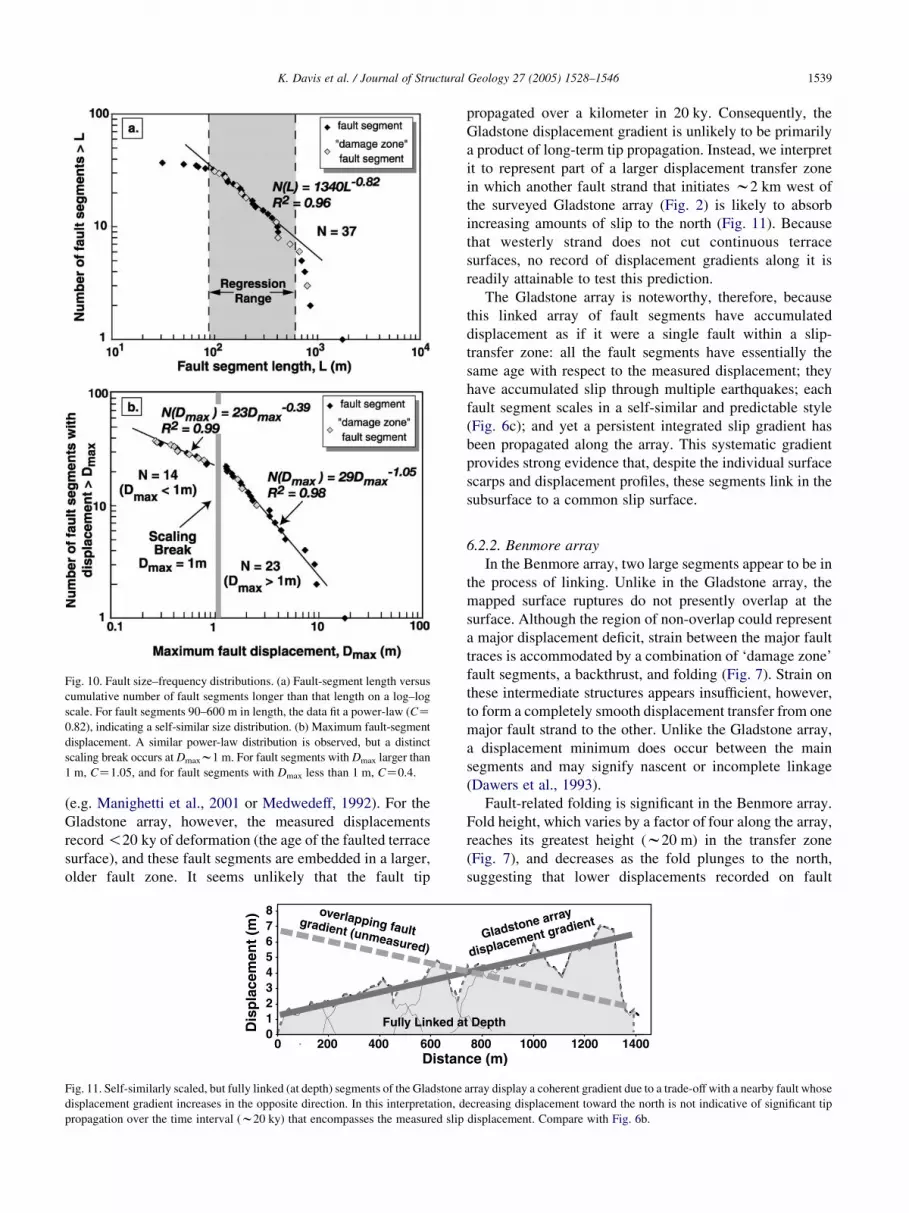
Fig. 10. Fault size–frequency distributions. (a) Fault-segment length versus
cumulative number of fault segments longer than that length on a log–log
scale. For fault segments 90–600 m in length, the data fit a power-law (CZ0.82), indicating a self-similar size distribution. (b) Maximum fault-segment
displacement. A similar power-law distribution is observed, but a distinct
scaling break occurs at Dmaxw1 m. For fault segments with Dmax larger than
1 m, CZ1.05, and for fault segments with Dmax less than 1 m, CZ0.4.
K. Davis et al. / Journal of Structural Geology 27 (2005) 1528–1546 1539
(e.g. Manighetti et al., 2001 or Medwedeff, 1992). For the
Gladstone array, however, the measured displacements
record!20 ky of deformation (the age of the faulted terrace
surface), and these fault segments are embedded in a larger,
older fault zone. It seems unlikely that the fault tip
Fig. 11. Self-similarly scaled, but fully linked (at depth) segments of the Gladstone
displacement gradient increases in the opposite direction. In this interpretation, d
propagation over the time interval (w20 ky) that encompasses the measured slip
propagated over a kilometer in 20 ky. Consequently, the
Gladstone displacement gradient is unlikely to be primarily
a product of long-term tip propagation. Instead, we interpret
it to represent part of a larger displacement transfer zone
in which another fault strand that initiates w2 km west of
the surveyed Gladstone array (Fig. 2) is likely to absorb
increasing amounts of slip to the north (Fig. 11). Because
that westerly strand does not cut continuous terrace
surfaces, no record of displacement gradients along it is
readily attainable to test this prediction.
The Gladstone array is noteworthy, therefore, because
this linked array of fault segments have accumulated
displacement as if it were a single fault within a slip-
transfer zone: all the fault segments have essentially the
same age with respect to the measured displacement; they
have accumulated slip through multiple earthquakes; each
fault segment scales in a self-similar and predictable style
(Fig. 6c); and yet a persistent integrated slip gradient has
been propagated along the array. This systematic gradient
provides strong evidence that, despite the individual surface
scarps and displacement profiles, these segments link in the
subsurface to a common slip surface.
6.2.2. Benmore array
In the Benmore array, two large segments appear to be in
the process of linking. Unlike in the Gladstone array, the
mapped surface ruptures do not presently overlap at the
surface. Although the region of non-overlap could represent
a major displacement deficit, strain between the major fault
traces is accommodated by a combination of ‘damage zone’
fault segments, a backthrust, and folding (Fig. 7). Strain on
these intermediate structures appears insufficient, however,
to form a completely smooth displacement transfer from one
major fault strand to the other. Unlike the Gladstone array,
a displacement minimum does occur between the main
segments and may signify nascent or incomplete linkage
(Dawers et al., 1993).
Fault-related folding is significant in the Benmore array.
Fold height, which varies by a factor of four along the array,
reaches its greatest height (w20 m) in the transfer zone
(Fig. 7), and decreases as the fold plunges to the north,
suggesting that lower displacements recorded on fault
array display a coherent gradient due to a trade-off with a nearby fault whose
ecreasing displacement toward the north is not indicative of significant tip
displacement. Compare with Fig. 6b.
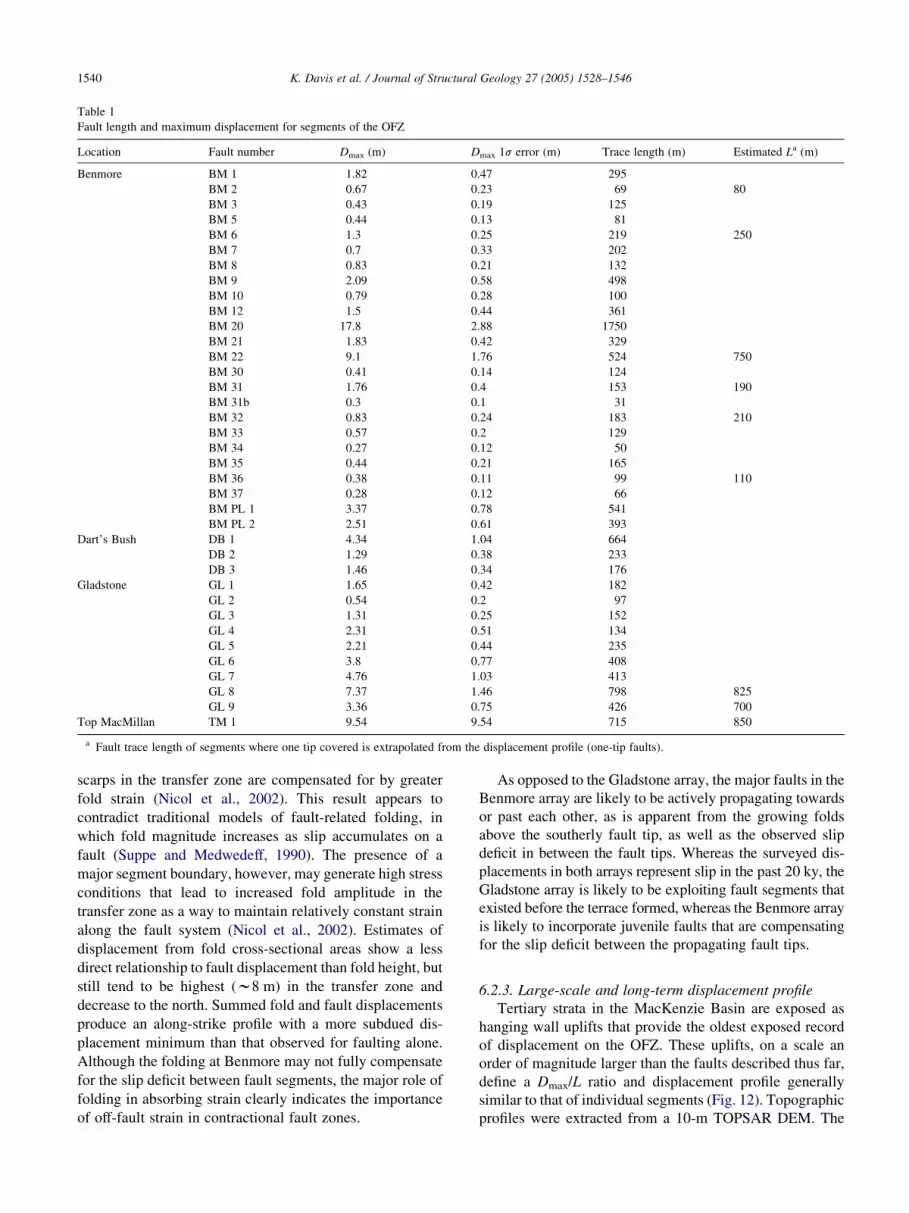
Table 1
Fault length and maximum displacement for segments of the OFZ
Location Fault number Dmax (m) Dmax 1s error (m) Trace length (m) Estimated La (m)
Benmore BM 1 1.82 0.47 295
BM 2 0.67 0.23 69 80
BM 3 0.43 0.19 125
BM 5 0.44 0.13 81
BM 6 1.3 0.25 219 250
BM 7 0.7 0.33 202
BM 8 0.83 0.21 132
BM 9 2.09 0.58 498
BM 10 0.79 0.28 100
BM 12 1.5 0.44 361
BM 20 17.8 2.88 1750
BM 21 1.83 0.42 329
BM 22 9.1 1.76 524 750
BM 30 0.41 0.14 124
BM 31 1.76 0.4 153 190
BM 31b 0.3 0.1 31
BM 32 0.83 0.24 183 210
BM 33 0.57 0.2 129
BM 34 0.27 0.12 50
BM 35 0.44 0.21 165
BM 36 0.38 0.11 99 110
BM 37 0.28 0.12 66
BM PL 1 3.37 0.78 541
BM PL 2 2.51 0.61 393
Dart’s Bush DB 1 4.34 1.04 664
DB 2 1.29 0.38 233
DB 3 1.46 0.34 176
Gladstone GL 1 1.65 0.42 182
GL 2 0.54 0.2 97
GL 3 1.31 0.25 152
GL 4 2.31 0.51 134
GL 5 2.21 0.44 235
GL 6 3.8 0.77 408
GL 7 4.76 1.03 413
GL 8 7.37 1.46 798 825
GL 9 3.36 0.75 426 700
Top MacMillan TM 1 9.54 9.54 715 850
a Fault trace length of segments where one tip covered is extrapolated from the displacement profile (one-tip faults).
K. Davis et al. / Journal of Structural Geology 27 (2005) 1528–15461540
scarps in the transfer zone are compensated for by greater
fold strain (Nicol et al., 2002). This result appears to
contradict traditional models of fault-related folding, in
which fold magnitude increases as slip accumulates on a
fault (Suppe and Medwedeff, 1990). The presence of a
major segment boundary, however, may generate high stress
conditions that lead to increased fold amplitude in the
transfer zone as a way to maintain relatively constant strain
along the fault system (Nicol et al., 2002). Estimates of
displacement from fold cross-sectional areas show a less
direct relationship to fault displacement than fold height, but
still tend to be highest (w8 m) in the transfer zone and
decrease to the north. Summed fold and fault displacements
produce an along-strike profile with a more subdued dis-
placement minimum than that observed for faulting alone.
Although the folding at Benmore may not fully compensate
for the slip deficit between fault segments, the major role of
folding in absorbing strain clearly indicates the importance
of off-fault strain in contractional fault zones.
As opposed to the Gladstone array, the major faults in the
Benmore array are likely to be actively propagating towards
or past each other, as is apparent from the growing folds
above the southerly fault tip, as well as the observed slip
deficit in between the fault tips. Whereas the surveyed dis-
placements in both arrays represent slip in the past 20 ky, the
Gladstone array is likely to be exploiting fault segments that
existed before the terrace formed, whereas the Benmore array
is likely to incorporate juvenile faults that are compensating
for the slip deficit between the propagating fault tips.
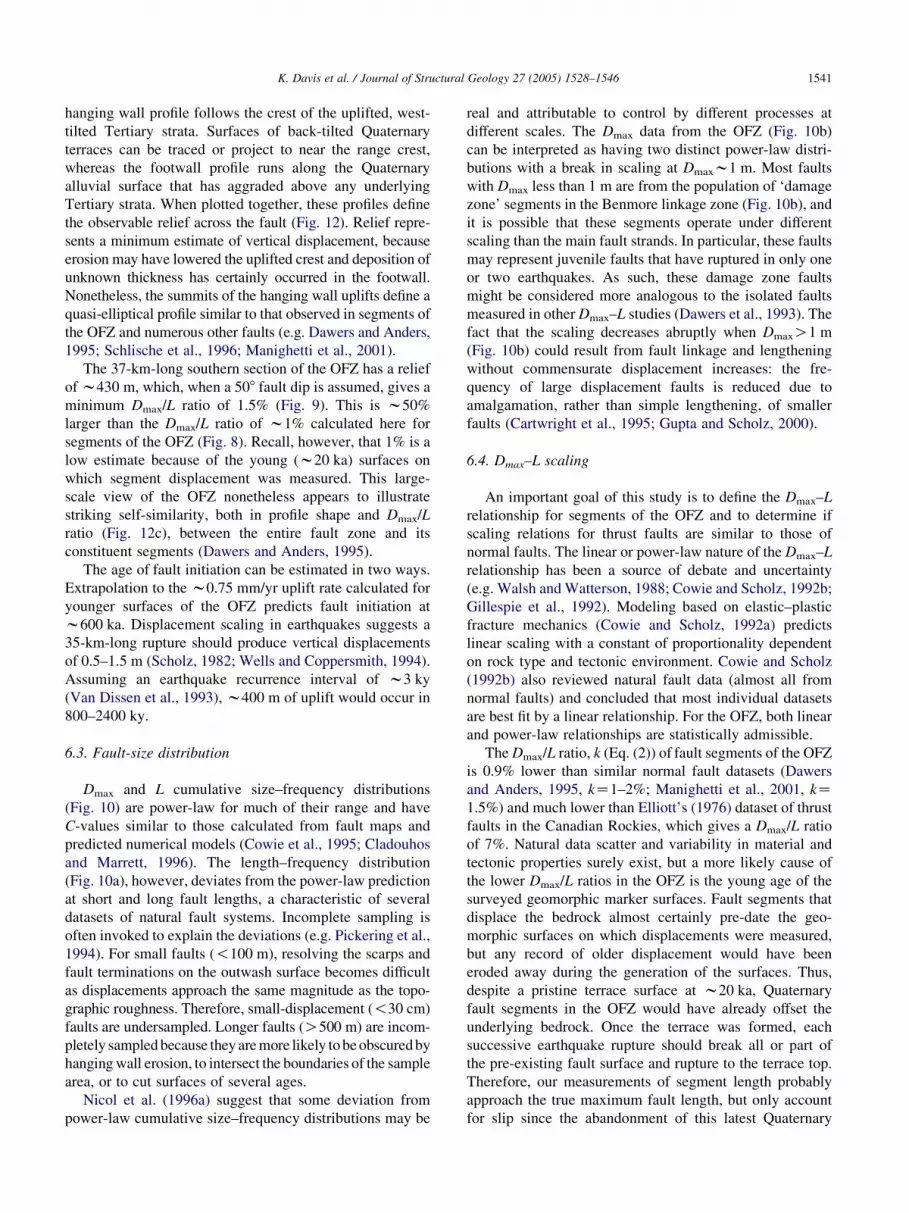
6.2.3. Large-scale and long-term displacement profile
Tertiary strata in the MacKenzie Basin are exposed as
hanging wall uplifts that provide the oldest exposed record
of displacement on the OFZ. These uplifts, on a scale an
order of magnitude larger than the faults described thus far,
define a Dmax/L ratio and displacement profile generally
similar to that of individual segments (Fig. 12). Topographic
profiles were extracted from a 10-m TOPSAR DEM. The
K. Davis et al. / Journal of Structural Geology 27 (2005) 1528–1546 1541
hanging wall profile follows the crest of the uplifted, west-
tilted Tertiary strata. Surfaces of back-tilted Quaternary
terraces can be traced or project to near the range crest,
whereas the footwall profile runs along the Quaternary
alluvial surface that has aggraded above any underlying
Tertiary strata. When plotted together, these profiles define
the observable relief across the fault (Fig. 12). Relief repre-
sents a minimum estimate of vertical displacement, because
erosion may have lowered the uplifted crest and deposition of
unknown thickness has certainly occurred in the footwall.
Nonetheless, the summits of the hanging wall uplifts define a
quasi-elliptical profile similar to that observed in segments of
the OFZ and numerous other faults (e.g. Dawers and Anders,
1995; Schlische et al., 1996; Manighetti et al., 2001).
The 37-km-long southern section of the OFZ has a relief
ofw430 m, which, when a 508 fault dip is assumed, gives a
minimum Dmax/L ratio of 1.5% (Fig. 9). This is w50%
larger than the Dmax/L ratio of w1% calculated here for
segments of the OFZ (Fig. 8). Recall, however, that 1% is a
low estimate because of the young (w20 ka) surfaces on
which segment displacement was measured. This large-
scale view of the OFZ nonetheless appears to illustrate
striking self-similarity, both in profile shape and Dmax/L
ratio (Fig. 12c), between the entire fault zone and its
constituent segments (Dawers and Anders, 1995).
The age of fault initiation can be estimated in two ways.
Extrapolation to the w0.75 mm/yr uplift rate calculated for
younger surfaces of the OFZ predicts fault initiation at
w600 ka. Displacement scaling in earthquakes suggests a
35-km-long rupture should produce vertical displacements
of 0.5–1.5 m (Scholz, 1982; Wells and Coppersmith, 1994).
Assuming an earthquake recurrence interval of w3 ky
(Van Dissen et al., 1993), w400 m of uplift would occur in
800–2400 ky.
6.3. Fault-size distribution
Dmax and L cumulative size–frequency distributions
(Fig. 10) are power-law for much of their range and have
C-values similar to those calculated from fault maps and
predicted numerical models (Cowie et al., 1995; Cladouhos
and Marrett, 1996). The length–frequency distribution
(Fig. 10a), however, deviates from the power-law prediction
at short and long fault lengths, a characteristic of several
datasets of natural fault systems. Incomplete sampling is
often invoked to explain the deviations (e.g. Pickering et al.,
1994). For small faults (!100 m), resolving the scarps and
fault terminations on the outwash surface becomes difficult
as displacements approach the same magnitude as the topo-
graphic roughness. Therefore, small-displacement (!30 cm)
faults are undersampled. Longer faults (O500 m) are incom-
pletely sampledbecause they aremore likely tobeobscuredby
hangingwall erosion, to intersect the boundaries of the sample
area, or to cut surfaces of several ages.
Nicol et al. (1996a) suggest that some deviation from
power-law cumulative size–frequency distributions may be
real and attributable to control by different processes at
different scales. The Dmax data from the OFZ (Fig. 10b)
can be interpreted as having two distinct power-law distri-
butions with a break in scaling at Dmaxw1 m. Most faults
with Dmax less than 1 m are from the population of ‘damage
zone’ segments in the Benmore linkage zone (Fig. 10b), and
it is possible that these segments operate under different
scaling than the main fault strands. In particular, these faults
may represent juvenile faults that have ruptured in only one
or two earthquakes. As such, these damage zone faults
might be considered more analogous to the isolated faults
measured in other Dmax–L studies (Dawers et al., 1993). The
fact that the scaling decreases abruptly when DmaxO1 m
(Fig. 10b) could result from fault linkage and lengthening
without commensurate displacement increases: the fre-
quency of large displacement faults is reduced due to
amalgamation, rather than simple lengthening, of smaller
faults (Cartwright et al., 1995; Gupta and Scholz, 2000).
6.4. Dmax–L scaling
An important goal of this study is to define the Dmax–L
relationship for segments of the OFZ and to determine if
scaling relations for thrust faults are similar to those of
normal faults. The linear or power-law nature of the Dmax–L
relationship has been a source of debate and uncertainty
(e.g. Walsh andWatterson, 1988; Cowie and Scholz, 1992b;
Gillespie et al., 1992). Modeling based on elastic–plastic
fracture mechanics (Cowie and Scholz, 1992a) predicts
linear scaling with a constant of proportionality dependent
on rock type and tectonic environment. Cowie and Scholz
(1992b) also reviewed natural fault data (almost all from
normal faults) and concluded that most individual datasets
are best fit by a linear relationship. For the OFZ, both linear
and power-law relationships are statistically admissible.
The Dmax/L ratio, k (Eq. (2)) of fault segments of the OFZ
is 0.9% lower than similar normal fault datasets (Dawers
and Anders, 1995, kZ1–2%; Manighetti et al., 2001, kZ1.5%) and much lower than Elliott’s (1976) dataset of thrust
faults in the Canadian Rockies, which gives a Dmax/L ratio
of 7%. Natural data scatter and variability in material and
tectonic properties surely exist, but a more likely cause of
the lower Dmax/L ratios in the OFZ is the young age of the
surveyed geomorphic marker surfaces. Fault segments that
displace the bedrock almost certainly pre-date the geo-
morphic surfaces on which displacements were measured,
but any record of older displacement would have been
eroded away during the generation of the surfaces. Thus,
despite a pristine terrace surface at w20 ka, Quaternary
fault segments in the OFZ would have already offset the
underlying bedrock. Once the terrace was formed, each
successive earthquake rupture should break all or part of
the pre-existing fault surface and rupture to the terrace top.
Therefore, our measurements of segment length probably
approach the true maximum fault length, but only account
for slip since the abandonment of this latest Quaternary
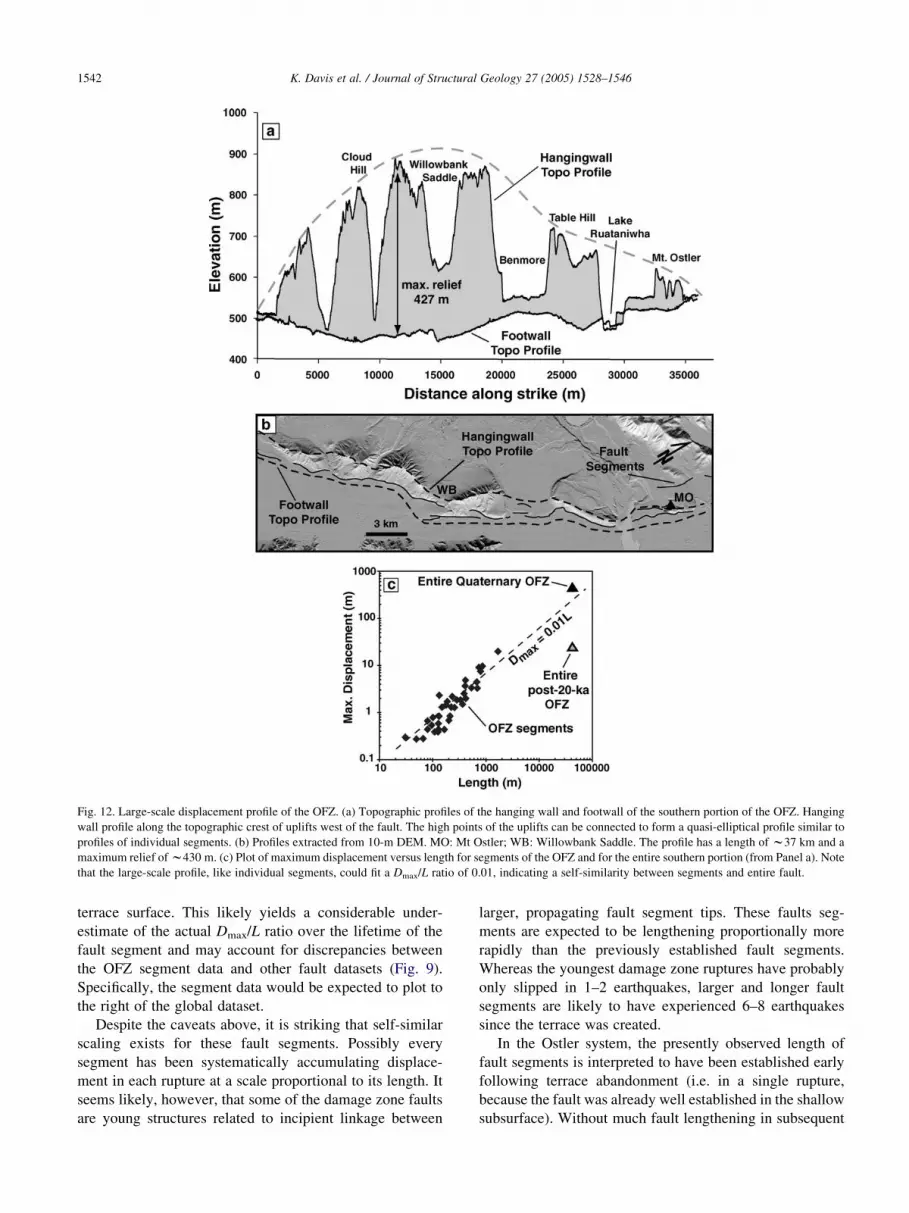
Fig. 12. Large-scale displacement profile of the OFZ. (a) Topographic profiles of the hanging wall and footwall of the southern portion of the OFZ. Hanging
wall profile along the topographic crest of uplifts west of the fault. The high points of the uplifts can be connected to form a quasi-elliptical profile similar to
profiles of individual segments. (b) Profiles extracted from 10-m DEM. MO: Mt Ostler; WB: Willowbank Saddle. The profile has a length of w37 km and a
maximum relief ofw430 m. (c) Plot of maximum displacement versus length for segments of the OFZ and for the entire southern portion (from Panel a). Note
that the large-scale profile, like individual segments, could fit a Dmax/L ratio of 0.01, indicating a self-similarity between segments and entire fault.
K. Davis et al. / Journal of Structural Geology 27 (2005) 1528–15461542
terrace surface. This likely yields a considerable under-
estimate of the actual Dmax/L ratio over the lifetime of the
fault segment and may account for discrepancies between
the OFZ segment data and other fault datasets (Fig. 9).
Specifically, the segment data would be expected to plot to
the right of the global dataset.
Despite the caveats above, it is striking that self-similar
scaling exists for these fault segments. Possibly every
segment has been systematically accumulating displace-
ment in each rupture at a scale proportional to its length. It
seems likely, however, that some of the damage zone faults
are young structures related to incipient linkage between
larger, propagating fault segment tips. These faults seg-
ments are expected to be lengthening proportionally more
rapidly than the previously established fault segments.
Whereas the youngest damage zone ruptures have probably
only slipped in 1–2 earthquakes, larger and longer fault
segments are likely to have experienced 6–8 earthquakes
since the terrace was created.
In the Ostler system, the presently observed length of
fault segments is interpreted to have been established early
following terrace abandonment (i.e. in a single rupture,
because the fault was already well established in the shallow
subsurface). Without much fault lengthening in subsequent
K. Davis et al. / Journal of Structural Geology 27 (2005) 1528–1546 1543
ruptures, slip continues to accrue along the fault segments,
while shortening in transfer zones occurs by other
mechanisms, such as small-scale faulting, folding, and
backthrusting. The isolated and overlapping fault scarps at
the surface are likely to be kinematically linked with a
continuous fault system at depth. Segment boundaries are
likely to be defined early during upward propagation of the
Ostler fault through a heterogeneous three-dimensional
stress field (Mandl, 1987; Walsh et al., 2003). Such a model
would produce non-self-similar growth as segment length
grows initially very rapidly and then abruptly slows, while
displacement changes systematically and gradually catches
up. The changing Dmax/L ratios that we document for
varying spatial and temporal scales in the OFZ support also
suggest a non-self-similar fault growth history (Fig. 9)
(Gupta and Scholz, 2000; Walsh et al., 2002).
In the OFZ, four different Dmax/L ratios have been
observed: first, for fault segments with no more than 20 ky
of slip accumulation, a ratio of w1% pertains (Fig. 8);
second, for a linked fault array with a length of w1.4 km
(Fig. 6), a ratio of 0.5% is apparent for slip since 20 ka;
third, for an array of 37 km length, the Dmax/L ratio is
!0.1% over the same 20 ky interval (Fig. 9); and fourth,
when the entire recorded life of the fault is considered,
accumulated slip is at least 1.5% of the fault length
(Fig. 12). These differing ratios offer support both for the
model of Cartwright et al. (1995) in which fault linkage
drives D/L ratios away from the linear trend of individual
faults and for a change in scaling ratio as faults lengthen past
some threshold (Fig. 9). In addition, these ratios suggest
that, with respect to the accumulated displacement, shorter
faults can lengthen relatively faster than longer faults. This
may reflect either the lower likelihood of linking larger
faults or changes in the ways faults propagate and accumu-
late slip when they achieve lengths equal to or exceeding the
thickness of the brittle crust. Finally, observed Dmax/L ratios
range over an order of magnitude depending on whether
individual or linked fault segments are considered and
whether cumulative displacement is measured since fault
initiation or only since a geomorphic marker was created.
Not only does this suggest that caution must be used when
comparing datasets from different populations of faults, but
those data that appear as outliers with respect to typical
Dmax/L ratios may be recording transitional stages between
the coseismic rupture-displacement scale and the fully
linked, mature fault stage (Figs. 9 and 11).
An implication of the modeling of Cowie and Scholz
(1992a) is that faulting from different stress regimes and
lithological settings will have different Dmax–L scaling,
because the parameters for shear strength and shear modulus
of the surrounding rock, frictional shear stress on the fault,
and ratio of remote stress loading to rock shear strength all
affect the Dmax–L relationship. Nevertheless, the global fault
dataset (Schlische et al., 1996) shows a clear positive trend
over nine orders of magnitude (Fig. 9). These data comprise
faults that have accumulated slip from many earthquakes,
and most of the data come from inactive faults. Wells and
Coppersmith (1994) and Scholz (1982) have compiled data
on the length and displacement of earthquake ruptures that
define a positive linear relationship between Dmax and L
with a Dmax/L ratio ofw2–5!10K5. Individual segments of
the OFZ, which record displacement of only the last
w20 ka, fall clearly within the range of the global fault
dataset, and have Dmax/L ratios (w0.01) at least two orders
of magnitude greater than those of earthquake ruptures.
A change in slope in the global fault data at Lw100 m
is apparent (Fig. 9). Shorter faults best fit the power-law
relationship DmaxZ0.02L0.8, whereas faults longer than
100 m best fit DmaxZ0.0009L1.4. Although Cowie and
Scholz (1992b) argued that faults from different tectonic
and lithologic settings have different k-values (Eq. (2)), and
should not be combined, this scaling break persists in data
that are synthesized from many settings and should,
therefore, smooth site-specific differences. The OFZ data
for fault segments straddle this scaling break and have an
n-value of w1.1, which is intermediate between LO100
and !100 regressions for the global dataset (Fig. 9). This
break in slope implies that the mechanics of fault ruptures
may vary for small (10K2–102 m long) faults versus those
O103–104 m long. The physical basis for such variation, if
it exists, needs to be explored.
6.5. Segmentation and Dmax–L scaling on the OFZ
Fault segments of the OFZ have Dmax/L ratios similar to
those of ancient faults, not of earthquake ruptures (Fig. 9).
The long-term scaling, however, can be understood in terms
of linkage among fault segments and superposition of
successive earthquakes, each with Dmax/L ratios much lower
than those of mature faults. The largest surveyed dis-
placements (15–25 m) on the last glacial surfaces are
undoubtedly the product of multiple earthquake ruptures.
Earthquake scaling relationships (Scholz, 1982; Wells and
Coppersmith, 1994) predict maximum displacements of
1–2.5 m for a 50-km-long fault such as the OFZ. These
predictions are generally compatible with the w3 m
observed co-seismic displacements on the OFZ (Van Dissen
et al., 1993). Based on a w3 ky earthquake recurrence
interval (Van Dissen et al., 1993), perhaps 6–8 earthquakes
have occurred since the abandonment of the w20 ka out-
wash surface. If each earthquake ruptures the entire length
of the OFZ, 6–8 earthquakes should produce 6–20 m of
displacement, a prediction that agrees well with field obser-
vations. Although the overall displacement on the surface
can be explained by multiple earthquake ruptures with
Dmax/L ratios of 2–5!10K5, individual segments have
much higher Dmax/L ratios. This discrepancy could be
resolved if the entire fault ruptures along a single surface at
depth, but splays into multiple segments within the over-
lying basin strata (Fig. 13) (Bray et al., 1994).
Seismic reflection data (Long et al., 2000) and field
observations indicate that the MacKenzie Basin stratigraphy
K. Davis et al. / Journal of Structural Geology 27 (2005) 1528–15461544
consists of 10–100 m of Quaternary glacial outwash
deposits and up to 800 m of Tertiary sediments (Glentanner
Fm.) overlying a basement of Torlesse meta-sedimentary
rocks. Although some of the regional scale segmentation
may be rooted in the bedrock, we suggest that most
segmentation in this study is a product of rupturing through
Cenozoic basin stratigraphy (upper w1000 m). Near its
northern termination, the fault cuts bedrock at the surface,
and a single, straight, and unsegmented fault scarp is
present. In contrast, in addition to folding, parallel, en
echelon, and ‘damage zone’ fault segments occur in that
part of the OFZ underlain by Cenozoic strata. Presumably
the sum of displacement on these structures equals the
displacement of the underlying main fault strand in bedrock.
Where we have observations (i.e. Benmore and Mt Ostler
areas; Fig. 2), the total displacement of the 20 ka terrace
across the entire fault zone is of the order of 15–25 m.
Where fewer fault segments are present, displacements are
greater on the individual faults. The compensation or
displacement transfer that we observe at the w500 m scale
at Benmore (Fig. 7) also occurs in multiple faults at the
w3 km scale near Mt Ostler (Fig. 2a and c).
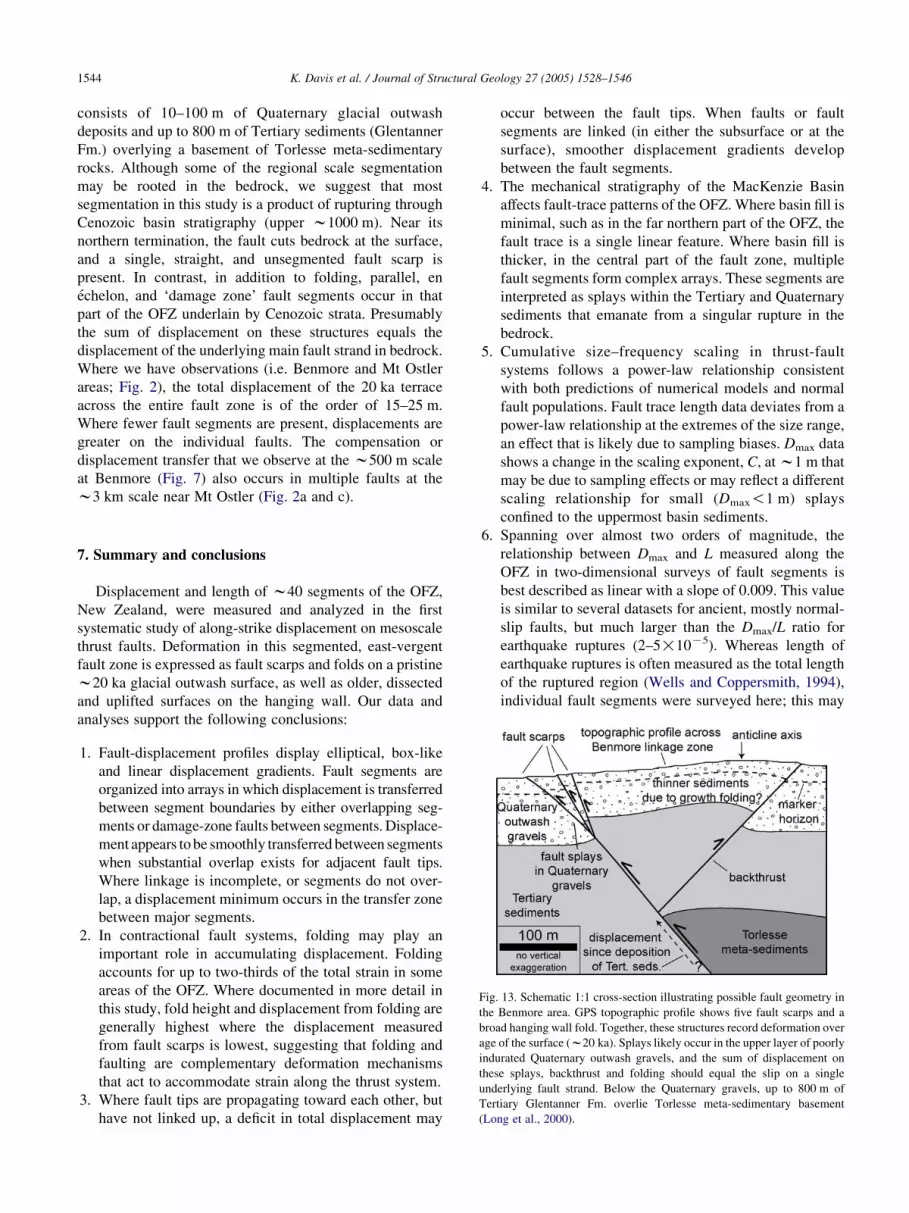
Fig. 13. Schematic 1:1 cross-section illustrating possible fault geometry in
the Benmore area. GPS topographic profile shows five fault scarps and a
broad hanging wall fold. Together, these structures record deformation over
age of the surface (w20 ka). Splays likely occur in the upper layer of poorly
indurated Quaternary outwash gravels, and the sum of displacement on
these splays, backthrust and folding should equal the slip on a single
underlying fault strand. Below the Quaternary gravels, up to 800 m of
Tertiary Glentanner Fm. overlie Torlesse meta-sedimentary basement
(Long et al., 2000).
7. Summary and conclusions
Displacement and length of w40 segments of the OFZ,
New Zealand, were measured and analyzed in the first
systematic study of along-strike displacement on mesoscale
thrust faults. Deformation in this segmented, east-vergent
fault zone is expressed as fault scarps and folds on a pristine
w20 ka glacial outwash surface, as well as older, dissected
and uplifted surfaces on the hanging wall. Our data and
analyses support the following conclusions:
1. Fault-displacement profiles display elliptical, box-like
and linear displacement gradients. Fault segments are
organized into arrays in which displacement is transferred
between segment boundaries by either overlapping seg-
ments or damage-zone faults between segments. Displace-
ment appears tobe smoothly transferred between segments
when substantial overlap exists for adjacent fault tips.
Where linkage is incomplete, or segments do not over-
lap, a displacement minimum occurs in the transfer zone
between major segments.
2. In contractional fault systems, folding may play an
important role in accumulating displacement. Folding
accounts for up to two-thirds of the total strain in some
areas of the OFZ. Where documented in more detail in
this study, fold height and displacement from folding are
generally highest where the displacement measured
from fault scarps is lowest, suggesting that folding and
faulting are complementary deformation mechanisms
that act to accommodate strain along the thrust system.
3. Where fault tips are propagating toward each other, but
have not linked up, a deficit in total displacement may
occur between the fault tips. When faults or fault
segments are linked (in either the subsurface or at the
surface), smoother displacement gradients develop
between the fault segments.
4. The mechanical stratigraphy of the MacKenzie Basin
affects fault-trace patterns of the OFZ. Where basin fill is
minimal, such as in the far northern part of the OFZ, the
fault trace is a single linear feature. Where basin fill is
thicker, in the central part of the fault zone, multiple
fault segments form complex arrays. These segments are
interpreted as splays within the Tertiary and Quaternary
sediments that emanate from a singular rupture in the
bedrock.
5. Cumulative size–frequency scaling in thrust-fault
systems follows a power-law relationship consistent
with both predictions of numerical models and normal
fault populations. Fault trace length data deviates from a
power-law relationship at the extremes of the size range,
an effect that is likely due to sampling biases. Dmax data
shows a change in the scaling exponent, C, atw1 m that
may be due to sampling effects or may reflect a different
scaling relationship for small (Dmax!1 m) splays
confined to the uppermost basin sediments.
6. Spanning over almost two orders of magnitude, the
relationship between Dmax and L measured along the
OFZ in two-dimensional surveys of fault segments is
best described as linear with a slope of 0.009. This value
is similar to several datasets for ancient, mostly normal-
slip faults, but much larger than the Dmax/L ratio for
earthquake ruptures (2–5!10K5). Whereas length of
earthquake ruptures is often measured as the total length
of the ruptured region (Wells and Coppersmith, 1994),
individual fault segments were surveyed here; this may
K. Davis et al. / Journal of Structural Geology 27 (2005) 1528–1546 1545
account for some of the discrepancy. Segments of the
OFZ follow similar scaling relationships to faults with
sizes ranging across nine orders of magnitude and from
all modes of faulting. Calculated Dmax values in the
Ostler system are likely to be an underestimate because
displacement is only recorded on fault scarps for the
w20 ky since formation of the outwash surfaces that
were subsequently faulted.
7. At the scale of the entire Ostler Fault system, the Dmax/L
ratios define two extremes. Since 20 ka, the entire
system Dmax/L ratio is !0.001, whereas the ratio is
R0.015 since the fault zone was initiated. The former
value falls below the typically observed Dmax/L ratios
and appears to capture some of the transition from the
displacement scale of coseismic ruptures to that of
mature fault zones. The latter value is typical of the
global data set for (predominantly normal) faults, but is
much lower than the 0.07 ratio for large thrust faults in
the Canadian Rockies. More data are needed on large
thrust-fault systems to define their displacement scaling
behavior (Elliott, 1976).
8. The OFZ accommodates up to 7% of plate convergence
east of the Alpine fault, making it a significant structure
in the eastern Southern Alps. Deformation on the OFZ
likely originated before 600 ka, based on (i) extrapol-
ation of recent uplift rates to the highest preserved
uplifts, and (ii) extrapolation of earthquake-rupture
scaling ratios and earthquake recurrence intervals.
Acknowledgements
Haikai Tane of the Center for Catchment Ecology in
Twizel, NZ provided assistance in the field, and high-
resolution topographic data and aerial photography. The
TOPSAR DEM used in this study was kindly supplied by
NASA. This research was funded by National Science
Foundation grant EAR-0117242. The manuscript was
substantially improved by the incisive reviews of N. Dawers
and A. Nicol.
References
Blick, G.H., Read, S.A.L., Hall, P.T., 1989. Deformation monitoring of the
Ostler fault zone, South Island, New Zealand. Tectonophysics 167,
329–339.
Bray, J.D., Seed, R.B., Cluff, L.S., Seed, H.B., 1994. Earthquake rupture
propagation through soil. Journal of Geotechnical Engineering 120,
543–561.
Cartwright, J.A., Trudgill, B.D., Mansfield, C.S., 1995. Fault growth by
segment linkage; an explanation for scatter in maximum displacement
and trace length data from the Canyonlands Grabens of SE Utah.
Journal of Structural Geology 17, 1319–1326.
Childs, C., Watterson, J., Walsh, J.J., 1995. Fault overlap zones within
developing normal fault systems. Journal of the Geological Society of
London 152, 535–549.
Cladouhos, T.T., Marrett, R., 1996. Are fault growth and linkage models
consistent with power-law distributions of fault lengths. Journal of
Structural Geology 18, 281–293.
Clark, R.M., Cox, S.J.D., 1996. A modern regression approach to
determining fault displacement–length scaling relationships. Journal
of Structural Geology 18, 147–152.
Cowie, P.A., Scholz, C.H., 1992a. Physical explanation for the
displacement–length relationship of faults using a post-yield fracture
mechanics model. Journal of Structural Geology 14, 1133–1148.
Cowie, P.A., Scholz, C., 1992b. Displacement–length scaling relationship
for faults: data synthesis and discussion. Journal of Structural Geology
14, 1149–1156.
Cowie, P.A., Shipton, Z., 1998. Quasistatic fault slip as an explanation for
finite displacement gradients at fault tips. Journal of Structural Geology
20, 983–997.
Cowie, P.A., Sornette, D., Vanneste, C., 1995. Multifractal scaling
properties of a growing fault population. Geophysical Journal
International 122, 457–469.
Crider, J.G., Pollard, D.D., 1998. Fault linkage: three-dimensional
mechanical interaction between echelon normal faults. Journal of
Geophysical Research, B, Solid Earth and Planets 103, 24373–24391.
Dawers, N.H., Anders, M.H., 1995. Displacement–length scaling and fault
linkage. Journal of Structural Geology 17, 607–614.
Dawers, N.H., Anders, M.H., Scholz, C.H., 1993. Growth of normal faults:
displacement–length scaling. Geology 21, 1107–1110.
DeMets, C., Gordon, R.G., Argus, D.F., Stein, S., 1994. Effect of recent
revisions to the geomagnetic reversal time scale on estimates of current
plate motions. Geophysical Research Letters 21, 2191–2194.
Elliott, D., 1976. The energy balance and deformation mechanisms of thrust
sheets. Philosophical Transactions of the Royal Society of London 283,
289–312.
Gillespie, P.A., Walsh, J.J., Watterson, J., 1992. Limitations of dimension
and displacement data from single faults and the consequences for data
analysis and interpretation. Journal of Structural Geology 14,
1157–1172.
Gupta, A., Scholz, C., 1998. Utility of elastic model in predicting fault
displacement fields. Journal of Geophysical Research 103, 823–834.
Gupta, A., Scholz, C., 2000. A model of normal fault interaction based on
observations and theory. Journal of Structural Geology 22, 865–879.
Long, D., Cox, S.J.D., Bannister, S., Gerstenberger, M., Yu, J.Z., Henrys,
S.A., Okaya, D., 2000. Unveiling the secrets of the Mackenzie Basin:
results from the 1998 SIGHT seismic reflection experiment. In:
GSNZ/NZGS Joint Meeting: Geological Society of New Zealand
Miscellaneous Publication 108A, 94pp.
Mandl, G., 1987. Discontinuous fault zones. Journal of Structural Geology
9, 105–110.
Manighetti, I., King, G.C.P., Gaudemer, Y., Scholz, C., Doubre, C., 2001.
Slip accumulation and lateral propagation of active normal faults in
Afar. Journal of Geophysical Research 106, 13667–13696.
Mansfield, C.S., Cartwright, J.A., 2001. Fault growth by linkage:
observations and implications from analogue models. Journal of
Structural Geology 23, 745–763.
Medwedeff, D.A., 1992. Geometry and kinematics of an active, laterally
propagating wedge thrust, Wheeler Ridge, California. In: Mitra, S.,
Fisher, G.W. (Eds.), Structural Geology of Fold and Thrust Belts. Johns
Hopkins University Press, Baltimore, MD, pp. 3–28.
Nicol, A., Walsh, J.J., Watterson, J., Gillespie, P.A., Wojtal, S.F., 1996a.
Fault size distributions; are they really power-law? Journal of Structural
Geology 18, 191–197.
Nicol, A., Watterson, J., Walsh, J.J., Childs, C., 1996b. The shapes, major
axis orientations and displacement patterns of fault surfaces. Journal of
Structural Geology 18, 235–248.
Nicol, A., Gillespie, P.A., Childs, C., Walsh, J.J., 2002. Relay zones
between mesoscopic thrust faults in layered sedimentary sequences.
Journal of Structural Geology 24, 709–727.
Nobes, D.C., Wallace, S., Davis, K.J., White, A., Burbank, D.W., 2003.
Three-dimensional imaging of the Benmore segment of the Ostler Fault
K. Davis et al. / Journal of Structural Geology 27 (2005) 1528–15461546
using ground-penetrating radar (GPR), resistivity tomography and
differential GPS. In: Abstracts of the Australasian Quaternary
Association and New Zealand Friends of the Pleistocene Conference,
Westport, New Zealand.
Norris, R.J., Cooper, A.F., 2001. Late Quaternary slip rates and slip
partitioning on the Alpine Fault, New Zealand. Journal of Structural
Geology 23, 507–520.
Oncel, A.O., Wilson, T.H., Nishizawa, O., 2001. Size scaling relationships
in the active fault networks of Japan and their correlation with
Gutenberg–Richter b values. Journal of Geophysical Research—Solid
Earth 106, 21827–21841.
Peacock, D.C.P., Sanderson, D.J., 1991. Displacement, segment linkage
and relay ramps in normal fault zones. Journal of Structural Geology 13,
721–733.
Peacock, D.C.P., Sanderson, D.J., 1996. Effects of propagation rate on
displacement variations along faults. Journal of Geophysical Research
18, 311–320.
Pickering, G., Bull, J.M., Sanderson, D.J., Harrison, P.V., 1994. Fractal
fault displacements: a case study from the Moray Firth, Scotland. In:
Kruhl, J.H. (Ed.), Fractals and Dynamic Systems in Geosciences.
Springer, Berlin, pp. 105–118.
Pollard, D.D., Segall, P., 1987. Theoretical displacements and stresses near
fractures in rock; with applications to faults, joints, veins, dikes, and
solution surfaces. In: Atkinson, B.K. (Ed.), Fracture Mechanics of
Rock. Academic Press, London, pp. 277–349.
Poulimenos, G., 2000. Scaling properties of normal fault populations in the
western Corinth Graben, Greece: implications for fault growth in large
strain settings. Journal of Structural Geology 27, 307–322.
Read, S.A.L., 1984. The Ostler fault zone. In: Wood, P.R. (Ed.), Guidebook
to the South Island Scientific Excursions International Symposium on
Recent Crustal Movements of the Pacific Region. Wellington, NZ.
February, 1984 Royal Society of New Zealand Miscellaneous Series 9.
The Royal Society of New Zealand, Wellington, pp. 121–134.
Schlische, R.W., Young, S.S., Ackermann, R.V., Gupta, A., 1996.
Geometry and scaling relations of a population of very small rift-
related normal faults. Geology 24, 683–686.
Scholz, C.H., 1982. Scaling laws for large earthquakes: consequences for
physical models. Bulletin of the Seismological Society of America 72,
1–14.
Scholz, C.H., 1990. The Mechanics of Earthquakes and Faulting.
Cambridge University Press, Cambridge, UK.
Scholz, C.H., Cowie, P.A., 1990. Fault growth and linkage models and
distributions of fault length. Nature 346, 837–839.
Scholz, C.H., Dawers, N.H., Yu, J.Z., Anders, M.H., 1993. Fault growth
and fault scaling laws; preliminary results. In: Schubert, G. (Ed.),
Special Section on Physical Processes in Geodynamics [Modified] 98.
American Geophysical Union, Washington, pp. 21951–21961.
Sempere, J.C., Macdonald, K.C., 1986. Overlapping spreading centers:
implications from crack growth simulation by the displacement
discontinuity method. Tectonics 5 (1), 151–163.
Soliva, R., Benedicto, A., 2004. A linkage criterion for segmented normal
faults. Journal of Structural Geology 26, 2251–2267.
Suppe, J., Medwedeff, D.A., 1990. Geometry and kinematics of fault-
propagation folding. Eclogae Geologicae Helvetiae 83, 409–454.
Tippett, J.M., Hovius, N., 2000. Geodynamic processes in the Southern
Alps, New Zealand. In: Summerfield, M.A. (Ed.), Geomorphology and
Global Tectonics. Wiley, Chichester, pp. 109–134.
Turcotte, D.L., 1992. Fractals and Chaos in Geology and Geophysics.
Cambridge University Press, Cambridge.
Van Dissen, R.J., Hull, A.G., Read, S.A.L., 1993. Timing of Some Large
Holocene Earthquakes on the Ostler Fault, New Zealand. CRCM, Kobe,
Japan, pp. 381–386.
Walcott, R.I., 1998. Modes of oblique compression; late Cenozoic tectonics
of the South Island of New Zealand. Reviews of Geophysics 36, 1–26.
Walsh, J.J., Watterson, J., 1988. Analysis of the relationship between
displacements and dimensions of faults. Journal of Structural Geology
10, 239–247.
Walsh, J.J., Nicol, A., Childs, C., 2002. An alternative model for the growth
of faults. Journal of Structural Geology 24, 1669–1675.
Walsh, J.J., Childs, C., Imber, J., Manzocchi, T., Watterson, J.,
Nell, P.A.R., 2003. Strain localisation and population changes during
fault system growth within the Inner Moray Firth, Northern North Sea.
Journal of Structural Geology 25, 307–315.
Watterson, J., Walsh, J.J., Gillespie, A., Easton, S., 1996. Scaling
systematics of fault sizes on a large-scale range fault map. Journal of
Structural Geology 18, 199–214.
Wells, D.L., Coppersmith, K.J., 1994. New empirical relationships among
magnitude, rupture length, rupture width, rupture area, and surface
displacement. Bulletin of the Seismological Society of America 84,
974–1002.
Wickham, J., 1995. Fault displacement-gradient folds and the structure at
Lost Hills, California. Journal of Structural Geology 17, 1293–1302.
Willemse, E.J.M., Pollard, D.D., Aydin, A., 1996. 3D analyses of slip
distributions on normal fault arrays with consequences for fault scaling.
Journal of Structural Geology 18, 295–309.
Recommended


![[EUREGEO2015] Geological 3D modelling. Poster ... - icgc.cat · (VS2) Thrust Fault Fault Filón Sur ore-body San Dionisio ore-body B 3D geological map of “Cerro Colorado” open-pit](https://img.pdfslide.us/doc/110x75/5f5f392ee4d50253202e2c3e/euregeo2015-geological-3d-modelling-poster-icgc-vs2-thrust-fault-fault.jpg)