Three-dimensional subwavelength confinement of light with dielectric
microspheres
Alexis Devilez, Nicolas Bonod,* Jérôme Wenger, Davy Gérard, Brian Stout, Hervé
Rigneault, Evgeny Popov
Institut Fresnel, Aix-Marseille Université, CNRS, 13397 Marseille, France
*Corresponding author: [email protected]
Abstract: Dielectric microspheres are shown to be capable of confining
light in a three-dimensional region of subwavelength dimensions when
they are illuminated by tightly focused Gaussian beams. We show that a
simple configuration, not involving resonances, permits one to reach an
effective volume as small as 0.6 (λ/n)3. It is shown that this three-
dimensional confinement arises from interferences between the field
scattered by the sphere and the incident Gaussian beam containing high
angular components.
2009 Optical Society of America
OCIS codes: (180.0180) Microscopy; (230.3990) Micro-optical devices; (290.4020) Mie
theory; (260.2110) Electromagnetic optics; (290.5850) Scattering, particles.
References and links
1. J.-C. Weeber, A. Bouhelier, G. Colas des Francs, L. Markey, and A. Dereux, “Submicrometer In-
Plane Integrated Surface Plasmon Cavities,” Nano Lett. 7, 1352-1359 (2007).
2. H. Rigneault, J. Capoulade, J. Dintinger, J. Wenger, N. Bonod, E. Popov, T. W. Ebbesen, P.F. Lenne,
“Enhancement of single-molecule fluorescence detection in subwavelength apertures,” Phys. Rev.
Lett. 95, 117401 (2005).
3. P. Anger, P. Bharadwaj and L. Novotny, “Enhancement and Quenching of Single-Molecule
Fluorescence,” Phys. Rev. Lett. 96, 113002 (2006).
4. S. Nie, S. R. Emory, “Probing single molecules and single nanoparticles by surface-enhanced Raman
scattering,” Science 275, 1102 (1997).
5. S. Noda, “Seeking the ultimate nanolaser,” Science 314, 260-261 (2006).
6. A. Sentenac and P. C. Chaumet, “Subdiffraction Light Focusing on a Grating Substrate,” Phys. Rev.
Lett. 101, 013901 (2008).
7. D. C. Marinica, A. G. Borisov, S. V. Shabanov, “Bound states in the continuum in photonics,” Phys.
Rev. Lett. 100, 183902 (2008).
8. Z. Chen, A. Taflove, V. Backman, “Photonic nanojet enhancement of backscattering of light by
nanoparticles: A potential novel visible-light ultramicroscopy technique,” Opt. Express 12, 1214 -
1220 (2004).
9. X. Li, Z. Chen, A. Taflove, V. Backman, “Optical analysis of nanoparticles via enhanced
backscattering facilitated by 3-D photonic nanojets,” Opt. Express 13, 526 - 533 (2005).
10. S. Lecler, Y. Takakura, and P. Meyrueis, “Properties of a 3D photonic jet,” Opt. Lett. 30, 2641-2643
(2005).
11. A. V. Itagi and W. A. Challener, “Optics of photonic nanojets,” J. Opt. Soc. Am. A 22, 2847-2858
(2005).
12. J. Kofler, N. Arnold, “Axially symmetric focusing as a cuspoid diffraction catastrophe: scalar and
vector cases and comparison with the theory of Mie,” Phys. Rev. B. 73, 235401 (2006).
13. P. Ferrand, J. Wenger, A. Devilez, M. Pianta, B. Stout, N. Bonod, E. Popov, and H. Rigneault, “Direct
imaging of photonic nanojets,” Opt. Express 16, 6930-6940 (2008)
14. A. Devilez, B. Stout, N. Bonod, E. Popov, “Spectral analysis of three-dimensional photonic jets,” Opt.
Express 16, 14200 – 14212 (2008).
15. M. Mosbacher, H.-J. Münzer, J. Zimmermann, J. Solis, J. Boneberg, P. Leiderer, “Optical field
enhancement effects in laser-assisted particle removal,” Appl. Phys. A: Mater. Sci. Process. 72, 41-44
(2001).
16. B. S. Luk’yanchuk, N. Arnold, S. M. Huang, Z. B. Wang, and M. H. Hong, “Three-dimensional
effects in dry laser cleaning,” Appl. Phys. A: Mater. Sci. Process. 77, 209-215 (2003).
17. K. Piglmayer, R. Denk, and D. Bäuerle, “Laser-induced surface patterning by means of microspheres,”
Appl. Phys. Lett. 80, 4693-4695 (2002).
(C) 2009 OSA 16 February 2009 / Vol. 17, No. 4 / OPTICS EXPRESS 2089#105481 - $15.00 USDReceived 19 Dec 2008; revised 27 Jan 2009; accepted 27 Jan 2009; published 2 Feb 2009
18. E. McLeod, C. B. Arnold, “Subwavelength direct-write nanopatterning using optically trapped
microspheres,” Nature nanotechnology 3, 413 - 417 (2008).
19. A. Pereira, D. Grojo, M. Chaker, P. Delaporte, D. Guay, M. Sentis, “Laser-fabricated porous alumina
membranes for the preparation of metal nanodot arrays,” Small 4, 572-576 (2008)
20. K. J. Yi, H. Wang, Y. F. Lu, Z. Y. Yang, “Enhanced Raman scattering by self-assembled silica
spherical microparticles,” J. Appl. Phys. 101, 063528 (2007).
21. J. Kasim, Y. Ting, Y. Y. Meng, L. J. Ping, A. See, L. L. Jong, S. Z. Xiang, “Near-field Raman
imaging using optically trapped dielectric microsphere,” Opt. Express 16, 7976 – 7984 (2008).
22. S.-C. Kong, A. Sahakian, A. Taflove, V. Backman, “Photonic nanojet-enabled optical data storage,”
Opt. Express 16, 13713 – 13719 (2008).
23. D. Gérard, J. Wenger, A. Devilez, D. Gachet, B. Stout, N. Bonod, E. Popov, H. Rigneault, “Strong
electromagnetic confinement near dielectric microspheres to enhance single-molecule fluorescence,”
Opt. Express 16, 15297 – 15303 (2008).
24. B. Stout, M. Neviere, E. Popov, “Light diffraction by three-dimensional object: differential theory,” J.
Opt. Soc. Am. A 22, 2385 - 2404 (2005).
25. L. W. Davis, “Theory of electromagnetic beams,” Phys. Rev. A 19, 1177 - 1179 (1978).
26. B. Stout, J.-C. Auger, J. Lafait, “A transfert matrix approach to local field calculations in multiple-
scattering problems,” J. Mod. Opt. 49, 2129 - 2152 (2002).
1. Introduction
Strong concentration of light in a single spot of subwavelength dimensions is widely
performed by metallic structures such as gratings, pinholes, tips or nanoparticles [1-4],
which take advantage of electromagnetic resonances on metals such as surface plasmon
modes. However, losses in metals and technically challenging nanofabrication processes
may limit their interest for applications in ultramicroscopy, spectroscopy and optical data
storage. Resonant dielectric structures such as gratings or photonic crystal cavities offer
an alternative with almost no intrinsic absorption [5-7]. The quality factors and field
enhancement of these resonant structures vary from tens to thousands or more, but this
comes at the expense of rather complicated structures.
In the search for simpler dielectric structures to concentrate light at the nanoscale,
several groups have considered the use of dielectric spheres of micrometer dimensions [8-
14]. When the microsphere is illuminated by a plane wave, the so-called “photonic
nanojet” beam that emerges from the sphere has subwavelength transverse dimensions
and low divergence, which makes it fruitful for applications in dry laser cleaning [15,16],
nanopatterning [17-19], Raman spectroscopy [20,21] and optical data storage [22].
However, due to its large dimension along the optical axis (typically 2-3 µm), the
photonic nanojet does not provide three-dimensional subwavelength light confinement.
For applications requiring high transverse and longitudinal resolutions, the classical
photonic nanojet is unsuitable, as performs no better than the focusing obtained from a
classical microscope objective with a high numerical aperture.
Quite surprisingly, it has recently been shown that a single microsphere illuminated
by a tightly focused Gaussian beam can outperform classical microscope systems and
significantly enhance the fluorescence emission from a single molecule [23]. In that case,
strong confinement of light, on the order of (λ/n)3, with a non-resonant dielectric structure
was clearly demonstrated, but the physical origin of this effect and its implications
remained untreated.
In this paper, we investigate the light confinement produced by a dielectric
microsphere illuminated by a tightly focused Gaussian beam. Our simulations employ a
rigorous Lorentz-Mie theory [24], and concern the experimentally relevant configuration
of a 2 µm diameter latex sphere of refractive index ns = 1.6 surrounded by water (n =
1.33) as used in Ref. [23]. The incident beam parameters are chosen to approximate the
properties of a perfectly corrected objective with high numerical aperture NA ≈ 1: vacuum
wavelength λ = 633 nm, 300 nm transverse waist (half width at 1/e²), and 1.25 µm
longitudinal half width at 1/e². A circular polarization is chosen to simplify the numerical
simulations. This beam is simulated using the first-order Davis coefficients [25], the
translation-addition theorem acting on the incident beam coefficients is used to tune the
position d of the incident beam focus with respect to the sphere center [26].
(C) 2009 OSA 16 February 2009 / Vol. 17, No. 4 / OPTICS EXPRESS 2090#105481 - $15.00 USDReceived 19 Dec 2008; revised 27 Jan 2009; accepted 27 Jan 2009; published 2 Feb 2009
2. Three dimensional subwavelength confinement of light
Figure 1(a) presents the electric field intensity map when the incident beam focus is at the
position resulting in the optimal concentration of light and strongest field intensity,
denoted Imax, behind the sphere. This corresponds to setting the d parameter to 1.62 µm. In
this case, a central spot with subwavelength dimensions along the three spatial directions
is present close to the sphere surface. Its intensity is one order of magnitude higher than
the intensity in the other lobes (note the logarithmic scale in Fig. 1). The thin black line
represents the Imax/e² intensity contour, which is a useful guide when comparing the
intensity map with the microsphere (Fig. 1(a)) to the incident Gaussian beam without the
sphere (Fig. 1(b)).
Table 1 compares the transverse and longitudinal waist (radii) defined at Imax/e² and
denoted respectively wxy and wz for the incident beam and the beam focused by the
microsphere for d = 1.62 µm. Let us remark that with the add of the microsphere, the
longitudinal intensity distribution is no more symmetric with respect to the Imax position
and that the longitudinal waist is calculated outside the sphere, after the Imax position. The
incident field is further confined by the sphere both longitudinally and transversally. It is
apparent that the longitudinal modification of the beam is more spectacular since the
maximum intensity has both been enhanced and moved toward the sphere surface. The
effective volume behind the sphere defined by π3/2
wxy2wz/2 is reduced by one order of
magnitude, and is approximately 0.6 (λ/n)3. It must be stressed that this effect permits to
decrease by one order of magnitude the number of probed molecules in fluorescence
spectroscopy [23] and that this strong confinement of light is obtained with a very simple
structure. The volume reduction has been observed for various dielectric materials and
increases with the refractive index of the microsphere. It can be reduced down to 0.43
(λ/n)3 when the microsphere is made of melamine (refractive index of 1.68). But let us
point out that the ratio between refractive index of the microsphere ns and the surrounding
medium n has to be lower than 1.4 because for higher contrasts (ns>1.85 in aqueous
solution), the electromagnetic field is fully confined inside the dielectric sphere.
Table 1. Summary of the characteristics widths at Imax/e² corresponding to the intensity maps displayed
in Fig. 1. The volume is derived for the incident beam as V = π3/2 wxy2 wz, and for the focus by the
microsphere V = π3/2 wxy2 wz /2 (let us recall that only the beam exiting the microsphere is considered
here).
Incident beam Beam + microsphere Ratio to incident
beam
Transverse waist wxy 300 nm 230 nm 77 %
Longitudinal waist wz 1250 nm 420 nm 33 %
Effective volume V 0.6 µm3
≈ 6 (λ/n)3
0.06 µm3
≈ 0.6 (λ/n)3 10 %
In order to understand the physical mechanism of this confinement, we have
employed a simulation method that allows the calculation of the incident and scattered
field separately [24]. Figure 1(c) presents the map of the scattered field intensity. It shows
an elongated region with high intensity in the shadow side of the sphere. This scattered
field is very close to a classical “photonic nanojet” beam: it has both narrow lateral extent
and large longitudinal extent. Only the coherent sum of the incident beam plus the
scattered field is able to reach the strong confinement in the three directions (Fig.1(a))
which highlights the relation between interference and the subwavelength confinement.
(C) 2009 OSA 16 February 2009 / Vol. 17, No. 4 / OPTICS EXPRESS 2091#105481 - $15.00 USDReceived 19 Dec 2008; revised 27 Jan 2009; accepted 27 Jan 2009; published 2 Feb 2009
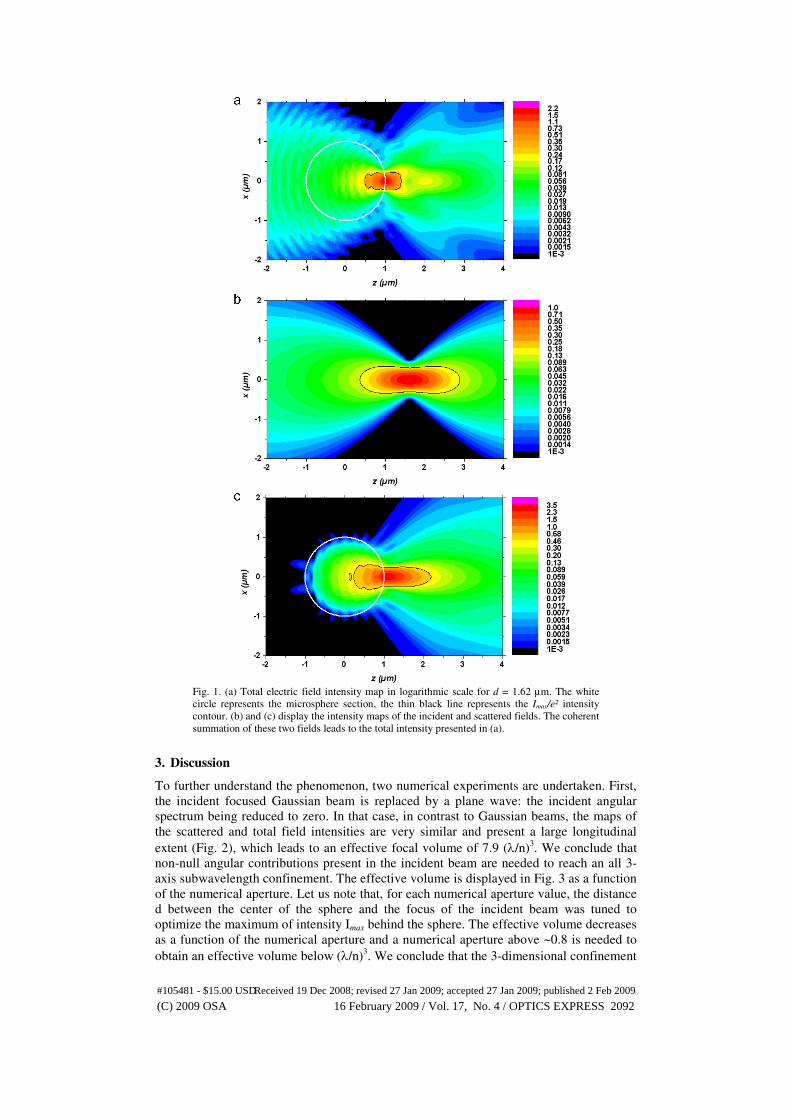
Fig. 1. (a) Total electric field intensity map in logarithmic scale for d = 1.62 µm. The white
circle represents the microsphere section, the thin black line represents the Imax/e² intensity
contour. (b) and (c) display the intensity maps of the incident and scattered fields. The coherent
summation of these two fields leads to the total intensity presented in (a).
3. Discussion
To further understand the phenomenon, two numerical experiments are undertaken. First,
the incident focused Gaussian beam is replaced by a plane wave: the incident angular
spectrum being reduced to zero. In that case, in contrast to Gaussian beams, the maps of
the scattered and total field intensities are very similar and present a large longitudinal
extent (Fig. 2), which leads to an effective focal volume of 7.9 (λ/n)3. We conclude that
non-null angular contributions present in the incident beam are needed to reach an all 3-
axis subwavelength confinement. The effective volume is displayed in Fig. 3 as a function
of the numerical aperture. Let us note that, for each numerical aperture value, the distance
d between the center of the sphere and the focus of the incident beam was tuned to
optimize the maximum of intensity Imax behind the sphere. The effective volume decreases
as a function of the numerical aperture and a numerical aperture above ~0.8 is needed to
obtain an effective volume below (λ/n)3. We conclude that the 3-dimensional confinement
(C) 2009 OSA 16 February 2009 / Vol. 17, No. 4 / OPTICS EXPRESS 2092#105481 - $15.00 USDReceived 19 Dec 2008; revised 27 Jan 2009; accepted 27 Jan 2009; published 2 Feb 2009
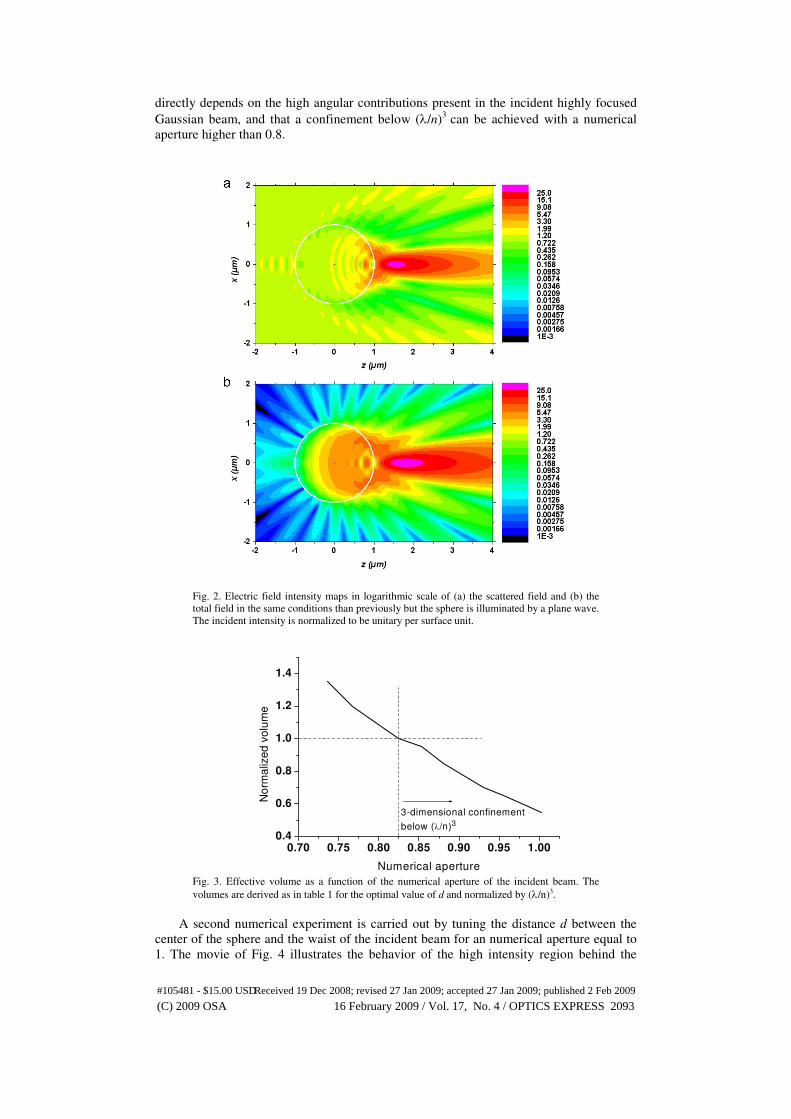
directly depends on the high angular contributions present in the incident highly focused
Gaussian beam, and that a confinement below (λ/n)3
can be achieved with a numerical
aperture higher than 0.8.
Fig. 2. Electric field intensity maps in logarithmic scale of (a) the scattered field and (b) the
total field in the same conditions than previously but the sphere is illuminated by a plane wave.
The incident intensity is normalized to be unitary per surface unit.
0.70 0.75 0.80 0.85 0.90 0.95 1.00
0.4
0.6
0.8
1.0
1.2
1.4
3-dimensional confinement
below (λ/n)3
No
rma
lize
d v
olu
me
Numerical aperture Fig. 3. Effective volume as a function of the numerical aperture of the incident beam. The
volumes are derived as in table 1 for the optimal value of d and normalized by (λ/n)3.
A second numerical experiment is carried out by tuning the distance d between the
center of the sphere and the waist of the incident beam for an numerical aperture equal to
1. The movie of Fig. 4 illustrates the behavior of the high intensity region behind the
(C) 2009 OSA 16 February 2009 / Vol. 17, No. 4 / OPTICS EXPRESS 2093#105481 - $15.00 USDReceived 19 Dec 2008; revised 27 Jan 2009; accepted 27 Jan 2009; published 2 Feb 2009
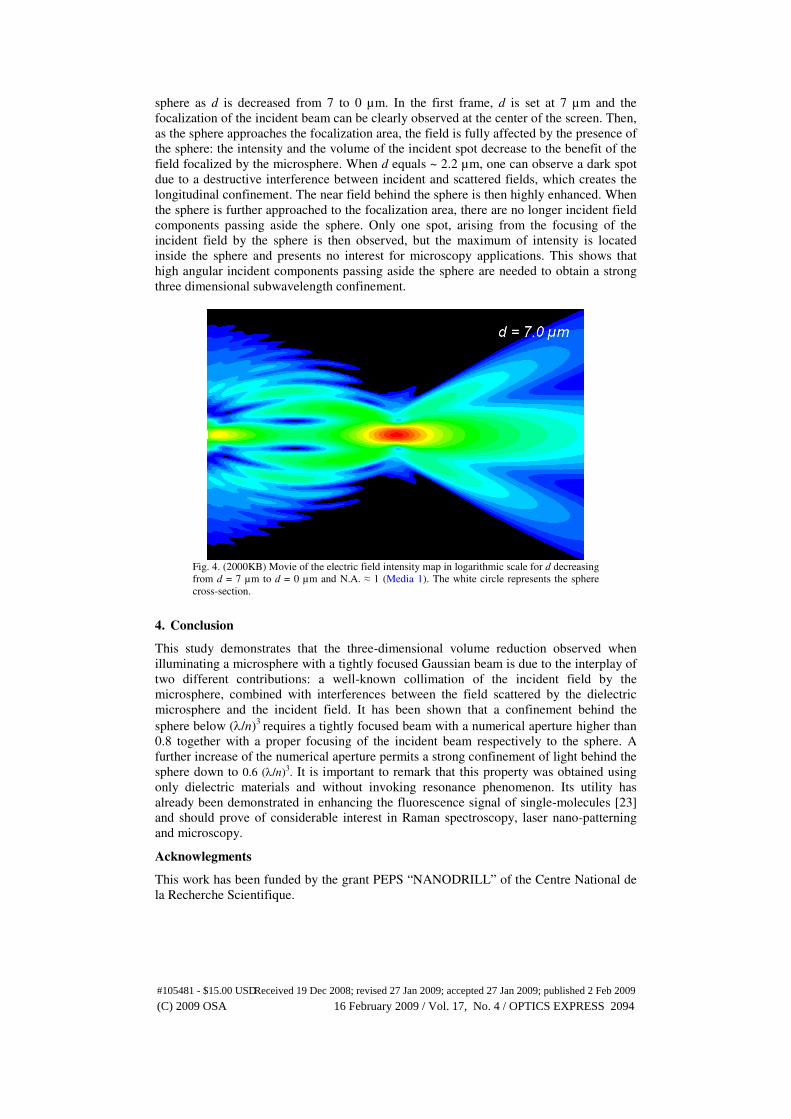
sphere as d is decreased from 7 to 0 µm. In the first frame, d is set at 7 µm and the
focalization of the incident beam can be clearly observed at the center of the screen. Then,
as the sphere approaches the focalization area, the field is fully affected by the presence of
the sphere: the intensity and the volume of the incident spot decrease to the benefit of the
field focalized by the microsphere. When d equals ~ 2.2 µm, one can observe a dark spot
due to a destructive interference between incident and scattered fields, which creates the
longitudinal confinement. The near field behind the sphere is then highly enhanced. When
the sphere is further approached to the focalization area, there are no longer incident field
components passing aside the sphere. Only one spot, arising from the focusing of the
incident field by the sphere is then observed, but the maximum of intensity is located
inside the sphere and presents no interest for microscopy applications. This shows that
high angular incident components passing aside the sphere are needed to obtain a strong
three dimensional subwavelength confinement.
Fig. 4. (2000KB) Movie of the electric field intensity map in logarithmic scale for d decreasing
from d = 7 µm to d = 0 µm and N.A. ≈ 1 (Media 1). The white circle represents the sphere
cross-section.
4. Conclusion
This study demonstrates that the three-dimensional volume reduction observed when
illuminating a microsphere with a tightly focused Gaussian beam is due to the interplay of
two different contributions: a well-known collimation of the incident field by the
microsphere, combined with interferences between the field scattered by the dielectric
microsphere and the incident field. It has been shown that a confinement behind the
sphere below (λ/n)3
requires a tightly focused beam with a numerical aperture higher than
0.8 together with a proper focusing of the incident beam respectively to the sphere. A
further increase of the numerical aperture permits a strong confinement of light behind the
sphere down to 0.6 (λ/n)3. It is important to remark that this property was obtained using
only dielectric materials and without invoking resonance phenomenon. Its utility has
already been demonstrated in enhancing the fluorescence signal of single-molecules [23]
and should prove of considerable interest in Raman spectroscopy, laser nano-patterning
and microscopy.
Acknowlegments
This work has been funded by the grant PEPS “NANODRILL” of the Centre National de
la Recherche Scientifique.
(C) 2009 OSA 16 February 2009 / Vol. 17, No. 4 / OPTICS EXPRESS 2094#105481 - $15.00 USDReceived 19 Dec 2008; revised 27 Jan 2009; accepted 27 Jan 2009; published 2 Feb 2009
Recommended