THIS REPORT CONTAINS ASSESSMENTS OF COMMODITY AND TRADE ISSUES MADE BY
USDA STAFF AND NOT NECESSARILY STATEMENTS OF OFFICIAL U.S. GOVERNMENT
POLICY
-
Date:
GAIN Report Number:
Post:
Report Categories:
Approved By:
Prepared By:
Report Highlights:
In 2014 the total fish catch in Lithuania was 150,000 MT, which included the long-distance, Baltic Sea,
and inland fisheries. Almost the entire fish catch from long-distance ocean fisheries and 85 percent of
the Baltic Sea catch was sold directly to foreign countries. Lithuania is a net exporter of fish and
seafood products in terms of value and net importer in terms of volume. Lithuanian processors import
95 percent of their raw materials and export value added products.
Piotr Rucinski, Agricultural Specialist
Russell J. Nicely, Agricultural Attaché
Fishery Products
Fish and seafood market in Lithuania.
Warsaw
Lithuania
12/4/2015
Public Voluntary
General Information:
Production
Fishing sector
In 2014 the total fish catch was 150,034 MT, which included the Baltic Sea, long-distance ocean and
inland fisheries. The fish catch in 2014 was 66 percent higher than in 2013 because of an increased
catch in long-distance ocean fisheries. Most of the fish catch in ocean is carried out in Mauritanian
waters (mostly pelagic species), followed by Senegalese waters, Moroccan waters and the Pacific Ocean
region. The total amount of catch from the long-distance fisheries amounted to 136,056 MT, an 82
percent increase compared to 2013 because of higher harvest of Mauritania, and from a return to the
Moroccan fishing grounds.
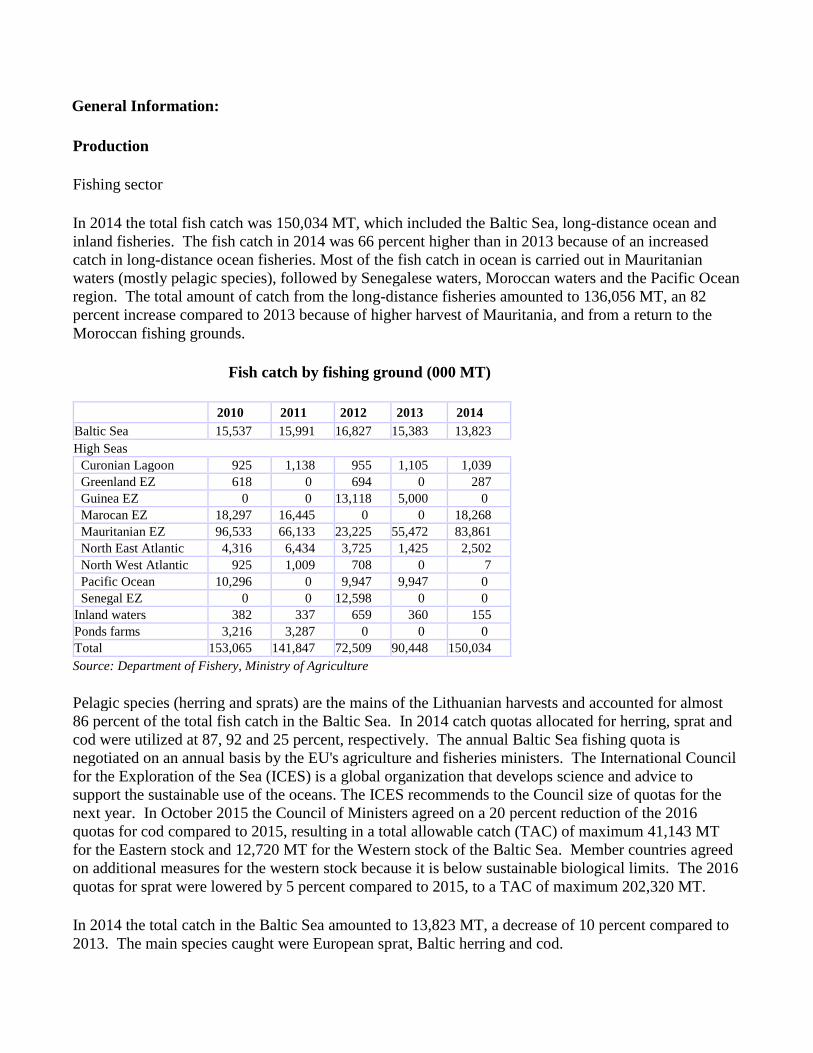
Fish catch by fishing ground (000 MT)
2010 2011 2012 2013 2014 Baltic Sea 15,537 15,991 16,827 15,383 13,823 High Seas
Curonian Lagoon 925 1,138 955 1,105 1,039 Greenland EZ 618 0 694 0 287 Guinea EZ 0 0 13,118 5,000 0 Marocan EZ 18,297 16,445 0 0 18,268 Mauritanian EZ 96,533 66,133 23,225 55,472 83,861 North East Atlantic 4,316 6,434 3,725 1,425 2,502 North West Atlantic 925 1,009 708 0 7 Pacific Ocean 10,296 0 9,947 9,947 0 Senegal EZ 0 0 12,598 0 0 Inland waters 382 337 659 360 155 Ponds farms 3,216 3,287 0 0 0 Total 153,065 141,847 72,509 90,448 150,034 Source: Department of Fishery, Ministry of Agriculture
Pelagic species (herring and sprats) are the mains of the Lithuanian harvests and accounted for almost
86 percent of the total fish catch in the Baltic Sea. In 2014 catch quotas allocated for herring, sprat and
cod were utilized at 87, 92 and 25 percent, respectively. The annual Baltic Sea fishing quota is
negotiated on an annual basis by the EU's agriculture and fisheries ministers. The International Council
for the Exploration of the Sea (ICES) is a global organization that develops science and advice to
support the sustainable use of the oceans. The ICES recommends to the Council size of quotas for the
next year. In October 2015 the Council of Ministers agreed on a 20 percent reduction of the 2016
quotas for cod compared to 2015, resulting in a total allowable catch (TAC) of maximum 41,143 MT
for the Eastern stock and 12,720 MT for the Western stock of the Baltic Sea. Member countries agreed
on additional measures for the western stock because it is below sustainable biological limits. The 2016
quotas for sprat were lowered by 5 percent compared to 2015, to a TAC of maximum 202,320 MT.
In 2014 the total catch in the Baltic Sea amounted to 13,823 MT, a decrease of 10 percent compared to
2013. The main species caught were European sprat, Baltic herring and cod.
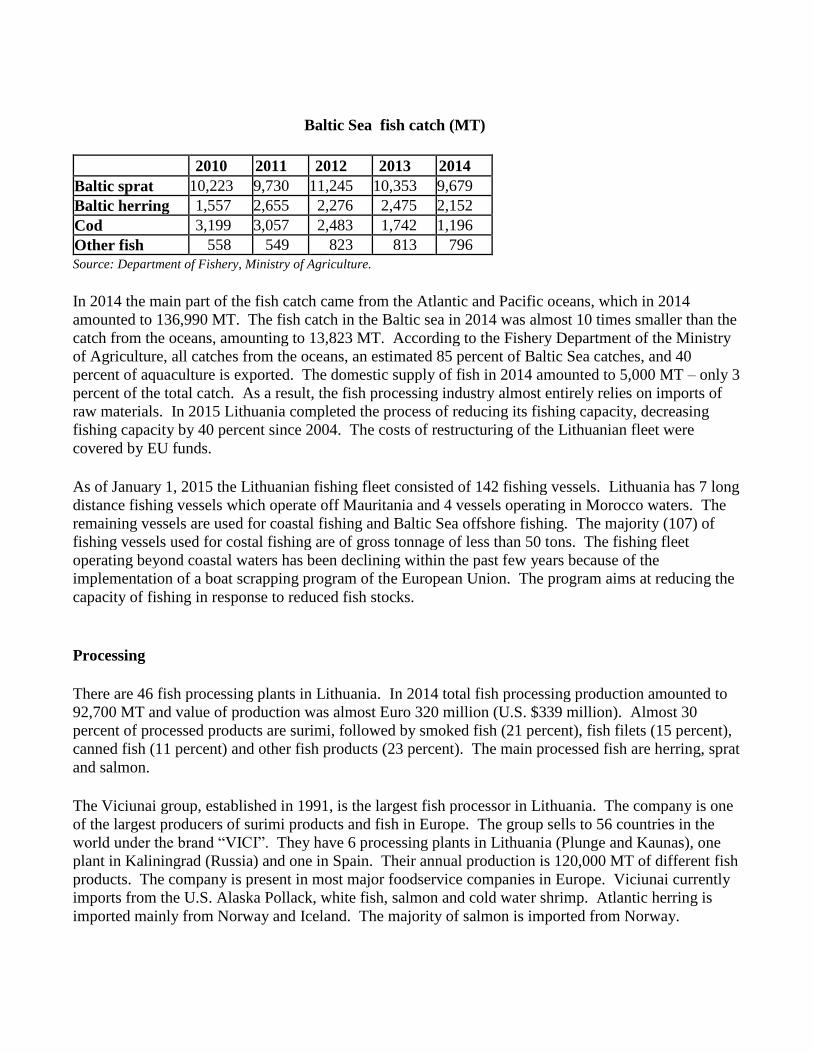
Baltic Sea fish catch (MT)
2010 2011 2012 2013 2014
Baltic sprat 10,223 9,730 11,245 10,353 9,679
Baltic herring 1,557 2,655 2,276 2,475 2,152
Cod 3,199 3,057 2,483 1,742 1,196
Other fish 558 549 823 813 796 Source: Department of Fishery, Ministry of Agriculture.
In 2014 the main part of the fish catch came from the Atlantic and Pacific oceans, which in 2014
amounted to 136,990 MT. The fish catch in the Baltic sea in 2014 was almost 10 times smaller than the
catch from the oceans, amounting to 13,823 MT. According to the Fishery Department of the Ministry
of Agriculture, all catches from the oceans, an estimated 85 percent of Baltic Sea catches, and 40
percent of aquaculture is exported. The domestic supply of fish in 2014 amounted to 5,000 MT – only 3
percent of the total catch. As a result, the fish processing industry almost entirely relies on imports of
raw materials. In 2015 Lithuania completed the process of reducing its fishing capacity, decreasing
fishing capacity by 40 percent since 2004. The costs of restructuring of the Lithuanian fleet were
covered by EU funds.
As of January 1, 2015 the Lithuanian fishing fleet consisted of 142 fishing vessels. Lithuania has 7 long
distance fishing vessels which operate off Mauritania and 4 vessels operating in Morocco waters. The
remaining vessels are used for coastal fishing and Baltic Sea offshore fishing. The majority (107) of
fishing vessels used for costal fishing are of gross tonnage of less than 50 tons. The fishing fleet
operating beyond coastal waters has been declining within the past few years because of the
implementation of a boat scrapping program of the European Union. The program aims at reducing the
capacity of fishing in response to reduced fish stocks.
Processing
There are 46 fish processing plants in Lithuania. In 2014 total fish processing production amounted to
92,700 MT and value of production was almost Euro 320 million (U.S. $339 million). Almost 30
percent of processed products are surimi, followed by smoked fish (21 percent), fish filets (15 percent),
canned fish (11 percent) and other fish products (23 percent). The main processed fish are herring, sprat
and salmon.
The Viciunai group, established in 1991, is the largest fish processor in Lithuania. The company is one
of the largest producers of surimi products and fish in Europe. The group sells to 56 countries in the
world under the brand “VICI”. They have 6 processing plants in Lithuania (Plunge and Kaunas), one
plant in Kaliningrad (Russia) and one in Spain. Their annual production is 120,000 MT of different fish
products. The company is present in most major foodservice companies in Europe. Viciunai currently
imports from the U.S. Alaska Pollack, white fish, salmon and cold water shrimp. Atlantic herring is
imported mainly from Norway and Iceland. The majority of salmon is imported from Norway.
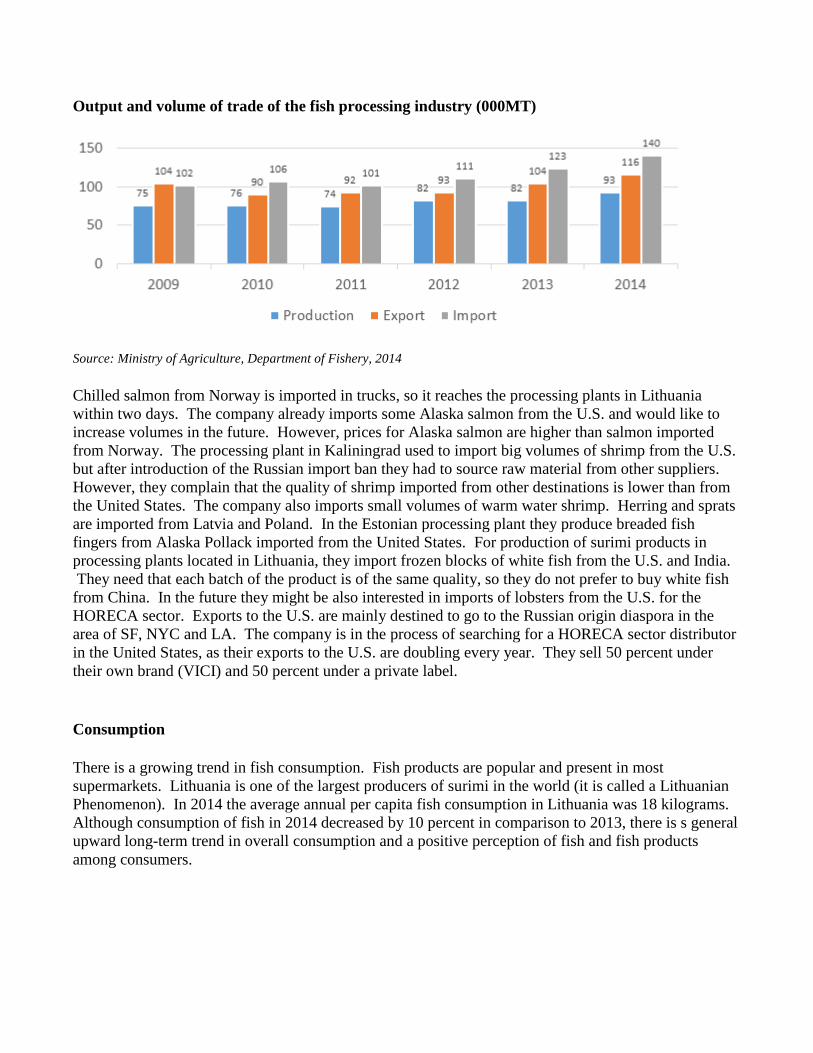
Output and volume of trade of the fish processing industry (000MT)
Source: Ministry of Agriculture, Department of Fishery, 2014
Chilled salmon from Norway is imported in trucks, so it reaches the processing plants in Lithuania
within two days. The company already imports some Alaska salmon from the U.S. and would like to
increase volumes in the future. However, prices for Alaska salmon are higher than salmon imported
from Norway. The processing plant in Kaliningrad used to import big volumes of shrimp from the U.S.
but after introduction of the Russian import ban they had to source raw material from other suppliers.
However, they complain that the quality of shrimp imported from other destinations is lower than from
the United States. The company also imports small volumes of warm water shrimp. Herring and sprats
are imported from Latvia and Poland. In the Estonian processing plant they produce breaded fish
fingers from Alaska Pollack imported from the United States. For production of surimi products in
processing plants located in Lithuania, they import frozen blocks of white fish from the U.S. and India.
They need that each batch of the product is of the same quality, so they do not prefer to buy white fish
from China. In the future they might be also interested in imports of lobsters from the U.S. for the
HORECA sector. Exports to the U.S. are mainly destined to go to the Russian origin diaspora in the
area of SF, NYC and LA. The company is in the process of searching for a HORECA sector distributor
in the United States, as their exports to the U.S. are doubling every year. They sell 50 percent under
their own brand (VICI) and 50 percent under a private label.
Consumption
There is a growing trend in fish consumption. Fish products are popular and present in most
supermarkets. Lithuania is one of the largest producers of surimi in the world (it is called a Lithuanian
Phenomenon). In 2014 the average annual per capita fish consumption in Lithuania was 18 kilograms.
Although consumption of fish in 2014 decreased by 10 percent in comparison to 2013, there is s general
upward long-term trend in overall consumption and a positive perception of fish and fish products
among consumers.
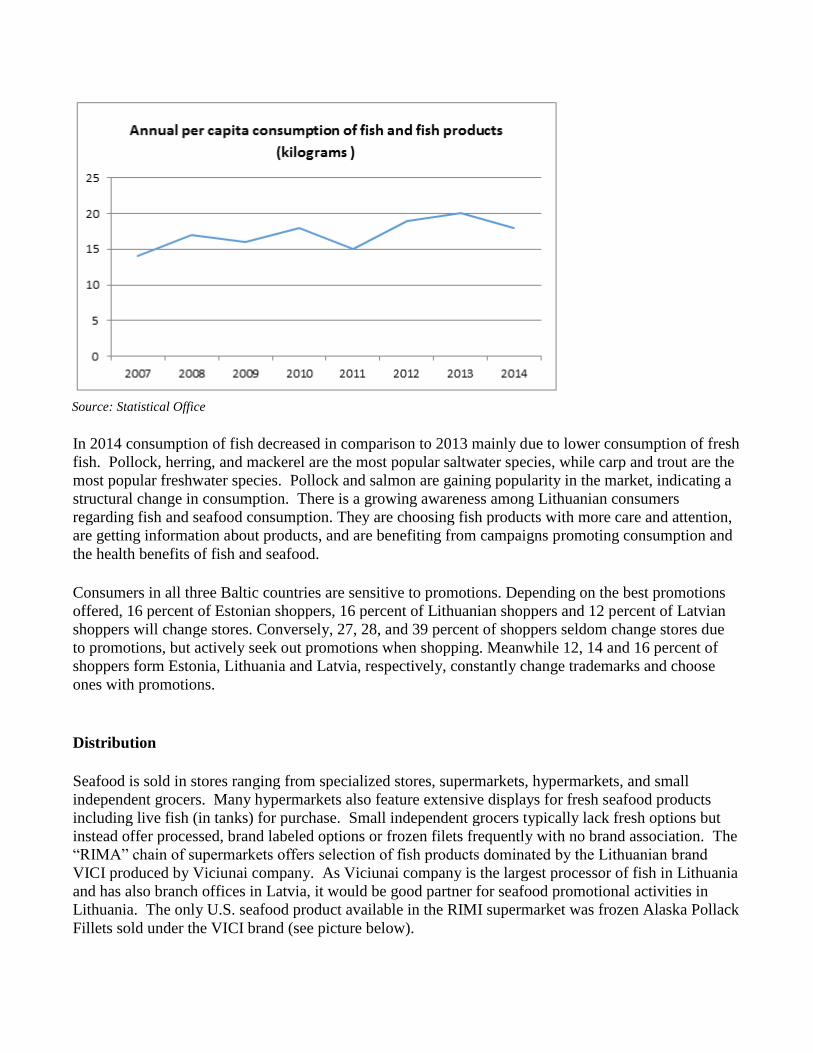
Source: Statistical Office
In 2014 consumption of fish decreased in comparison to 2013 mainly due to lower consumption of fresh
fish. Pollock, herring, and mackerel are the most popular saltwater species, while carp and trout are the
most popular freshwater species. Pollock and salmon are gaining popularity in the market, indicating a
structural change in consumption. There is a growing awareness among Lithuanian consumers
regarding fish and seafood consumption. They are choosing fish products with more care and attention,
are getting information about products, and are benefiting from campaigns promoting consumption and
the health benefits of fish and seafood.
Consumers in all three Baltic countries are sensitive to promotions. Depending on the best promotions
offered, 16 percent of Estonian shoppers, 16 percent of Lithuanian shoppers and 12 percent of Latvian
shoppers will change stores. Conversely, 27, 28, and 39 percent of shoppers seldom change stores due
to promotions, but actively seek out promotions when shopping. Meanwhile 12, 14 and 16 percent of
shoppers form Estonia, Lithuania and Latvia, respectively, constantly change trademarks and choose
ones with promotions.
Distribution
Seafood is sold in stores ranging from specialized stores, supermarkets, hypermarkets, and small
independent grocers. Many hypermarkets also feature extensive displays for fresh seafood products
including live fish (in tanks) for purchase. Small independent grocers typically lack fresh options but
instead offer processed, brand labeled options or frozen filets frequently with no brand association. The
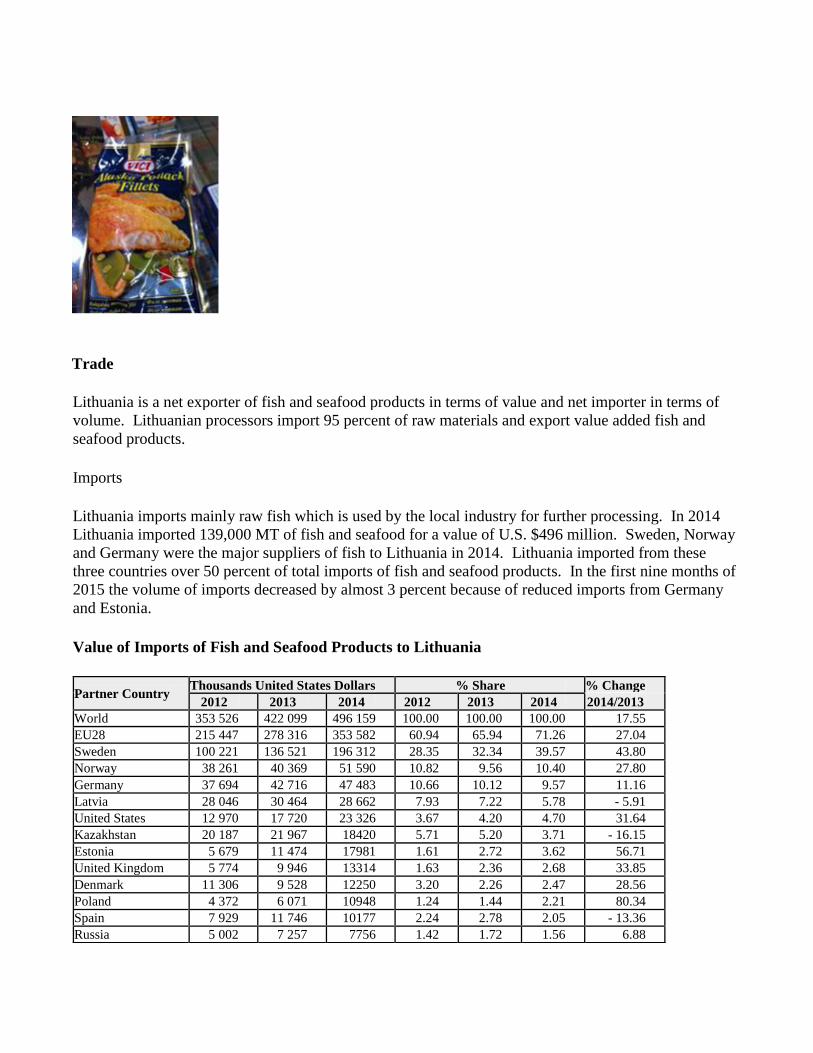
“RIMA” chain of supermarkets offers selection of fish products dominated by the Lithuanian brand
VICI produced by Viciunai company. As Viciunai company is the largest processor of fish in Lithuania
and has also branch offices in Latvia, it would be good partner for seafood promotional activities in
Lithuania. The only U.S. seafood product available in the RIMI supermarket was frozen Alaska Pollack
Fillets sold under the VICI brand (see picture below).
Trade
Lithuania is a net exporter of fish and seafood products in terms of value and net importer in terms of
volume. Lithuanian processors import 95 percent of raw materials and export value added fish and
seafood products.
Imports
Lithuania imports mainly raw fish which is used by the local industry for further processing. In 2014
Lithuania imported 139,000 MT of fish and seafood for a value of U.S. $496 million. Sweden, Norway
and Germany were the major suppliers of fish to Lithuania in 2014. Lithuania imported from these
three countries over 50 percent of total imports of fish and seafood products. In the first nine months of
2015 the volume of imports decreased by almost 3 percent because of reduced imports from Germany
and Estonia.
Value of Imports of Fish and Seafood Products to Lithuania
Partner Country Thousands United States Dollars % Share % Change
2012 2013 2014 2012 2013 2014 2014/2013 World 353 526 422 099 496 159 100.00 100.00 100.00 17.55 EU28 215 447 278 316 353 582 60.94 65.94 71.26 27.04 Sweden 100 221 136 521 196 312 28.35 32.34 39.57 43.80 Norway 38 261 40 369 51 590 10.82 9.56 10.40 27.80 Germany 37 694 42 716 47 483 10.66 10.12 9.57 11.16 Latvia 28 046 30 464 28 662 7.93 7.22 5.78 - 5.91 United States 12 970 17 720 23 326 3.67 4.20 4.70 31.64 Kazakhstan 20 187 21 967 18420 5.71 5.20 3.71 - 16.15 Estonia 5 679 11 474 17981 1.61 2.72 3.62 56.71 United Kingdom 5 774 9 946 13314 1.63 2.36 2.68 33.85 Denmark 11 306 9 528 12250 3.20 2.26 2.47 28.56 Poland 4 372 6 071 10948 1.24 1.44 2.21 80.34 Spain 7 929 11 746 10177 2.24 2.78 2.05 - 13.36 Russia 5 002 7 257 7756 1.42 1.72 1.56 6.88
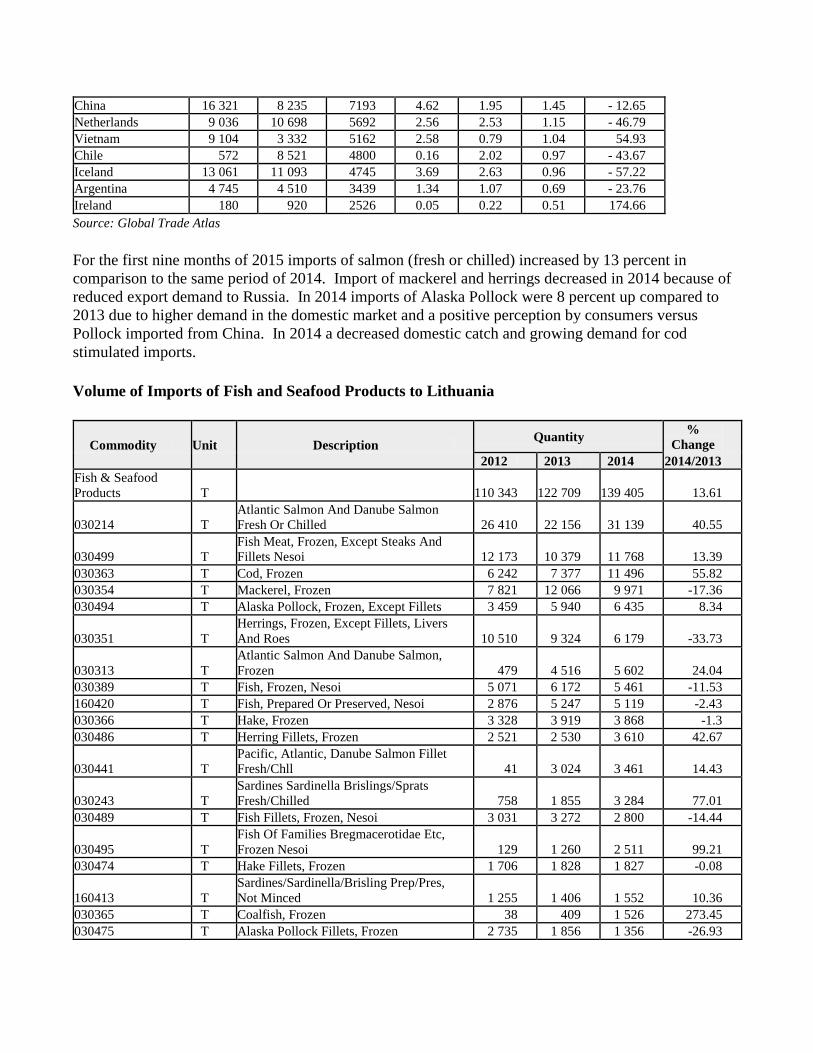
China 16 321 8 235 7193 4.62 1.95 1.45 - 12.65 Netherlands 9 036 10 698 5692 2.56 2.53 1.15 - 46.79 Vietnam 9 104 3 332 5162 2.58 0.79 1.04 54.93 Chile 572 8 521 4800 0.16 2.02 0.97 - 43.67 Iceland 13 061 11 093 4745 3.69 2.63 0.96 - 57.22 Argentina 4 745 4 510 3439 1.34 1.07 0.69 - 23.76 Ireland 180 920 2526 0.05 0.22 0.51 174.66 Source: Global Trade Atlas
For the first nine months of 2015 imports of salmon (fresh or chilled) increased by 13 percent in
comparison to the same period of 2014. Import of mackerel and herrings decreased in 2014 because of
reduced export demand to Russia. In 2014 imports of Alaska Pollock were 8 percent up compared to
2013 due to higher demand in the domestic market and a positive perception by consumers versus
Pollock imported from China. In 2014 a decreased domestic catch and growing demand for cod
stimulated imports.
Volume of Imports of Fish and Seafood Products to Lithuania
Commodity Unit Description Quantity %
Change 2012 2013 2014 2014/2013
Fish & Seafood
Products T 110 343 122 709 139 405 13.61
030214 T Atlantic Salmon And Danube Salmon
Fresh Or Chilled 26 410 22 156 31 139 40.55
030499 T Fish Meat, Frozen, Except Steaks And
Fillets Nesoi 12 173 10 379 11 768 13.39 030363 T Cod, Frozen 6 242 7 377 11 496 55.82 030354 T Mackerel, Frozen 7 821 12 066 9 971 -17.36 030494 T Alaska Pollock, Frozen, Except Fillets 3 459 5 940 6 435 8.34
030351 T Herrings, Frozen, Except Fillets, Livers
And Roes 10 510 9 324 6 179 -33.73
030313 T Atlantic Salmon And Danube Salmon,
Frozen 479 4 516 5 602 24.04 030389 T Fish, Frozen, Nesoi 5 071 6 172 5 461 -11.53 160420 T Fish, Prepared Or Preserved, Nesoi 2 876 5 247 5 119 -2.43 030366 T Hake, Frozen 3 328 3 919 3 868 -1.3 030486 T Herring Fillets, Frozen 2 521 2 530 3 610 42.67
030441 T Pacific, Atlantic, Danube Salmon Fillet
Fresh/Chll 41 3 024 3 461 14.43
030243 T Sardines Sardinella Brislings/Sprats
Fresh/Chilled 758 1 855 3 284 77.01 030489 T Fish Fillets, Frozen, Nesoi 3 031 3 272 2 800 -14.44
030495 T Fish Of Families Bregmacerotidae Etc,
Frozen Nesoi 129 1 260 2 511 99.21 030474 T Hake Fillets, Frozen 1 706 1 828 1 827 -0.08
160413 T Sardines/Sardinella/Brisling Prep/Pres,
Not Minced 1 255 1 406 1 552 10.36 030365 T Coalfish, Frozen 38 409 1 526 273.45 030475 T Alaska Pollock Fillets, Frozen 2 735 1 856 1 356 -26.93
030353 T Sardines, Sardinella, Brisling Or Sprats,
Frozen 3 227 1 507 1 190 -21.02
030561 T Herrings, Salted, Or In Brine, Not Dry
Or Smoked 997 1 415 1 175 -16.94 030471 T Cod Fillets, Frozen 1 281 806 1 154 43.23
160419 T Fish, Prepared Or Preserved, Whole Or
Pieces Nesoi 575 1 209 1 090 -9.87
030211 T Trout (Salmo Trutta, Etc) Fresh,
Chilled, Nesoi 1 459 1 022 1 044 2.16
160414 T Tunas/Skipjack/Bonito Prep/Pres Not
Minced 864 1 140 1 028 -9.81
030369 T Fish Bregmacerotidae Euclichthyidae
Etc Frzn Nesoi 234 454 1 015 123.61 030462 T Catfish Fillets, Frozen 1 002 1 031 967 -6.22
030452 T Salmonidae Meat Fresh/Chilled Exc
Fillets & Steaks 2 148 817 451.92
030259 T Fish Of Fam Bregmacerotidae Etc
Fresh/Chilld Nesoi 315 229 817 256.59 030251 T Cod, Fresh Or Chilled 2 697 493 659 33.81 Source: Global Trade Atlas
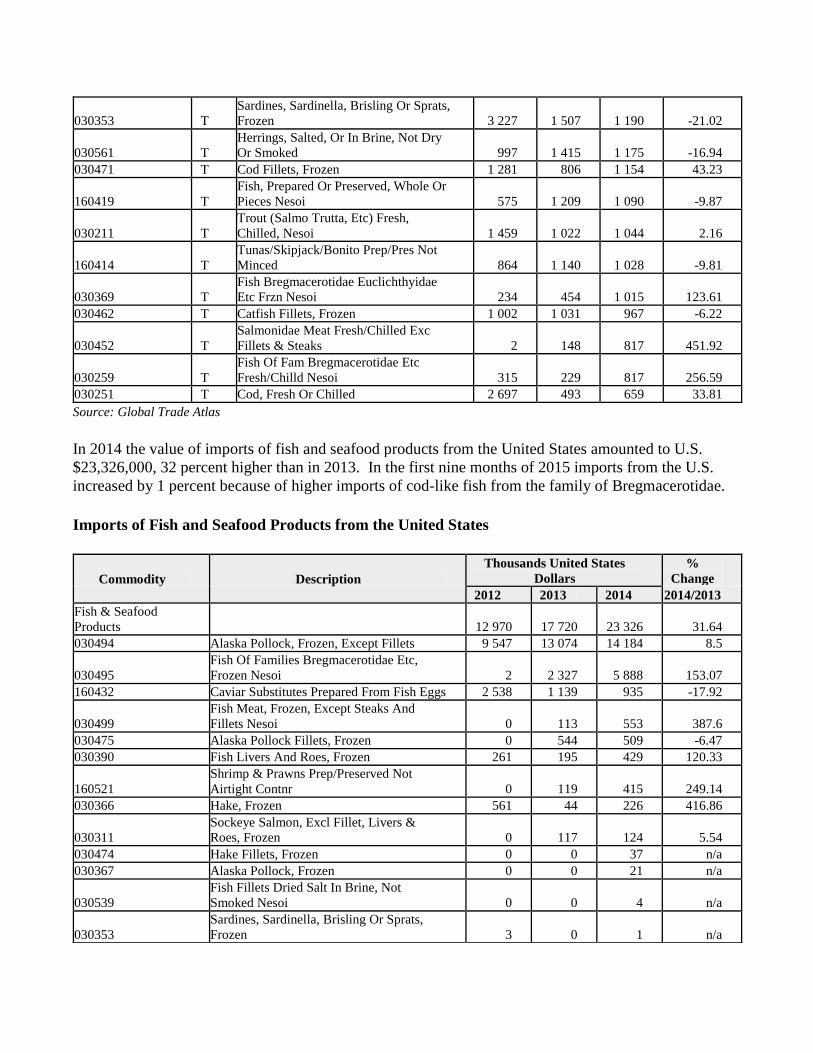
In 2014 the value of imports of fish and seafood products from the United States amounted to U.S.
$23,326,000, 32 percent higher than in 2013. In the first nine months of 2015 imports from the U.S.
increased by 1 percent because of higher imports of cod-like fish from the family of Bregmacerotidae.
Imports of Fish and Seafood Products from the United States
Commodity Description Thousands United States
Dollars %
Change 2012 2013 2014 2014/2013
Fish & Seafood
Products 12 970 17 720 23 326 31.64 030494 Alaska Pollock, Frozen, Except Fillets 9 547 13 074 14 184 8.5
030495 Fish Of Families Bregmacerotidae Etc,
Frozen Nesoi 2 2 327 5 888 153.07 160432 Caviar Substitutes Prepared From Fish Eggs 2 538 1 139 935 -17.92
030499 Fish Meat, Frozen, Except Steaks And
Fillets Nesoi 0 113 553 387.6 030475 Alaska Pollock Fillets, Frozen 0 544 509 -6.47 030390 Fish Livers And Roes, Frozen 261 195 429 120.33
160521 Shrimp & Prawns Prep/Preserved Not
Airtight Contnr 0 119 415 249.14 030366 Hake, Frozen 561 44 226 416.86
030311 Sockeye Salmon, Excl Fillet, Livers &
Roes, Frozen 0 117 124 5.54 030474 Hake Fillets, Frozen 0 0 37 n/a 030367 Alaska Pollock, Frozen 0 0 21 n/a
030539 Fish Fillets Dried Salt In Brine, Not
Smoked Nesoi 0 0 4 n/a
030353 Sardines, Sardinella, Brisling Or Sprats,
Frozen 3 0 1 n/a
030363 Cod, Frozen 58 0 0 n/a
030339 Flat Fish Nesoi Except Fillets, Livers, Roes,
Frz 0 0 0 -100
030351 Herrings, Frozen, Except Fillets, Livers
And Roes 0 48 0 -100 Source of Data: Eurostat
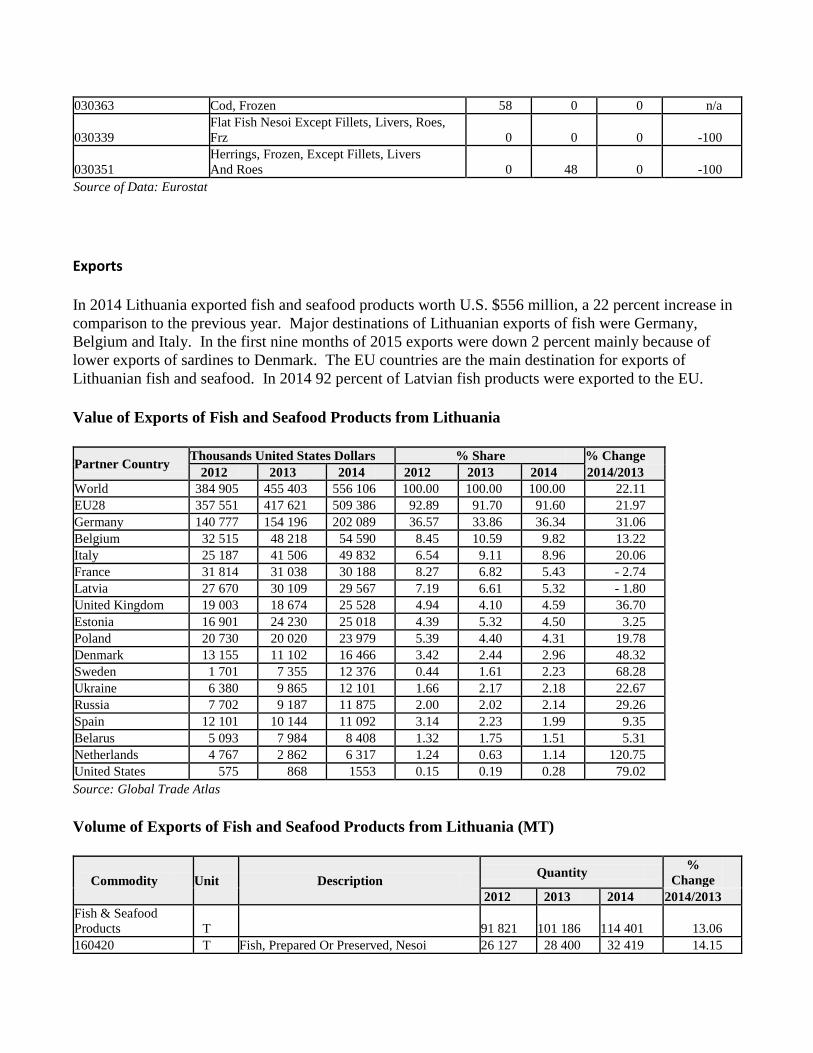
Exports
In 2014 Lithuania exported fish and seafood products worth U.S. $556 million, a 22 percent increase in
comparison to the previous year. Major destinations of Lithuanian exports of fish were Germany,
Belgium and Italy. In the first nine months of 2015 exports were down 2 percent mainly because of
lower exports of sardines to Denmark. The EU countries are the main destination for exports of
Lithuanian fish and seafood. In 2014 92 percent of Latvian fish products were exported to the EU.
Value of Exports of Fish and Seafood Products from Lithuania
Partner Country Thousands United States Dollars % Share % Change
2012 2013 2014 2012 2013 2014 2014/2013 World 384 905 455 403 556 106 100.00 100.00 100.00 22.11 EU28 357 551 417 621 509 386 92.89 91.70 91.60 21.97 Germany 140 777 154 196 202 089 36.57 33.86 36.34 31.06 Belgium 32 515 48 218 54 590 8.45 10.59 9.82 13.22 Italy 25 187 41 506 49 832 6.54 9.11 8.96 20.06 France 31 814 31 038 30 188 8.27 6.82 5.43 - 2.74 Latvia 27 670 30 109 29 567 7.19 6.61 5.32 - 1.80 United Kingdom 19 003 18 674 25 528 4.94 4.10 4.59 36.70 Estonia 16 901 24 230 25 018 4.39 5.32 4.50 3.25 Poland 20 730 20 020 23 979 5.39 4.40 4.31 19.78 Denmark 13 155 11 102 16 466 3.42 2.44 2.96 48.32 Sweden 1 701 7 355 12 376 0.44 1.61 2.23 68.28 Ukraine 6 380 9 865 12 101 1.66 2.17 2.18 22.67 Russia 7 702 9 187 11 875 2.00 2.02 2.14 29.26 Spain 12 101 10 144 11 092 3.14 2.23 1.99 9.35 Belarus 5 093 7 984 8 408 1.32 1.75 1.51 5.31 Netherlands 4 767 2 862 6 317 1.24 0.63 1.14 120.75 United States 575 868 1553 0.15 0.19 0.28 79.02 Source: Global Trade Atlas
Volume of Exports of Fish and Seafood Products from Lithuania (MT)
Commodity Unit Description Quantity %
Change 2012 2013 2014 2014/2013
Fish & Seafood
Products T 91 821 101 186 114 401 13.06 160420 T Fish, Prepared Or Preserved, Nesoi 26 127 28 400 32 419 14.15
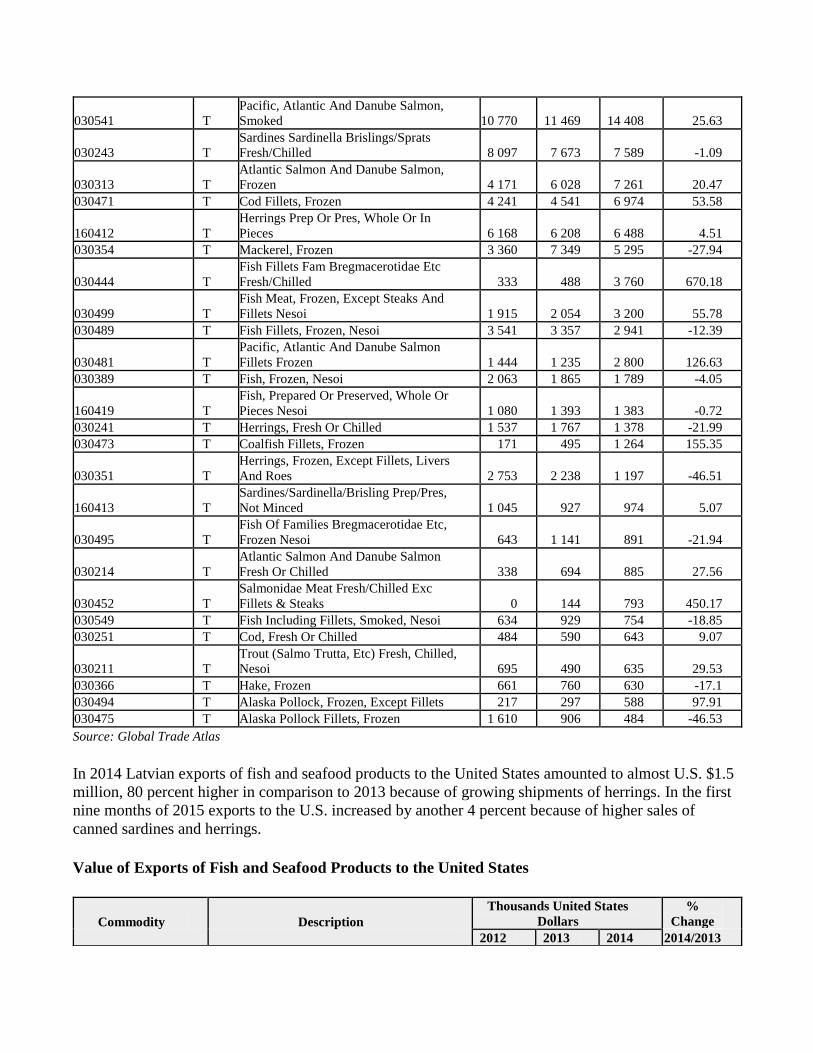
030541 T Pacific, Atlantic And Danube Salmon,
Smoked 10 770 11 469 14 408 25.63
030243 T Sardines Sardinella Brislings/Sprats
Fresh/Chilled 8 097 7 673 7 589 -1.09
030313 T Atlantic Salmon And Danube Salmon,
Frozen 4 171 6 028 7 261 20.47 030471 T Cod Fillets, Frozen 4 241 4 541 6 974 53.58
160412 T Herrings Prep Or Pres, Whole Or In
Pieces 6 168 6 208 6 488 4.51 030354 T Mackerel, Frozen 3 360 7 349 5 295 -27.94
030444 T Fish Fillets Fam Bregmacerotidae Etc
Fresh/Chilled 333 488 3 760 670.18
030499 T Fish Meat, Frozen, Except Steaks And
Fillets Nesoi 1 915 2 054 3 200 55.78 030489 T Fish Fillets, Frozen, Nesoi 3 541 3 357 2 941 -12.39
030481 T Pacific, Atlantic And Danube Salmon
Fillets Frozen 1 444 1 235 2 800 126.63 030389 T Fish, Frozen, Nesoi 2 063 1 865 1 789 -4.05
160419 T Fish, Prepared Or Preserved, Whole Or
Pieces Nesoi 1 080 1 393 1 383 -0.72 030241 T Herrings, Fresh Or Chilled 1 537 1 767 1 378 -21.99 030473 T Coalfish Fillets, Frozen 171 495 1 264 155.35
030351 T Herrings, Frozen, Except Fillets, Livers
And Roes 2 753 2 238 1 197 -46.51
160413 T Sardines/Sardinella/Brisling Prep/Pres,
Not Minced 1 045 927 974 5.07
030495 T Fish Of Families Bregmacerotidae Etc,
Frozen Nesoi 643 1 141 891 -21.94
030214 T Atlantic Salmon And Danube Salmon
Fresh Or Chilled 338 694 885 27.56
030452 T Salmonidae Meat Fresh/Chilled Exc
Fillets & Steaks 0 144 793 450.17 030549 T Fish Including Fillets, Smoked, Nesoi 634 929 754 -18.85 030251 T Cod, Fresh Or Chilled 484 590 643 9.07
030211 T Trout (Salmo Trutta, Etc) Fresh, Chilled,
Nesoi 695 490 635 29.53 030366 T Hake, Frozen 661 760 630 -17.1 030494 T Alaska Pollock, Frozen, Except Fillets 217 297 588 97.91 030475 T Alaska Pollock Fillets, Frozen 1 610 906 484 -46.53 Source: Global Trade Atlas
In 2014 Latvian exports of fish and seafood products to the United States amounted to almost U.S. $1.5
million, 80 percent higher in comparison to 2013 because of growing shipments of herrings. In the first
nine months of 2015 exports to the U.S. increased by another 4 percent because of higher sales of
canned sardines and herrings.
Value of Exports of Fish and Seafood Products to the United States
Commodity Description Thousands United States
Dollars %
Change 2012 2013 2014 2014/2013
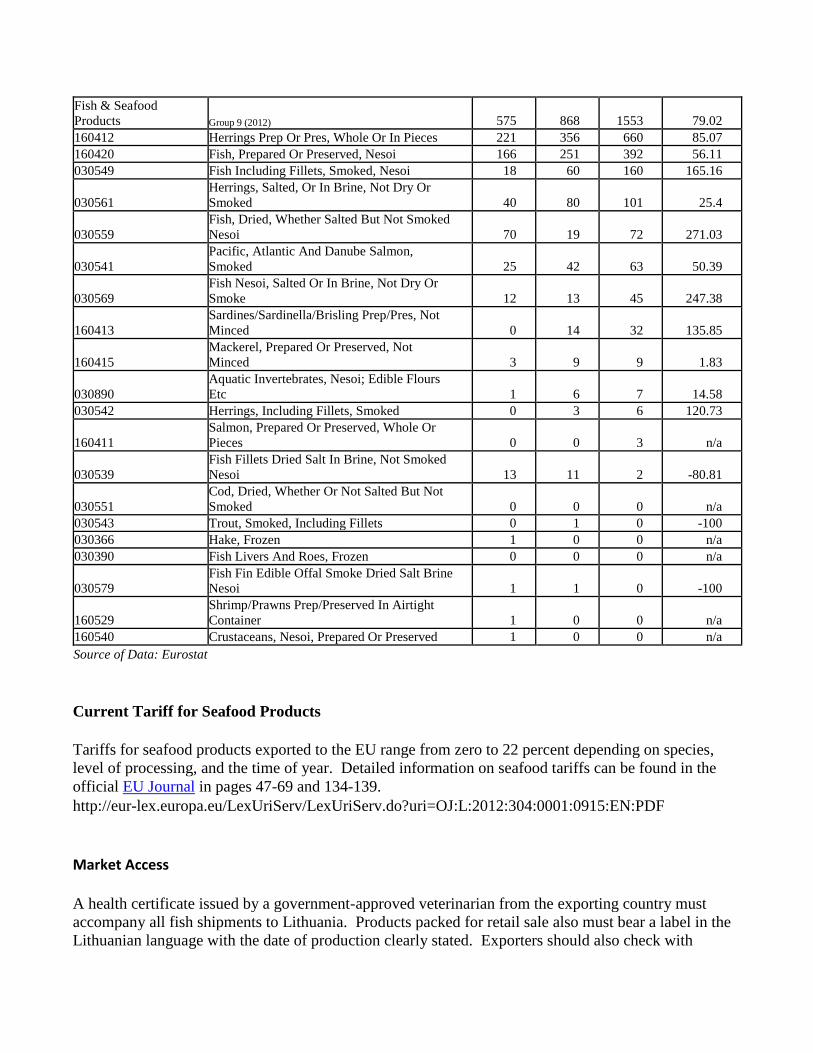
Fish & Seafood
Products Group 9 (2012) 575 868 1553 79.02 160412 Herrings Prep Or Pres, Whole Or In Pieces 221 356 660 85.07 160420 Fish, Prepared Or Preserved, Nesoi 166 251 392 56.11 030549 Fish Including Fillets, Smoked, Nesoi 18 60 160 165.16
030561 Herrings, Salted, Or In Brine, Not Dry Or
Smoked 40 80 101 25.4
030559 Fish, Dried, Whether Salted But Not Smoked
Nesoi 70 19 72 271.03
030541 Pacific, Atlantic And Danube Salmon,
Smoked 25 42 63 50.39
030569 Fish Nesoi, Salted Or In Brine, Not Dry Or
Smoke 12 13 45 247.38
160413 Sardines/Sardinella/Brisling Prep/Pres, Not
Minced 0 14 32 135.85
160415 Mackerel, Prepared Or Preserved, Not
Minced 3 9 9 1.83
030890 Aquatic Invertebrates, Nesoi; Edible Flours
Etc 1 6 7 14.58 030542 Herrings, Including Fillets, Smoked 0 3 6 120.73
160411 Salmon, Prepared Or Preserved, Whole Or
Pieces 0 0 3 n/a
030539 Fish Fillets Dried Salt In Brine, Not Smoked
Nesoi 13 11 2 -80.81
030551 Cod, Dried, Whether Or Not Salted But Not
Smoked 0 0 0 n/a 030543 Trout, Smoked, Including Fillets 0 1 0 -100 030366 Hake, Frozen 1 0 0 n/a 030390 Fish Livers And Roes, Frozen 0 0 0 n/a
030579 Fish Fin Edible Offal Smoke Dried Salt Brine
Nesoi 1 1 0 -100
160529 Shrimp/Prawns Prep/Preserved In Airtight
Container 1 0 0 n/a 160540 Crustaceans, Nesoi, Prepared Or Preserved 1 0 0 n/a Source of Data: Eurostat
Current Tariff for Seafood Products
Tariffs for seafood products exported to the EU range from zero to 22 percent depending on species,
level of processing, and the time of year. Detailed information on seafood tariffs can be found in the
official EU Journal in pages 47-69 and 134-139.
http://eur-lex.europa.eu/LexUriServ/LexUriServ.do?uri=OJ:L:2012:304:0001:0915:EN:PDF
Market Access
A health certificate issued by a government-approved veterinarian from the exporting country must
accompany all fish shipments to Lithuania. Products packed for retail sale also must bear a label in the
Lithuanian language with the date of production clearly stated. Exporters should also check with
Lithuanian importers regarding standards.
For guidelines regarding seafood exports to Lithuania and the EU in general, information is available
from the National Oceanic and Atmospheric Association, NOAA.
http://www.seafood.nmfs.noaa.gov/Howtoexportseafood2013.pdf
Market Entry Strategy
Trade missions coordinated through industry/export organizations as well as participation in trade
shows such as the annual European Seafood Exposition in Brussels are important in gaining knowledge
about the market structure, consumer preferences and building contacts with importers. The Fishery
Department of the Ministry of Agriculture may also be a partner in a generic promotion of fish
products.
U.S. exporters of seafood products may also obtain a list of current importers by contacting the Office
of Agricultural Affairs of the U.S. Embassy in Warsaw.
Trade Shows and Contact
European Seafood Exposition, Brussels, Belgium
April 26-28, 2016
http://www.polfishfair.pl
For more information concerning market entry and a current importer list contact:
Office of Agricultural Affairs, Warsaw, Poland
Embassy of the United States of America
Mr. Piotr Rucinski
E-mail: [email protected]
Tel: (48-22) 504 2349
End of Report.
Recommended