THIS
IS 5th Math

With
Host at
Your
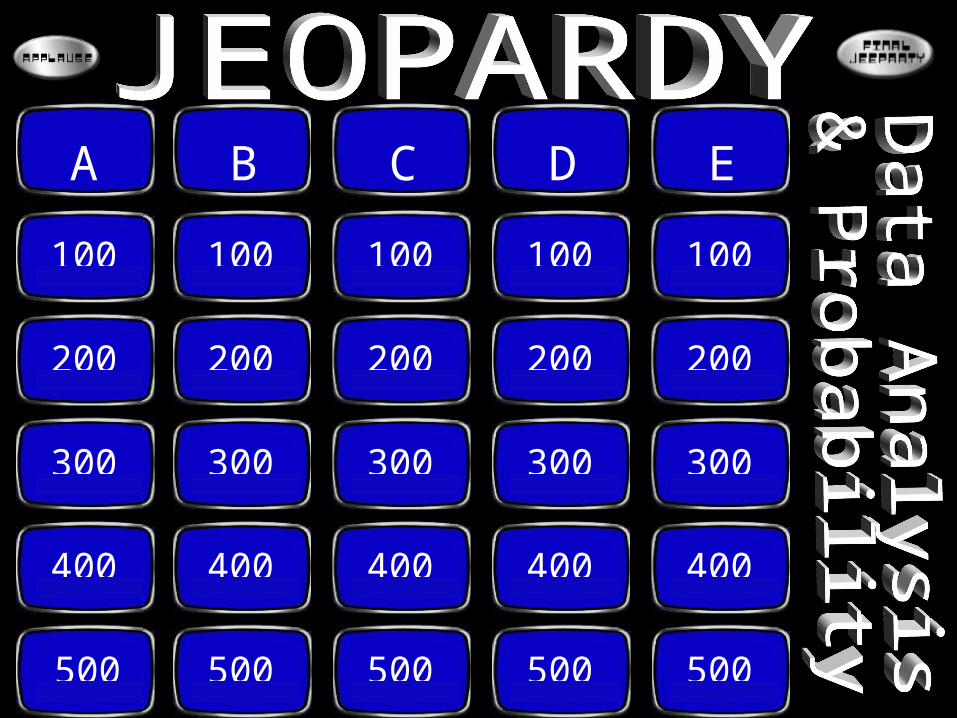
100 100 100 100 100
200 200 200 200 200
300 300 300 300 300
400 400 400 400 400
500 500 500 500 500
A B C D E
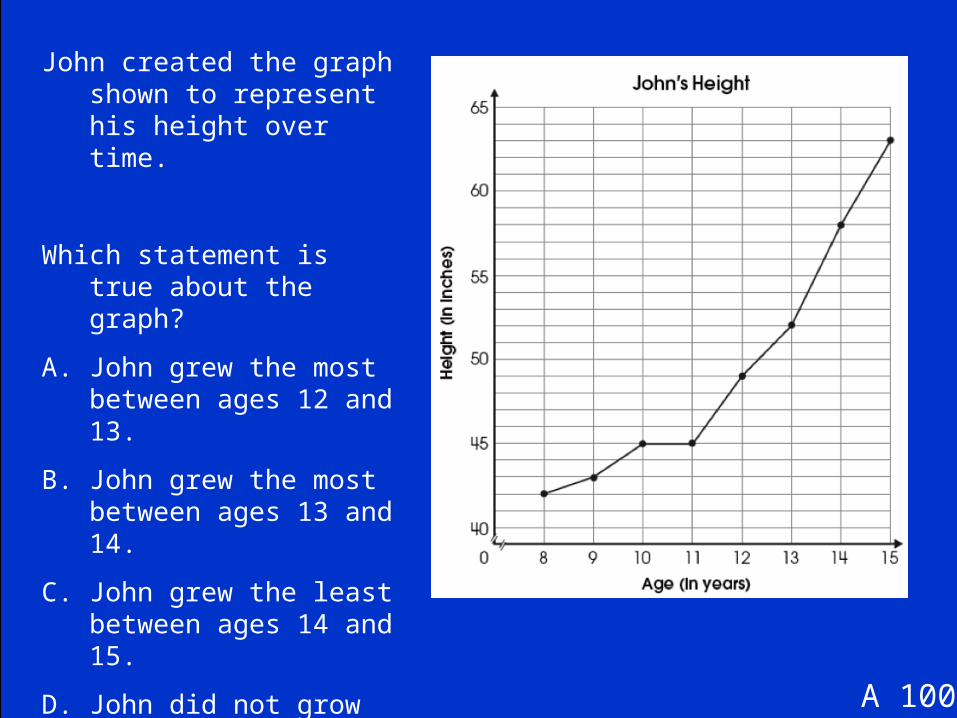
John created the graph shown to represent his height over time.
Which statement is true about the graph?
A. John grew the most between ages 12 and 13.
B. John grew the most between ages 13 and 14.
C. John grew the least between ages 14 and 15.
D. John did not grow at all between ages 9 and 10.
A 100

B. John grew the most between ages 13 and 14.
A 100

Shelly recorded the amount of time she spent waiting at the bus stop on several days over two weeks.
How much more time did Shelly spend waiting at the bus stop during Week 1 than Week 2?
A. Shelly waited the same amount of time in both weeks.
B. Shelly waited 3 more minutes in Week 1.
C. Shelly waited 6 more minutes in Week 1.
D. Shelly waited 9 more minutes in Week 1.
A 200

D. Shelly waited 9 more minutes in Week 1.
A 200

Mr. Reid wants to know which dessert the students in his class like best.
Which data would NOT be shown in a graph of desserts the students like?
A.The price of the desserts.
B.The dessert students like best.
C.The number of students surveyed.
D.The desserts students like second best.
A 300

A. The price of the desserts.
A 300

Jim created a table of the different types of music in his CD collection.
He started to create the circle graph shown to represent these data.
What types of music does the shaded section represent?
A. Rock
B. Oldies
C. Country
D. ClassicalA 400

C. Country
A 400

A 500
The height of a maple tree is recorded for each of 5 years in the table shown.
Chris displays the data in the circle graph shown.
Explain why Chris’ circle graph is not an appropriate way to display the data.
Create an appropriate graph to display the data shown in the table. Be sure to give your graph a title, labels and a scale.
Explain why your graph is a better way to display the data.

A 500
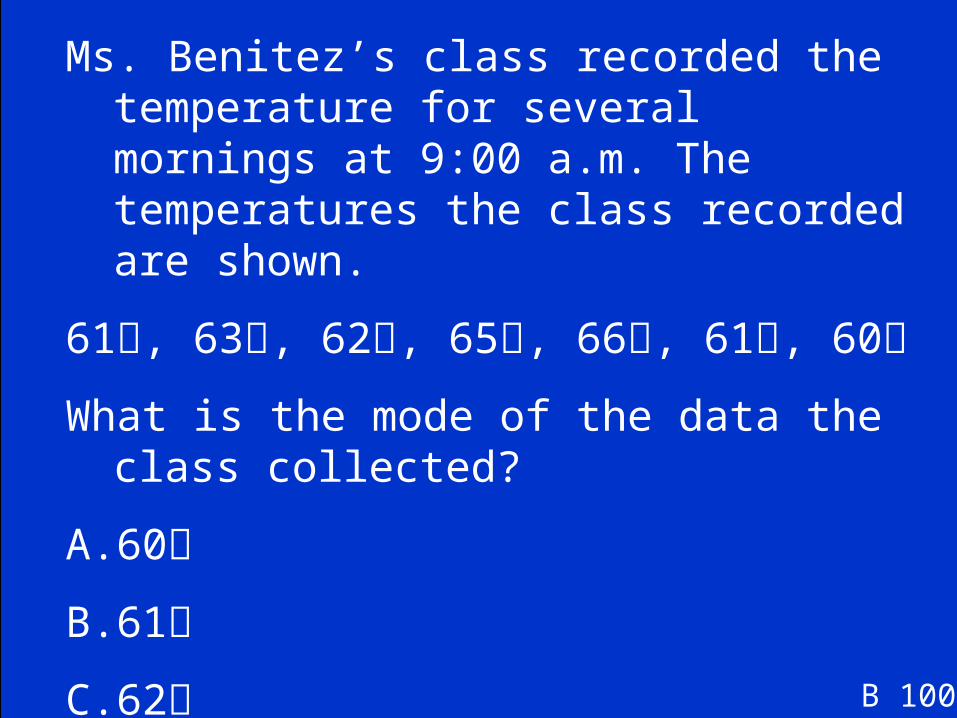
Ms. Benitez’s class recorded the temperature for several mornings at 9:00 a.m. The temperatures the class recorded are shown.
61, 63, 62, 65, 66, 61, 60
What is the mode of the data the class collected?
A. 60
B. 61
C. 62
D. 65
B 100
B. 61
B 100
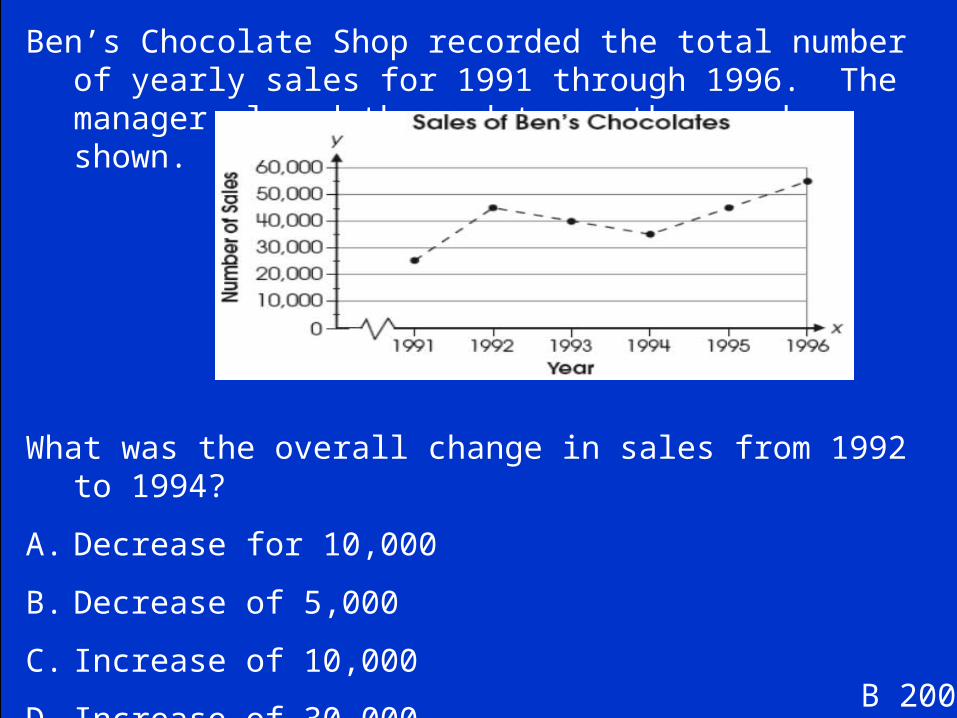
Ben’s Chocolate Shop recorded the total number of yearly sales for 1991 through 1996. The manager placed these data on the graph shown.
What was the overall change in sales from 1992 to 1994?
A. Decrease for 10,000
B. Decrease of 5,000
C. Increase of 10,000
D. Increase of 30,000
B 200
A. Decrease for 10,000
B 200

Which group of numbers has the greatest median?
A. 2, 5, 5, 5, 6
B. 2, 3, 7, 9, 10
C. 4, 4, 6, 6, 7
D. 3, 5, 8, 9, 9
B 300

D. 3, 5, 8, 9, 9
B 300

This graph shows the high temperatures over five days in one week.What is the range of the temperatures?
B 400
A. 0 degrees
B. 20 degrees
C.30 degrees
D.90 degrees

C. 30 degrees
B 400

B 500
QuickTime™ and aTIFF (Uncompressed) decompressor
are needed to see this picture.

B 500

Beverly writes each letter of her name on a separate index card, as shown. She puts all the cards in a bag. She randomly pulls out one card. What is the probability that the card is an “E”?
C 100
A
B
C
D

D.
C 100

Craig tossed a coin 16 times. The coin landed on heads 6 times.
How does the number of heads Craig obtained compare with the number of heads expected?
A. 1 fewer head than expected
B. 2 fewer heads than expected
C. 10 fewer heads than expected
D. exact amountC 200

B. 2 fewer heads than expected
C 200

Gregg has four shirts and three pairs of pants. His shirts are red, green, white, and yellow. His pants are navy, black, and tan.
List all the different shirt and pants combinations that Gregg can wear.
C 300
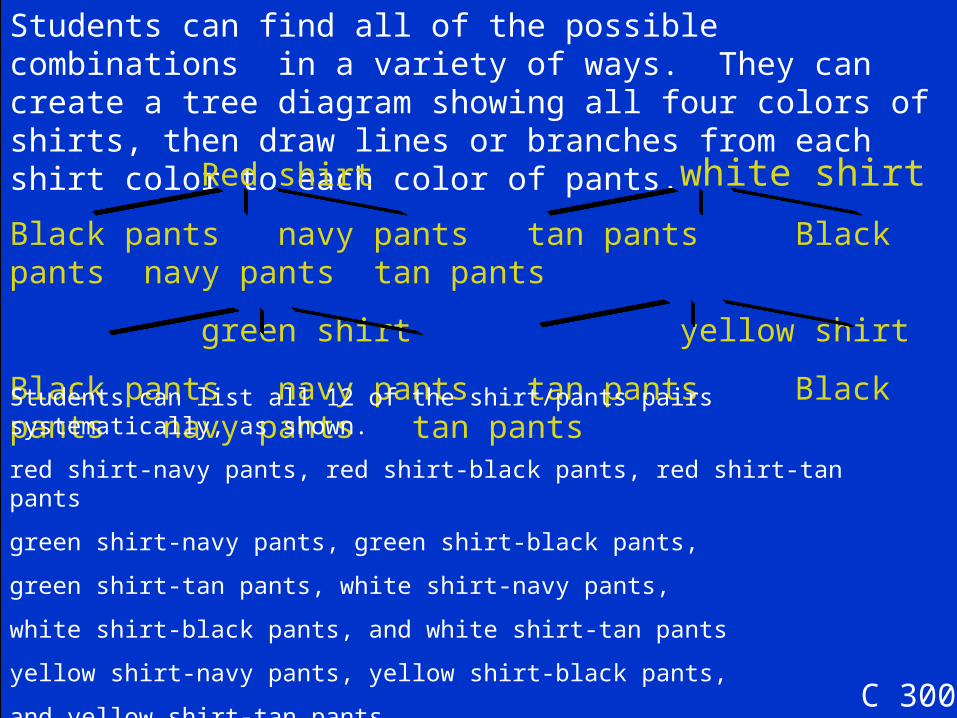
Students can find all of the possible combinations in a variety of ways. They can create a tree diagram showing all four colors of shirts, then draw lines or branches from each shirt color to each color of pants.
C 300
Red shirt white shirt
Black pants navy pants tan pants Black pants navy pants tan pants
green shirt yellow shirt
Black pants navy pants tan pants Black pants navy pants tan pants
Students can list all 12 of the shirt/pants pairs systematically, as shown.
red shirt-navy pants, red shirt-black pants, red shirt-tan pants
green shirt-navy pants, green shirt-black pants,
green shirt-tan pants, white shirt-navy pants,
white shirt-black pants, and white shirt-tan pants
yellow shirt-navy pants, yellow shirt-black pants,
and yellow shirt-tan pants

DAILY DOUBLE
C 400
DAILY DOUBLE
Place A Wager

Janet has a box of 30 cards. There are 15 blue cards and 15 green cards in the box. Janet pulls out a card, records the color and returns the card to the box. After pulling 10 times, she has recorded 6 blue cards and 4 green cards. Which statement describes whether this result is reasonable?
A. It is reasonable because both 6 and 4 are close to 5.
B. It is reasonable because 6 is more than 4. C. It is not reasonable because she will always get 5
blue cards and 5 green cards. D. It is not reasonable because she did not pick
enough cards
C 400

A. It is reasonable because both 6 and 4 are close to 5.
C 400

Samantha has different-colored buttons in a bag. The probabilities of picking each color are shown in the table. Samantha picks a button without looking in the bag. Which color is she least likely to pick from the bag?
A. black
B. red
C. white
D. yellow
C 500

B. red
C 500

The table below shows how the ticket prices to concerts and theme parks have increased over the years.
D 100
Based on the table, what is the relationship between the ticket prices of concerts and theme parks over the years?
A. Concert ticket prices are $10 more than theme park ticket prices.
B. Concert ticket prices are $36 more than theme park ticket prices.
C. Theme park ticket prices are $24 less than concert ticket prices.
D. Theme park ticket prices are $26 less than concert ticket prices.

C. Theme park ticket prices are $24 less than concert ticket
prices.
D 100
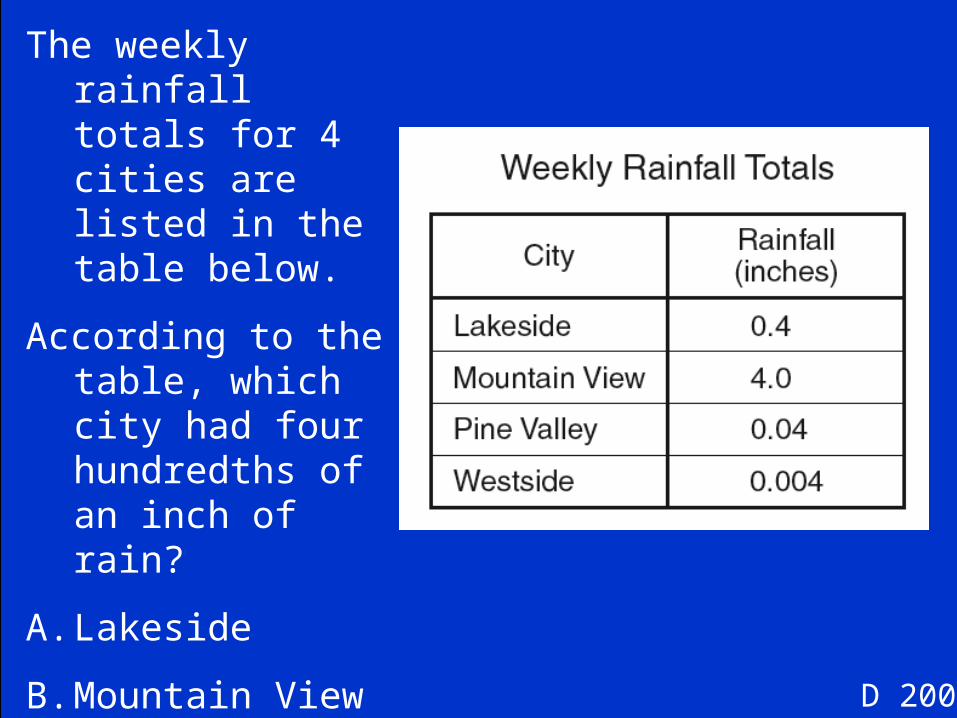
The weekly rainfall totals for 4 cities are listed in the table below.
According to the table, which city had four hundredths of an inch of rain?
A. Lakeside
B. Mountain View
C. Pine Valley
D. WestsideD 200

C. Pine Valley
D 200
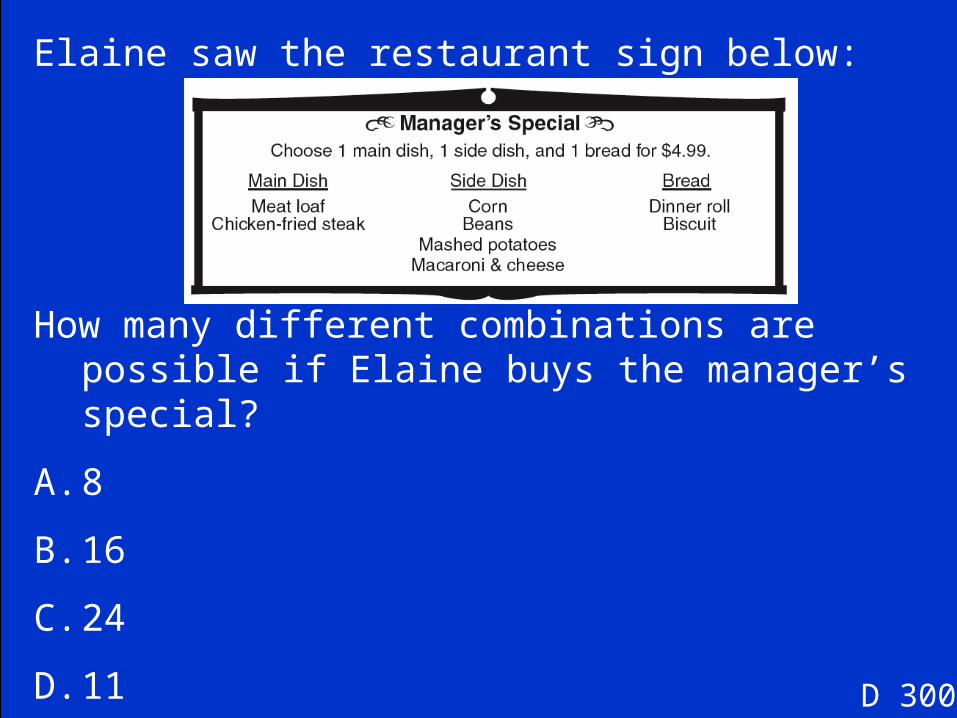
Elaine saw the restaurant sign below:
How many different combinations are possible if Elaine buys the manager’s special?
A. 8
B. 16
C. 24
D. 11
D 300

B. 16
D 300

The members of Dana’s family had their pictures taken at a photo studio. Their choices for ordering pictures are shown in the table below.
How many different combinations of size and style can Dana’s family choose from?
A. 8
B. 12
C. 6
D. 36
D 400

B. 12
D 400

Kevin has the following three kinds of juice in boxes in a cooler.
v12 apple juice
v13 grape juice
v15 orange juice
The juice boxes are all the same size and shape. Kevin will take out a juice box without looking. What is the probability that Kevin will take out an apple juice box?
D 500

D 500

Will earned the following grades on his last five mathematics tests.
What was Will’s median grade for these five tests?
A. 79
B. 95
C. 87
D. 91E 100
88, 79, 99, 96, 91

D. 91
E 100

Carol is training for a bicycle race. The number of miles that she rode her bicycle on each of the past 5 days is shown below.
What is the mean (average) number of miles that Carol rode her bicycle per day?
A. 13 miles
B. 16 miles
C. 17 miles
D. 20 miles
E 200
12, 18, 13, 17, 20

B. 16 miles
E 200

The manager of an ice cream shop asked some boys and girls to vote for their favorite kind of sundae. The results are shown below.
Which kind of sundae received the greatest TOTAL number of votes?
A. Hot fudge
B. Peanut butter
C. Strawberry
D. Caramel
E 300

A. Hot fudge
E 300

Roxanne’s book has 240 pages. If she reads 20 pages a day, how many days will it take her to read the entire book?
A.12 days
B.48 days
C.120 days
D.260 days
E 400

A. 12 days
E 400

The table to the right shows the distance a turtle traveled over a period of 8 minutes.
E 500
Which graph best represents the date in the table?
A B
C D

D.
E 500

The Final Jeopardy Category is:
Data Analysis and Probability
Please record your wager.
Click on screen to begin
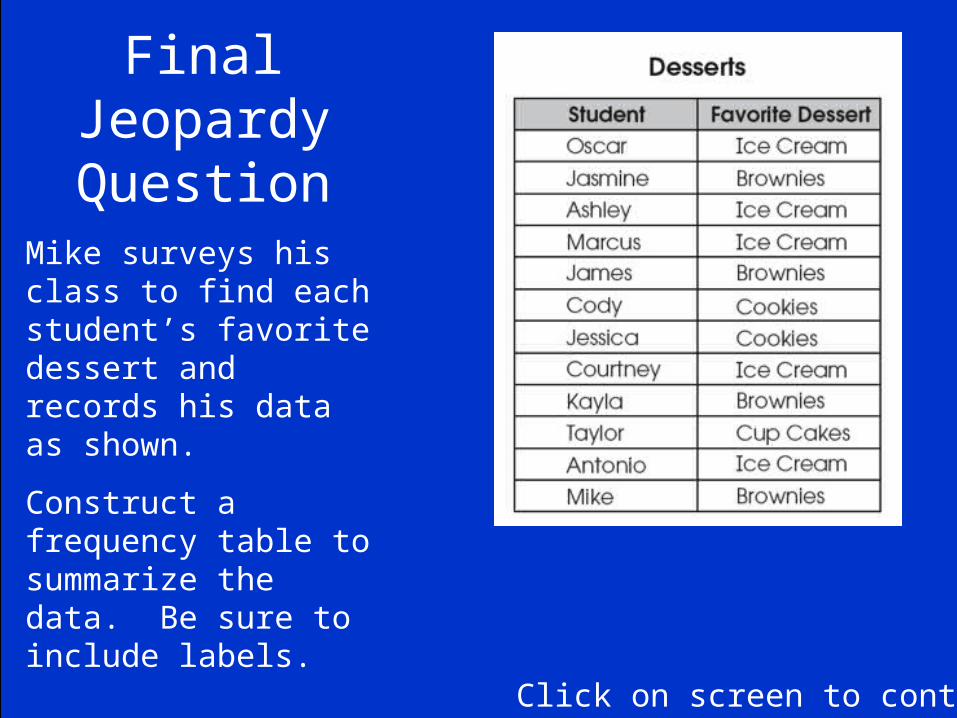
Final Jeopardy Question
Mike surveys his class to find each student’s favorite dessert and records his data as shown.
Construct a frequency table to summarize the data. Be sure to include labels.
Click on screen to continue

Correct Final Jeopardy Response
Click on screen to continue

Thank You for Playing Jeopardy!
Game Produced by Greene ESC
Recommended