Thinking LEAN
1
Objectives and Expectations • Start “thinking Lean” • Better understand Lean methodology • Utilize Lean concepts to identify and remove
waste and enhance customer value • Understand your role in creating a Lean culture
2
3
What is Lean?
Creating more value for customer with fewer resources
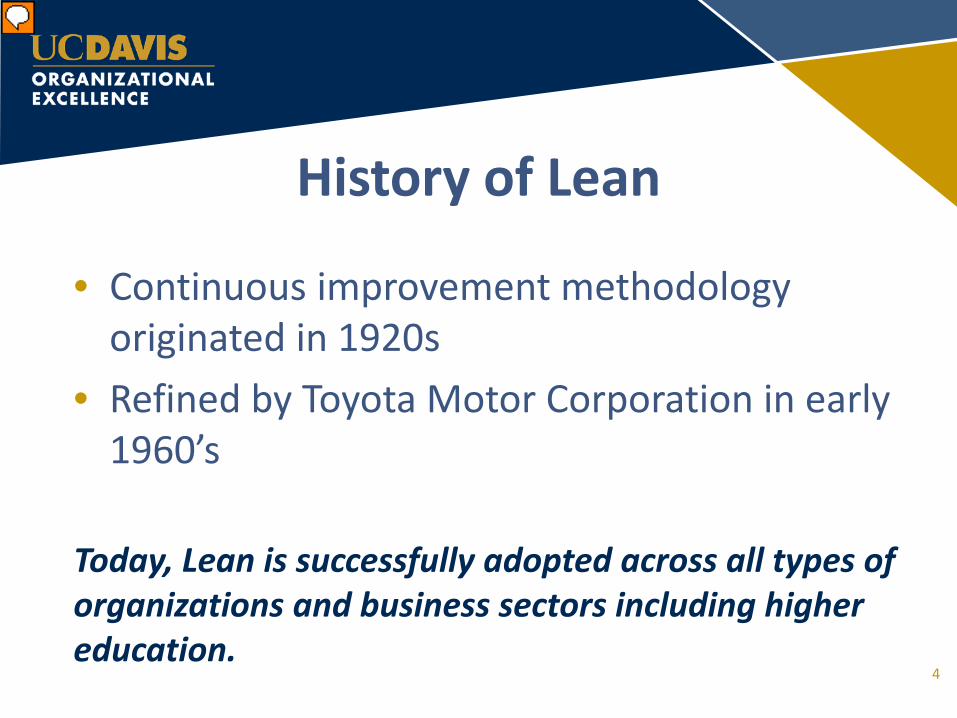
History of Lean
• Continuous improvement methodology originated in 1920s
• Refined by Toyota Motor Corporation in early 1960’s
Today, Lean is successfully adopted across all types of organizations and business sectors including higher education.
4
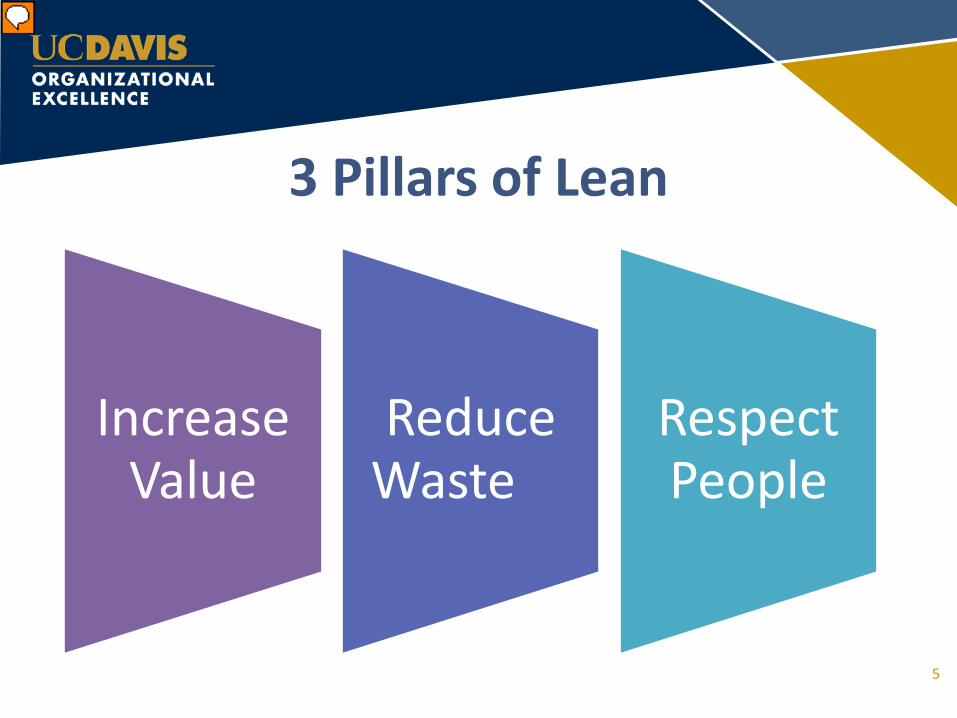
3 Pillars of Lean
Increase Value
Reduce Waste
Respect People
5
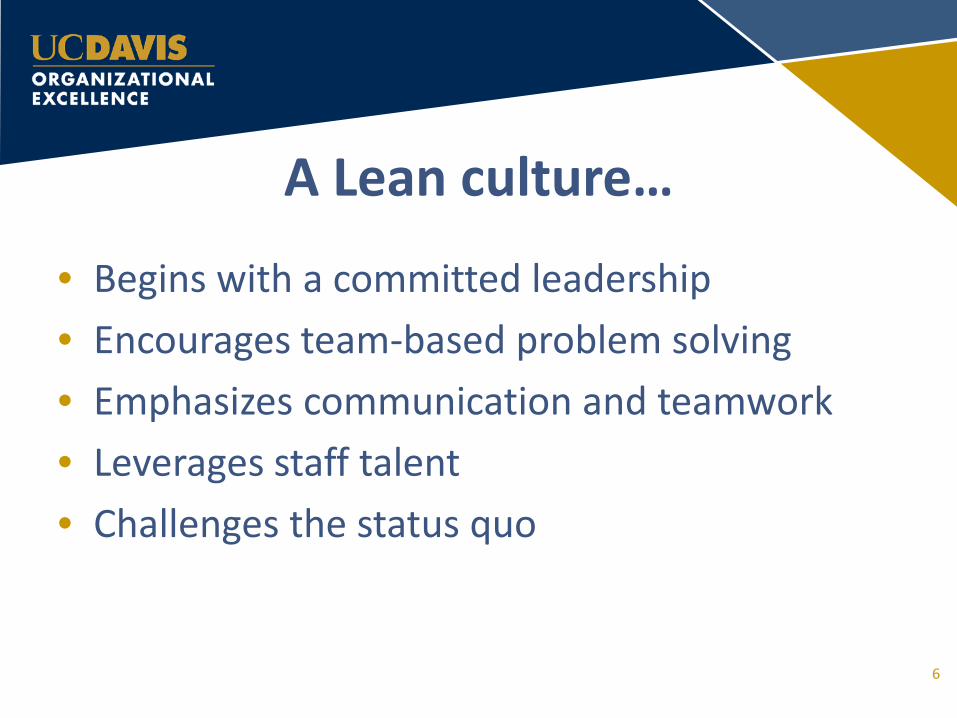
A Lean culture…
• Begins with a committed leadership • Encourages team-based problem solving • Emphasizes communication and teamwork • Leverages staff talent • Challenges the status quo
6
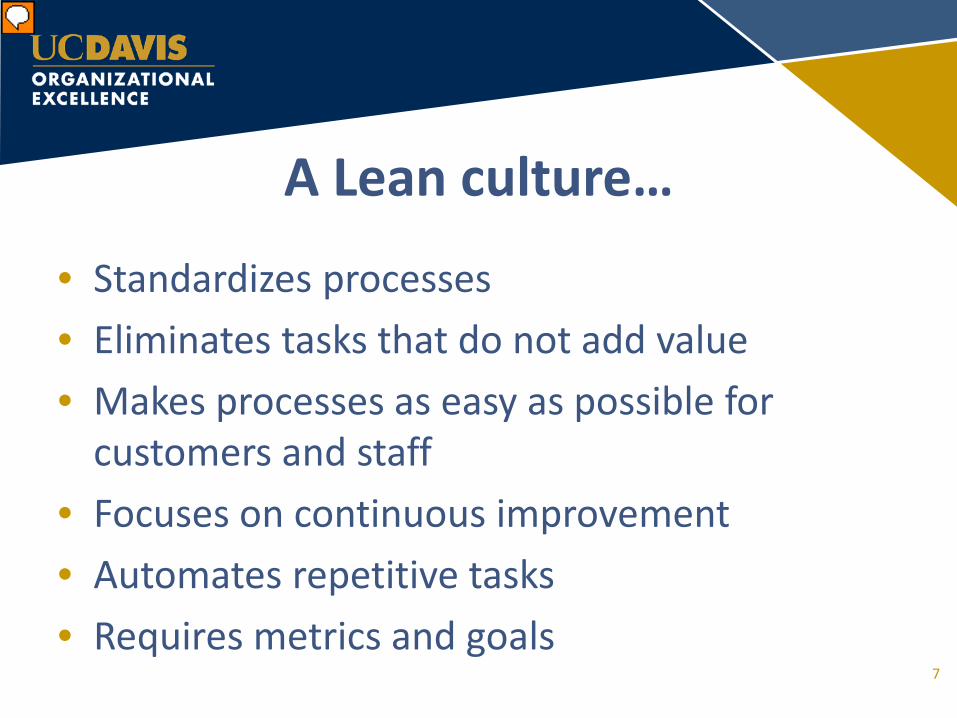
A Lean culture…
• Standardizes processes • Eliminates tasks that do not add value • Makes processes as easy as possible for
customers and staff • Focuses on continuous improvement • Automates repetitive tasks • Requires metrics and goals
7
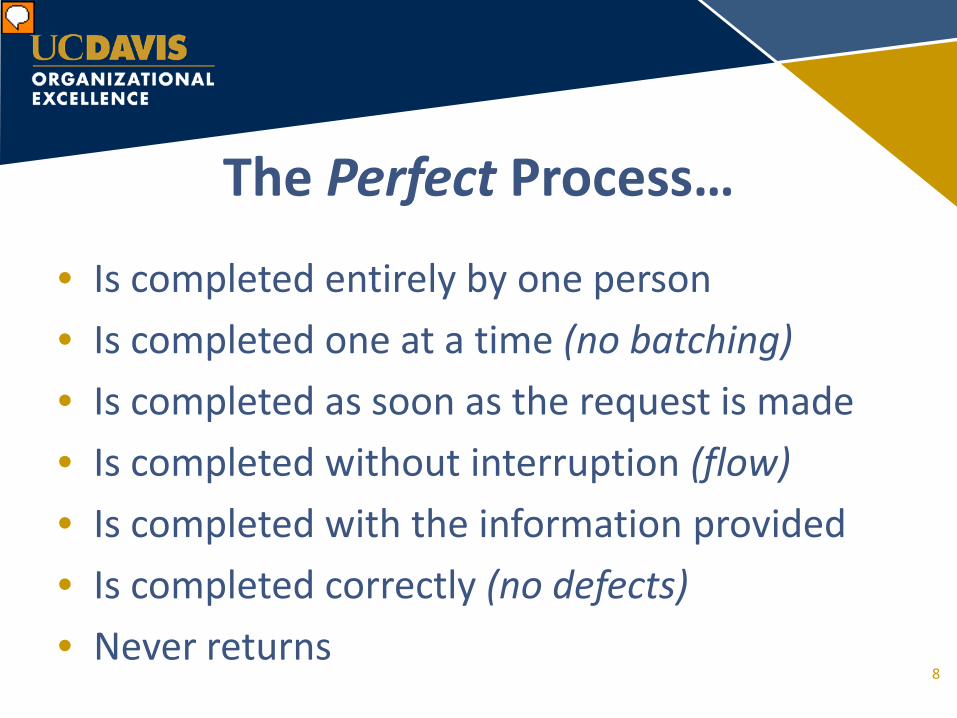
The Perfect Process…
• Is completed entirely by one person • Is completed one at a time (no batching) • Is completed as soon as the request is made • Is completed without interruption (flow) • Is completed with the information provided • Is completed correctly (no defects) • Never returns
8
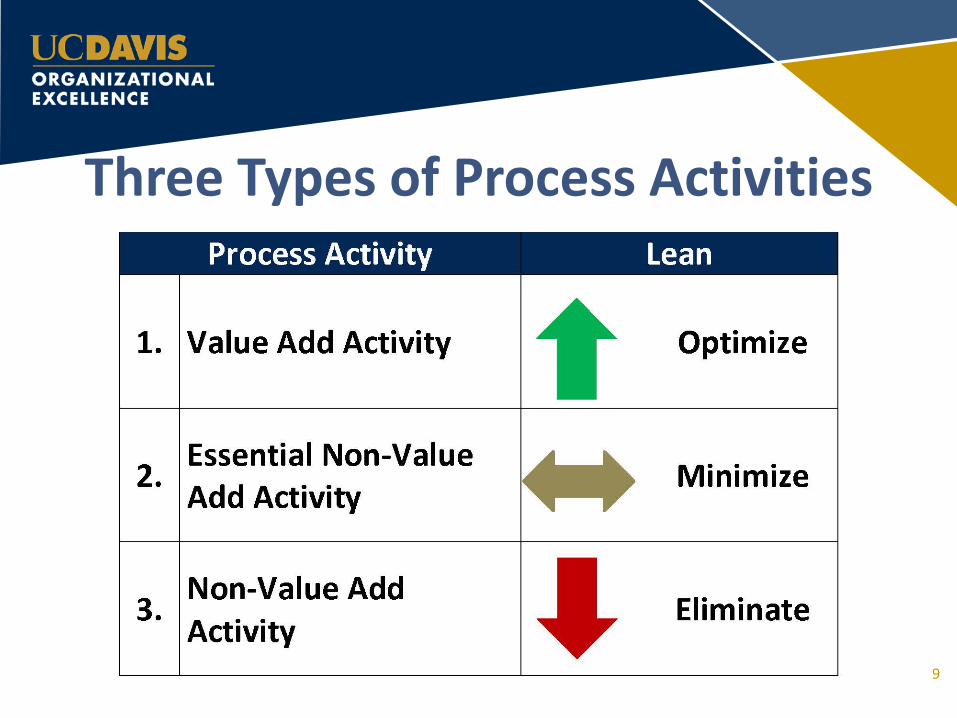
Three Types of Process Activities
9
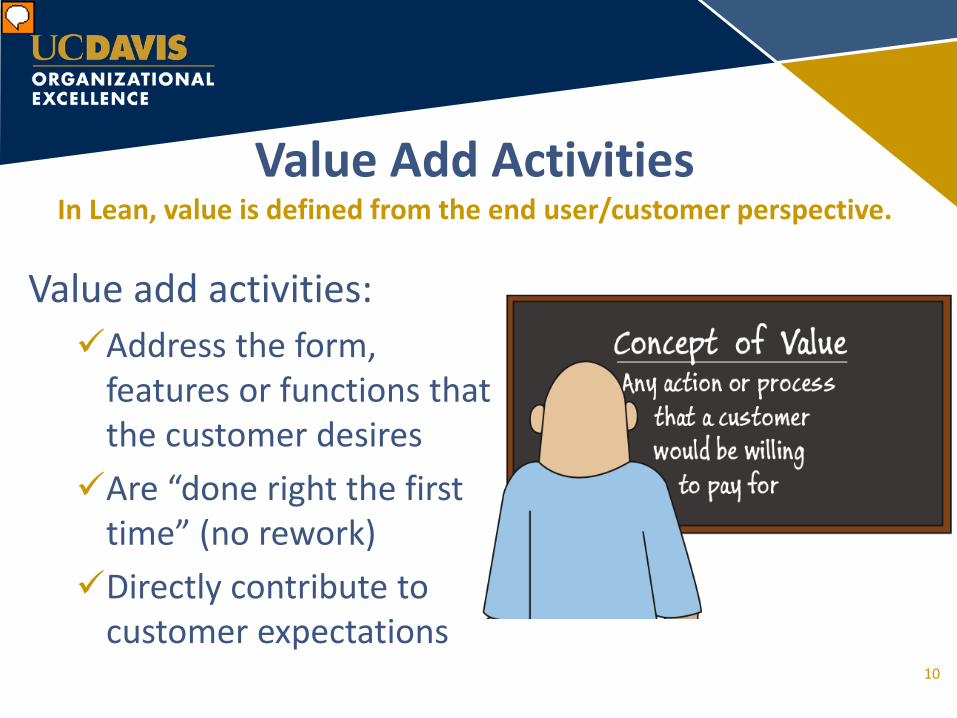
Value Add Activities In Lean, value is defined from the end user/customer perspective.
Value add activities: Address the form,
features or functions that the customer desires Are “done right the first
time” (no rework) Directly contribute to
customer expectations 10
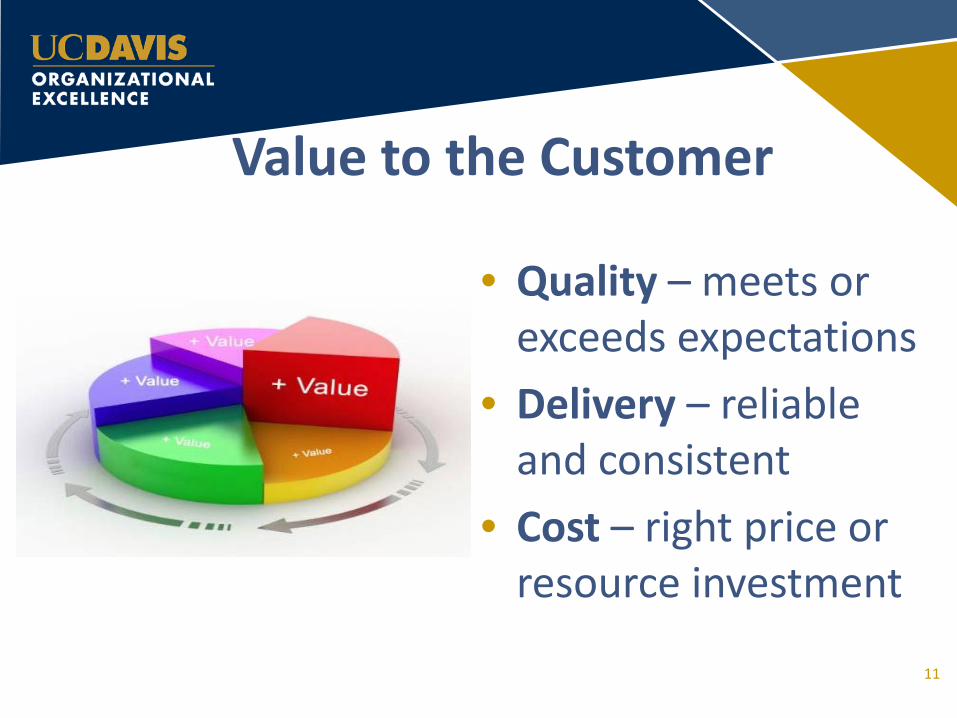
Value to the Customer
• Quality – meets or exceeds expectations
• Delivery – reliable and consistent
• Cost – right price or resource investment
11
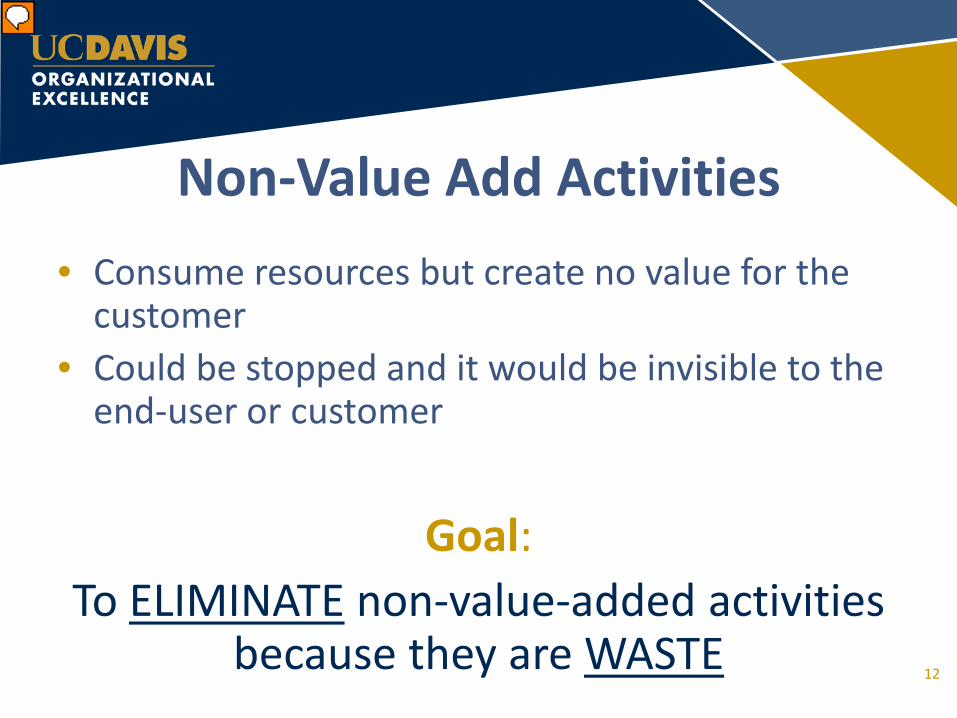
Non-Value Add Activities • Consume resources but create no value for the
customer • Could be stopped and it would be invisible to the
end-user or customer
Goal: To ELIMINATE non-value-added activities
because they are WASTE 12
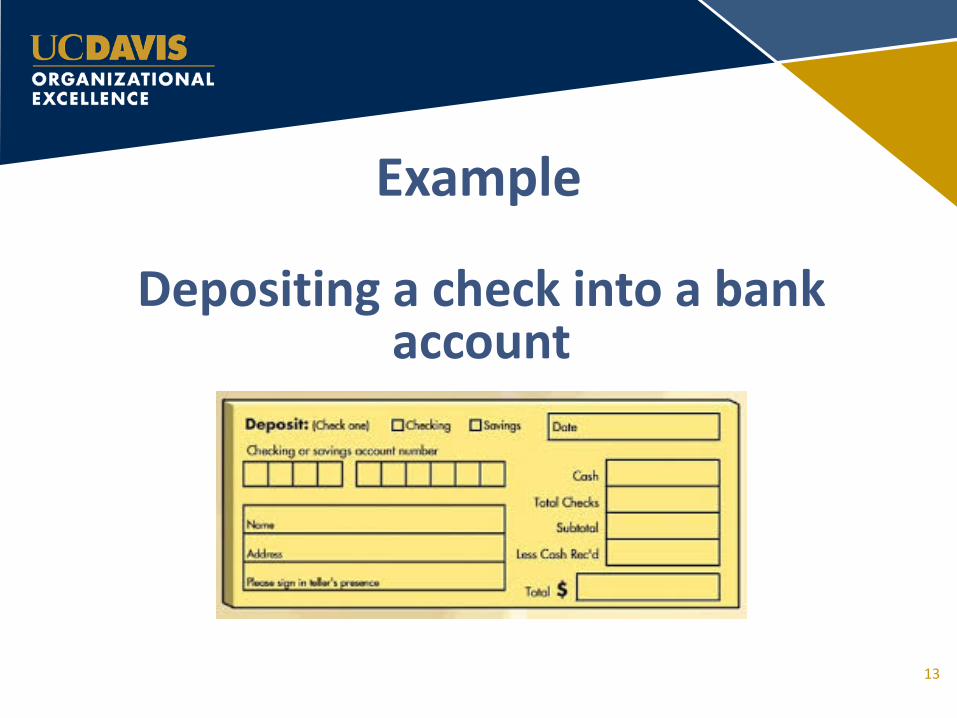
Example
Depositing a check into a bank account
13
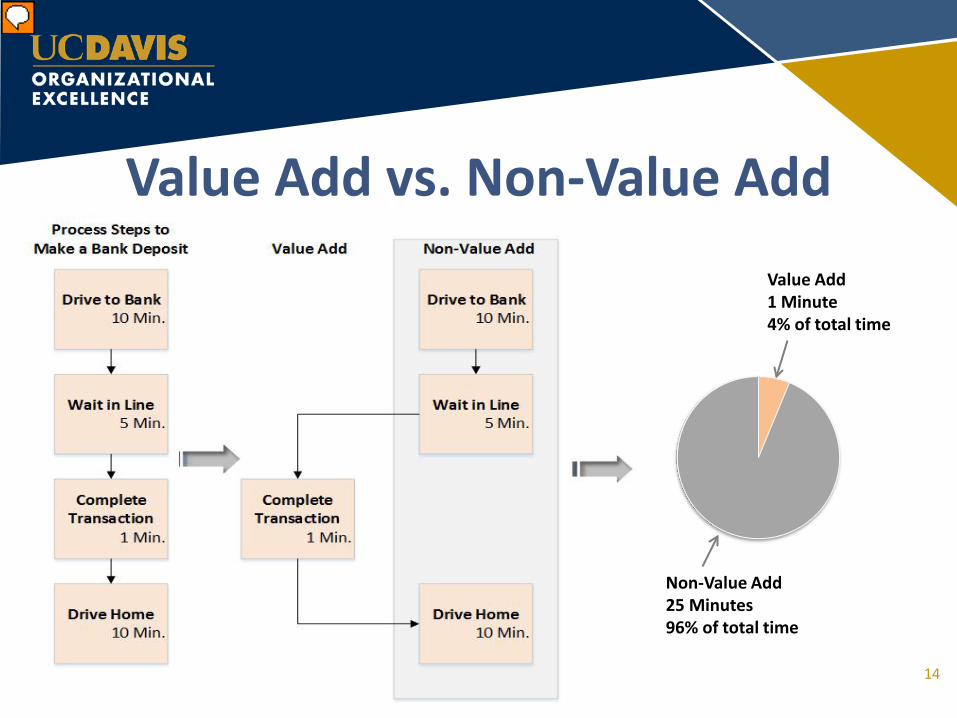
Value Add vs. Non-Value Add
Non-Value Add 25 Minutes 96% of total time
Value Add 1 Minute 4% of total time
14
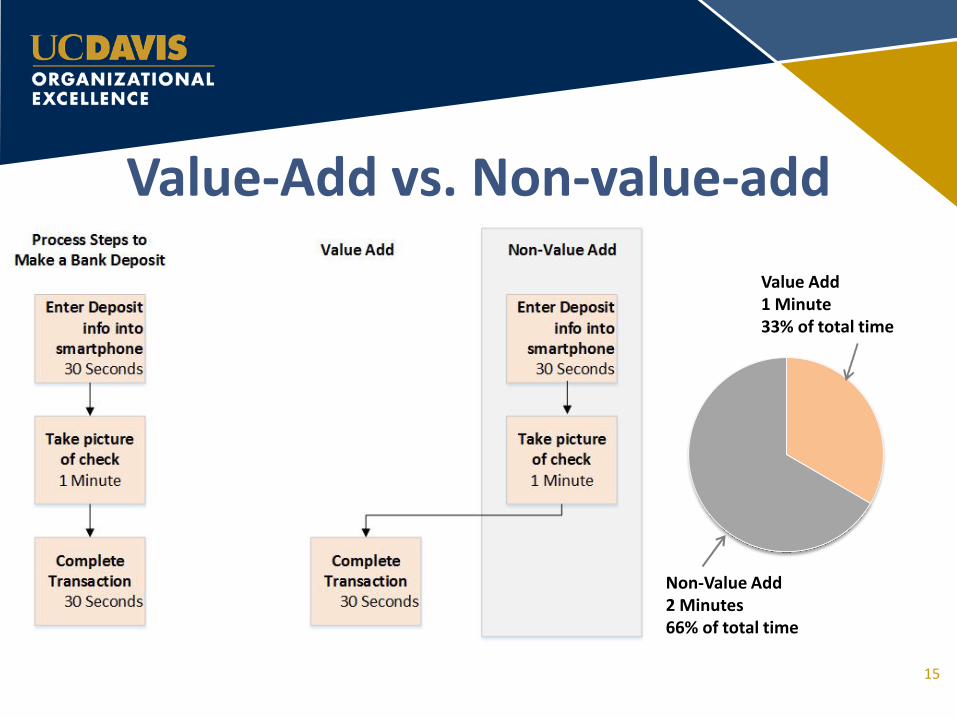
Value Add 1 Minute 33% of total time
Non-Value Add 2 Minutes 66% of total time
Value-Add vs. Non-value-add
15
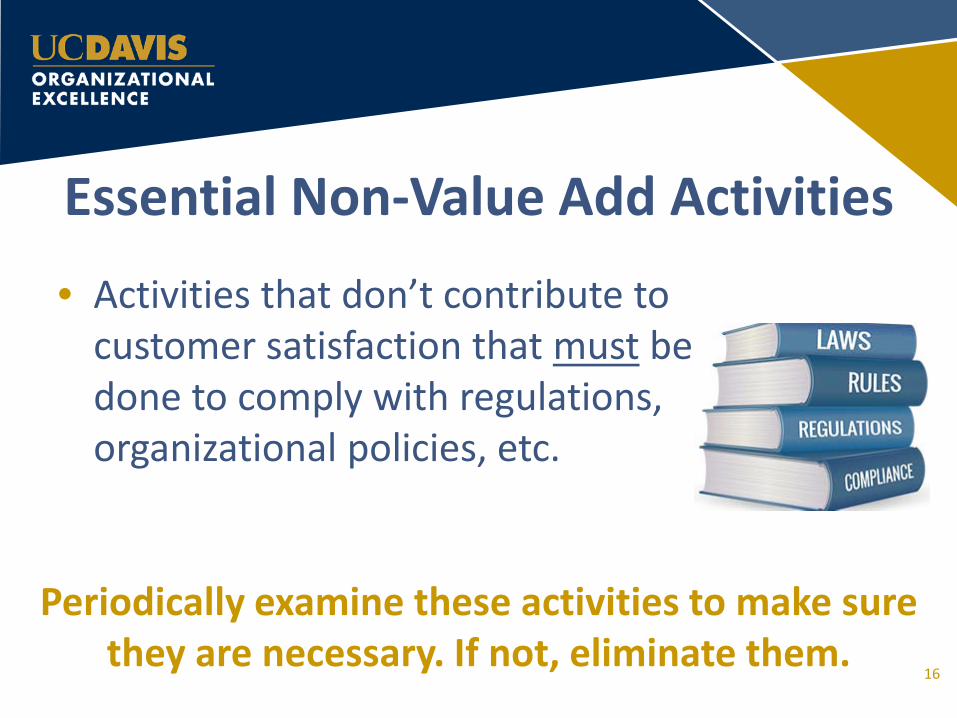
Essential Non-Value Add Activities
• Activities that don’t contribute to customer satisfaction that must be done to comply with regulations, organizational policies, etc.
Periodically examine these activities to make sure they are necessary. If not, eliminate them.
16
ACTIVITY
17
Directions
• The worksheet has a list of value add, non-value add and essential non-value add administrative activities
• In the next five (5) minutes, individually identify the category in which each activity belongs
• When you’ve completed your individual worksheet, turn it over on the table
18
Directions
• At each table, identify a facilitator and a scribe • In the next ten (10) minutes, discuss the
individual responses to the worksheet and then, as a group, come to consensus about the correct response for each activity
19
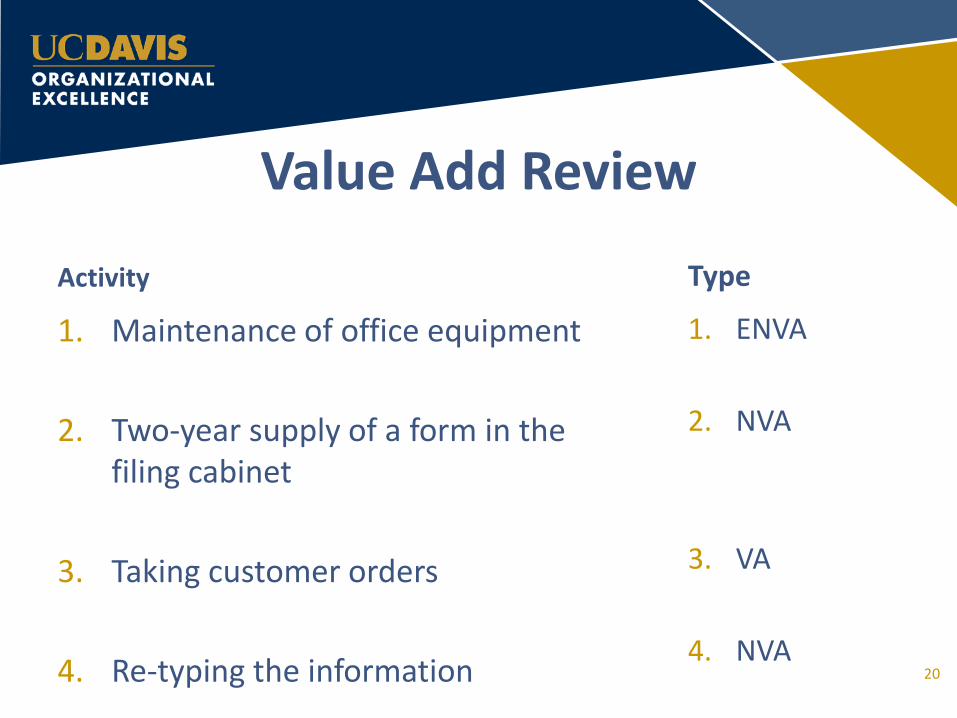
Value Add Review
Activity
1. Maintenance of office equipment 2. Two-year supply of a form in the
filing cabinet 3. Taking customer orders 4. Re-typing the information
Type
1. ENVA 2. NVA 3. VA 4. NVA
20
Value Add Review
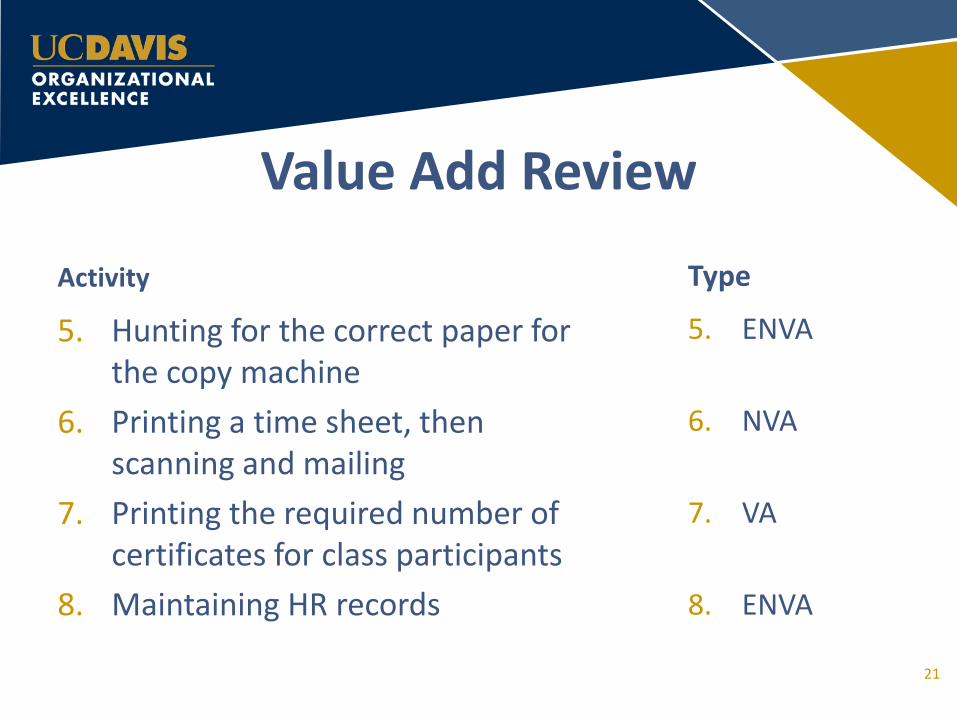
Activity
5. Hunting for the correct paper for the copy machine
6. Printing a time sheet, then scanning and mailing
7. Printing the required number of certificates for class participants
8. Maintaining HR records
Type
5. ENVA
6. NVA
7. VA
8. ENVA
21
Value Add Review
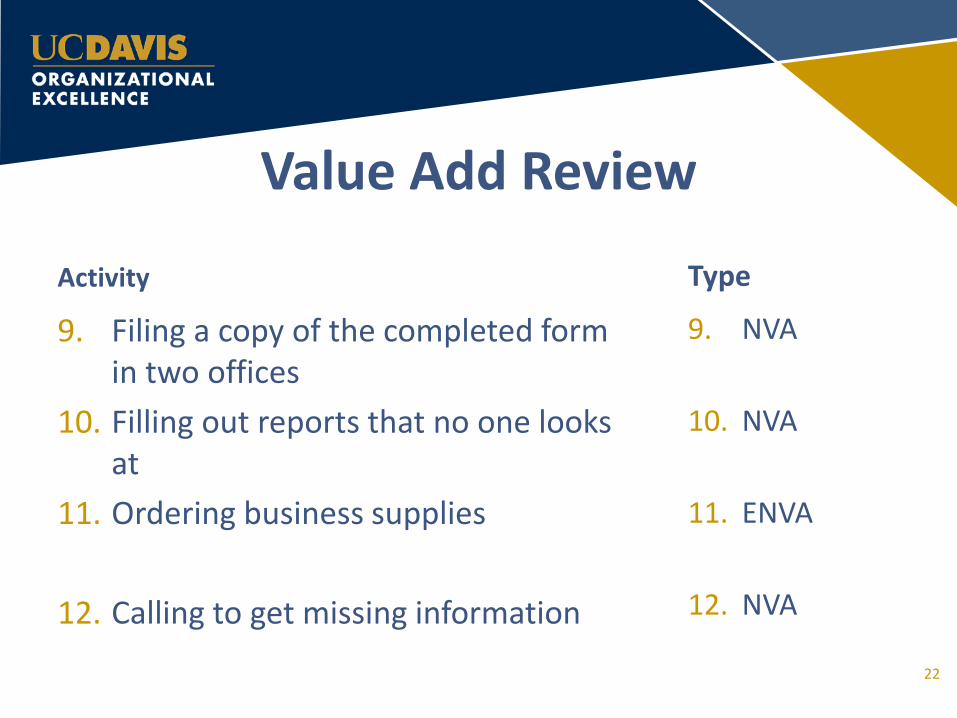
Activity
9. Filing a copy of the completed form in two offices
10. Filling out reports that no one looks at
11. Ordering business supplies 12. Calling to get missing information
Type
9. NVA
10. NVA
11. ENVA
12. NVA
22
Value Add Review
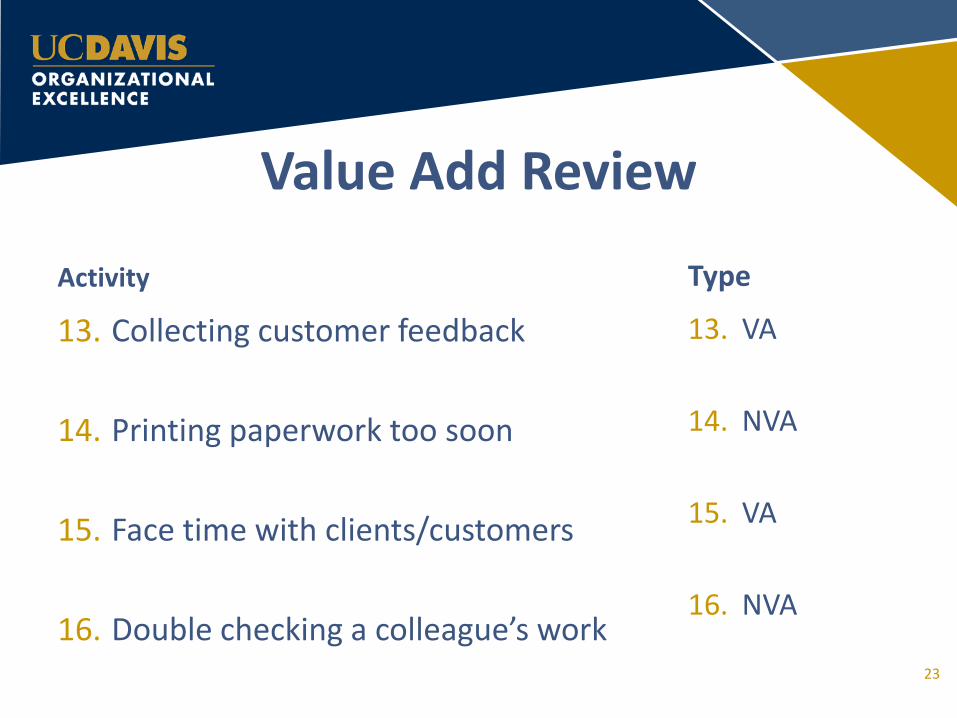
Activity
13. Collecting customer feedback 14. Printing paperwork too soon
15. Face time with clients/customers
16. Double checking a colleague’s work
Type
13. VA
14. NVA
15. VA
16. NVA
23
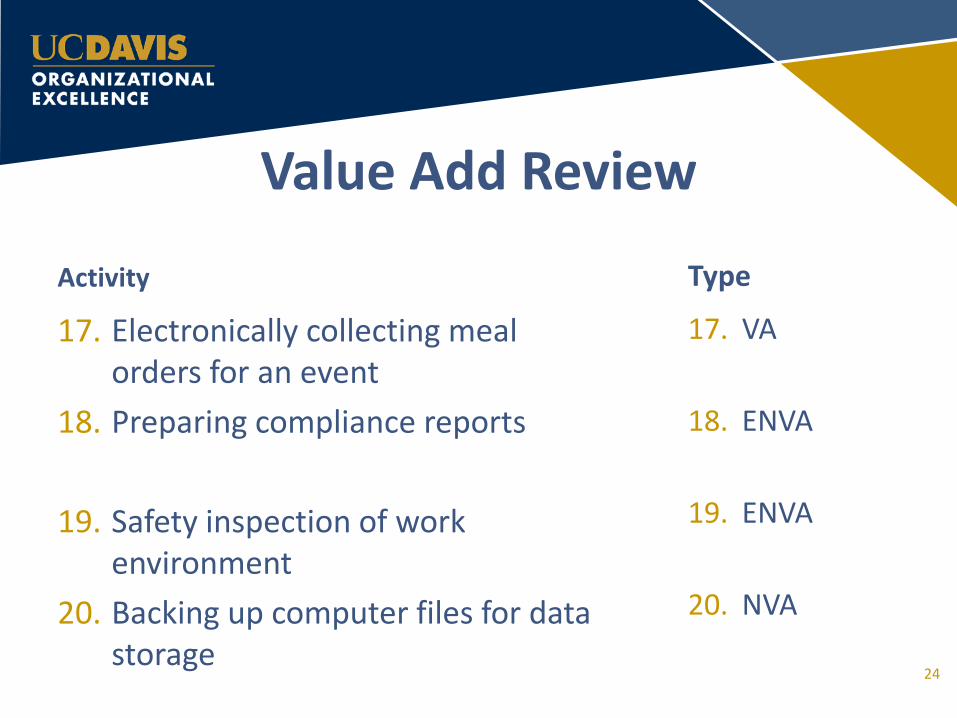
Value Add Review
Activity
17. Electronically collecting meal orders for an event
18. Preparing compliance reports
19. Safety inspection of work environment
20. Backing up computer files for data storage
Type
17. VA
18. ENVA
19. ENVA
20. NVA
24
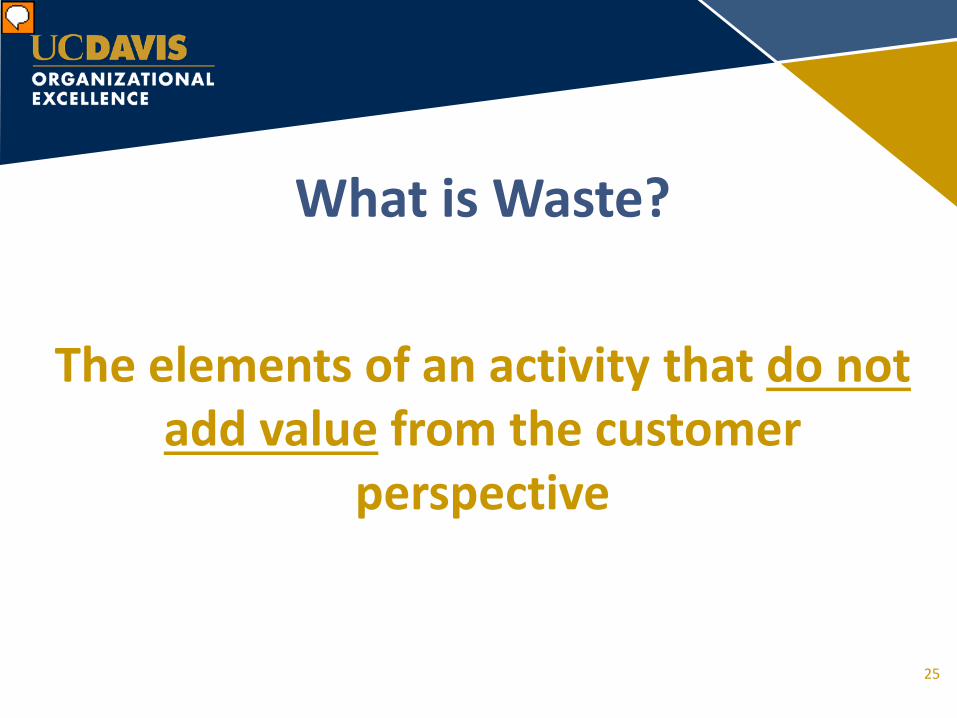
What is Waste?
The elements of an activity that do not add value from the customer
perspective
25
26
27
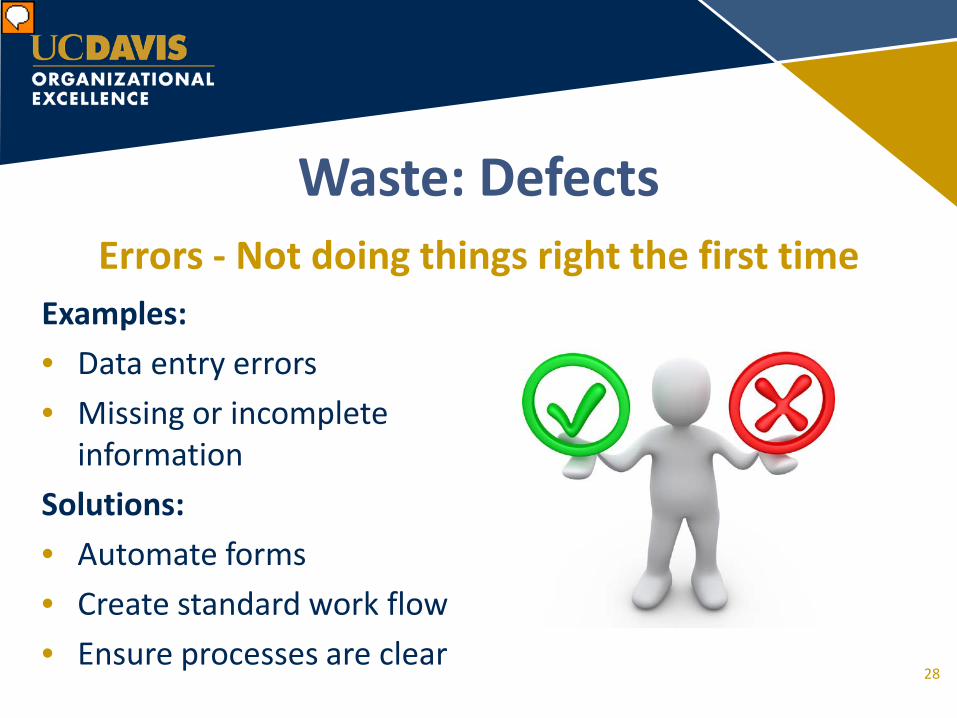
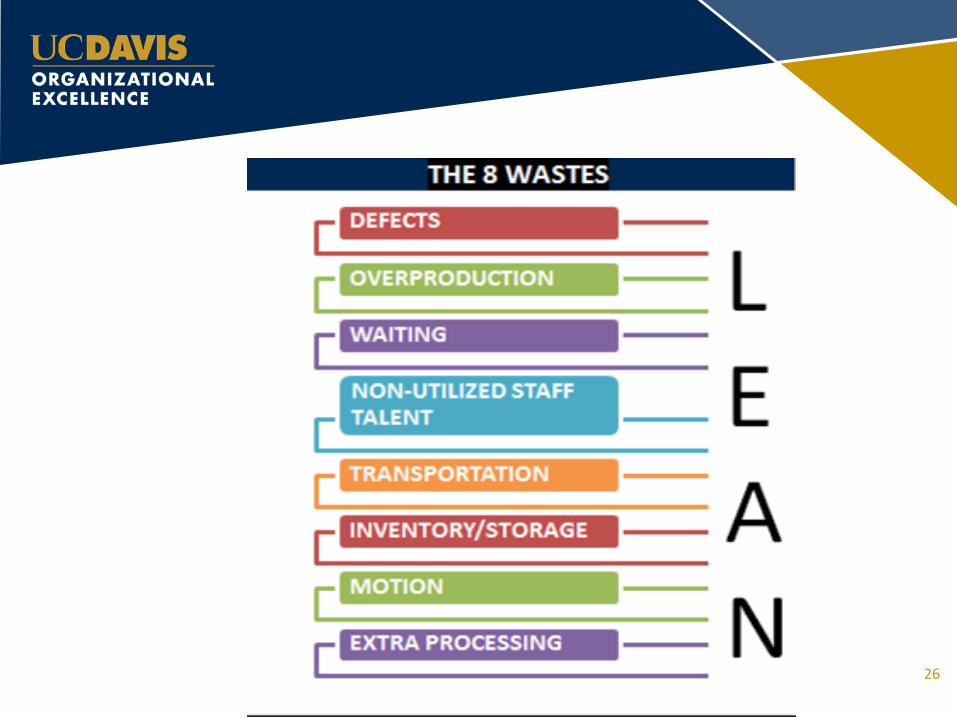
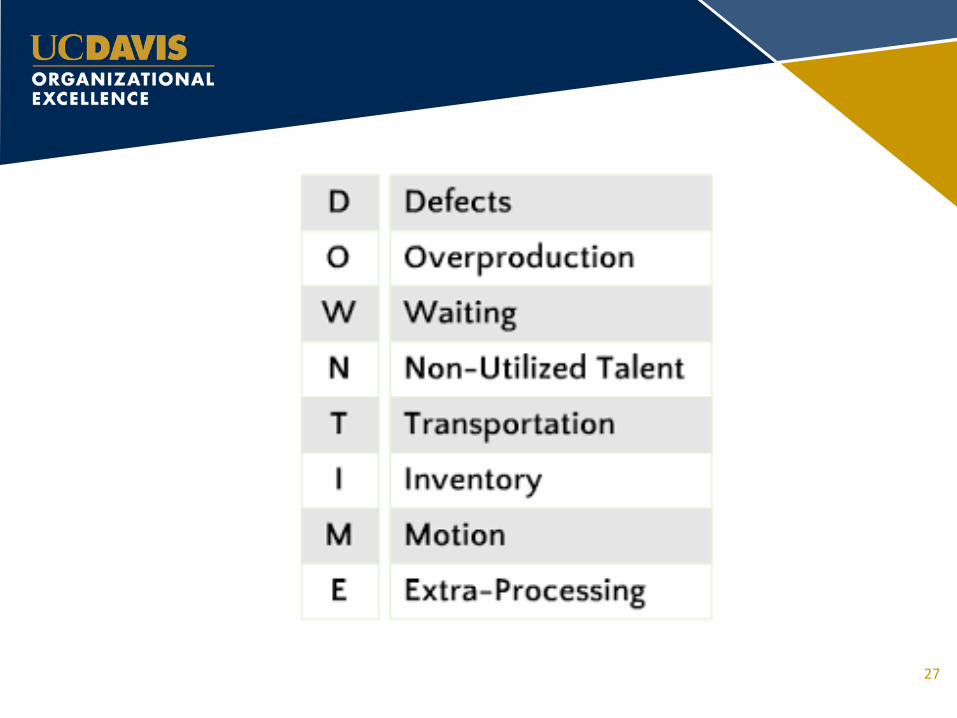
Waste: Defects
Examples: • Data entry errors • Missing or incomplete
information Solutions: • Automate forms • Create standard work flow • Ensure processes are clear
Errors - Not doing things right the first time
28
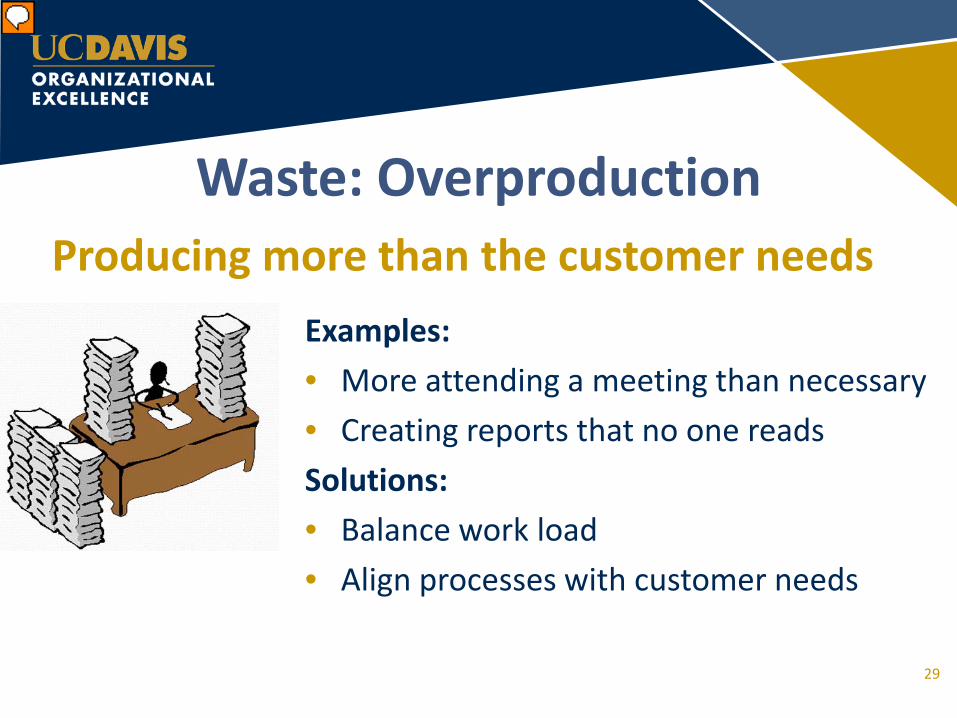
Waste: Overproduction
Examples: • More attending a meeting than necessary • Creating reports that no one reads Solutions: • Balance work load • Align processes with customer needs
Producing more than the customer needs
29
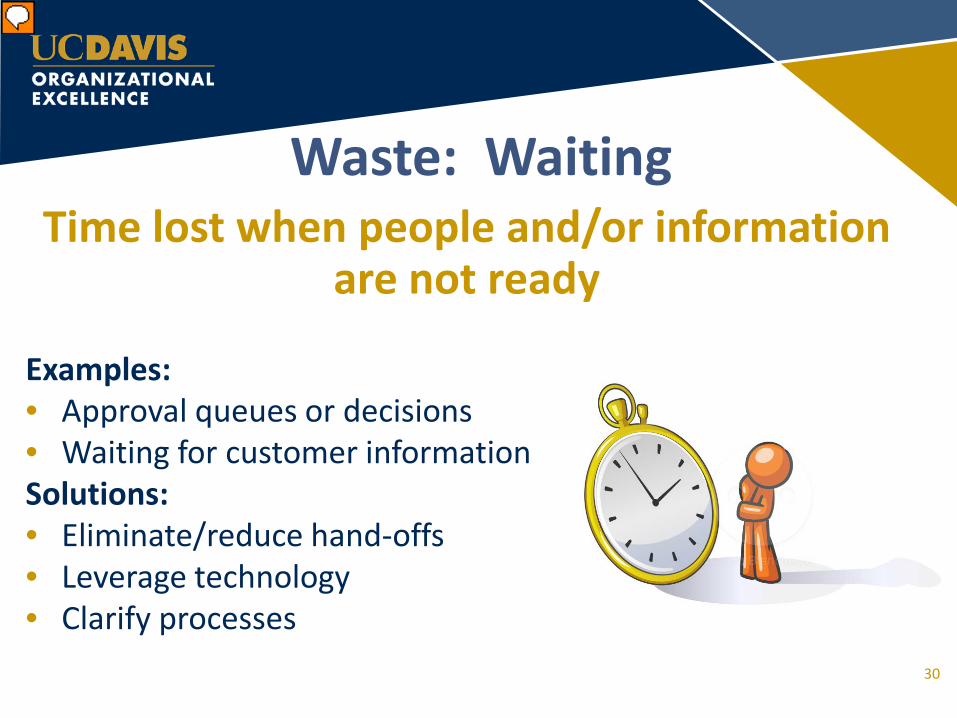
Examples: • Approval queues or decisions • Waiting for customer information Solutions: • Eliminate/reduce hand-offs • Leverage technology • Clarify processes
Waste: Waiting Time lost when people and/or information
are not ready
30
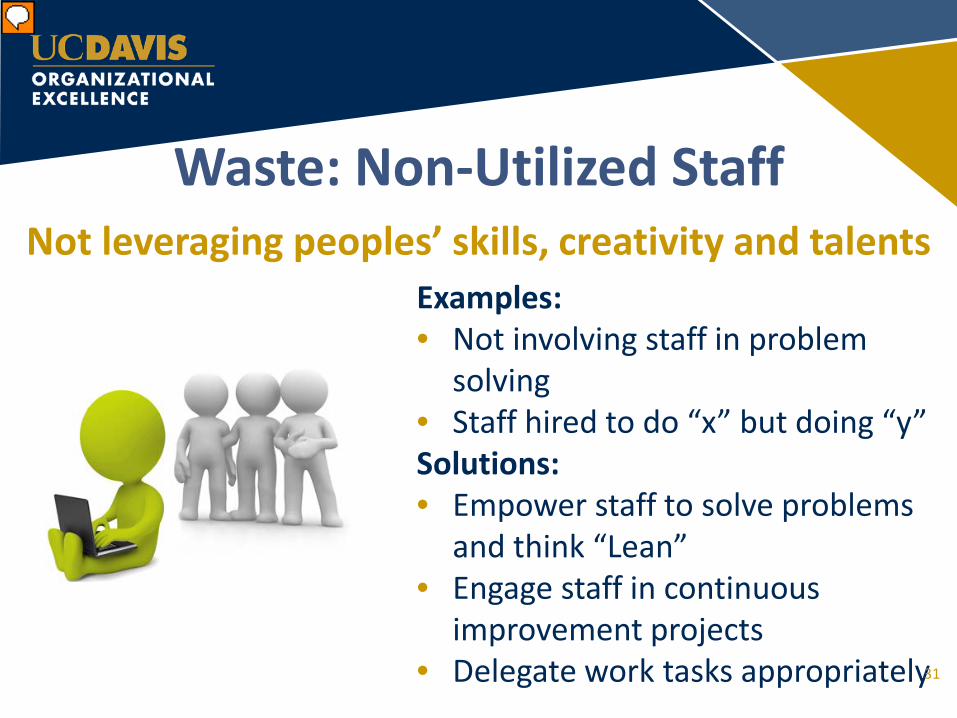
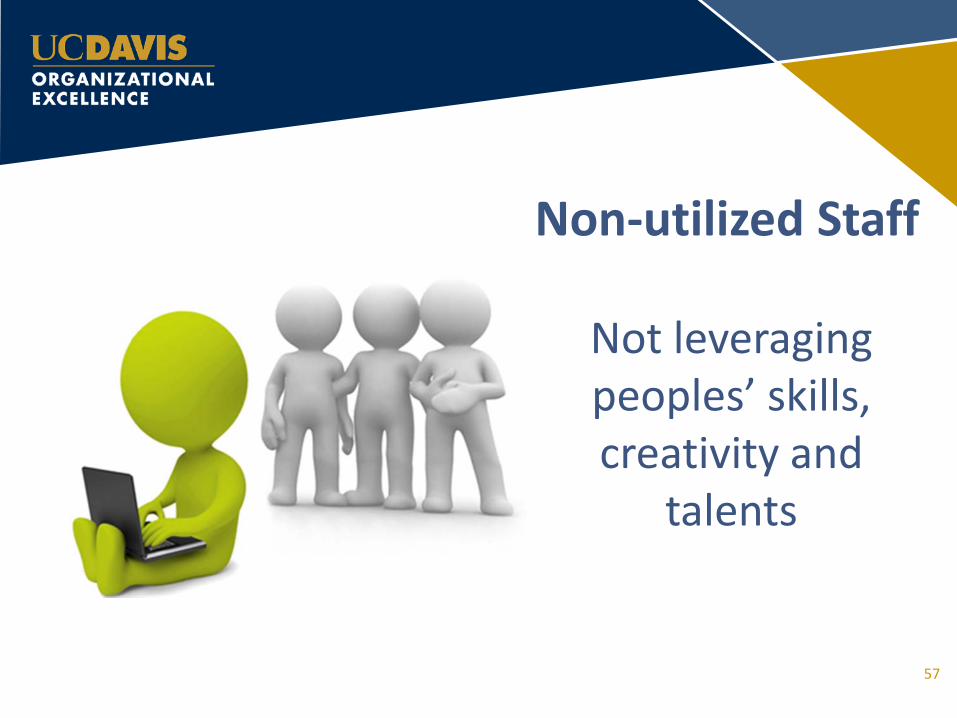
Waste: Non-Utilized Staff
Examples: • Not involving staff in problem
solving • Staff hired to do “x” but doing “y” Solutions: • Empower staff to solve problems
and think “Lean” • Engage staff in continuous
improvement projects • Delegate work tasks appropriately
Not leveraging peoples’ skills, creativity and talents
31
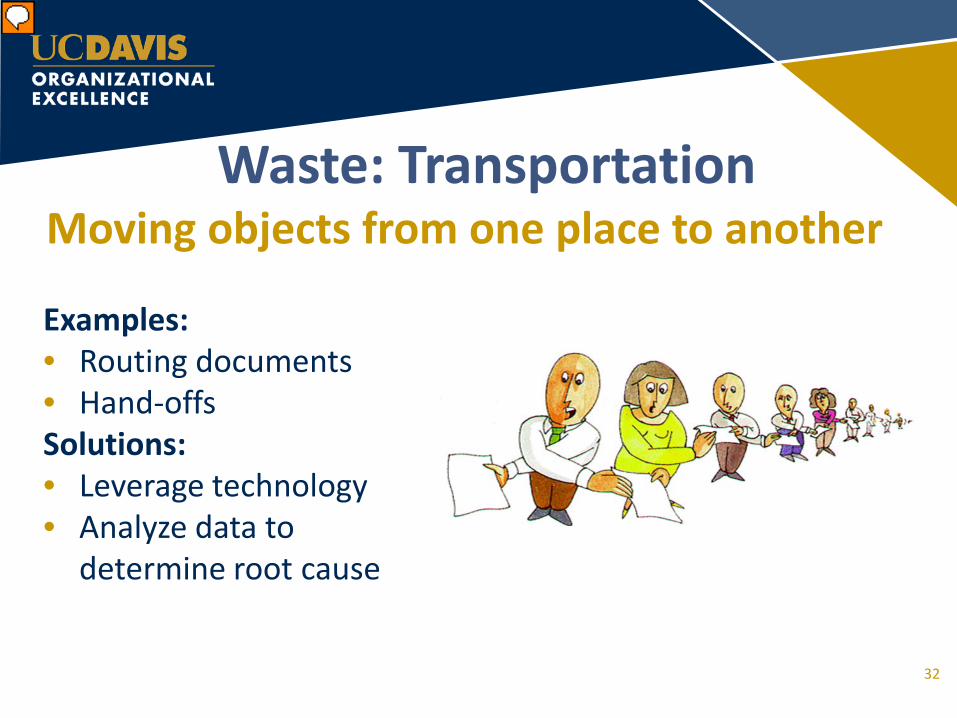
Waste: Transportation
Examples: • Routing documents • Hand-offs Solutions: • Leverage technology • Analyze data to
determine root cause
Moving objects from one place to another
32
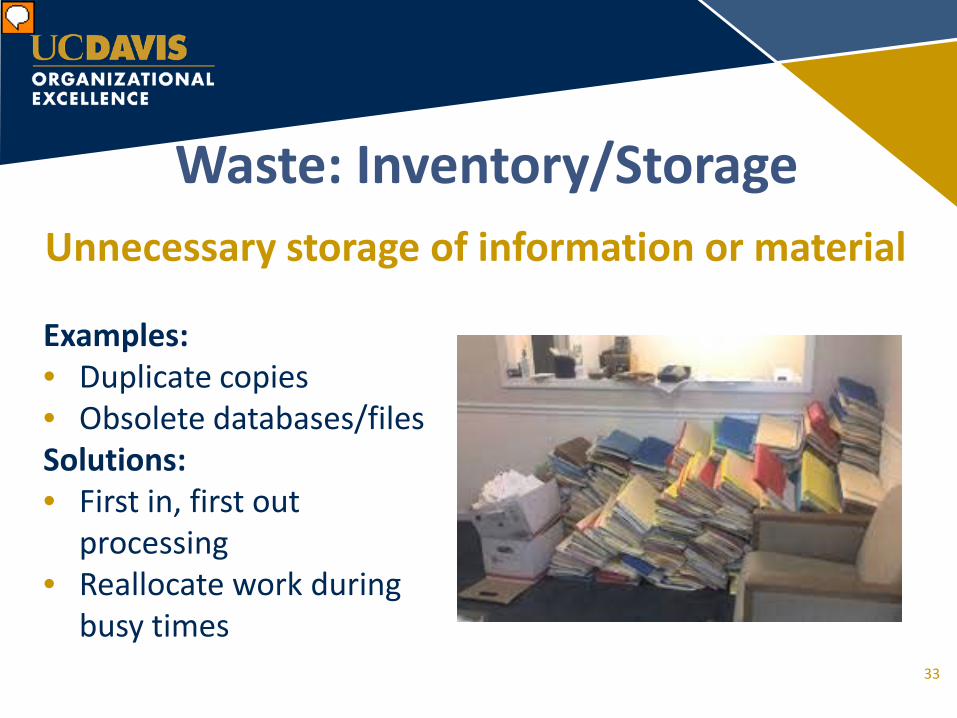
Waste: Inventory/Storage
Examples: • Duplicate copies • Obsolete databases/files Solutions: • First in, first out
processing • Reallocate work during
busy times
Unnecessary storage of information or material
33
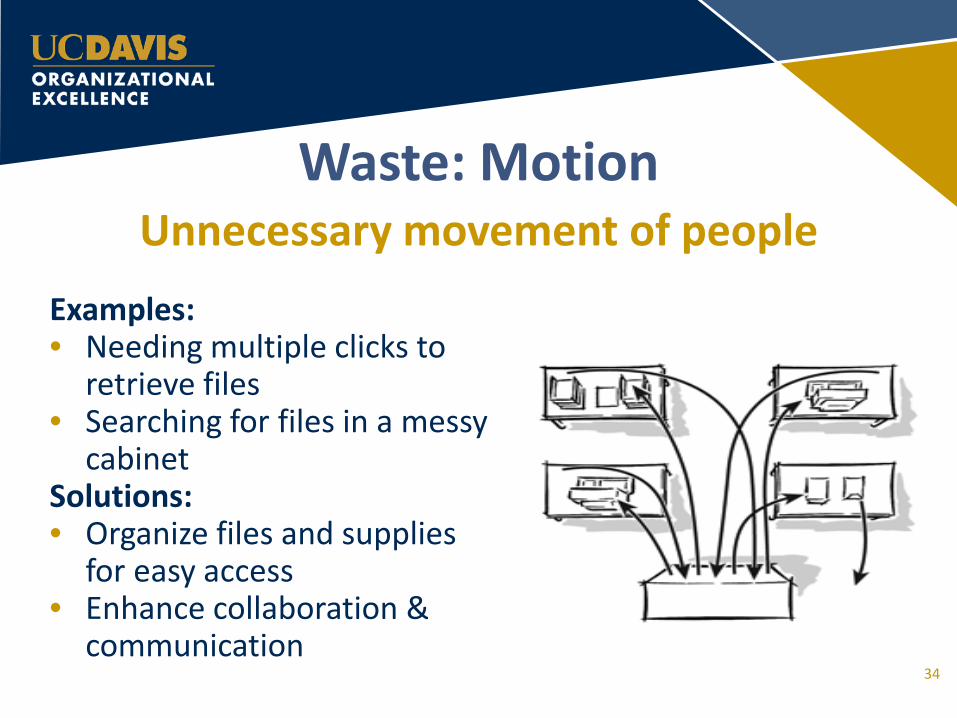
Waste: Motion
Examples: • Needing multiple clicks to
retrieve files • Searching for files in a messy
cabinet Solutions: • Organize files and supplies
for easy access • Enhance collaboration &
communication
Unnecessary movement of people
34
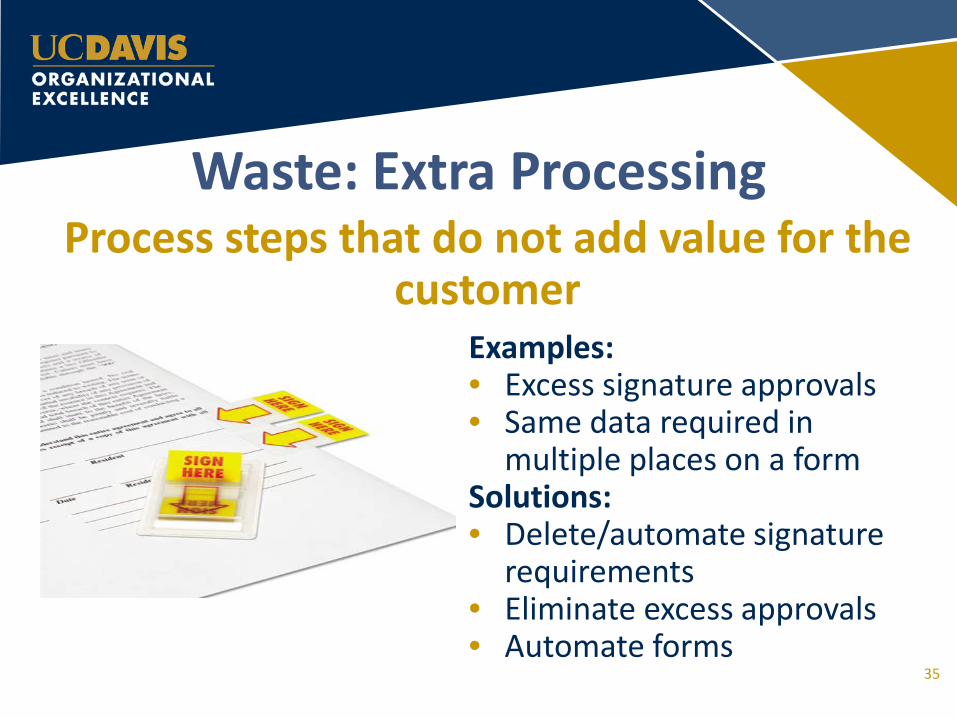
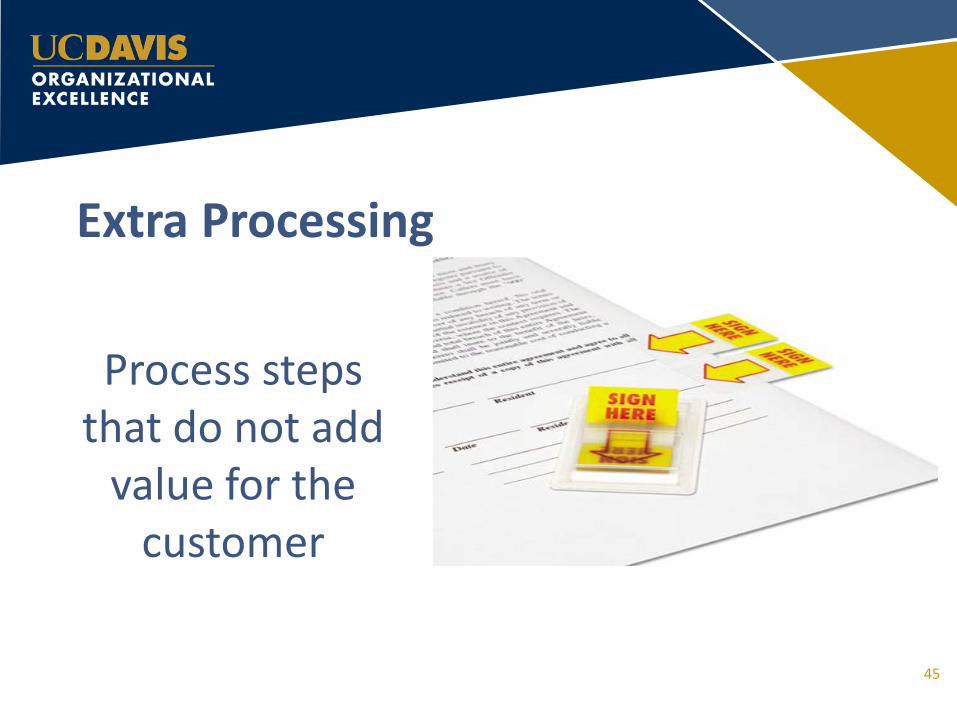
Waste: Extra Processing
Examples: • Excess signature approvals • Same data required in
multiple places on a form Solutions: • Delete/automate signature
requirements • Eliminate excess approvals • Automate forms
Process steps that do not add value for the customer
35
ACTIVITY
36
Directions
• Choose a partner • Each partner will have a set of flash cards • One partner will read the activity listed on the
card; the other will identify the type of waste the activity reflects
• When you hear the bell, switch roles
37
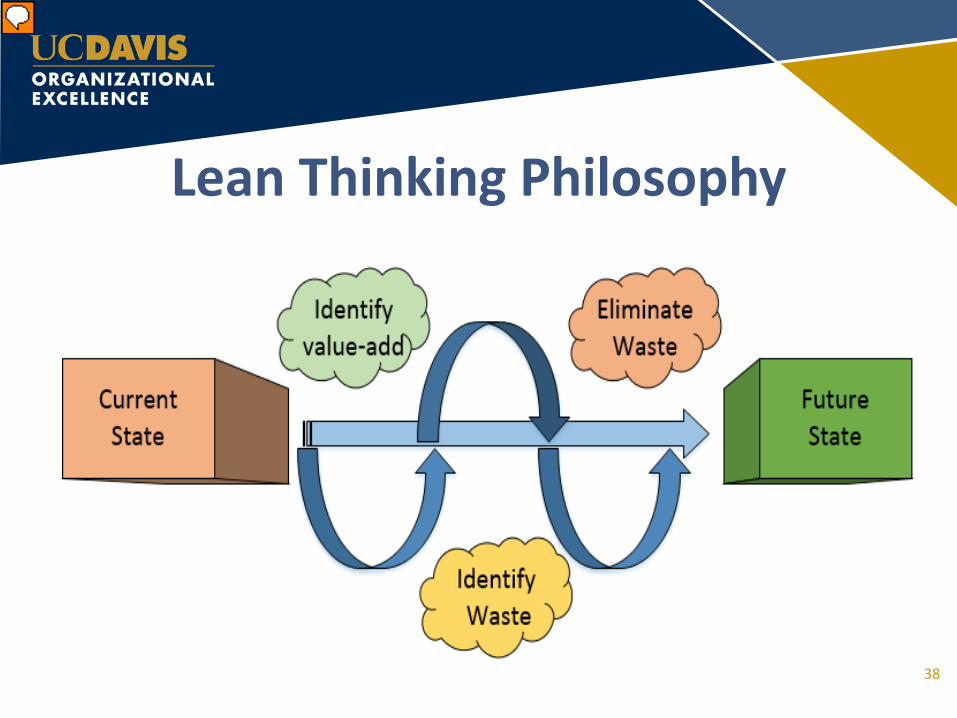
Lean Thinking Philosophy
38
So far…
• Value add; non-value add; essential non-value add
• Lean’s 8 Wastes • Current state process mapping • Removing waste from a process • Future state process mapping
39
Searching for files in a file room is what type of waste?
1. Defect 2. Motion 3. Overproduction 4. Transportation
40
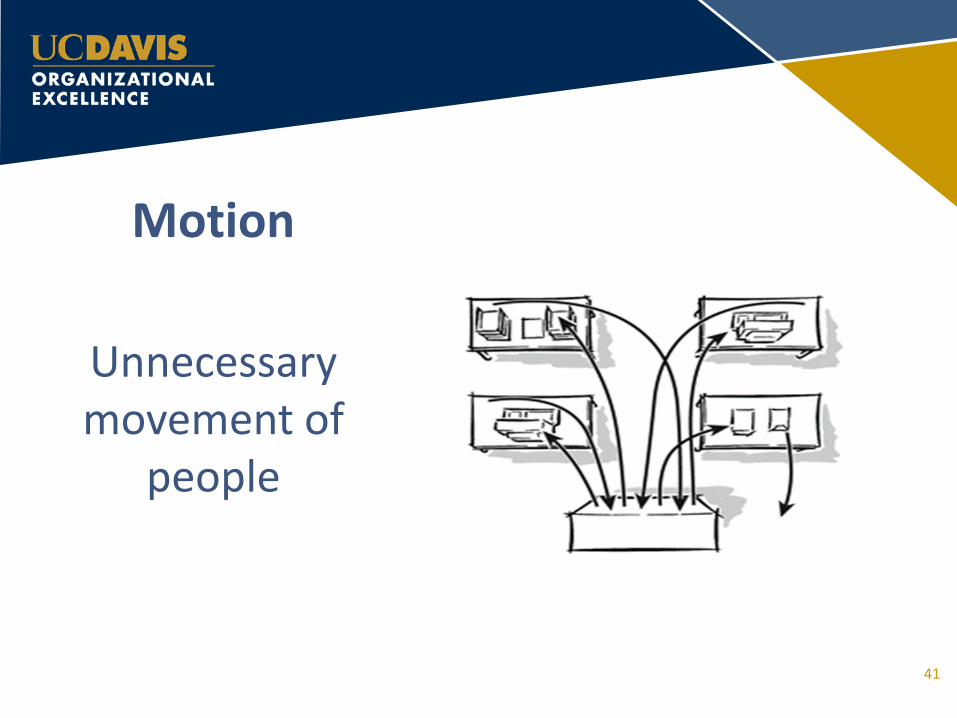
Motion
Unnecessary movement of
people
41
What type of waste is producing reports that no one reads?
1. Inventory/Storage 2. Motion 3. Non-utilizing staff 4. Overproduction
42
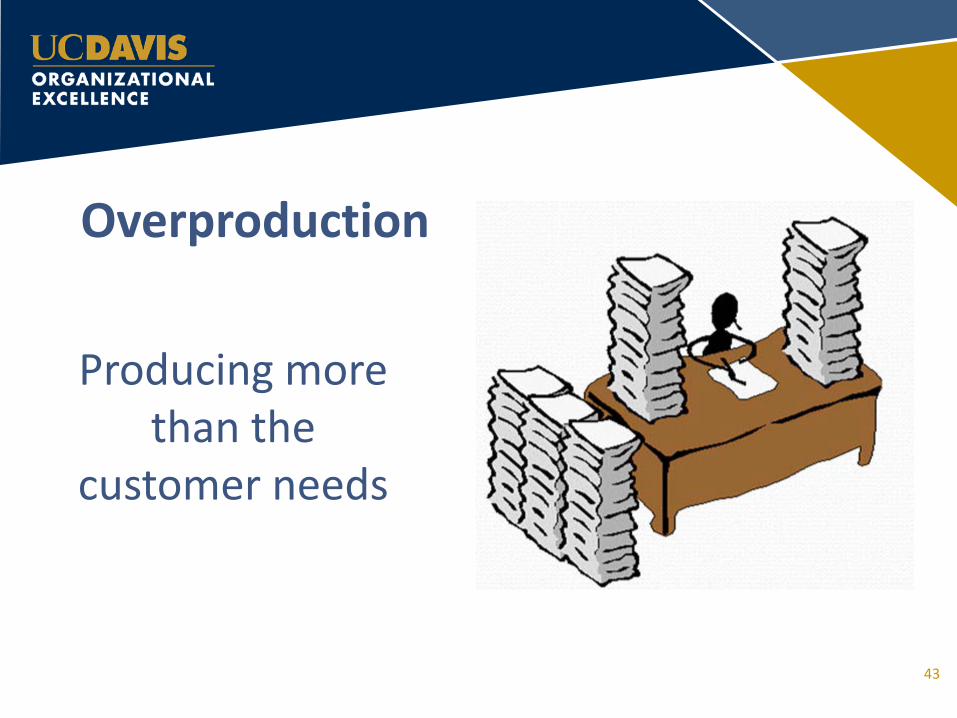
Overproduction
Producing more than the
customer needs
43
What type of waste do I create when I require more approvals than are
required by policy?
1. Extra Processing 2. Overproduction 3. Waiting 4. Motion
44
Extra Processing
Process steps that do not add
value for the customer
45
A Cross Functional Flowchart is unique because of its:
1. Activity shapes 2. Technology 3. Available colors 4. Swim lanes
46
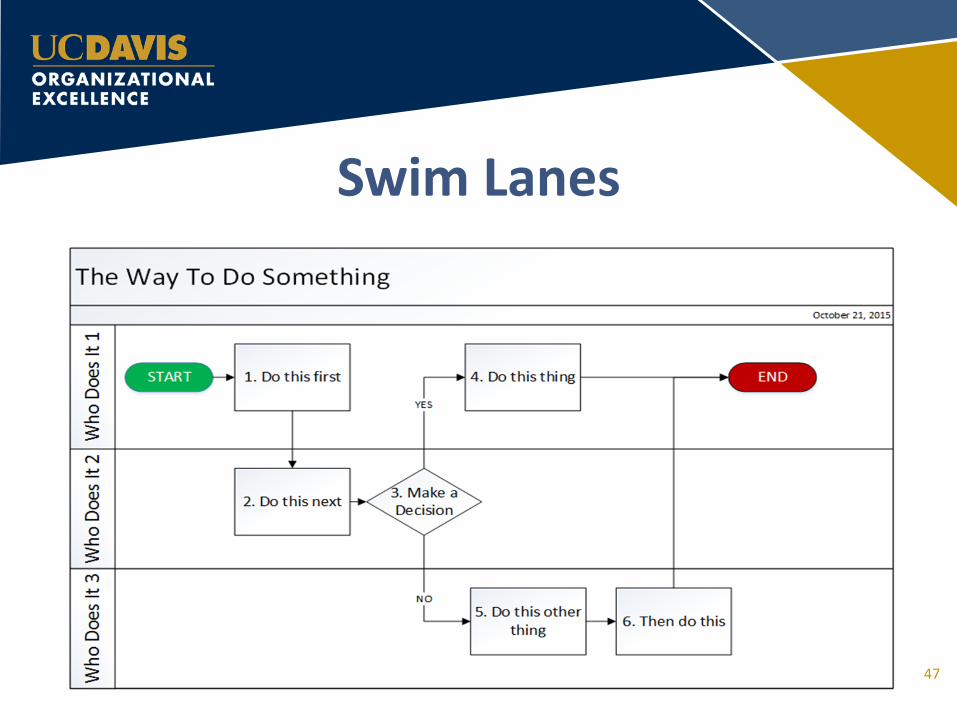
Swim Lanes
47
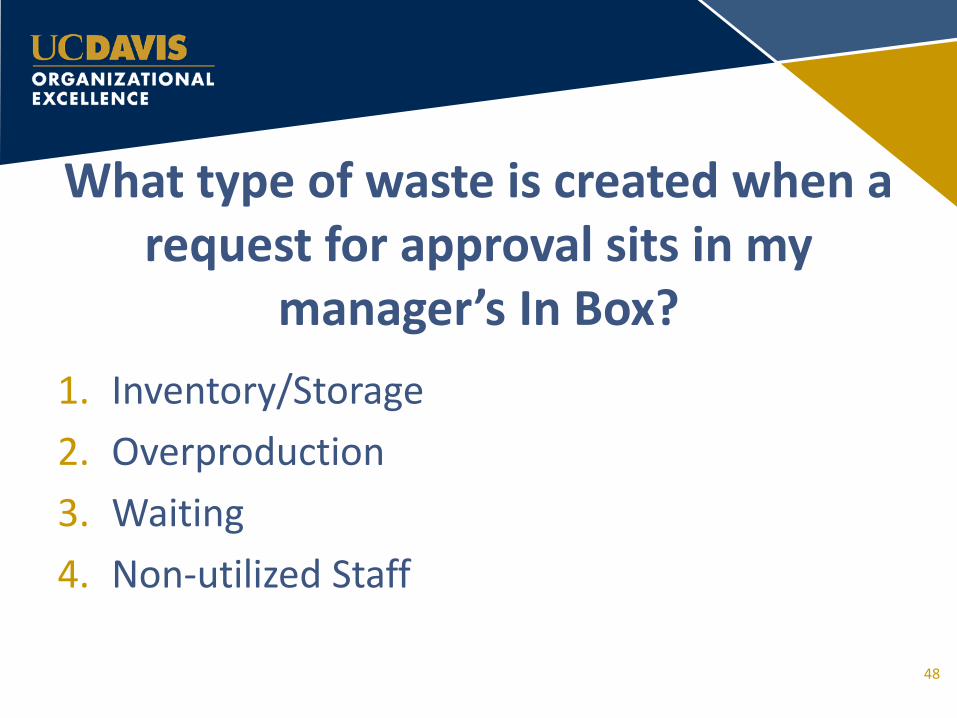
What type of waste is created when a request for approval sits in my
manager’s In Box? 1. Inventory/Storage 2. Overproduction 3. Waiting 4. Non-utilized Staff
48
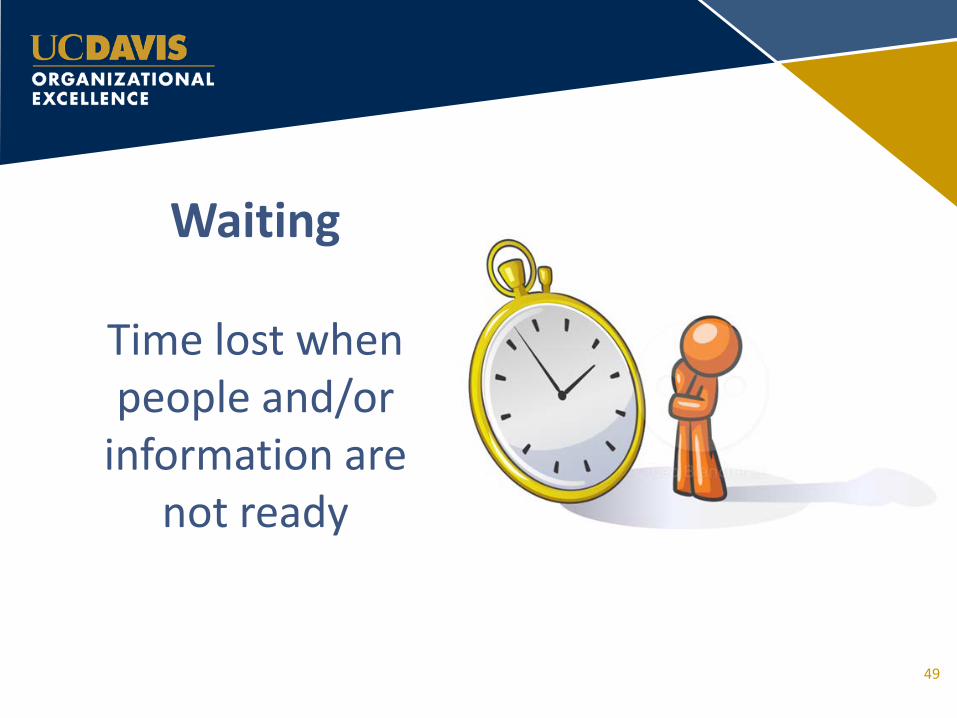
Waiting
Time lost when people and/or
information are not ready
49
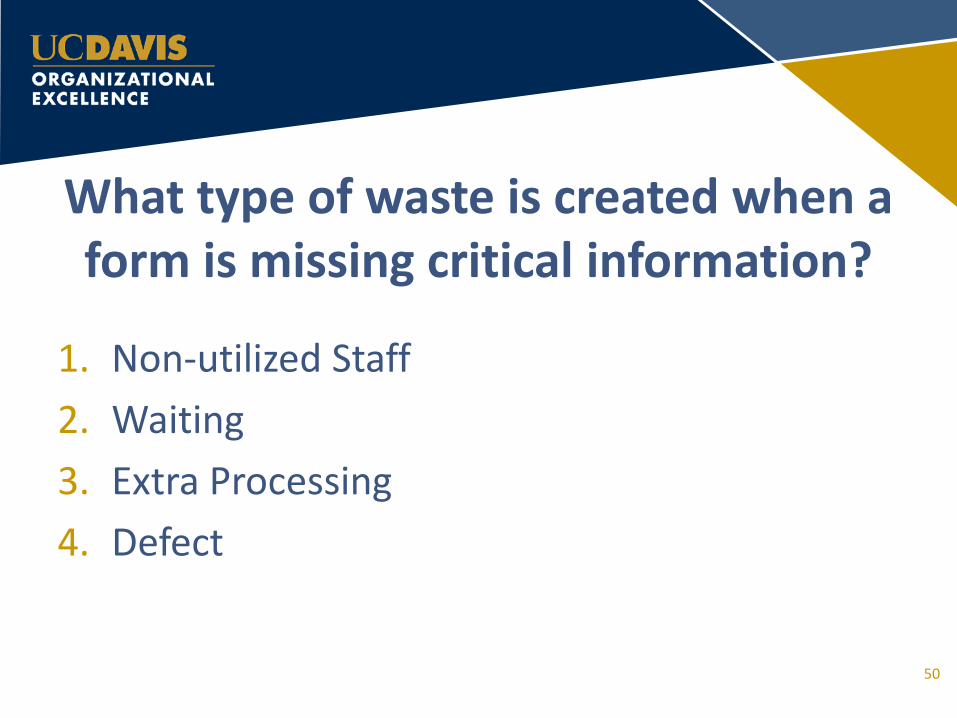
What type of waste is created when a form is missing critical information?
1. Non-utilized Staff 2. Waiting 3. Extra Processing 4. Defect
50
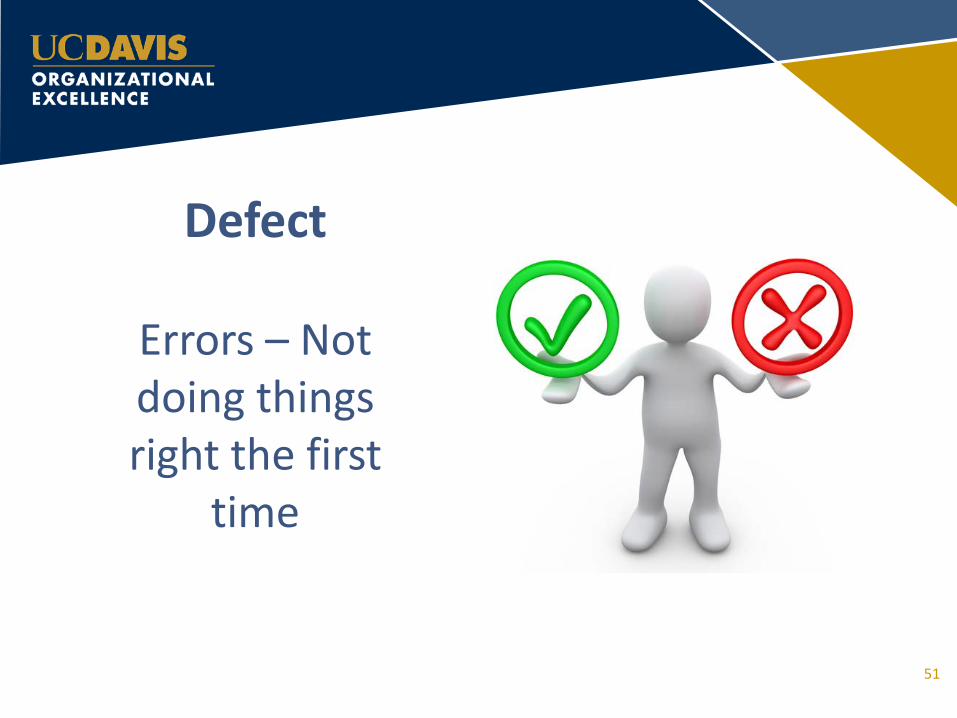
Defect
Errors – Not doing things right the first
time
51
The diamond shape on a process map represents:
1. A task 2. A decision point 3. A start point 4. An end point
52
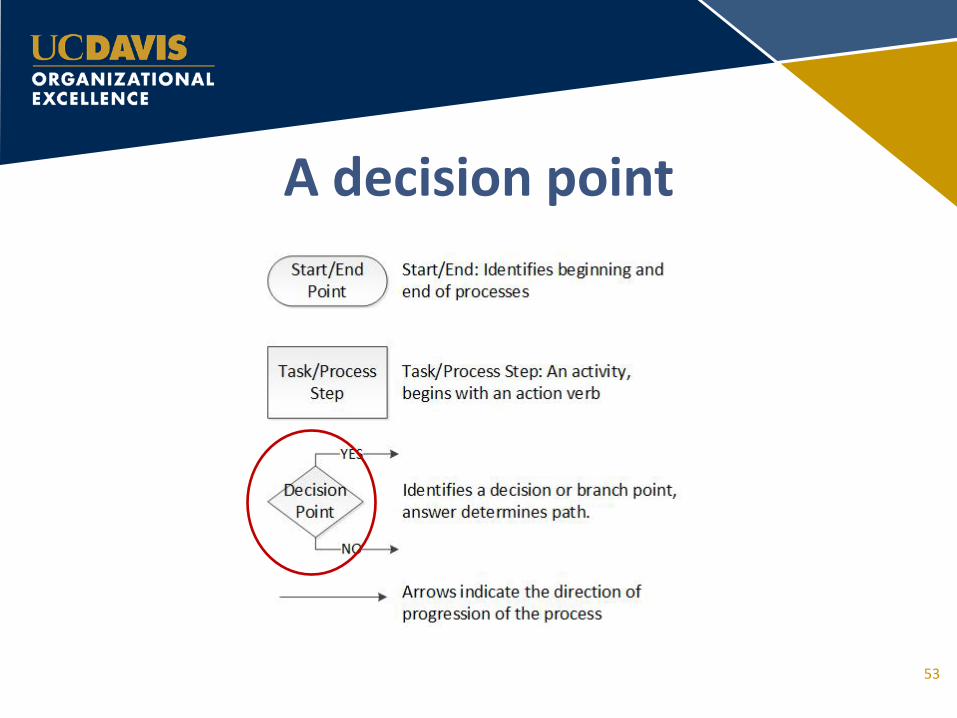
A decision point
53
What type of waste is created when I keep files from 1999?
1. Inventory/Storage 2. Waiting 3. Extra Processing 4. Defect
54
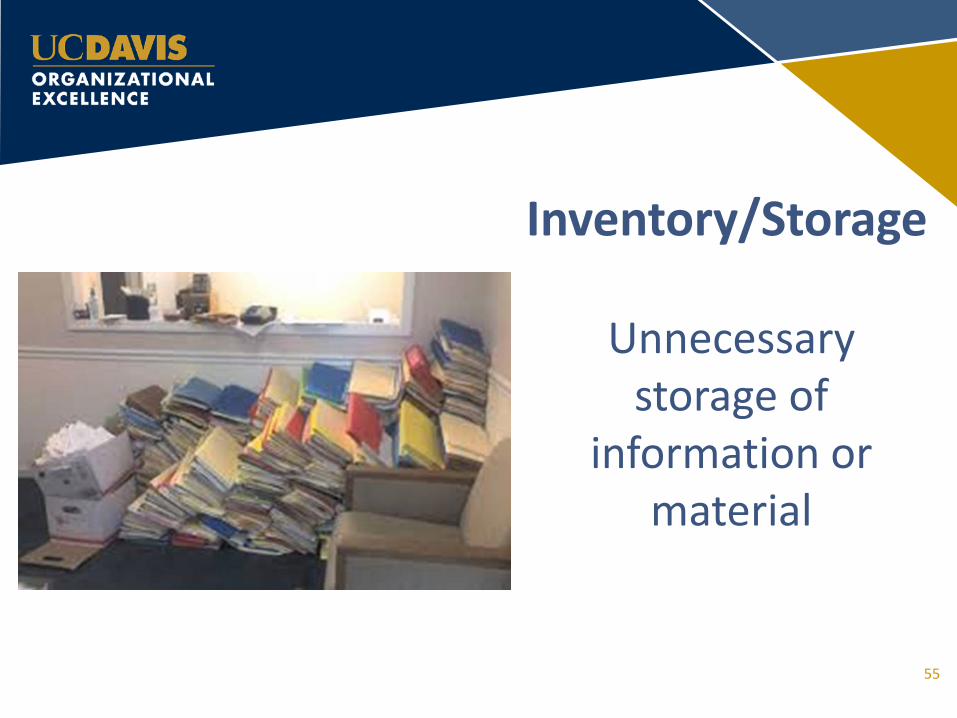
Inventory/Storage
Unnecessary storage of
information or material
55
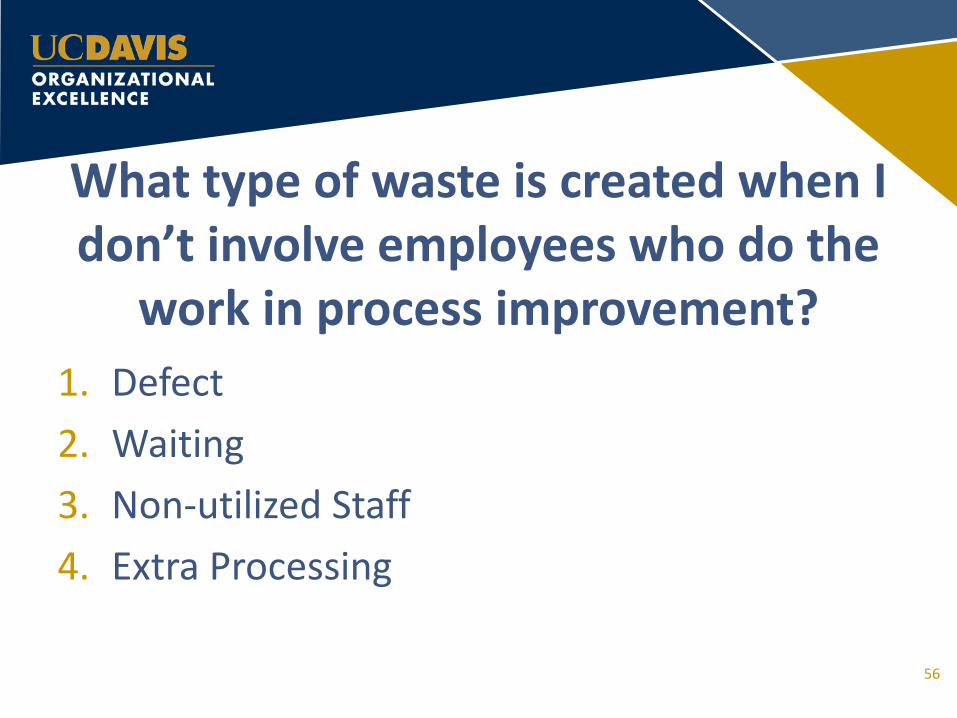
What type of waste is created when I don’t involve employees who do the
work in process improvement? 1. Defect 2. Waiting 3. Non-utilized Staff 4. Extra Processing
56
Non-utilized Staff
Not leveraging peoples’ skills, creativity and
talents
57
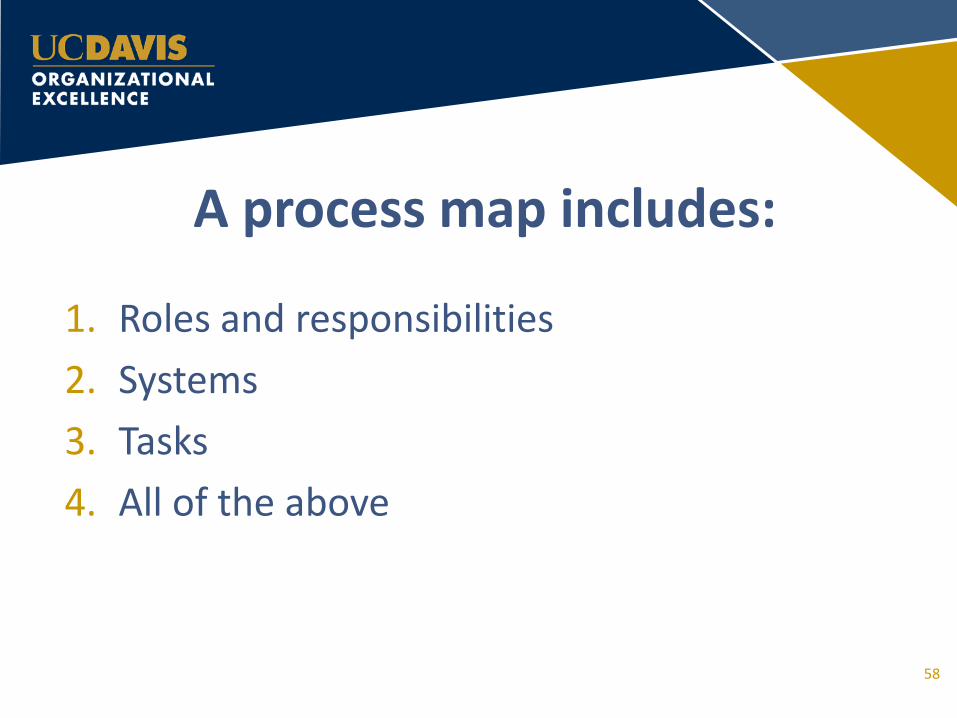
A process map includes:
1. Roles and responsibilities 2. Systems 3. Tasks 4. All of the above
58
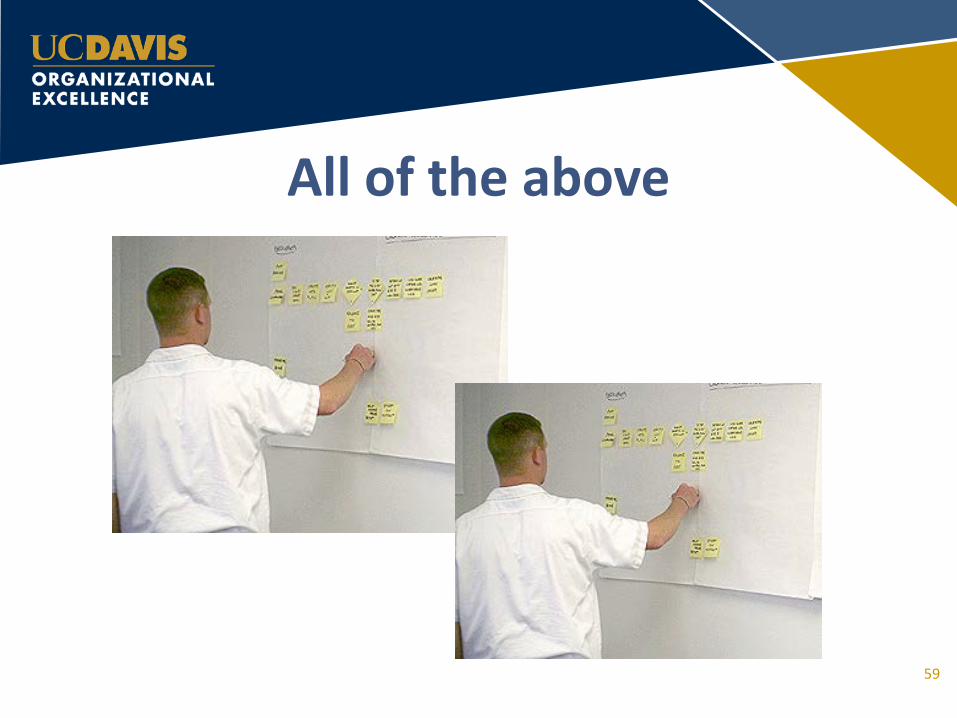
All of the above
59
What type of waste is created when I hand deliver my unit’s invoices to an
office off campus? 1. Extra Processing 2. Overproduction 3. Transportation 4. Waiting
60
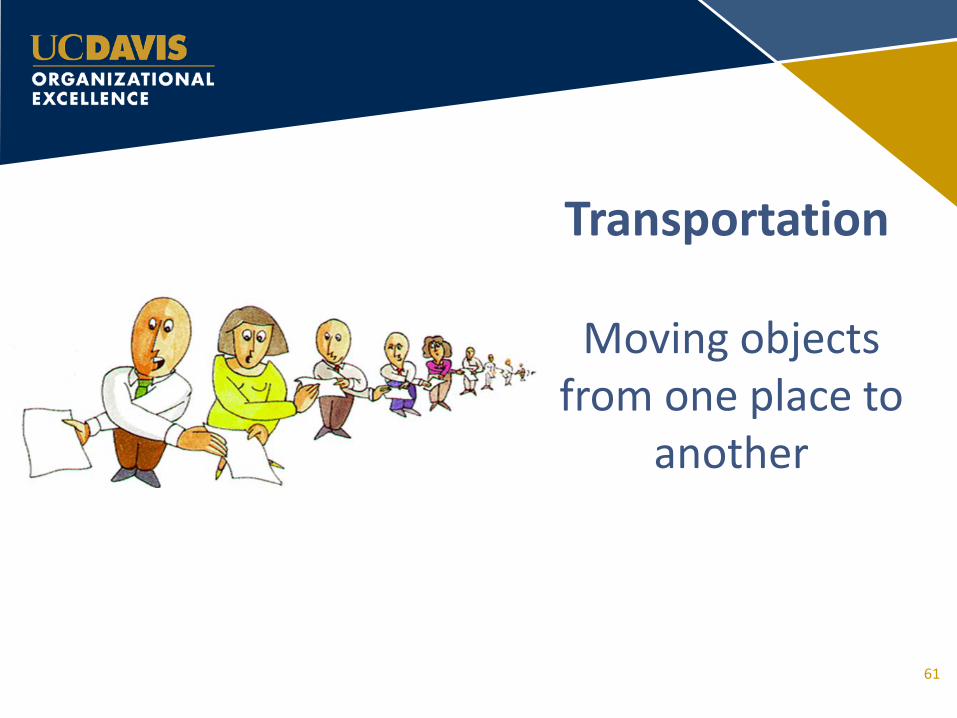
Transportation
Moving objects from one place to
another
61
When considering process improvement, what is always the first
consideration in a Lean culture? 1. Metrics 2. Reducing the number of steps in the process 3. The customer’s viewpoint 4. Who to involve in a mapping session
62
63
One of the Three Pillars of a Lean Culture is:
1. Map processes 2. Get leadership support 3. Respect people 4. Provide technology
64
Respect People
65
Finding the Root Cause
66
5 Whys • A simple technique to get to the root of a
problem • Asking questions
– Challenges assumptions – Uncovers how much people really know about a
process and its inherent outcome(s) • Not necessarily about asking “why” 5 times, but
asking it as many times as needed to get to the real cause of a problem
• Focus is on process 67
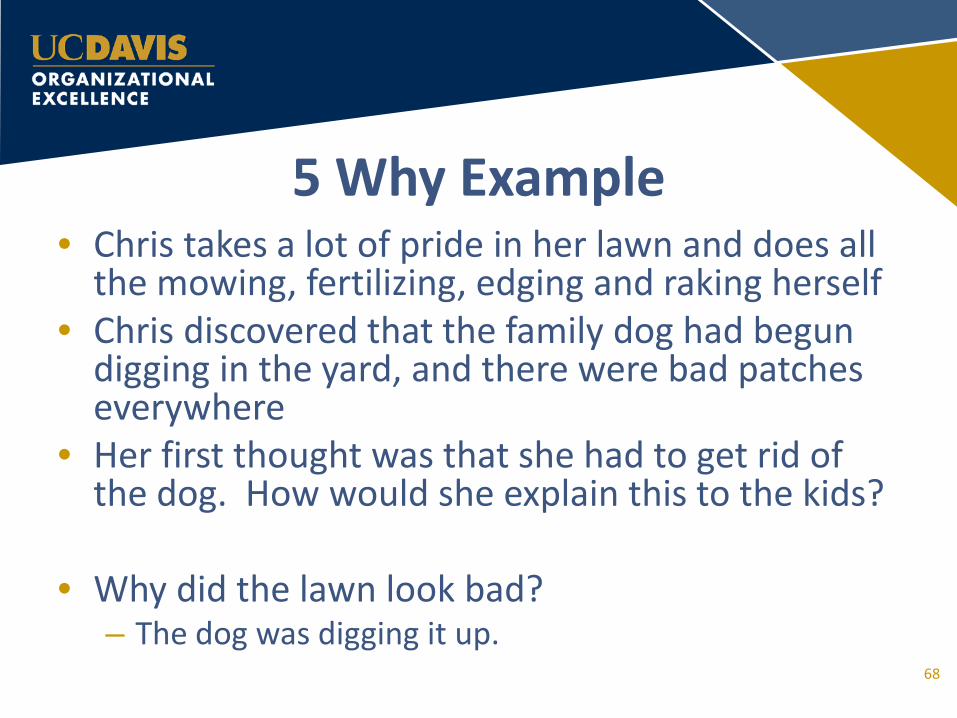
5 Why Example • Chris takes a lot of pride in her lawn and does all
the mowing, fertilizing, edging and raking herself • Chris discovered that the family dog had begun
digging in the yard, and there were bad patches everywhere
• Her first thought was that she had to get rid of the dog. How would she explain this to the kids?
• Why did the lawn look bad?
– The dog was digging it up.
68
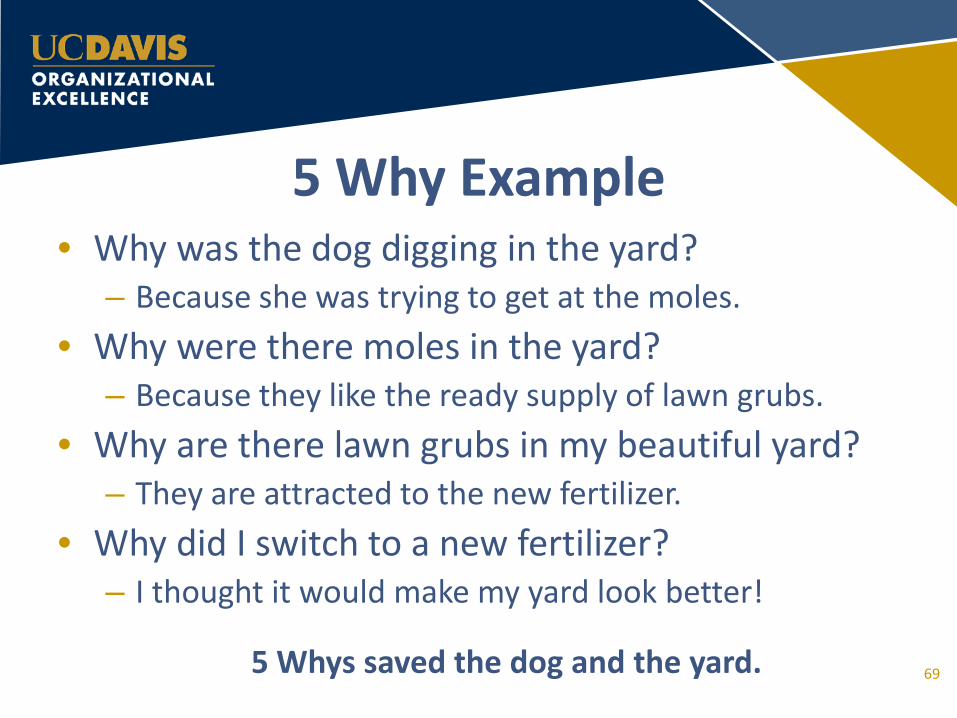
5 Why Example • Why was the dog digging in the yard?
– Because she was trying to get at the moles. • Why were there moles in the yard?
– Because they like the ready supply of lawn grubs. • Why are there lawn grubs in my beautiful yard?
– They are attracted to the new fertilizer. • Why did I switch to a new fertilizer?
– I thought it would make my yard look better!
5 Whys saved the dog and the yard.
69
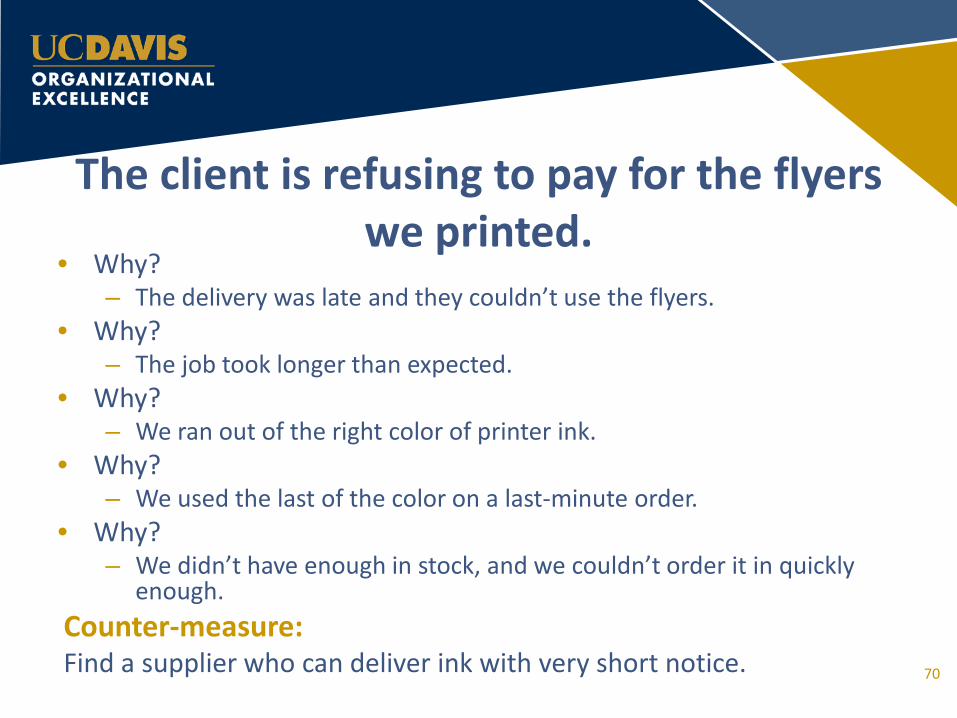
The client is refusing to pay for the flyers we printed.
• Why? – The delivery was late and they couldn’t use the flyers.
• Why? – The job took longer than expected.
• Why? – We ran out of the right color of printer ink.
• Why? – We used the last of the color on a last-minute order.
• Why? – We didn’t have enough in stock, and we couldn’t order it in quickly
enough. Counter-measure: Find a supplier who can deliver ink with very short notice.
70
5 Whys
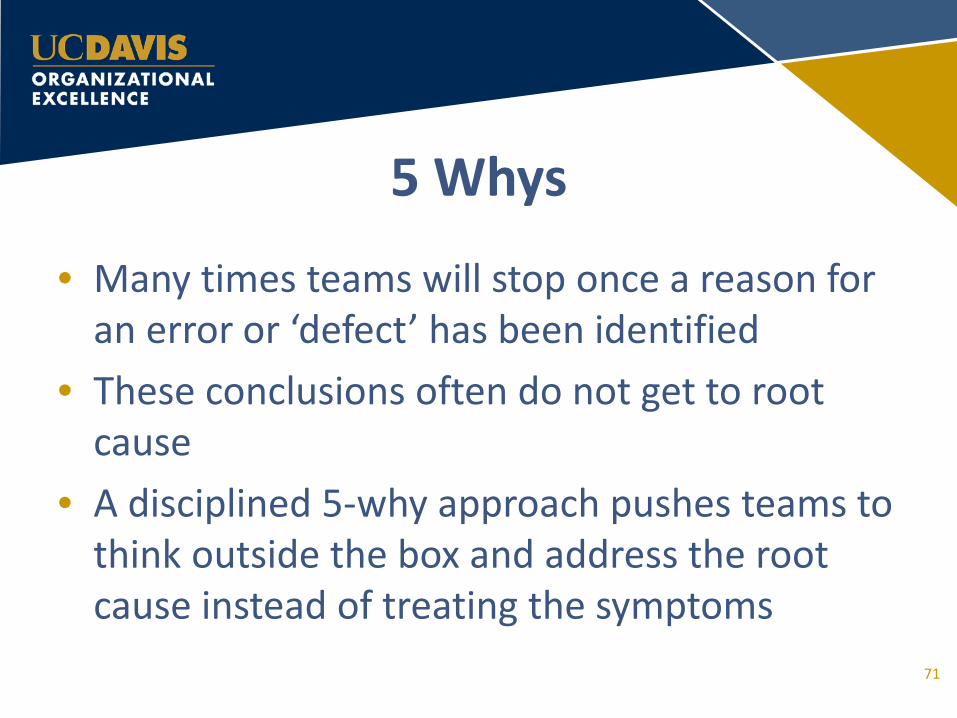
• Many times teams will stop once a reason for an error or ‘defect’ has been identified
• These conclusions often do not get to root cause
• A disciplined 5-why approach pushes teams to think outside the box and address the root cause instead of treating the symptoms
71
Measurement
72
Why Measure?
• To identify whether we are meeting customer requirements
• To help us understand our processes • To confirm what we know or reveal what we
don’t know
73
Why Measure?
• To ensure decisions are based on fact, not on emotion
• To show if improvements actually happened • To reveal problems that bias, emotion and
longevity cover up
74
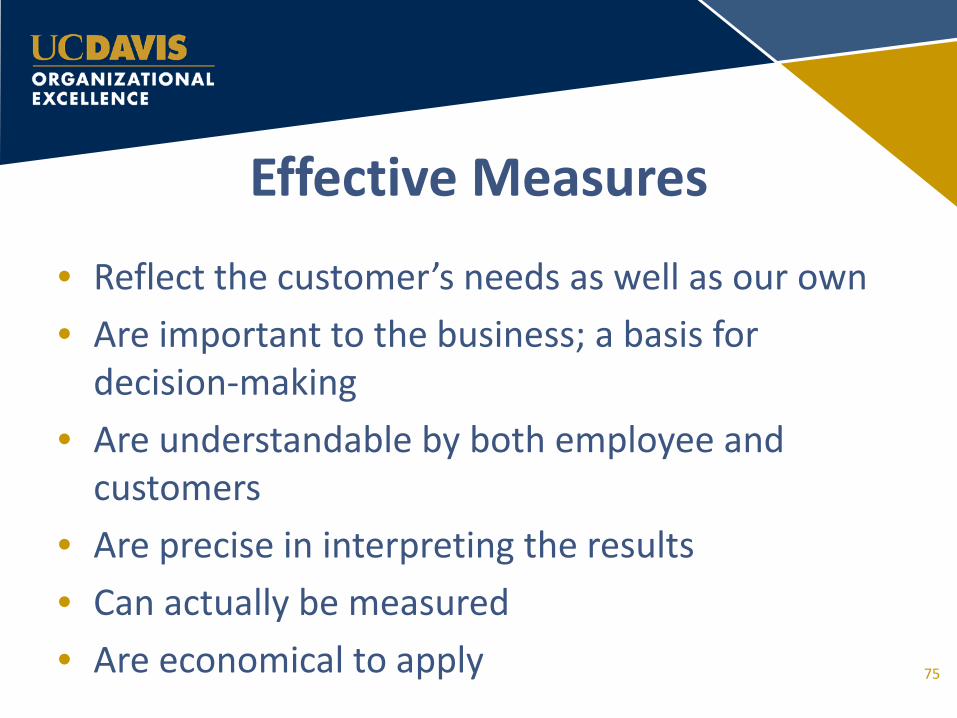
Effective Measures
• Reflect the customer’s needs as well as our own • Are important to the business; a basis for
decision-making • Are understandable by both employee and
customers • Are precise in interpreting the results • Can actually be measured • Are economical to apply 75
Data Driven Decisions • If you hear complaints that a process doesn’t
work or is too slow… – Gather data to confirm
• If you have difficulty deciding which solution will work best? – Test and make decisions based on data
• The only way to show success is through data • Verify anecdotes and feelings with data!
76
Measures in Our Environment
• Timeliness • Costs and/or Revenue • Error Rate • Productivity • Process complexity • Customer satisfaction
77
How to apply Lean in your work
78
Think Lean
• Customer is always the priority • Identify what adds value for the customer and
what doesn’t • Ask why…5 times • Identify and remove the waste in processes • Standardize processes where possible • Measure
79
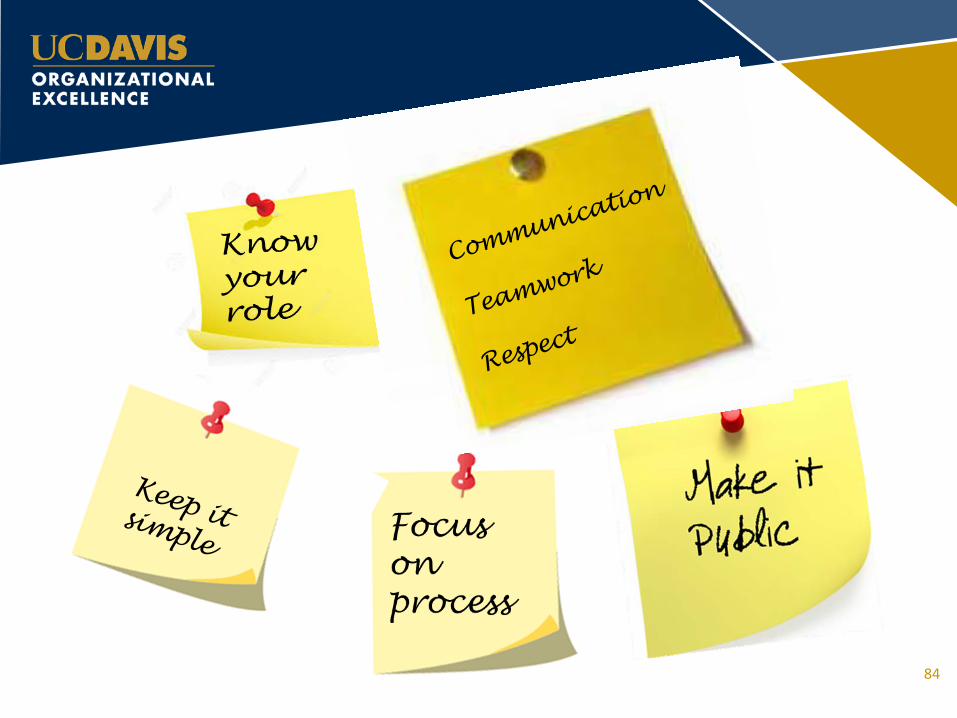
Your Lean unit • Everyone understands their roles and
responsibilities • Problems are brought out in the open • The focus is on the process • Ingenuity is used to ‘improve the system’ • Employees are empowered to solve problems,
make improvements • Communication, teamwork and respect are the
norm
80
What Processes Are Ripe for Lean? • Take five (5) minutes at your table and fill out
the worksheet – Identify a process that is ripe for improvement – Who would need to be involved in the mapping
session? – What are some of the types of waste you have
observed in the process? – What might you measure to show improvement
progress?
81
What Processes Are Ripe for Lean?
• Take five (5) minutes at your table and fill out the worksheet – What actions do you commit to take to ensure this
process is addressed when you return to the office?
– Identify a partner at your table that you will follow up with in two weeks to check on your progress.
– How might you influence leadership to create a Lean culture in your unit? 82
Lean and You
• Anyone can play a role in Lean process improvement
• In Lean organizations, front line employees are the source of most process improvements
• When you need additional leadership support to improve a process, think of someone who is an effective sponsor of change
83
84
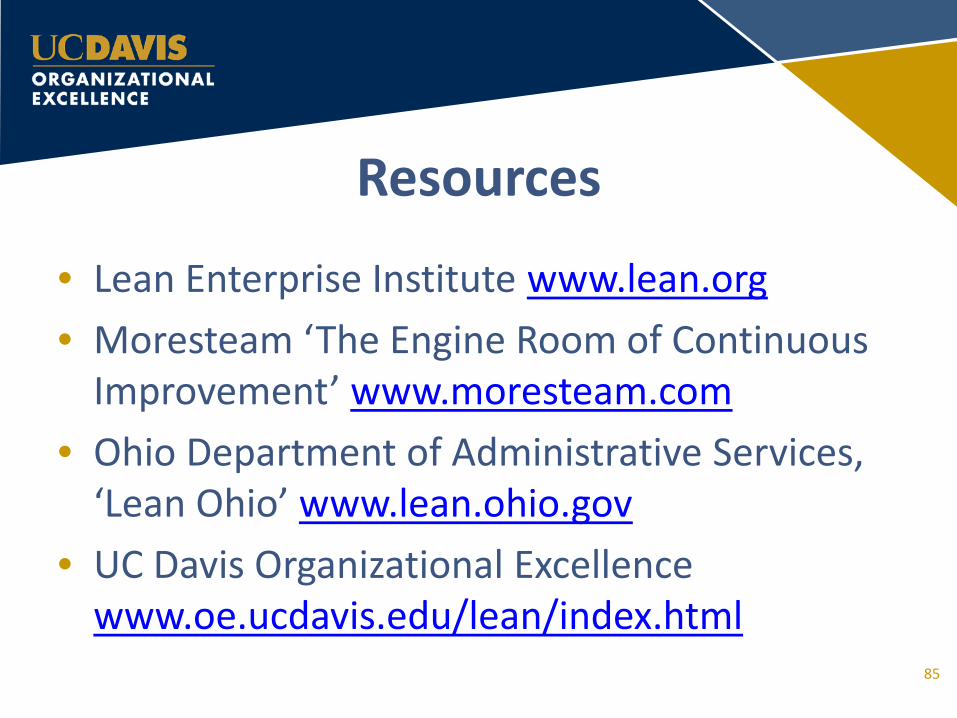
Resources
• Lean Enterprise Institute www.lean.org • Moresteam ‘The Engine Room of Continuous
Improvement’ www.moresteam.com • Ohio Department of Administrative Services,
‘Lean Ohio’ www.lean.ohio.gov • UC Davis Organizational Excellence
www.oe.ucdavis.edu/lean/index.html 85
THANK YOU!
86
Recommended