THESIS
THREE MECHANISMS
OF
BREAKDOWN OF PYREX GLASS
R. A. SWAN, JR.
and
W. F. BARTLETT
Electrical Engineering Department
of
Massachusetts Institute of Technology
June, 1929
5%4cf
,
TABLE OF CONTVNTS .
Page
Acknowledgments 4
Introduction 5
Purpose of Thesis 11
Materials Used 12
Apparatus 15
Description of Test 19
Discussion of Results 2Z
Recommendations for Further Study 31
Conclusions 32
Appendices
Appendix 1 54
Appendix II 48
Bibliograpby 52
167497

Oambridge, Massachusetts
May 23, 1929.
Professor A. L. Merrill,Secretary of the Faculty,Massachusetts Institute of Technology
Dear Sir:
We respectfully submit a thesis entitled
"Three Mechanisms of Breakdowns of Pyrex Glass"
as a partial fulfillment of the requirements for
degree of Bachelor of Science in Electrical Engineer-
ing.
Respectfully submitted,
Z _ /_ _

-4; -rrI ai
ACKNOWLEDGMENTS
The authors of this thesis wish to take
this opportunity to express their sincere apprecia-
tion for the guidance and cooperation of Mr. P. H.
Moon, and to acknowledge their indebtedness to
Mr. A. S. Norcross for his valuable suggestions.
r"- a&
INTRODUCTION
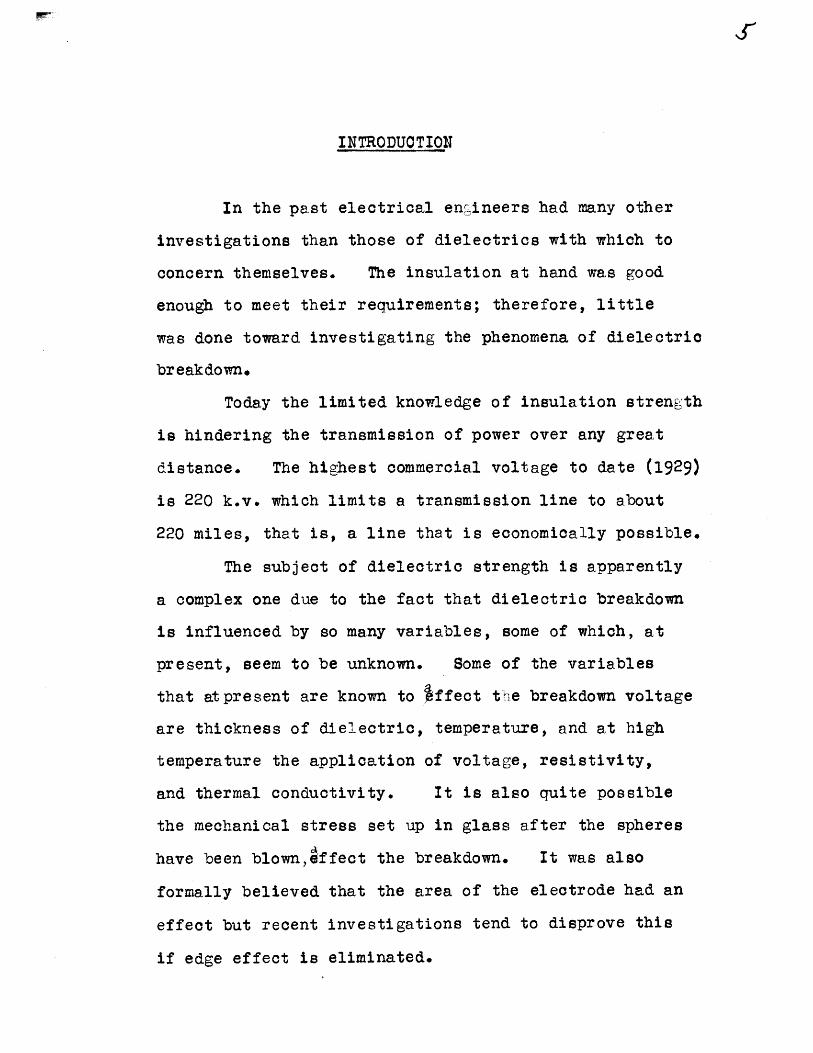
In the past electrical engineers had many other
investigations than those of dielectrics with which to
concern themselves. The insulation at hand was good
enough to meet their requirements; therefore, little
was done toward investigating the phenomena of dielectric
breakdown.
Today the limited knowledge of insulation strength
is hindering the transmission of power over any great
distance. The highest commercial voltage to date (1929)
is 220 k.v. which limits a transmission line to about
220 miles, that is, a line that is economically possible.
The subject of dielectric strength is apparently
a complex one due to the fact that dielectric breakdown
is influenced by so many variables, some of which, at
present, seem to be unknown. Some of the variables
that atpresent are known to 3ffect the breakdown voltage
are thickness of dielectric, temperature, and at high
temperature the application of voltage, resistivity,
and thermal conductivity. It is also quite possible
the mechanical stress set up in glass after the spheres
have been blown,effect the breakdown. It was also
formally believed that the area of the electrode had an
effect but recent investigations tend to disprove this
if edge effect is eliminated.
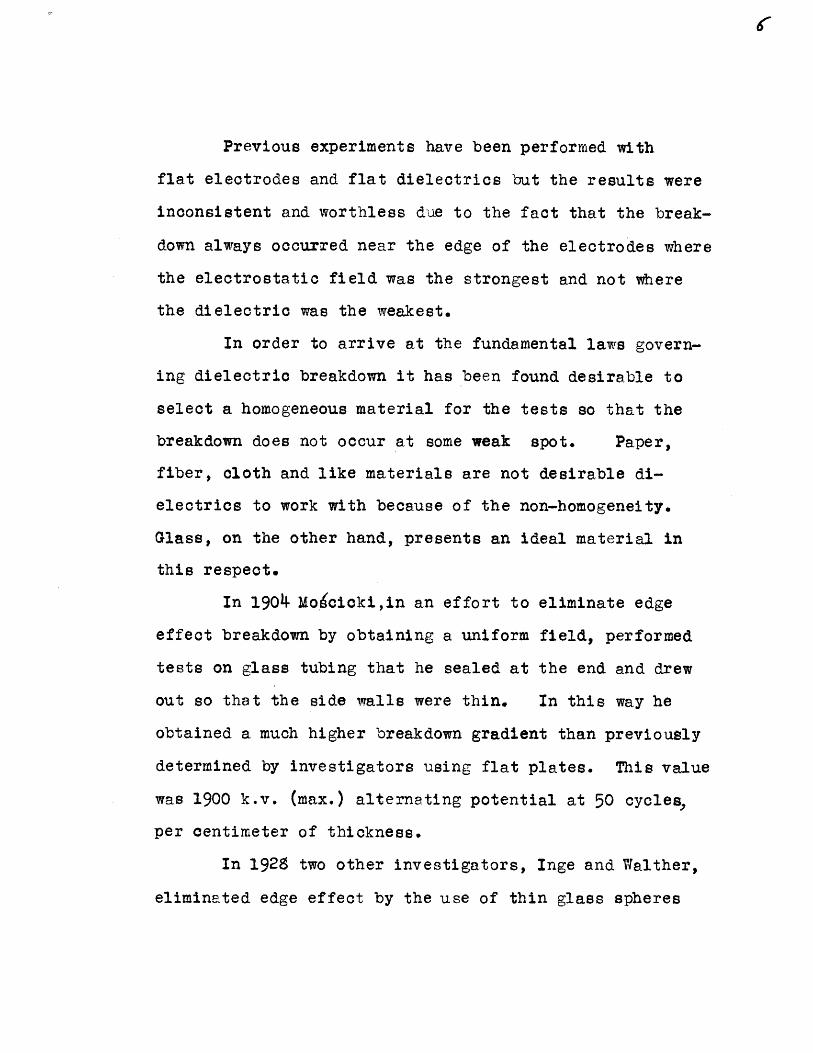
Previous experiments have been performed with
flat electrodes and flat dielectrics but the results were
inconsistent and worthless due to the fact that the break-
down always occurred near the edge of the electrodes where
the electrostatic field was the strongest and not where
the dielectric was the weakest.
In order to arrive at the fundamental laws govern-
ing dielectric breakdown it has been found desirable to
select a homogeneous material for the tests so that the
breakdown does not occur at some weak spot. Paper,
fiber, cloth and like materials are not desirable di-
electrics to work with because of the non-homogeneity.
Glass, on the other hand, presents an ideal material in
this respect.
In 1904 Mo~cicki,in an effort to eliminate edge
effect breakdown by obtaining a uniform field, performed
tests on glass tubing that he sealed at the end and drew
out so that the side walls were thin. In this way he
obtained a much higher breakdown gradient than previously
determined by investigators using flat plates. This value
was 1900 k.v. (max.) alternating potential at 50 cycles,
per centimeter of thickness.
In 1928 two other investigators, Inge and Walther,
eliminated edge effect by the use of thin glass spheres
and also by placing the electrodes and flat specimens
in a semi-conducting bath. They thus greatly increased
the gradient. Their value was 3100 kilovolts per centi-
meter for both alternating and direct potentials.
More recently, Inge and Walther, after eliminating
edge effect by blowing spheres, made some experiments
with thin glass at low temperatures and found the break-
down gradient independent of the thickness.
In 1922 Wagner made public his thermal theory of
breakdown of solid dielectrics. While conducting tests
Wagner noticed that just prior to the rupture the speci-
ments would be heated in some spots and comparatively
cool in others. Interrupting a test before breakdown
he observed that the electrical qualities of the hot and
cold spots were practically the same. According to
Wagner, for a given temperature, breakdown voltage is
proportional to the thickness.
Inge and Walther, during their experiments, found
that this was tQae and also that, for a given thickness
of specimen, with a decrease in temperature a point is
finally reached where a continued decrease in temperature
no longer lowers the breakdown voltage. This last region
is known as the disruptive region.
____ __ _ _;_C_ _I
In between these two regions they found a smooth
curve connecting the two mechanism. This disruptive
region was first theoretically determined by Rob6wski
who in a report worked out from the structure of the
molecule of a simple polarized lattice of sodium chloride,
mathematical relations which showed the breakdown
gradient independent of thickness. This value was
100 - 200 million volts/cm. He believed breakdowns
of this type were caused by the rupture of the molecule
and called it the disruptive region.
Just prior to Rogewski's work, Joffe presented
his ionization theory of breakdown. He set forth
that ionization of the dielectric,caused by the poten-
tial gradient, finally lead to the breakdown. Inge
and Walther at the time of their work believed they
had experimentally found this ionization region but
no1 it is believed that their breakdowns occurred in
the disruptive region and the region they set forth
as indefinite was really the ionization one.
To return to the thermal breakdown of Wagner,
all insulating materials have a negative temperature
coefficient, that is, as the temperature increases the
resistance decreases so that at high temperatures
normally good insulators become good conductors. Wagner

then stated that due to the non-homogeneity, the conduc-
tivity of one section will differ from that of another.
The point of highest conductivity will heat up, thereby
decreasing the resistance, allowing more current to flow
and the process repeats itself. This accumulative effect
causes the rupture when the hottest spot burns through.
In 1928, Moon and Norcross of the Electrical
Engineering Department of the Massachusetts Institute of
Technology attempted to verify the results of Inge and
Walther and to study the intermediate region in more
detail by varying the temperature through a wider range.
Their results tend to show three definite regions as
outlined above; disruptive, ionization and thermal.
They used lime glass,G-1 (lead) glassand mica and
both known means of eliminating edge breakdown, (spheres
and flat specimens in a semi-conducting bath). They
found that their curves for G-1 glass fitted the five
points of Inge and Walther as well as those the latter
drew.
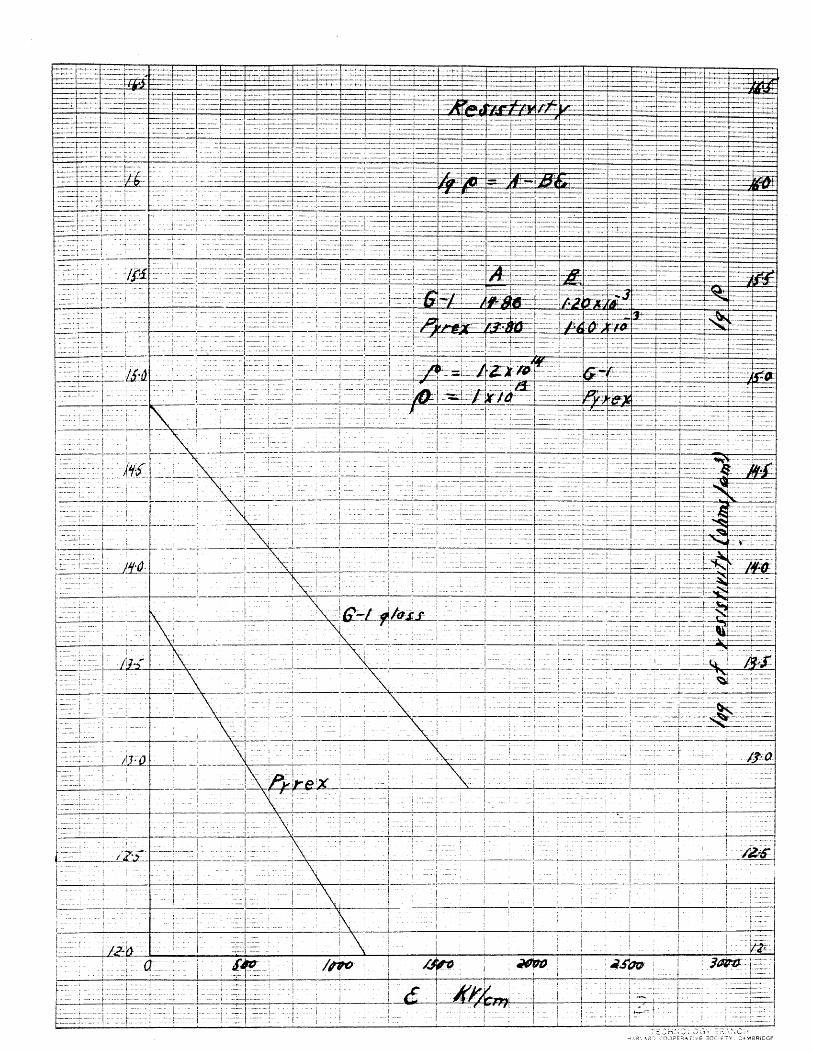
The thermal region has been most successfully
studied. It seems that the value of voltage obtained
in this region depends on the resistivity of the speoi-
men. Moon and Norcross give the following formula
for this region for G-1 glass;
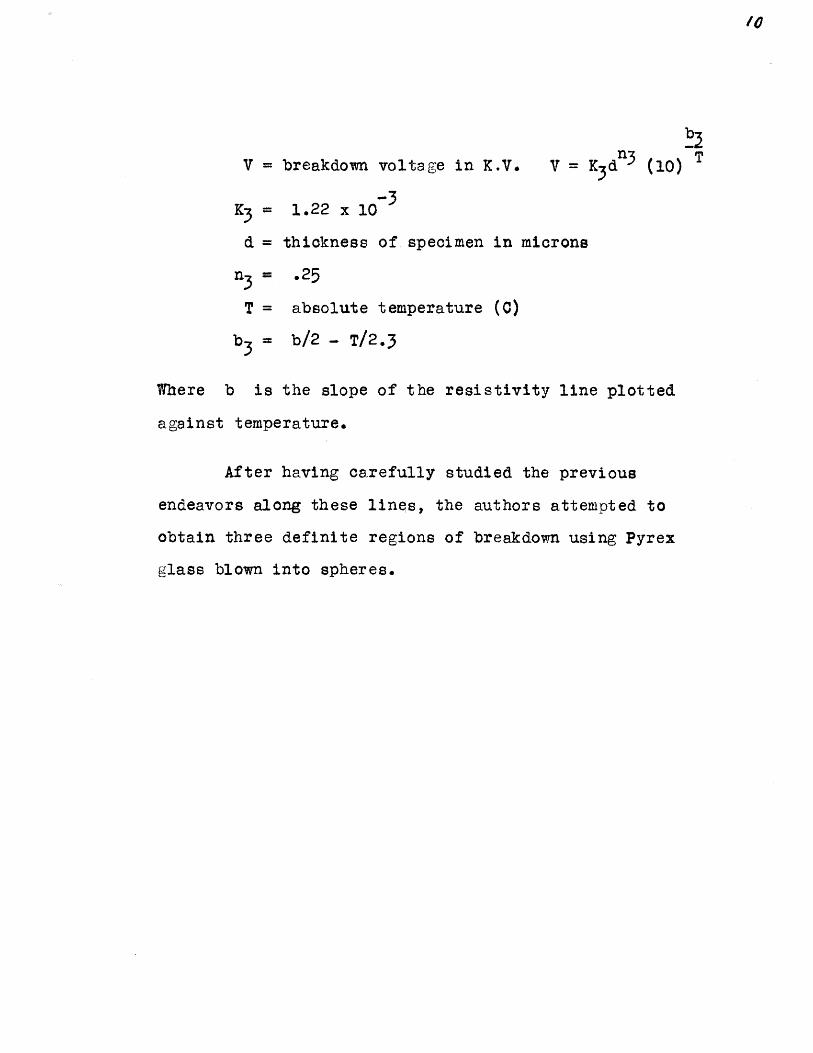
V = breakdown voltage in K.V. V = K3 dn (10) T
K3 = 1.22 x 10
d = thickness of specimen in microns
n3 = .25
T = absolute temperature (0)
b = b/2 - T/2.3
Where b is the slope of the resistivity line plotted
against temperature.
After having carefully studied the previous
endeavors along these lines, the authors attempted to
obtain three definite regions of breakdown using Pyrex
glass blown into spheres.
PURPOSE OF THESIS
The object of this thesis is to determine, if
possible, the three mechanisms of breakdown of Pyrex
glass and to verify the theory of dielectric break-
down as applied by Moon and Norcross to lime and
lead glass.
~_ _
MATERIAL USED
Pyrex glass was used to obtain similar data to
those obtained on lime and lead glass by Messrs.
Moon and Norcross in order to verify their theory.
This material was readily obtained in tube
form from which we were able to blow spheres, thereby
apparently eliminating edge effect completely.
Pyrex glass is homogeneous, which is a necessary
quality in order to eliminate the possibility of weak
spot breakdown.
One undesirable feature is that the effect of
blowing spheres on the chemical and physical structure
of the glass is unknown.
_..~P5i-- ii -ii
I

/a
APPARATUS
A 100-kilovot kenetron rectifying set in the
Electrical Engineering Research Laboratory of the
Massachusetts Institute of Technology, was used for
the major part of the tests. At high temperatures,
where lower breakdown voltages were obtained, a 4000-
volt D.C. motor-generator set was used. The Pyrex
glass spheres were placed in a well in a thermally-
insulated iron block heated electrically, and the
electrode material filled this well and the specimen.
The temperatures were read: by means of a ther-
mometer that had a range from 0*0 - 400*0. Several
lower range thermometers were used to check this one
at lower temperatures and the higher range was cali-
brated against the boiling point of water and the
melting point of tin and it was found to be correct
within + 200. This was as accurate as the tempera-
ture could be held constant.
The heating block consisted of a piece of six
inch steel shafting with a well for the specimen. There
was also a hole for the thermometer so that it was
immersed in the electrode material. The illustra-
tion (Figure 1) shows clearly the layout of the heating
apparatus with the specimen in place. The block it-

Iron RodTo High VoiLage lus
To .,oLurLo
mercuryIron Dlocc
Heat Insulation
To 1 0 Volt IIC.
Heat ing }Ilonont
Heating Equipment
EieC ri
self was the ground connection while the iron rod
was the negative terminal on the Kenetron set and the
positive one on the motor generator set.
The Kenetron set consists of a high-voltage trans-
former, two kenetrons, and a condenser bank. These
could be connected to give 50 k.v. full-wave rectifica-
tion or 100 K.V. half-wave rectification. (See Figure 2).
The primary voltage was controlled by an induction
regulator and a motor driven rheostat. The high and
low voltage connections are given in Figures 2 and 3-
Tabulated data on the parts will be found in the
Appendix.
A voltmeter and ammeter in the primary gave the
operator an idea of the conditions on the low voltage
side but were not used in recording data.
The secondary voltage was read by an electrostatic
voltmeter constructed by P. H. Moon. (See Bibliography).
This voltmeter was used above 20 k.v. Below 20 k.v.
a Weston D. 0. voltmeter with a specially-constructed
multiplier was used. Both meters were read by teles-
copes outside the high tension cage.
When the motor-generator set was used, the high
potential was controlled by a hand operated drop wire
rheostat in the generator field and by a field rheostat
that varied the speed of the driving motor.
~----- -C-- - I ___ I I

()z0
I -'
IoZ
o
oZb0oIILj
I
U
~5ooLIIa.r
i
IL
""~~ =
-"==
~L
~-=
~9131rrr~
~
-.... --IIC
-III
~ -
-Ib
Z---- L
- ~
I IP
3
r I
-,~a~,~-~~~--~- ~,~-------
-
~r ~
~-rY
~IP
l~'~
~s~
~"c~
~~
--~--~
~c
" --r~*~-'~---Y-~---i-----
;-----;---' ~- -; ---
--~-------i.~ --
i
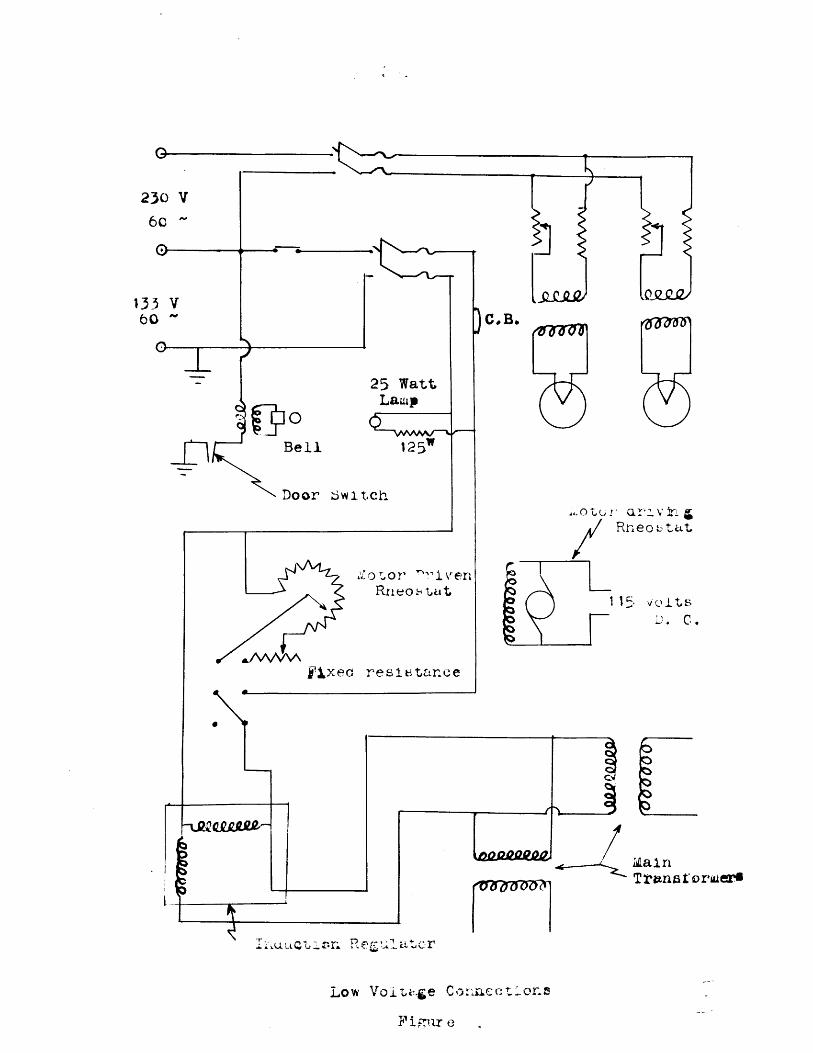
lain
It~ ~2&tcr
Low Voi-*.ge CO-ct*Ol
Finr e
S/6 2
When either set was used a water tube was placed
in series with the high potential lead in order to
limit the current when rupture occurred, to prevent
injury to the apparatus, and also to prevent shattering
of the specimen, if possible.
The following safety devices were used. All high
potential apparatus were inside a large metal fence, each
section of which was grounded to a heavy copper ground
wire which, in turn, was connected to two radiators and
to the neutral of the D.O. supply. The case of the
induction regulator was also grounded. A knife switch
on the door made it impossible to complete the circuit
without the door being closed and just before the door
was closed, a contact was made which rang a bell as a
warning to anyone who might have been inside the fence.
There is aleo a device that discharges the
condensers immediately when the cage door is opened,
thus doing away with the possibility of trouble with
residual charges.
When using the motor-generator set, the operator
sat at the driving motor and generator field controls
and read the voltmeter directly. This meter was never
more than 500 volts above ground because of the multipliers.
The frame of the generator was grounded for safety.
DESCRIPTION OF TEST
It was first necessary to heat the glass tubing and
seal up the end which was then blown into a sphere. To
vary the thickness of the spheres they were blown different
sizes and 8 mm. - 10 mm. tubing was used. The thickness
of the spheres varied from 15 microns (.015 mm.) to
400 microns (.4 mm.).
Mercury electrodes were used the greater .part of
the time. The block was filled with mercury and heated
to the desired temperature, and then the sphere also was
filled with mercury and placed in the well in the block.
The wire from the high-tension bus was then placed inside
the glass tube, sinking into the Hg. The iron block was
grounded. The voltage was then increased slowly until
the specimen was punctured, the voltage being recorded.
The specimen was then removed carefully, inserted
into a dilute solution of nitric acid to remove the
mercury. Pieces of glass around the hole were then
measured with micrometers. This was done very carefully
because a small error here had a great effect on the
resuilts. About six measurements were made of each speci-
men and the smallest reading wastaken as the thickness of
the specimen where the puncture occurred.
- ------i--;-----------:--- - ; -~
X
20
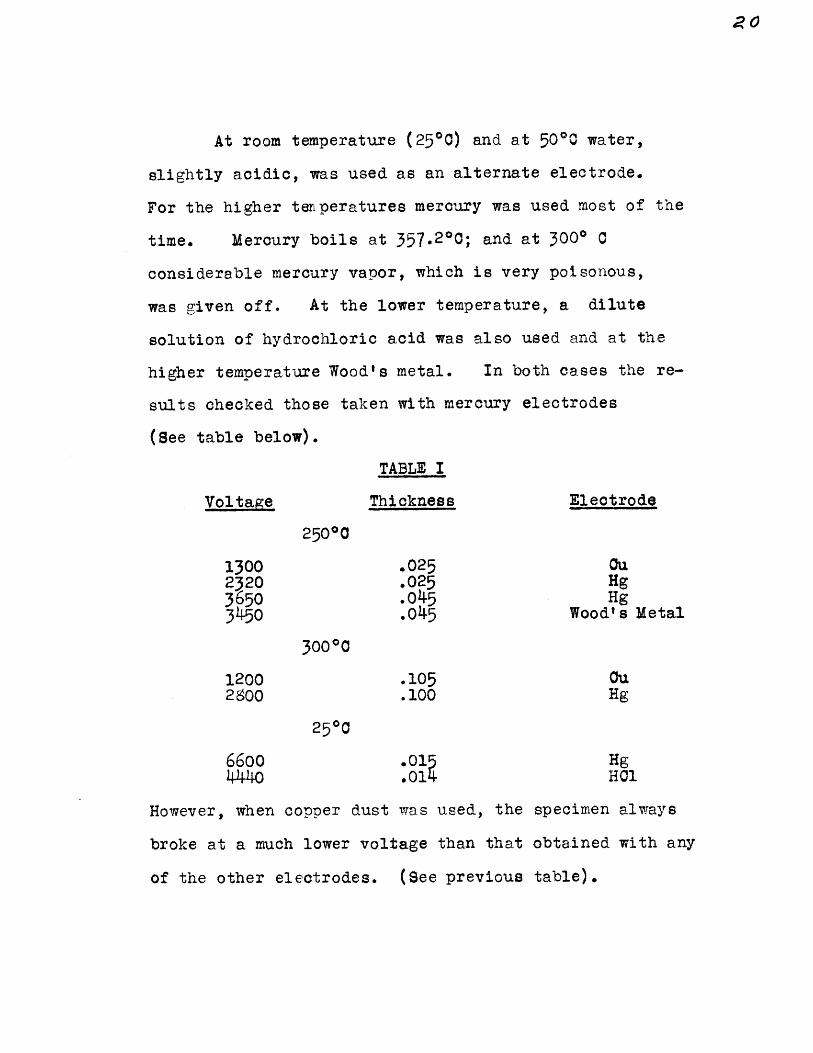
At room temperature (2500) and at 5000 water,
slightly acidic, was used as an alternate electrode.
For the higher terperatures mercury was used most of the
time. Mercury boils at 357.200; and at 3000 0
considerable mercury vapor, which is very poisonous,
was given off. At the lower temperature, a dilute
solution of hydrochloric acid was also used and at the
higher temperature Wood's metal. In both cases the re-
sults checked those taken with mercury electrodes
(See table below).
TABLE I
Voltage Thickness Electrode
25000
1300 .025 Ou2320 .025 Hg3650 .045 Hg3450 .045 Wood's Metal
3000
1200 .105 ou2800 .100 Hg
2500
66oo0 01 Hg4440 .014 H01
However, when copper dust was used, the specimen always
broke at a much lower voltage than that obtained with any
of the other electrodes. (See previous table).
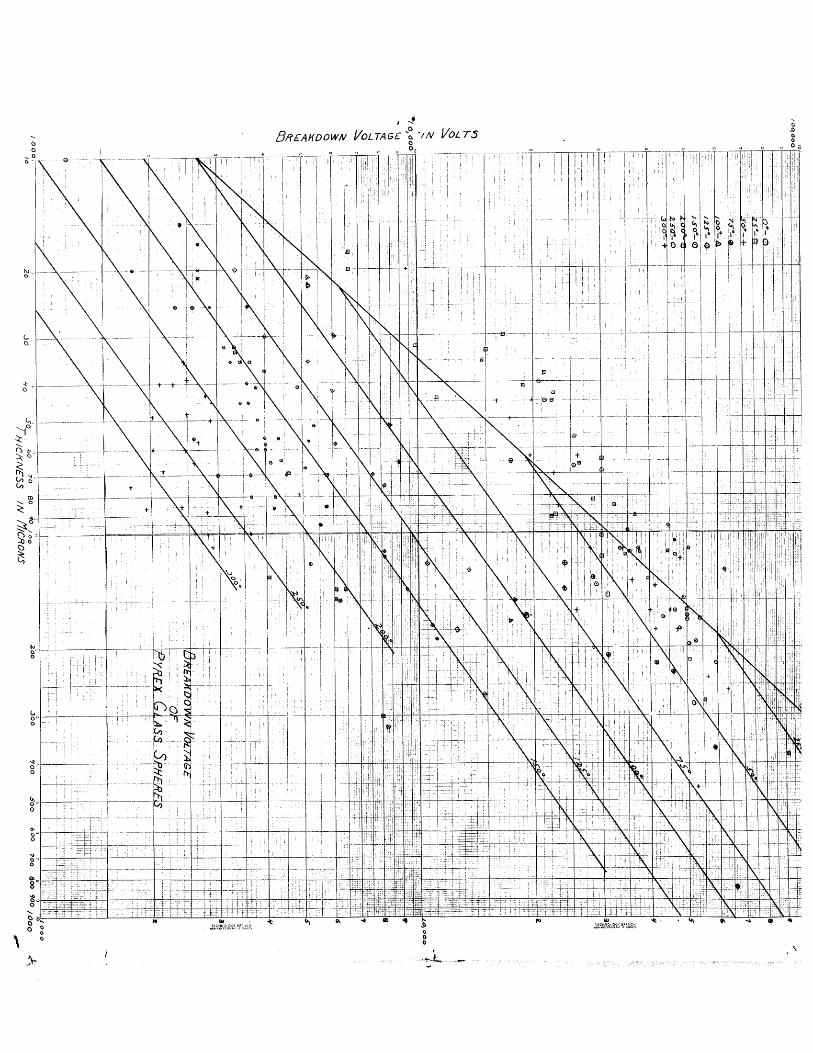
The results are tabulated in the Appendix. From
this data curves were drawn up of log of voltage vs.
log of thickness,and log of voltage vs. the reciorocal
of the absolute temperature.
-

DISCUSSION OF RESULTS
The curves for the disruptive and ionization regions
(See Fig. 4) were easily obtained and compare favorably
with those of Moon and Norcross. The slope obtained in the
ionization region showed that the voltage varied as the
.71 power of the thickness in centimeters for Pyrex.
G-1 glass gave an exponent of .66 while lime glass gave
.63. In the disruptive region a gradient of 3100 K.V.
per cm. was obtained. This exactly checks the value
obtained with G-1 and lime glasses. Although the slopes
are nearly the same, Pyrex gives a slightly higher break.-
down voltage throughout the ionization region than lime
glass. At 1000 0 and 100 microns, in the ionization
region, a value of breakdown voltage of 8000 volts higher
than that of lime glass was obtained.
In trying to obtain the thermal region considerable
difficulty was encountered. In Figure 5, the 2000 and
2500 curves were successfully drawn giving the thermal
region but they came unexpeotedly close together. The
30 0 * curve was not definitely enough defined to be of
any value. When Figure 4 was plotted, it was seen
that these curves did not fit in with the thermal theory
as it was impossible to draw a straight line through
these points.

00
K . eli.
0~0
-i--i---- 4
0-a
________ -F 110__________
--- 0
+1 -i- -0 4
+~:i ~ ±1
-F
________ I
I II:
K-7-I--
0
-h
- I.
1'/cEKDOWN 1/OLTAGE //V 'NVOL
c~ K
KV I I
01 1'
* I.
I.7
I:
~ 'F ii-
4
~2
H
t
*1 I-
0
0
-F
-~ ij*'*II
-t
L
1~~
I I I
0-e
00
K100
+
0
I I
ii
Oc
7-
t~
0:
+1 -p
___ 1~~~~1.
2~~~-- -*7 4 ~2~
,c~l0I.~
Io~
I'
1~
+
-t
I,
I---
IF a
-A
- 71

To investigate this difficulty we used Wood's
metal for an electrode instead of mercury but the
tests thus made checked those of mercury (see Table I.)
Finally,copper dust was used as an electrode but these
results were obviously incorrect probably due to edge
effect as previously explained. As a last resort some
lime glass spheres were tried with mercury to check
the procedure and the results were exactly the same
as - those of Moon.
We then examined bits of the Pyrex glass around
the rupture through a microscope, but we were unable to
account for the difficulties. Upon further study of
Figure 4, it was decided that it was possible to ex-
tend the ionization region to include some of the
points obtained at 200*, 250* and 300* 0. This means
that the thermal region occurs above 3000 0 for the
thickness used. Since the breakdown voltage of
Pyrex is higher, for a given thickness than that of
lime glass, it is reasonable to assume that this is
true.
One of the most important variables affecting the
results is the rate of application of voltage. At
the lower temperature, the effect is not so pronounced
but at the higher temperature it is very noticable. At
,2 6
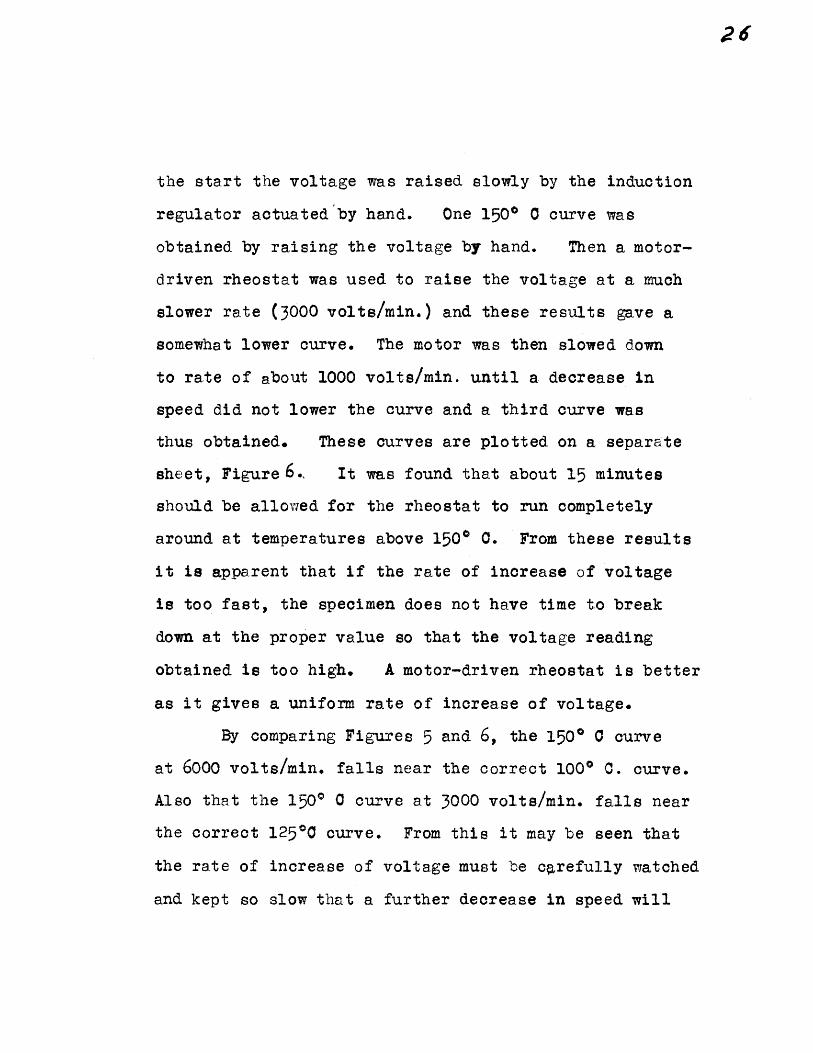
the start the voltage was raised slowly by the induction
regulator actuated by hand. One 150 0 curve was
obtained by raising the voltage by hand. Then a motor-
driven rheostat was used to raise the voltage at a much
slower rate (3000 volts/min.) and these results gave a
somewhat lower curve. The motor was then slowed down
to rate of about 1000 volts/min. until a decrease in
speed did not lower the curve and a third curve was
thus obtained. These curves are plotted on a separate
sheet, Figure . It was found that about 15 minutes
should be allowed for the rheostat to run completely
around at temperatures above 1500 0. From these results
it is apparent that if the rate of increase of voltage
is too fast, the specimen does not have time to break
down at the proper value so that the voltage reading
obtained is too high. A motor-driven rheostat is better
as it gives a uniform rate of increase of voltage.
By comparing Figures 5 and 6, the 1500 0 curve
at 6000 volts/min. falls near the correct 1000 0. curve.
Also that the 150 ° 0 curve at 3000 volts/min. falls near
the correct 12500 curve. From this it may be seen that
the rate of increase of voltage must be carefully watched
and kept so slow that a further decrease in speed will
L
-"I :Y -V. I--------~--~,,...~ :,
7_ *0 __.- o 25 23 5 €: 8 _ _ [ 20 5 50 7_ - OC:: - _____ __ __
-- 8913 ____
oni br 'akdown: lusI IK h 7
-I-7
A A... . . .. . . . . ..
I. . . . . . . ... "-7 7 . .:1 - - ..... ... ..
. .. : :::- --_ --- 7D
tt12 ~ ~ ~ ~ ~ ~ ~ ~ ~ ~ ~ ~ ... .... "....... . T ;... ... .. . ...
-4-f *I- i:: , ' ; - '
" i : ' . i ' ] 1 1 : ' ... .: i : : ! . . .
-1-4It J.:: :'h I: t. ' 't ttj 1 r - '
7 . ___...._,__ .. . .. .. ...... _ " , . iii..# H"ti. *4 .. 2-11
___ __ LI. _'1-4-.-i....: ::::: . i'~4i 4< 41''' ' J
-4j
. ... t v-....... -------- +
........... ; :I:::::::..~ .. :::;::;-::
.5 1.5 i fi4 -
i1 Lt1'1J
15 a 2.5 3 4 5 6 7 891I0 15 20 25 30 40 so eo 0 wso0w0
Thickness- [iorons z 10-1 °7 :1 . .. ...... + .. !T.
-i ii ii~ t:: ::11 _4 L- - -r --:. 4:
T .... ILL: IL XTT
I i: Eit -4-"444444 14 1,14
2.5-- 2.5
T i
t: - :: i -
T I 41-i ITH I, i...L5 2 25 3 4 5 6 7 8 9 10 15 20 25 30 40 W 60 70 80 90 WI:I/: iThicknes-s- - i-tt-!-f .. clill s x 10lit't
I~ I
not lower the curve.
With the different liquid electrodes used, we are
lead to believe that the kind o Fiquid electrode used
has no effect on the specimen because the points obtained
using hydrochloric acid and Wood's metal, checked those
obtained using mercury. When copper dust was used the
results were much below the other curves. This is probably
due to the fact that a concentrated field is set up by the
particles of copper next to the glass which cannot make
a uniform contact and the specimen breaks down at a much
lower voltage. This situation is exactly like the
edge effect case. This may be seen from a comparison
of the values given in Table I.
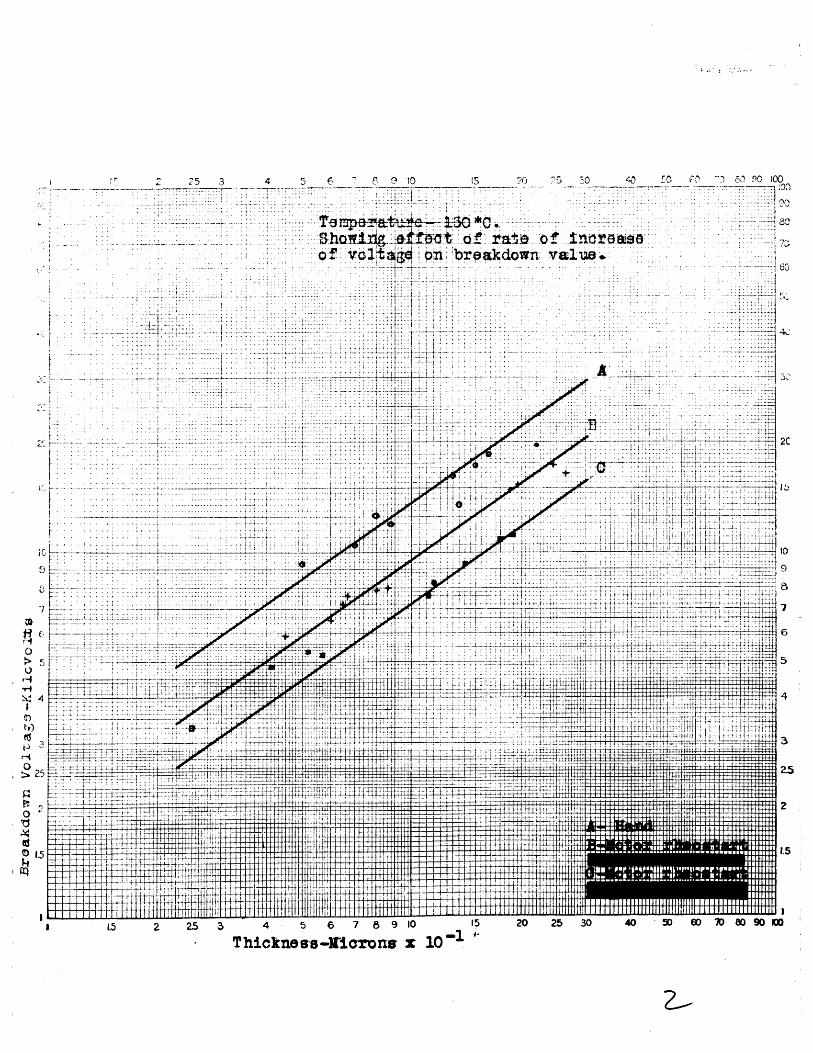
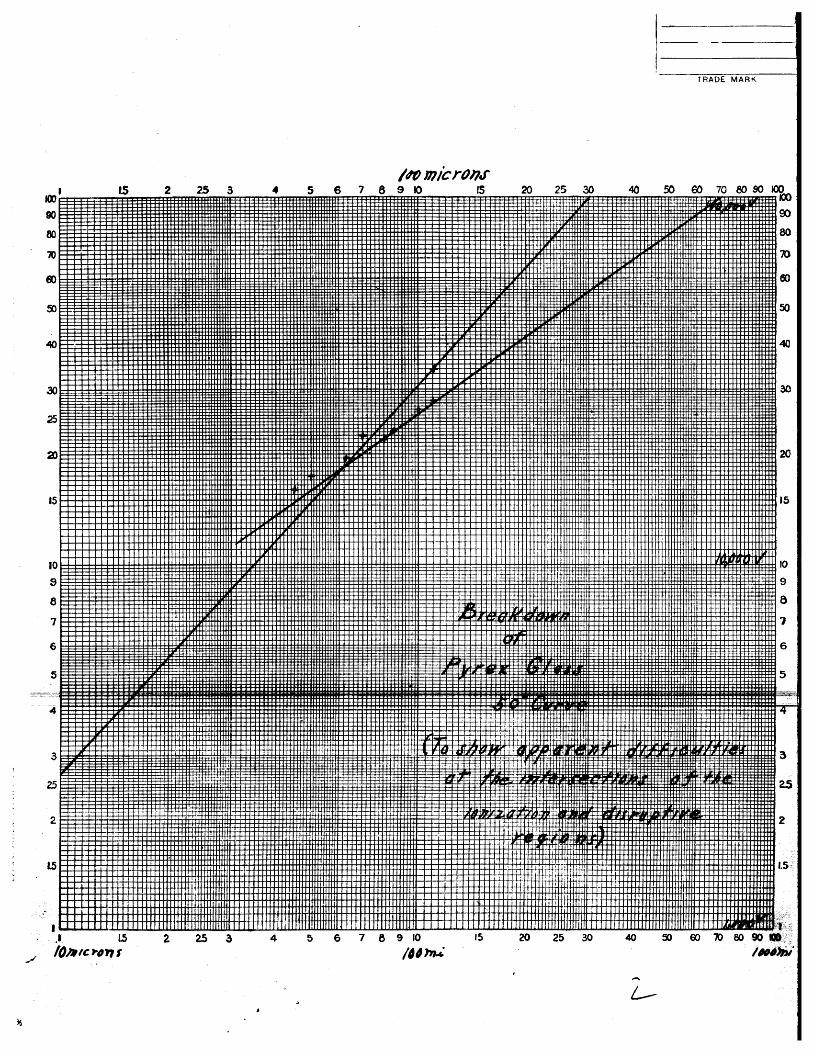
At the intersection of the ionization and disrup-
tive regions, difficulties were encountered. From Figure
7, it may be seen that the points seem to fall in four
groups, two of which fall on the projections of the two
regions by the intersections. The intersections of the
two regions were never definitely obtainable wb c h see.
to indicate an unstable condition at these points. T hi
contradicts the experiments of Moon and Norcross who
found these intersections sharply defined. This mioht
explain why Inge and Walther concluded that this inter-
mediate region was a combination of the other two.
- ~i~i[r I-" I II 1 ~."~
TRADE MARK
/O mc rron'9 10 15 20 25 30 40 50 60 70 80 90 00
1+ ++++H 111111+111+++14+4.1P I++ 1 V1100
UIIIII
LtH1 iff L i t iH [tFntiHHS~L J 4 I L i I .L ! .m IL. t M jl 1 . .i |.I| .ILlL J .l l.l l ' I ' i i .1. .J I LaO 25Ill Ol[lnlTilI
2
r.
40 50 60 70 80 90 W0
l-I
15 2 25 3 5 6 7
III1111 1 1
~uiI
Jul
IIIL
I'l
1111H111111 I
2 25 3 5 6 7 8 9 10 15 20 25 30.11 /Orror
During the microscopic examination it was observed
that all specimens that had been subjected to voltage
acquired a branch-like formation of microscopic dendrites.
Those specimens subjected to the hot metal alone did not
show this formation. It is interesting to note that
Joffe observed the same thing while examining salt.crystals
that had been subjected to high voltage. His theory vwas
that due to heating the crystal was softened permitting
the electrode to work in causing more conduction which
caused more heating. This cycle repeats itself until
breakdown occurs. The dendrites were not obtained at lower
temperatures with either mercury or hydrochloric acid
electrodes. However, with Wood's metal at high tempera-
ture, they were noticed but to a lesser degree than with
mercury.
_ __L~-- - -- iC-_ i -L ~~-ih--------i---~-,- -"L1 r"-
id
13/
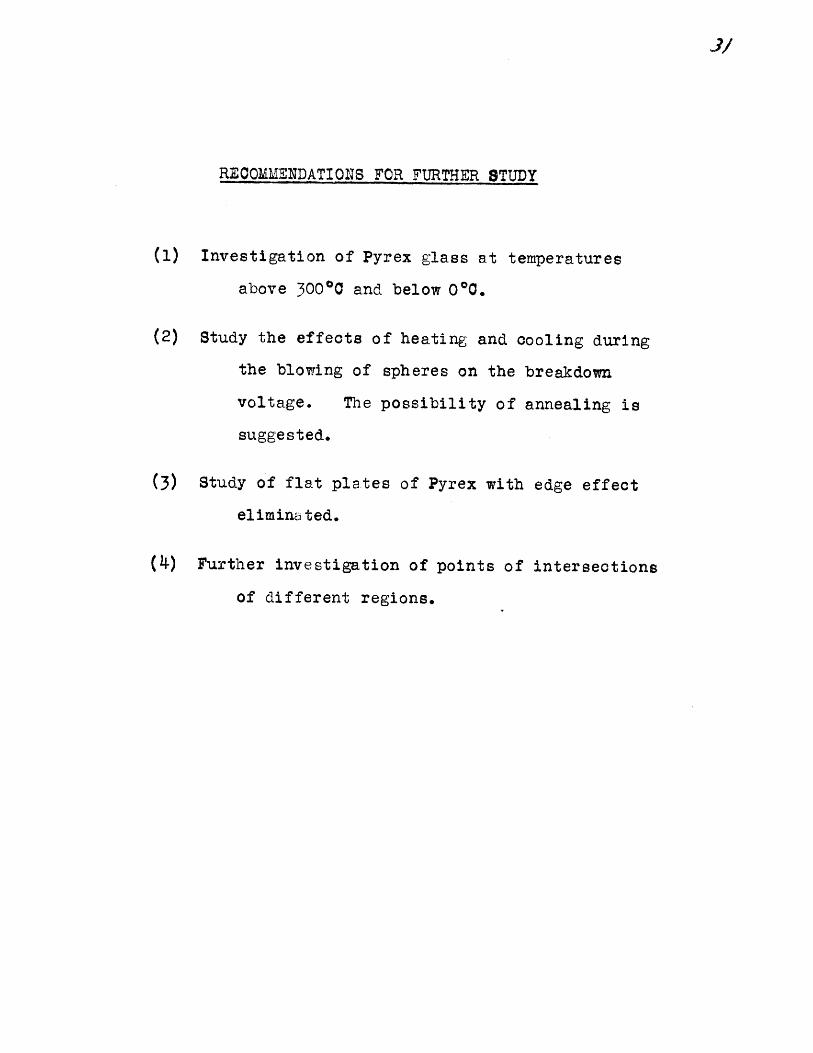
RECOMMENDATIONS FOR FURTHER STUDY
(1) Investigation of Pyrex glass at temperatures
above 300° 0 and below 00,.
(2) Study the effects of heating and cooling during
the blowing of spheres on the breakdown
voltage.
suggested.
The possibility of annealing is
(3) Study of flat plates of Pyrex with edge effect
eliminated.
(4) Further investigation of points of intersections
of different regions.

ad2
CONCLUSIONS
(1) The kind of liquid electrode has no effect on
results. Powdered electrodes are not satisfactory
due to edge effect probably being present.
(2) Pyrex is a better insulator than lead or lime
glass particularly in the ionization region.
(3) It is apparent that two mechanisms of breakdown
exist in Pyrex glass and it is probable that a
third one will be found.
(4) The changing from the Kertron set to the motor-
generator set had no effect on the results.

AP P PE N D I C E S *.
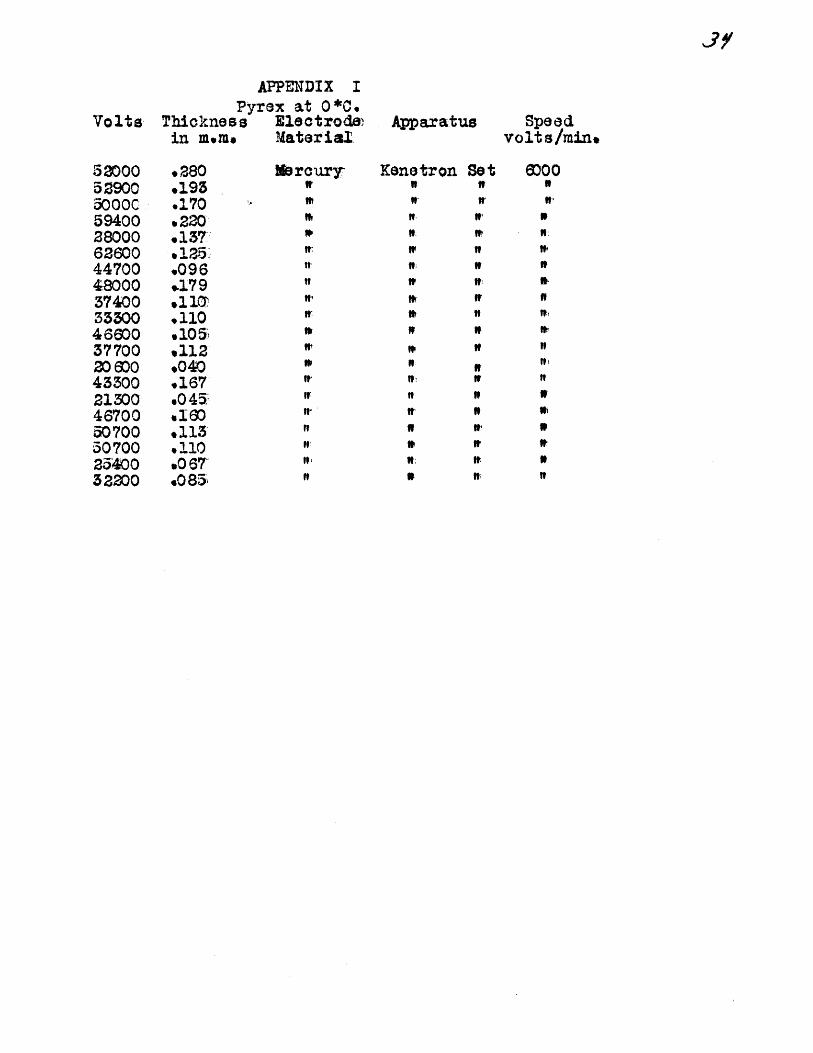
APPENDIX IPyrex at O*C.
Volts Thickness Electrode,in m.m. Material.
Apparatus: Speedvolts/min.
Kenetron Set# *#fi
3j
ilkrory-if-
If,
if,
6000*
520005 89005000¢59400280006260044700480003740033300466003770020 60043300213004870050700307002540032200
* 280.193.170.220* 137
.096
..179110'
.110
.10 5
.040
.167
.0 45
.2160
.1135*110.0 6T.085
--
Jr
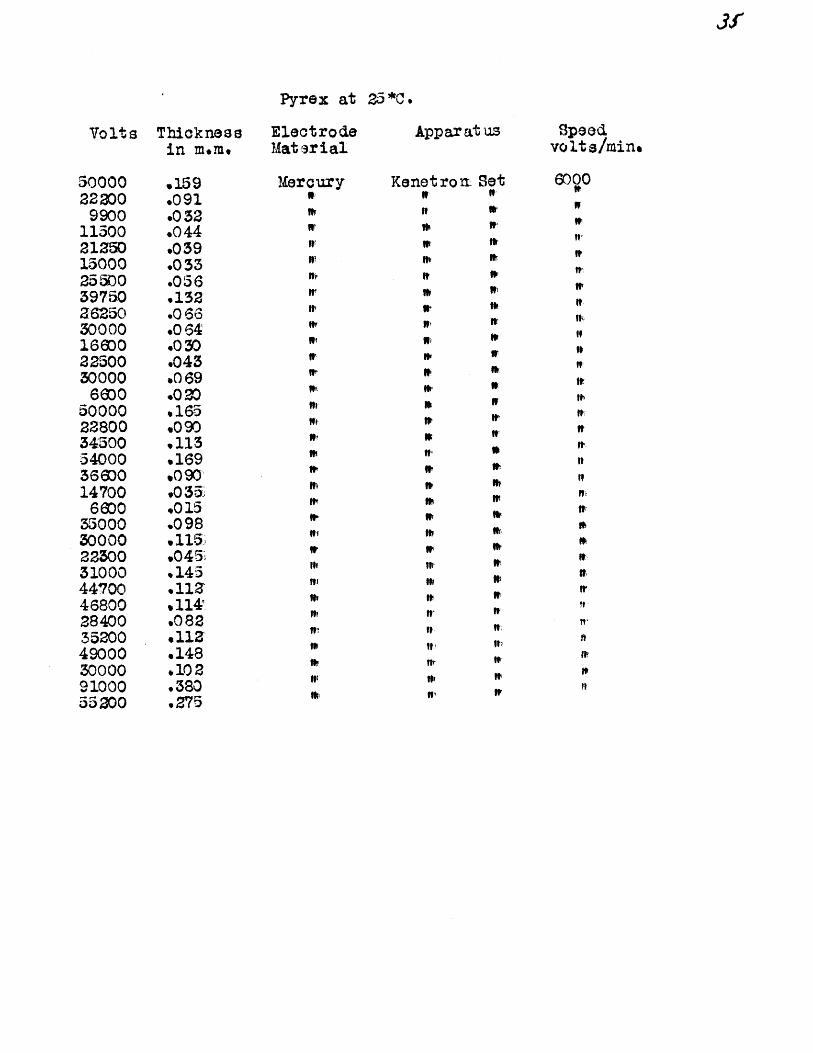
Pyrex at 25*C.
Volts Thicknessin m.m.
5000022200
9900115002125015000255003975068250
30000166002250030000
6600500002280034500540003660014700
66003500030000223500310004470046800284003520049000300009100055200
,159.091.0 52.044.039.053.056.132.0 66.064.030*0430 69
.020
.165
.090
.113
.169
.090
.015.098.115.045.145.112a.114' .
.082* 11a.148.102.380., 75
ElectrodeMat rial
MercuryWt
if?
Wi,11
ifr
if,
ni
#,It19k
ft
if:wIw!
if'9"
Appart us
Kenet ro ItI
It
if?
if
ItC
I
tif
ftr
It'
t,
Set
I,
ft
It,
'1
Iif,
if'
ft;
if?
It?
if
Speedvolts/mine
6OO0
It
,
It
NIt;
nirfI'
if!!
I,!11if
Itc
It
_~ _ ___---lii I
Pyrex at 23aC.
Volts Thicknessin m.m.
900018664440
444019 300
.025
.050
.012
.0 14
.050
ElectrodeMaterial
Dil. HCIW:
Apparatus
Kenetron Set"N W
Speedvolts/min.
53000'rn:
#*
n- -i;- - --- -- - -i~p r__~I-C*L.-I.--I.~--;_py-~-il--l ;~ :--.- -- ._____ __
J

37
Pryex at 50*0.
Volts Thicknessin m.m.
36500196501600022100
93304130023100Z800017300258004130045300360001980022700M000
40000527005660047300340006400048000
.100
.045
.080
.0 20
.085
.160S158.160
.045
.070
.063
.160
.4609240.180*110.259*117
Elec tro J~etMbat erial
Mfercxry:WI
't~Il
WII'
if
if
if,if?
if,
Apparatus
Kenetron Seto
Speedvolts/min.
00
I
I
IrIk
t
38
Pyrem at 75~C.
Vo lt Thicknes sin m..m.
17350483002400042300285006800019600587002400031000
.065
*140
*1329830.850*1653*365
*10TSg3
ElectrodeMaterial
Mercury0
Apparatus.
Kenetron SetIt
Speedvolt s/min=
W-

3?
Pryez at 100*C.
Volts Thioknessin mm,.
600053 00
892017400
608017900
04a.0Z.052*0 22.065.1700050*150
HC1 coetrodai~Mactrri.
MercuryW
Apparatus Speed.Volts/min.
5000WI
* - Taken with one- Kenetron. on 50 kw, connaetion.
' - Taken with two Kene-t~rn on 50 krit. connection.

Pyrex at 18z.5*C
Volt a Thicknessin m.m.
ElectrodeMaterial
Apparatus Speedvolts/min,
Kenetron Setr r
MErcury"I
1050013550040001250061003360
760017400816011600
.120
.125.0 50. 180.0 68.0 20.035,,070* 2350.075
.1251007151~*105-
3000W
Y/
Pyrex at 150*C..
Volts Thicknessin m.m..
ElectrodaMaterial
Apparatus Speedvolts/min.
Kenetron SetMercuryIt4840
5320111009330
108003 600
148005240,
8120
.113
.190*140.175.0 235P 265
.0517*115
1000
- -- --- CT --- -
Pyrex at 200*00
Voltsa Thicknessin m.m.
EiectrodaMaetal-
App ar atus Speedvolts/mine
Kontetron Betft II
ft It'
ti ft
64008280
60404600236040003800488026803440552252T040403360
4400508057505680
Mercury
w
if
If'
.140
.5332.140.1500148.069.0 10o037.060*074.021.0 35.o 095;
o130.033.032
90 6T.085*0 355
fit
If' t)
if.
1q00
iItO
ftIbfir
if
if,

90
Pyrex at 250*C.
Volts Thicknessin m.m.
43 342402640360040003800
B840220
68031203260Z600240018002600365034W367042001300
.0536
.080
.017
.040
.058
.041
.050
.055
.0820
.03255
.056
.0159020
.025
.045
.045
.080
.086
ElectrodeMater ial
Mercury
nII,
if
if
Apparatus
Kenetron SetI, It
if tt
ft; 1f
Speedvoit s/min,
1000It
if,I:
It:ififH'
Wood' s MetalI I
.0 25 Copper Dust
M-GI
SetW
It if'
if'
C-- _~_ ~ ;_
il- iiii
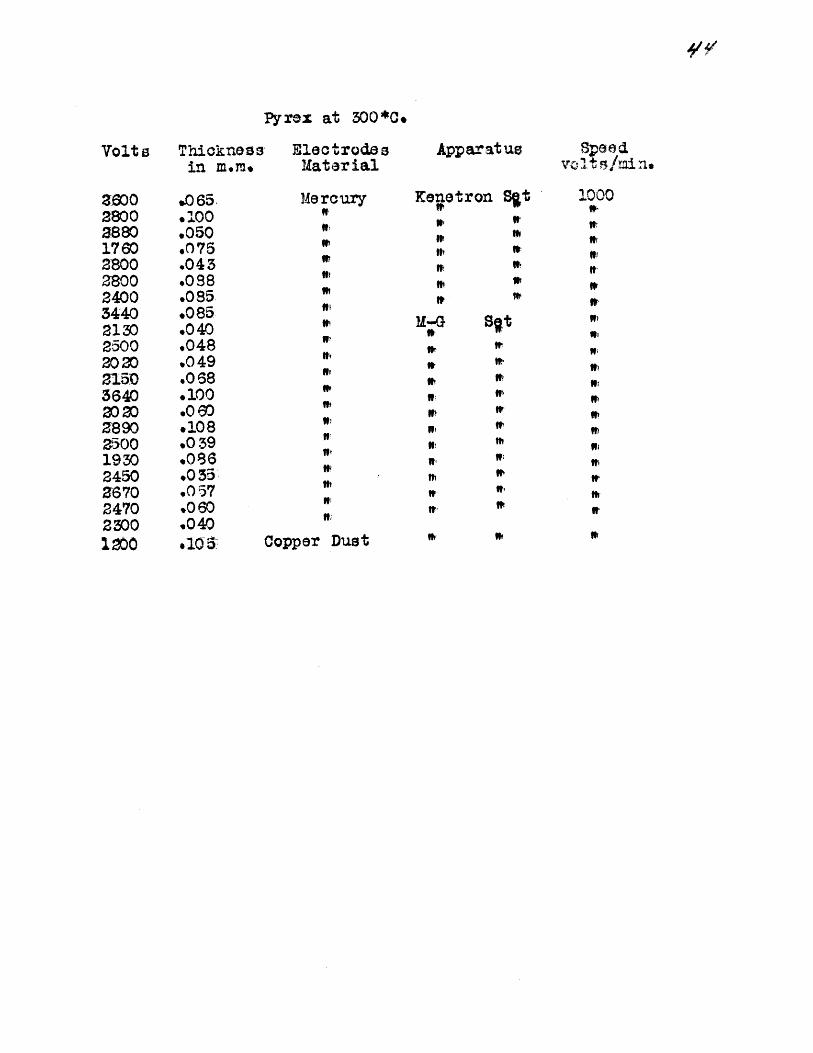
y4/
Pyrex at
Volts Thickness-in m.m.
ElectrodesMaterial
Apparatus Speedv tolt /r ne
Mercury
M
f
If,
if:If)3
ltt3,
Copper Dust
Kenetron Sst3. .
e *o)
t07:
I, WV
2600280028801760280028002400344021302500202021503640202028902500193024502670247023001200
.065
.100
.050
.075
.043
.0938.085.085.040.048.049.068.100.0 60.108.039.086.055.057.060.040.105
300*0.
M'-G
37m
#-#aIti)
Vt,
8qt***
t1It,37
o)13.37if,
i'if.
3,
1000
37.
I,
37fIr
37i,
m
3t37
'I
3:
if37
"V
3.
37
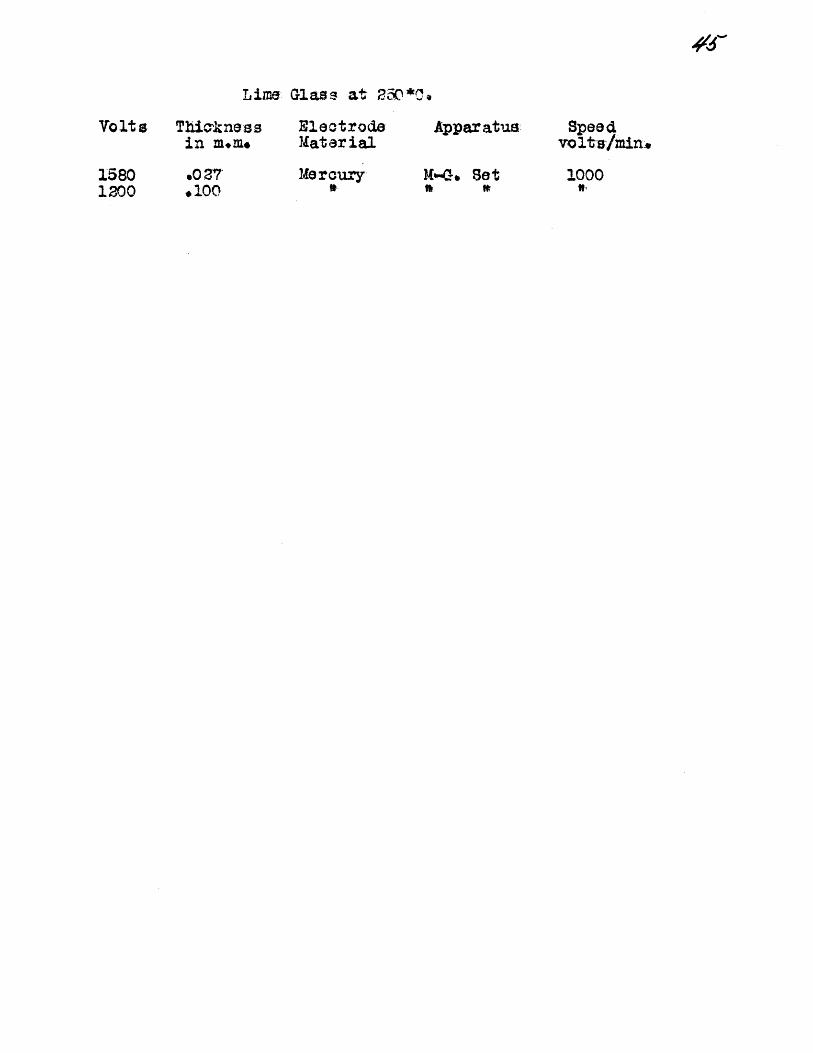
Lime Glass at 2,T0*f
Volts Thicknessin mare.
15801200
0 7.100
ElectrodeMater ial
Mercury0
Apparatus
Mb-G~ Set
Speedvolt-smin.
1000
--~-~-I I __;__~_ ..

*'6
Pyrex below O*.
Thicknessin m.m.
.040
.030
.0 28
.040
.010.030
ElectrodeMaterial
Apparatus
ydrochloric Acid. Kenetron Setft ft W
Speedvolt s/min.
00fto
V Vr
V. f
ft V.
Mr ft
These temperatures were obtained by the use ofcarbon dioxide snow- (solid)
Volts
25500165001500018750
675018750
97
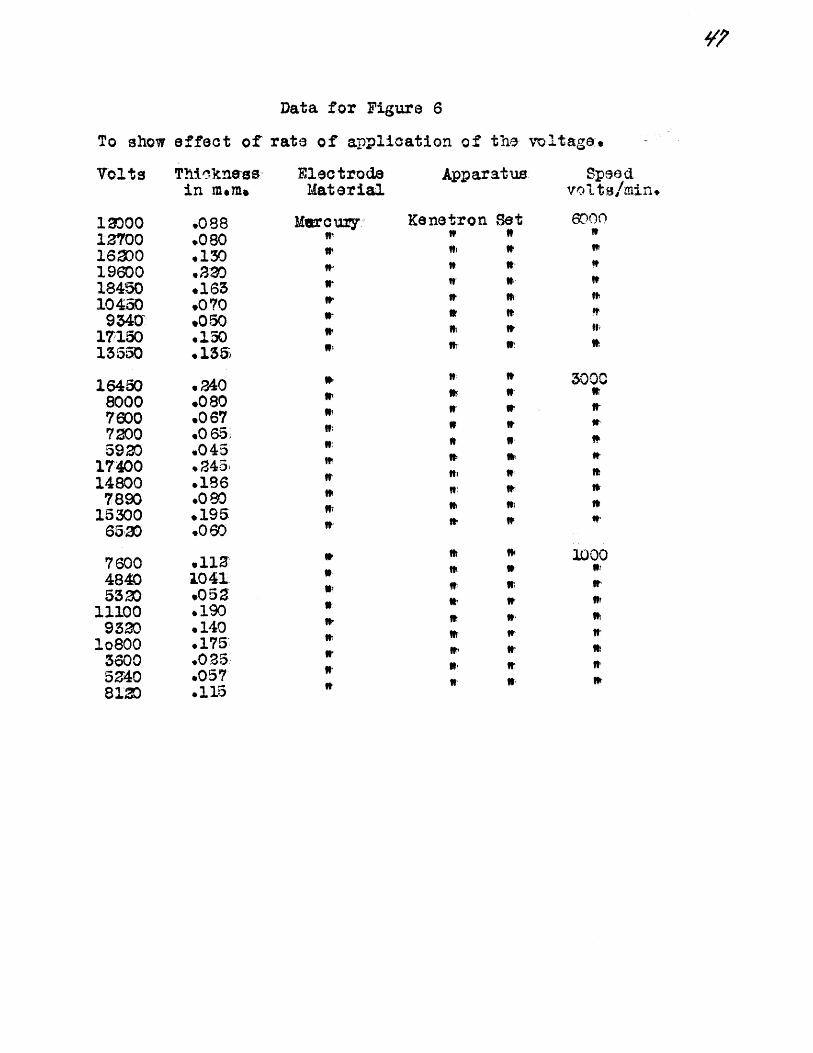
Data for Figure
To show effect of rate of application of the voltage.
Volts Thicknessin m.mo
10001370016200196001845010450
95411715015550
164508000760072005920
17400148007890
153006520
760048405320
111009320
lo80036005240810
.088
.080
.130
.320
.1659070.050.150o155)
.9 AO
.080
.067.0 65
.045
.245
.186
.080.195.060
.112104105 Z
.190.140
.175
.025
.057
.115
ElectrodeMaterial
Mercury
Apparatus
Kenetron SetW *
WI W"It It
Speedvolts/min.
WI19?
WI
WI
M7 w
3000
ftI,
WI S
if; I
t~ WtIWI ~
WI I
1000W.
n W
I1 ff
II' #"W WI
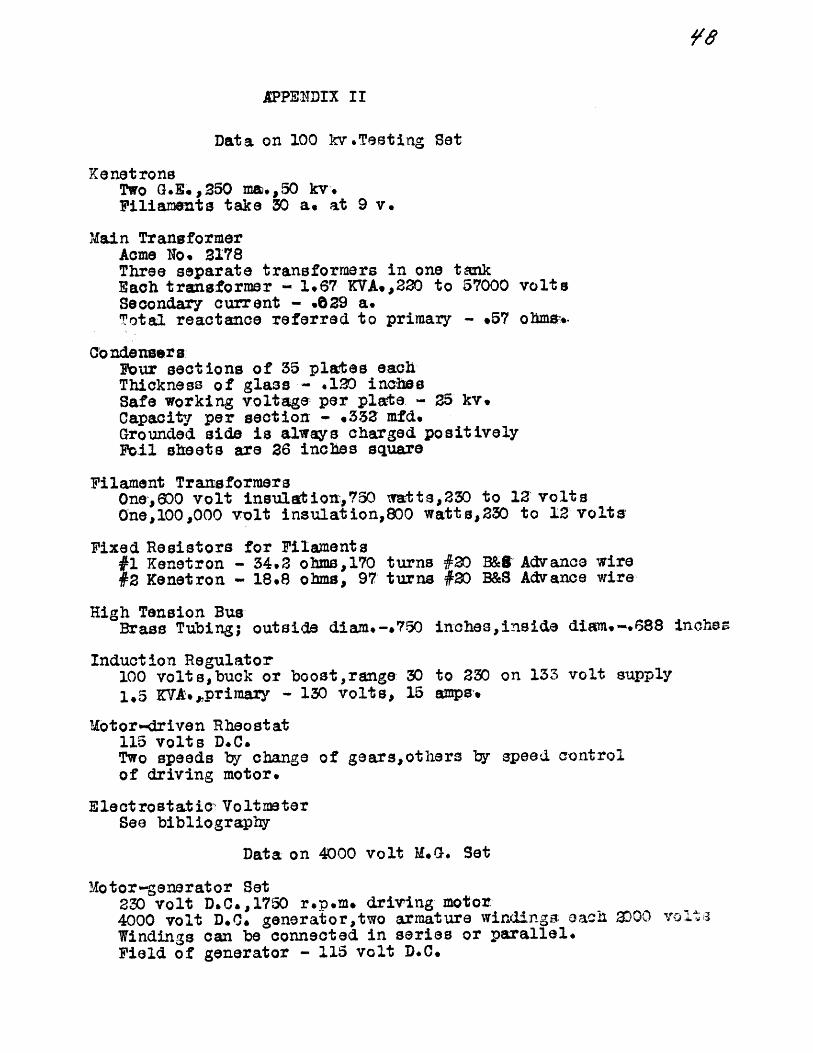
APPENDIX II
Data on 100 kv.Testing Set
Kenet ronsTwo G.E*s250 ma., 50 kv.Filiamemts take 30 a. at 9 v.
Main TransformerAcme No. 2178Three separate transformers in one tankEach transformer - 1.67 KVA.,220 to 57000 voltsSecondary current - .029 a.Total reactance referred to primary - .57 ohms.
Condenser sFour sections of 35 plates eachThickness of glass - .1240 inchesSafe working voltage per plate - 25 kv.Capacity per section - .353 mfd.Grounded side is always charged positivelyFoil sheets are 26 inches square
Filament TransformersOne,600 volt insulation:,750 watts,20 to 12 voltsOne,100,000 volt insulation,800 watts,250 to 12 volts
Fixed Resistors for Filaments#1 Kenetron - 34.2 ohms,170 turns #20 B&8 Advance wire#2 Kenetron - 18.8 ohms, 97 turns #20 B&S Advance wire
High Tension BusBrass Tubing; outside diam.-.750 inches,inside diam-.'&88 inchess
Induction Regulator100 volts,buck or boost,range 30 to 2350 on 133 volt supply1.5 KVA.,,primary - 130 volts, 15 amps.
Motor-driven Rheostat115 volts D.C.Two speeds by change of gears,others by speed controlof driving motor.
Electrostatic- VoltmeterSee bibliography
Data on 4000 volt M.G. Set
otor-generator Set230 volt D.C.,1750 r.p.m. driving motor4000 volt D.C. generator,two armature winding. each TC00 volt2Windings can be connected in series or parallel.Field of generator - 115 volt D.C.
-- .

Meters Used
Balance Current of Electrostatic VoltmeterMA-98,0-150 ma. f/E accuracy
Primary Voltage of Main Transformer#235Z M.I.T. D.J.Mo Lab.A.G. or D.C. Voltmeter,O-60-150-300 volts
Primary CurrentMA-73,0-10 amps,MA- ,0-25 amps.
Secondary VoltageTotal voltage range - 20,000 volt D...MV-66,0-500 volts D.O.,Weston.Two Weston multipliers for that range (500)Special multiplier consisting of six 249,000 ohm units inwith the Weston meter and its multipliers.
__ __ ~_El
I i:iILCL-ii:1 I
S'II
ii._l._l 1jI .ii I
_ii ;ili , jliii
._.... 1;.-_._.-~
7I
*1
-I,-
Ii
~ti I-i, l4s;'
L .
i i;;
j
I _
I I
IC
I --
-r
1 I
' I
'PS
1
7 --------
------ ------;
--1-'
"ct-----C
iii
i p
''
' "
Il -i.
-II I
i i 1; I 1 II I i.L
!ii.i I 'I i 'I
c:i
I j /i
-.~1. .~.
I I1 I /i i
i Ii i: j: I i :;T-l
i:~ii----1
iI-"-I iI
riii i :i'1
;
--'-- _II--.I i ; i
I 1 I
--L i
7T
~-- --
^ i
I!i i i !
'7(/
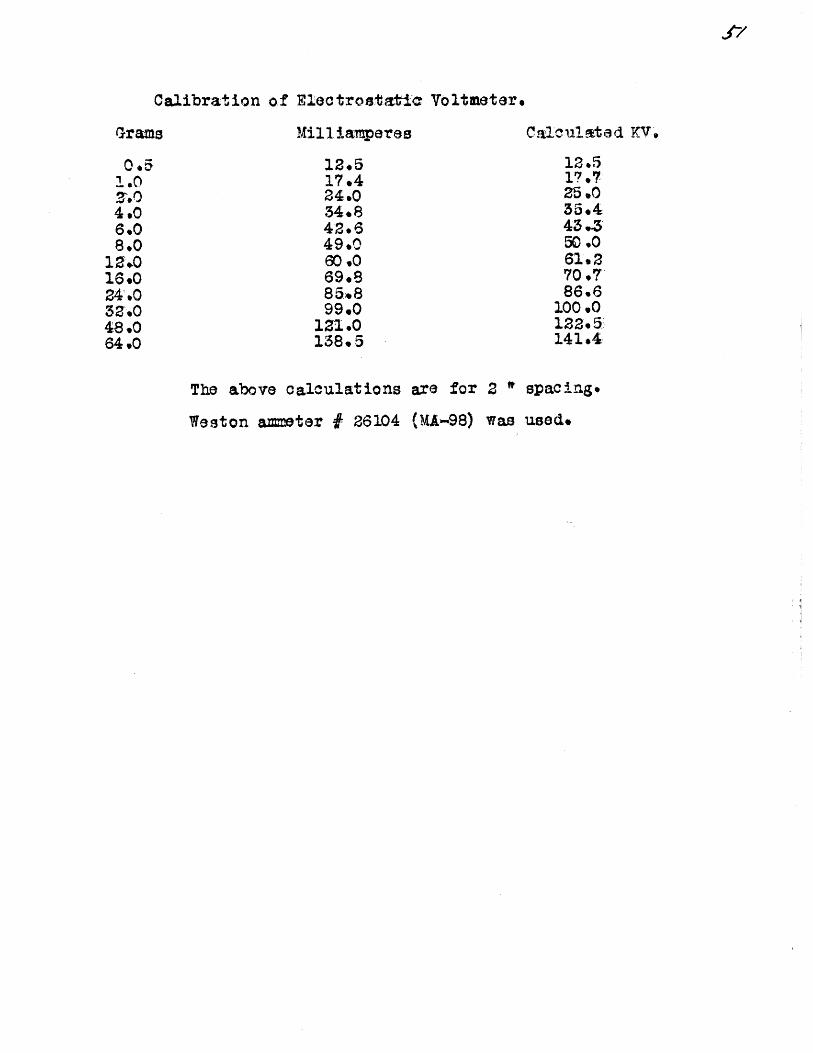
Calibration of EloctrostatIc Voltmeter.
Milliamperes
12.517.424.034.84'2 .649.060.069.885.899.0
121.0138.5
12.517.725.035,443450.061.270.7T86.6
100.0122.5'141.4
The above calculations are for 2 * spacing.
Weston ammeter # 26104 (MA-98) was used.
Grams
0.5
4.06.08.06 .08.0
16.024.0
48.064.0
Calcul ted KV -
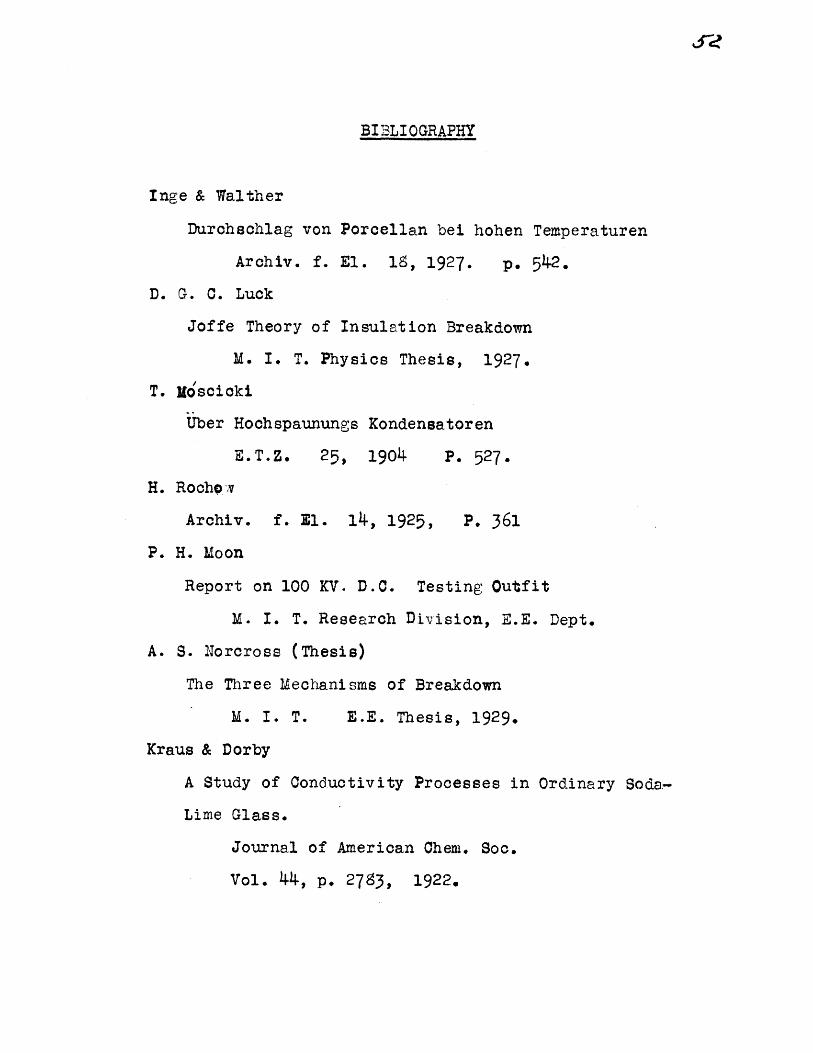
BIBLIOGRAPHY
Inge & Walther
Durchschlag von Porcellan bei hohen Temperaturen
Archiv. f. El. 18, 1927. p. 542.
D. G. C. Luck
Joffe Theory of Insulation Breakdown
M. I. T. Physics Thesis, 1927.
T. Moscicki
Uber Hochspaunungs Kondensatoren
E.T.Z. 25, 1904
H. Rochqov
Archiv. f. El. 14, 1925,
P. 527.
P. 361
P. H. Moon
Report on 100 KV. D.C. Testing Outfit
M. I. T. Research Division, E.E. Dept.
A. S. Norcross (Thesis)
The Three Mechanisms of Breakdown
M. I. T. E.E. Thesis, 1929.
Kraus & Dorby
A Study of Conductivity Processes in Ordinary Soda-
Lime Glass.
Journal of American Chem. Soc.
Vol. 44, p. 2783, 1922.
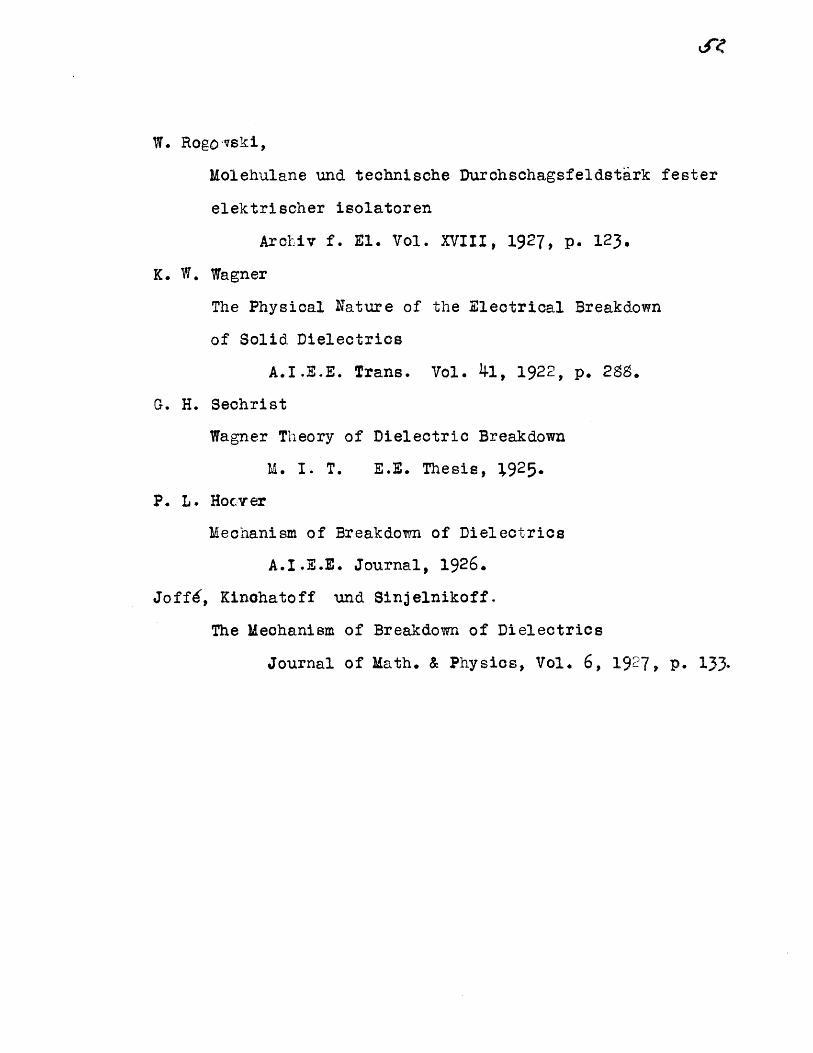
W. Rogo-vski,
Molehulane und technische Durchschagsfeldstark fester
elektrischer isolatoren
ArcLiv f. El. Vol. XVIII, 1927, p. 123.
K. W. Wagner
The Physical Nature of the Electrical Breakdown
of Solid Dielectrics
A.I.E.E. Trans. Vol. 41, 1922, p. 288.
G. H. Sechrist
Wagner Theory of Dielectric Breakdown
M. I. T. E.E. Thesis, 1925.
P. L. Hocver
Mechanism of Breakdown of Dielectrics
A.I.E.E. Journal, 1926.
Joffd, Kinohatoff und Sinjelnikoff.
The Mechanism of Breakdown of Dielectrics
Journal of Math. & Physics, Vol. 6, 1927, p. 133.
Recommended