Habits, hassle, and health:
how do blood donors respond to a temporary deferral due to low haemoglobin?
Tessa Hillgrove PhD Candidate
Discipline of Public Health
School of Population Health and Clinical Practice University of Adelaide
Thesis submitted in fulfilment of the requirements for the Degree of Doctor of Philosophy
April 2009

ii
Table of contents
TABLE OF CONTENTS II
LIST OF TABLES VI
LIST OF FIGURES IX
LIST OF FIGURES IX
ABSTRACT X
ABSTRACT X
DECLARATION XII
DEDICATION XIII
ACKNOWLEDGEMENTS XIV
1 INTRODUCTION 1
1.1 BACKGROUND AND RATIONALE FOR RESEARCH 1 1.1.1 THE AUSTRALIAN BLOOD SUPPLY 1 1.1.2 TEMPORARY DEFERRAL DUE TO A LOW HAEMOGLOBIN CONCENTRATION 2 1.2 AIMS 3 1.2.1 THE PURPOSE OF THIS RESEARCH 3 1.2.2 OUTLINE OF STUDIES IN THIS THESIS 3
2 LITERATURE REVIEW 5
2.1 CHAPTER OUTLINE 5 2.2 BACKGROUND 5 2.2.1 DONOR DEFERRAL FOR A LOW HB CONCENTRATION 5 2.2.2 DEFINITIONS OF ANAEMIA, IRON DEFICIENCY, AND IRON DEFICIENCY ANAEMIA 5 2.2.3 THE IMPACT OF IRON DEFICIENCY 6 2.2.4 SCREENING BLOOD DONORS FOR IRON DEFICIENCY 8 2.2.5 SEEKING MEDICAL INVESTIGATIONS AFTER DEFERRAL 12 2.3 WHY DO PEOPLE DONATE BLOOD? 14 2.3.1 DESCRIBING THE DONOR POPULATION: PAST RESEARCH INTO THE MOTIVATIONS AND
SOCIO-DEMOGRAPHIC CHARACTERISTICS OF BLOOD DONORS 16 2.3.2 RETENTION OF BLOOD DONORS: RECENT RESEARCH AND IMPLICATIONS FOR RETENTION
STRATEGIES 17 2.3.3 THE PROCESS OF BECOMING A COMMITTED DONOR 21 2.3.4 CEASING DONATION: WHY DO DONORS “LAPSE”? 22 2.4 THE IMPACT OF TEMPORARY DEFERRAL ON DONOR RETURN 24 2.4.1 WHY ARE DEFERRED DONORS LESS LIKELY TO RETURN? 27 2.4.2 INCREASING THE LIKELIHOOD OF RETURN AFTER DEFERRAL 29
iii
2.5 THEORETICAL PERSPECTIVES 31 2.5.1 THEORETICAL UNDERSTANDINGS OF ROLE IDENTITY, AND IMPLICATIONS FOR VOLUNTEER
BEHAVIOUR IN CONTEMPORARY AUSTRALIA 32 2.5.2 THE THEORY OF THE SPURNED PHILANTHROPIST: WHAT HAPPENS WHEN A DONOR’S OFFER
OF ASSISTANCE IS REJECTED? 36 2.5.3 THE THEORY OF REASONED ACTION AND THE THEORY OF PLANNED BEHAVIOUR IN
PREDICTING BLOOD DONATION 37 2.6 SUMMARY 40
3 OVERVIEW OF METHODS 42
3.1 OUTLINE 42 3.2 DEVELOPMENT OF METHODS 42 3.3 RESEARCH QUALITY 45 3.4 ETHICS 47 3.5 RESEARCHER’S BACKGROUND 48 3.6 PRESENTATION OF RESULTS 49
4 RESULTS: PART ONE 51
4.1 CHAPTER OUTLINE 51 4.2 AIM 51 4.3 METHODS 51 4.3.1 STUDY DESIGN 51 4.3.2 SAMPLE 52 4.3.3 IDENTIFICATION OF SAMPLE 52 4.3.4 ANALYTICAL APPROACH 53 4.3.5 DATA LIMITATIONS 55 4.4 RESULTS 56 4.4.1 WHAT CHARACTERISTICS ARE ASSOCIATED WITH LOW HB DEFERRAL? 56 4.4.2 FACTORS ASSOCIATED WITH RETURN DURING THE FOLLOW-UP PERIOD 60 4.4.3 FACTORS ASSOCIATED WITH THE TIME TAKEN TO RETURN 88 4.4.4 THE IMPACT OF DEFERRAL ON DONATION FREQUENCY 108 4.5 SUMMARY 117 4.6 DISCUSSION 118 4.6.1 LIMITATIONS AND DATA ISSUES 122 4.7 CONCLUSION 123
5 RESULTS: PART TWO 124
5.1 CHAPTER OUTLINE 124 5.2 AIM 124 5.3 METHODS 124 5.3.1 SAMPLE 125 5.3.2 ACCESSING PARTICIPANTS 126 5.3.3 DATA COLLECTION 127 5.3.4 THE PARTICIPANTS 128 5.3.5 ANALYTICAL APPROACH 131 5.4 RESULTS 136 5.4.1 PRESENTATION OF THE RESULTS 136 5.4.2 SUMMARY OF THEORETICAL PERSPECTIVES 136 5.4.3 VIEWS ON GIVING BLOOD 137

iv
5.4.4 CEASING DONATION 148 5.4.5 RETURNING PROMPTLY AFTER DEFERRAL 154 5.4.6 THE “HASSLE” OF DEFERRAL 155 5.4.7 DELAYING RETURN: “IT’S AN EASY THING TO PUT OFF” 163 5.4.8 KEYS TO UNDERSTANDING PROMPT RETURN FROM DEFERRAL 166 5.5 SUMMARY 174 5.6 DISCUSSION AND IMPLICATIONS 174 5.6.1 LIMITATIONS 177 5.7 CONCLUSION 178
6 RESULTS: PART THREE 180
6.1 CHAPTER OUTLINE 180 6.2 AIM 180 6.3 METHODS 181 6.3.1 STUDY DESIGN 181 6.3.2 SAMPLE 182 6.3.3 DEVELOPMENT OF THE QUESTIONNAIRE 183 6.3.4 ADMINISTRATION OF THE QUESTIONNAIRE 185 6.3.5 ANALYTICAL APPROACH 186 6.4 RESULTS 187 6.4.1 RESPONSE RATE 187 6.4.2 DEMOGRAPHIC CHARACTERISTICS OF RESPONDENTS 187 6.4.3 UNDERSTANDING OF THE RATIONALE FOR DEFERRAL 190 6.4.4 REFLECTIONS ON THE DEFERRAL APPOINTMENT 190 6.4.5 SEEKING FURTHER INVESTIGATIONS 194 6.4.6 CHANGES SINCE DEFERRAL 202 6.4.7 PERSPECTIVES ON GIVING BLOOD 203 6.4.8 INTENTION TO RETURN ONCE ELIGIBLE 209 6.5 SUMMARY OF RESULTS 223 6.6 DISCUSSION 224 6.6.1 THEORY OF THE SPURNED PHILANTHROPIST 228 6.6.2 LIMITATIONS 229 6.7 CONCLUSION 229
7 RESULTS: PART FOUR 230
7.1 CHAPTER OUTLINE 230 7.2 AIM 230 7.3 METHODS 231 7.3.1 STUDY DESIGN 231 7.3.2 SAMPLE 231 7.3.3 IDENTIFICATION OF SAMPLE 232 7.3.4 DEVELOPMENT OF THE QUESTIONNAIRE 233 7.3.5 ANALYTICAL APPROACH 237 7.4 RESULTS 239 7.4.1 DEMOGRAPHIC CHARACTERISTICS OF RESPONDENTS 239 7.4.2 DEFERRAL IN HINDSIGHT 241 7.4.3 SEEKING FURTHER INVESTIGATIONS AFTER DEFERRAL 250 7.4.4 FACTORS ASSOCIATED WITH RETURN WITHIN SIX MONTHS OF BEING ELIGIBLE 261 7.4.5 EARLY RETURN FROM DEFERRAL 271 7.4.6 INTENTION TO RETURN IN THE FUTURE 272 7.4.7 TO WHAT EXTENT DOES INTENTION TO GIVE BLOOD PREDICT BEHAVIOUR? 275

v
7.4.8 FACTORS ASSOCIATED WITH INTENTION TO RETURN IN THE SIX MONTHS FOLLOWING THE SURVEY 277
7.4.9 ANALYSIS OF FACTORS ASSOCIATED WITH ACTUAL RETURN FOLLOWING THE SURVEY 285 7.4.10 VALIDATION OF NBMS RECORDS AGAINST SELF-REPORTED DONATION HISTORY 293 7.5 SUMMARY OF RESULTS 294 7.6 DISCUSSION 295 7.6.1 DATA LIMITATIONS 301 7.7 CONCLUSION 303
8 FINAL DISCUSSION 304
8.1 INTRODUCTION 304 8.2 OVERVIEW OF KEY FINDINGS 304 8.2.1 THE IMPACT OF DEFERRAL ON SUBSEQUENT DONATION PATTERNS 304 8.2.2 WHAT PROCESSES ARE RESPONSIBLE FOR THE DISRUPTION TO DONATION PATTERNS? 305 8.2.3 FACTORS MEDIATING RETURN AFTER DEFERRAL 306 8.2.4 INTENTION TO RETURN 309 8.2.5 PERCEPTIONS OF THE DEFERRAL EVENT 310 8.3 HOW DO THE FINDINGS COMPARE TO THE LITERATURE ON RETURN AFTER TEMPORARY
DEFERRAL? 311 8.3.1 LITERATURE ON RETURN FROM TEMPORARY DEFERRAL 311 8.3.2 TO WHAT EXTENT DOES THEORY EXPLAIN THE EFFECT OF DEFERRAL FOR A LOW HB
CONCENTRATION? 314 8.4 DISCUSSION OF METHODS 317 8.4.1 ADVANTAGES OF THE APPROACH 317 8.4.2 LIMITATIONS 318 8.5 IMPLICATIONS 319 8.5.1 RECOMMENDATIONS FOR PRACTICE 319 8.5.2 FUTURE RESEARCH 328 8.6 CONCLUSION 330
BIBLIOGRAPHY 332
APPENDICES 340
vi
List of Tables Table 1: Length of deferral for those deferred for a reason other than low Hb 53 Table 2: Timeline of the study period for the deferred group 54 Table 3: Timeline of the study period for the comparison group 54 Table 4: Sex distribution of study groups 56 Table 5: Age distribution of study groups 56 Table 6: Age distribution of study groups: for females 57 Table 7: Age distribution of study groups: for males 57 Table 8: Proportion of first time donors in study groups 58 Table 9: Number of attendances made in twelve months prior to the reference donation 58 Table 10: Number of donations made in twelve months prior to reference donation 59 Table 11: Distribution of low Hb deferrals prior to reference donation 59 Table 12: Distribution of deferrals for another reason prior to reference donation 60 Table 13: Univariable logistic regression models for return during three year follow-up period, deferred group
62 Table 14: Results of fitting multivariable model of return during three year follow-up period, with significant
univariable effects, deferred group 63 Table 15: Univariable logistic regression models for return during Year 1, deferred group 64 Table 16: Results of fitting multivariable model of return during Year 1, with significant univariable effects,
deferred group 65 Table 17: Univariable logistic regression models for return during Year 2, deferred group 67 Table 18: Results of fitting multivariable model of return during Year 2, with significant univariable effects,
deferred group 68 Table 19: Preliminary final model of return in Year 2, deferred group 69 Table 20: Univariable logistic regression models for return during Year 3, deferred group 71 Table 21: Results of fitting multivariable model of return during Year 3, with significant univariable effects,
deferred group 72 Table 22: First preliminary final model of return in Year 3, deferred group 73 Table 23: Results of fitting multivariable model of return during Year 2, amongst donors returning in Year 1,
deferred group 74 Table 24: Results of fitting multivariable model of return during Year 3, amongst donors returning in Year 1,
deferred group 75 Table 25: Results of fitting multivariable model of return during Year 3, amongst donors returning in Year 1,
deferred group 76 Table 26: Univariable logistic regression models for return during three year follow-up period, comparison
group 78 Table 27: Results of fitting multivariable model of return during three year follow-up period, with significant
univariable effects, comparison group 79 Table 28: First preliminary model of return, comparison group 79 Table 29: Proportion returning to donate by group 81 Table 30: Proportion of deferred group returning during follow-up, by first time donor status 82 Table 31: Proportion of comparison group returning during follow-up, by first time donor status 82 Table 32: Factors predicting return during Year 1, all donors 83 Table 33: Factors predicting return in Year 2, given a donor returned in Year 1 84 Table 34: Factors predicting return in Year 2, given a donor returned in Year 1, adjusting for number of
donations given in Year 1 85 Table 35: Logistic regression of likelihood of return in Year 3, given return in Year 1 & Year 2, adjusting for
number of donations given in each year 86 Table 36: First preliminary final model of hazard ratio 90 Table 37: Second preliminary final model of hazard ratio 91 Table 38: Results of Cox proportional hazards regression for deferred donors, by age group 97 Table 39: Results of Cox proportional hazards regression for deferred donors, by age group, for males 98 Table 40: Results of Cox proportional hazards regression for deferred donors, by age group, for females 98 Table 41: Results of Cox proportional hazards regression for deferred donors, by recent donation frequency,
for males 102 Table 42: Results of Cox proportional hazards regression for deferred donors, by recent donation frequency,
for females 102 Table 43: Results of Cox proportional hazards regression for deferred donors, by length of donation history
105
vii
Table 44: Number of donations given in each year of follow-up (including non-returning donors) 108 Table 45: Number of donations given in each year of follow-up- for donors who returned during the year* 109 Table 46: Negative binomial regression of number of donations made in Year 2 of follow-up, given a donor
returned during Year 1 110 Table 47: Negative binomial regression of number of donations made in Year 2 of follow-up, given a donor
returned during Year 1, adjusted for number of donations in Year 1 111 Table 48: Negative binomial regression of number of donations made in Year 3, given a donor returned
during the Year 1 and Year 2, adjusted for donations in Year 1 and Year 2 112 Table 49: Proportion of returning donors deferred due to low Hb during the follow-up period 113 Table 50: Proportion of returning donors deferred for another reason during follow-up period 114 Table 51: Negative binomial regression of number of donations made in follow up period, amongst returning
donors, deferred group 115 Table 52: Negative binomial regression of number of donations made in follow up period, amongst returning
donors, comparison group 115 Table 53: Comparison of demographic characteristics and life stages of participants and non-participants 129 Table 54: Participant demographic and life stage characteristics 130 Table 55: Framework used for indexing: categories and sub-categories 133 Table 56: Key themes for analysis 135 Table 58: Demographic characteristics of respondents 188 Table 59: Proportion with a history of low Hb/low iron, or previous deferral 189 Table 60: Understanding of the extent to which rationales were a consideration for deferral 190 Table 61: Rating of aspects of the deferral event 191 Table 62: Proportion given and understanding letter 191 Table 63: Ratings of possible emotional responses to deferral 193 Table 64: Investigations performed to investigate low Hb 194 Table 65: Underlying conditions (of those who saw their GP) 196 Table 66: Donor provided with an explanation of why their Hb levels were low 198 Table 67: Explanation for low Hb levels 198 Table 68: Proportion given specific advice by their doctor 199 Table 69: Proportion given advice about returning to give blood 200 Table 70: Source of information for lifestyle changes 202 Table 71: Reason attributed to low Hb 202 Table 72: Self-assessed ease of giving blood 203 Table 73: Univariable logistic regression models for certainty of return, demographic and donation
characteristics 212 Table 74: Univariable logistic regression models for certainty of return, aspects of the deferral experience 213 Table 75: Univariable logistic regression models for certainty of return, seeking further investigations and
attributed cause of low Hb 216 Table 76: Univariable logistic regression models for certainty of return, self-perceptions as a donor 217 Table 77: Results of fitting a multivariable model with significant univariable effects 217 Table 78: Results of fitting a second multivariable model with significant univariable effects 219 Table 79: Preliminary final model containing significant main effects 221 Table 80: Demographic characteristics of respondents (from NBMS records) 239 Table 81: Donation Characteristics of repeat donors (self-reported) 240 Table 82: Reasons for low Hb suggested by interview nurses, among those given this information at deferral
241 Table 83: Dietary advice suggested by interview nurses, among those given advice at deferral 242 Table 84: Preferred differences to explanation and advice, among those dissatisfied with this aspect of deferral
243 Table 85: Preferred differences to care, among those dissatisfied with this aspect of deferral 244 Table 86: Proportion given and reading brochures 245 Table 87: Emotional responses to deferral 246 Table 88: Descriptions of respondents’ understandings of the reason for their deferral 248 Table 89: The length of time donors believed they were deferred 249 Table 90: People told about deferral? 250 Table 91: Time taken to visit the GP 250 Table 92: Who saw their GP? Demographic characteristics and donation history 251 Table 93: Who saw their GP? Aspects of the deferral appointment 252 Table 94: Among those who had further tests performed by a medical practitioner, types of investigations 252 Table 95: Among those who had blood tests taken by their GP, outcome of the test results 253
viii
Table 96: Among those given a reason for low Hb by their doctor, summary of the reasons 253 Table 97: Amongst those who saw their GP, what were donors told to do to improve their low Hb? 255 Table 98: Serious illness identified during investigation 257 Table 99: Among those who made changes since deferral, coded responses of the changes made 260 Table 100: Univariable logistic regression models for return within 6 months of being eligible, demographic
and donation characteristics 263 Table 101: Univariable logistic regression models for return within 6 months of being eligible, aspects of the
deferral experience 264 Table 102: Univariable logistic regression models for return within 6 months of being eligible, seeking further
investigations 265 Table 103: Univariable logistic regression models for return within 6 months of being eligible, other factors
266 Table 104: Results of fitting multivariable model of return prior to survey, using significant univariable
effects (amongst donors who saw their GP) 267 Table 105: Results of fitting multivariable model of return prior to survey, with significant univariable effects
(amongst all donors (no GP variables)) 268 Table 106: First preliminary model of return prior to survey 269 Table 107: Second preliminary final model of return prior to survey containing significant main effects 270 Table 108: Outcome of early return donation 271 Table 109: Intention to return within next 6 months 272 Table 110: Reason given for being “very unlikely” to return 273 Table 111: Reason given for being “somewhat unlikely” to return 273 Table 112: Reason given for being “undecided” about return 274 Table 113: Comparison of self-assessed likelihood of return, and actual return during follow-up period 2 276 Table 114: Univariable analysis for actual return in follow-up period 2, by intention to return 277 Table 115: Univariable logistic regression models for intention to return, demographic and donation
characteristics 278 Table 116: Univariable logistic regression models for intention to return, aspects of the deferral experience
279 Table 117: Univariable logistic regression models for intention to return, seeking further investigations 280 Table 118: Univariable logistic regression models for intention to return, other factors 280 Table 119: Results of fitting multivariable model of intention to return, with significant univariable effects
(amongst repeat donors who saw their GP) 281 Table 120: Results of fitting multivariable model of intention to return, with significant univariable effects
(amongst all repeat donors (no GP variables)) 282 Table 121: Preliminary final model of intention to return, containing significant main effects 283 Table 122: Univariable logistic regression models for return after the survey, demographic and donation
characteristics 285 Table 123: Univariable logistic regression models for return after the survey, aspects of the deferral
experience 287 Table 124: Univariable logistic regression models for return after the survey, seeking further investigations
287 Table 125: Univariable logistic regression models for return after the survey, other factors 288 Table 126: Results of fitting multivariable model of return following the survey, with significant univariable
effects (amongst all donors who saw their GP) 288 Table 127: Results of fitting multivariable model of return following the survey, with significant univariable
effects (amongst all donors) 290 Table 128: First preliminary final model of return following the survey, containing significant main effects
291 Table 129: Proportion of new donors (NBMS vs. self-assessment) 293 Table 130: Number of donations given in 12 months prior to deferral, NBMS vs. self-assessment 293
ix
List of Figures Figure 1: Donor deferral due to a low haemoglobin concentration (adapted from SOPs) 10 Figure 2: Sequential Explanatory design (adapted from (Creswell, Plano Clark et al. 2003)) 43 Figure 3: Overview of the research methods used investigate the impact of deferral due to low Haemoglobin
44 Figure 4: Plot of sensitivity versus 1-specificity (ROC Curve) 64 Figure 5: Plot of sensitivity versus 1-specificity (ROC Curve) 70 Figure 6: Significant predictors of return in each year of follow-up in the deferred group 77 Figure 7: Plot of sensitivity versus 1-specificity (ROC Curve) 81 Figure 8: Time to return, by study group 88 Figure 9: Hazard estimates smoothed over the three year follow-up period 89 Figure 10: Hazard estimates smoothed to show hazard each week 90 Figure 11: Factors influencing survivorship amongst deferred donors 92 Figure 12: Time to return for low Hb deferred donors, by sex 93 Figure 13: Hazard estimates smoothed over the three year follow-up period, by sex 94 Figure 14: Hazard estimates smoothed week by week, by sex 94 Figure 15: Hazard estimates smoothed over the three year follow-up period, by sex (comparison group) 95 Figure 16: Hazard estimates smoothed week by week, by sex (comparison group) 95 Figure 17: Time to return for low Hb deferred donors, by age 96 Figure 18: Hazard estimates smoothed over the three year follow-up period, by age 97 Figure 19: Time to return for low Hb deferred donors, by new donor status 99 Figure 20: Hazard estimates smoothed over the three year follow-up period, by new donor status 100 Figure 21: Hazard estimates smoothed week by week, by new donor status 100 Figure 22: Time to return for low Hb deferred donors, by recent donation frequency 101 Figure 23: Hazard estimates smoothed over the three year follow-up period, by recent donation frequency 103 Figure 24: Hazard estimates smoothed week by week, by recent donation frequency 103 Figure 25: Time to return for low Hb deferred donors, by donation history 104 Figure 26: Hazard estimates smoothed over the three year follow-up period, by donation history 105 Figure 27: Hazard estimates smoothed week by week, by donation history 106 Figure 28: Time to return for low Hb deferred donors, by deferral for low Hb prior 106 Figure 29: Personal benefits of being a blood donor 146 Figure 30: Pathway to unintentionally lapsing from donation 151 Figure 31: Conceptual model explaining likelihood of return after a temporary deferral for low Hb 170 Figure 32: Shift in likelihood of return after a temporary deferral for low Hb 172 Figure 33: Shift in likelihood of return: for a working female donor with children 172 Figure 34: Shift in likelihood of return: when return is facilitated by giving in a group and donation is viewed
as personally rewarding 173 Figure 35: Timeline for deferral and survey for the survey of experiences seeking further investigations 186 Figure 36: Rating of the extent to which deferral was a surprise 192 Figure 37: Rating of whether the donor would have given at deferral 193 Figure 38: Distribution of role-merger score 204 Figure 39: Factors associated with role identity score 206 Figure 40: Distribution of self-efficacy score 207 Figure 41: Factors associated with self-efficacy to return once eligible 209 Figure 42: Intention to return to donate 210 Figure 43: Plot of sensitivity versus 1-specificity (ROC curve) 222 Figure 44: Factors associated with intention to return in final logistic regression model 222 Figure 45: Timeline for deferral, survey and follow-up periods for study 231 Figure 46: Summary of pathways following deferral 234 Figure 47: Plot of sensitivity versus 1-specificity (ROC Curve) 271 Figure 48: Plot of sensitivity versus 1-specificity (ROC Curve) 284 Figure 49: Plot of sensitivity versus 1-specificity (ROC Curve) 292 Figure 50: Significant pathways predicting intention to donate & actual donation before and after the survey
292

x
Abstract
This thesis explored the impact on whole blood donors of a six month deferral from giving
blood due to a low haemoglobin (Hb) concentration. The aims were two-fold: first, to
quantify the effect of a temporary deferral on donation patterns once eligible to return, and
second, to identify the processes contributing to the effect. The mixed methods design
utilised four distinct research phases: statistical analysis of donation patterns over a three
year period, surveys of whole blood donors three and twelve months after deferral, and
semi-structured interviews with 25 blood donors in the weeks immediately following
deferral.
Deferral for a low Hb increased the likelihood of non-return in both new and repeat donors,
and, amongst those who did return, delayed first return, reduced donation frequency and
increased the likelihood of drop-out in later years.
Qualitative interviews suggested that, predominantly, individuals give blood because it
represents an easy and convenient way to help others, and provides additional rewards, such
as enhancing positive self-concepts and a free health check. Returning promptly after
deferral appears to be related to three aspects of a person and his/her context: an
individual’s other obligations, especially parenting; the extent to which donation is
considered personally rewarding; and whether donation arrangements were facilitated by a
range of supports prior to deferral.
Over three quarters of surveyed deferred donors seek further advice and investigations from
their medical practitioner and nearly half of those are encouraged to change their donation
patterns. With the exception of having a low haemoglobin level confirmed at follow-up
testing, experiences seeking further investigations were not associated with either intentions
or return.
Triangulation of findings suggests that deferral disrupts the habit of regular donation, and
that this disruption makes donors more vulnerable to changes to their personal
circumstances or collection practices. Deferral may also increase the perceived
inconvenience of the activity, decrease self-perceptions of competence and good health, and
diminish the “blood donor” identity.

xi
Practical implications of these findings are recommendations that may increase retention of
deferred donors, including encouraging donors to return promptly once eligible, enhancing
the convenience of blood donation, and improving aspects of the deferral event.


xiii
Dedication
This thesis is dedicated to my parents, for their constant love, support and encouragement.
xiv
Acknowledgements I benefited from a wonderful supervisory panel. First, I wish to thank my principal
supervisor Prof Philip Ryan for his wisdom, guidance, and seemingly endless patience. To
A/Prof Vivienne Moore, thanks for your passion, enthusiasm, and understanding. I am
indebted to Dr Kathleen Doherty, who was responsible for sourcing the initial funding for
the project and provided much encouragement and good cheer.
This research was supported by an internal Australian Red Cross Blood Service (ARCBS)
project grant and an ARC-Linkage Grant (LP0669248). I am grateful to a number of staff at
the ARCBS, particularly to members of the Data Warehouse team for their assistance in
obtaining data, and senior managers in the Donor Services area for their support of the
project.
Thanks to Thomas Sullivan from DMAC for sharing his statistical expertise.
Many thanks to my friends and family for their love and support over the last four years.
There are a number of individuals who particularly helped in the final stages of the PhD.
Sharyn Goudie offered constant encouragement and social support while I was writing up,
and provided comments on numerous chapter drafts. Michelle Carr Swift provided
feedback on my qualitative chapter. My father Lewis Hillgrove assisted in proof-reading.
A special thanks to my husband Ben for helping me keep it all in perspective and for
providing love, encouragement and support.
To my co-workers & fellow students Sue Heatley and Natalie Villalta, thanks for the
friendship and camaraderie. Thanks also to my fellow PhD students (past and present), in
particular Dr Adam Elshaug, Emily Steele, Gemma Carey, James Smith, Dr Catherine
Chittleborough, Alana Hansen, Rosie King, Jesia Berry, Lisa Yelland, and Natasha
Howard, for the friendship and for generously sharing your expertise despite your own
heavy workloads.
Professional editors, Bill & Rose Winser, were used in the preparation of the thesis for
submission, following the guidelines of the Australian Standards for Editing Practice.
Finally, this research could not have been completed without the assistance of the many
blood donors who participated in surveys, pilot studies, and interviews. Thank you.

1
1 Introduction
The act of donating blood to an anonymous stranger has been described as the purest form
of altruism (Titmuss 1997). Blood is donated at considerable personal cost for minimal
reward, contrasting with the enormous benefit to the transfusion recipient, who might
literally have been given the “gift of life”.
What happens when the offer of the gift is refused? Will donors understand the reason for
their deferral? Will they seek further medical investigations? And, importantly, will they
return to give blood once eligible?
This thesis is concerned with whole blood donors who, in the interests of their health, were
not permitted to give blood for a six month period.
1.1 Background and rationale for research
1.1.1 The Australian blood supply
The collection, management, and distribution of blood in Australia is coordinated by the
Australian Red Cross Blood Service (ARCBS), which is jointly funded by the Federal and
State Governments (Australian Red Cross Blood 2007). Australian blood donors are not
paid for their donations.
The blood supply is a vital component of the Australian health system. The health and
safety of patients requiring transfusions or blood products are dependent on the availability
of a safe and reliable blood supply, which in turn is dependent on the willingness of non-
remunerated volunteers to become and remain blood donors.
Australia is one of the few countries that has achieved self-sufficiency in fresh blood
products, and is nearly able to meet all demand for plasma products (Australian Red Cross
Blood Service 2008). However, self-sufficiency is difficult to maintain, particularly in light
of increasingly strict donor acceptance criteria and a growing demand for blood due to the
ageing population and new medical techniques (Gillespie and Hillyer 2002). Currently,
only three percent of the Australian population donates blood each year (Australian Red
Cross Blood Service 2007), and donation rates have been declining over the past two
decades (Whyte 1999). The blood supply is thus reliant on a small group of committed,
regular donors, making both recruitment and retention efforts vital to guarantee that blood
is readily available to those who need it (Whyte 1999; Gillespie and Hillyer 2002).

2
Not all people are eligible to donate blood. Amongst other criteria, Australian blood donors
must be aged between 16 and 81, weigh 45 kilograms or more, be of good health, have not
resided in the UK for a cumulative period of 6 months between 1980 and 1996, and have
haemoglobin levels within prescribed criteria (Australian Red Cross Blood 2007). Donors
who fail to meet acceptance criteria may be deferred temporarily or permanently. Deferral
guidelines are in place to protect the safety of recipients, and/or to safeguard the wellbeing
of the donor.
1.1.2 Temporary deferral due to a low haemoglobin concentration
Prior to giving blood, all individuals participate in a pre-donation screening interview,
during which a nurse determines their eligibility to give blood. During this time a finger-
prick blood sample is taken which is used to measure their haemoglobin (Hb)
concentration. Those who fail to meet the minimum acceptable Hb concentration (currently
120g/L for women, and 130 g/L for men) are not eligible to give blood on the day, and,
subject to the results of further testing, are deferred from giving blood for a six month
period. Individuals are eligible to return sooner if their physician deems it safe for them to
do so.
Approximately 5% of those attending to give blood are deferred due to a low Hb
concentration each year (Love 2007). Deferral for this reason is both a recipient and donor
safety issue. It ensures that transfusion recipients receive a minimum infused haemoglobin
dose per unit. The donor with a low haemoglobin concentration, which indicates anaemia
and possibly iron deficiency, is protected from further depleting their iron stores. A low
haemoglobin concentration may be the result of lifestyle factors such as dietary deficiency
of iron, heavy exercise (Doust 2003), or frequent blood donation (Bianco, Brittenham et al.
2002; Boulton 2004; Newman 2006). Women are particularly prone to depleted iron stores
due to menstrual blood loss, increased iron demands due to pregnancy, and blood loss
during childbirth (Ross 2002). Furthermore, a low Hb can indicate an underlying
pathology, such as coeliac disease, gastrointestinal bleeding from gastritis or peptic ulcer
disease, neoplasms, inflammatory bowel disease, parasitic infections, haemorrhoids, and
urinary tract or pulmonary system conditions (Ross 2002).
The six month deferral period allows donors time to seek further investigations and advice
from their physicians, complete any necessary testing, and make changes to their diet or
lifestyle to address their depleted iron stores. Even though donors are eligible to return after

3
the six month period, it is known that many will not do so. Several studies have shown that
individuals are less likely to return to donate blood after a temporary deferral (Jobuck, Lau
et al. 1980; Noonan, Menitove et al. 1981; Piliavin 1987; Halperin, Baetens et al. 1998;
Custer, Chinn et al. 2007). However, all research in this area has been conducted in the US,
where collection and deferral practices are known to differ to those used in Australia.
Furthermore, no studies have identified the processes responsible for the reduced likelihood
of return after a temporary deferral.
1.2 Aims
1.2.1 The purpose of this research
First, it was not known how many Australian donors deferred due to low Hb return once
they are eligible, and whether those returning will continue to donate with the same
frequency as before their deferral. This research investigated the return patterns of blood
donors who have been temporarily deferred due to a low haemoglobin concentration
relative to those who were not deferred.
Second, the research aimed to explain why temporarily deferred donors are less likely to
return once eligible.
1.2.2 Outline of studies in this thesis
This research was comprised of four separate studies. The first study quantified the impact
of a temporary deferral for low haemoglobin on the subsequent donation patterns of whole
blood donors.
Using qualitative research methods, the second study sought to understand donors’
experiences of deferral, their intention to return once eligible, the reasons they give blood,
and how this activity fits into their lives.
The third and forth studies used cross-sectional surveys to investigate what proportion of
donors seek further investigations following their deferral, and of those who do so, how
many have clinically significant iron deficiency, receive satisfactory explanations of their
conditions, and are given advice about whether they should continue to give blood. These
issues were explored using surveys at three and twelve months after the deferral event. The
surveys also sought information on donors’ perceptions of the deferral event and their
intentions to return once eligible.

4
Finally, survey responses twelve months after the deferral were linked with donation
records of return within one year of being eligible to do so. This allowed analysis of the
association between prompt return and intentions to do so, aspects of the deferral event, and
the experience of seeking further investigations.
The next chapter (Chapter 2) provides an overview of the literature and theoretical
perspectives guiding the research. Following this, Chapter 3 gives an overview of the
methods used in the project and Chapters 4-7 contain the results from each of the four
distinct research phases. Chapter 8 contains the final discussion and conclusion.

5
2 Literature review
2.1 Chapter Outline
This chapter presents the background literature and theoretical perspectives that frame the
investigation and analysis in the subsequent chapters of the thesis.
The first section of the chapter will describe the public health impact of iron deficiency, and
the way in which blood donors are screened for the condition and subsequently deferred.
Next, the chapter reviews research on treatment seeking behaviours following notification
of a screening result. A literature review of the reasons people begin to donate blood, and
how they come to make a commitment to the practice of blood donation, will be followed
by a review of the research investigating the impact of temporary deferral on subsequent
blood donations. Finally, the chapter will introduce the theoretical perspectives used to
guide the research described in subsequent chapters: the Theory of the Spurned
Philanthropist, Role Identity Theory, and finally, the Theory of Planned Behaviour.
2.2 Background
2.2.1 Donor deferral for a low Hb concentration
As noted in the introduction, a temporary deferral due to low Hb is predominantly in the
interests of the donor. A low Hb concentration (anaemia) is associated with negative health
outcomes in its own right, and may also reflect an underlying pathology. Anaemia is often
caused by an iron deficiency, a condition which contributes to poor health and decreased
wellbeing in a number of ways. A six month deferral allows donors to seek further
investigations into the causes of their low Hb concentration, adequate time to restore their
levels, and prevents someone with an iron deficiency from further depleting their stores.
This section describes the health effects of anaemia and iron deficiency, their prevalence in
the Australian population, and the role of frequent donation in depleting iron stores. First,
however, terms commonly used in this chapter will be defined.
2.2.2 Definitions of anaemia, iron deficiency, and iron deficiency anaemia
Anaemia is defined as a haemoglobin concentration of <120g/L for women and <130g/L
for men (World Health Organisation 2001), and although underlying conditions (such as

6
malaria) can cause anaemia in the absence of iron deficiency, iron deficiency is the most
common cause. Iron deficiency occurs when iron stores have been depleted to the point
where there are insufficient stores available to be mobilised to meet the body’s
requirements (World Health Organisation 2001). Serum ferritin concentration is a more
accurate measurement of iron stores, with a level of <15 μg/l indicating iron deficiency
(Corbaic and Baghurst 1993; Herrmann 1994; World Health Organisation 2001). Iron
deficiency anaemia (IDA) occurs after iron stores have been severely depleted or exhausted
thus causing haemoglobin production to fall. WHO guidelines define IDA as the presence
of both iron deficiency (serum ferritin of <15 μg/l) and anaemia (haemoglobin
concentration of <120g/L for women and <130g/L for men) (World Health Organisation
2001).
2.2.3 The impact of iron deficiency
Iron deficiency is a global public health issue and is estimated to affect some four to five
billion people worldwide (World Health Organisation 2003). The condition is associated
with reduced work capacity and cognitive function, impaired fetal development, diminished
physical performance in athletes, impaired regulation of body temperature, and reduced
immunity (Corbaic and Baghurst 1993). Australian research has shown that self-reported
low-iron status is associated with a drop in physical and mental capabilities and in general
vitality (Patterson, Brown et al. 2000).
There is evidence that amongst older adults, a low Hb concentration may contribute to
mortality even in the absence of iron deficiency or other diseases, with Australian research
concluding those aged over 65 were more likely to die if they had Hb concentrations in the
lowest and highest quintiles (McCredie 2005).
There is a possibility that iron deficiency is associated with health benefits. Some research
has suggested that blood donors are less likely to suffer Coronary Heart Disease (CHD) - a
finding hypothesised to be due to the process of having iron stores repeatedly depleted and
restored (Sempos 2002; Alpert 2004). However, the finding is contentious, with the
observed protective effect potentially an artefact of study design, due to the fact that
individuals with a history of CHD are not eligible to give blood and therefore under-
represented in the donor population (Sempos 2002).
The prevalence of iron deficiency in the Australian adult population is difficult to establish.
The three studies published in the literature have each assessed the iron stores of a different
7
target population, with no consensus on which laboratory assessments should be performed
or which criteria indicate iron deficiency or IDA. However, it seems likely that between 7
and 9% of women are iron deficient, and between 2 and 3% of men. The most recent study
was undertaken in a population of women aged 15-30 years and used a multiple criteria
measurement (iron deficiency defined as serum ferritin <12 µg/L & transferrin saturation of
<16% ; IDA defined as additionally having a Hb of <120g/L). The research reported 7.2%
of the sample were iron deficient and 4.5% had IDA (Rangan, Aitkin et al. 1997). An
earlier study assessed the iron stores of bank and finance employees, using a cut-off of
serum ferritin ≤10µg/L, and found that 8.9% of women and 2.6% of men were iron
deficient (Leggett, Brown et al. 1990). A more comprehensive study of the iron status of
the adult Australian population was undertaken in 1989 as part of the National Heart
Foundation Risk Factor Prevalence Study. Using a cut-off level of serum ferritin <20µg/L,
2% of men were found to be iron deficient, compared to 8% of women (Corbaic and
Baghurst 1993).
An iron deficiency may result from underlying conditions, such as coeliac disease,
gastrointestinal bleeding from gastritis or peptic ulcer disease, neoplasms, inflammatory
bowel disease, parasitic infections, haemorrhoids, and conditions of the urinary tract or
pulmonary system, all of which cause blood loss or poor absorption of dietary iron (Ross
2002). Alternatively, it may be caused by lifestyle factors, such as insufficient iron in the
diet (Herrmann 1994), heavy exercise (Doust 2003), and in women, heavy menstrual blood
loss, increased iron demands due to pregnancy, and blood loss during childbirth (Ross
2002).
Two Australian studies have identified that blood donors have a higher prevalence of iron-
deficiency than the rest of the population. In an older population, women who donated
blood at least three times per year were more likely to be iron deficient (Leggett, Brown et
al. 1990), while in a younger population, the relationship between blood donation and iron
deficiency was only seen amongst women with a BMI of <20 (Rangan, Aitkin et al. 1997).
Brazilian researchers have also found that those who have previously given blood are more
likely to be iron deficient than first time donors (41.5% vs. 18.5% of women, and 7.6% vs.
0.0% for men respectively) (Cancado, Chiattone et al. 2001). The likelihood of iron
deficiency also increases with donation frequency, with 20% of men and 19% of women
who donated at the maximum frequency allowed in Germany (5 times p.a. for men, 3 times

8
p.a. for women) found to be iron deficient, compared to 1% and 6% of first time male and
female blood donors respectively (Radtke, Meyer et al. 2005).
It is not surprising that blood donation is associated with iron deficiency in women.
Gordeuk (2002) demonstrated that if the average female donor had 250-500mg of stored
iron, and lost approximately 210mg in a standard whole-blood donation, she would take
approximately 1.5 years to replace the iron lost at one donation if continuing to consume a
normal diet. If the donor was already iron deficient before donation, iron re-absorption rates
would be higher (3.0mg/day above basal losses), but after 2.5 months, the replacement
point, the donor would still be iron deficient (Bianco, Brittenham et al. 2002). In an older
population, Garry and colleagues showed that female donors aged 65+ were able to cope
with donations every 8-12 weeks if they had adequate iron stores to begin with, while
donors with inadequate stores were more likely to become anaemic and subsequently were
deferred (Garry, Koehler et al. 1995).
2.2.4 Screening blood donors for iron deficiency
Figure 1 is a flow chart describing the process for screening and deferring whole blood
donors for low Hb levels. This chart has been adapted from ARCBS standard operating
procedures that applied during the period of research presented in this thesis.
Hb concentrations are measured with a capillary finger-prick test taken by collection staff at
the beginning of the donation interview, to determine whether the haemoglobin level is
within the selection criteria. This capillary sample is analysed using the HemoCue ™
automated analyser, and those with levels greater than the acceptable minimum (currently
120g/L for women and 130g/L for men) are able to donate blood, provided they meet all
other criteria for whole blood donation.
Those who fail the capillary Hb test are offered further tests from a venous sample of blood,
which is recognised to give a more accurate reading than a capillary sample. A small
amount of the venous sample is then tested using the HemoCue machine. If this sample is
above the threshold, the donor is able to donate. If not, the donor is temporarily deferred
from donating blood for a period of six months.
The remainder of the venous sample is retained for further testing, including serum ferritin
analysis to investigate possible iron deficiency. Donors are notified their ferritin test results
by letter after the deferral event. If their test results are found to be within the normal range,
donors are informed that they are eligible to return at any time; however if they are low, the

9
deferral period remains. (There is one exception: those who have a normal ferritin but a low
Hb level are placed on an indefinite deferral and not invited to return. They may, however,
donate if they are cleared to do so by a medical officer and meet future acceptance criteria).
After the six month deferral the donor may return to donate provided they meet the
acceptance criteria. Donors may also return within this six month deferral period provided
the ARCBS has received permission from their physician following investigations into the
cause of their low Hb, and they meet the acceptance criteria.
10
Figure 1: Donor deferral due to a low haemoglobin concentration (adapted from SOPs)
Flow Chart for Donor Deferral due to low Haemoglobin
* These donors are indefinitely deferred. They are allowed to return with the permission of their doctor, but are not invited to do so by the ARCBS

11
Automated haemoglobin analysis (such as the HemoCue ™ machine, used to measure
haemoglobin levels of Australian blood donors) is quick, inexpensive, and able to be
performed at the point-of-care by any trained individual (HemoCue AB 2007).
There has been considerable debate around the best way to screen donors for iron
deficiency. Screening donors for haemoglobin will detect anaemia, but will not reliably
detect iron deficient donors or those at risk of anaemia if they continue to donate.
The first issue is that Hb levels fall only after iron stores have been exhausted, and so an
individual can have iron stores insufficient to meet their bodily demands and yet still have a
haemoglobin in the normal range (Radtke, Meyer et al. 2005). The second issue is that Hb
has poor specificity and sensitivity in relation to detecting iron deficiency. The low
specificity of the test means that a proportion of donors deferred for low Hb will not have
low iron stores, due to the poor correlation between haemoglobin levels and stored iron,
and the low sensitivity of the test means that not all iron deficient donors will be detected,
resulting in iron deficient donors being allowed to donate.
Two studies of iron stores in blood donor populations have demonstrated the difficulty of
using haemoglobin measurements to assess iron stores. A Brazilian group investigated the
iron status of donors who had been accepted to donate (females with Hb levels of >120g/L,
males >130g/L), and found that 11% of the accepted blood donors were iron deficient
(Cancado, Chiattone et al. 2001). More recently, a German group found that only 29% of
donors deferred due to low Hb (as assessed by a finger-prick capillary sample) were iron
depleted according to the most precise laboratory measurement available (logarithm of the
ratio of soluble transferring receptor to ferritin (log(TfR/F)). Furthermore, 85% of those
with depleted iron stores, as determined by the log(TfR/F) measurement, had Hb
concentration above the German thresholds (125g/L for women and 135g/L for men)
(Radtke, Tegtmeier et al. 2005).
In light of the difficulties screening blood donors for iron deficiency, there has been
considerable debate about the minimum Hb level for blood donation (Cable 1995).
Different countries use different methods to measure Hb concentration, and there is
discussion as to whether levels should be increased to minimise the likelihood of accepting
a donation from an iron deficient donor, or decreased so more donors are able to contribute
to the blood supply.
12
Australia currently follows the recommendations made by the Council of Europe (12th Ed.)
in the publication “Guide to the Preparation, Use and Quality Assurance of Blood
Components” (Council of Europe 2006). The guide states that females and males with Hb
of less than 125 g/L and 135 g/L respectively should be deferred from donation, however
“individual donations may be accepted below these levels after consultation with the
responsible physician or as established by a national control authority based on norms for
this specific population” (Council of Europe 2006). With haemoglobin thresholds set at
120g/L for women and 130g/L for men, Australia is currently accepting donors at a level
below that recommended by the Council of Europe.
However, the international literature suggests blood could safely be taken from donors at
lower cut-off thresholds. For example, Ali and colleagues demonstrated that most Canadian
blood donors, deferred at 125g/L and 135g/L (for women and men, respectively), were not
iron deficient (Ali, McAvoy et al. 1985), and in a later study showed that the Hb level
which best discriminated between iron deficient and non iron deficient donors was 115 g/L
and 125g/L for women and men respectively (Ali, Goldsmith et al. 1989).
An additional issue is that reference values for haemoglobin deferral are based on
population norms, and consequently many people have a low Hb concentration with no
corresponding poor health or underlying disease (Doust 2003). However, some not meeting
the acceptance criteria will have an underlying medical condition (Ross 2002), and their
deferral from donating blood may be the first time their condition is bought to their
attention. Unsworth and colleagues found that 4.6% (n=22) of a sample of anaemic donors
in the UK (n=483) had coeliac disease; prior to the study, none of the donors had ever been
investigated for the condition, and, worryingly, 14 of the 22 donors had not had any further
investigations carried out by their doctor following their deferral (Unsworth, Lock et al.
2000).
2.2.5 Seeking medical investigations after deferral
Currently it is not known how many Australian donors will seek further investigations
regarding their low Hb status. Two studies conducted in the US in the early 1980s suggest
that only a small proportion will do so. The first study was a review of an evaluation system
in US blood service. Donors with an irregular pulse or cardiovascular symptoms were
deferred and provided with a letter for their physicians in the event they underwent further
investigations. The letter contained an evaluation report section for physicians to return to

13
the blood service stating the donor’s suitability to continue donating. Researchers reviewed
the proportion of physician evaluation reports received by the blood service out of the total
number of deferred donors who were given a letter (n=1203), and found that 18% of
referral letters resulted in an evaluation being received, and 13% (n=29) of those
evaluations recommended that the donor did not continue to donate. The study also
suggested that donors deferred for a medical condition already known to them were less
likely to seek further investigations than donors for whom the finding was new (Blumberg,
Shah et al. 1982). The study did not attempt to examine the experience of those who did not
seek treatment and return their evaluation report to the blood service.
The second study investigated whether providing donors with counselling immediately
after their deferral for low haematocrit increased the proportion seeking further
investigations (Falter and Reiss 1981). Donors receiving a standard deferral (n=60), which
consisted of the nurse providing a verbal statement of their deferral, an information sheet,
and a suggestion that they might want to see their physician, were far less likely to visit
their physician for further investigations than donors who were offered a more in-depth
explanation about their low haematocrit (n=61). At 12-18 weeks after deferral, only 25% of
donors in the standard deferral group visited their physician, with 15% making a visit
specifically for that purpose, and 10% mentioning their deferral in an unrelated visit.
However, 60% of donors who accepted counselling at their deferral appointment saw their
family physician. Amongst those who did not seek further investigations, the most common
reason was not feeling unwell, followed by “not yet having got around to it”. Of the group
offered counselling, younger donors were less likely to seek further treatment than older
donors, but no more likely to do so than younger donors from the standard deferral group.
It is unclear how many patients seeking investigations for the cause of their low Hb reach a
satisfactory outcome. Research groups from Australia (Herrmann 1994) and other countries
(Farrell and LaMont 1998; Goddard, McIntyre et al. 1999; Hin, Lehman et al. 1999) have
shown that there is some controversy about the best and most complete way to investigate
the cause of anaemia. A UK study found that twelve months after presenting to primary
care physicians with iron deficiency anaemia, only 30% of subjects had a confirmed
diagnosis, and 40% still had low Hb levels (Logan, Yates et al. 2002). Further
investigations of this cohort found that 11% (n=48) of patients had gastrointestinal cancer.
The majority of patients (53%) had not had any investigations carried out within three
months of presenting, with 32% having no documented reason for non-investigation.

14
Women aged less than 65 and patients with recurrent anaemia were less likely to be offered
investigations (Yates, Logan et al. 2004).
A second UK study recommended that patients aged 50 or older presenting to their GP with
IDA should have full investigations of the gastrointestinal tract
(oesophagogastroduodenoscopy (OGD), sigmoidoscopy and barium enema), as 12 of the 26
patients studied were found to have a serious condition, often in the absence of symptoms
(Stellon and Kenwright 1997). Similarly, an Australian study investigating the frequency of
neoplasms in a group of IDA patients referred to a clinic (n=80, 51 with confirmed IDA
and 29 with probable IDA) found that 9% of the sample had colonic cancer, even though all
but one patient was symptom free, and 60% of the patients had gastrointestinal lesions that
were the likely cause of their IDA (Bampton and Holloway 1996).
2.3 Why do people donate blood? Encouraging people to try donating blood is a difficult and expensive exercise (Devine,
Goldman et al. 2007). There are many barriers to blood donation, including time out from
routine, waiting times at blood centres, transport issues, interference with normal life (such
as being requested not to participate in certain activities after donating), fear of pain and
needles (Piliavin, Evans et al. 1984), and possible fatigue after donation (Nilsson-Sojka and
Sojka 2003). Young people are less likely to donate than older generations, and a recent US
study found this group most commonly cited the “inconvenience” of donation as the main
reason they did not give blood (Kolins and Herron 2003).
Australian blood donors are not paid for their donations, and receive no tangible reward for
their contribution apart from light refreshments following donation, and small, inexpensive
gifts to recognise milestone donations. Given the significant costs of donation to the donor,
and the minimal tangible rewards offered in exchange, donors have little incentive to
donate, especially if they believe their blood is not viable to be used for transfusion. It is
widely accepted that the safest possible blood supply can only be provided by voluntary,
non-remunerated blood donors (WHO 2008). Many countries are attempting to move away
from their reliance on paid or family replacement donors, as blood collected from these
sources may be less safe as donors have an incentive to hide risk behaviours (WHO 2008).
In the “Gift Relationship”, originally published in 1970, Richard Titmuss considered
altruism to be the principal motivator in a non-remunerated blood donation system. He
proposed that a collection system based on altruism would deliver a safer blood supply

15
(such as the system in the UK), with less wastage and greater efficiencies, than a
commercial collection system (such as the for-profit system that dominated the US at the
time) (Titmuss 1997). Non-remunerated donation was also argued to be important for social
cohesion, with Titmuss proposing that a lack of opportunity for voluntary blood donation
would diminish the “spirit of altruism” in society (Titmuss 1997). Titmuss’ book had far-
reaching influence on blood collection policy, prompting a move from a primarily for-profit
system towards a non-remunerated system in the US, and maintaining the structure of the
National Blood Transfusion Service in the UK.
However, Titmuss’ thesis is not without critics. Rapport and Maggs argue that the survey
tool used by Titmuss was flawed, and therefore the theory that Titmuss built from his tool
was unreliable. If blood donors are altruistically motivated, they argue, then this fact is not
demonstrated in his work (Rapport and Maggs 2002). Schwartz states that Titmuss used
incomplete and inadequate data to draw his conclusions, and that unchecked altruism is just
as dangerous as unchecked commercialism (Schwartz 1999). Nevertheless, the argument
that blood donors are primarily motivated by altruism is widely accepted (Piliavin 1990).
Given the challenges in maintaining a sufficient blood supply, the idea of reintroducing
payment in return for blood donation has been raised as a possible way to increase the
donor base (Fernandez-Montoya 1997; Simon 2003). In defence of payment, Schwartz has
suggested that scientific advances, rather than volunteer blood donation, have been
responsible for the increase in blood safety over the past two decades (Schwartz 1999). In
defence of non-remunerated donation, Keown writes that payment for blood donation is
unnecessary and unethical, based on five principles: the self-sufficiency of several countries
with non-remunerated systems demonstrates that payment is unnecessary; social cohesion,
as unpaid donation promotes altruism and social solidarity; safety concerns of taking
donations from those motivated to donate by payment; avoiding exploitation, as those most
likely to be persuaded by financial reimbursement are the poor and deprived; and finally,
questions around the commercialisation of the human body - Keown (1997) asks if blood
can be sold, then why not kidneys, eyes, or hearts (Keown 1997)? Furthermore, there is
evidence to suggest that many committed blood donors would decide not to give blood if
they were offered payment (Howden-Chapman, Carter et al. 1996).

16
2.3.1 Describing the donor population: past research into the motivations and socio-demographic characteristics of blood donors
In 1977, Oswalt reviewed the international literature on the socio-demographic
characteristics of blood donors and motivations to donate. The “average” donor was shown
to be male, married, aged in his 30s or 40s, who gave blood as part of an organised group.
Studies at that time consistently found that blood donors were primarily motivated by
altruism and humanitarian concerns. Donors were also motivated by social pressure, an
awareness of the need for blood, and were influenced by behavioural modelling, being
more likely to donate if they had a friend or family member who also gave. More selfish
reasons were also apparent, with some reporting they felt proud of their efforts and superior
to non-donors, and others giving blood to earn blood credits for their family or to replace
blood used by themselves or someone they knew - common practices in the US at the time
(Oswalt 1977). Around the time of Oswalt’s review, recruitment efforts were primarily
coordinated by volunteers, with no systematic reminder systems, and poor efforts to
reactivate previous donors.
By the time Piliavin published her review of donor research undertaken between the late
1970s and 1990, there had been many changes in the way blood was collected. Donor
acceptance criteria had changed dramatically in light of the tainted blood scandals related to
HIV in the 1980s, excluding many previously acceptable individuals from the donor pool.
US research during this period occurred in the context of an entirely voluntary system, with
whole blood donors no longer able to receive payment for their donation, and blood credit
or replacement systems largely eradicated. Researchers were using more sophisticated
approaches to investigate donor motivations, such as incorporating theory into their
research.
Piliavin’s review reported that the majority of first time donors were now women, although
women were more likely to stop donating between the forth and eight donation, and were
correspondingly underrepresented in the most experienced donor group. Donors were still
more likely to be married than not, while no consistent relationship was found between
donor status and occupational prestige. Piliavin concluded that the socio-demographic
characteristics of the blood donor population were most likely the result of collection
practices, rather than true differences in motivation (Piliavin 1990). There also appeared to
be no clear personality traits associated with blood donor status, but rather, people became
17
committed to giving blood through the very practice of donating. Donors continued to cite
altruism as their main motivation, although some research suggests this is merely a
rationalisation, and in fact donors are more motivated by increased self-esteem and
emotional gratification. The use of incentives was found to motivate some donors to give,
but backfired amongst more altruistically motivated donors, and was thought to inhibit the
development of internal motivations to donate. Awareness of community need and social
pressure remained important motivations (Piliavin 1990).
Since Piliavin’s review was published in 1990, the context of voluntary blood donation has
shifted once again, with the emergence of risks associated with new infectious diseases,
such as Variant Creutzfeldt-Jakob disease (vCJD), resulting in further restrictions on who is
eligible to give blood. Consequently, the 1990s saw a substantial drop in the amount of
blood collected in Australia (Whyte 1999) and in the US (Gillespie and Hillyer 2002), as
well as in other countries, while at the same time demand for blood increased (Gillespie and
Hillyer 2002). More studies were guided by theory (Ferguson 1996), and large multi-centre
studies enabled detailed descriptions of the sociodemographic characteristics and risk
profiles of the US blood donor population (Zuck, Thomson et al. 1995). The findings of
recent research into the motivations and socio-demographic characteristics of blood donors
are summarised in the following section.
2.3.2 Retention of blood donors: recent research and implications for retention strategies
Retention of existing blood donors is a very high priority for blood services, as repeat
donors provide a safer source of blood than first time donors (Williams, Thomson et al.
1997; Glynn, Busch et al. 2003), and are more responsive to requests to donate (Gillespie &
Hillyer 2002). Furthermore, it is estimated that less than half of those who can be
convinced to try donating blood return after their first donation, let alone become regular
donors (Schreiber et al. 2003). Yu and colleagues found 5.9% of male and 7.6% of female
first time donors were still donating blood after four years, and around 60% of first time
donors had not returned within four years of their initial donation (Yu, Chung et al. 2007).
The findings of three studies show that the period following the first donation is critical in
determining future donation behaviour. Schreiber and colleagues found that the number of
donations given in the twelve months following a first donation predicts the likelihood that
a person will become a committed donor (Schreiber, Sharma et al. 2005). Yu et al (2007)
18
used a “decision tree” approach to study the donation patterns of first time Hong Kong
donors, and found that the donations made within 18 months of the first donation could
predict whether a donor became a “once-only”, “drop-out”, or “committed” donor over the
four year follow-up period (Yu, Chung et al. 2007). Similarly, Ownby and colleagues
showed that the shorter the time period between the first and the second attendance, the
greater likelihood the donor would make more donations in the future (Ownby, Kong et al.
1999).
However, efforts to understand why donors return after an initial donation have not yielded
many possibilities for intervention. One study found that only 6% of donor return could be
predicted by attitudes and intentions at the first donation, with 4% relating to donor’s
intention to donate and 2% to donor’s rating of staff and atmosphere (Piliavin and Callero
1991). Research by Godin and colleagues indicated that return of first-time donors was only
predicted by intentions to give and belonging to an older age group (Godin, Conner et al.
2007). Motivations leading to the first donation attempt appear to predict the likelihood of
giving blood again, with those intrinsically motivated (i.e. giving blood without being
asked or attending on their own) more likely to return than those who gave under social
pressure (i.e. being asked to attend or donating with a group) (Callero and Piliavin 1983;
Germain, Glynn et al. 2007).
A number of studies have been published in the last ten years exploring the factors
associated with future donation behaviour amongst those who have already given blood.
Consistent links have been demonstrated between donation behaviour and psychological
constructs such as attitudes, perceived behavioural norms, anticipated regret at not giving
blood, intentions, self-efficacy, and perceived behavioural control (Masser, White et al.
2008). Previous donation behaviour has been shown to be a strong predictor of future
behaviour (Whyte 1999; Godin, Conner et al. 2007; Schlumpf, Glynn et al. 2008). Negative
experiences at the previous donation and feeling unwell after giving blood have been linked
with non-return (Schlumpf, Glynn et al. 2008), as has not having a convenient place to
donate (Schreiber, Schlumpf et al. 2006)(Schlumpf, Glynn et al. 2008). Finally, some
demographic characteristics have been associated with future behaviour, with several
studies having identified older donors as those most likely to give again (Ownby, Kong et
al. 1999; Whyte 1999; Germain, Glynn et al. 2007; Godin, Conner et al. 2007), while some,
though not all, demonstrated a link between future donation and a higher level of education
(Ownby, Kong et al. 1999). A number of the above factors may be inter-linked.
19
An older US study investigated characteristics differentiating high frequency, long-term
donors from lower frequency or newer donors, and found relatively few differences
between the groups. While the “multi-gallon” donors were more likely to be white, male,
have graduated college, and to participate in other pro-social activities, contrary to
expectations, they were no more likely to have friends or family donating, know a blood
recipient, make efforts to maintain good health, be given time off work to donate, feel a
moral obligation, receive more recognition for donating, or report fewer bad experiences.
Unfortunately the study potentially suffers from bias due to the low response rate of the
comparison donor population (21% compared to 57% for the multi-gallon population)
(Royse and Doochin 1995).
In the last decade researchers have increasingly begun to question long-held assumptions
about blood donor motivation. For example, a Canadian study found that positive attitudes
towards blood donation are shared by donors and non-donors alike, while negative
perceptions of donation (such as physical risk) were the factors that differed between the
two groups (Hupfer, Taylor et al. 2005). Taking an institutional perspective, Healy
demonstrated that differences in the prevalence and intensity of blood donation in different
European countries could be explained largely by the way collection services were offered
to the population, rather than any fundamental difference in levels of altruism (Healy 2000).
In a similar vein, Steele and colleagues showed that characteristics commonly believed to
motivate blood donors, such as altruism, social responsibility, and empathy, barely differed
between populations of current donors and people who no longer gave blood (Steele,
Schreiber et al. 2008).
Few studies have attempted to describe the diversity of motivations amongst the blood
donor population. One exception is a Spanish study that showed that rather than any one
“type” of donor, three discourses of blood donation could be seen: firstly, “typical”, in
which donation is motivated by self-esteem, social recognition and perceived need;
secondly “rational”, in which donation is motivated by general and personal norms and
social responsibility; and thirdly “evolving”, in which donation is dependent on the
continual convenience of donating. These three discourses were associated with different
levels of commitment to donating blood (Belda Suarez, Fernandez-Montoya et al. 2004).
The implications are clear: while some donors are motivated by factors traditionally
believed to drive donation behaviour, others are reliant on the continued convenience of the

20
activity, and therefore their commitment is vulnerable to changes in collection practices or
their own circumstances.
Although there is a considerable amount of literature describing the motivations and socio-
demographic characteristics of the donor population, few studies provide evidence-based
approaches to increasing donor retention. It has been suggested that collection services do
not adequately cater to the needs of many would-be donors (Robinson 1999), as evidenced
by reports that many non-donors and former donors believe that giving blood is too
inconvenient (Kolins and Herron 2003; Schreiber, Schlumpf et al. 2006; Schlumpf, Glynn
et al. 2008), but there is no literature on which changes to collection services are the most
effective in increasing retention. In an effort to address the lack of evidence-based retention
strategies, a small number of groups have utilised randomised controlled trials (RCT) to
assess the success of different approaches to retaining donors. Three of these studies are
described below.
The first study, conducted in the US, tested the effectiveness of eight separate recruitment
strategies on return within six months of initial donation (n=1500 per arm), for a group who
gave blood for the first time after the events of September the 11th, 2001. The possible
combinations were an incentive (a t-shirt) as opposed to no incentive, two different
recruitment message scripts, and either email or telephone recruitment. The researchers
found that use of the incentive had no effect on return rates, email was less effective than
telephone recruitment, and that donors who were given a message appealing to empathy
(being told about a liver transplant patient who needed blood) were more likely to return
than donors who were given a message appealing to self-esteem (a complimentary message
and mention of their blood type) (Reich, Roberts et al. 2006).
A second study, conducted in NZ, used an RCT to investigate the effect of messages
designed to increase self-efficacy. The researchers tested whether a group of lower
frequency donors could be encouraged to return more often if they were sent letters with
personalised information about the rarity of their blood group rather than the standard letter.
The group found that the experimental group was significantly more likely to return (23%
return) within a four week follow-up period than the control group (13% return) (Chamla,
Leland et al. 2006).
Most recently, a group investigated the effect of offering free cholesterol screening on
future donation in a Swiss population (Goette, Stutzer et al. 2009). Groups of non-donors

21
and current donors were contacted by mail with a flier containing either a message
appealing for them to give blood (control group), or an identical message as well as an offer
of free cholesterol testing when they attended the collection site (the experimental groups).
Amongst both non-donors and current donors, those offered free cholesterol testing were no
more likely to attend to give blood.
2.3.3 The process of becoming a committed donor
There is considerable evidence that the attitudes and motivations of blood donors evolve
over time. In a cross-sectional study, Piliavin and Callero (1991) found that as donation
experience increased, donors felt less nervous and had more positive feelings prior to
donation, less anxiety during donation, and more positive assessments of donor centre staff.
Furthermore, donors were more likely to rate themselves as “someone for whom donating
is easy”, be internally motivated to continue, and see donation as “very important” as their
level of experience increased. Due to the cross-sectional study design, it is unclear from this
study whether changes really do occur throughout the donor “career”, or whether those
experiencing more difficulties stop donating, leaving only those with more positive
attitudes and experiences (Piliavin and Callero 1991). A longitudinal study by the same
researchers sheds more light on the process of committing to blood donation. The study
found that between the first and second donation, donors improved their physiological
indicators (a decreased pre-donation pulse and systolic blood pressure) and subjective
ratings of pre-donation nervousness, and increased their rating of the importance of blood
donation (Piliavin and Callero 1991). Furthermore, a Spanish longitudinal study
demonstrated that over time donors reported a diminishing need for reward and recognition,
decreasing fears about donation, and increasing feelings of duty and solidarity (Fernandez-
Montoya, Lopez-Berrio et al. 1998).
Changes in donor motivation may be due to the development of a “blood donor” role
identity, and studies have found that the presence of the identity has a small but significant
influence on donation frequency independent of other factors predicting return (Callero and
Piliavin 1983; Charng, Piliavin et al. 1988; Piliavin and Callero 1991; Giles and Cairns
1995). The exact number of donations required to form the identity is unclear, with one
study suggesting it occurs after approximately three donations (Piliavin and Callero 1991),
and another suggesting the fifth donation was the crucial point (Ferguson and Bibby 2002).

22
Furthermore, there is evidence that habit plays a crucial role in donation behaviour
(Bagozzi 1981; Charng, Piliavin et al. 1988; Piliavin and Callero 1991; Godin, Conner et al.
2007). Habits are actions that, performed without conscious thought, develop after repeated
successful behaviour (Ronis, Yates et al. 1989). Piliavin and Callero show that the
relationship between previous donation behaviour and the decision to return in the future is
independent of the strength of role identity or any other variables (Piliavin and Callero
1991). The authors concluded that blood donation cannot be habitual in the true sense, as
successful performance requires too many logistical decisions to be “mindless”, instead,
over time, continued donation becomes less determined by self-conscious factors. The habit
of regular donation becomes a form of behavioural inertia that influences future donation
independently of attitudes and intentions. Several studies suggest this occurs after five
donations (Charng, Piliavin et al. 1988; Ferguson and Bibby 2002).
Not all changes to blood donor motivation benefit the blood supply. UK researchers found
that amongst a sub-group of the most experienced donors, high frequency of previous
donations was associated with decreased donor return, although the reason for this was
unclear. The authors suggested that some long-term donors perceived they had “done their
bit” (Ferguson and Bibby 2002).
2.3.4 Ceasing donation: Why do donors “lapse”?
Important lessons on donor management may be learned by investigating why former, or
“lapsed” donors, ceased to give blood. There has been surprisingly little work published in
this area (O'Brien 2006).
It is likely that the very process of donating blood turns donors away. Lapsed donors report
they stopped donating due to lack of a convenient location, ill-timed opening hours, poor
staff treatment, and long waiting times (Ferguson, Skikne et al. 1992; Schreiber, Schlumpf
et al. 2006). Germain and colleagues report that being dissatisfied with the most recent
donation experience was a predictor of a lapsed status (Germain, Glynn et al. 2007). There
may also be aspects of the pre-donation process that donors find unpleasant. Prior to giving
blood in Australia, donors must answer a lengthy questionnaire containing confronting
personal questions and undergo pre-donation screening (a finger-prick to measure Hb
concentration, and a blood pressure reading), more than likely encountering a wait before
each step.
23
Surprisingly, blood donor research rarely focuses on what donation is like from the donor’s
perspective. One exception is a Swedish study, in which repeat donors were asked to
describe whether donation had any effect on them personally. Twenty nine percent of
donors reported exclusively positive effects (such as feelings of satisfaction and increasing
wellbeing), some donors felt both positive and negative effects (6%), and a further 19%
reported only negative effects (such as dizziness or fatigue) (Nilsson-Sojka and Sojka
2003). Quebec researchers recently published a paper outlining their three-arm plan to
improve the blood-donor experience: the physical blood donation environment; streamlined
processes (such as waiting times); and the improving the quality of the relationship between
the donor and the blood service, particularly communications and interactions (Daigneault
and Blais 2004). The group has not yet published findings about whether these changes
translate to improved donor retention.
Physical reactions to donation are one of the few areas that has been considered from the
donor’s perspective. Adverse donation events, such as fainting, arm injuries (haematoma,
bruising), and fatigue after donation are likely to contribute to an unsatisfactory experience,
and are surprisingly common, with one study finding 36% of donors reported an adverse
event during or immediately following a donation (Newman, Pichette et al. 2003).
Blood services would do well to try to minimise donor reactions. Cable and colleagues
found that donors who had a syncopal reaction (such as fainting or dizziness) were far less
likely to return to donate within a four year period than donors without a reaction, with
26% and 62% return rates respectively (Cable 1999). Amongst donors who had a reaction
(n=1052), those with higher subjectively rated physiological reactions were found to be less
likely to return over a twelve month follow-up period (France, France et al. 2004).
Furthermore, witnessing another donor faint is associated with a lower likelihood of return,
even for those with no reactions themselves (Ferguson and Bibby 2002).
Some research suggests that phlebotomists’ interpersonal skills impacts on the likelihood of
a reaction (Stewart, France et al. 2006). Furthermore, with careful and compassionate
management, adverse reactions need not reduce return rates. A UK study found that blood
donors who experienced bruising during or after donation could be encouraged to return at
the same rate as donors who did not bruise (Ranasinghe and Harrison 2000).
Sociodemographic characteristics do not consistently predict the likelihood of becoming a
lapsed donor. For example, being older was found to be protective against non-return in
24
repeat donors (but not first time donors) in one US study (Germain, Glynn et al. 2007), first
time donors in a second US study (Schreiber, Sharma et al. 2005), and in all donors in an
Australian study (Whyte 1999). Similarly, level of education was found to be associated
with non-return in one US study (Germain, Glynn et al. 2007) but associated with high
return frequency in another (Schreiber, Sharma et al. 2005).
A qualitative exploration into the reasons people have never donated, or ceased giving
blood, in a US population, found that both lapsed and non-donors said that they were put
off donating due to fear (of needles, contracting a disease, finding out about disease status),
and the inconvenient locations and opening times for donation. Most people said that they
would donate if they believed there was a genuine need and it was easy to do. There were
several lapsed donors who incorrectly thought they were permanently deferred due to low
Hb or hematocrit, and participants displayed a lack of understanding of the need for blood,
claiming they had not heard of shortages, and were concerned about wastage. Surprisingly,
lapsed donors ranked blood donation as less important on a list of pro-social activities than
non-donors (Mathew, King et al. 2007).
One of the biggest impacts on donor return is a temporary deferral, often resulting from
medical ineligibility. The next section will review the literature examining the return rates
of temporarily deferred blood donors.
2.4 The impact of temporary deferral on donor return Several studies, all conducted in the US, have shown that donors are less likely to return to
donate following a temporary deferral (Jobuck, Lau et al. 1980; Noonan, Menitove et al.
1981; Piliavin 1987; Halperin, Baetens et al. 1998; Custer, Chinn et al. 2007). The effect is
particularly pronounced amongst those deferred at their first donation attempt (Piliavin
1987). This next section summaries the literature in this area.
In the earliest and smallest study, Jobuck et al. (1980) found that only a low proportion of
temporarily deferred donors returned without encouragement (10% of new donors and
around 30% of repeat donors). However, with telephone solicitation, the proportion
returning was increased to nearly 50%. First-time female donors were least likely to return
after solicitation (Jobuck, Lau et al. 1980).
Noonan et al. (1981) followed the return rates of temporarily deferred blood donors
(n=772) and found just 3. 5% of donors returned to donate, and not one donor deferred at

25
their first donation (n=64) returned (Noonan, Menitove et al. 1981). However, the follow-
up period was not specified.
In a large study undertaken in the mid 1980s, Piliavin examined the return rates of
temporarily deferred donors (n=1247) (Piliavin 1987). The study reported that around 71%
of experienced donors returned within six months, compared with 27% of those deferred at
their first appointment (Piliavin 1987). There was a statistically different return rate
between those deferred at their first attendance and those who were able to successfully
give at their first attendance (2.8% vs. 27.3% respectively), but no difference in return was
seen amongst repeat donors. In another publication Piliavin summarizes the results of
studies of return rates amongst five different donor populations (ranging from college
campus donors to older adults), and reports that temporary deferral reduces return by 17-
28% (Piliavin and Callero 1991).
More recently, Halperin and colleagues undertook a four year follow-up of temporarily
deferred donors (including n=1273 low haemoglobin donors), finding that after four years
70% of donors deferred for low Hb had returned, compared to 81% of non-deferred donors
(Halperin, Baetens et al. 1998). Over the period of the study, donors who had been
temporarily deferred for any reason donated less blood per donor per year than donors who
had not been temporarily deferred (1.03 donations p.a. vs. 1.45 donations p.a.). First time
and repeat donors could not be differentiated in this analysis.
Custer and colleagues (2007) followed the donation patterns of temporarily deferred donors
over a five year period (including n=1828 repeat and n=1244 first time low
haemoglobin/hematocrit (Hct) donors). Repeat donors did not demonstrate any reduction
in the likelihood of return, with similar proportions of low Hb/ Hct deferred and non-
deferred returning within the five year period (85% vs 86% respectively), however survival
analysis showed that return was slower amongst deferred repeat donors. Amongst first time
donors, 29% of those deferred for low Hb or Hct returned within five years, compared to
47% of those who were not deferred, and return was also found to be slower. The
difference in return amongst first time donors was attributed to the fact that those deferred
at their first appointment were not contacted by the blood service for a subsequent
appointment, whereas repeat deferred donors were.
Deferral was also shown to impact on donation frequency. Amongst donors who returned,
donors temporarily deferred for any reason gave less blood than non-deferred donors. First

26
time donors gave 0.52 donations p.a. if they were deferred and 0.68 donations p.a. if not
deferred, while repeat donors gave 1.49 donations p.a. if deferred and 1.83 donations p.a. if
not deferred. The researchers also found that rates of subsequent deferral were high
amongst all donors, with 19% of first time and 11% of repeat donors experiencing a
temporary deferral for any reason within the five year follow up, with around half of the
deferrals due to low Hb/ Hct concentration. When considering temporary deferral for all
causes, multivariate analysis showed that donors who were older, white, and more highly
educated were more likely to return. Gender had a varying influence on return rates, with
females returning more often than males amongst first time donors, and males more often
than females amongst repeat donors (Custer, Chinn et al. 2007).
While not specifically investigating the impact of temporary deferral on return rates,
Germain and colleagues did not find any association between temporary deferral and a
lapsed donor status, after adjusting for motivation to donate and demographic factors
(Germain, Glynn et al. 2007). They concluded that short-term deferral does not exert an
independent effect on the likelihood of a donor becoming lapsed, but rather works in
conjunction with other factors. However, the authors did recognise donors may not have
recalled short-term deferrals accurately.
One study found that temporary deferral may actually increase return rates. Katz and
colleagues studied the impact of 12 twelve month deferral due to either travel or residence
in malarial endemic country (n=156). The group tracked donations for twelve months prior
to, and following deferral. Contrary to other studies, they found return rates were the same
in both deferred and non-deferred donors (68% in both groups), and deferred first time
donors returned at twice the rate (51.5%) of non-deferred donors called for the first time.
Donation frequencies were found to be quite high in this study: 2.35 donations p.a. in the
follow-up year for first-time donors, and 2.83 donations p.a. for repeat donors, which was
an increase from 2.12 donations p.a. in the year before deferral. In contrast, the non-
deferred group (as a whole) gave 1.97 donations p.a. (Katz and Kabat 2007).
Each of these studies has limitations. All studies were undertaken in the US donor
populations, where donor acceptance criteria and deferral procedures are known to differ
from those used in Australia. For example, Custer et al’s study examined donor return in a
blood service with very different donation and deferral policies. Donors deferred at their
first attendance were not followed up by the blood service for a subsequent donation
appointment attempt (all registered donors are followed up in Australia), low Hb/Hct

27
donors were deferred for just one day (as opposed to the six month deferral period in
Australia), and the minimum gap between whole blood donations was only eight weeks (vs.
twelve weeks in Australia).
The first two studies are over 25 years old, and are only published as abstracts, so limited
detail is known about the study design and potential biases that may have arisen (Jobuck,
Lau et al. 1980; Noonan, Menitove et al. 1981). The Piliavin study is 20 years old, and may
suffer from self-selection bias, as the participants had previously participated in a survey,
and it might be expected that donors who return surveys also donate more frequently.
Furthermore, a very small number of first-time donors were studied, and donor return was
only tracked for six months. The Halperin et al. study was not able to differentiate whether
donors were deferred at their first or subsequent donation, and so the authors were unable to
compare differences in return between deferred first-time and experienced donors. Both of
these studies did not define the deferral period that applied to the temporarily deferred
donors, nor the deferral process or re-recruitment strategies. Finally, Katz’s study did not
take into account any socio-demographic differences between the groups that may have
impacted on the likelihood of return.
2.4.1 Why are deferred donors less likely to return?
While no studies have identified the mechanisms by which temporary deferral has an
impact on donation patterns, researchers have proposed several possibilities. Medical
ineligibility, real or imagined, may result in self-deferral (Piliavin and Callero 1991), and it
is possible that some donors misinterpret their temporary deferral as being permanent
(Mathew, King et al. 2007). Donors who originally attended under the influence of social
pressure may consider themselves to be let “off the hook”, and those with altruistic
motivations are likely to feel rejected and disappointed (Piliavin 1987). Donors may be
annoyed at having their time wasted (Halperin, Baetens et al. 1998). Being deferred
potentially impacts on the donor identity, particularly in the sense of whether the individual
feels donation is something they can personally do (Piliavin and Callero 1991). Deferred
donors are more likely to say that donation is difficult, and report bad feelings after their
experience than non-deferred donors (Piliavin and Callero 1991).
Deferral at one’s first attempt has a particularly negative impact on the likelihood of return.
Becker’s Model of Commitment to a Deviant Career was used to explain commitment to
blood donation by Piliavin and Callero (Piliavin and Callero 1991). This theory suggests
28
that commitment to an uncommon and potentially problematic behaviour is reliant on a
positive, successful encounter at the first experience. Deferral is unlikely to be construed as
a successful encounter. Furthermore, a deferral of six months, which applies to Australian
donors deferred due to low Hb, would constrain the number of donations able to be made
within twelve months of the first attempt, a crucial time period in determining the
likelihood of becoming a committed donor (Schreiber, Sharma et al. 2005).
The increased likelihood of non-return following a temporary deferral may also be
attributed to the breaking of habit. Habitual behaviours are maintained in stable
circumstances, however they may return to more conscious control in the face of a novel
situation or new problems (Ronis, Yates et al. 1989). For example, a research group found
that students transferring to a new university maintained their newspaper reading, television
watching, and exercise habits only if the context of the habitual behaviour was maintained,
for example, reading the newspaper with others (Wood, Tam et al. 2005). Furthermore, the
study reported that if old habits could not be supported in a similar environment, such as
exercising at a gym, the behaviour was more likely to be predicted by intentions. In the
context of blood donation, a low Hb deferral may represent a disruption of the habit of
regular donation, with the decision to return correspondingly requiring more conscious
effort. This might be problematic if a donor is left believing their low Hb concentration
reduces their suitability to give blood, or is upset by their deferral and wishes to avoid
another occurrence.
It is possible that the way donors are told about their deferral contributes to negative
feelings about the experience. Research into the responses of permanently deferred donors
shows that donors are confused and upset by the messages they are given by blood services
regarding their deferral (Kleinman, Wang et al. 2004; Whittaker, Carter et al. 2008).
Qualitative research has explored the responses of Canadian donors who had been
permanently deferred due to “false-reactive” laboratory test results, and found that the
experience was highly distressing. Donors described feelings of shock, fear, rejection, loss,
and a sense that they were being punished for something that they had not done. Donors
could not understand the rationale for the permanent deferral and did not understand the
explanation of the testing. Despite their negative experience, most donors said they would
return to give blood if they were allowed to do so (Whittaker, Carter et al. 2008).
A quantitative survey of US blood donors (n=1728) who had been permanently deferred
from blood donation found that the notification was difficult to understand for most donors,

29
and while three quarters of donors had questions after reading the notification, only one
quarter contacted the blood service for more information (Kleinman, Wang et al. 2004). Of
more concern, a substantial proportion of donors did not recognise they were permanently
deferred: 9% reported they were temporarily deferred, 9% were unsure of their deferral
status, 6% believed that a part of their donation could be utilised, and 2% believed that they
were not deferred (Kleinman, Wang et al. 2004).
Studies into the effects of notification of test results in other populations also indicate the
possible impact that temporary deferral could have on low Hb blood donors. Psychological
responses of individuals receiving blood test reports appear to vary considerably, even for
serious conditions. For example, people notified that they were carriers for cystic fibrosis
experienced high levels of anxiety (Bekker, Denniss et al. 1994) but in another group
notified of results of a genetic test for haemochromatosis there was no effect on
psychological status (Power and Adams 2001).
In summary, temporary deferral has been shown to negatively impact on donation patterns
in both first time and repeat donors in most studies (Jobuck, Lau et al. 1980; Noonan,
Menitove et al. 1981; Piliavin and Callero 1991; Halperin, Baetens et al. 1998; Custer,
Chinn et al. 2007), and only in new donors in one study (Piliavin 1987). However two
studies have found either a negligible impact or increased return following temporary
deferral, though these studies did not specifically investigate deferral due to low Hb
(Germain, Glynn et al. 2007; Katz and Kabat 2007). Two research groups were able to
isolate donors deferred due to low Hb from those deferred due to other types of deferral
(Halperin, Baetens et al. 1998; Custer, Chinn et al. 2007). Previous research in the area has
been undertaken in the US, where there are substantial differences in blood collection
practices and deferral procedures, and most studies have limitations either in their design or
reporting methods. Several possible explanations for the impact of deferral on donation
patterns have been suggested; however the processes by which deferral reduces the
likelihood of future return remain unclear.
2.4.2 Increasing the likelihood of return after deferral
A range of re-activation strategies has been shown to increase return following deferral
(Jobuck, Lau et al. 1980; Walz, McMullen et al. 1985; Piliavin 1987; Halperin, Baetens et
al. 1998). Walz and colleagues found that donors who were contacted a day or two after
their deferral for low hematocrit were more likely to attend a subsequent scheduled
30
donation appointment than all scheduled (predominantly non-deferred) donors (59.6% vs
46.6% respectively) (Walz, McMullen et al. 1985). Similar findings were reported by
Piliavin and Callero, who found that deferred donors who were contacted with personal
solicitation messages soon after their deferral were more likely to return when eligible
(Piliavin and Callero 1991). Even after a six month wait, Jobuck and colleagues were able
to encourage 35% of donors to return to donate with telephone prompts (Jobuck, Lau et al.
1980).
Improving the donor’s experience of deferral is another possible way to increase return.
Piliavin concludes that the ideal deferral event incorporates:
“personal attention, professional treatment, concern for privacy, and warm and
friendly interactions. Donors want their question answers and their fears allayed,
yet they do not want to waste time” (Piliavin and Callero 1991 p 220)
It is not clear whether the information provided during the deferral procedure has an impact
on the likelihood of return. One study found that deferred donors given information
brochures at their deferral appointment did not return at increased rates compared to those
who were not given brochures (Gimble, Kline et al. 1994).
It has been suggested that deferral due to a low haemoglobin level could be largely avoided
through iron supplementation (Brittenham, Gordeuk et al. 1996). Studies of female blood
donors show that short-term iron supplementation can restore iron stores and correct iron
deficiency anaemia (Gordeuk, Brittenham et al. 1987; Gordeuk, Brittenham et al. 1990)
(Garry, Koehler et al. 1995), and lead to an increase in the number of donations given per
annum (Brittenham, Gordeuk et al. 1996). Supplementation for iron donors may be the only
way this subpopulation can rebuild inadequate iron stores, particularly given it is difficult
for iron deficient pre-menopausal women to restore depleted iron levels through diet alone,
even with tailored, one-to-one encouragement and education (Heath, Skeaff et al. 2001).
However, there are some reservations about large-scale provision of iron supplements to
blood donors without physician supervision. Supplementation has the potential to mask
underlying pathological conditions, such as haemochromatosis or gastrointestinal blood
loss, that may be indicated by low Hb levels, and also presents a poison risk to young
children if consumed in large quantities (Simon 2002). Iron supplements may interact with
medication or diseases (such as GI tract ulcers), increase the formation of atherosclerosis,
and cause allergic reactions (Newman 2004). Routine supplementation can be expensive

31
(Newman 2004). Furthermore, it is not known how donors feel about being made iron
deficient as a result of donation, or their attitudes towards taking iron supplements to enable
them to continue giving blood (Nemo, Harvath et al. 2001).
Carbonyl iron is a safe, non-toxic form of iron that is readily absorbed and unlikely to cause
poisoning if swallowed in large doses by children, and use of this form of iron supplement
could overcome many of the recognised issues involved in supplementing blood donors
(Brittenham, Klein et al. 2001).
While blood services do not traditionally have a health-care provider role in the community
(Simon 2002), donors appear to be receptive to health information and services that lie
outside the traditional domain of blood services. Hypertensive donors at the New York
blood centre have been offered counselling and referred to a local hospital (Davey 2004).
Blood centres have publicised colorectal cancer screening (Hart, Jestico et al. 1996), and
some blood services (not including the Australian Red Cross Blood Service) offer free
cholesterol screening (Blood Centres of the Pacific 2007).
2.5 Theoretical perspectives While several studies have investigated the relationship between temporary deferral and
return, no research has specifically explored the reasons why deferral has such a negative
impact on return, and only one study (Piliavin and Callero 1991) has utilised theory to
guide its research. Theoretical perspectives that had previously been utilised in research
into blood donation behaviour, as well as the wider literature of pro-social behaviours, were
reviewed, and based on this review three theories were chosen to guide the research
described in this thesis.
“Role Identity” theory, the “Theory of the Spurned Philanthropist”, and the “Theory of
Planned Behaviour” were chosen as frameworks to understand return after a temporary
deferral. The theories were selected as they each offered a possible explanation as to why
deferral for a low Hb concentration impacts so strongly on the likelihood of return. Aspects
of the theories were used when developing the surveys and interview guides, and when
interpreting the findings of the studies described in this thesis. The aim was not to validate
a particular model as the process through which deferral impacts on donation patterns, but
to create a working account of what may be occurring and how the ARCBS could respond.
32
The first theory, “Role Identity”, has its origins in symbolic interactionism, and has been
used extensively in donor motivation research to explain the process of becoming a
committed donor. Alternative conceptualisations of role identity were also considered. The
second theory, the “Theory of the Spurned Philanthropist”, which is taken from the
psychological literature, has previously been applied to research into the coping practices of
professionals in service occupations when their offer of help is rejected. The “Theory of
Planned Behaviour” incorporates a measure of “perceived behavioural control”. Each
theory is explained in more detail below.
2.5.1 Theoretical understandings of role identity, and implications for volunteer behaviour in contemporary Australia
2.5.1.1 Role identity theories
Role identity theory has been widely used to explain the process of committing to blood
donation (Callero 1985; Piliavin 1987; Lee 1999). Research into the “blood donor” role
identity has been primarily influenced by the identity theory developed by Stryker, and later
Burke (Sets and Burke 2003), which proposes that individuals have many identities, each
relating to a specific role behaviour. The role identities are organised by a hierarchy of
salience, and the more salient a particular role identity, the more likely role-specific
behaviours will be enacted in a given situation (Reed 2002).
The salience of an identity is seen to be influenced by the degree of commitment to an
identity, which is conceptualised as the number of people to whom the individual is tied to
through the behaviour. This conceptualisation has been shown to be relevant to blood
donation, with research showing that the greater the number of people an individual knows
through blood donation, the more donations they give (Callero 1985). The number of
people an individual knows through donation is unlikely to change as a result of deferral,
but, because role identities are thought to be reinforced through behaviour, a six month
break from being able to enact the behaviour may reduce the salience of the role identity
(Burke and Reitzes 1981), and therefore its likelihood of future enactment.
Other aspects of Stryker’s role identity theory may explain, in part, why donors are less
likely to return after a deferral. He posits that identities that repeatedly cause negative
feelings are less likely to be acted out and the identity moved down in the salience
hierarchy. One explanation for this is that not successfully carrying out a role generates
negative feelings because others are not verifying "one's identity claims", with stronger

33
reactions in those with the strongest identities (Sets and Burke 2003). Emotional responses
are thought to lessen with repeated affronts to the identity (Sets and Burke 2003),
suggesting those who had been deferred on previous occasions might have a smaller
negative reaction.
Other role identity theorists, rarely utilised in the blood donor literature, have alternative
conceptualisations of role identity that may provide a better fit in the context of return after
a temporary deferral. McCall and Simmons propose that individuals have a role identity for
each social position they occupy or even wish to occupy. Successful role-performance, and
the recognition of performance by others, is crucial in legitimising role-identities. They
suggest that the salience of a role identity (and therefore its likelihood of being enacted in a
given situation) is influenced by four factors: its prominence (made up of the level of
support from others, perceived success of performance, the level of commitment and
investment in the identity, and the rewards offered by the identity); the need for external
support and recognition of the identity; the need for the intrinsic and extrinsic rewards
offered by enacting the identity; and the perceived opportunity for successful, “profitable”,
enactment (McCall and Simmons 1978).
Giddens wrote about the way in which individuals create their self-identity in the current
historical period of “late modernity”. Late modernity is characterised by loosening of
traditions, diminishing levels of trust in traditional institutions, and an increasingly
sceptical and risk aware public. This era has opened up a wide range of options for people
to construct their “life narrative” of who they want to be. This self becomes a reflexive
project, reliant on sustained, though revisable, biographical narratives. Decisions about
every-day life are “not only about how to act but who to be” (Giddens 1991).
This perspective suggests individuals engage or disengage in behaviours that enhance or
diminish their ideal perceptions of self. This perspective is helpful in explaining part of the
motivation to give blood. Participation in the activity enables membership of the social
identity of being a “blood donor”. A social identity is defined as “an actuated perspective
or frame of reference that a consumer possesses as part of the repertoire of who they are or
what they want to appear to be” (Reed 2002 p255). Once an identity has been incorporated
into self-perceptions, it becomes a driving force for maintaining the corresponding
repertoire of behaviours.

34
The biographical narratives shaping self-identity are fragile, and rely on maintenance of a
particular behaviour. Giddens writes:
“A person’s identity is not to be found in behaviour, nor- important though this is -
in the reactions of others, but in the capacity to keep a particular narrative going.
The individual’s biography…cannot be wholly fictive” (Giddens 1991 p54)
Giddens suggests that while individuals are faced with a plurality of choices from which to
build their self-identity, their choices are influenced by other patterns of behaviour, with the
engagement of some options increasing or reducing the likelihood of engaging with others,
depending on the relationship with the first. Drawing on Giddens’ thesis, Alessandrini
interpreted research finding blood donors had higher levels of physical activity than non-
donors as an indication that those perceiving themselves as approaching a state of good
health and fitness see giving blood as an appropriate expression of this self-perception. In
turn, blood donation is “a public demonstration and institutional recognition of wellness”
(Alessandrini 2006 p130).
2.5.1.2 Building identity in the period of late modernity
Australia has been in the midst of economic reform for over two decades, and this has
shifted the distribution of income, power and resources, particularly for the “middle
classes”, with implications for patterns of volunteering in this group (Pusey 2000). Higher
participation in tertiary education has delayed the entry into full-time work by an average of
five years and has placed increased financial and time pressures on individuals in the
middle-span of their working lives, particularly on those with children. Consequently,
engaging in voluntary activities is unlikely to be a priority for these individuals.
Furthermore, the increasingly “flexible” nature of work, characterised by a growing
proportion of casual or part-time jobs and unpredictable working hours, limits the
opportunity for civic and social time (Pusey 2000).
Wider social transformations, such as the rise of individualism, have influenced the social
context within which volunteering is performed. Increasing work pressures and
unpredictable life courses have attracted people to sporadic and spontaneous forms of
helping over long-term memberships and strong identification with organisations.
Individuals often choose activities that allow easy withdrawal from participation, and are
more likely to engage as individuals (such as in making ethical purchasing decisions),
35
rather than in groups (such as attending council meetings) (Hustinx and Lammertyn 2003;
Stolle and Hooghe 2004). The implications are clear: in order to attract and keep
volunteers, organisations need to offer roles that are relevant, able to fit into busy lives, and
require minimal or flexible commitment.
This same social context has been recognised in relation to blood donation. In 1999
prominent members of the international blood service community met to discuss altruism
and blood donation in the late 20th century (Robinson 1999). The first speaker, Dr Robert
Beal, noted that society had changed substantially since voluntary services began collecting
blood. Though people continued to look favourably upon the act of donation, they lead
increasingly busy lives with diminishing levels of free time, which no longer allows them
to fit in with traditional collection systems. Correspondingly, inconvenience is increasingly
recognised as a barrier to giving blood (Robinson 1999; Schreiber, Schlumpf et al. 2006;
Mathew, King et al. 2007).
When following a social identity perspective, it can be seen that individuals may commence
blood donation, in part, because they recognise the way blood donors are perceived in the
community, and wish to incorporate those perspectives into their self-perceptions. Piliavin
and Callero found that new and experienced blood donors described the characteristics of
“a regular blood donor” in much the same way, perceiving them to have highly positive
traits such as being caring, considerate, kind, altruistic and helpful (Piliavin and Callero
1991). A recent Australian study found that both donors and non-donors described those
who gave blood in moral and emotional terms, viewing blood donors as more
“compassionate” and “generous” than the average person. The author found that those
excluded from this identity due to failing to meet donation criteria, such as intravenous
drug users, experienced negative emotional responses to their ineligibility (Valentine 2005).
In summary, in the current historical period individuals are better placed to take up
altruistic activities that are convenient and require minimal levels of commitment. Blood
donation fulfils these criteria, at least until successful donation patterns are disrupted. While
self-identity can be a driving force for continuing a given behaviour, identity is fluid,
dependent on successful performance and stable circumstances. McCall and Simmons’
theory suggests that the salience of the blood donor role identity depends on the opportunity
for donation, whether return will be “profitable” (i.e. successful), and takes into account the
intrinsic and extrinsic rewards associated with the behaviour - essentially, an informal cost-
benefit analysis of the opportunity for profitable return.

36
2.5.2 The theory of the spurned philanthropist: What happens when a donor’s offer of assistance is rejected?
Marcel Mauss wrote that, traditionally, offers of gifts were not “free”, but rather had moral,
economic, religious, or social meanings, and that would-be recipients were obliged to
accept the offer of the gift (Mauss 1970). Blood donation has been conceptualised by one
writer as a free gift to an unknown stranger (Titmuss 1997), but it is unclear how donors
respond when the offer of their gift is declined.
There is a surprising paucity of data on the effects of rejection on a would-be helper, with
only one research group having conducted research into this area. The group, led by Sidney
Rosen, first published a paper in 1986 introducing the concept of “The Spurned
Philanthropist”. They theorised that when help is offered by someone with altruistic
motivations, and that help is turned down, the would-be helper experiences tension to the
degree that they expected that their help would be accepted (an “expectancy violation”).
This tension results in emotional, evaluative, cognitive, and behavioural changes for the
helper, which are mediated by personal and situational variables (Rosen, Mickler et al.
1986). Rejected helpers react with more negative emotions (“affect”), evaluate the recipient
in a more negative light, and desire less future contact with the rejecter. Rejected helpers
undergo cognitive reactions, such as saying that they did not expect their help to be
accepted anyway, and to having behavioural reactions that vary from attempting to
overcome the rejection through to reducing the offer of help in other capacities (Rosen,
Mickler et al. 1986; Rosen, Mickler et al. 1987).
The proposed reason for an expectancy violation causing such a strong reaction is that
rejection impacts on the identity of the helper, influencing their self-efficacy. There are two
types of moderating factors to this process: personal factors and situational factors.
Personal factors include self-perceptions and personal skill level, and situational factors
include the nature of the help being offered, the pre-existing relationship between helper
and recipient, perceived attributes of the recipient, and the perceived importance of help to
the recipient.
The theory was validated in experimental situations exploring reactions to the rejection of
voluntarily offered tutoring assistance to university and school students (Cheuk and Rosen
1993; Cheuk and Rosen 1996). It was then used to develop a “spurning scale” that
measured the level of rejection experienced by workers in helping professions (Cheuk,
Wong et al. 2000; Cheuk, Wong et al. 2002; Cheuk, Wong et al. 2003).

37
2.5.2.1 Do deferred donors feel “spurned”?
The theory of the “spurned philanthropist” may be applicable to the situation of return after
a temporary deferral from giving blood. It is possible deferral could be perceived by the
donor as rejection of their offer of assistance, and that the ARCBS may be viewed as the
rejecter, as it is the organisation to which the offer of donation is made (on behalf of a
nameless, faceless recipient). The level of “expectancy violation”, and the corresponding
emotional, evaluative, cognitive, and behavioural changes, might be greater amongst those
who have never been deferred for low iron and have no history of anaemia. The recent
change in the acceptance threshold for haemoglobin concentration has resulted in the
deferral of blood donors who were previously acceptable, meaning a larger group of donors
is likely to experience an expectancy violation.
Furthermore, we would expect that committed blood donors are highly caring and capable
individuals, given their commitment to an activity that cannot be performed by a large
proportion of the population and that carries substantial personal costs to the helper. We
would also expect to see relatively strong expectancy violation related responses amongst
more experienced blood donors.
It is likely that this theory will not be a perfect explanation for the situation of the donor
deferred for a low Hb concentration. Many donors will understand the health implications
of their deferral and therefore may not see the deferral as an outright rejection. And it is
possible that some donors may respond behaviourally by making repeated attempts to
overcome “rejection”, thereby actually increasing their efforts to meet the eligibility criteria
and thus return to donate. They may also respond in the opposite way, by disengaging from
the blood service and therefore not returning, either out of fear of a subsequent rejection or
due to a combination of the negative cognitive and affective experiences resulting from the
last rejection. In addition, deferral may have important ramifications for self-image,
impacting on the development of donor identity in newer donors, and its maintenance in
experienced donors, thereby resulting in a lower likelihood of return once eligible in both
groups.
2.5.3 The Theory of Reasoned Action and the Theory of Planned Behaviour in predicting blood donation
The Theory of Reasoned Action (TRA) (Fishbein and Ajzen 1975), and the later extended
version, the Theory of Planned Behaviour (TPB), are models that have been used to explain

38
blood donation behaviour with varying success. Briefly, the TRA proposes that behaviour
under voluntary control is explained by an individual’s intention to perform the behaviour,
which is determined by two independent factors: beliefs about the outcome of performing
the behaviour (which form attitudes), and beliefs about whether other people think they
should perform the behaviour (which form the “subjective norm”) (Fishbein and Ajzen
1975). Later, recognising that stated intentions do not necessarily translate into action,
Ajzen proposed the TPB, which introduced a third dimension, perceived behavioural
control, as an independent predictor of whether or not behaviour is carried out (Ajzen
1985).
Several research groups have investigated the ability of the TRA and the TPB to predict
blood donation behaviour (Bagozzi 1981; Charng, Piliavin et al. 1988; Giles and Cairns
1995; Holdershaw, Gendall et al. 2003; Giles, McClenahan et al. 2004; France, France et al.
2007; Masser, White et al. 2009). A brief review of the research is given here, but it is by
no means exhaustive (for a full review see Masser, White et al. 2008).
The attitudes-behaviour relationship was investigated in a convenience sample of students
and staff (n= 157) in a US university. The researchers surveyed individuals’ attitudes and
intentions to give blood in the future, and then tracked donation behaviour at blood drives
one week later and four months later. While the study found support for TRA in predicting
donation at the blood drive the following week, it was found to be a poor predictor of
donation four months later. Furthermore, previous donation behaviour was a better
predictor of donation one week later than were attitudes towards giving blood. This
suggests that habit played an independent role in predicting return (Bagozzi 1981).
Giles and Cairns (1995) tested the predictive power of the TPB relative to the TRA in a
sample of young, mostly female UK college undergraduate students (n=141). The study
found that the TPB was superior to the TRA in predicting intention to donate blood at a
campus blood drive a week later, showing that the perceived behavioural control
component was an independent predictor of intention to donate. However, when it came to
predicting actual behaviour, the two theories performed similarly. A later study by this
research group concluded that “self-efficacy” was the most important predictor of intention
to give blood, which in turn was associated with actual return behaviour, though this study
suffered from low response rates when following up actual donation behaviour (Giles,
McClenahan et al. 2004).
39
Holdershaw and colleagues compared the predictive capabilities of the TPB against an
approach advocated by Labaw, which states that future behaviour is best predicted by
previous behaviour (Labaw 1980). Unfortunately this study was weakened by the use of a
convenience sample (n=100) at a university campus, of which only 40 were followed up.
Nevertheless the study identified that the TPB was better than Labaw’s proposal for
predicting behavioural intention, but when it came to predicting actual behaviour, the TPB
approach was inferior to the Labaw approach (R2=0.19 vs. R2=0.35 respectively)
(Holdershaw, Gendall et al. 2003).
In their analysis of the factors predicting intention amongst new donors to give blood,
France and colleagues found evidence that higher levels of satisfaction with the most recent
donation, and no history of fainting during donation, were associated with more positive
attitudes, and that more positive attitudes, together with higher ratings of subjective norms
and self-efficacy, were associated with stronger intentions to give blood (France, France et
al. 2007). This group did not look at donation behaviour. An Australian group built on this
work by analysing donation behaviour within three months of a survey. The group
expanded France’s work by showing that a stronger donor identity contributed to more
positive attitudes to donation, and that more positive attitudes, together with a higher level
of self-efficacy and anticipated regret at not giving in the future, predicted intention to
return. Out of the variables measured, only intention was directly associated with actual
donation behaviour (Masser, White et al. 2009).
Most of the research investigating psychosocial factors predicting blood donation behaviour
does not take into account demographic characteristics or differences in aspects of donation
history (such as recent frequency or length of history), making unclear the extent to which
habits or life stage play a role in either intention to give blood or actual donation behaviour.
Furthermore, the validity of the samples often suffers from bias that may be introduced by a
self-selected and/or convenience sample (for example, (Bagozzi 1981; France, France et al.
2004; Masser, White et al. 2009), and low response rates in the follow-up phase limits the
accuracy of assessing donation behaviour (Masser, White et al. 2009) (Holdershaw,
Gendall et al. 2003; Giles, McClenahan et al. 2004). Nevertheless, there is substantial
evidence that the TPB plays a role in explaining both intention to return, and actual return
behaviour.

40
2.5.3.1 Do attitudes, subjective norms, and perceived behavioural control change following deferral?
The research presented in this thesis utilised only selected aspects of the TPB,
predominantly in the qualitative phase of the project. The TPB states that an individual’s
intention to perform behaviour is reliant upon their attitudes towards the behaviour and
whether they think other people support them in acting in that particular way. It is possible
that negative feelings resulting from deferral diminish positive attitudes previously held
towards blood donation. Likewise, support of others towards the individual giving blood
may reduce following a deferral (particular that of medical practitioners). The expanded
TPB, which includes self-efficacy and role identity (France, France et al. 2007; Masser,
White et al. 2009), might explain non-return after deferral through the reduction in these
concepts: self-efficacy may reduce in line with the feelings of mastery over donation and
control over their health, and role identity with no opportunity for successful enactment.
Only limited aspects of the expanded TPB were incorporated into this research. This was a
deliberate strategy, based on an expectation that analysis of the attitudes and norms of
deferred donors would offer little opportunity for intervention, while analysis related to an
individual’s life stage, previous donation behaviour, and experience of the deferral event
may provide clear guidelines for how practices can be improved, and for determining which
donors could be targeted to enhance return. In contrast, it may be difficult to move donors
with negative attitudes towards having more positive attitudes, or to change perceived
social or personal norms about giving blood. Furthermore, there is substantial evidence that
interventions to improve attitudes do not necessarily lead to a behaviour change
(Verplanken and Wood 2006).
2.6 Summary This chapter reviewed the background literature and theoretical perspectives that framed the
research presented in subsequent chapters of the thesis.
It began by describing the rationale behind a low haemoglobin deferral, the public health
impact of iron deficiency, and the range of causes that might contribute to depleting iron
stores, including frequent blood donation. Next, the controversy around the best way to
screen blood donors for the condition was reviewed. It then examined the literature on
seeking further investigations after receiving screening test results, and reviewed research
into the incidence of underlying conditions in iron deficient populations.
41
Next, the chapter presented a review of older and more recent literature on the
characteristics and motivations of blood donors, noting the difficulty of attracting new
blood donors and encouraging return after the first donation. It examined the factors
associated with continuing to give blood, showing that organisational practices are
responsible for a proportion of non-returns, and that there is little evidence for the best way
to retain donors. Next, it described the literature on temporarily deferred blood donors, and
noted that although several studies have shown temporary deferral reduces the likelihood of
return, particularly amongst those deferred at their first attempt, none has specifically
explored why deferral has such a negative impact on future return. Finally, the chapter
introduced the three theoretical perspectives that were used to guide the methods, analysis,
and interpretation of the research presented in this thesis.
42
3 Overview of methods
3.1 Outline
The previous chapter reviewed the literature and introduced the theoretical frameworks
guiding the research described in this thesis. This chapter will provide an overview of the
aims and methods used in the four distinct research phases that make up the study. It also
includes a brief discussion of the strategies used to ensure research quality, the ethical
considerations of the project, and a summary of my background in order to acknowledge
how my assumptions and beliefs were located within the research.
3.2 Development of methods
Initially, this research was planned to be a cross-sectional survey twelve months after
deferral for a low haemoglobin concentration, investigating donors’ assessments of the
deferral experience, reactions to deferral, and the proportion seeking further investigations.
The survey data were then to be analysed against actual return data, to identify associations
predicting whether donors return within twelve months of being eligible to do so. However,
this approach was soon recognised to have several important limitations.
First, tracking the return patterns of only donors who participated in a survey led to the
possibility of selection bias, as the profile of survey respondents would not necessarily
match that of all deferred donors. Furthermore, the survey was planned to be carried out
twelve months after deferral, placing it six months into the period where donors were
eligible to return to donate, and there were concerns that the process of being surveyed
might trigger an increase in return, affecting the outcome of interest. In order to understand
the true impact of deferral on donation, it was clear that an audit of return rates needed to be
carried out in a group that had not been surveyed.
Second, a survey twelve months after deferral might lead to issues with the quality of
recall, particularly in donors’ perceptions of the deferral experience. A more immediate,
qualitative approach was required.
Finally, the survey was only able to gather limited data on treatment seeking behaviours
and experiences. A more detailed investigation into the range of investigations undertaken,
and nature of the advice given, was needed.

43
Therefore, a project that began as a purely quantitative piece of research evolved into a
multi-phased, mixed methods study. A mixed method approach was deemed necessary to
fully investigate the impact on donation patterns of being deferred due to a low Hb
concentration on donation patterns, as each of the qualitative and quantitative methods
allowed access to a different range of data. The project was multi-phased to allow for
expansion and corroboration, with each section of the study extending the findings of the
previous phase. Using the framework described by Creswell et al, this project roughly
followed a Sequential Explanatory design (Creswell, Plano Clark et al. 2003). In this
design, quantitative data are collected and analysed in the first instance, then qualitative
data are collected and analysed, and then the two methods are integrated during
interpretation. Qualitative data are typically used to interpret the results of the quantitative
study.
Figure 2: Sequential Explanatory design (adapted from (Creswell, Plano Clark et al. 2003))
However, the actual practice of undertaking the research was somewhat different. Phase 1,
the “Twelve Month Later study”, was not originally conceptualised as the pilot stage of the
project, but as an end-point in itself. However, recognition of the limitations of the
approach led to the analysis of this component being used to inform the research questions
and methods used in each of the three subsequent phases. Phase 2, the “Audit of Return”
was completed next, and analysis of these data influenced the development of the interview
guide that was used in Phase 3, “Qualitative Interviews”. Framework analysis of the
interview data guided the questionnaire used in the Phase 4 “Three Months Later study”.
Each of the phases was intended to be completed as a stand alone piece of research,
completed in sequence, with the findings informing the development of the next phase of
the research. In practice, lengthy hold-ups in accessing the data required for the Phase 2
(Audit of Return) meant that Phase 3 and 4 (Qualitative Interviews and the Three Months
Later study) were initiated before the analysis of Phase 2 had been finalised, and final
analysis of the latter three phases was completed concurrently. Nevertheless, each phase of
research contributed to the overall understanding of how deferral impacts on donor return.
Figure 3 contains a flow chart showing research methods used in this overall study.
QUAN Data
Analysis
QUAN Data
collection
QUAL Data
Collection QUAL Data
Analysis
Interpretation of entire analysis
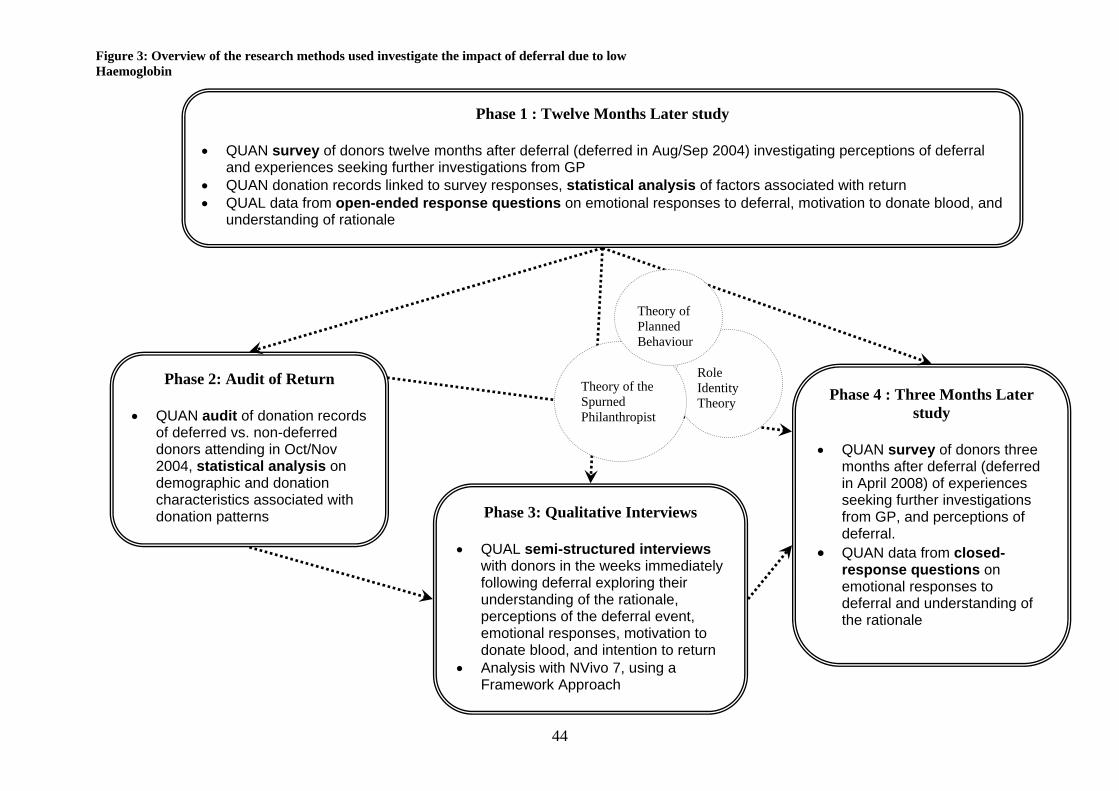
44
Figure 3: Overview of the research methods used investigate the impact of deferral due to low Haemoglobin
Phase 1 : Twelve Months Later study
• QUAN survey of donors twelve months after deferral (deferred in Aug/Sep 2004) investigating perceptions of deferral and experiences seeking further investigations from GP
• QUAN donation records linked to survey responses, statistical analysis of factors associated with return • QUAL data from open-ended response questions on emotional responses to deferral, motivation to donate blood, and
understanding of rationale
Phase 2: Audit of Return
• QUAN audit of donation records of deferred vs. non-deferred donors attending in Oct/Nov 2004, statistical analysis on demographic and donation characteristics associated with donation patterns
Phase 4 : Three Months Later study
• QUAN survey of donors three
months after deferral (deferred in April 2008) of experiences seeking further investigations from GP, and perceptions of deferral.
• QUAN data from closed-response questions on emotional responses to deferral and understanding of the rationale
Phase 3: Qualitative Interviews
• QUAL semi-structured interviews with donors in the weeks immediately following deferral exploring their understanding of the rationale, perceptions of the deferral event, emotional responses, motivation to donate blood, and intention to return
• Analysis with NVivo 7, using a Framework Approach
Role Identity Theory
Theory of the Spurned Philanthropist
Theory of Planned Behaviour
45
The mixed-methods approach has been criticised for combining methods that are
epistemologically incompatible (O'Cathain and Thomas 2006). I have taken a pragmatic
approach to this argument, believing that the use of qualitative and quantitative methods
generates more insights than the use of one approach alone, and that the utilisation of
different research approaches can compensate for the weaknesses of a single approach.
Greene and Caracelli write:
… a pragmatic mixed methods inquirer attends to the demands of the particular
inquiry context and makes inquiry decisions so as to provide the information
needed to maximised desired consequences- “get the job done.”(Greene and
Caracelli 2003 p101)
I attempted to behave in a manner appropriate to the paradigm of each research phase. Each
of the four phases was undertaken with separate samples (rather than a single cohort)
because it was possible that interaction with the researcher at each stage would influence
donors’ courses of action. In addition, the findings from each phase informed the questions
and approach of subsequent phases. Overall, the research described in this thesis proved to
be a challenging but useful exercise, which made me appreciate how hard it can be to
produce a good piece of mixed methods research.
The specific methods used in each phase of the project are not reported in this chapter, but
are described in the first sections of each respective “Results” chapter.
3.3 Research quality
Triangulation refers to the process of combining different research methods in a way that
derives the advantages of each method while reducing the limitations of a single approach
(Walter 2006a). In this research triangulation was achieved through the use of four separate
studies investigating different aspects of the topic of interest. The goal was not to identify
an overall “truth”, but rather derive a more comprehensive understanding of the issue than
would be possible by using any one of the studies alone (Morse 2003). Furthermore, data
triangulation was applied by investigating phenomena at different time points, using
different methods, and comparing and contrasting the results. Inconsistencies were of
particular interest, and helped form alternative explanations for patterns of behaviour.
Within the quantitative phases, external validity was supported through attempts to gain a
representative sample, and reliability through systematic administration procedures.

46
The rigour and validity of qualitative research are judged by a different set of standards.
This project followed the recommendations proposed by Popay and colleagues for
evaluating the quality of qualitative research in the health services sector. The
recommendations include assessments of the following characteristics: attention to lay
knowledge; evidence of purposive sampling; responsiveness to social context; adequate
descriptions; data quality; theoretical and conceptual adequacy, and typicality of the
findings (Popay, Rogers et al. 1998).
Attention to lay knowledge was achieved by prioritising participant perspectives of events
through the selection of “Framework Analysis”, which ensures that all conclusions are
grounded in original accounts, and through presentation of original quotes in the qualitative
results chapter. Member checking was also incorporated, and this involved offering
participants the opportunity to read the transcript of their interview before data were used in
the study. Purposive sampling was utilised to determine which donors should be invited to
participate, based on their demographic characteristics and donation history, rather than
approaching a random selection of donors.
Responsiveness to social context was shown in a number of ways. During the course of
completing the interviews, the interview guide, the settings in which interviews were
conducted, decisions about which donors should be approached for an interview, and the
interviewing techniques were all adapted in response to my experiences in the field.
Adequate descriptions were sought by using semi-structured interviews rather than a more
structured approach. This allowed participants to discuss the issues that were relevant to
them rather than be confined by a pre-determined list of issues relevant to the researcher.
“Thick descriptions” were obtained where possible, which involved descriptions of the
context of a situation, including the meanings and intentions, rather than “thin
descriptions”, which are merely statements of fact.
Popay writes:
Given the involvement of the researcher in the research process, the question is not
whether the data is biased, but to what extent the researcher rendered transparent
the processes by which data have been collected, analysed, and presented (Popay,
Rogers et al. 1998 p348)
Improvement of data quality was achieved through clear descriptions of the methods and
analytical processes used in the qualitative analysis. Furthermore, I engaged in
47
“reflexivity”, a process of reflection and self-awareness of the researcher’s role in the
research process (Willis 2006). This is acknowledged later in this chapter with a description
of my personal experiences as they relate to the research (see section 3.5 in this chapter).
Theoretical and conceptual adequacy was sought by following the Framework Approach.
Further description of this analytical approach is given in the methods section of the
qualitative results chapter (see the Results: Part Two chapter).
Finally, the typicality of the findings refers to the extent to which the research can be
generalised. Purposive sampling techniques were used to ensure the participants
represented deferred donors from a range of life stages and donation histories, so that the
findings might be generalised more widely than the participant group.
3.4 Ethics
Approval for each stage of the research was obtained from both the Human Research Ethics
Committee of the University of Adelaide, and the Human Research Ethics Committee of
the Australian Red Cross Blood Service.
All participants completing a questionnaire were given an information sheet, assuring them
that participation was voluntary and advising them that completing the questionnaire
constituted consent to participate.
The Twelve Months Later study involved linking of survey data with donation data and
demographic information available in the donor database. Donors were advised that this
was planned in the information letter. All datasets were kept in password protected folders
and not shared with anyone outside the research group.
The Three Months Later study was not linked to donor records, and surveys were
completed anonymously.
Qualitative interview participants were given an information sheet assuring them of
anonymity and the confidentiality of their interview data. All signed a consent form and
gave permission for interviews to be recorded. Participants’ names were changed when
interviews were transcribed. Donors were offered the opportunity to view their transcript,
and fourteen out of the twenty nine respondents requested this option. None reported back
issues with the transcription of their interview.
The majority of interviews were conducted in donors’ homes. To protect my personal
safety, I left details of the address, time of interview, and planned time of return with
48
ARCBS staff sharing an office, and additionally telephoned back to the office at the
interview’s completion.
3.5 Researcher’s background
A researcher influences every aspect of their research, from conceptualisation, planning and
data collection, to analysis and interpretation. As the researcher is inextricably bound in all
aspects of the research process, his/her underlying assumptions and beliefs mean that true
objectivity may not be possible. Biases can be identified and reduced through a process of
reflexivity. Assumptions and biases arise, in part, from personal experience. This section
gives an overview of my background and experiences as they relate to the research
described in this thesis.
From my late teens I experienced an occasional nagging feeling that donation was
something that I ought to be doing. I perceived blood donors as morally good, “giving”
people who put themselves out to help others, however I believed the experience would be
painful and unpleasant.
Five years ago I began working with the ARCBS, which provided me with knowledge
about the severely stretched blood supply, as well as close physical proximity to the
donation site, which meant that I could no longer justify my excuses in putting off donating
blood. Over the course of several weeks I worked up the courage to donate for the first
time. Thankfully my first experience was a positive one, and after my successful first
attempt, I readily adopted the role identity of a “blood donor”, as in my mind the action
aligned with self-perceptions I already held. That said, I never particularly enjoyed the
process of donating blood, as my fear of needles and discomfort at the sight of blood only
slightly diminished through my experience as a donor.
I had already been donating regularly and successfully for over three years, and was over
two years into my PhD research, when I was deferred for a low haemoglobin concentration.
My reaction was one of surprise, concern, and excitement. I was surprised and concerned
that I was not as healthy as I thought I was, and that a recent change in diet had taken its
toll on my iron stores so quickly, but excited that I had a better opportunity to understand
the deferral process from the donor’s perspective.
I made notes of my impressions of the deferral experience immediately following the event.
For me, deferral consisted of ambiguous explanations, particularly the reason for the
49
samples being taken, more needles than I was expecting, and finally, the overwhelming
feeling of being “off the hook” from donating blood for six months. I was left wondering
whether other donors felt the same way. I returned to give blood on the first day after being
eligible to do so.
My deferral for low Hb occurred prior to conducting the qualitative interviews, and during
several interviews I shared the fact that I was a donor, often to confirm assumptions held by
the interviewee, and less often, that I had also experienced low Hb deferral. This assisted
with building rapport.
Early in 2008 I was deferred for low Hb for a second time, after having successfully made a
further three donations. As in my first encounter, I found the explanation to be lacking and,
in one instance, misleading (I was advised to drink more red wine, and later investigations
confirmed there was limited evidence that red wine contributed to iron intake in the diet). I
wondered why this nurse had recommended multi-vitamins rather than iron supplements,
and whether she should be recommending any supplementation at all. In common with the
majority of my interview participants, I was not offered an information brochure, and
though told one was available when questioned, it was never given. Again, the
overwhelming feeling was of being “let off the hook” from giving blood for a while.
As I had now been deferred twice in the space of 18 months, I sought further testing with
my GP to rule out any underlying conditions. I returned to give blood within one month of
being eligible to return for two reasons: awareness- obtained through being located within
the organisation (emails, information on the intranet) - that blood stocks were critically low,
and the high level of convenience resulting from working in the same building as the
collection site. I was aware that most blood donors do not experience such strong
facilitation of a prompt return.
3.6 Presentation of results
The results of this research are presented in the following four “Results” chapters, each
describing one of four studies completed in the overall project. The chapters contain the
aims, methods, results, discussion, and the conclusion from each distinct study. A final
discussion chapter follows the results sections, which draws together the findings of each
study into an overall conclusion.

50
The results chapters are not presented in the order in which the studies were completed, but
rather presented in a way that attempts to build a comprehensive picture of not only the
impact of a low Hb deferral on subsequent donation patterns, but the range of possible
explanations for the effect. Results: Part One describes the Audit of Return study,
exploring the impact of a low Hb deferral on donation patterns during a three year follow-
up period. Results: Part Two discusses a qualitative investigation into why donors are less
likely to return after deferral. Results: Part Three presents the findings from a cross-
sectional survey exploring donors’ experiences when seeking further medical
investigations, and in particular, whether these experiences influence their intention to
return. Results: Part Four describes the study that was actually completed first; this was a
cross-sectional survey completed twelve months after the deferral event. Linking the survey
responses with return data allowed exploratory analysis of the factors associated with
return, and to what extent intention to return predicted donation during a specific time
period.
Throughout the rest of this thesis any reference to four studies in the project will be made
using acronyms: the Audit of return study as AR, the Qualitative Interviews study as QI, the
Three Months Later study as 3ML, and the Twelve Months Later study as 12ML.

51
4 Results: Part One The impact of low haemoglobin deferral on donation behaviour An audit of return patterns following deferral
4.1 Chapter Outline
This chapter describes the results of a retrospective cohort study investigating the effect of
a temporary deferral due to low haemoglobin (Hb) on the likelihood of return and
subsequent donation frequency of whole blood donors.
4.2 Aim
This phase of the research sought to answer four questions:
What are the demographic characteristics and donation histories of blood donors who have
been deferred due to low haemoglobin, compared to the non-deferred donor population?
What are the factors associated with non-return after a temporary deferral due to low
haemoglobin?
What are the factors associated with time to return following temporary deferral?
How does deferral impact on donation frequency for the donors who do return?
4.3 Methods
4.3.1 Study design
This phase of the project was a retrospective cohort study. Donation records for a cohort of
all donors attending to give blood in October and November of 2004 in two states (NSW
and SA) were extracted from the ARCBS Data Warehouse. The first attendance at the
blood service during the time period (October or November 2004) was identified as the
reference donation. If the reference donation had resulted in a deferral due to a low
haemoglobin concentration, the donor was assigned to the deferred group, and if their Hb
concentration was within the acceptable range and they were not deferred for any other
reason, to the comparison group. This coding allowed comparisons between the return
patterns of low Hb deferred donors and those who were not deferred during the same time
period.
52
Records included details of each donation made for twelve months prior to the deferral, and
for forty two months following the reference donation to allow analysis of return patterns
for up to three years beyond the end of the six month deferral period. Donation records
were de-identified and individuals were not contacted at any stage of the study.
4.3.2 Sample
4.3.2.1 Inclusion criteria
All whole blood donors who attended to donate during October and November of 2004,
from New South Wales (NSW) and South Australia (SA) were included in the study. These
states were selected as data for these states had been fully “migrated” onto the ARCBS
Data Warehouse (long term data storage) and the National Blood Management System
(NBMS) (the “live” database) at the time of the study, allowing details to be easily
accessed. The time period was selected to allow donor return to be followed for three years
after donors were eligible to return.
4.3.2.2 Exclusion criteria
Therapeutic donors (who donate to alleviate the symptoms of haemochromatosis),
apheresis donors (who donate plasma, platelets, or red cell components only), and
autologous donors (who donate blood for their own sole use) were excluded, as these types
of donations have different acceptance criteria, donation frequency and, in the case of
therapeutic and autologous donors, potentially different motivations for giving blood.
4.3.3 Identification of sample
A data set was extracted from the Data Warehouse of the Australian Red Cross Blood
Service for all donors meeting the inclusion criteria. The dataset contained demographic
information, including the donor identification number, state, date of birth, sex, number of
donations made, date of first donation, and blood group, as well as data on all donation
attempts during the study period, including donation number, date, type of donation being
made (for example, whole blood or apheresis), outcome of donation attempt (for example
successful donation, deferral or not taken), and the type and duration of any deferrals
incurred at donation attempts. The group was divided into the deferred and comparison
groups as previously described.
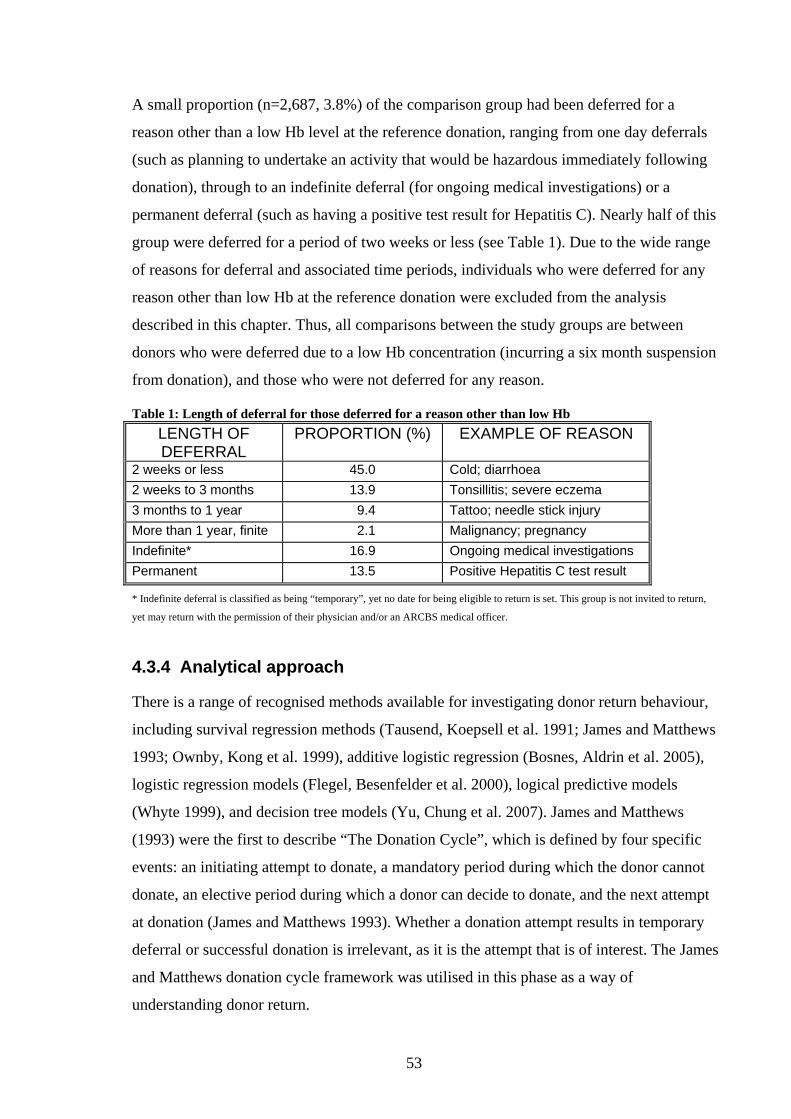
53
A small proportion (n=2,687, 3.8%) of the comparison group had been deferred for a
reason other than a low Hb level at the reference donation, ranging from one day deferrals
(such as planning to undertake an activity that would be hazardous immediately following
donation), through to an indefinite deferral (for ongoing medical investigations) or a
permanent deferral (such as having a positive test result for Hepatitis C). Nearly half of this
group were deferred for a period of two weeks or less (see Table 1). Due to the wide range
of reasons for deferral and associated time periods, individuals who were deferred for any
reason other than low Hb at the reference donation were excluded from the analysis
described in this chapter. Thus, all comparisons between the study groups are between
donors who were deferred due to a low Hb concentration (incurring a six month suspension
from donation), and those who were not deferred for any reason.
Table 1: Length of deferral for those deferred for a reason other than low Hb LENGTH OF DEFERRAL
PROPORTION (%) EXAMPLE OF REASON
2 weeks or less 45.0 Cold; diarrhoea 2 weeks to 3 months 13.9 Tonsillitis; severe eczema 3 months to 1 year 9.4 Tattoo; needle stick injury More than 1 year, finite 2.1 Malignancy; pregnancy Indefinite* 16.9 Ongoing medical investigations Permanent 13.5 Positive Hepatitis C test result
* Indefinite deferral is classified as being “temporary”, yet no date for being eligible to return is set. This group is not invited to return,
yet may return with the permission of their physician and/or an ARCBS medical officer.
4.3.4 Analytical approach
There is a range of recognised methods available for investigating donor return behaviour,
including survival regression methods (Tausend, Koepsell et al. 1991; James and Matthews
1993; Ownby, Kong et al. 1999), additive logistic regression (Bosnes, Aldrin et al. 2005),
logistic regression models (Flegel, Besenfelder et al. 2000), logical predictive models
(Whyte 1999), and decision tree models (Yu, Chung et al. 2007). James and Matthews
(1993) were the first to describe “The Donation Cycle”, which is defined by four specific
events: an initiating attempt to donate, a mandatory period during which the donor cannot
donate, an elective period during which a donor can decide to donate, and the next attempt
at donation (James and Matthews 1993). Whether a donation attempt results in temporary
deferral or successful donation is irrelevant, as it is the attempt that is of interest. The James
and Matthews donation cycle framework was utilised in this phase as a way of
understanding donor return.

54
Cut-off dates were calculated for each donor. Attendances more than one year prior to the
reference donation, and more than three years following eligibility to return were excluded
from analysis. For the deferred group, eligibility for first return was set as one day after the
last date of temporary deferral (181 days from the reference donation). However, if the
donor returned earlier than this date, as can occur if they receive a clearance from their
doctor, their date of eligibility for first return was set as the date of their return
For the comparison group, eligibility for first return was set as 85 days after the reference
donation (one day after the mandatory 12 week break between whole blood donations).
However, whole blood donors are technically allowed to return after a minimum of ten
weeks (70 days) following a whole blood donation, although the ARCBS does not invite
return until a minimum of twelve weeks (84 days) have elapsed. If donors returned before
85 days had elapsed, their date of eligibility for first return was set as the date of their
return.
The timeline of the study for the deferred group is shown in Table 2 and for the comparison
group in Table 3.
Table 2: Timeline of the study period for the deferred group
Table 3: Timeline of the study period for the comparison group
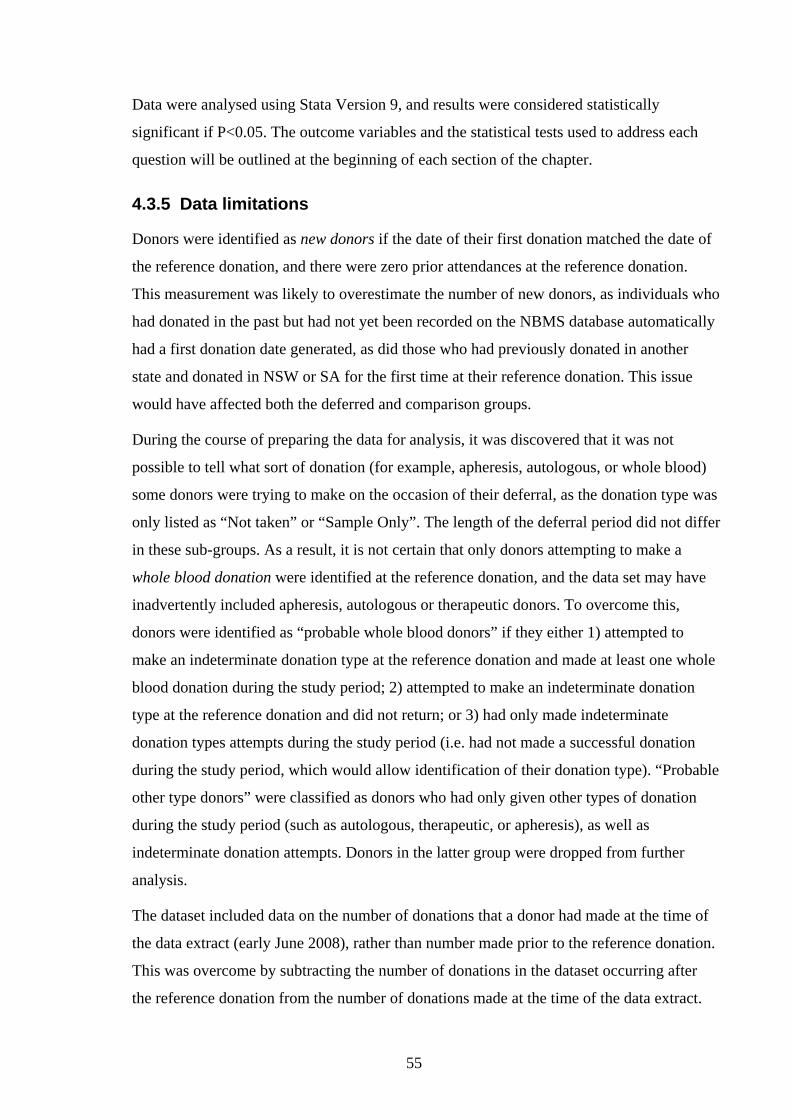
55
Data were analysed using Stata Version 9, and results were considered statistically
significant if P<0.05. The outcome variables and the statistical tests used to address each
question will be outlined at the beginning of each section of the chapter.
4.3.5 Data limitations
Donors were identified as new donors if the date of their first donation matched the date of
the reference donation, and there were zero prior attendances at the reference donation.
This measurement was likely to overestimate the number of new donors, as individuals who
had donated in the past but had not yet been recorded on the NBMS database automatically
had a first donation date generated, as did those who had previously donated in another
state and donated in NSW or SA for the first time at their reference donation. This issue
would have affected both the deferred and comparison groups.
During the course of preparing the data for analysis, it was discovered that it was not
possible to tell what sort of donation (for example, apheresis, autologous, or whole blood)
some donors were trying to make on the occasion of their deferral, as the donation type was
only listed as “Not taken” or “Sample Only”. The length of the deferral period did not differ
in these sub-groups. As a result, it is not certain that only donors attempting to make a
whole blood donation were identified at the reference donation, and the data set may have
inadvertently included apheresis, autologous or therapeutic donors. To overcome this,
donors were identified as “probable whole blood donors” if they either 1) attempted to
make an indeterminate donation type at the reference donation and made at least one whole
blood donation during the study period; 2) attempted to make an indeterminate donation
type at the reference donation and did not return; or 3) had only made indeterminate
donation types attempts during the study period (i.e. had not made a successful donation
during the study period, which would allow identification of their donation type). “Probable
other type donors” were classified as donors who had only given other types of donation
during the study period (such as autologous, therapeutic, or apheresis), as well as
indeterminate donation attempts. Donors in the latter group were dropped from further
analysis.
The dataset included data on the number of donations that a donor had made at the time of
the data extract (early June 2008), rather than number made prior to the reference donation.
This was overcome by subtracting the number of donations in the dataset occurring after
the reference donation from the number of donations made at the time of the data extract.

56
There was a lapse of several weeks between the last donation in the dataset and the date of
the data extract, so it is possible that some donors returned during this window resulting in
the overestimation of donations. This would have affected both groups.
4.4 Results
Results are presented in four sections, each addressing a separate research question. A
summary of all results is provided at the end of the chapter.
4.4.1 What characteristics are associated with low Hb deferral?
This section presents the results of analysis of the differences between the deferred and
comparison groups, using descriptive statistics, t-tests and chi-square tests.
Table 4 summarises the distribution of gender in the two study groups. Donors deferred for
a low haemoglobin level were far more likely to be female (85.2% of the deferred group,
compared to 52.4% of the comparison group (P<0.001)).
Table 4: Sex distribution of study groups DEFERRED GROUP
(N=1,011) COMPARISON GROUP
(N= 68,675)
Sex n % n %
Female 861 85.2 36,007 52.4 Male 150 14.8 32,668 47.6
Table 5 shows the distribution of age at the reference donation. Deferred donors were
significantly younger, with greater proportions of deferred donors aged less than 45 than
the comparison group (P<0.001). The mean age of the deferred group was significantly
lower than that of the comparison group (P<0.001).
Table 5: Age distribution of study groups DEFERRED GROUP
(N=1,011) COMPARISON GROUP
(N= 68,675) Age n % n %
Less than 18 146 7.2 7640 5.6
18-24 328 16.2 16522 12.0
25-34 270 13.4 19850 14.5 35-44 430 21.3 25662 18.7
45-54 442 21.9 33116 24.1
55-64 298 14.7 27070 19.7 65+ 108 5.3 7490 5.5

57
Mean age (SD) 40.1 (15.3) 42.4 (15.0) Range of age 16-74 15-80
Table 6 and Table 7 show the distribution of age, stratified by sex. The distribution of age
differed by sex, with deferred females significantly younger than comparison group females
(t- test P<0.001), and deferred males significantly older than comparison group males (t-
test P<0.001).
Table 6: Age distribution of study groups: for females DEFERRED GROUP
(N= 861) COMPARISON GROUP
(N= 36,007)
Age n % n % Less than 18 68 7.9 2144 6.0
18-24 153 17.8 5214 14.5
25-34 121 14.1 5500 15.3 35-44 201 23.3 6693 18.6
45-54 190 22.1 8301 23.1
55-64 98 11.4 6635 18.4 65+ 30 3.5 1520 4.2
Mean age (SD) 38.3 (14.6) 41.0 (15.1) Range of age 16-71 15-79
Table 7: Age distribution of study groups: for males DEFERRED GROUP
(N=150) COMPARISON GROUP
(N=32,668) Age n % n %
Less than 18 5 3.3 1676 5.1
18-24 11 7.3 3047 9.3
25-34 14 9.3 4425 13.6 35-44 14 9.3 6138 18.8
45-54 31 20.7 8257 25.3
55-64 51 34.0 6900 21.1 65+ 24 16.0 2225 6.8
Mean age (SD) 50.4 (15.4) 43.9 (14.9) Range of age 16-74 15-80
Table 8 presents the proportion of new and repeat donors in each group. The deferred group
was significantly less likely to be a first time donor than the comparison group (83.0% vs.
87.2 % respectively) (P<0.001).

58
Table 8: Proportion of first time donors in study groups DEFERRED GROUP
(N=1,011) COMPARISON GROUP
(N= 68,675)
First time or repeat? n % n %
First time 129 12.8 11,675 17.0 Repeat 882 87.2 57,000 83.0
Table 9 shows a summary of the recent donation frequencies of the groups, which is the
number of donations made by repeat donors in the twelve months prior to, but not
including, the reference donation. Chi-square tests show a significantly greater proportion
of the deferred group had given two or more donations (P<0.001). The difference in the
mean number of donations was statistically significant (P<0.001). Only the donation rates
of repeat donors were described here, as including first time donors would have artificially
boosted the proportion of donors not having given blood in the twelve months prior to
deferral.
Table 9: Number of attendances made in twelve months prior to the reference donation DEFERRED GROUP
(N=882) COMPARISON GROUP
(N= 57,000) Number of attendances in previous 12 months* n % n %
0 58 6.6 6,712 11.8 1 198 22.5 15,272 26.8 2 218 24.7 13,361 23.4 3 245 27.8 12,221 21.4 4 141 16.0 8,464 14.9 5 or more 22 2.5 970 1.7
Mean donations (SD) 2.4 (1.5) 2.1 (1.5) Range of donations 0-18 0-25
* for repeat donors only, not including the reference donation
Amongst both the deferred and comparison groups, donors with the highest recent donation
frequency were most likely to be male (P<0.001 and P<0.001 respectively) and of an older
age (P<0.001 and P<0.001 respectively).
The number of donations an individual had given prior to the reference donation varied
widely, as shown in Table 10. Deferred group donors ranged from having the reference
donation as their first donation (1 donation) through to having made 165 donations, and
comparison group donors had given up to 359 donations. Deferred donors were less likely

59
to be longer term donors, with a lower mean donation number than comparison donors
(17.5 vs. 21.6 respectively, P<0.001), and those in the comparison group were more likely
to have given 20 or more times prior to their deferral, or just once, reflecting the greater
proportion of first time donors (P<0.001).
Table 10: Number of donations made in twelve months prior to reference donation CATEGORY DEFERRED GROUP
(N=1,011) COMPARISON GROUP
(N= 68,675) Number of previous donations made* n % n %
1 129 12.8 11,383 16.6 2 to 4 225 22.3 13,376 19.5 5 to 10 208 20.6 10,559 15.4 10 to 19 183 18.1 10,378 15.1 20 to 49 166 16.4 13,018 19.0 50 to 99 83 8.2 7,903 11.5 100+ 17 1.7 2,058 3.0
Mean donations (SD) 17.5 (24.1) 21.6 (29.1) Range of donations 1-165 1-359
*the number of donations at (and including) the reference donation
Those belonging to the deferred group were significantly more likely to have been deferred
for low Hb in the year prior to the reference donation (P<0.001) (see Table 11).
In both the deferred and comparison groups, donors who had given a greater number of
donations were most likely to be male (P<0.001 and P<0.001 respectively) and in an older
age group (P<0.001 and P<0.001 respectively).
Table 11: Distribution of low Hb deferrals prior to reference donation DEFERRED GROUP
(N=1,011) COMPARISON GROUP
(N= 68,675) Deferred due to low Hb? n % n %
Deferred 16 1.6 177 0.3 Not deferred 995 98.4 68,498 99.7
Table 12 shows the proportions of donors in each group deferred for a reason other than
low Hb in the year prior to the reference donation. Differences were not statistically
significant (P=0.237). Incidentally, the proportion of donors deferred for “other” reasons
prior to the reference donation did not significantly differ between groups even when the

60
comparison group included those deferred for an “other” reason at the reference donation
(data not shown, P=0.321).
Table 12: Distribution of deferrals for another reason prior to reference donation
DEFERRED GROUP (N=1,011)
COMPARISON GROUP (N= 68,675)
Deferred due for another reason? n % n %
Deferred 14 1.4 693 1.0 Not deferred 997 98.6 67,982 99.0
4.4.2 Factors associated with return during the follow-up period
Logistic regression analysis was used to test for associations between returning to give
blood during the follow-up period and demographic and donation characteristics. The
follow-up period commenced from when the donor was first eligible to return to donate,
and ended three years after that date, capped at the end of May 2008.
Return status was coded 1= return, and 0=non-return. Separate models were developed to
predict return amongst donors in the deferred and comparison groups.
The dependent variables were coded as follows:
• deferred donor 1=low Hb deferred group 0=comparison group
• male 1=male 0=female
• age dummy variables for being aged 25-34, 35-44, 45-54, 55-64, and 65 or older,
against a baseline of 15-24.
• recent donation frequency dummy variables for having made zero, 1, 2, 3, 4 or 5
or more attendances in the year prior to reference donation (not including reference
donation), against a baseline of being a new donor at the reference donation
• donation history dummy variables for having made 1 or 2, 3 to 10, 11 to 20, 21 to
49, and 50 or more donations (not including reference donation), against a baseline
of being a new donor at the reference donation
• low Hb deferral in the 12 months prior to reference donation 1=was deferred 0=
was not deferred (repeat donors only)

61
• low Hb deferral following eligibility to return (calculated separately for years 1,
2, and 3 of follow-up) 1=was deferred 0= was not deferred
• other deferral following eligibility to return (calculated separately for years 1, 2,
and 3 of follow-up) 1=was deferred 0= was not deferred
• number of donations following eligibility to return (a count of donations overall,
and separately for years 1, 2, and 3 of follow-up) N= the number of donations given
in time period
Analysis was structured as follows: first, univariable (simple) logistic regression was
performed on each variable. Following established guidelines, variables with a univariable
global P test values of <0.25 were selected as candidates in the multivariable model
(Hosmer and Lemeshow 2000). Following the fit of the preliminary multivariable model,
variables with a test p value of <0.05 were retained in the final model.
Although presented in the results of univariable analysis, variables indicating recent
donation frequency and donation history could not both be included in the multivariable
models due to problems with dependence in categories (chi-square P<0.001), as donors
with a shorter donation history could not be represented in all categories of recent donation
frequency. Therefore, guided by the approach of Schlumpf and colleagues (Schlumpf,
Glynn et al. 2008), who used recent donation frequency to indicate donor history, this
factor was included in the models rather than length of donation history.
4.4.2.1 Factors predicting return in the deferred group
4.4.2.1.1 Return during the whole follow-up period The results of the univariable analysis of factors predicting return during the entire follow-
up period are presented in Table 13, and estimates where the global P value is <0.25 are
indicated in bold font. Older donors, particularly those aged between 45 and 64, were
significantly more likely to return than younger donors. A greater recent frequency and
longer donation history was associated with a higher likelihood of return. Amongst those
attending during the year prior to deferral, those who were deferred for low Hb in this time
were significantly more likely to return than those who were not. Males were no more
likely to return than females.

62
Table 13: Univariable logistic regression models for return during three year follow-up period, deferred group
VARIABLE OR 95% CONF. INTERVAL
P
Age 0.007
<25 25-34 0.86 0.56 1.31 0.48 35-44 1.40 0.96 2.03 0.08 45-54 1.58 1.09 2.30 0.02 55-64 1.77 1.16 2.71 0.01 65+ 1.04 0.57 1.88 0.90
Male (relative to female) 1.19 0.83 1.70 0.34
Recent attendance history (in 12 months prior to reference donation) <0.001 New donor 0 donations prior 4.05 2.08 7.89 <0.001 1 donations prior 4.44 2.67 7.38 <0.001 2 donations prior 7.35 4.42 12.22 <0.001 3 donations prior 8.09 4.90 13.36 <0.001 4 donations prior 9.21 5.27 16.11 <0.001 5 donations prior 10.07 3.60 28.21 <0.001
Number of donations (ever made) <0.001New donor 1 or 2 donations 4.46 2.65 7.50 <0.001 3 to 10 donations 5.16 3.20 8.33 <0.001 11 to 20 donations 8.28 4.79 14.30 <0.001 21 to 49 donations 12.56 7.09 22.24 <0.001 50+ 11.03 5.93 20.54 <0.001
Previously deferred for low Hb* (n=824)
3.88 0.88 17.18 0.07
Univariable (simple) logistic regression (n=1011) * for donors who attended in the year prior to deferral only 1/0 coding of all categories reflects whether or not the donor was coded affirmatively in category
Factors found to be significant predictors (P<0.25) in the univariable analysis were
included in the multivariable model of return amongst the deferred group. The estimates of
the multivariable model are shown in Table 14. Global P values for categorical predictors
with more than three levels (e.g. age) were estimated using likelihood-ratio tests.
In order to allow the variable indicating whether the donor had been previously deferred for
low Hb to be included in the model, variables relating to donation history were re-coded to
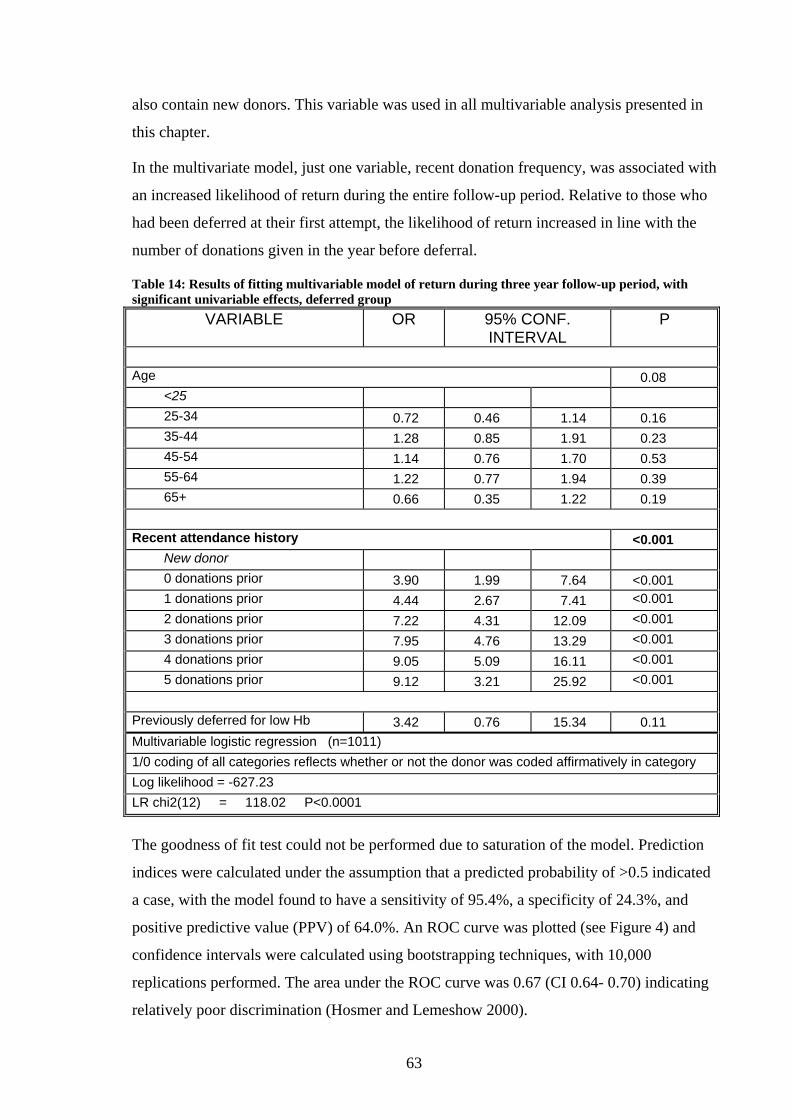
63
also contain new donors. This variable was used in all multivariable analysis presented in
this chapter.
In the multivariate model, just one variable, recent donation frequency, was associated with
an increased likelihood of return during the entire follow-up period. Relative to those who
had been deferred at their first attempt, the likelihood of return increased in line with the
number of donations given in the year before deferral.
Table 14: Results of fitting multivariable model of return during three year follow-up period, with significant univariable effects, deferred group
VARIABLE OR 95% CONF. INTERVAL
P
Age 0.08
<25 25-34 0.72 0.46 1.14 0.16 35-44 1.28 0.85 1.91 0.23 45-54 1.14 0.76 1.70 0.53 55-64 1.22 0.77 1.94 0.39 65+ 0.66 0.35 1.22 0.19
Recent attendance history <0.001
New donor 0 donations prior 3.90 1.99 7.64 <0.001 1 donations prior 4.44 2.67 7.41 <0.001 2 donations prior 7.22 4.31 12.09 <0.001 3 donations prior 7.95 4.76 13.29 <0.001 4 donations prior 9.05 5.09 16.11 <0.001 5 donations prior 9.12 3.21 25.92 <0.001
Previously deferred for low Hb 3.42 0.76 15.34 0.11 Multivariable logistic regression (n=1011) 1/0 coding of all categories reflects whether or not the donor was coded affirmatively in category Log likelihood = -627.23 LR chi2(12) = 118.02 P<0.0001
The goodness of fit test could not be performed due to saturation of the model. Prediction
indices were calculated under the assumption that a predicted probability of >0.5 indicated
a case, with the model found to have a sensitivity of 95.4%, a specificity of 24.3%, and
positive predictive value (PPV) of 64.0%. An ROC curve was plotted (see Figure 4) and
confidence intervals were calculated using bootstrapping techniques, with 10,000
replications performed. The area under the ROC curve was 0.67 (CI 0.64- 0.70) indicating
relatively poor discrimination (Hosmer and Lemeshow 2000).

64
Figure 4: Plot of sensitivity versus 1-specificity (ROC Curve) In order to investigate the factors predicting return in different phases of the follow-up
period, and in particular the effect of another deferral during the follow-up period, analysis
was performed on the variables predicting return in each of the three years of follow-up.
4.4.2.1.2 Return during Year 1 The results of the univariable analysis of factors predicting return in the first year of being
eligible is shown below (see Table 15). All variables were found to be significant predictors
at the P<0.25 level.
Table 15: Univariable logistic regression models for return during Year 1, deferred group VARIABLE OR 95% CONF.
INTERVAL P
Age 0.002
<25 25-34 0.85 0.55 1.32 0.47 35-44 1.51 1.04 2.19 0.03 45-54 1.65 1.14 2.39 0.01 55-64 1.83 1.21 2.77 0.004
0.00
0.25
0.50
0.75
1.00
Sen
sitiv
ity
0.00 0.25 0.50 0.75 1.001 - Specificity
Area under ROC curve = 0.6746

65
65+ 1.49 0.83 2.71 0.18
Male (relative to female) 1.42 1.00 2.02 0.047
Recent attendance history (in 12 months prior to reference donation) <0.001 New donor 0 donations prior 2.21 1.04 4.69 0.04 1 donations prior 4.09 2.33 7.19 <0.001 2 donations prior 6.71 3.85 11.68 <0.001 3 donations prior 7.47 4.31 12.92 <0.001 4 donations prior 9.91 5.46 17.97 <0.001 5 donations prior 15.44 5.36 44.43 <0.001
Number of donations (ever made) <0.001
New donor 1 or 2 donations 3.96 2.23 7.03 <0.001 3 to 10 donations 4.52 2.65 7.72 <0.001 11 to 20 donations 7.37 4.11 13.21 <0.001 21 to 49 donations 11.94 6.58 21.68 <0.001 50+ 12.51 6.55 23.89 <0.001
Previously deferred for low Hb* (n=824)
2.64 0.84 8.25 0.10
Univariable (simple) logistic regression (n=1011) * for donors who attended in the year prior to deferral only 1/0 coding of all categories reflects whether or not the donor was coded affirmatively in category
All variables (with the exception of donation history) were included in a multivariable
model. Only recent attendance history was a significant predictor of return in the model.
The odds of return amongst repeat donors who had not made any donations in the year prior
to deferral were not significantly different to that of a first time donor, suggesting that
donors who were deferred at their first return in over a year had a similar likelihood of
returning promptly once eligible as those who were deferred at their first ever donation.
(see Table 16).
Table 16: Results of fitting multivariable model of return during Year 1, with significant univariable effects, deferred group

66
VARIABLE OR 95% CONF. INTERVAL
P
Age 0.08
<25 25-34 0.72 0.45 1.14 0.16 35-44 1.40 0.94 2.09 0.10 45-54 1.22 0.82 1.81 0.32 55-64 1.27 0.80 2.00 0.31 65+ 0.96 0.51 1.80 0.89
Male (relative to female) 1.07 0.72 1.58 0.75
Recent attendance history <0.001
New donor 0 donations prior 2.09 0.98 4.47 0.06 1 donations prior 4.02 2.28 7.08 <0.001 2 donations prior 6.43 3.67 11.28 <0.001 3 donations prior 7.16 4.10 12.53 <0.001 4 donations prior 9.25 5.01 17.08 <0.001 5 donations prior 14.01 4.77 41.14 <0.001
Previously deferred for low Hb 2.24 0.70 7.14 0.17 N=1011 Log likelihood = -640.42 LR chi2(13) = 117.50 P<0.0001
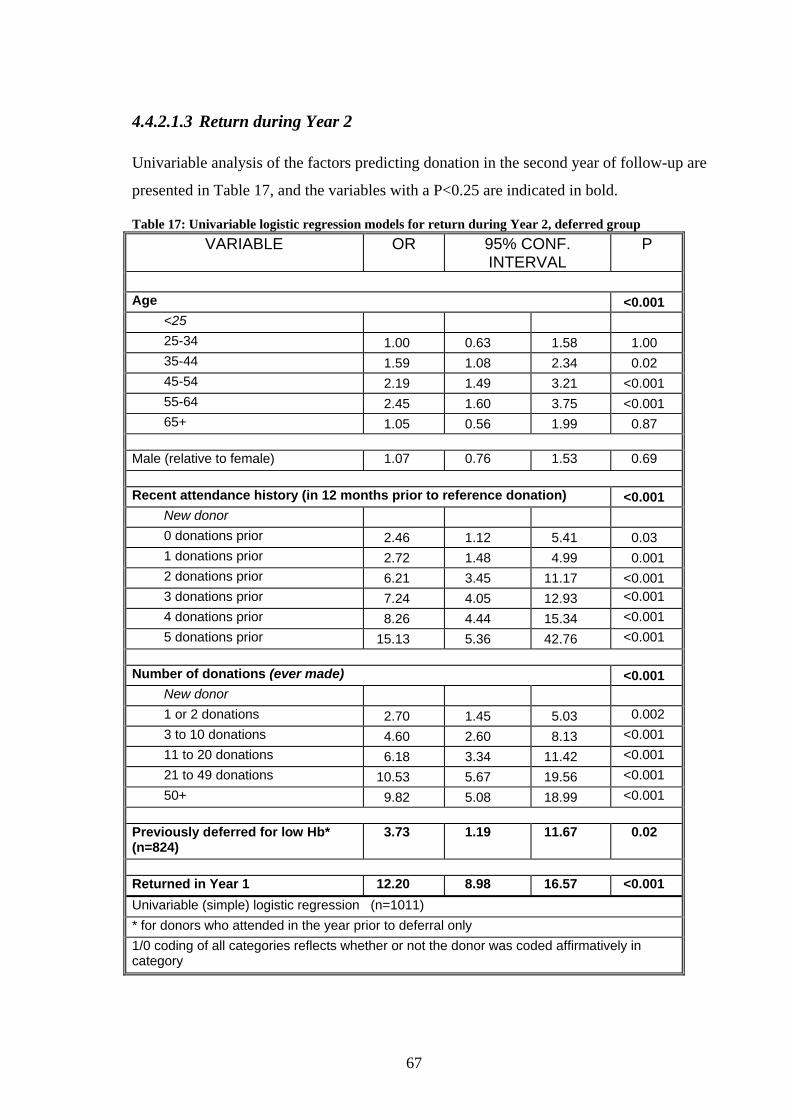
67
4.4.2.1.3 Return during Year 2 Univariable analysis of the factors predicting donation in the second year of follow-up are
presented in Table 17, and the variables with a P<0.25 are indicated in bold.
Table 17: Univariable logistic regression models for return during Year 2, deferred group VARIABLE OR 95% CONF.
INTERVAL P
Age <0.001
<25 25-34 1.00 0.63 1.58 1.00 35-44 1.59 1.08 2.34 0.02 45-54 2.19 1.49 3.21 <0.001 55-64 2.45 1.60 3.75 <0.001 65+ 1.05 0.56 1.99 0.87
Male (relative to female) 1.07 0.76 1.53 0.69
Recent attendance history (in 12 months prior to reference donation) <0.001 New donor 0 donations prior 2.46 1.12 5.41 0.03 1 donations prior 2.72 1.48 4.99 0.001 2 donations prior 6.21 3.45 11.17 <0.001 3 donations prior 7.24 4.05 12.93 <0.001 4 donations prior 8.26 4.44 15.34 <0.001 5 donations prior 15.13 5.36 42.76 <0.001
Number of donations (ever made) <0.001
New donor 1 or 2 donations 2.70 1.45 5.03 0.002 3 to 10 donations 4.60 2.60 8.13 <0.001 11 to 20 donations 6.18 3.34 11.42 <0.001 21 to 49 donations 10.53 5.67 19.56 <0.001 50+ 9.82 5.08 18.99 <0.001
Previously deferred for low Hb* (n=824)
3.73 1.19 11.67 0.02
Returned in Year 1 12.20 8.98 16.57 <0.001 Univariable (simple) logistic regression (n=1011) * for donors who attended in the year prior to deferral only 1/0 coding of all categories reflects whether or not the donor was coded affirmatively in category

68
The variables found to be significant predictors of return (P<0.25) in the univariable
analysis were included in multivariable analysis (see Table 18). The strongest predictor of
return during Year 2 was whether the donor had returned once during Year 1, followed by
having given a greater number of donations in the past, and an older age (aged 45-64
relative to being aged <25).
Table 18: Results of fitting multivariable model of return during Year 2, with significant univariable effects, deferred group
VARIABLE OR 95% CONF. INTERVAL
P
Age 0.02
<25 25-34 0.95 0.54 1.66 0.85 35-44 1.30 0.81 2.08 0.27 45-54 1.70 1.07 2.71 0.03 55-64 1.72 1.02 2.90 0.04 65+ 0.64 0.30 1.34 0.23
Recent attendance history <0.001
New donor 0 donations prior 1.65 0.68 4.04 0.27 1 donations prior 1.37 0.69 2.69 0.37 2 donations prior 2.80 1.45 5.41 <0.001 3 donations prior 3.13 1.63 6.02 <0.001 4 donations prior 2.99 1.47 6.08 <0.001 5 donations prior 4.82 1.48 15.70 0.01
Previously deferred for low Hb 2.59 0.70 9.52 0.15
Return in Year 1 10.29 7.48 14.18 <0.001 N=1011 Log likelihood = -498.41 LR chi2(13) = 362.87 P<0.0001
69
The variables found to be significant predictors in the multivariable model were included in
the preliminary final model (see Table 19).
Table 19: Preliminary final model of return in Year 2, deferred group OR 95% CONF.
INTERVAL P
Age 0.02 <25 25-34 0.96 0.55 1.68 0.89 35-44 1.32 0.83 2.11 0.24 45-54 1.70 1.06 2.70 0.03 55-64 1.71 1.01 2.89 0.04 65+ 0.64 0.31 1.35 0.24
Recent attendance history <0.001
New donor 0 donations prior 1.66 0.68 4.05 0.27 1 donations prior 1.37 0.69 2.69 0.37 2 donations prior 2.87 1.49 5.54 0.002 3 donations prior 3.20 1.67 6.15 <0.001 4 donations prior 3.03 1.49 6.16 0.002 5 donations prior 5.25 1.61 17.13 0.006
Return in Year 1 10.34 7.51 14.23 <0.001 N=1011 Log likelihood = -499.54 LR chi2(12) = 360.60 P<0.0001
The goodness of fit test found that the estimates of the preliminary final model were not
significantly different to those of the observed data (Pearson chi2 (63) = 66.0, P= 0.37).
Prediction indices were calculated under the assumption that a predicted probability of >0.5
indicated a case, with the model found to have a sensitivity of 74.4%, a specificity of
79.4%, and PPV of 70.6%. An ROC curve was plotted (see Figure 5). The area under the
ROC curve was 0.83 (95% CI 0.80- 0.85), indicating excellent discrimination (Hosmer and
Lemeshow 2000).

70
Figure 5: Plot of sensitivity versus 1-specificity (ROC Curve)
0.00
0.25
0.50
0.75
1.00
Sen
sitiv
ity
0.00 0.25 0.50 0.75 1.001 - Specificity
Area under ROC curve = 0.8295
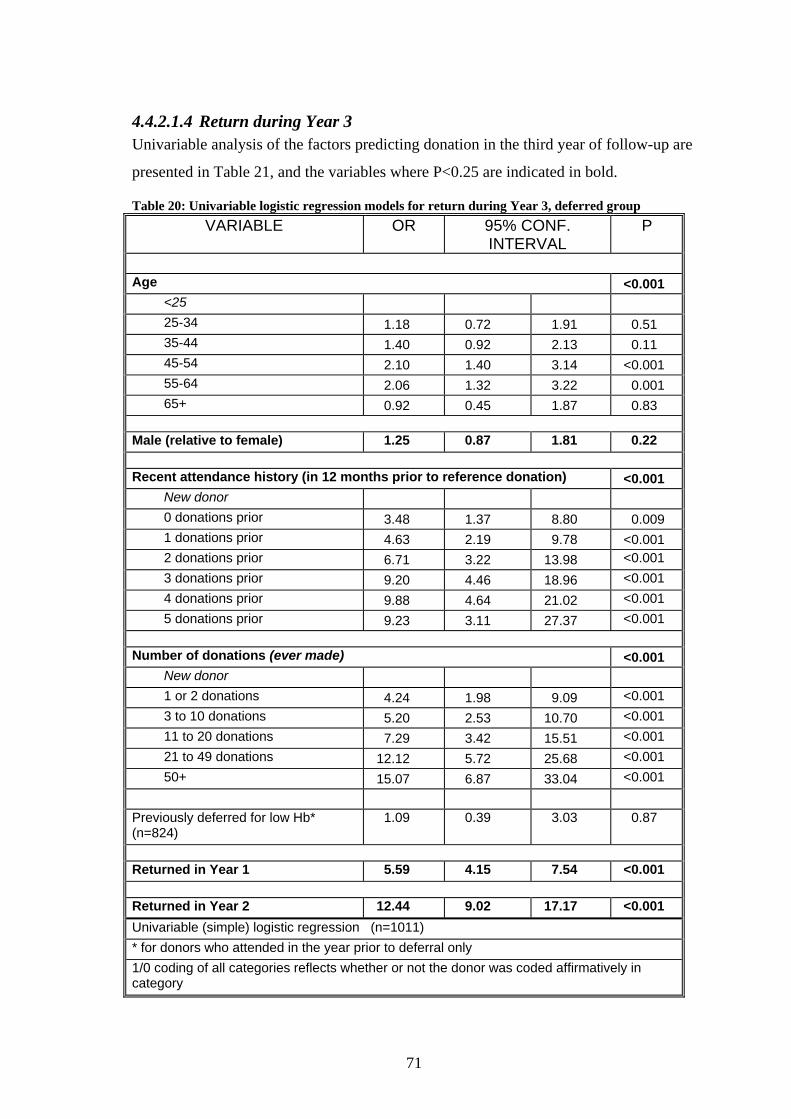
71
4.4.2.1.4 Return during Year 3 Univariable analysis of the factors predicting donation in the third year of follow-up are
presented in Table 21, and the variables where P<0.25 are indicated in bold.
Table 20: Univariable logistic regression models for return during Year 3, deferred group VARIABLE OR 95% CONF.
INTERVAL P
Age <0.001
<25 25-34 1.18 0.72 1.91 0.51 35-44 1.40 0.92 2.13 0.11 45-54 2.10 1.40 3.14 <0.001 55-64 2.06 1.32 3.22 0.001 65+ 0.92 0.45 1.87 0.83
Male (relative to female) 1.25 0.87 1.81 0.22
Recent attendance history (in 12 months prior to reference donation) <0.001 New donor 0 donations prior 3.48 1.37 8.80 0.009 1 donations prior 4.63 2.19 9.78 <0.001 2 donations prior 6.71 3.22 13.98 <0.001 3 donations prior 9.20 4.46 18.96 <0.001 4 donations prior 9.88 4.64 21.02 <0.001 5 donations prior 9.23 3.11 27.37 <0.001
Number of donations (ever made) <0.001
New donor 1 or 2 donations 4.24 1.98 9.09 <0.001 3 to 10 donations 5.20 2.53 10.70 <0.001 11 to 20 donations 7.29 3.42 15.51 <0.001 21 to 49 donations 12.12 5.72 25.68 <0.001 50+ 15.07 6.87 33.04 <0.001
Previously deferred for low Hb* (n=824)
1.09 0.39 3.03 0.87
Returned in Year 1 5.59 4.15 7.54 <0.001
Returned in Year 2 12.44 9.02 17.17 <0.001 Univariable (simple) logistic regression (n=1011) * for donors who attended in the year prior to deferral only 1/0 coding of all categories reflects whether or not the donor was coded affirmatively in category

72
The factors that were found to be significant at the P<0.25 level were included in a
multivariate model of return in Year 3. The results are shown in Table 21. Just three
variables were significant predictors of return in Year 3: a higher recent frequency (with the
main difference amongst those who gave between 2 and 4 donations), and whether the
donor returned in Year 1 or Year 2.
Table 21: Results of fitting multivariable model of return during Year 3, with significant univariable effects, deferred group
VARIABLE OR 95% CONF. INTERVAL
P
Age 0.60
<25 25-34 1.13 0.63 2.03 0.68 35-44 1.02 0.62 1.68 0.93 45-54 1.32 0.81 2.14 0.27 55-64 1.07 0.62 1.87 0.80 65+ 0.63 0.27 1.47 0.29
Male 1.21 0.76 1.94 0.42
Recent attendance history 0.02
New donor 0 donations prior 2.48 0.89 6.96 0.08 1 donations prior 3.26 1.44 7.37 0.05 2 donations prior 2.84 1.27 6.37 0.01 3 donations prior 3.89 1.75 8.64 0.001 4 donations prior 3.61 1.54 8.48 0.003 5 donations prior 2.06 0.60 7.05 0.25
Returned in Year 1 1.86 1.28 2.69 0.001
Returned in Year 2 8.20 5.68 11.85 <0.001 N=1011 Log likelihood = -464.87 LR chi2(14) = 323.02 P<0.0001
The variables found to be significant in the multivariable model were included in the
preliminary final model (see Table 22).

73
Table 22: First preliminary final model of return in Year 3, deferred group OR 95% CONF.
INTERVAL P
Recent attendance history 0.01 New donor 0 donations prior 2.69 0.97 7.50 0.06 1 donations prior 3.34 1.48 7.55 0.004 2 donations prior 2.97 1.33 6.63 0.008 3 donations prior 4.08 1.85 9.01 <0.001 4 donations prior 3.93 1.71 9.07 0.001 5 donations prior 2.37 0.71 7.98 0.16
Return in Year 1 1.85 1.28 2.68 0.001
Return in Year 2 8.30 5.77 11.94 <0.001 N=1011 Log likelihood = -466.91 LR chi2(8) = 318.95 P<0.0001
The goodness of fit test found that the estimates of the preliminary final model were
significantly different to those of the observed data (Pearson chi2 (18) = 31.27, P= 0.02).
Further diagnostic tests were not pursued as this model excluded factors known to predict
return during this period (demonstrated in the next section).

74
4.4.2.1.5 The effect of a subsequent deferral In order to determine whether another deferral during Year 1 decreased the likelihood of a
return in the subsequent years of follow-up, multivariable analysis was performed on the
factors predicting return in each of Year 2 and Year 3 amongst only donors who returned at
least once in Year 1. The results are presented in Table 23. Amongst donors who returned
during Year 1, return in Year 2 was significantly less likely if the donor was deferred for
low haemoglobin or for another reason (see highlighted items in table).
Table 23: Results of fitting multivariable model of return during Year 2, amongst donors returning in Year 1, deferred group
VARIABLE OR 95% CONF. INTERVAL
P
Age 0.03
<25 25-34 1.49 0.68 3.26 0.32 35-44 1.62 0.88 2.98 0.12 45-54 2.81 1.47 5.36 0.002 55-64 2.08 1.02 4.21 0.04 65+ 0.94 0.37 2.41 0.91
Recent attendance history 0.002
New donor 0 donations prior 0.39 0.10 1.61 0.20 1 donations prior 0.41 0.14 1.19 0.10 2 donations prior 1.02 0.36 2.90 0.98 3 donations prior 1.04 0.36 2.96 0.95 4 donations prior 1.15 0.38 3.49 0.80 5 donations prior 7.15 0.72 70.70 0.09
Previously deferred for low Hb 1.96 0.39 9.74 0.41
Hb deferral in Y1 0.51 0.32 0.79 0.003
Other deferral in Y2 0.29 0.15 0.58 <0.001
N=477 Log likelihood = -267.38 LR chi2(14) = 63.81 P<0.0001
To determine whether deferral during Year 1 of follow-up reduced the likelihood of return
beyond Year 2, multivariable analysis was performed on the factors predicting return in
Year 3 amongst donors who returned at least once in Year 1. The results are presented in
Table 24 and Table 25.
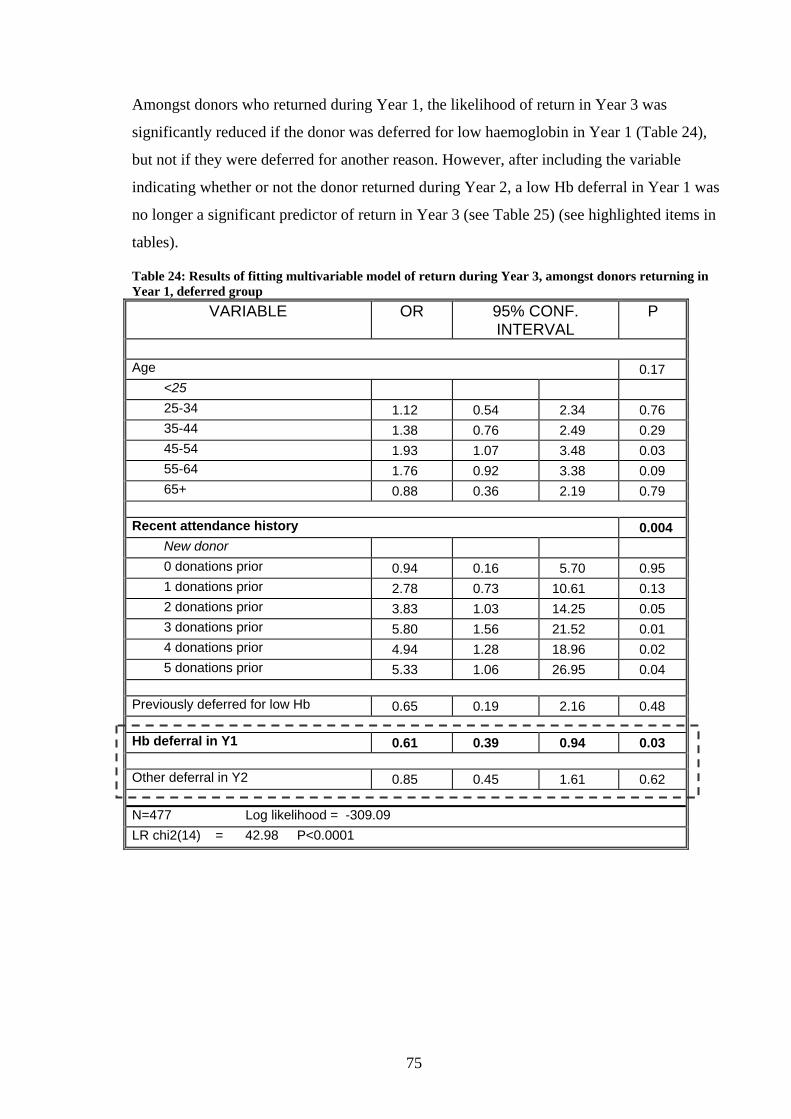
75
Amongst donors who returned during Year 1, the likelihood of return in Year 3 was
significantly reduced if the donor was deferred for low haemoglobin in Year 1 (Table 24),
but not if they were deferred for another reason. However, after including the variable
indicating whether or not the donor returned during Year 2, a low Hb deferral in Year 1 was
no longer a significant predictor of return in Year 3 (see Table 25) (see highlighted items in
tables).
Table 24: Results of fitting multivariable model of return during Year 3, amongst donors returning in Year 1, deferred group
VARIABLE OR 95% CONF. INTERVAL
P
Age 0.17
<25 25-34 1.12 0.54 2.34 0.76 35-44 1.38 0.76 2.49 0.29 45-54 1.93 1.07 3.48 0.03 55-64 1.76 0.92 3.38 0.09 65+ 0.88 0.36 2.19 0.79
Recent attendance history 0.004
New donor 0 donations prior 0.94 0.16 5.70 0.95 1 donations prior 2.78 0.73 10.61 0.13 2 donations prior 3.83 1.03 14.25 0.05 3 donations prior 5.80 1.56 21.52 0.01 4 donations prior 4.94 1.28 18.96 0.02 5 donations prior 5.33 1.06 26.95 0.04
Previously deferred for low Hb 0.65 0.19 2.16 0.48
Hb deferral in Y1 0.61 0.39 0.94 0.03
Other deferral in Y2 0.85 0.45 1.61 0.62
N=477 Log likelihood = -309.09 LR chi2(14) = 42.98 P<0.0001

76
Table 25: Results of fitting multivariable model of return during Year 3, amongst donors returning in Year 1, deferred group
VARIABLE OR 95% CONF. INTERVAL
P
Age 0.70
<25 25-34 0.97 0.44 2.12 0.93 35-44 1.19 0.63 2.25 0.59 45-54 1.48 0.79 2.78 0.22 55-64 1.45 0.72 2.92 0.30 65+ 0.91 0.35 2.41 0.85
Recent attendance history 0.01
New donor 0 donations prior 1.29 0.20 8.38 0.79 1 donations prior 4.47 1.11 18.01 0.04 2 donations prior 4.38 1.12 17.10 0.03 3 donations prior 6.99 1.80 27.22 0.01 4 donations prior 5.59 1.39 22.55 0.02 5 donations prior 4.42 0.84 23.26 0.08
Previously deferred for low Hb 0.53 0.15 1.85 0.32
Hb deferral in Y1 0.72 0.45 1.15 0.17
Other deferral in Y2 1.31 0.66 2.62 0.44
Returned in Y2 5.59 3.46 9.02 <0.001
N=477 Log likelihood = -275.42 LR chi2(20) = 110.31 P<0.0001
The analysis in this section shows that attending to give blood in any given year predicts
return in the next year, but also has an independent effect on return in later years. For
example, donation frequency prior to deferral increased the likelihood of giving blood in
each year of follow-up independent of its effect on return in the first year. Similarly,
returning in the first year of follow-up increased the likelihood of returning in the third
year, independent of the increased likelihood of return in the second year.
Being deferred for a low haemoglobin concentration again during the first year of follow-up
period significantly reduced the likelihood of returning during the second year, but

77
provided the donor could be encouraged to donate during this time, they were not less
likely to return in the third year.
Figure 6 is a diagram showing the factors found to predict return amongst deferred donors
in the final multivariable models. All associations are positive unless indicated otherwise.
Figure 6: Significant predictors of return in each year of follow-up in the deferred group
Return in Year 1
An older age
↑ donations in the year prior to deferral
Return in Year 2
Return in Year 3
- Deferred for low Hb Y1
Deferred for other Y1 -
If the donor returned in Y1

78
4.4.2.2 Factors predicting return in the comparison group
Analysis was performed on the factors predicting return during the entire follow-up period
in the comparison group. The results of the univariable analysis are shown in Table 26.
Table 26: Univariable logistic regression models for return during three year follow-up period, comparison group
VARIABLE OR 95% CONF. INTERVAL
P
Age <0.001
<25 25-34 1.10 1.03 1.17 0.004 35-44 2.12 1.98 2.27 <0.001 45-54 3.62 3.37 3.89 <0.001 55-64 5.33 4.89 5.81 <0.001 65+ 4.62 4.01 5.32 <0.001
Male (relative to female) 1.21 1.16 1.27 <0.001
Recent attendance history <0.001 New donor 0 donations prior 1.59 1.48 1.71 <0.001 1 donations prior 2.83 2.66 3.01 <0.001 2 donations prior 5.37 4.98 5.79 <0.001 3 donations prior 10.65 9.63 11.77 <0.001 4 donations prior 16.56 14.38 19.08 <0.001 5 donations prior 21.50 13.63 33.92 <0.001
Number of donations ever made <0.001
New donor 1 or 2 donations 2.00 1.88 2.13 <0.001 3 to 10 donations 3.30 3.11 3.51 <0.001 11 to 20 donations 5.67 5.18 6.19 <0.001 21 to 49 donations 10.55 9.54 11.65 <0.001 50+ 17.46 15.26 19.97 <0.001
Previously deferred for low Hb* (n=50288)
1.10 0.61 1.97 0.76
Univariable (simple) logistic regression (n=68675) * for donors who attended in the year prior to deferral only 1/0 coding of all categories reflects whether or not the donor was coded affirmatively in category

79
Factors found to be significant (P<0.25) in the univariable analysis were included in the
multivariable model of return amongst the comparison group. The estimates of the
multivariable model are shown in Table 14. Global P values for categorical predictors with
more than three levels (e.g. age) were estimated using likelihood-ratio tests. Age and recent
attendance history were significant predictors in this model.
Table 27: Results of fitting multivariable model of return during three year follow-up period, with significant univariable effects, comparison group
VARIABLE OR 95% CONF. INTERVAL
P
Age <0.001
<25 25-34 0.97 0.91 1.04 0.37 35-44 1.60 1.49 1.72 <0.001 45-54 2.27 2.10 2.44 <0.001 55-64 2.80 2.55 3.06 <0.001 65+ 2.05 1.77 2.38 <0.001
Male (relative to female) 1.00 0.95 1.04 0.86
Recent attendance history <0.001 New donor 0 donations prior 1.33 1.24 1.43 <0.001 1 donations prior 2.42 2.27 2.58 <0.001 2 donations prior 4.20 3.89 4.54 <0.001 3 donations prior 7.62 6.87 8.44 <0.001 4 donations prior 10.90 9.44 12.60 <0.001 5 donations prior 13.80 8.73 21.80 <0.001
Multivariable logistic regression N=68675 Log likelihood = -22684.96 LR chi2(12) = 6626.55 P<0.0001
The variables found to be significant predictors in the first multivariate model were
included in the preliminary final model, shown in Table 28.
Table 28: First preliminary model of return, comparison group VARIABLE OR 95% CONF.
INTERVAL P
Age <0.001
<25 25-34 0.97 0.91 1.04 0.37
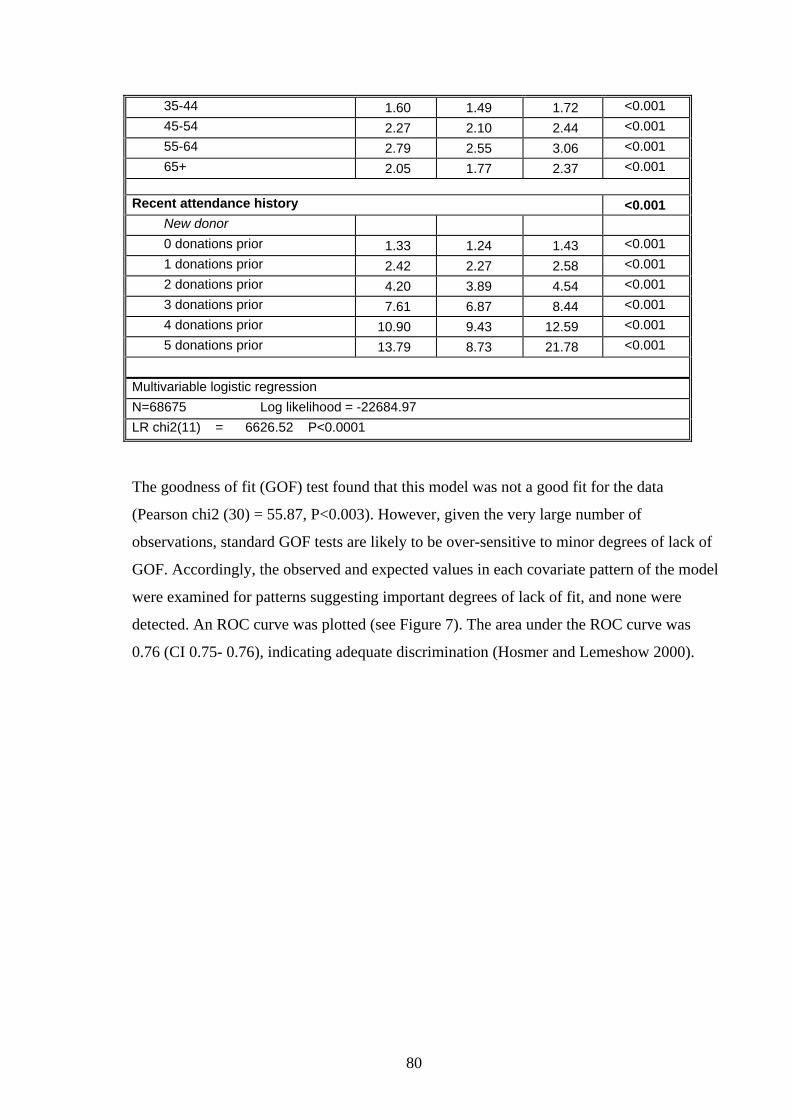
80
35-44 1.60 1.49 1.72 <0.001 45-54 2.27 2.10 2.44 <0.001 55-64 2.79 2.55 3.06 <0.001 65+ 2.05 1.77 2.37 <0.001
Recent attendance history <0.001
New donor 0 donations prior 1.33 1.24 1.43 <0.001 1 donations prior 2.42 2.27 2.58 <0.001 2 donations prior 4.20 3.89 4.54 <0.001 3 donations prior 7.61 6.87 8.44 <0.001 4 donations prior 10.90 9.43 12.59 <0.001 5 donations prior 13.79 8.73 21.78 <0.001
Multivariable logistic regression N=68675 Log likelihood = -22684.97 LR chi2(11) = 6626.52 P<0.0001
The goodness of fit (GOF) test found that this model was not a good fit for the data
(Pearson chi2 (30) = 55.87, P<0.003). However, given the very large number of
observations, standard GOF tests are likely to be over-sensitive to minor degrees of lack of
GOF. Accordingly, the observed and expected values in each covariate pattern of the model
were examined for patterns suggesting important degrees of lack of fit, and none were
detected. An ROC curve was plotted (see Figure 7). The area under the ROC curve was
0.76 (CI 0.75- 0.76), indicating adequate discrimination (Hosmer and Lemeshow 2000).

81
Figure 7: Plot of sensitivity versus 1-specificity (ROC Curve) Analysis of the factors predicting return in each year of follow-up was not pursued for the
comparison group.
4.4.2.3 Analysis of the difference in likelihood of return between deferred and non-deferred donors
Table 29 shows the proportion of each study group returning during the three year follow-
up period. Those who were deferred for low Hb were significantly less likely to return
(58.5% vs. 87.4%, P<0.001).
Table 29: Proportion returning to donate by group DEFERRED GROUP
(N=1,011) COMPARISON GROUP
(N=68,675) Donor return during follow-up? n % n %
Did not return 420 41.5 8,648 12.6 Returned 591 58.5 60,027 87.4
To investigate whether the likelihood of return differed between first time donors and
repeat donors, separate analysis was performed for these groups. As seen in Table 30 and
Table 31, donors were significantly less likely to return when deferred at their first donation
0.00
0.25
0.50
0.75
1.00
Sen
sitiv
ity
0.00 0.25 0.50 0.75 1.001 - Specificity
Area under ROC curve = 0.7588
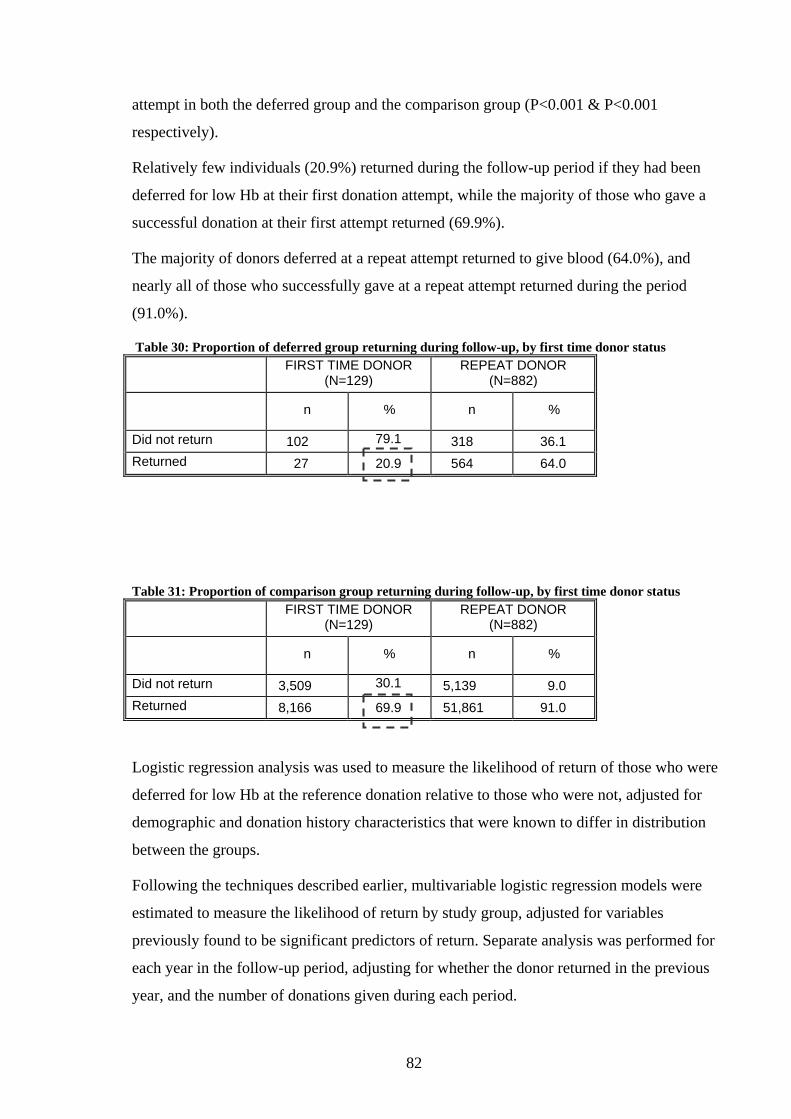
82
attempt in both the deferred group and the comparison group (P<0.001 & P<0.001
respectively).
Relatively few individuals (20.9%) returned during the follow-up period if they had been
deferred for low Hb at their first donation attempt, while the majority of those who gave a
successful donation at their first attempt returned (69.9%).
The majority of donors deferred at a repeat attempt returned to give blood (64.0%), and
nearly all of those who successfully gave at a repeat attempt returned during the period
(91.0%).
Table 30: Proportion of deferred group returning during follow-up, by first time donor status FIRST TIME DONOR
(N=129) REPEAT DONOR
(N=882)
n % n %
Did not return 102 79.1 318 36.1 Returned 27 20.9 564 64.0
Table 31: Proportion of comparison group returning during follow-up, by first time donor status FIRST TIME DONOR
(N=129) REPEAT DONOR
(N=882)
n % n %
Did not return 3,509 30.1 5,139 9.0 Returned 8,166 69.9 51,861 91.0
Logistic regression analysis was used to measure the likelihood of return of those who were
deferred for low Hb at the reference donation relative to those who were not, adjusted for
demographic and donation history characteristics that were known to differ in distribution
between the groups.
Following the techniques described earlier, multivariable logistic regression models were
estimated to measure the likelihood of return by study group, adjusted for variables
previously found to be significant predictors of return. Separate analysis was performed for
each year in the follow-up period, adjusting for whether the donor returned in the previous
year, and the number of donations given during each period.

83
The results of the model of return in Year 1 of follow-up are shown in Table 32. In the first
year of follow-up, those deferred for low Hb were significantly less likely to return, after
adjusting for demographic characteristics and donation history.
Table 32: Factors predicting return during Year 1, all donors VARIABLE OR 95% CONF.
INTERVAL P
Deferred group (relative to comparison group) 0.13 0.11 0.15 <0.001
Age <0.001
<25 25-34 0.96 0.90 1.03 0.24 35-44 1.60 1.49 1.71 <0.001 45-54 2.22 2.06 2.39 <0.001 55-64 2.72 2.49 2.97 <0.001 65+ 1.96 1.70 2.25 <0.001
Male (relative to female) 0.99 0.95 1.04 0.77
Recent attendance history <0.001
New donor 0 donations prior 1.35 1.26 1.45 <0.001 1 donations prior 2.45 2.31 2.61 <0.001 2 donations prior 4.28 3.96 4.62 <0.001 3 donations prior 7.45 6.75 8.22 <0.001 4 donations prior 10.32 9.01 11.81 <0.001 5 donations prior 12.61 8.40 18.91 <0.001
Previously deferred for low Hb 1.32 0.75 2.32 0.34 Multivariable logistic regression N=69686 Log likelihood = -23342.01 LR chi2(14) = 7200.99 P<0.0001
Multivariate analysis was also performed for the likelihood of return in Year 2 and Year 3
of follow-up, in the manner shown above (full tables not shown). The deferred group had a
significantly reduced likelihood of return in the subsequent years of follow-up relative to
the comparison group: Year 2 (OR 0.30 (CI 0.27-0.34), P<0.001); and Year 3 (OR 0.31 (CI
0.27- 0.35), P<0.001).
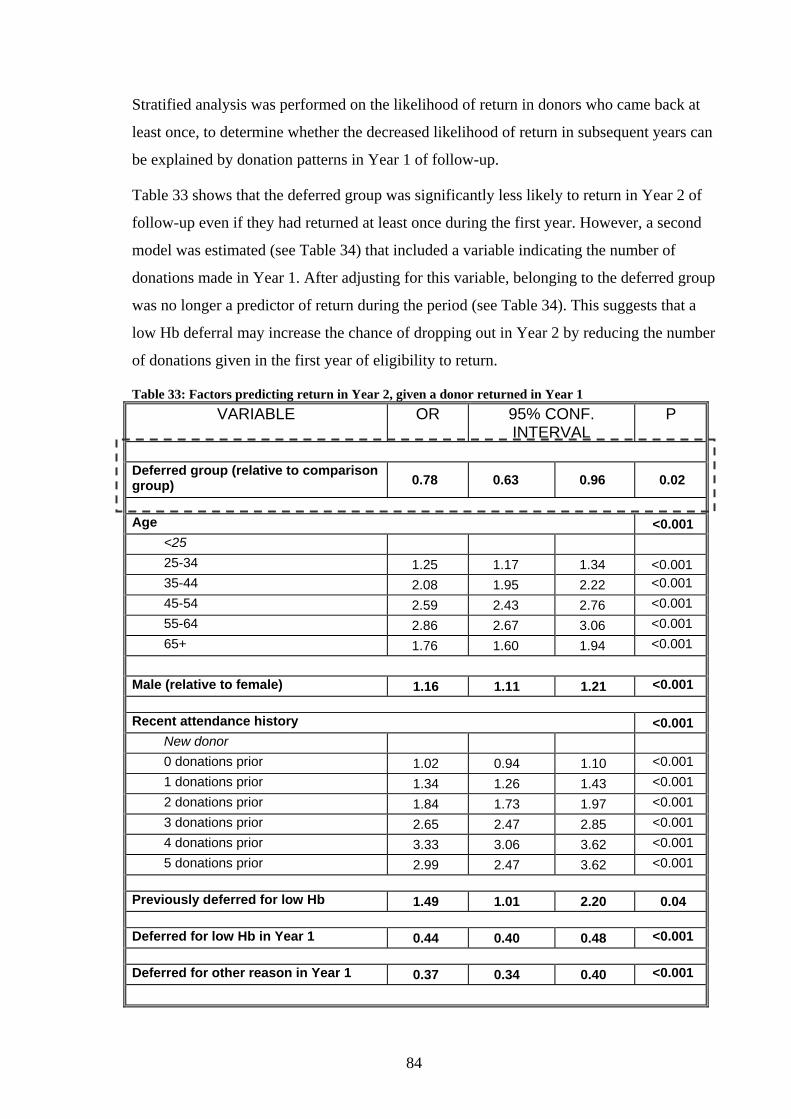
84
Stratified analysis was performed on the likelihood of return in donors who came back at
least once, to determine whether the decreased likelihood of return in subsequent years can
be explained by donation patterns in Year 1 of follow-up.
Table 33 shows that the deferred group was significantly less likely to return in Year 2 of
follow-up even if they had returned at least once during the first year. However, a second
model was estimated (see Table 34) that included a variable indicating the number of
donations made in Year 1. After adjusting for this variable, belonging to the deferred group
was no longer a predictor of return during the period (see Table 34). This suggests that a
low Hb deferral may increase the chance of dropping out in Year 2 by reducing the number
of donations given in the first year of eligibility to return.
Table 33: Factors predicting return in Year 2, given a donor returned in Year 1 VARIABLE OR 95% CONF.
INTERVAL P
Deferred group (relative to comparison group) 0.78 0.63 0.96 0.02
Age <0.001
<25 25-34 1.25 1.17 1.34 <0.001 35-44 2.08 1.95 2.22 <0.001 45-54 2.59 2.43 2.76 <0.001 55-64 2.86 2.67 3.06 <0.001 65+ 1.76 1.60 1.94 <0.001
Male (relative to female) 1.16 1.11 1.21 <0.001
Recent attendance history <0.001
New donor 0 donations prior 1.02 0.94 1.10 <0.001 1 donations prior 1.34 1.26 1.43 <0.001 2 donations prior 1.84 1.73 1.97 <0.001 3 donations prior 2.65 2.47 2.85 <0.001 4 donations prior 3.33 3.06 3.62 <0.001 5 donations prior 2.99 2.47 3.62 <0.001
Previously deferred for low Hb 1.49 1.01 2.20 0.04
Deferred for low Hb in Year 1 0.44 0.40 0.48 <0.001
Deferred for other reason in Year 1 0.37 0.34 0.40 <0.001

85
Multivariable logistic regression N=56042 Log likelihood = -29354.92 LR chi2(16) = 5289.61 P<0.0001
Table 34: Factors predicting return in Year 2, given a donor returned in Year 1, adjusting for number of donations given in Year 1
VARIABLE OR 95% CONF. INTERVAL
P
Deferred group (relative to comparison group) 1.18 0.95 1.47 0.13
Age <0.001
<25 25-34 1.20 1.11 1.28 <0.001 35-44 1.83 1.71 1.96 <0.001 45-54 2.08 1.95 2.23 <0.001 55-64 2.15 2.00 2.31 <0.001 65+ 1.27 1.14 1.40 <0.001
Male (relative to female) 1.07 1.02 1.12 <0.001
Recent attendance history <0.001
New donor 0 donations prior 1.16 1.06 1.26 0.001 1 donations prior 1.35 1.26 1.44 <0.001 2 donations prior 1.59 1.48 1.71 <0.001 3 donations prior 1.79 1.66 1.93 <0.001 4 donations prior 1.59 1.45 1.74 <0.001 5 donations prior 0.82 0.66 1.02 0.08
Previously deferred for low Hb 1.40 0.93 2.12 0.11
Deferred for low Hb in Year 1 0.40 0.37 0.44 <0.001
Deferred for other reason in Year 1 0.29 0.26 0.31 <0.001
Number of donations in Year1 2.03 1.99 2.07 <0.001 Multivariable logistic regression N=56042 Log likelihood = -26248.87 LR chi2(17) = 11501.70 P<0.0001

86
Multivariable models were estimated for the likelihood of return in Year 3, for donors who
gave at least once in Year 2 and Year 3. Return was less likely in Year 3 of the follow-up
period amongst those deferred for low Hb at the reference donation, after adjusting for the
number of donations made in Year 1 and Year 2, and for deferrals during those years (see
Table 35).
Table 35: Logistic regression of likelihood of return in Year 3, given return in Year 1 & Year 2, adjusting for number of donations given in each year
VARIABLE OR 95% CONF. INTERVAL
P
Deferred group (relative to comparison group) 0.62 0.48 0.81 <0.001
Age <0.001
<25 25-34 1.19 1.08 1.31 <0.001 35-44 1.69 1.55 1.85 <0.001 45-54 2.01 1.84 2.18 <0.001 55-64 1.98 1.81 2.17 <0.001 65+ 1.24 1.10 1.41 0.001
Male (relative to female) 1.07 1.02 1.13 0.01 Recent attendance history <0.001
New donor 0 donations prior 1.28 1.14 1.43 <0.001 1 donations prior 1.39 1.27 1.52 <0.001 2 donations prior 1.64 1.50 1.80 <0.001 3 donations prior 1.81 1.65 1.99 <0.001 4 donations prior 1.71 1.53 1.91 <0.001 5 donations prior 1.43 1.11 1.85 0.01
Previously deferred for low Hb 1.33 0.83 2.15 0.24
Deferred for low Hb in Year 1 1.25 1.10 1.42 <0.001
Deferred for other reason in Year 1 1.02 0.90 1.16 0.75
Number of donations in Year 1 1.04 1.02 1.06 0.001
Deferred for low Hb in Year 2 0.31 0.27 0.34 <0.001
Deferred for other reason in Year 2 0.20 0.18 0.22 <0.001
Number of donations in Year 2 1.96 1.91 2.01 <0.001

87
Multivariable logistic regression N=41581 Log likelihood = -17902.07 LR chi2(20) = 7271.70 P<0.0001
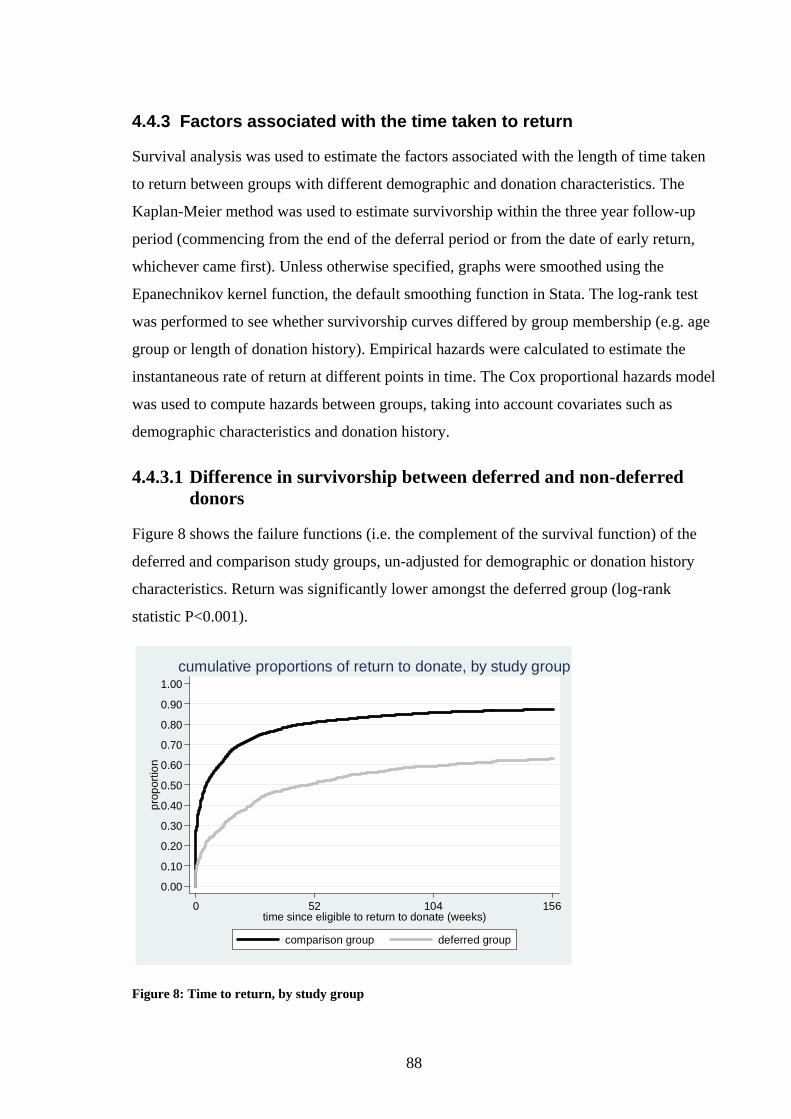
88
4.4.3 Factors associated with the time taken to return
Survival analysis was used to estimate the factors associated with the length of time taken
to return between groups with different demographic and donation characteristics. The
Kaplan-Meier method was used to estimate survivorship within the three year follow-up
period (commencing from the end of the deferral period or from the date of early return,
whichever came first). Unless otherwise specified, graphs were smoothed using the
Epanechnikov kernel function, the default smoothing function in Stata. The log-rank test
was performed to see whether survivorship curves differed by group membership (e.g. age
group or length of donation history). Empirical hazards were calculated to estimate the
instantaneous rate of return at different points in time. The Cox proportional hazards model
was used to compute hazards between groups, taking into account covariates such as
demographic characteristics and donation history.
4.4.3.1 Difference in survivorship between deferred and non-deferred donors
Figure 8 shows the failure functions (i.e. the complement of the survival function) of the
deferred and comparison study groups, un-adjusted for demographic or donation history
characteristics. Return was significantly lower amongst the deferred group (log-rank
statistic P<0.001).
Figure 8: Time to return, by study group
0.00
0.10
0.20
0.30
0.40
0.50
0.60
0.70
0.80
0.90
1.00
prop
ortio
n
0 52 104 156time since eligible to return to donate (weeks)
comparison group deferred group
cumulative proportions of return to donate, by study group

89
For donors who did return during the follow-up period, the median time to first return was
13.2 weeks (interquartile range 2.2- 38.2 weeks) for the deferred group, and 2.7 weeks
(interquartile range 0.0- 14.4 weeks) for the comparison group.
Figure 9 shows the hazard estimates for return over the three year follow-up period,
smoothed over the entire three year period (using Epanechnikov kernel function, the default
smoothing function in Stata) This graph shows that the rate of returning to donate is
greatest at approximately week 9 for the comparison group, and week 13 for the deferred
group (shown by the first and second lines, respectively).
Figure 9: Hazard estimates smoothed over the three year follow-up period
Figure 10 also shows the rate of returning to donate, but smoothed to show return week by
week (by specifying a narrower kernel function). The vertical lines indicate twelve week
intervals, which are the points at which donors were invited by letter to return to donate.
For the deferred donors, rate of return is highest within the first week of being eligible to
donate, dropping quickly until increasing again at approximately week 10, then dropping
again until approximately week 20, and then falling to a steady, low rate of return after
approximately 36 weeks (approximately 9 months). For the comparison donors, rate of
return is also highest within the first week of being eligible to donate, followed by a steady
decrease until a small rise in return before week 12 (the first vertical line), then again at
week 36, and finally dropping to a steady, low rate of return after approximately 50 weeks.
0
.01
.02
.03
.04
0 52 104 156time since eligible to return to donate (weeks)
comparison group deferred group
smoothed hazard estimates- over 3 years

90
Figure 10: Hazard estimates smoothed to show hazard each week
Given that the distribution of demographic characteristics and donation history variables
were known to differ between study groups, Cox proportional hazard models were used to
compare hazards adjusted for these factors. The results are shown in Table 36. The deferred
group had a significantly reduced hazard relative to the comparison group, after adjusting
for other variables.
Table 36: First preliminary final model of hazard ratio VARIABLE HAZ.
RATIO 95% CONF. INTERVAL
P
Deferred group (relative to comparison group) 0.37 0.34 0.40 <0.001
Age <0.001
<25 25-34 1.02 0.99 1.05 0.32 35-44 1.25 1.21 1.28 <0.001 45-54 1.40 1.37 1.44 <0.001 55-64 1.54 1.50 1.58 <0.001 65+ 1.55 1.49 1.61 <0.001
Male (relative to female) 1.02 1.00 1.04 0.02
Recent attendance history (in 12 months prior to reference donation) <0.001
0
.05
.1
.15
0 52 104 156time since eligible to return to donate (weeks)
comparison group deferred group
smoothed hazard estimates- week by week
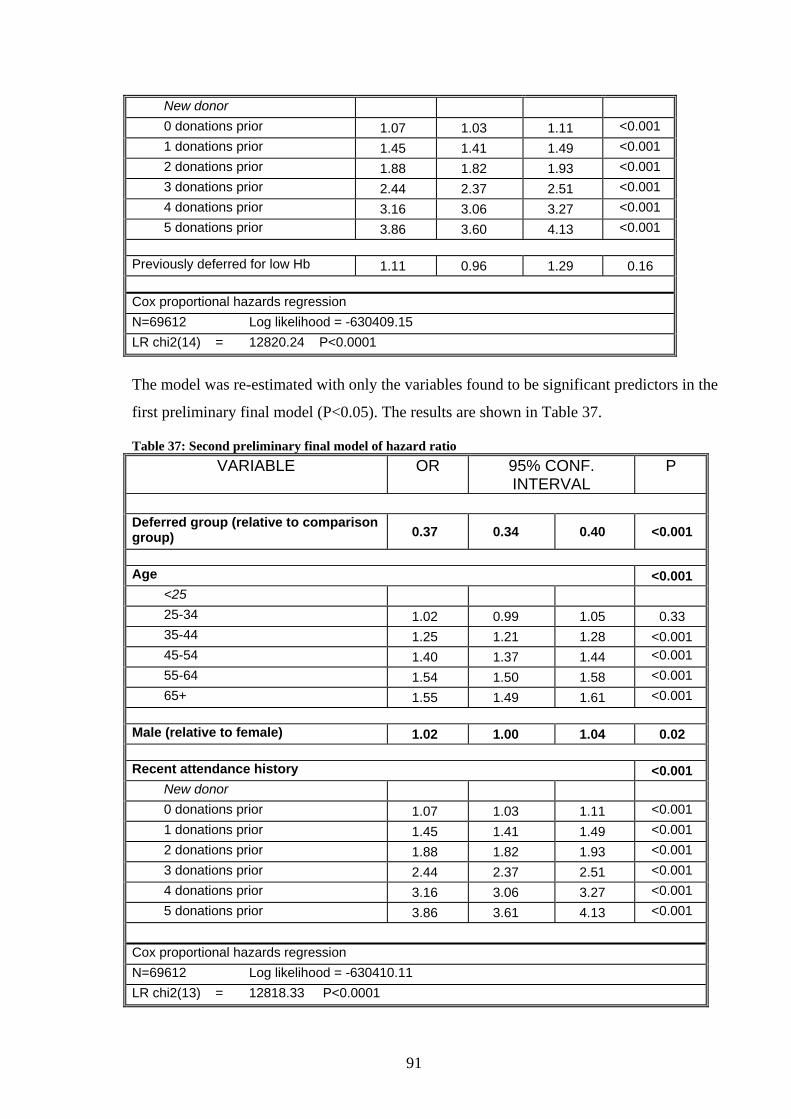
91
New donor 0 donations prior 1.07 1.03 1.11 <0.001 1 donations prior 1.45 1.41 1.49 <0.001 2 donations prior 1.88 1.82 1.93 <0.001 3 donations prior 2.44 2.37 2.51 <0.001 4 donations prior 3.16 3.06 3.27 <0.001 5 donations prior 3.86 3.60 4.13 <0.001
Previously deferred for low Hb 1.11 0.96 1.29 0.16
Cox proportional hazards regression N=69612 Log likelihood = -630409.15 LR chi2(14) = 12820.24 P<0.0001
The model was re-estimated with only the variables found to be significant predictors in the
first preliminary final model (P<0.05). The results are shown in Table 37.
Table 37: Second preliminary final model of hazard ratio VARIABLE OR 95% CONF.
INTERVAL P
Deferred group (relative to comparison group) 0.37 0.34 0.40 <0.001
Age <0.001
<25 25-34 1.02 0.99 1.05 0.33 35-44 1.25 1.21 1.28 <0.001 45-54 1.40 1.37 1.44 <0.001 55-64 1.54 1.50 1.58 <0.001 65+ 1.55 1.49 1.61 <0.001
Male (relative to female) 1.02 1.00 1.04 0.02
Recent attendance history <0.001 New donor 0 donations prior 1.07 1.03 1.11 <0.001 1 donations prior 1.45 1.41 1.49 <0.001 2 donations prior 1.88 1.82 1.93 <0.001 3 donations prior 2.44 2.37 2.51 <0.001 4 donations prior 3.16 3.06 3.27 <0.001 5 donations prior 3.86 3.61 4.13 <0.001
Cox proportional hazards regression N=69612 Log likelihood = -630410.11 LR chi2(13) = 12818.33 P<0.0001
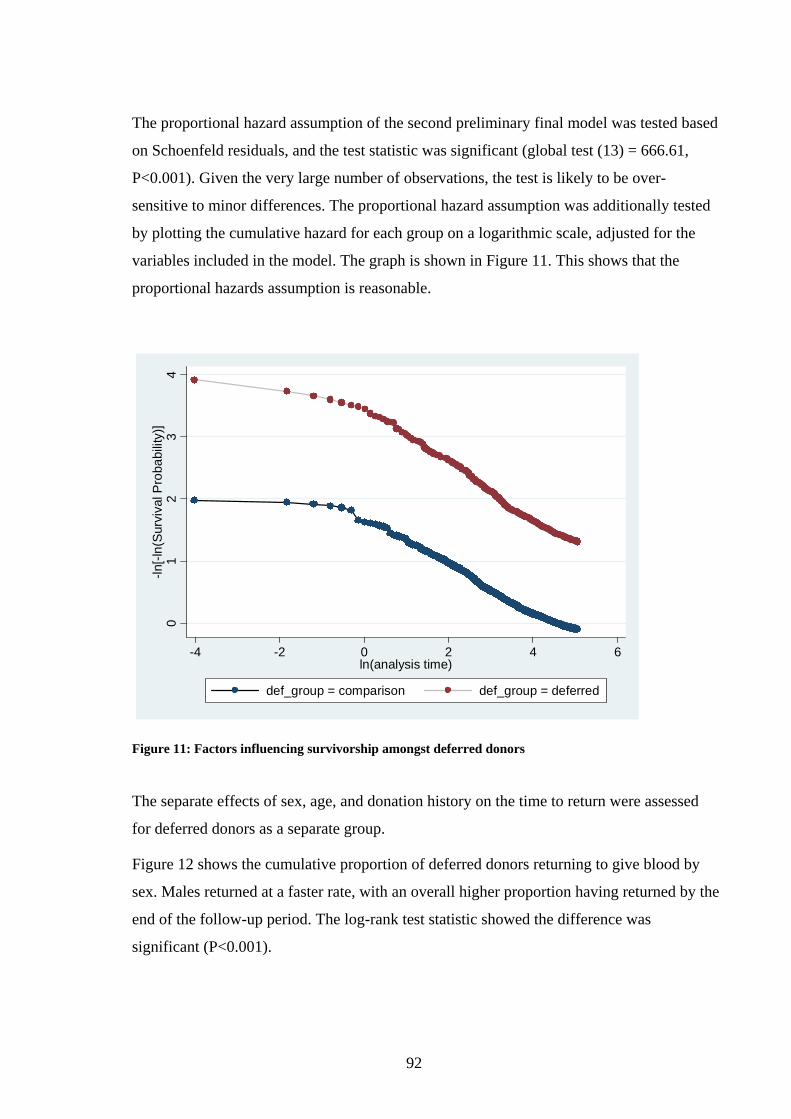
92
The proportional hazard assumption of the second preliminary final model was tested based
on Schoenfeld residuals, and the test statistic was significant (global test (13) = 666.61,
P<0.001). Given the very large number of observations, the test is likely to be over-
sensitive to minor differences. The proportional hazard assumption was additionally tested
by plotting the cumulative hazard for each group on a logarithmic scale, adjusted for the
variables included in the model. The graph is shown in Figure 11. This shows that the
proportional hazards assumption is reasonable.
Figure 11: Factors influencing survivorship amongst deferred donors
The separate effects of sex, age, and donation history on the time to return were assessed
for deferred donors as a separate group.
Figure 12 shows the cumulative proportion of deferred donors returning to give blood by
sex. Males returned at a faster rate, with an overall higher proportion having returned by the
end of the follow-up period. The log-rank test statistic showed the difference was
significant (P<0.001).
01
23
4-ln
[-ln(
Sur
viva
l Pro
babi
lity)
]
-4 -2 0 2 4 6ln(analysis time)
def_group = comparison def_group = deferred

93
Figure 12: Time to return for low Hb deferred donors, by sex
Figure 13 and Figure 14 show the hazard estimates for deferred donors by sex, firstly
smoothed to show the rate of return over the whole three year follow-up, and then to show
the rate of return week by week. The Cox proportional hazard model estimated a hazard
ratio of 1.38 (95% CI 1.11- 1.72, P=0.004), for males relative to females, but the
proportional hazards assumption was violated (proportional hazard test P=0.01), as easily
seen in Figure 13. Accordingly, amongst the deferred, it would be more appropriate to base
interpretations on sub-group analysis. Males appear more than twice as likely to return in
the first weeks of being eligible to do so, while after 30 weeks (indicated by the vertical
line), female donors who had yet to return were more likely to come back than males who
had not yet returned.
0.00
0.10
0.20
0.30
0.40
0.50
0.60
0.70
0.80
0.90
1.00
0 52 104 156time since eligible to return to donate (weeks)
females males
for deferred donors, by sexcumulative proportions of return to donation

94
Figure 13: Hazard estimates smoothed over the three year follow-up period, by sex
Figure 14: Hazard estimates smoothed week by week, by sex
To compare whether the rate of return followed similar patterns in males and females who
were not deferred, the hazard estimates of the comparison group were plotted, and are
shown in Figure 15 and Figure 16. These graphs show that males initially returned at a
0.0
1.0
2.0
3
0 52 104 156time since eligible to return to donate (weeks)
females males
for deferred donors, by sexsmoothed hazard estimates- over 3 years
0.0
2.0
4.0
6.0
8.1
0 52 104 156time since eligible to return to donate (weeks)
females males
for deferred donors, by sexsmoothed hazard estimates- week by week

95
faster rate than females; however the hazard estimates remained similar over the remaining
follow-up period.
Figure 15: Hazard estimates smoothed over the three year follow-up period, by sex (comparison group)
Figure 16: Hazard estimates smoothed week by week, by sex (comparison group)
Age was significantly associated with the time taken to first return in deferred donors (log-
rank statistic, P=0.002). As shown in Figure 17, the older age groups had the highest return
0.0
1.0
2.0
3.0
4
0 52 104 156time since eligible to return to donate (weeks)
females males
for comparison group, by sexsmoothed hazard estimates- over 3 years
0.0
5.1
.15
0 52 104 156time since eligible to return to donate (weeks)
females males
for comparison group, by sexsmoothed hazard estimates- week by week

96
in the initial months following eligibility to return, while the youngest age groups were the
slowest group to return at every time period.
Figure 17: Time to return for low Hb deferred donors, by age
Figure 18 shows hazard estimates for return by age smoothed over the whole three year
follow-up period. Donors in the oldest age groups had higher rates of return than younger
donors in the first few months of being eligible to return. A plot of the hazard estimates
smoothed for week by week return is not shown here, as the number of lines makes
interpretation difficult.
Cox proportional hazards regression estimated a significantly higher hazard ratio for those
in older age groups (aged over 35) relative to those in the youngest age groups (see Table
38) while the hazard functions were not significantly different in the other age groups. The
proportional hazard assumption was met (proportional hazard test P= 0.08).
0.000.100.200.300.400.500.600.700.800.901.00
0 52 104 156time since eligible to return to donate (weeks)
<18 18-2425-34 35-4445-54 55-6465+
for deferred donors, by agecumulative proportions of return to donation
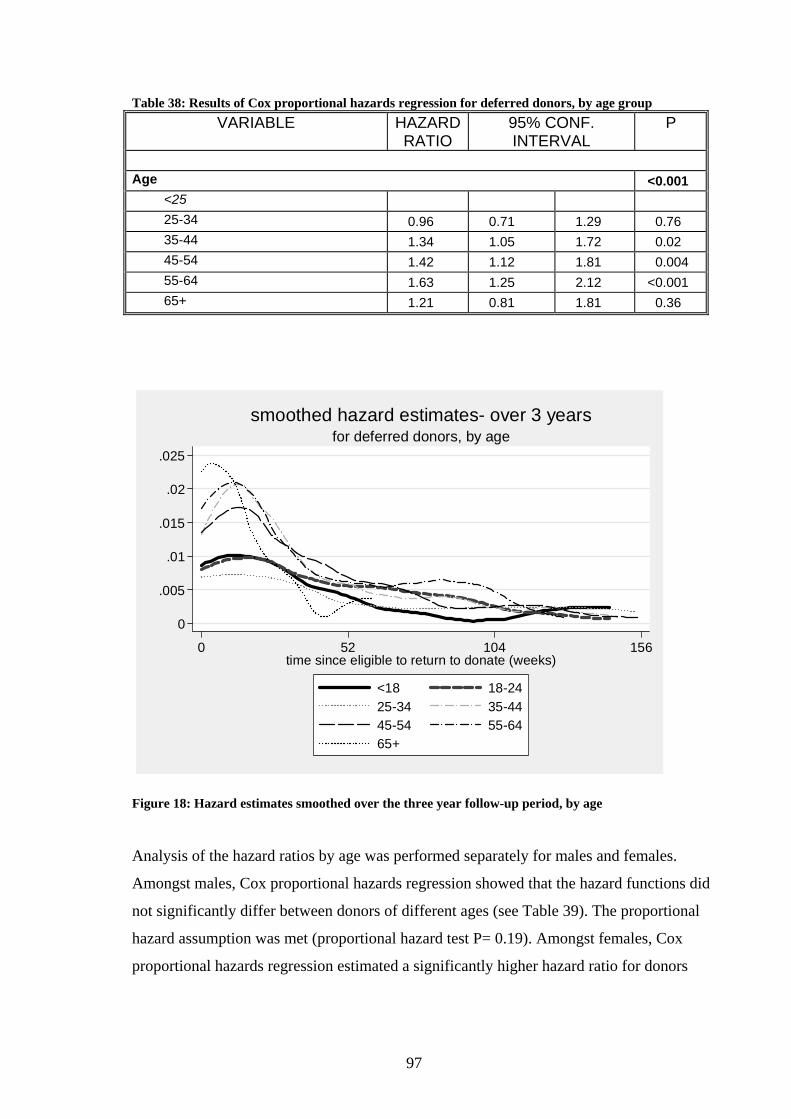
97
Table 38: Results of Cox proportional hazards regression for deferred donors, by age group VARIABLE HAZARD
RATIO 95% CONF. INTERVAL
P
Age <0.001
<25 25-34 0.96 0.71 1.29 0.76 35-44 1.34 1.05 1.72 0.02 45-54 1.42 1.12 1.81 0.004 55-64 1.63 1.25 2.12 <0.001 65+ 1.21 0.81 1.81 0.36
Figure 18: Hazard estimates smoothed over the three year follow-up period, by age
Analysis of the hazard ratios by age was performed separately for males and females.
Amongst males, Cox proportional hazards regression showed that the hazard functions did
not significantly differ between donors of different ages (see Table 39). The proportional
hazard assumption was met (proportional hazard test P= 0.19). Amongst females, Cox
proportional hazards regression estimated a significantly higher hazard ratio for donors
0
.005
.01
.015
.02
.025
0 52 104 156time since eligible to return to donate (weeks)
<18 18-2425-34 35-4445-54 55-6465+
for deferred donors, by agesmoothed hazard estimates- over 3 years

98
aged 35 to 64 relative to the youngest and oldest age groups (see Table 40). The
proportional hazard assumption was met (proportional hazard test P= 0.58).
Table 39: Results of Cox proportional hazards regression for deferred donors, by age group, for males VARIABLE HAZARD
RATIO 95% CONF. INTERVAL
P
Age 0.83
<25 25-34 1.35 0.55 3.31 0.52 35-44 1.65 0.65 4.20 0.29 45-54 1.16 0.54 2.52 0.70 55-64 1.45 0.71 2.95 0.30 65+ 1.53 0.68 3.40 0.30
Table 40: Results of Cox proportional hazards regression for deferred donors, by age group, for females
VARIABLE HAZARD RATIO
95% CONF. INTERVAL
P
Age 0.001
<25 25-34 0.91 0.66 1.24 0.54 35-44 1.34 1.04 1.73 0.03 45-54 1.45 1.13 1.87 0.004 55-64 1.58 1.17 2.14 0.003 65+ 0.89 0.51 1.55 0.68
Hazard estimates were plotted for return by age amongst the comparison group, but the
distributions did not vary much from the graph of the deferred group, and are not shown
here. Further analysis of the survivorship of the comparison group is not presented here.

99
Individuals deferred for low Hb at their first donation attempt were significantly slower to
return than those deferred at a repeat attempt (log-rank statistic P<0.001, see Figure 19).
Figure 19: Time to return for low Hb deferred donors, by new donor status
Figure 20 shows the highest rate of return for donors deferred at a repeat attempt is at
around 13 weeks (approximately three months, shown with the first red line), while first
time donors had the greatest rate of return between 13 and 24 weeks, or approximately
three to six months, shown between the two vertical lines. Hazard estimates smoothed to
show return week by week, displayed in Figure 21, shows that the hazard function for first
time donors follows a similar pattern, albeit always lower, to that of repeat donors.
Cox proportional hazards regression estimated a hazard ratio of 0.26 (CI 0.18- 0.38,
P<0.001) for new donors, relative to repeat donors. The proportional hazard requirement
for this model was met (proportional hazard test P= 0.47). Separate analysis for both males
and females found new donors in both groups were significantly less likely to return. Male
new donors had a hazard ratio of 0.13 (CI 0.02- 0.99, P=0.049) relative to repeat donors,
and female new donors had a hazard ratio of 0.28 (CI 0.19- 0.41, P<0.001) relative to
repeat donors.
0.00
0.100.20
0.30
0.400.50
0.60
0.700.80
0.901.00
0 52 104 156time since eligible to return to donate (weeks)
repeat first time
for deferred donors, by new donor statuscumulative proportions of return to donation
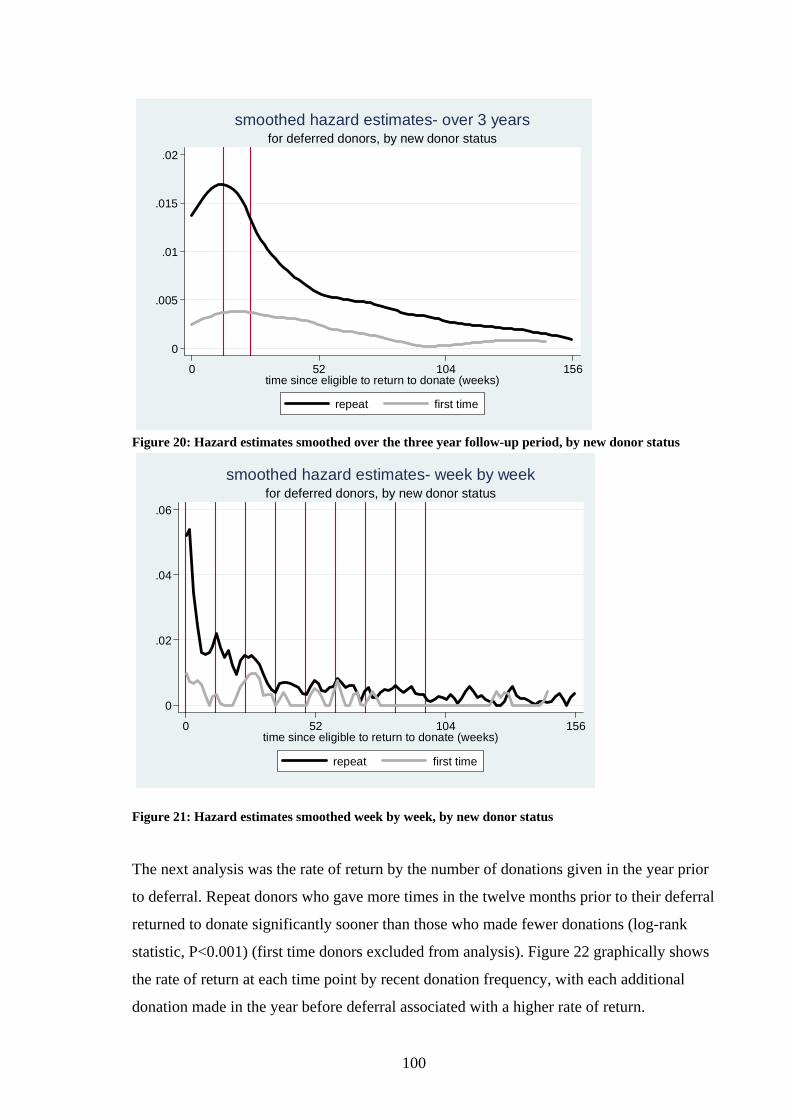
100
Figure 20: Hazard estimates smoothed over the three year follow-up period, by new donor status
Figure 21: Hazard estimates smoothed week by week, by new donor status
The next analysis was the rate of return by the number of donations given in the year prior
to deferral. Repeat donors who gave more times in the twelve months prior to their deferral
returned to donate significantly sooner than those who made fewer donations (log-rank
statistic, P<0.001) (first time donors excluded from analysis). Figure 22 graphically shows
the rate of return at each time point by recent donation frequency, with each additional
donation made in the year before deferral associated with a higher rate of return.
0
.005
.01
.015
.02
0 52 104 156time since eligible to return to donate (weeks)
repeat first time
for deferred donors, by new donor statussmoothed hazard estimates- over 3 years
0
.02
.04
.06
0 52 104 156time since eligible to return to donate (weeks)
repeat first time
for deferred donors, by new donor statussmoothed hazard estimates- week by week
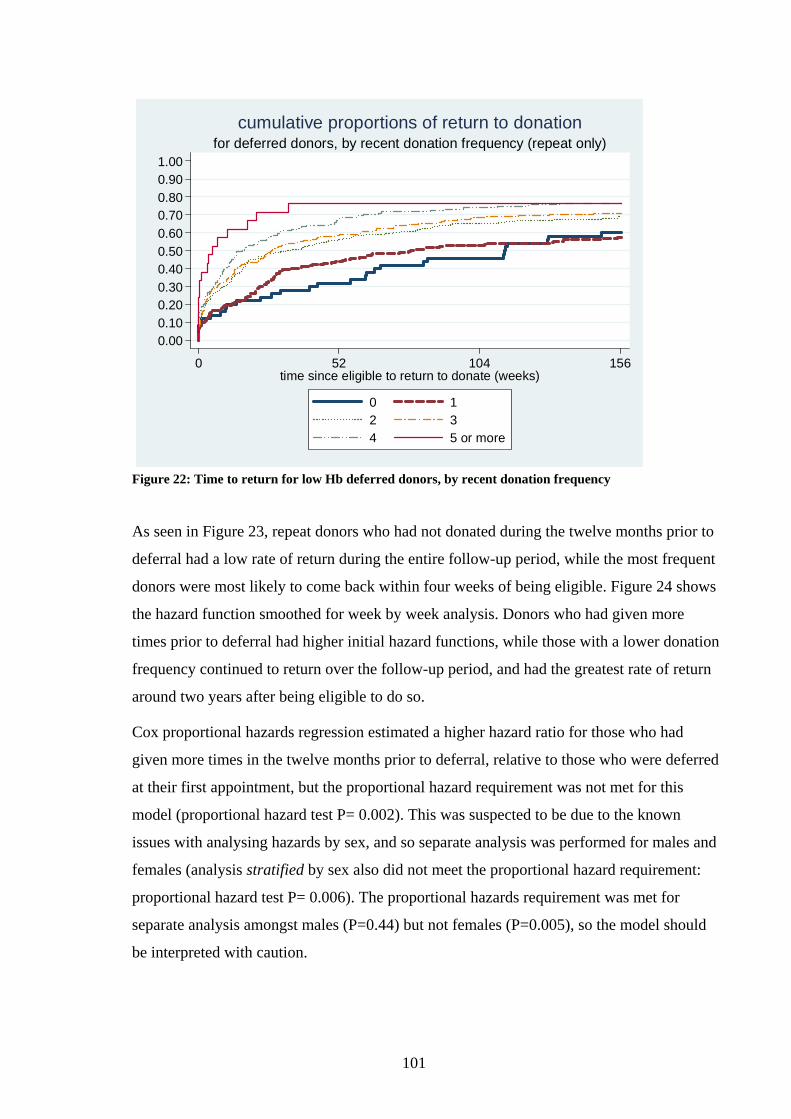
101
Figure 22: Time to return for low Hb deferred donors, by recent donation frequency
As seen in Figure 23, repeat donors who had not donated during the twelve months prior to
deferral had a low rate of return during the entire follow-up period, while the most frequent
donors were most likely to come back within four weeks of being eligible. Figure 24 shows
the hazard function smoothed for week by week analysis. Donors who had given more
times prior to deferral had higher initial hazard functions, while those with a lower donation
frequency continued to return over the follow-up period, and had the greatest rate of return
around two years after being eligible to do so.
Cox proportional hazards regression estimated a higher hazard ratio for those who had
given more times in the twelve months prior to deferral, relative to those who were deferred
at their first appointment, but the proportional hazard requirement was not met for this
model (proportional hazard test P= 0.002). This was suspected to be due to the known
issues with analysing hazards by sex, and so separate analysis was performed for males and
females (analysis stratified by sex also did not meet the proportional hazard requirement:
proportional hazard test P= 0.006). The proportional hazards requirement was met for
separate analysis amongst males (P=0.44) but not females (P=0.005), so the model should
be interpreted with caution.
0.000.100.200.300.400.500.600.700.800.901.00
0 52 104 156time since eligible to return to donate (weeks)
0 12 34 5 or more
for deferred donors, by recent donation frequency (repeat only)cumulative proportions of return to donation
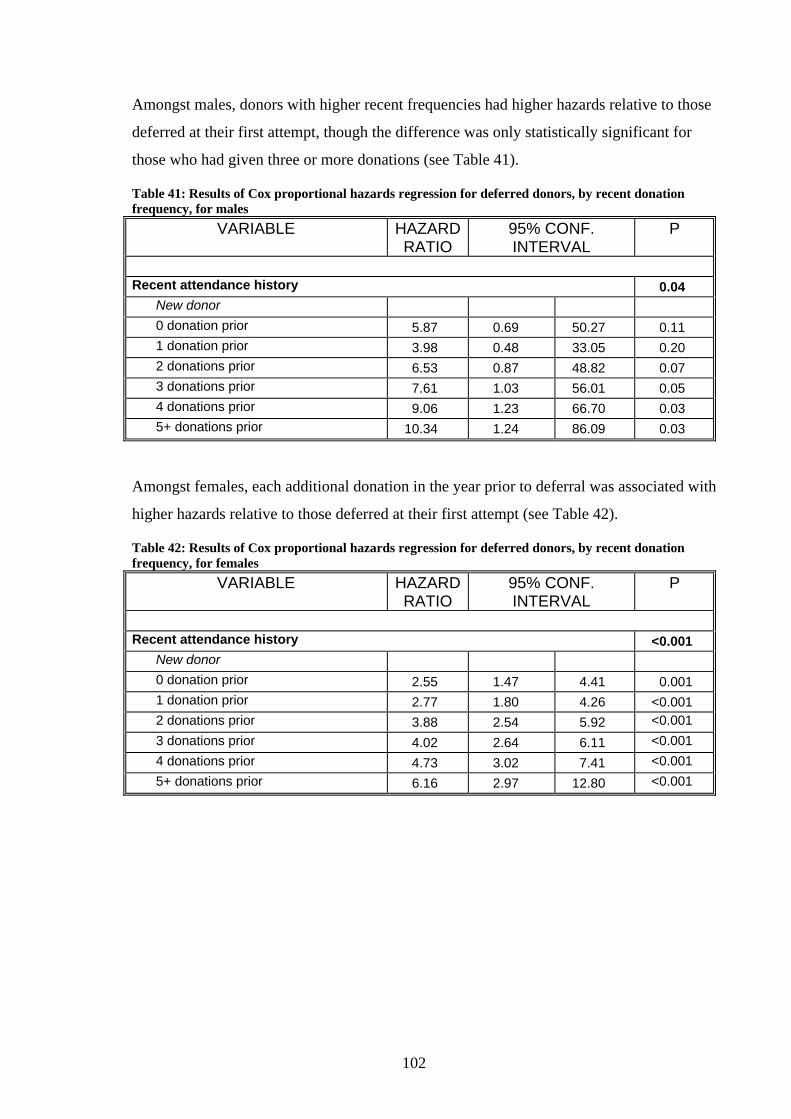
102
Amongst males, donors with higher recent frequencies had higher hazards relative to those
deferred at their first attempt, though the difference was only statistically significant for
those who had given three or more donations (see Table 41).
Table 41: Results of Cox proportional hazards regression for deferred donors, by recent donation frequency, for males
VARIABLE HAZARD RATIO
95% CONF. INTERVAL
P
Recent attendance history 0.04
New donor 0 donation prior 5.87 0.69 50.27 0.11 1 donation prior 3.98 0.48 33.05 0.20 2 donations prior 6.53 0.87 48.82 0.07 3 donations prior 7.61 1.03 56.01 0.05 4 donations prior 9.06 1.23 66.70 0.03 5+ donations prior 10.34 1.24 86.09 0.03
Amongst females, each additional donation in the year prior to deferral was associated with
higher hazards relative to those deferred at their first attempt (see Table 42).
Table 42: Results of Cox proportional hazards regression for deferred donors, by recent donation frequency, for females
VARIABLE HAZARD RATIO
95% CONF. INTERVAL
P
Recent attendance history <0.001
New donor 0 donation prior 2.55 1.47 4.41 0.001 1 donation prior 2.77 1.80 4.26 <0.001 2 donations prior 3.88 2.54 5.92 <0.001 3 donations prior 4.02 2.64 6.11 <0.001 4 donations prior 4.73 3.02 7.41 <0.001 5+ donations prior 6.16 2.97 12.80 <0.001

103
Figure 23: Hazard estimates smoothed over the three year follow-up period, by recent donation frequency
Figure 24: Hazard estimates smoothed week by week, by recent donation frequency
0
.01
.02
.03
.04
.05
0 52 104 156time since eligible to return to donate (weeks)
0 12 34 5 or more
for deferred donors, by recent donation frequency (repeat only)smoothed hazard estimates- over 3 years
0
.01
.02
.03
.04
.05
0 52 104 156time since eligible to return to donate (weeks)
0 12 34 5 or more
for deferred donors, by recent donation frequency (repeat only)smoothed hazard estimates- week by week

104
Finally, the survival functions of deferred donors with different lengths of donation history
were calculated (see Figure 25). First time donors were excluded from this analysis. In the
initial six months, donors with a longer donation history returned sooner than those who
had made fewer donations, although a higher proportion of donors with middle ranges of
donations (between 21-49) had returned by the end of the follow-up period. The differences
in the probability of return were statistically significant (log-rank statistic P<0.001).
Figure 25: Time to return for low Hb deferred donors, by donation history
Hazard functions by donation history are mapped in Figure 26 and Figure 27. In the first
week of being eligible, donors who had given between 2 and 4 donations had the highest
rate of return, though this group dropped quickly and was overtaken by those with the
longest commitment (see Figure 27). Donors with the fewest donations were more likely to
return than those with more donations into the second and third years of follow-up, if they
had not already done so.
Cox proportional hazards regression estimated a higher hazard ratio for repeat donors who
had given a greater number of times, relative to those who had given fewer times (see Table
43). The proportional hazard requirement was met for this model (proportional hazard test
P=0.35). Separate analysis for males and females was not pursued as this variable was not
included in the multivariable analysis.
0.000.100.200.300.400.500.600.700.800.901.00
0 52 104 156time since eligible to return to donate (weeks)
1-2 3-1011-20 21-4950+
for deferred donors, by length of donation history (repeat only)cumulative proportions of return to donation

105
Table 43: Results of Cox proportional hazards regression for deferred donors, by length of donation history
VARIABLE HAZARD RATIO
95% CONF. INTERVAL
P
Recent attendance history (for repeat donors only) <0.001
1 or 2 donations 3 to 10 donations 1.09 0.85 1.40 0.50 11 to 20 donations 1.53 1.15 2.02 0.003 21 to 49 donations 1.87 1.42 2.46 <0.001 50+ donations 1.87 1.37 2.54 <0.001
Figure 26: Hazard estimates smoothed over the three year follow-up period, by donation history
0
.01
.02
.03
0 52 104 156time since eligible to return to donate (weeks)
1-2 3-1011-20 21-4950+
for deferred donors, by length of donation history (repeat only)smoothed hazard estimates- over 3 years
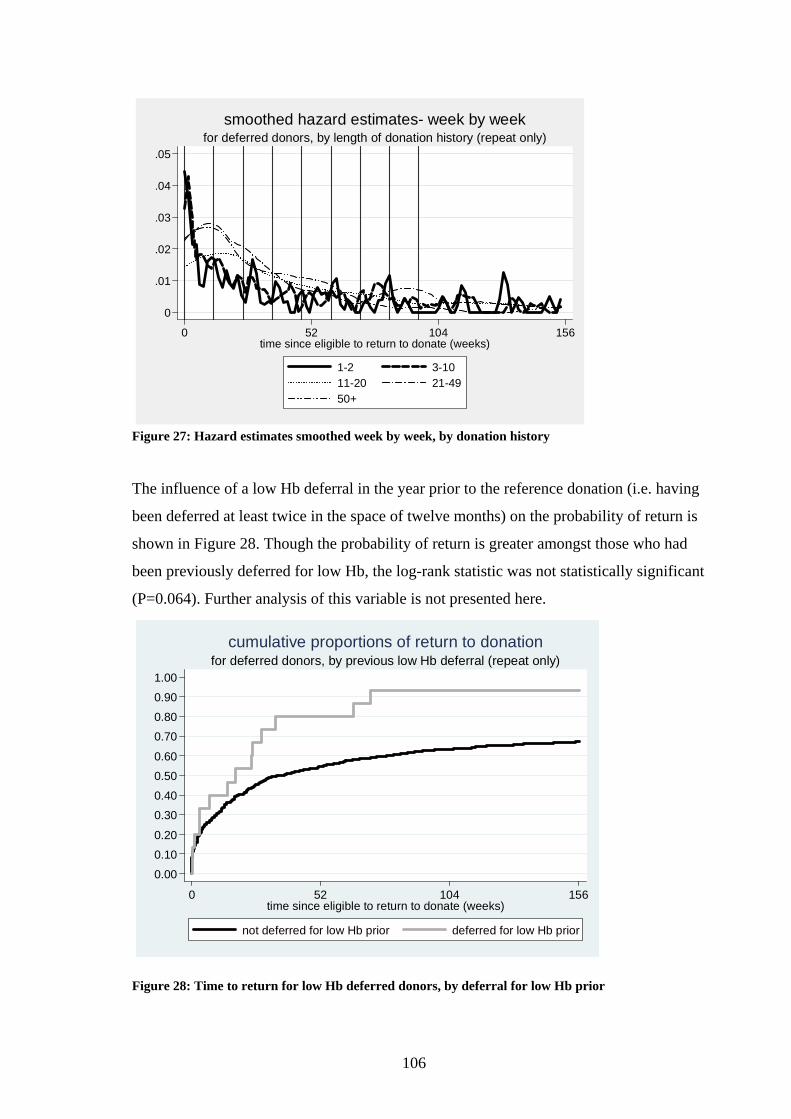
106
Figure 27: Hazard estimates smoothed week by week, by donation history
The influence of a low Hb deferral in the year prior to the reference donation (i.e. having
been deferred at least twice in the space of twelve months) on the probability of return is
shown in Figure 28. Though the probability of return is greater amongst those who had
been previously deferred for low Hb, the log-rank statistic was not statistically significant
(P=0.064). Further analysis of this variable is not presented here.
Figure 28: Time to return for low Hb deferred donors, by deferral for low Hb prior
0
.01
.02
.03
.04
.05
0 52 104 156time since eligible to return to donate (weeks)
1-2 3-1011-20 21-4950+
for deferred donors, by length of donation history (repeat only)smoothed hazard estimates- week by week
0.00
0.100.20
0.300.40
0.500.60
0.700.80
0.90
1.00
0 52 104 156time since eligible to return to donate (weeks)
not deferred for low Hb prior deferred for low Hb prior
for deferred donors, by previous low Hb deferral (repeat only)cumulative proportions of return to donation

107
The Cox proportional hazard model was used to identify the variables associated with rate
of return in the deferred group. However the proportional hazards assumption was violated
in the model for all deferred donors (proportional hazard test P=0.002), and a model
stratified by sex also violated the proportion hazards assumption (proportional hazard test
P=0.01). Separate analysis was performed for males and females, however the hazards
assumption was violated for females (proportional hazard test p=0.02), and the estimates
generated by the model amongst males were not significantly different to estimates
resulting from chance (P=0.22). The results of the models are not shown here.

108
4.4.4 The impact of deferral on donation frequency
The outcome of interest in this section is the number of times the donor attended to give
blood. This will be referred to in this section as the number of donations, although it is
acknowledged that attendances do not necessarily result in a successful donation (for
example, individuals may be ineligible to donate or unable to give a full unit of blood).
Medians and inter-quartile ranges of donations given during the follow-up period were
calculated. The mean was calculated to allow comparisons with findings reported in the
literature (for example Halperin, Baetens et al. 1998; for example Custer, Chinn et al.
2007). The Wilcoxon rank-sum (Mann-Whitney) test and negative binomial regression
analysis were used to estimate whether donors who had been deferred for low Hb gave
significantly fewer donations than those who had not been deferred. These tests were
appropriate because the outcome in question was a count- meaning parametric tests such as
t-tests were not applicable (van Belle, Fisher et al. 2004), and dispersion of the data was
greater than that predicted by the Poisson model (McCullagh and Nelder 1989).
Table 44 shows the mean and median number of attendances in each year, by study group,
for all donors. The Wilcoxon rank-sum test showed that the distribution of counts was
significantly different in each year (P<0.001).
Table 44: Number of donations given in each year of follow-up (including non-returning donors) DONATIONS IN YEAR 1 MEAN (SD) MEDIAN RANGE INTERQUARTILE
RANGE Deferred low Hb 1.1 (1.5) 0 0-16 2 Comparison 2.3 (1.9) 2 0-26 3
DONATIONS IN YEAR 2 Deferred low Hb 0.9 (1.5) 0 0-12 2 Comparison 1.8 (2.1) 1 0-25 3
DONATIONS IN YEAR 3 Deferred low Hb 0.8 (1.5) 0 0-12 1 Comparison 1.7 (2.3) 1 0-26 3
As the results presented earlier in this chapter have shown, deferred donors were less likely
to return in any given year of the follow-up period. Table 45 shows the mean and median
number of donations made by the study groups in each year of follow-up, given the donor
returned at least once during the year. The Wilcoxon rank-sum test showed that the
distributions of counts was significantly different in each year (P<0.001). These results
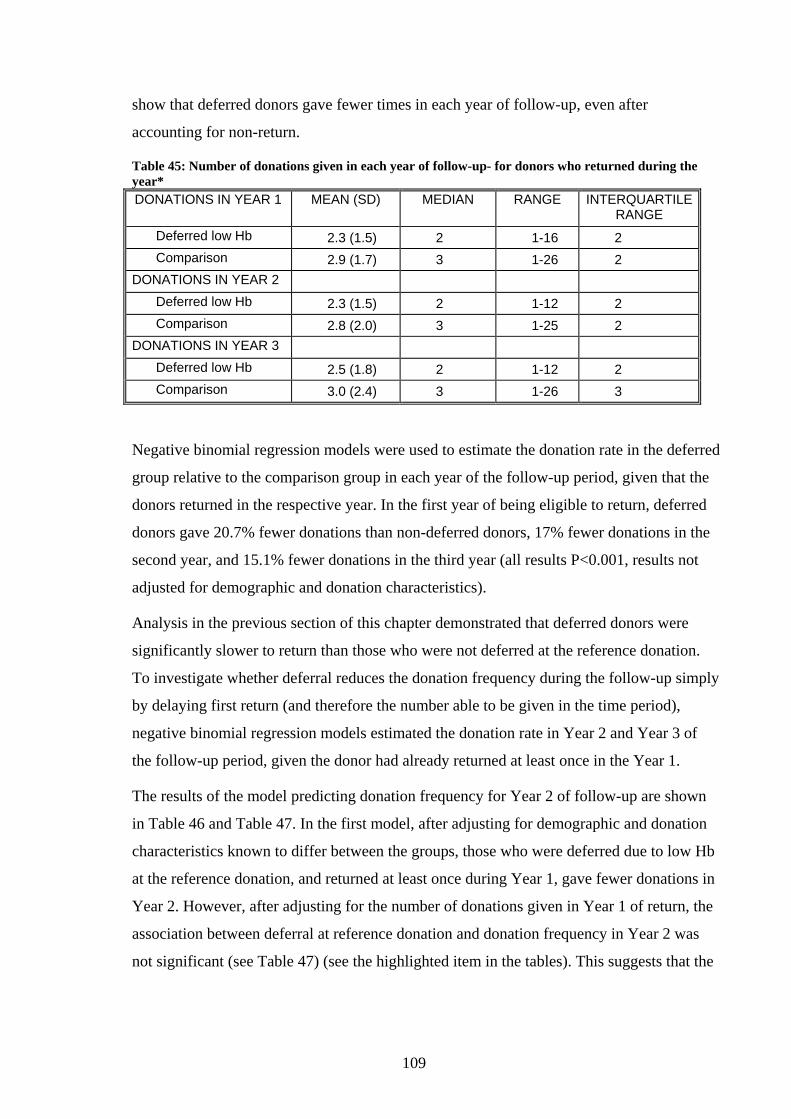
109
show that deferred donors gave fewer times in each year of follow-up, even after
accounting for non-return.
Table 45: Number of donations given in each year of follow-up- for donors who returned during the year* DONATIONS IN YEAR 1 MEAN (SD) MEDIAN RANGE INTERQUARTILE
RANGE Deferred low Hb 2.3 (1.5) 2 1-16 2 Comparison 2.9 (1.7) 3 1-26 2
DONATIONS IN YEAR 2 Deferred low Hb 2.3 (1.5) 2 1-12 2 Comparison 2.8 (2.0) 3 1-25 2
DONATIONS IN YEAR 3 Deferred low Hb 2.5 (1.8) 2 1-12 2 Comparison 3.0 (2.4) 3 1-26 3
Negative binomial regression models were used to estimate the donation rate in the deferred
group relative to the comparison group in each year of the follow-up period, given that the
donors returned in the respective year. In the first year of being eligible to return, deferred
donors gave 20.7% fewer donations than non-deferred donors, 17% fewer donations in the
second year, and 15.1% fewer donations in the third year (all results P<0.001, results not
adjusted for demographic and donation characteristics).
Analysis in the previous section of this chapter demonstrated that deferred donors were
significantly slower to return than those who were not deferred at the reference donation.
To investigate whether deferral reduces the donation frequency during the follow-up simply
by delaying first return (and therefore the number able to be given in the time period),
negative binomial regression models estimated the donation rate in Year 2 and Year 3 of
the follow-up period, given the donor had already returned at least once in the Year 1.
The results of the model predicting donation frequency for Year 2 of follow-up are shown
in Table 46 and Table 47. In the first model, after adjusting for demographic and donation
characteristics known to differ between the groups, those who were deferred due to low Hb
at the reference donation, and returned at least once during Year 1, gave fewer donations in
Year 2. However, after adjusting for the number of donations given in Year 1 of return, the
association between deferral at reference donation and donation frequency in Year 2 was
not significant (see Table 47) (see the highlighted item in the tables). This suggests that the

110
reduced number of donations made by the deferred group in the second year of follow-up is
explained by the lower donation frequency in the first year of being eligible to return.
Table 46: Negative binomial regression of number of donations made in Year 2 of follow-up, given a donor returned during Year 1
VARIABLE INCIDENCE RATE RATIO
95% CONF. INTERVAL
P
Deferred group (relative to comparison group) 0.80 0.74 0.88 <0.001
Age <0.001
<25 25-34 1.20 1.16 1.25 <0.001 35-44 1.53 1.48 1.58 <0.001 45-54 1.73 1.68 1.78 <0.001 55-64 1.75 1.70 1.81 <0.001 65+ 1.46 1.41 1.52 <0.001
Male (relative to female) 1.14 1.13 1.16 <0.001
Recent attendance history <0.001
New donors 0 donation prior 1.01 0.96 1.05 0.74 1 donation prior 1.16 1.12 1.20 <0.001 2 donations prior 1.37 1.32 1.41 <0.001 3 donations prior 1.65 1.60 1.70 <0.001 4 donations prior 1.96 1.90 2.02 <0.001 5+ donations prior 3.02 2.81 3.24 <0.001
Previously deferred for low Hb 1.17 1.06 1.31 0.003
Hb deferral in Y1 0.68 0.65 0.71 <0.001
Other deferral in Y1 0.80 0.76 0.85 <0.001 Negative binomial regression N=56042 Log pseudolikelihood = -103794.91 Wald chi2 (16) = 8783.17 P<0.0001
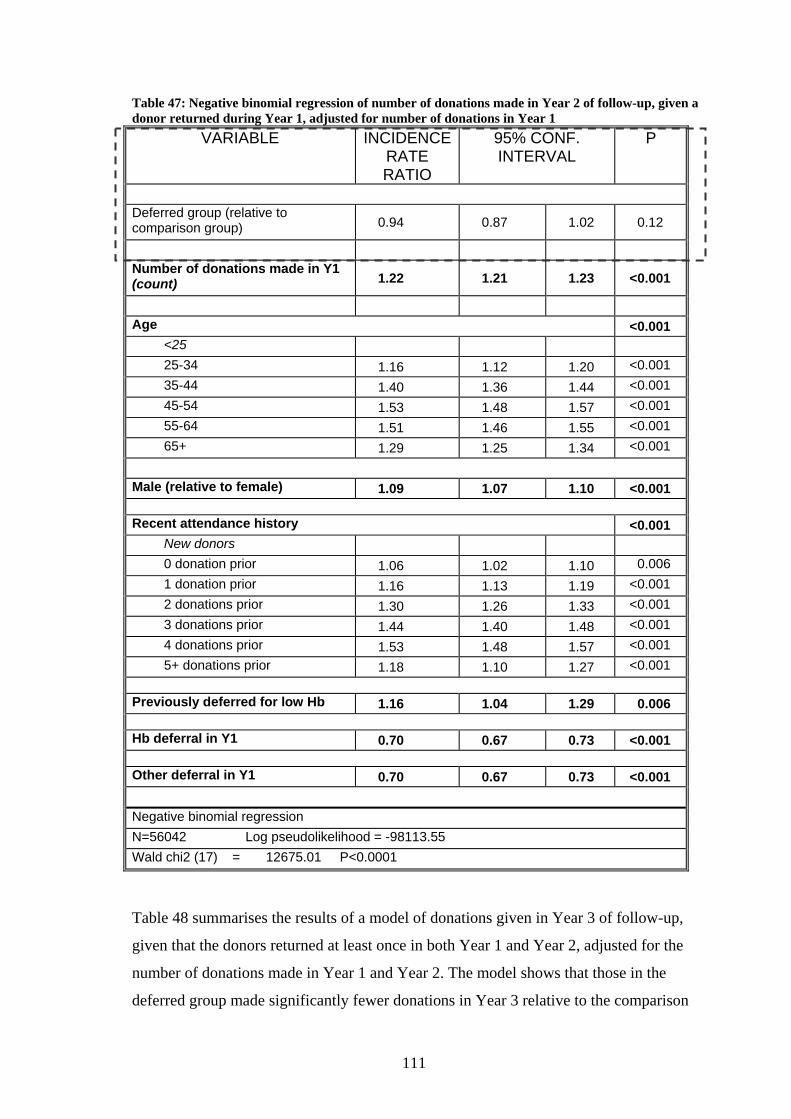
111
Table 47: Negative binomial regression of number of donations made in Year 2 of follow-up, given a donor returned during Year 1, adjusted for number of donations in Year 1
VARIABLE INCIDENCE RATE RATIO
95% CONF. INTERVAL
P
Deferred group (relative to comparison group) 0.94 0.87 1.02 0.12
Number of donations made in Y1 (count) 1.22 1.21 1.23 <0.001
Age <0.001
<25 25-34 1.16 1.12 1.20 <0.001 35-44 1.40 1.36 1.44 <0.001 45-54 1.53 1.48 1.57 <0.001 55-64 1.51 1.46 1.55 <0.001 65+ 1.29 1.25 1.34 <0.001
Male (relative to female) 1.09 1.07 1.10 <0.001
Recent attendance history <0.001
New donors 0 donation prior 1.06 1.02 1.10 0.006 1 donation prior 1.16 1.13 1.19 <0.001 2 donations prior 1.30 1.26 1.33 <0.001 3 donations prior 1.44 1.40 1.48 <0.001 4 donations prior 1.53 1.48 1.57 <0.001 5+ donations prior 1.18 1.10 1.27 <0.001
Previously deferred for low Hb 1.16 1.04 1.29 0.006
Hb deferral in Y1 0.70 0.67 0.73 <0.001
Other deferral in Y1 0.70 0.67 0.73 <0.001 Negative binomial regression N=56042 Log pseudolikelihood = -98113.55 Wald chi2 (17) = 12675.01 P<0.0001
Table 48 summarises the results of a model of donations given in Year 3 of follow-up,
given that the donors returned at least once in both Year 1 and Year 2, adjusted for the
number of donations made in Year 1 and Year 2. The model shows that those in the
deferred group made significantly fewer donations in Year 3 relative to the comparison
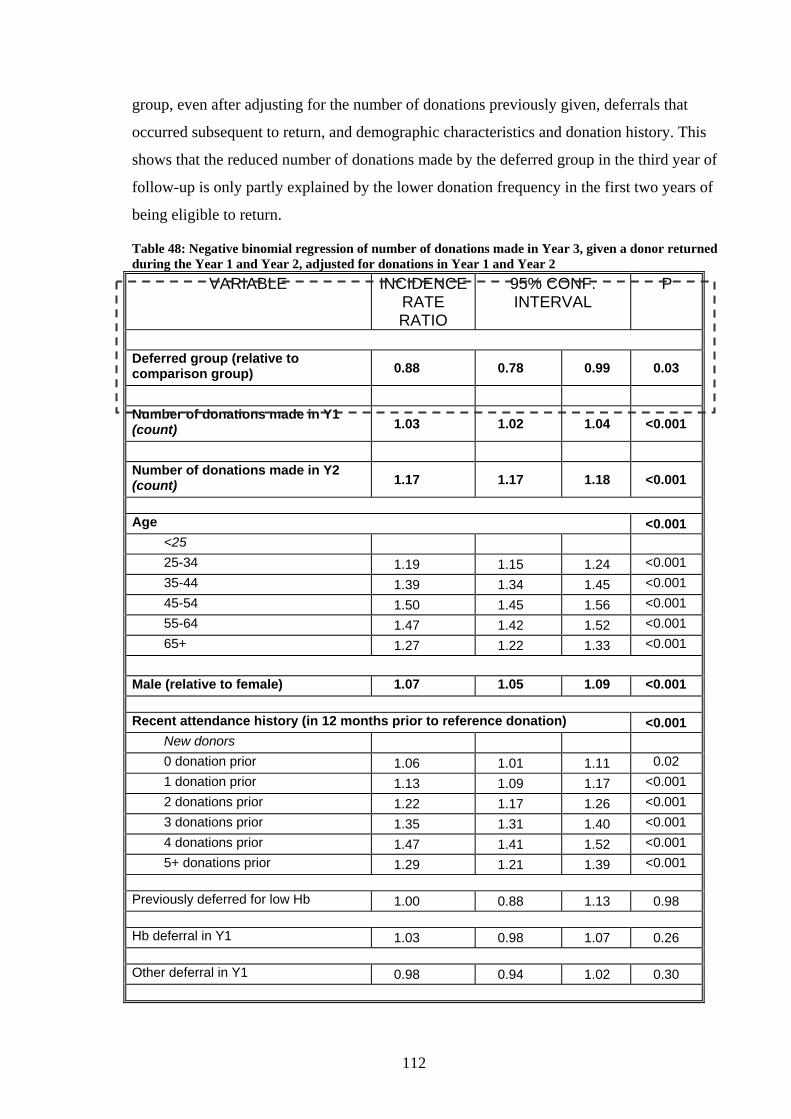
112
group, even after adjusting for the number of donations previously given, deferrals that
occurred subsequent to return, and demographic characteristics and donation history. This
shows that the reduced number of donations made by the deferred group in the third year of
follow-up is only partly explained by the lower donation frequency in the first two years of
being eligible to return.
Table 48: Negative binomial regression of number of donations made in Year 3, given a donor returned during the Year 1 and Year 2, adjusted for donations in Year 1 and Year 2
VARIABLE INCIDENCE RATE RATIO
95% CONF. INTERVAL
P
Deferred group (relative to comparison group) 0.88 0.78 0.99 0.03
Number of donations made in Y1 (count) 1.03 1.02 1.04 <0.001
Number of donations made in Y2 (count) 1.17 1.17 1.18 <0.001
Age <0.001
<25 25-34 1.19 1.15 1.24 <0.001 35-44 1.39 1.34 1.45 <0.001 45-54 1.50 1.45 1.56 <0.001 55-64 1.47 1.42 1.52 <0.001 65+ 1.27 1.22 1.33 <0.001
Male (relative to female) 1.07 1.05 1.09 <0.001
Recent attendance history (in 12 months prior to reference donation) <0.001
New donors 0 donation prior 1.06 1.01 1.11 0.02 1 donation prior 1.13 1.09 1.17 <0.001 2 donations prior 1.22 1.17 1.26 <0.001 3 donations prior 1.35 1.31 1.40 <0.001 4 donations prior 1.47 1.41 1.52 <0.001 5+ donations prior 1.29 1.21 1.39 <0.001
Previously deferred for low Hb 1.00 0.88 1.13 0.98
Hb deferral in Y1 1.03 0.98 1.07 0.26
Other deferral in Y1 0.98 0.94 1.02 0.30

113
Hb deferral in Y2 0.72 0.68 0.77 <0.001
Other deferral in Y2 0.71 0.68 0.74 <0.001 Negative binomial regression N=41581 Log pseudolikelihood = -76891.30 Wald chi2(20) = 9064.35 P<0.0001
The next analysis looked at subsequent deferrals for low Hb, or other reasons, amongst
returning donors. The results are summarised in Table 49 and Table 50. Subsequent
deferral rates were high amongst those deferred due to low Hb at the reference donation,
with 21.0% of those donating in Year 1, 24.1% of those donating in Year 2, and 22.3% of
those donating in Year 3 deferred again for the same reason. Relatively small proportions of
those in the comparison group were deferred for low Hb in subsequent years. Differences
were statistically significant in each year (P<0.001).
Table 49: Proportion of returning donors deferred due to low Hb during the follow-up period DEFERRAL FOR
LOW HB DEFERRED GROUP
(N= 477) COMPARISON GROUP
(N= 55,565) Donor deferred in Year 1?* n % n %
Yes 100 21.0 2,737 4.9 No 377 79.0 52,828 95.1
Donor deferred in Year 2?*
DEFERRED GROUP (N=403)
COMPARISON GROUP (N= 44,512)
Yes 97 24.1 1,844 4.1 No 306 75.9 42,668 95.9
Donor deferred in Year 3?*
DEFERRED GROUP (N=314)
COMPARISON GROUP (N= 38,698)
Yes 70 22.3 1,542 4.0 No 244 77.7 37,156 96.0
*donors must have returned at least once in a given year
There were also differences in the likelihood of deferral for a reason other than low Hb,
with donors deferred for low Hb at the reference donation also more likely to be deferred
for another reason during Year 1 of follow-up (P=0.024, see Table 50). Differences in the
likelihood of deferral in Year 2 were also statistically significant (P=0.049) but were not in
Year 3 (P=0.78).

114
Table 50: Proportion of returning donors deferred for another reason during follow-up period DEFERRAL FOR
ANOTHER REASON DEFERRED GROUP
(N= 477) COMPARISON GROUP
(N= 55,565) Donor deferred in Year 1?* n % n %
Yes 37 7.8 3,006 5.4 No 440 92.2 52,559 94.6
Donor deferred in Year 2?*
DEFERRED GROUP (N=403)
COMPARISON GROUP (N=44,512)
Yes 33 8.2 2,614 5.9 No 370 91.8 41,898 94.1
Donor deferred in Year 3?*
DEFERRED GROUP (N=314)
COMPARISON GROUP (N=38,698)
Yes 20 6.4 2,618 6.8 No 294 93.6 36,080 93.2
*donors must have returned at least once in a given year
Wilcoxon rank-sum (Mann-Whitney) tests were used to test whether members of the
deferred group who were deferred again for low Hb gave significantly fewer donations in
subsequent years. Amongst the deferred group, those who were deferred again in Year 1 of
being eligible to return gave fewer donations in Year 2 and Year 3 of follow-up (P<0.001
and P= 0.001, respectively); however, the difference was not statistically significant when
excluding non-retuning donors in either year. Similarly, a deferral due to low Hb in Year 2
reduced donation frequency in Year 3 (P=0.04), but the difference was not significant after
excluding those who did not return in Year 3.
Return from deferral during the follow-up period for a reason other than low Hb followed a
similar pattern. Donation frequency did not significantly differ in the next subsequent year,
given donors returned at least once during the year, although if donors were deferred in
Year 1, they gave significantly fewer donations in Year 3 (P=0.042).
Table 51 and Table 52 show the results of stratified analysis of the variables associated
with donation frequency for returning donors over the entire follow-up period, for the
deferred group and comparison group separately. In the deferred group, a returning donor
made more donations if they were aged between 35 and 64, had given more donations in
the year prior to deferral, and were male (see Table 51). New donors make a similar
number of donations as repeat donors who gave one or two donations in the previous year.

115
Table 51: Negative binomial regression of number of donations made in follow up period, amongst returning donors, deferred group
VARIABLE INCIDENCE RATE RATIO
95% CONF. INTERVAL
P
Male (relative to female) 1.21 1.01 1.46 0.04 Age <0.001
<25 25-34 1.18 0.93 1.49 0.18 35-44 1.41 1.17 1.69 <0.001 45-54 1.67 1.41 1.98 <0.001 55-64 1.44 1.19 1.74 <0.001 65+ 1.17 0.87 1.57 0.29
Recent attendance history (in 12 months prior to reference donation) <0.001
New donors 0 donation prior 0.82 0.52 1.27 0.37 1 donation prior 1.23 0.91 1.67 0.18 2 donations prior 1.55 1.16 2.06 0.003 3 donations prior 1.91 1.45 2.53 <0.001 4 donations prior 2.17 1.60 2.93 <0.001 5+ donations prior 3.06 1.97 4.77 <0.001
Previously deferred for low Hb 1.00 0.76 1.30 0.98 Negative binomial regression N=591 Log pseudolikelihood = -1437.2281 Wald chi2(13) = 155.60 P<0.0001
The variables predicting the number of donations given by returning donors in the
comparison group were the same (see Table 52).
Table 52: Negative binomial regression of number of donations made in follow up period, amongst returning donors, comparison group
VARIABLE INCIDENCE RATE RATIO
95% CONF. INTERVAL
P
Male (relative to female) 1.13 1.12 1.15 <0.001
Age <0.001
<25 25-34 1.15 1.13 1.18 <0.001 35-44 1.41 1.38 1.44 <0.001

116
45-54 1.58 1.55 1.62 <0.001 55-64 1.63 1.59 1.66 <0.001 65+ 1.40 1.37 1.44 <0.001
Recent attendance history <0.001
New donors 0 donation prior 0.97 0.94 0.99 0.02 1 donation prior 1.12 1.10 1.15 <0.001 2 donations prior 1.33 1.30 1.36 <0.001 3 donations prior 1.61 1.58 1.65 <0.001 4 donations prior 1.94 1.89 1.98 <0.001 5+ donations prior 3.07 2.90 3.25 <0.001
Previously deferred for low Hb 1.03 0.95 1.12 0.47 Negative binomial regression N=60027 Log pseudolikelihood = -162805.68 Wald chi2(13) = 15557.64 P<0.0001

117
4.5 Summary
This section contains a brief summary of the important results of the study as they relate to
each of the aims.
Aim 1: To describe the demographic characteristics and donation histories of
deferred blood donors
Donors were more likely to have been deferred for a low haemoglobin level at the reference
donation if they were younger, female, a returning donor, had given more donations in the
twelve months prior to the reference donation, and had a shorter donation history. They
were more likely to have been deferred for low Hb in the previous year, but no more likely
to have been deferred for another reason.
Aim 2: To describe the factors associated with return after deferral
Individuals deferred for low Hb at the reference donation were less likely to return within
three years of being eligible to do so than those who were not deferred, and the effect was
more pronounced amongst those deferred at their first attempt. Deferred donors were also
more likely to drop out in a later year of follow-up even if they had already returned, and
this effect was largely, though not entirely, explained by the lower likelihood of attendance
and fewer donations made in the first year of being eligible to return.
Amongst the deferred group, return within the first year of being eligible was predicted
only by donation frequency prior to deferral. Those who had not given in the year before
their deferral had a similar likelihood of returning during this period as those who were
deferred at their first donation attempt. In later years of follow-up, return was predicted by
recent frequency, an older age, and whether or not they had already returned. Another
deferral during the follow-up period reduced the likelihood of return in the next year, but
provided the donor did return at least once, did not influence return during the subsequent
year.
Aim 3: To describe the factors associated with time to return after deferral
The likelihood of first return amongst deferred donors diminishes quickly over the course
of the three year follow-up period. Half of all deferred donors returning during the period
had already done so within thirteen weeks of being eligible, and relatively few donors
returned after nine months of being eligible to do so. The likelihood of first return also

118
diminishes for the comparison group within Year 1, albeit at a slower rate. Cox
proportional hazard regression found that deferred donors had a significantly lower rate of
return relative to non-deferred donors after adjusting for differences between the groups.
Univariable analysis found deferred donors returned faster if they were male, older (only if
female) deferred at a repeat attempt, had a higher recent donation frequency, and had a
longer donation history.
Aim 4: To explore the impact of deferral on donation frequency
The number of donations given in each year of the follow-up period was significantly fewer
if the donor was deferred at the reference donation, even after accounting for the higher
likelihood of non-return. However, the difference in donation rates was partly attributed to
the fewer donations made in Year 1, which reflected a slower time to first return. Once this
factor was taken into account, returning deferred donors did not make significantly fewer
donations relative to the comparison group in Year 2. The difference in donations given in
Year 3 of follow-up remained significant, however, even after adjusting for number of
donations in earlier years and subsequent deferrals.
Returning donors in both the comparison and deferred groups made more donations in the
follow-up period if they were male, older, and had a higher frequency prior to deferral.
4.6 Discussion
The association between a low Hb deferral and demographic characteristics, such as age
and sex, has been demonstrated in other studies. Custer found that females were more likely
to be deferred for low haematocrit than males in all age groups (Custer, Johnson et al.
2004). The higher likelihood of deferral in younger women reflects, in part, the higher
likelihood of this group having iron deficiency relative to other groups in the population
(Leggett, Brown et al. 1990; Corbaic and Baghurst 1993). This group is particularly prone
to iron deficiency due to menstruation, pregnancy, and inadequate dietary intake. Bianco
demonstrated that premenopausal women, who have lower iron stores than other
populations to begin with, lose a larger proportion of their stored iron when giving a whole-
blood donation than other groups, and therefore are more likely to become iron deficient
with frequent donation (Bianco, Brittenham et al. 2002).
The relationship between low Hb deferral and having a higher donation frequency prior to
deferral also confirms Bianco’s argument that frequent donation increases the chance that

119
iron stores are not adequately replenished between donations. It seems that donors who are
willing and able to donate at a higher frequency are at a greater risk of depleting their iron
stores.
The results presented in this chapter demonstrate that deferral for a low Hb has
considerable impact on donation patterns: increasing the likelihood of non-return in both
new and repeat donors; delaying first return amongst those who do come back; and
reducing the frequency of donation amongst those who did return, a reduction which was
only partly explained by the longer time to first return. The use of a comparison group, who
attended during the same time period but were not deferred, supports the notion that the
changes to donation patterns were a result of the low Hb deferral, and not due to
circumstances affecting all donors.
This study found a lower likelihood of return from deferral in both repeat and new donors,
a result which has not been reported in all studies in the literature. For example Piliavin did
not find a significant difference in the proportion of returning new and repeat donors
(Piliavin 1987). Additionally, the reduced likelihood of return in repeat donors was more
pronounced than the proportions reported in the literature. This is likely to reflect different
deferral procedures and retention practices in the various blood services, as well as
differences in the study design, such as length of follow-up period. For example, Custer
reported that low Hb deferred repeat donors had similar likelihood of return to non-deferred
repeat donors over a 5 year follow-up period (85% vs. 86% returning respectively), though
the time to first return was significantly slower amongst deferred donors. Halperin et al
(1997) found that those given a short-term, temporary deferral due to low Hb were less
likely to return (70% vs 81% of those with no deferral) over a 4.25 year follow up period.
However, the study did not report the duration of the deferral period, and could not
differentiate first time donors from repeat donors (Halperin, Baetens et al. 1998).
The impact of temporary deferral on the likelihood of return in first time donors has been
well established (Noonan, Menitove et al. 1981; Piliavin 1987; Custer, Chinn et al. 2007).
Custer et al reported that amongst first time donors, those deferred for low Hb were
significantly less likely to return than those who made a successful donation (29% vs. 47%
returning respectively). While Custer et al attributed the difference in return to
administrative practices, as the blood service did not actively recruit those deferred at their
first attempt, a substantial difference in the likelihood of return was also reflected in the
present research (20.9% of deferred vs. 69.9% non-deferred first time donors returning), in

120
a context where all donors are invited to return. This suggests that those deferred at their
first attempt are less resilient to deferral than those who have established donation patterns,
regardless of retention practices.
An unexpected finding was that many donors who had not attended to give blood in the
year prior to deferral had similar donation patterns to those who were deferred at their first
attempt. This was seen in analysis of return in the first year, and in analysis of subsequent
donation frequency amongst donors who did return. While it was not possible to identify
the duration of their break prior to the reference donation, the finding suggests that donors
out of the habit of regular donation and/or with a reduced capacity to accommodate
donation in their lives, would be expected to have a similar likelihood of return to those for
whom donation is a novel activity.
Donation frequency drops substantially following deferral. Deferred donors attended an
average of 2.4 times in the year before the reference donation and far less often in each year
of the follow-up period (1.1, 0.9, and 0.8 respectively). This is in contrast to comparison
group donors, who attended an average of 2.1 times in the year before the reference
donation and gave similar numbers in the years after (2.3, 1.8 and 1.7 respectively). This
study reported higher mean donations than other studies in the literature. Both deferred and
comparison donors had higher rates than those reported by Custer et al over a 5 year
follow-up period (0.6 units per year for donors deferred for any reason vs. 1.1 units per year
for non-deferred donors), while only the comparison group were higher relative to the
donations reported by Halperin et al (1.03 per year for low Hb deferred donors vs. 1.45
units per year for non-deferred donors).
The number of donations made in the year prior to deferral predicted the likelihood of
return, return at a faster rate, and a higher donation frequency. In some instances the
variable was the only significant predictor of the outcome of interest. This finding can be
explained in a number of ways. First, the finding may indicate that a stronger habit of
giving blood determines the likelihood that a donor will re-establish their donation patterns
following deferral. Second, it may also reflect that those with a stronger blood donor role
identity, known to be associated with having made more donations (Piliavin and Callero
1991), are better placed to overcome the disruption of a temporary deferral. Third, those
able to give more often have a greater capacity to fit donation into their lives: not only are
they more readily able to re-engage with donation after deferral, but once re-engaged, are
able to pick it up with a higher frequency. These explanations will be explored in the
121
studies described in the subsequent results chapters and discussed in the Final Discussion
chapter.
It appears that deferral for a low Hb influences donation behaviour primarily through
delaying return, and consequently the number of donations able to be given in the first year
of being eligible to give blood. However, a rather unexpected finding was that deferred
donors were less likely to attend in the second and third year of follow-up, even if they had
returned at least once during the first year of being eligible to do so. The “drop-out” in the
second year was not significantly different from that of the comparison group after
adjusting for the number of donations and deferrals given in the first year. This suggests
that deferral increases the risk of drop-out in later years through reducing the number of
attendances in the initial period following eligibility to return. However, the deferred group
was still more likely to drop-out during the third year of follow up (if they had returned in
the first and second years) even after adjusting for the number of donations and subsequent
deferrals during these years. Similarly, a lower donation frequency amongst deferred
donors in the second year could also be explained by fewer donations in the first year;
however the effect of deferral was still seen in the third year, even after adjusting for the
number of donations given in the first two years. Thus, it appears that deferral for a low Hb
has implications for donation behaviour beyond the effect on donation patterns in the first
year. The suspected reasons for these findings will be discussed in the Final Discussion
chapter.
The chronic nature of a low Hb status was apparent in this study. This has been reported by
other research groups (Halperin, Baetens et al. 1998; Custer, Chinn et al. 2007). Compared
to the comparison group, those deferred at the reference donation were more likely to have
been deferred in the previous year, and they were also more likely to be deferred during
every year of the follow-up period.
It was anticipated that having been deferred twice in one year (i.e. deferred at the reference
donation as well as in the twelve months prior) would have resulted in a lower likelihood of
return and a slower time to return, as donors may have been seeking medical advice,
making lifestyle changes to increase their iron stores, and perhaps were reluctant to risk a
third deferral in such a short period of time. However, membership of this group was
associated with increased likelihood of return, though the difference was not significant. It
is likely that the small number of donors in this group (n=16) contributed to the non-

122
significant P value, and the increased likelihood of return due to a higher donation
frequency prior to the deferral.
However, analysis of subsequent deferrals in the deferred group found that another deferral
within a year of being eligible to return was associated with a higher drop-out rate in the
following year, though not in the third year after adjusting for return in the second year.
This implies that given a donor can be encouraged to return at least once within a year of
being eligible to return, the detrimental effect of deferral on return and donation frequency
in subsequent years can be minimised.
It appears the effectiveness of the reminder letters diminishes the longer donors do not
return, as relatively smaller peaks in return rates are seen at subsequent correspondence
dates. Regular mail communications continue until donors become “lapsed”, that is, have
not returned for a two year period (indicated by the cessation of vertical lines in graphs
smoothed for week by week return in Figure 10). A minimal increase in return is observed
beyond the initial year of correspondence, suggesting that if donors have not returned
within nine months, further invitations to do so are relatively ineffective.
4.6.1 Limitations and data issues
The high likelihood of return in the first week in most Kaplan-Meier graphs (see section
4.4.3) indicates that the follow-up period was set to include donors who returned as early as
ten weeks after a successful whole blood donation, which is permissible, though not
encouraged, rather than the twelve weeks that regular communications invite donors to take
between donations. Similarly, donors with a temporary deferral set to a particular date were
allowed to come back earlier with the permission of their doctor or the medical officers of
the ARCBS, although they were not invited to do so in communications sent by the blood
service. Therefore, a high proportion of donors would have returned on the day they were
“eligible”, as the ARCBS determined their eligibility on the day of their return. The
increase in return at around week ten to twelve would have reflected the next mail reminder
requesting them to return to donate blood.
The larger than expected range of donations prior to the reference donation, particularly in
the comparison group (up to 359), reflects the fact that donors are able to change between
different donation types at each donation attempt, as long as the minimum time period prior
to the intended donation type has been fulfilled. Some donors had given predominantly
apheresis donations over the course of the study period, but if the reference donation was

123
whole blood, they were included in the comparison group. Similarly, if donors were
deferred for a low Hb level at the reference donation, meaning their intended donation type
could not be deciphered, they were considered possible whole blood donors if they had
made at least one whole blood donation at another point in the study period, even if their
donations were predominantly apheresis.
The cases where donors were older or younger than the standard donor age criteria (16-70)
appeared to have been allowed at the discretion of a medical officer. The two 15 year olds
attended within one week of their birthday, and donors of an older age than the maximum
age cut-off can keep donating with the permission of their physician.
The finding that the deferred group were more likely to have given an apheresis donation
prior to the reference donation may be an artefact of study design. The dataset was only
meant to include those who attended (successfully or unsuccessfully) to give whole blood
at their reference donation. As previously recognised, one limitation in the dataset was not
being able to distinguish the type of donation an individual had attempted to give if they
had been deferred at that attendance. Although measures were taken to eliminate likely
“apheresis only” donors, the analysis may have inadvertently included donors who were
deferred when trying to make an apheresis donation at the reference donation.
4.7 Conclusion
The results in this chapter show that temporary deferral for a low Hb concentration reduces
the likelihood of return, increases the time to first return, and reduces the number of
donations given in a three year follow-up period. The effect is particularly apparent in those
deferred at their first attempt. However, if a donor returns promptly once eligible, the
negative impact on future donation patterns can be reduced. This has important
implications for retention strategies, which will be discussed later in the thesis.

124
5 Results: Part Two What processes are responsible for the reduced likelihood of return after deferral? Results from qualitative interviews
5.1 Chapter Outline
This chapter describes the results of a qualitative exploration of the processes contributing
to the reduced likelihood of return following a temporary deferral for low haemoglobin
(Hb). All names presented in this chapter are pseudonyms.
5.2 Aim
The aim of this study was to investigate possible reasons why deferral had such a dramatic
impact on donation patterns. Qualitative methods were used to explore the experience of
temporary deferral from donors’ perspectives, intentions to return once eligible to do so,
motivations for giving blood, and structures that supported or precluded individuals giving
blood at various stages during their donation history.
5.3 Methods
This phase was qualitative, utilising semi-structured interviews to allow donors to express a
diversity of views, to allow for the emergence of new issues, and to enable comparisons
between donors of different backgrounds. Analysis was conducted following the
Framework Approach (Ritchie and Spencer 1993) which is described in detail below.
The investigation was primarily informed by social theories described in the Literature
Review (see Chapter 2), namely The Theory of the Spurned Philanthropist (Rosen, Mickler
et al. 1986), and Role identity theories (McCall and Simmons 1978; Callero 1985; Giddens
1991). These theories, as well as a literature review, were used to inform the development
of the interview guide.
The following research questions were included in the initial interview guide:
• What are donors’ perceptions of the deferral experience?
• What do donors understand about the reasons for their deferral?

125
• What are donors’ intentions regarding seeking further investigations into the cause
of their low haemoglobin, and what is their motivation for doing so?
• How do donors talk about their intentions to return once eligible?
• Do participants see themselves as “blood donors”, and how do their self-perceptions
compare with the concept of a “blood donor identity”?
Through exploration of emerging themes in the pilot interviews and in the initial study
interviews, the questionnaire evolved to accommodate discussions on:
• Motivations for donating for the first time, and then for continuing to give blood;
• Descriptions of unsatisfactory donation experiences;
• The circumstances leading to a cessation from donation during previous phases of
the donor career, and recommencing after the break;
• Reflections on giving blood as a voluntary activity;
• Responses to the information that deferral reduces the likelihood of return.
The final interview guide is shown in Appendix 1.
5.3.1 Sample
Potential participants were selected through purposive sampling. This method of sampling
is recognised as a non-probability sample, which does not provide results that can be
generalised to a wider population; however it ensures that the sample shares key
characteristics with the population in question (Walter 2006b). Care was taken to invite
both men and women, donors of a range of ages, and people with varying lengths of
experience of giving blood to participate in the interviews.
Although there are no guidelines regarding the specific number of participants that should
be included in a qualitative study (e.g. power analysis or sample size calculations), data
saturation is used as a common end-point (Daly, Willis et al. 2007). Data saturation refers
to the point at which the diversity of experiences appears to be completely described, and
no new themes emerge. In practice, this occurred after 25 interviews, in addition to the four
pilot interviews.
126
5.3.2 Accessing participants
Prior to commencement of the interviews, consultation occurred with the Donor Advisory
Committee (DAC), a self-selected group of blood donors who meet regularly to offer
feedback to senior ARCBS staff about the most appropriate way to recruit study
participants and to conduct interviews. The DAC recommended contacting the donors with
a telephone call followed by a letter, as a way of separating the approach from the usual
form of ARCBS contact (a standard letter inviting donors to return). They also advised that
participants should be given the option of completing the interview in their home or at a
mutually convenient location (such as a local café), rather than requesting participants to
make a special trip into the ARCBS for their interview. These recommendations were
adopted, with the exception of making the initial contact by telephone, which was not
supported by the University of Adelaide’s Human Research Ethics Committee.
At the beginning of each week during April, May and early June of 2007, I extracted
reports from the National Blood Management System (NBMS) of all South Australian
donors who had been deferred for low Hb during the previous week. Donors were selected
based on a recorded haemoglobin concentration of <120g/L for women, and <130 g/L for
men (the threshold at the time of the study). Manual checking of individual donor records
ensured that donors had been confirmed as deferred following ferritin testing, and that they
had been notified by letter of their deferral status.
Purposive sampling was used to select between 5 and 10 potential participants from the
confirmed deferral list, depending on the number of interviews already scheduled for the
coming week. For pragmatic reasons, donors who resided more than one hour away from
the CBD, or who did not speak English (identified in the NBMS by the need for an
interpreter) were not approached for an interview.
Donors were initially sent an information letter (see Appendix 2), which stated they would
received a follow-up phone call within one week. Telephone calls were made
approximately three days after mailing the letter to assess interest in participation. Five
donors rang or emailed me to indicate their interest prior to being followed up with a
telephone call.
Although the joint ownership of the project between the ARCBS and the University of
Adelaide was acknowledged in all correspondence, I emphasised my status as a PhD
student, to minimise any impression that the project was an evaluation exercise
127
commissioned by the ARCBS, and to encourage donors to speak freely about unsatisfactory
experiences. This had the unanticipated consequence of two donors expressing concern that
their details had been released to a third party without their consent: however further
discussions with each donor, in which I explained that I was employed by the ARCBS,
allayed their concerns and interviews were scheduled and completed.
A total of 50 donors were sent letters of invitation in April, May, and June of 2007 and this
resulted in a total of 29 interviews being completed. The first four interviews were used to
develop and pilot the interview schedule, with a further 25 interviews completed during
May and June of 2007. All interviews were completed between 7-20 days of the donation
appointment that resulted in deferral. The interviews ranged in length between 22 minutes
and 54 minutes.
Twenty-one (42%) of those invited to participate did not schedule and complete an
interview. The reasons were as follows: one donor did not have a telephone contact listed
on the NBMS, and so could not be followed up with a telephone call. Telephone contact
could not be made with fifteen donors after three attempts at contact (with messages left
where possible). Of the remaining five donors, one spoke limited English, two declined to
be interviewed, and two stated they were keen to participate subject to work commitments,
but did not call back to schedule an interview.
5.3.3 Data collection
If a donor agreed to participate, an appointment was made within the next week at a
location convenient to the participant, which included their workplaces and homes, cafés,
and the ARCBS CBD collection site.
The meeting commenced with an introduction, a review of the study aims and the format of
the interview, with donors being given the opportunity to ask any further questions.
Participants’ rights, such as the right to refuse any particular questions, and the right to
confidentiality, were emphasised. Participants signed a consent form and gave their
permission to have the interview digitally recorded. Participants were also offered the
opportunity to review the transcript from their interview prior to its inclusion in the study,
and interest in this option was recorded. Fourteen participants took up this offer and were
mailed their completed transcript, and no changes were requested.
I undertook all of the interviews. Efforts were made to develop good rapport with
participants, whilst maintaining a formal structure. All interviews were recorded. At the

128
conclusion of the interview, donors were thanked for their time, and were given the
opportunity to ask any further questions about the research.
I maintained a journal during the research period, which was used to record my reflections
after each interview. The exercise was particularly useful for identifying new topics for
exploration or alternative questioning strategies. I was also reflexive about my manner and
approach, and the circumstances affecting the quality of the interviews, in an effort to refine
my interviewing skills and achieve the best possible data.
Poor quality recording resulted in two interviews being unable to be transcribed and
therefore unable to be analysed further (only minimal notes were during interviews, as note
taking was found to hinder building rapport and my responsiveness to participants’
accounts). As a result, a total of 23 interview transcripts were available for analysis, with 8
interviews transcribed by me, and the remaining 15 completed by a private transcribing
service. Pseudonyms were used to protect the identity of the participants. I personally
checked all transcriptions against the audio files to ensure accuracy, and to increase
familiarisation with the data.
Data were subsequently available on whether participants had returned within nine months
of being eligible to do so, based on a search of NBMS records searched on October the 28th,
2008. This time point was selected as time to event analysis (presented in the previous
chapter) revealed that donors were unlikely to return beyond this point if they had not
already done so. A substantial proportion of the analysis had already been completed by
this stage, and the information was used to establish patterns between the likelihood of
return and the coded interview data.
5.3.4 The Participants
Summaries of the demographic, donation, and life stage characteristics of all donors that
were sent a letter of invitation are displayed in Table 53. The donors are separated into two
groups: those who completed an interview and those who did not (including those unable to
be contacted, declining to be interviewed, or who spoke limited English). It appears that
some groups were more difficult to engage than others. Just one of the six individuals
approached in the 25-39 age group completed an interview. Participation was also lower for
those who had never been deferred before, or had made fewer donations prior to deferral.
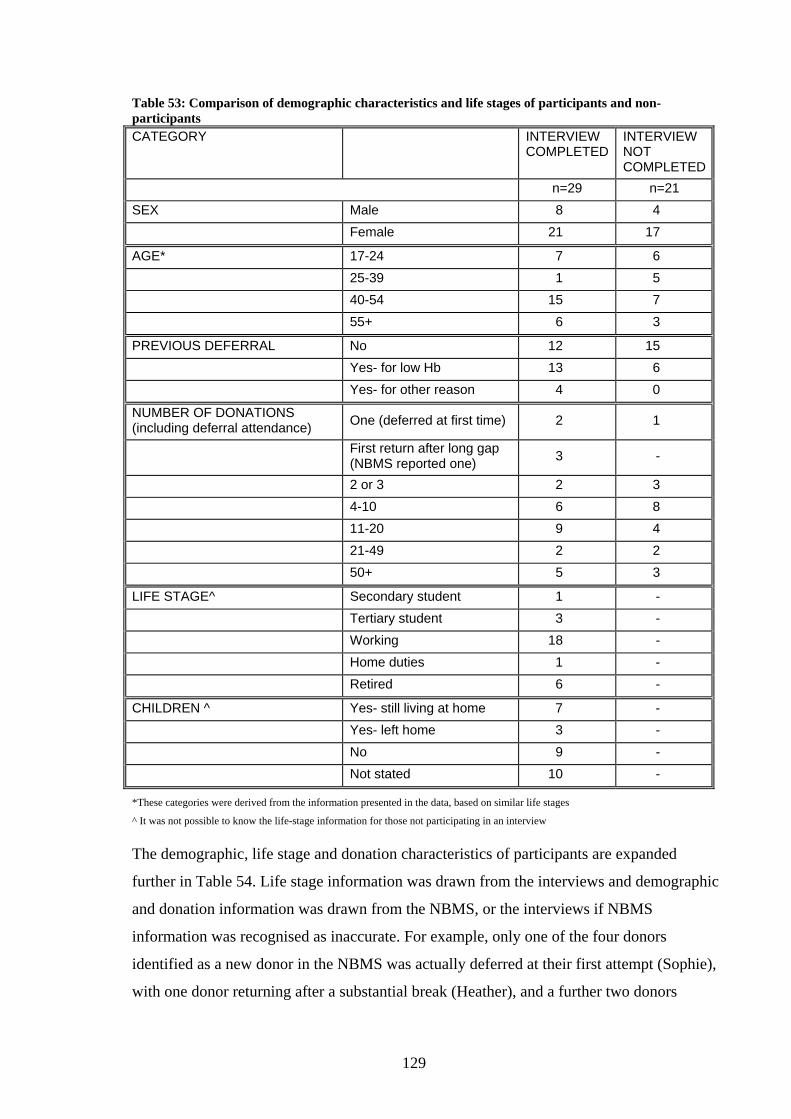
129
Table 53: Comparison of demographic characteristics and life stages of participants and non-participants CATEGORY INTERVIEW
COMPLETED INTERVIEW NOT COMPLETED
n=29 n=21 SEX Male 8 4 Female 21 17
AGE* 17-24 7 6 25-39 1 5 40-54 15 7 55+ 6 3
PREVIOUS DEFERRAL No 12 15 Yes- for low Hb 13 6 Yes- for other reason 4 0
NUMBER OF DONATIONS (including deferral attendance) One (deferred at first time) 2 1
First return after long gap (NBMS reported one) 3 -
2 or 3 2 3 4-10 6 8 11-20 9 4 21-49 2 2 50+ 5 3
LIFE STAGE^ Secondary student 1 - Tertiary student 3 - Working 18 - Home duties 1 - Retired 6 -
CHILDREN ^ Yes- still living at home 7 - Yes- left home 3 - No 9 - Not stated 10 -
*These categories were derived from the information presented in the data, based on similar life stages
^ It was not possible to know the life-stage information for those not participating in an interview
The demographic, life stage and donation characteristics of participants are expanded
further in Table 54. Life stage information was drawn from the interviews and demographic
and donation information was drawn from the NBMS, or the interviews if NBMS
information was recognised as inaccurate. For example, only one of the four donors
identified as a new donor in the NBMS was actually deferred at their first attempt (Sophie),
with one donor returning after a substantial break (Heather), and a further two donors

130
returning after a first attempt resulted in deferral several years prior (Brian and Cassie).
Some participants also described making far more donations than their record suggested.
For example, Susan had donated for over 20 years whilst living interstate, yet was only
listed as having four attendances in NBMS records. Two participants spoke English as a
second language (Pam and Jan). Around half of the participants (n=12) had been deferred
for low Hb on more than one occasion.
Table 54: Participant demographic and life stage characteristics PSEUDONYM AGE SEX DONATION
HISTORY RECENT DONATION FREQUENCY
PREVIOUS DEFERRAL
LIFE STAGE*
CHILDREN*
Barry 54 Male More than 50 3 donations No Retired No
Blake 22 Male 11-20 4 donations other reason Working No
Brian 53 Male
long gap (new donor on NBMS)
0 donations other reason Working Unsure
Cassie 21 Female
long gap (new donor on NBMS)
0 donations low Hb University Student No
Chloe 18 Female Two or three 2 donations low Hb University
Student No
Cynthia 64 Female More than 50 3 donations low Hb Retired Yes- left
home
Dianne 65 Female More than 50 2 donations low Hb Retired Yes- left
home Elizabeth 49 Female 21-49 2 donations low Hb Working No
Emily 17 Female 4-10 4 donations No School Student No
Eric 57 Male 21-49 3 donations No Retired Unsure
Graham 64 Male More than 50 2 donations low Hb Retired Unsure
Heather 45 Female
long gap (new donor on NBMS)
0 donations low Hb Working Yes- living at home
Jan 18 Female 4-10 3 donations No University Student No
Judith 41 Female 4-10 2 donations No Family duties
Yes- living at home
Kate 44 Female 11-20 3 donations low Hb Working Unsure
Mary 51 Female 11-20 1 donation low Hb Working Yes- living at home
Pam 49 Female 4-10 3 donations other reason Working Yes-
living at
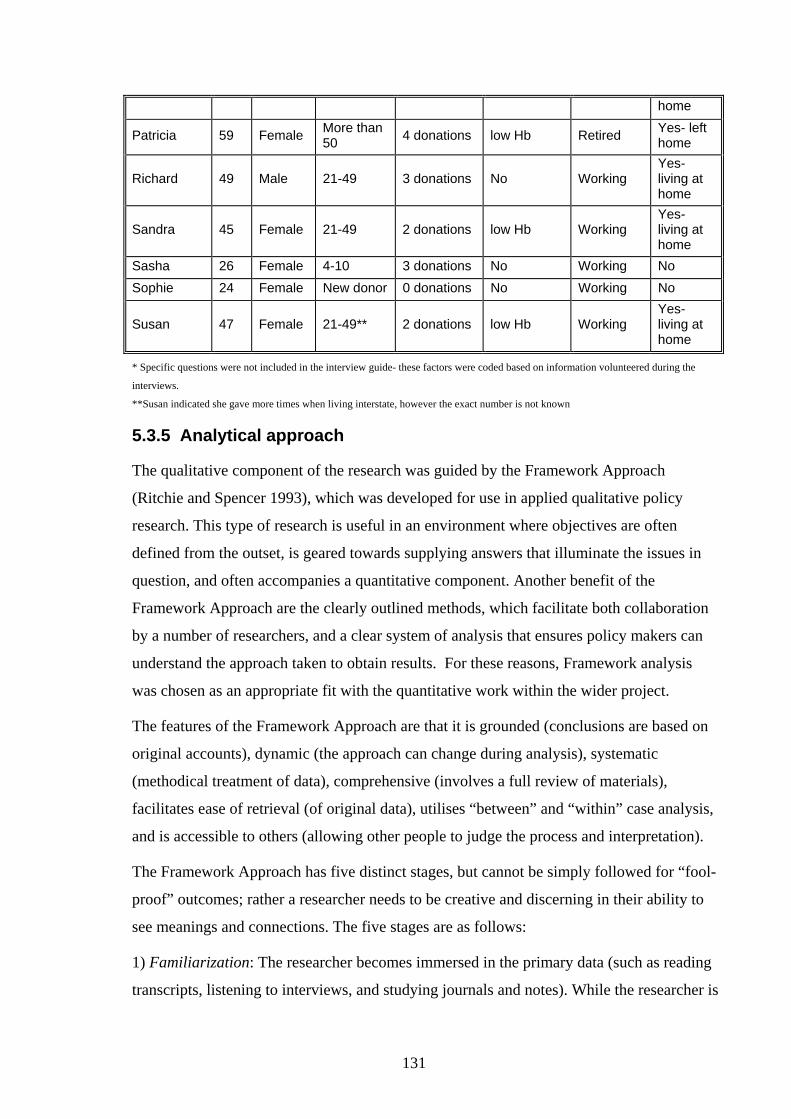
131
home
Patricia 59 Female More than 50 4 donations low Hb Retired Yes- left
home
Richard 49 Male 21-49 3 donations No Working Yes- living at home
Sandra 45 Female 21-49 2 donations low Hb Working Yes- living at home
Sasha 26 Female 4-10 3 donations No Working No Sophie 24 Female New donor 0 donations No Working No
Susan 47 Female 21-49** 2 donations low Hb Working Yes- living at home
* Specific questions were not included in the interview guide- these factors were coded based on information volunteered during the
interviews.
**Susan indicated she gave more times when living interstate, however the exact number is not known
5.3.5 Analytical approach
The qualitative component of the research was guided by the Framework Approach
(Ritchie and Spencer 1993), which was developed for use in applied qualitative policy
research. This type of research is useful in an environment where objectives are often
defined from the outset, is geared towards supplying answers that illuminate the issues in
question, and often accompanies a quantitative component. Another benefit of the
Framework Approach are the clearly outlined methods, which facilitate both collaboration
by a number of researchers, and a clear system of analysis that ensures policy makers can
understand the approach taken to obtain results. For these reasons, Framework analysis
was chosen as an appropriate fit with the quantitative work within the wider project.
The features of the Framework Approach are that it is grounded (conclusions are based on
original accounts), dynamic (the approach can change during analysis), systematic
(methodical treatment of data), comprehensive (involves a full review of materials),
facilitates ease of retrieval (of original data), utilises “between” and “within” case analysis,
and is accessible to others (allowing other people to judge the process and interpretation).
The Framework Approach has five distinct stages, but cannot be simply followed for “fool-
proof” outcomes; rather a researcher needs to be creative and discerning in their ability to
see meanings and connections. The five stages are as follows:
1) Familiarization: The researcher becomes immersed in the primary data (such as reading
transcripts, listening to interviews, and studying journals and notes). While the researcher is
132
familiarizing herself with the data, she begins jotting down key issues, concepts and
themes. These jottings will become the thematic framework.
2) Thematic framework: this is derived from the key concepts and themes identified in the
previous step. Data will then be examined and referenced by this framework. The
framework draws in “a priori” issues such as the questions introduced in the interview
guide, the original research aims, as well as what was raised by respondents themselves.
This is not an automatic process, and requires logical thinking and making judgments.
3) Indexing: the thematic framework is then applied systematically to the data (such as
interview transcripts), with sections of text coded against the items in the framework.
Single passages can have several themes, which can assist in identifying patterns.
4) Charting: this process involves building a picture of the data as a whole, and will look to
explain variation or identify patterns. Charts can be laid out thematically (e.g. considering
information for each theme across respondents), or by case (e.g. considering each case
across themes).
5) Mapping and interpretation: finally, once the charting process has been completed, the
data set is interpreted as a whole, in accordance with the key objectives set at the beginning
of the study. The process includes once again reviewing the charts and research notes,
followed by searching for patterns and contradictions, and finally, seeking explanations.
Judgment is required in assessing the relative importance of patterns and contradictions, as
not all identified factors will assist in answering questions set out at the beginning of the
study. The outcome of this process will vary depending on the specifics of the project, but
may include defining concepts, mapping phenomena, creating typologies, finding
associations, providing explanations, and developing strategies.
Data were analysed according to the five steps of the Framework Approach. The interview
transcripts were read in conjunction with the audio files to ensure accuracy of the
transcription, and to assist in the familiarisation with the raw data. Using Nvivo 7 software
(QSR International 2007), a thematic framework was developed initially based on the
original research questions, and as each transcript was read and coded against the
framework, further thematic categories were identified and added. This process began while
interviews were still being performed, and early analysis resulted in additional questions
being included in the interview guide. The framework index is shown in Table 55.
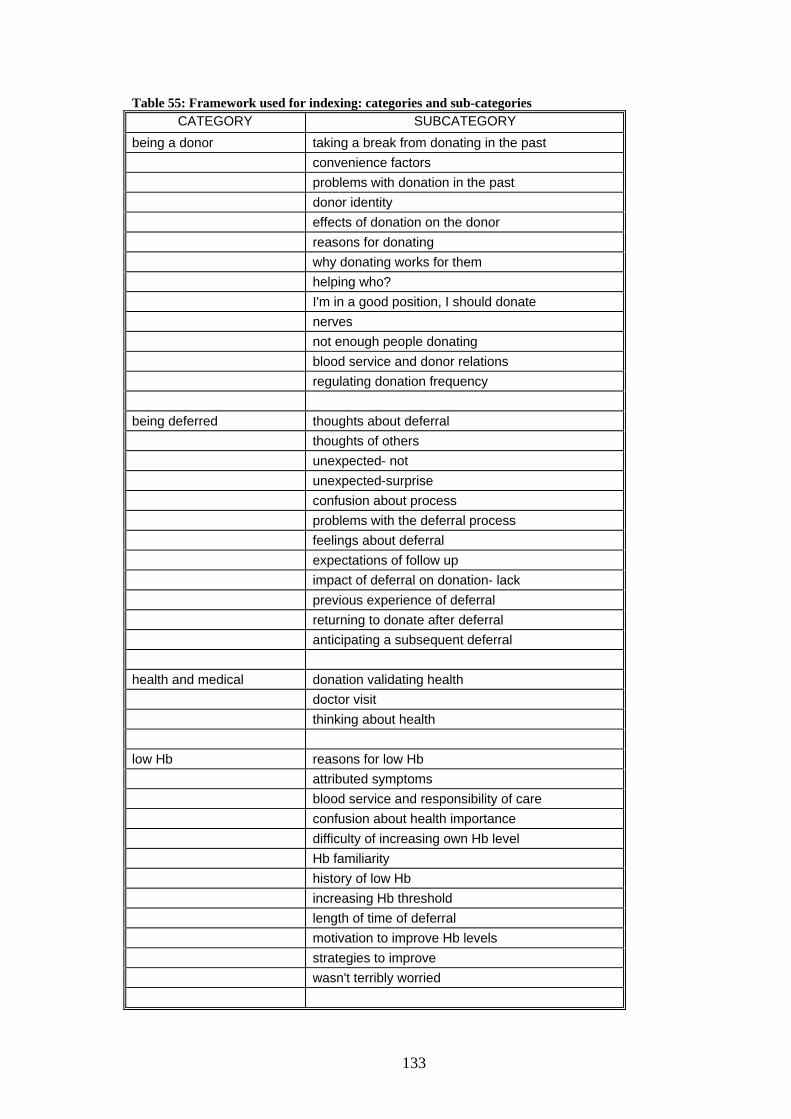
133
Table 55: Framework used for indexing: categories and sub-categories CATEGORY SUBCATEGORY
being a donor taking a break from donating in the past convenience factors problems with donation in the past donor identity effects of donation on the donor reasons for donating why donating works for them helping who? I'm in a good position, I should donate nerves not enough people donating blood service and donor relations regulating donation frequency being deferred thoughts about deferral thoughts of others unexpected- not unexpected-surprise confusion about process problems with the deferral process feelings about deferral expectations of follow up impact of deferral on donation- lack previous experience of deferral returning to donate after deferral anticipating a subsequent deferral health and medical donation validating health doctor visit thinking about health low Hb reasons for low Hb attributed symptoms blood service and responsibility of care confusion about health importance difficulty of increasing own Hb level Hb familiarity history of low Hb increasing Hb threshold length of time of deferral motivation to improve Hb levels strategies to improve wasn't terribly worried
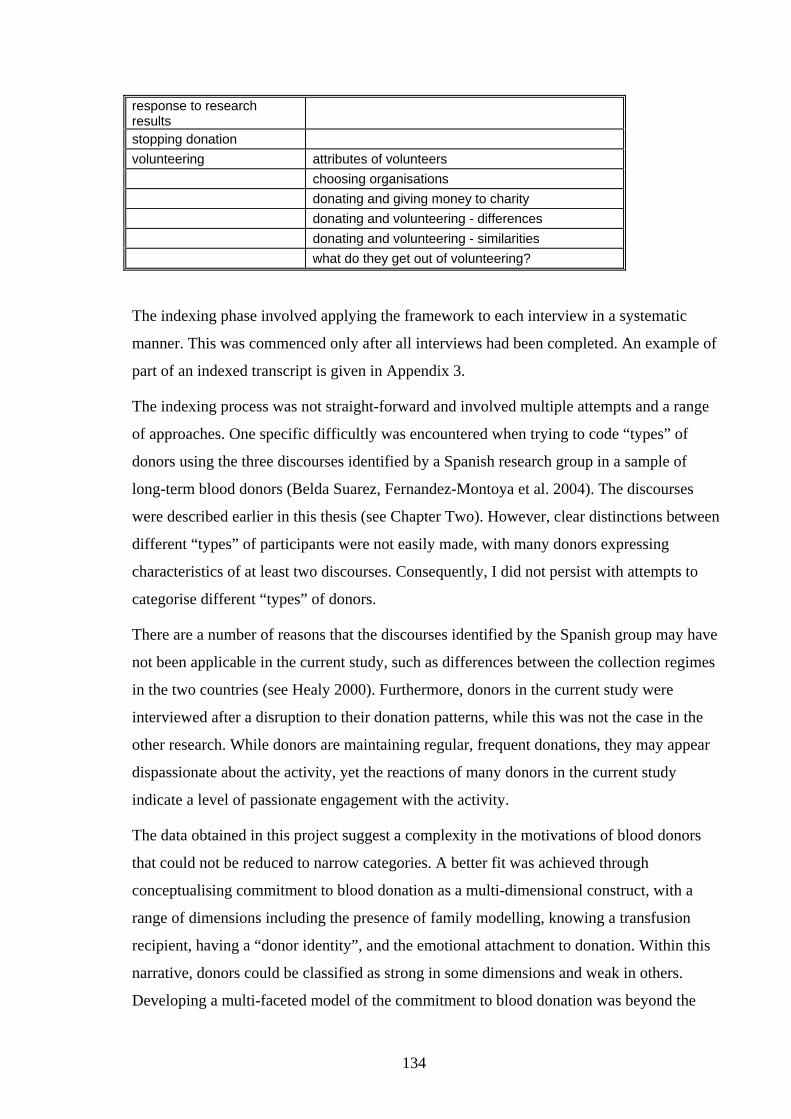
134
response to research results
stopping donation volunteering attributes of volunteers choosing organisations donating and giving money to charity donating and volunteering - differences donating and volunteering - similarities what do they get out of volunteering?
The indexing phase involved applying the framework to each interview in a systematic
manner. This was commenced only after all interviews had been completed. An example of
part of an indexed transcript is given in Appendix 3.
The indexing process was not straight-forward and involved multiple attempts and a range
of approaches. One specific difficultly was encountered when trying to code “types” of
donors using the three discourses identified by a Spanish research group in a sample of
long-term blood donors (Belda Suarez, Fernandez-Montoya et al. 2004). The discourses
were described earlier in this thesis (see Chapter Two). However, clear distinctions between
different “types” of participants were not easily made, with many donors expressing
characteristics of at least two discourses. Consequently, I did not persist with attempts to
categorise different “types” of donors.
There are a number of reasons that the discourses identified by the Spanish group may have
not been applicable in the current study, such as differences between the collection regimes
in the two countries (see Healy 2000). Furthermore, donors in the current study were
interviewed after a disruption to their donation patterns, while this was not the case in the
other research. While donors are maintaining regular, frequent donations, they may appear
dispassionate about the activity, yet the reactions of many donors in the current study
indicate a level of passionate engagement with the activity.
The data obtained in this project suggest a complexity in the motivations of blood donors
that could not be reduced to narrow categories. A better fit was achieved through
conceptualising commitment to blood donation as a multi-dimensional construct, with a
range of dimensions including the presence of family modelling, knowing a transfusion
recipient, having a “donor identity”, and the emotional attachment to donation. Within this
narrative, donors could be classified as strong in some dimensions and weak in others.
Developing a multi-faceted model of the commitment to blood donation was beyond the

135
scope of this project. However, the overall conclusion from attempts to “type” donors is
that people give blood for a range of reasons and describe varying levels of commitment to
the activity.
The next stage of analysis involved charting the transcripts against key themes, which were
chosen for their relevance to the initial research question and diversity of responses across
the participants. The majority of themes were emergent, in that they derived from the
interview discussions themselves, while others were predetermined, in that they arose from
the research aims or directly from the literature. Specifically, this stage involved searching
for patterns in the data, for example exploring whether those returning promptly once
eligible differed in their emotional response to deferral compared to those who did not
return. A list of the key themes is included in Table 56.
Table 56: Key themes for analysis KEY THEMES
Convenience of donation Rewards of giving blood Had a break from donation previously? Deferred previously? Donation can be unpleasant Engagement with donor identity Feels appreciated by the ARCBS? Feeling symptoms of low Hb? Emotional response to deferral Understanding of rationale Giving up donation Hassle factor Hb history Hb knowledge Intention to return Actual return
Finally, mapping and interpretation were completed, a stage which drew on the results of
the charting process as well as findings from the quantitative phases of the project, such as
exploration of the possible reasons males and older donors are more likely to return
promptly. The outcome from this process was the development of a conceptual model.
136
5.4 Results
5.4.1 Presentation of the results
The findings of this study are set out as follows: first, a brief review of the theoretical
concepts used to interpret the results, and second, the results from the indexing phase of
analysis with particular attention to the reasons people begin and continue to give blood,
the circumstances leading to breaks from donation, how donation is viewed in relation to
other pro-social activities, and the experience of deferral from donors’ perspectives. Third,
the chapter presents results from the charting phase, which analysed links between donors’
accounts and whether they returned within nine months of being eligible to do so. Fourth,
the chapter introduces the conceptual model that emerged from the mapping and
interpretation phase; and the chapter finishes with the discussion and concluding remarks.
Framework analysis is directed towards answering a specific question, and the results
presented in this chapter reflect this approach. Other themes and lines of enquiry emerging
from the data were not pursued in this analysis.
5.4.2 Summary of theoretical perspectives
The analysis in this section drew on two role identity theories in interpreting the results:
those proposed by Giddens, and by McCall and Simmons (see the Literature Review in
Chapter 2 for more detail). Giddens’ writings on self-identity were of interest due to their
emphasis on the constant revisability of identity in the current historical period of late-
modernity. McCall and Simmon’s theory was useful as it incorporated a number of the
elements found to be linked with return after deferral in this analysis.
Examination of the reasons people give blood provides possible explanations as to why
commitment to blood donation is readily disrupted. The next section is concerned with this
issue.

137
5.4.3 Views on giving blood
5.4.3.1 “It's a good community thing to do”: Why do people choose to give blood?
Consistent with the literature, participants were motivated to give for the first time for a
range of reasons, including altruism, family modelling, the presentation of a convenient
opportunity and the encouragement of active donors (Oswalt 1977; Piliavin 1990; Robinson
1999; Misje, Bosnes et al. 2005). Most indicated a general desire to help others in the
community.
I just wanted to give my bit to help in any way I can (Dianne, 65)
Just thinking you should do something for the community; somebody might need
my blood (Eric, 57)
A range of additional reasons was also given. Giving blood had personal relevance for
around half of participants, who had either received blood themselves, or knew a
transfusion recipient.
When I was a kid I was really sick and I needed transfusions, when I was about
seven. So I suppose I owe some people a bit of blood (Elizabeth, 49)
I had some friends who went through chemo and radiation because of cancer
(Emily, 17)
Many participants described being motivated to give blood through the example set by a
parent, grandparent, or spouse. The influence of family members worked in three ways:
positive role-modelling, familiarisation with the collection process as a child, and active
encouragement to commence the activity.
Dad always donates, my Mum used to, my grandparents always did (Sasha, 26)
I remember going with my mum once, it’s no hassle, they lie on the bed, you get a
nice drink, it doesn’t hurt, feed you afterwards, and off you trot (Susan, 47)
One day came home and Mum goes…“oh you know, you could have an afternoon
off from school, you know, if you want to give blood” (Emily, 17)
138
Most participants had thought about giving blood for a long period of time before their first
attempt. However, intentions were often translated into action after a specific trigger, such
as encouragement from others, the opportunity to give blood in an organised group, the
resonance of a particular appeal for blood donors, and the presentation of a convenient
opportunity.
That’s how I originally gave, one of the guys at work was going to give blood, he
said why don't you come down (Eric, 57)
Whenever they cried out on the TV for blood donor after the Bali Bombing… I
thought yes I must give blood but it was only when they really cried out I went
“okay now act on it” (Kate, 44)
The first time I just sort of walked past and thought “well I’ve got a break, you
know, may as well do something in the break” (Cassie, 21)
Several donors described giving blood for the first time in an organised group, such as a
workgroup, a community organisation, or with friends. This approach had two main
advantages: social support helped overcome fear about the process, and it also eliminated
the need to personally investigate logistical details of how, when and where to donate.
I just felt that, that it would be the right thing to do, you know, I was young and fit
and healthy, and they needed blood… you had courage, ‘cause all your workmates
would go in with you (Sandra, 45)
It’s something that had always been on my mind to do but I guess like a lot of
people it’s quite nerve wracking, thinking of needles, …Mainly having someone I
could go with as well, helped fight the fear a bit (Sasha, 26)
My mate and his Mum used to go … and he’s like, “I’m going to give blood with
my Mum, guys come along”. So a whole bunch of us went down one day (Chloe,
18)
Sophie, who was deferred at her first donation attempt, attended to give blood with a work
group. When asked why she donated on that particular occasion, after considering giving
blood for years, she replied:

139
Because it was organised for me…Because it was easy. Because I didn’t have to
think (Sophie, 24)
5.4.3.2 Giving blood beyond the first donation
Most participants described being motivated to continue giving blood by the same concerns
that led to their first donation. Additionally, some reported that personal experiences had
galvanised their commitment.
I guess being in the hospital system you see people come in and they’re very sick
and that sort of thing, and you just walk through ITU or ICU, you say to yourself
“why not? Why not” (Richard, 49)
Several donors described how the decision to give blood was no longer under their
conscious control, indicating the importance of habit in their commitment to give regularly.
Habit…You’re helping somebody (Patricia, 59)
It’s just something I do and I don’t think twice about it (Cynthia, 64)
It’s not something that you really think about, it’s just something that you do once
every three months (Chloe, 18)
5.4.3.3 Supportive environments to continue donating
Donors described a number of ways that attendance to give blood had been facilitated by
supportive structures. Several donors described being allowed by their employers to give
blood during their work hours.
I worked for the Government. They gave me time off, on full pay (Barry, 54)
In (REGIONAL CENTRE) you could get out of school if you went and gave blood.
So of course I got out of school to give blood (Elizabeth, 49)
Others continued to give as part of an informal group.
I go with my mates … donate blood, then go get something to eat… almost as a
social thing (Chloe, 18)
However, the majority of participants did not appear to be supported by their workplace or
social group to donate blood. A lack of support was acknowledged as making it difficult to

140
continue giving blood, particularly if the donor had previously been supported in this way.
Richard, for example, had previously donated at a mobile collection site at his workplace,
however changes to collection practices forced him to find a new collection site and attend
out of work hours.
There used to be one here, run at the [hospital], for a long time, but that stopped,
right, they don’t come here no more. Which makes it harder for me to donate
(Richard, 49)
Several activities undertaken by the ARCBS were recognised to encourage commitment.
Methods included recognition through small incentives, regular mail correspondence, and
scheduling future appointments immediately following donation. However, participants
saw the techniques as subtle motivators, and believed that the major drive remained with
donors.
When they send the letters out, they ask in a nice way that “It’s time to give your
blood again”…… the letter invites you to come give blood and then the rest is up to
you (Barry, 54)
Currie St always offers you to come back, to make an appointment, that sort of
encourages you to make an appointment and then to keep it, you know. If you have
an appointment it’s different (Pam, 49)
5.4.3.4 What does it mean to be a “blood donor”?
Participants were asked to reflect on whether they saw themselves as a “blood donor”, and
those who stated that they did were asked to elaborate on what that role meant to them.
Being a “blood donor” was predominantly seen as eliciting positive self-perceptions, such
as being unselfish, useful, and community-minded.
I’m quite proud to say that I do it … I guess it just helps make you be the person
you want to be, like everyone wants to be a good person so it definitely makes you
feel good about yourself, and that you’re contributing to others that need your help
(Sasha, 26)
I guess there’s a bit of a sense of pride involved in doing it…I don’t know, it feels
good, like the civic responsibility…as far as I’m concerned, I can’t see any reason
not to do it (Blake, 22)
141
You do feel as if you are helping out, cause even in all other aspects of life where
you do selfish things like your life is focussed on yourself, so it’s all your job and
things that you want …you can do something without having to give money or
without having to give a lot of time and do things (Chloe, 18)
Some saw the role as making them superior to people who were not prepared to go through
the inconvenience of donation.
I see myself as a blood donor, I see…myself as someone who can put themselves
out a little bit to help someone else… I guess you feel that you’re just a little bit
superior to people who can’t be bothered (Patricia, 59)
Donors across a broad range of age groups described a perception that giving blood was an
appropriate activity for someone enjoying good health.
[Donation is] a community thing that you can do because you consider yourself to
be healthy and fit (Kate, 44)
Not everyone can give blood, so if you can you should (Chloe, 18)
I’m fairly healthy. One regular partner… I’m in a good position, I should do it
(Heather, 45)
Consequently, meeting the criteria to give blood reinforced an individual’s status as a
healthy person.
[advertisements] say that it takes a special person to give blood because you go
through the list [asking] “had a tattoo, have you had any STDs and have you been
overseas in this time?” and they ask you millions of questions and you feel good
ticking off, “no I’ve not got any of these problems” and everything’s fine, sort it
validates it, I’m doing okay (Chloe, 18)
I must be healthy, my blood’s ok (Sandra, 45)
Many noted that the main attraction of giving blood was that it was a way to help others
with little personal cost. This was particularly noted in relation to discussions of how blood
donation compared to other altruistic activities, such as volunteering time or donating
money to a charity.

142
I don’t do anything wonderful, but it doesn’t cost me anything, just time… and I
help someone that I don’t know, so that’s good (Pam, 49)
Overwhelmingly, participants viewed blood donation as a voluntary activity, in the sense
that they were not paid for their contribution or forced to give, yet they made the distinction
that the activity was not “volunteering”. Donating blood was seen as a smaller investment
of time and energy than volunteering, and an activity that didn’t require a regular and
sustained commitment. In this way, donation represents an easy and convenient way to help
others.
It’s a convenience volunteering, I suppose (Susan, 47)
It doesn’t take up much of your time and it’s not something where you have to
apply yourself to do… it’s probably the most easiest thing you can do that is
helping the community (Blake, 22)
It’s not like I’m [an] “involved in the community” type of person, I don’t go to
fundraising events, if someone comes to the door, I’ll give a bit of money but it’s
not really involved in community activities, churches and things like that, but
giving blood you just see it literally helps someone without any effect to you, is, just
donating a bit of your time (Chloe, 18)
Giving blood was possible regardless of an individual’s financial situation.
We have still got three young children at home, so money doesn't come readily
enough to give away to other people. We have got to look after our own, but you
can do that [donation] for no outlay (Judith, 41)
Another appealing characteristic of blood donation was that donors gave as part of a pool,
making a small contribution to the community blood supply. Postponing donation was not
perceived to have catastrophic consequences.
It’s not the end of the world if I didn’t turn up. But whereas if you were
volunteering at a library or serving the Meals on Wheels or whatever, you’re very
much a cog in the system. And you’d really notice if a driver didn’t turn up.
They’re not going to notice one person not turning up to give blood (Heather, 45)
143
It’s not like you don’t go one day and everything’s going to crash down. Like you
help when you can (Blake, 22)
The blood service was seen as actively supporting this view. For example, one donor felt
that the organisation had a “no pressure” approach to requesting donations.
It’s not really a “ in your face” organisation, it’s pretty low key. Like they’ve got
the adverts and just like give blood if you can and they coming knocking once, like
once a year sort of raising money. It’s not like a guilt thing, like some charities
you feel really guilty, and they’re not, they’re just “if you can help out please do”,
it’s not, you know it’s your choice (Chloe, 18)
Blood donation was also perceived to provide less individual rewards than volunteering.
Volunteers were seen to be rewarded by social interaction with recipients, and gratified by
witnessing first-hand the effects of their contribution, while blood donors enjoyed relatively
fewer concrete benefits.
I think something like the meals on wheels thing is probably rewarding because
you are getting to know other people in the community and you’re working along
side them … so there’s that interaction more than volunteering to just to go and
give blood (Mary, 51)
The unique life-saving role of a blood donation meant that blood tended to be viewed as
more useful and special than a financial contribution to charity, and one less prone to
wastage and mismanagement.
So much of the money they collect just doesn’t get to where it’s needed, where it’s
intended, it gets eaten up on the way … The blood gets there, it doesn’t get slurped
out by all the bureaucrats on the way (Patricia, 59)
Overall, being a “blood donor” was commonly seen as validating individuals as caring,
unselfish, and healthy people, who were able to help others in a real and practical way that
was nevertheless easily achieved within a busy life.
5.4.3.5 Positive aspects of giving blood
In addition to enhanced self-perceptions, participants experienced a wide range of benefits
from giving blood. Some participants spoke about donation as a free health check.
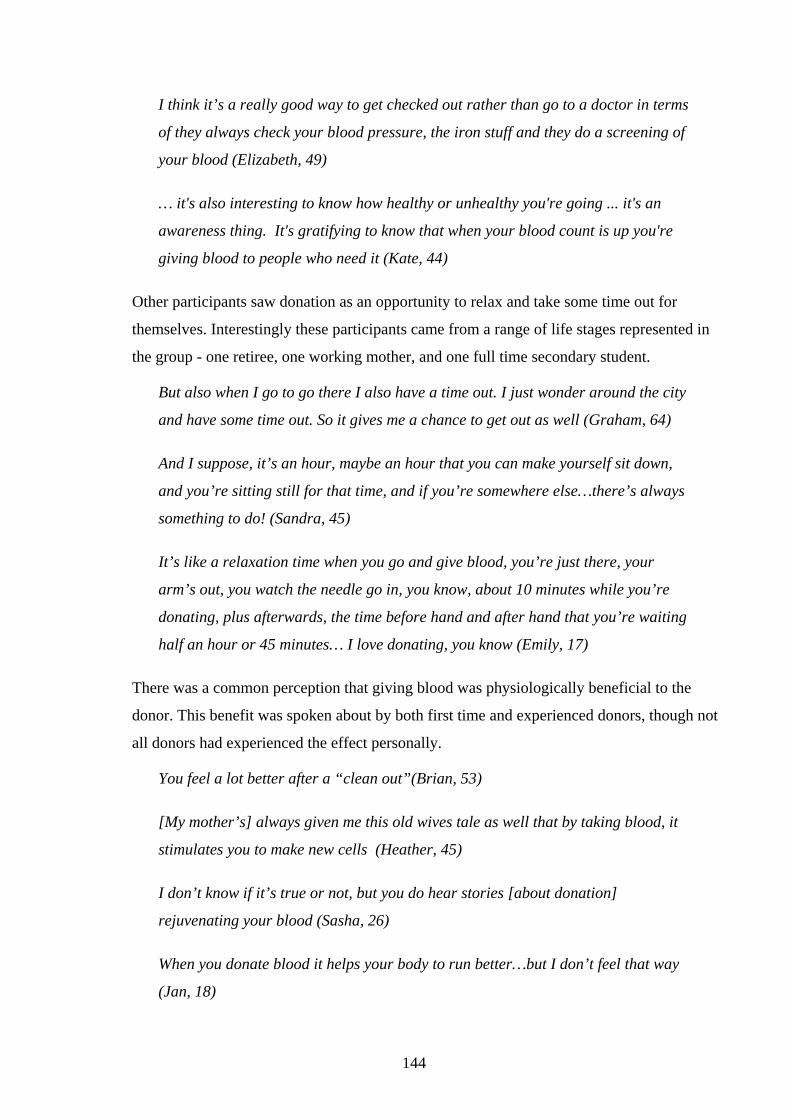
144
I think it’s a really good way to get checked out rather than go to a doctor in terms
of they always check your blood pressure, the iron stuff and they do a screening of
your blood (Elizabeth, 49)
… it's also interesting to know how healthy or unhealthy you're going ... it's an
awareness thing. It's gratifying to know that when your blood count is up you're
giving blood to people who need it (Kate, 44)
Other participants saw donation as an opportunity to relax and take some time out for
themselves. Interestingly these participants came from a range of life stages represented in
the group - one retiree, one working mother, and one full time secondary student.
But also when I go to go there I also have a time out. I just wonder around the city
and have some time out. So it gives me a chance to get out as well (Graham, 64)
And I suppose, it’s an hour, maybe an hour that you can make yourself sit down,
and you’re sitting still for that time, and if you’re somewhere else…there’s always
something to do! (Sandra, 45)
It’s like a relaxation time when you go and give blood, you’re just there, your
arm’s out, you watch the needle go in, you know, about 10 minutes while you’re
donating, plus afterwards, the time before hand and after hand that you’re waiting
half an hour or 45 minutes… I love donating, you know (Emily, 17)
There was a common perception that giving blood was physiologically beneficial to the
donor. This benefit was spoken about by both first time and experienced donors, though not
all donors had experienced the effect personally.
You feel a lot better after a “clean out”(Brian, 53)
[My mother’s] always given me this old wives tale as well that by taking blood, it
stimulates you to make new cells (Heather, 45)
I don’t know if it’s true or not, but you do hear stories [about donation]
rejuvenating your blood (Sasha, 26)
When you donate blood it helps your body to run better…but I don’t feel that way
(Jan, 18)

145
Participants enjoyed the social atmosphere at the donor centre, and spoke of positive
interactions with other donors.
The people are really nice, you know, around you… just a bit of camaraderie
(Sandra, 45)
You meet the people when you’re waiting … I actually met a really nice lady who
was sitting in opposite seats …, and just started talking to her, about her life and
everything, and she’s been donating since she was 16, she was now 46 years old.
30 years of donating blood. She goes “are you thinking of donating for longer than
me” and I’m like “I think so” (laughs) (Emily, 17)
Donors also appreciated the physical environment at the collection site, with benefits
including complimentary refreshments, magazines, and television programs.
Everyone that is down there is really nice, the old ladies come around offering coke
or iced coffee and you get the magazines and the biscuits and so you sort of sit
round the table afterwards …It makes you want to come back (Chloe, 18)
Finally, positive self-perceptions, such as feeling like a good person, were facilitated by the
way donors were treated by staff at the collection site. Many participants, though not all,
felt valued and appreciated by the organisation.
They make you feel welcome. And they make you feel if you have done something
really good and afterwards, they always sort of thank you for doing it…they sort of
make you feel, how should I put it, special (Dianne, 65)
All the nurses are always really nice and the tea ladies who donate their time
always have a chat and they’re very sweet… Looking after donors, making
everybody feel welcome there, rebooking your donation, and then you’re
appreciated. You get a pat on the head (laughs) (Susan, 47)
The range of extrinsic and intrinsic benefits a donor might experience are shown in a
diagram below (Figure 29).
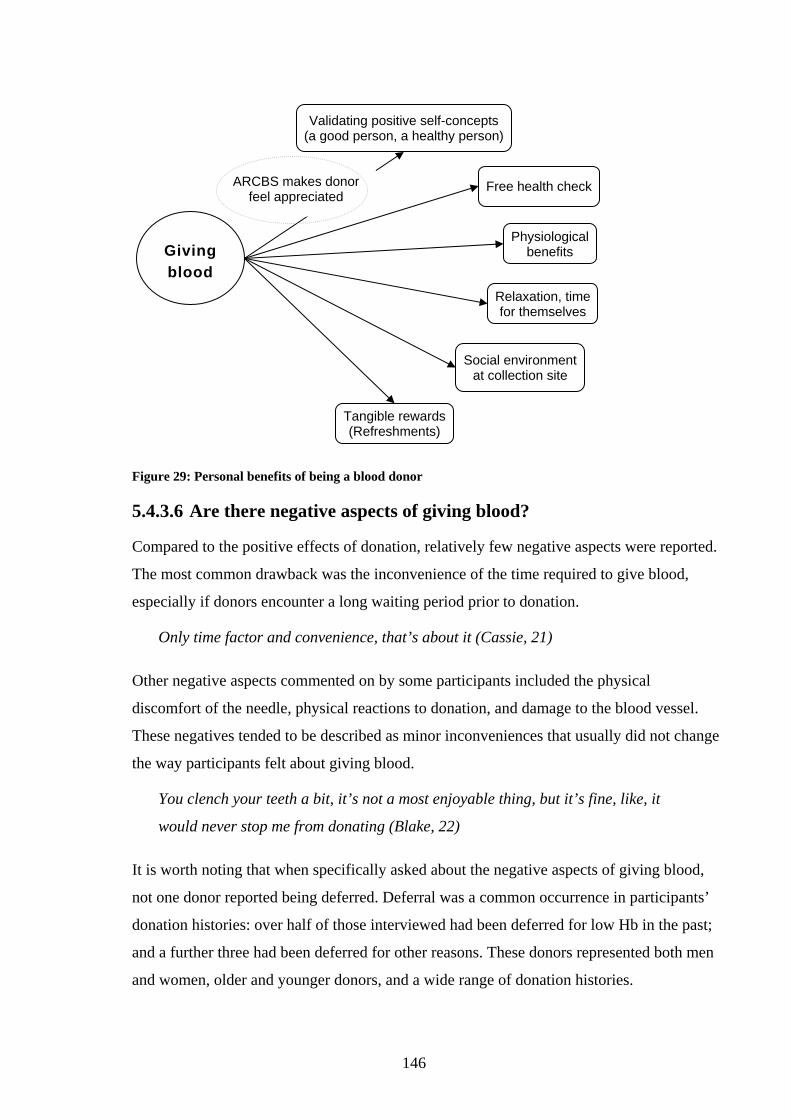
146
Figure 29: Personal benefits of being a blood donor
5.4.3.6 Are there negative aspects of giving blood?
Compared to the positive effects of donation, relatively few negative aspects were reported.
The most common drawback was the inconvenience of the time required to give blood,
especially if donors encounter a long waiting period prior to donation.
Only time factor and convenience, that’s about it (Cassie, 21)
Other negative aspects commented on by some participants included the physical
discomfort of the needle, physical reactions to donation, and damage to the blood vessel.
These negatives tended to be described as minor inconveniences that usually did not change
the way participants felt about giving blood.
You clench your teeth a bit, it’s not a most enjoyable thing, but it’s fine, like, it
would never stop me from donating (Blake, 22)
It is worth noting that when specifically asked about the negative aspects of giving blood,
not one donor reported being deferred. Deferral was a common occurrence in participants’
donation histories: over half of those interviewed had been deferred for low Hb in the past;
and a further three had been deferred for other reasons. These donors represented both men
and women, older and younger donors, and a wide range of donation histories.
Physiological benefits
Free health check
Relaxation, time for themselves
Social environment at collection site
Tangible rewards (Refreshments)
Giving blood
Validating positive self-concepts (a good person, a healthy person)
ARCBS makes donor feel appreciated

147
Several of those who were interviewed after their first deferral explained that they didn’t
realise the outcome was possible.
You know, all I really thought about was if you were unwell, you don't go. That
was basically as far as I thought about it, I hadn't heard of anyone getting deferred
before (Judith, 41)
5.4.3.7 Who identifies with a “blood donor” role identity?
The majority of interviewees indicated they saw themselves as a “blood donor”. Some
articulated how being a blood donor had become incorporated into their idea of themselves.
I’ve just been doing it for so long, its part of me now… (Cynthia, 64)
It’s just a part of me (Sasha, 26)
Not all donors indicated this level of engagement with the identity, with four participants
explicitly stating they did not see themselves as blood donors at all, and a further two
noting they had not previously seen themselves as blood donors during lengthy breaks in
their donation history.
I guess not yet because I haven’t done it yet (Sophie, 24)
Now I’m going back, I do (Sandra,45)
These findings support McCall and Simmon’s theory of role identity, suggesting that
successful enactment is critical to reinforcing identity claims. Self-perceptions are very
much reliant on successful participation in the activity, rather than intentions, and may
diminish when the donor is unable or ineligible to give.
Other aspects of McCall and Simmon’s theory were also present in descriptions of what it
meant to be a blood donor. For example, the necessity of opportunity and ability to donate
contributed to Heather’s and Blake’s understanding of the role.
It’s just something you’re able to do. While you’re able to do it, you should
(Heather, 45)
It feels good to be doing it because you can, and there’s really nothing difficult and
nothing hard to do (Blake, 22)

148
Two experienced donors, Mary and Susan, did not currently identify as “blood donors”.
Mary conceded that even though she didn’t define herself that way, she had experienced
social recognition of the role.
Although the doctor did say the other night when I was there, she only charged me
the Medicare rate, she didn’t charge the actual gap. She said “oh we need to look
after our blood donors” and I thought “ooh I must be special” because I didn’t
think of it that way, so that was nice, I did appreciate that (Mary, 51)
Earlier in her donor career, Mary was unable to give blood when mobile collection services
stopped visiting her town, and those who wished to continue had to travel over 45kms to
give blood. Perhaps not surprisingly, she didn’t feel that the organisation appreciated her
individual contribution.
That’s a funny word, appreciated. It’s sort a bit like a cattle run, you go in, you
give your card, you get called out, you go here, you get lined up there and you go
to the next one, so I don’t know if appreciated is the right word (Mary, 51)
Like Mary, Susan didn’t identify with the “blood donor” role identity, but for different
reasons. Susan saw her contribution as being similar to other types of volunteering or
charity work she could be doing, meaning that the “blood donor” role held no particular
significance above other types of altruistic behaviour.
I just think it’s like giving to the Salvos, you know, a little bit of charity work here
and that’s the same type of thing, it’s probably just a bit more personal (Susan, 47)
5.4.4 Ceasing donation
5.4.4.1 How do donors feel about stopping donation?
A prominent theme in the interviews was that, for the most part, donors did not actively
plan to stop giving blood. When asked whether they had considered ceasing donation, most
suggested that the decision would be imposed upon them, rather than an active decision to
stop.
I think it is just one of those things that would happen, as time went by they’d say
I’m too old, or blood’s not good enough …Unless I was ill or…couldn’t get there
sort of thing, for some reason (Cynthia, 64)
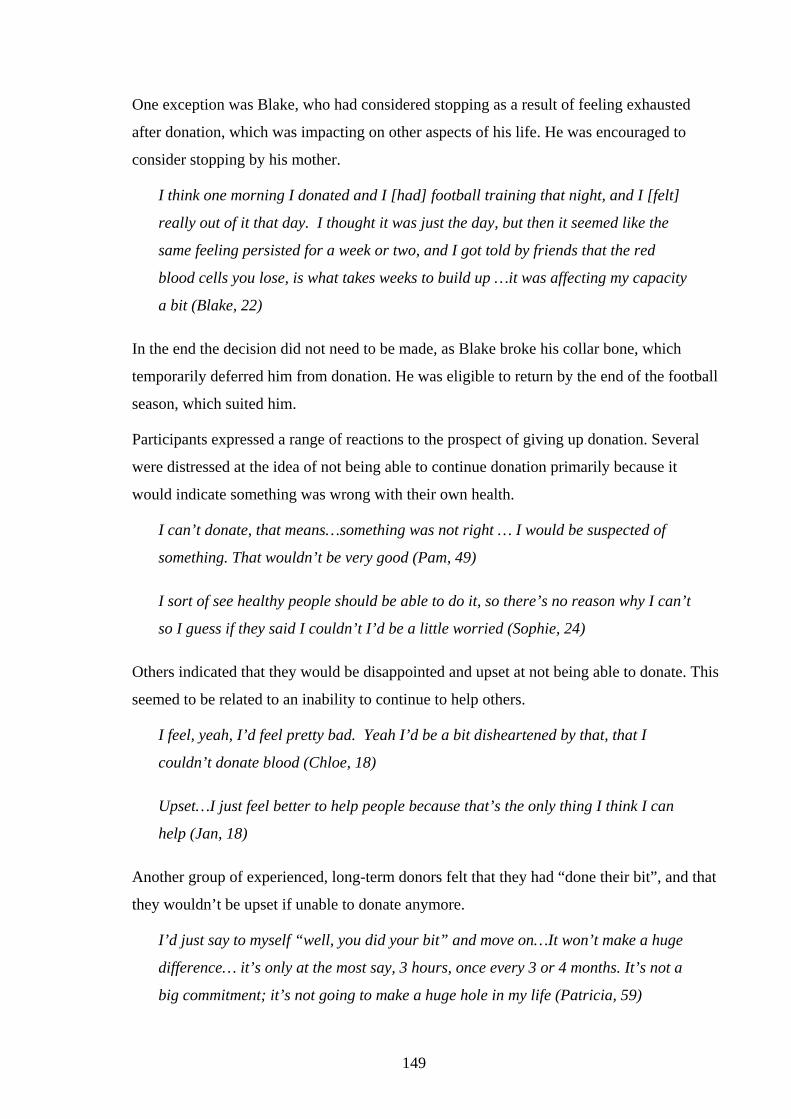
149
One exception was Blake, who had considered stopping as a result of feeling exhausted
after donation, which was impacting on other aspects of his life. He was encouraged to
consider stopping by his mother.
I think one morning I donated and I [had] football training that night, and I [felt]
really out of it that day. I thought it was just the day, but then it seemed like the
same feeling persisted for a week or two, and I got told by friends that the red
blood cells you lose, is what takes weeks to build up …it was affecting my capacity
a bit (Blake, 22)
In the end the decision did not need to be made, as Blake broke his collar bone, which
temporarily deferred him from donation. He was eligible to return by the end of the football
season, which suited him.
Participants expressed a range of reactions to the prospect of giving up donation. Several
were distressed at the idea of not being able to continue donation primarily because it
would indicate something was wrong with their own health.
I can’t donate, that means…something was not right … I would be suspected of
something. That wouldn’t be very good (Pam, 49)
I sort of see healthy people should be able to do it, so there’s no reason why I can’t
so I guess if they said I couldn’t I’d be a little worried (Sophie, 24)
Others indicated that they would be disappointed and upset at not being able to donate. This
seemed to be related to an inability to continue to help others.
I feel, yeah, I’d feel pretty bad. Yeah I’d be a bit disheartened by that, that I
couldn’t donate blood (Chloe, 18)
Upset…I just feel better to help people because that’s the only thing I think I can
help (Jan, 18)
Another group of experienced, long-term donors felt that they had “done their bit”, and that
they wouldn’t be upset if unable to donate anymore.
I’d just say to myself “well, you did your bit” and move on…It won’t make a huge
difference… it’s only at the most say, 3 hours, once every 3 or 4 months. It’s not a
big commitment; it’s not going to make a huge hole in my life (Patricia, 59)

150
I don’t think it would worry me, I just think I’ve done my bit (Cynthia, 64)
Two of the longest serving donors, Cynthia and Eric, noted that their continued
commitment to giving blood depended on the activity remaining easy and hassle-free.
It’s no hassle, you know you just go in and you do it… I think if it was a big hassle
you’d think twice, you know you’d think “oh I can’t be bothered”, and then, you
stop doing it once or twice and then you’d probably get out of that habit and not
go. So, you know, provided it’s easy. (Cynthia, 64)
Not really I think, unless it was really hard to get to (Eric, 57)
5.4.4.2 Why did donors stop giving in the past?
Though donors were reluctant to say they might cease donation of their own accord, many
discussed circumstances surrounding previous breaks from donation.
There were two common factors contributing to a break: changes in personal circumstances
that made donation inconvenient, and changes in ARCBS policy or procedures that made
donation less convenient. Many times, though not always, breaks began due to temporary
ineligibility or an unsuccessful donation attempt, which happened to coincide with life
changes (such as ineligibility due to pregnancy, followed by the responsibilities of caring
for young children). The combination of life events and decreased opportunity for donation
resulted in short breaks from which donors did not readily return, even once circumstances
were more favourable. These donors could be thought of as “unintentionally lapsed”.
Common events leading to breaks from giving blood are demonstrated graphically in
Figure 30.
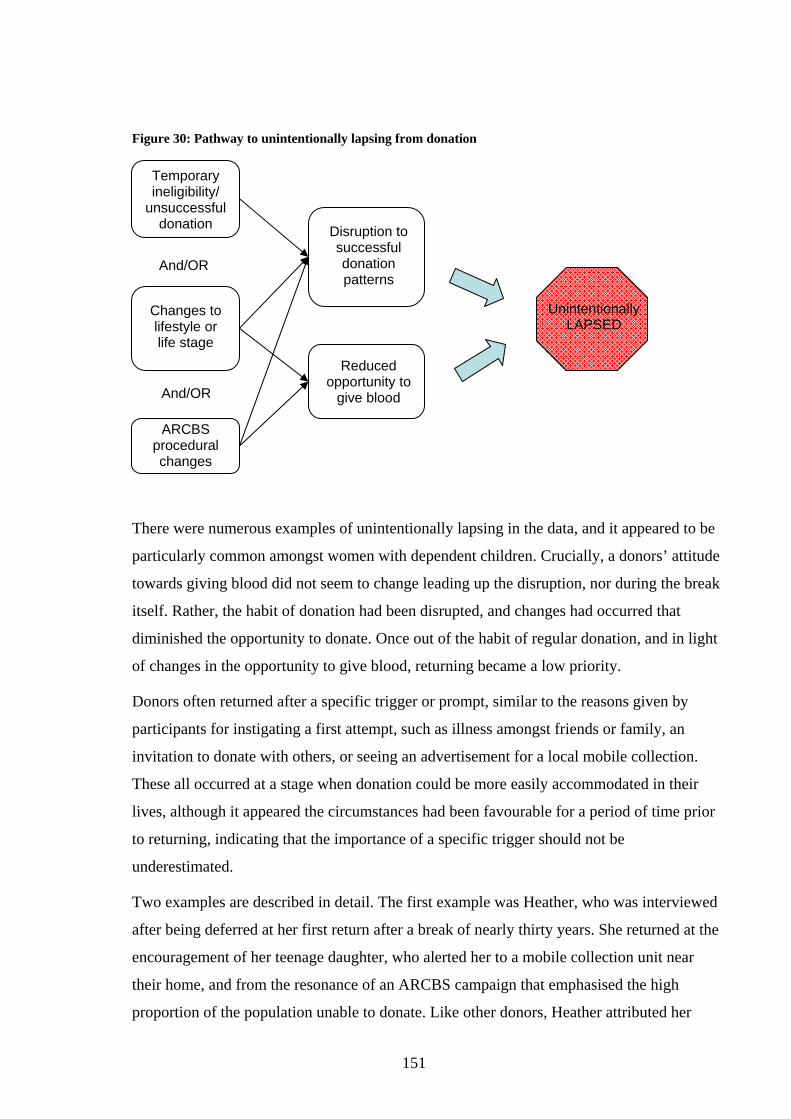
151
Figure 30: Pathway to unintentionally lapsing from donation
5.4.4.3
There were numerous examples of unintentionally lapsing in the data, and it appeared to be
particularly common amongst women with dependent children. Crucially, a donors’ attitude
towards giving blood did not seem to change leading up the disruption, nor during the break
itself. Rather, the habit of donation had been disrupted, and changes had occurred that
diminished the opportunity to donate. Once out of the habit of regular donation, and in light
of changes in the opportunity to give blood, returning became a low priority.
Donors often returned after a specific trigger or prompt, similar to the reasons given by
participants for instigating a first attempt, such as illness amongst friends or family, an
invitation to donate with others, or seeing an advertisement for a local mobile collection.
These all occurred at a stage when donation could be more easily accommodated in their
lives, although it appeared the circumstances had been favourable for a period of time prior
to returning, indicating that the importance of a specific trigger should not be
underestimated.
Two examples are described in detail. The first example was Heather, who was interviewed
after being deferred at her first return after a break of nearly thirty years. She returned at the
encouragement of her teenage daughter, who alerted her to a mobile collection unit near
their home, and from the resonance of an ARCBS campaign that emphasised the high
proportion of the population unable to donate. Like other donors, Heather attributed her
Disruption to successful donation patterns
Unintentionally LAPSED
ARCBS
procedural changes
Changes to lifestyle or life stage
And/OR
And/OR
Temporary ineligibility/
unsuccessful donation
Reduced opportunity to
give blood

152
stopping donation due to a number of contributing factors, including lack of convenient
opportunity, small children, and a busy lifestyle, but the main event triggering the break
was a change in work locations. She believed that “laziness” stopped her from returning
once her circumstances had changed.
It’s just that busy stuff, like location, little kids, working, all those sorts of things,
they were greater issues than me to really rush out and give blood. And laziness on
my part, of getting back into it… the only reason I stopped was I changed jobs and
from being in the city where it was convenient, I went right out to (OUTER
SUBURB) and there was sort of no way I could get to that. It was just purely…
logistics I suppose, you know, until finally they started the mobile services. I
always had great intentions of going back to the city, but never got there. (Heather,
45)
Susan, who had donated “off and on” since her first donation, described how a previous
low Hb deferral coincided with a change in the location of her most convenient donation
site, and long waiting times at the new collection facility. Susan also recognised that a
twelve month break from donation meant that her “habit” had been broken.
After the first time I got knocked back, I think it was 12 months that I couldn’t give
blood, and you do kind of get out of the habit of it and then that’s the same time
that it changed, and it moved, and so you had to make a conscious effort to always
remember to go down , and sometimes you could sit there for an hour before you
were actually seen, and at that stage, you think you’re giving yourself enough time
but the kids had to be picked up from school and something else, and so you’d sit
there for an hour and then you can’t possibly wait any longer, then go. So a couple
of times it was inconvenient in that regard (Susan, 47)
However one participant described intentionally delaying returning after an unsuccessful
donation attempt. On one occasion, Pam was unable to donate due to poor blood flow,
which the nurse attributed to inadequate fluid intake. She initially stated the reason for slow
return was “laziness”, however, when prompted to reflect on why donors might not return
after deferral, she offered a different perspective, suggesting that she had deliberately
avoided returning.

153
Actually it might be because they refused me, once …I did have a feeling that “oh I
don’t really want to come back”, you know…like you want to give and you’re being
refused…bad thoughts kind of hang around (Pam, 49)
Part of the negative reaction to her experience appeared to be that the issue had been
encountered previously and successfully overcome, yet on this occasion, inexplicably,
blood could not be taken. Additionally, Pam was accused of not preparing herself
adequately for donation, which she believed was unfair.
I felt like I already drank enough normally, like, and my vein is always small
anyway, I can’t make it any bigger ... It’s always small, you just have to try …you
were always able to and why is it this particular one that you refuse me? (Pam, 49)
Pam went on to describe how her feelings towards the organisation had changed as a result
of the experience.
I think my feeling was negative to the organisation…[thinking] “you should have
tried better to take it”… I was willing to give and you didn’t take it, you know, bad
luck… I didn’t make the appointment as I would normally have … then because my
daughter was willing that I went back. (Pam, 49)
There were examples of successful return after an unsuccessful donation attempt (including
deferral). Graham, Patricia, Dianne, and Cynthia, four of the most experienced donors, all
reported having breaks in the past due to travel or illness, but indicated their break lasted no
longer than the specific circumstances blocking their return. These returns were
characterised by the ongoing convenience of donation.
I had a couple of operations and I had to stop for a year. I had both knees
replaced and I gave, I had to give six lots of my own blood and I could only give
four so therefore I had two of somebody else’s, which means I had to have a break
for twelve months. I think that's the only time…I just rang up after twelve months
and said “I’m available, you know, can I have a date” (Cynthia, 64)
5.4.4.4 Why is it so easy to lapse from donation?
In order to understand why it is so easy for donors to lapse from donation, it is helpful to
recall the reasons why they gave blood in the first place.

154
Analysis of participants’ motivation to start and continue donation paints a picture of a
group of people who have a desire to help others in their community, and find that donation
is a way to achieve this within the parameters of their busy lives.
The convenience of donation appears to be a double-edged sword. Donors recognise that
they give blood as part of a pool, and that donation is something that can be put off until it
is more convenient without letting anyone down. The fact that donation is so easily put off
was part of the reason donation fits readily in participants’ lives, particularly for younger
and middle-aged donors. However, if blood donation becomes more difficult, whether
caused by lifestyle changes, such as having children or changing work location, or ARCBS
policy changes that decrease the opportunity to donate, the activity no longer fulfils the
“easy and convenient” criteria.
Sophie, who was deferred at her first donation attempt, observed that intentions to give
didn’t necessarily translate into action within her work place.
I know for example in our office, when the email came around…“ do you want to
be involved with this”, a lot of people said yes, and then on the day they were
either really busy, or had a lot of work to do, and they just didn’t go… I guess it’s
easy to say no to (Sophie, 24)
The next section summarises participants’ intentions to return and which participants
returned promptly after being eligible to do so. This leads into the results of the charting
stage of analysis, which identified the coding categories consistently linked with whether or
not a donor returned.
5.4.5 Returning promptly after deferral
5.4.5.1 Intention to return
At the time of the interviews, participants’ intentions to return once eligible had little
bearing on their actual return behaviour nine months later. Every participant stated a strong
intention to return once eligible. Just one donor, Elizabeth, stated she planned to delay her
return by approximately twelve months in order to have enough time to build up her iron
stores, but, she too planned to return after this period had lapsed.
155
5.4.5.2 Prompt return from deferral
Eleven of the twenty-three participants who contributed to this chapter had returned within
nine months of being eligible to do so. An additional two donors were not eligible to return,
with NBMS records indicating that Dianne had contacted the blood service to advise them
she was only eligible to donate once a year (presumably on her doctor’s advice), and a note
that Mary was deceased. Ten of the twenty three participants had neither returned, nor
advised the ARCBS of their ineligibility to do so.
5.4.5.3 Demographic and donation factors linked with return
While not the primary purpose of this study, comparisons were made between the
demographic characteristics of returning and non-returning donors in this study and other
phases of the project. The first clear pattern was that those who had not given blood in the
previous year were less likely to return. This category included those who had never
attended to give blood (Sophie), never successfully given (Cassie and Brian), and were
returning for the first time after a substantial break (Heather). Just one member of this
group, Sophie, returned within nine months of being eligible to do so. On the other hand,
both donors who had given four times in the year before deferral returned (Emily and
Blake). This supports the conclusion from other parts of this study that those without the
habit of regular donation are less likely to return than those who frequently donated prior to
deferral.
Analysis in the previous chapter showed no difference in the overall likelihood of return
between males and females, although females returned more slowly than males (see
Results: Part One). Consistent with this finding, all but one male participant had returned
within nine months of eligibility, with the only non-returning male having not given blood
in the year before deferral (Brian). Non-returning females tended to come from a particular
group that had not been identified in the quantitative analysis in other phases of the study.
Unexpectedly, none of the five female donors with dependent children returned within nine
months of being eligible to do so.
5.4.6 The “hassle” of deferral
The charting process found few patterns between the ways participants described their
deferral and whether or not they returned. For example, non-returning donors were no more
likely to be strongly distressed by their deferral, confused by the information, or have a

156
poorer understanding of the role of haemoglobin in the body. There were two exceptions,
with non-returning donors Judith and Jan both describing poor staff treatment that resulted
in their feeling unvalued and unappreciated.
It did appear, however, that all participants encountered one or more elements of “hassle” at
or following the deferral event. The hassle of deferral pertained to confusion, frustration,
and bad feelings arising from the explanation and treatment at the deferral event, difficult or
unpleasant experiences when seeing their GP, lifestyle changes required to improve their
levels, and an introduction (or reminder) to the reality that not every attempt at donation
will be successful. This section will concentrate on aspects of the deferral that differentiated
the event from a successful donation attempt.
5.4.6.1 Emotional responses to deferral
The first element of hassle is the adverse feelings that many donors reported experiencing
in response to deferral. Negative emotions resulted from denial of the opportunity to help
and the disruption to the donors’ self-perceptions as capable, competent, and healthy
individuals. Others were anxious about a possible underlying condition, annoyed at having
their time wasted, or upset with the way they were treated by collection staff.
Four participants were classified as having strong negative reactions to deferral, with a
large group expressing lesser negative reaction, however the reasons for being upset varied
widely. Three of the four donors (Dianne, Emily, and Kate) all appeared to have strong
“blood donor” identities, and described a strong desire to help others, while also seeing
donation as being personally rewarding. Kate additionally felt responsible for her low
levels. These donors were likely to have been upset by a disruption to their self-concepts as
capable, healthy donors.
I sort of felt like I had let everybody down… That makes me more depressed, that I
couldn't give it (Dianne, 65)
I was really really pissed off…I guess it’s because I’ve always given blood, I’ve
never had a problem or not been able to, and I wasn’t very happy to think about
it…just not being able to give blood is a pain in the backside (Emily, 17)
I'm really, really upset at myself… the whole day, yeah it's a feeling of rejection
and “how can you not be disciplined enough to eat the right foods, get the right
amount of sleep and do all the right things to give blood once every three months”

157
so I'm really upset at myself and it is a feeling of rejection, yeah…It was expected
but I get really upset so I ring my mum, my sister and I say “I'm real sad, I've been
rejected” (Kate, 44)
However, one of the four donors, Judith, did not have a strong self-concept as a “blood
donor”, and her strong negative reaction was due to poor treatment rather than being upset
at not being able to donate. She felt that she was not given enough time or attention, and on
top of those factors, she had also waited for an hour before getting to the interview stage.
Judith had not experienced any symptoms of low Hb, and was particularly upset by the lack
of explanation as she didn’t understand the reason for her deferral. From her perspective,
the nurses were more interested in carrying on a conversation than explaining her deferral.
Actually they were more talking about a TV show. Between themselves, so I felt a
bit shafted I must confess…
I didn't feel like there was anything wrong. So nobody really explained as to why,
it is only a little bit low, but it really needs to be at this level, to be able to accept.
Nobody sort of said anything like that, it wasn't until I read the [brochure]…if they
had just taken two minutes to say, “well it is a bit a low and this is why we don't
want to take it”, I would have walked about thinking “oh fair enough” that would
have been that. But I sort of thought, I had wasted an hour to be told nothing and
then I walked out. So that probably didn't make me very impressed, I suppose
(Judith, 41)
A large group of participants revealed what could be described as “less” negative reactions
to their deferral. Again, these donors described a range of reasons contributing to their
emotional responses, with the most common theme being disappointment at not being able
to contribute. Additionally, donors reported feeling that their efforts to attend the collection
centre were fruitless, and that they were worried about the implications for their own
health. Several of these donors had been deferred on a previous occasion.
Disappointed. Cause, it does make you feel good, it’s good to know that you are
helping others, yeah, so I do get myself a bit geared up for it…like, yeah, the whole
needle side of it, like you do spend a day thinking about it and drinking lots of
water and eating lots of food…[deferral means] not really having done what you
were meaning to do all day (Sasha, 26)

158
I’m just disappointed because you know, it wastes their time… I felt like a fraud,
you know (Heather, 45)
It was a bit weird… to get rejected by the blood service…I assumed I had socially
acceptable blood… you sort of assume there isn’t going to be a problem. The
finger test is just like part of the process (Blake, 22)
Shocked, disappointed…just finding my iron was low when I felt so well… I wasn’t
disappointed that the iron was low or anything, I was just disappointed about not
being able to give (Richard, 49)
Unfulfilled effort was a common theme of deferral. This was exacerbated by long waiting
periods prior to having the finger-prick test to determine eligibility, and for one donor, by
having samples taken after being found to be below the threshold.
We [had] three people…because she was training she had to explain all those
things to the trainee so it took so long, and then at the end, “oh, your HB is low” I
kind of laughed, I thought “oh god, after all this! After 15 minutes of interview,
now you can’t take my blood” (Pam, 49)
It’s a bit of a bummer, you sit there for 45 minutes or so, you wait, wait, wait, you
finally get in and [they] turn around and say “sorry, go home”… by the time you
travel there and go home it’s 2 hours gone (Richard, 49)
My time was limited … it came up as really low so I thought okay that’s fine I’ll go
because I’ve had low iron all the time…They said, after they did the test… she said
no, you have to sit here and wait for a doctor …I said “no, I won’t”, and she said
“no you have to, it’s a duty of care” (Elizabeth, 49)
While these donors all reported a negative emotional response to deferral, these reactions
appear to be short lived. It was common for donors to say they hadn’t thought about their
deferral much since the event and that they now felt fine about the outcome.
No problem (Brian, 53)
Only 1 week and then I got over it (Jan, 18)
159
Three of those with the strongest negative reactions indicated that they continued to reflect
on their experience
I still feel I could have given it (Dianne, 65)
Better but I'm still mindful everyday (Kate, 44)
The last group of donors reported no negative response to deferral. Most of this group had
been deferred for low Hb on more than one occasion, and some had anticipated the most
recent deferral event.
I thought “oh well, what’s new!” …sometimes I half expect it because it is a bit of
a thing with me (Mary, 51)
While most donors mentioned negative responses to their deferral, some also recognised
that being deferred had benefits.
This sort of offered a bit of education to what that is and how, what your levels
should be and your health and the food and stuff like that so. Sort of give you a
better understanding of things like that (Chloe, 18)
It’s a blessing as well because if I didn’t go on Saturday and my iron count was
low, who knows where that would have led to. Alright? So in one way it’s a free
check… you can say “well, ok, today I’m not as good as I thought I was, so I’ll get
myself fixed up and when I’m fixed I’ll go back” (Richard, 49)
Negative emotional responses have been proposed as a possible reason for the reduced
likelihood of return after a temporary deferral (Piliavin 1987; Halperin, Baetens et al.
1998). Theoretical perspectives suggest that bad feelings may result from the experience of
a negative expectancy violation at the refusal of an offer of assistance (The Theory of the
Spurned Philanthropist) (Rosen, Mickler et al. 1986), or because deferral does not verify
the donor’s “identity claims” as a “blood donor” (Sets and Burke 2003). There was limited
evidence to support the view that negative expectancy violation was responsible for adverse
feelings resulting from deferral, with no clear relationship between the levels of surprise at
deferral and the extent to which the donor was upset. Disruption of identity claims or
unsatisfactory staff treatment are more plausible explanations for this distress.
160
5.4.6.2 Understandings of low haemoglobin and the reason for deferral
The next element of hassle is the level of confusion and bewilderment resulting from a
deferral, particularly when the donor was unclear of the rationale, was given a limited
explanation, and was left unsure of the reason for their low levels and whether there were
any implications for their health.
The majority of participants reported that they had not felt any symptoms they could
attribute to a low Hb level prior to their deferral. Most were unable to describe possible
symptoms beyond tiredness. Donors expressed poor understanding of Hb in biomedical
terms, with limited understanding of the role of Hb in the body, and its relationship to
dietary iron intake or possible underlying disease.
I wouldn’t have any idea, I don’t know… I figured that it would have to be of some
importance, it’s something to do with iron or something like that? (Chloe, 18)
Nearly half of the participants expressed confusion as to the cause of their low haemoglobin
level. Several felt the reasons suggested by the nurse such as poor diet, stress, and heavy
menstrual cycles, did not necessarily apply to them. For example, Brian, deferred at his first
attempt, noted:
They told me that I wasn’t eating enough green vegetables or enough red meat and
I thought “well, I think I do” (Brian, 53)
Just one donor, Elizabeth, alluded to the relationship between a low Hb concentration and
giving blood. She had been advised by her partner, friends, and doctor that frequent
donation had consequences for the body. Interestingly, she did not appear to believe the
advice. She said:
My partner tells me I donate too much and that’s why I get run down… other
people have told me that, I don’t know that I believe it, that blood donation takes
stuff out of your own body… it takes a long time to build back up, but I don’t, that’s
just people talking.
I think every three months is fine but then my doctor said nope, every three
months…is not fine. He says people should only give blood once a year (Elizabeth,
49)

161
For a few donors, haemoglobin was a new term that they had only encountered through
donation. Sophie, deferred at her first donation attempt, had never heard the term before.
I’ve heard of iron and iron levels before, but when I was in the interview, and she
mentioned haemoglobin, and I thought “oh, what’s haemoglobin”…That’s the first
time I’d heard that term before (Sophie, 24)
One further source of confusion resulting from the deferral experience occurred after the
event, when donors who had venous samples tested received a letter containing a new
concept: ferritin. This term was unfamiliar to all donors and had not been discussed during
the deferral appointment.
When I got my letter back…they have haemoglobin level, and then they had
ferritin, and she didn’t mention that so I have no idea what that meant…it kind of
freaked me out a bit, I went “oh jeez, that might not be good” (Sophie, 24)
I don’t really understand that one [ferritin result] at all, because I didn’t realise …
I’m under in that as well. But that hadn’t been explained to me, I don’t believe. So
that probably for me, a bit confusing (Heather, 45)
The only donor displaying reasonable knowledge of the role of haemoglobin in the body
had sourced the information from the internet site Wikepedia after his deferral.
I think I just looked it up quickly the day I got deferred. Because I was sort of, I
don’t know where it had come from, because I always though haemoglobin had
something to do with the clotting, like blood clotting (Blake, 22)
Although most donors had limited understanding about the role of haemoglobin in the
body, it did not diminish their belief that there were justifiable reasons for their deferral,
indicating high levels of trust in the organisation.
I suppose there must be technical reasons why they defer low haemoglobin. In
other words what I’m saying is in terms who am I to question why (Barry, 54)
The interaction with ARCBS staff played an important role in the way donors interpreted
their low haemoglobin status and their perception of the deferral experience. While most
were happy with the information and advice they were given when deferred, three donors
162
described interactions with nursing staff that were less than satisfactory. Jan didn’t feel the
nurses showed her enough compassion about her wellbeing.
They were saying “oh you’re low in iron”, and I was thinking “how come you look
so, you don’t care about that?” (Jan, 18)
Judith received a very brief explanation about her deferral, and felt that she was largely
ignored by the nurses, who carried on a conversation above her head.
They were talking about taping a TV show at the time, and she just said, yeah,
there are some recipes in here and you will hear from the doctor in six months.
And I thought, “oh I didn't realise there was anything wrong with me” (Judith, 41)
As a result of her treatment, Judith was quite negative about her deferral experience, and
left the donor centre with many unanswered questions. Mary also reported receiving abrupt
treatment from the nursing staff.
She was a bit sort of snappy, an older lady…she didn’t upset me, not easily upset
but it was a bit abrupt more than anything, it was like “you can still have the tea if
you want to” “oh ok, no I’m going home!” (Mary, 51)
Blake described how the nurse’s response to his low haemoglobin level gave him the
impression that a low Hb concentration was not worth worrying about.
The nurse sort of gave me a few brief instructions, but… her demeanour, it wasn’t
that important, it was just sort of like a shame that I couldn’t donate…So I assume
this is not very important at all (Blake, 22)
Two information brochures have been developed by the ARCBS for donors deferred for
low Hb, the first containing information about the role of haemoglobin, iron, and ways to
increase iron intake and absorption. The second explains the need for deferred donors to
seek further testing, and the possibility of conversion to apheresis donation.
Ideally, these brochures would be distributed to all low Hb deferred donors. Only half of
the interviewees recalled receiving the brochures. Contrary to expectations, the donors
receiving the information did not demonstrate superior knowledge about haemoglobin to
those who had not.
163
5.4.6.3 Seeking further investigations
Donors are requested to seek further investigations into the reason for their low Hb level
from their GP, though are not required to do so prior to returning. Those who seek further
investigations may do so at their personal expense, and many will undergo time consuming
and invasive tests. Six donors had already sought further investigations by the time of the
interview, and the responses of one indicate that the experience can be quite unpleasant.
Elizabeth had been told to have a range of tests, including a colonoscopy.
Elizabeth He’s making me have a colonoscopy, hoh, can you believe it?...He said
I’m in that age group and I have to have a full set of bloods.
TH How are you feeling about that?
Elizabeth About a colonoscopy, very bad. The bloods will be fine…Well I’ll have
that stupid test which is horrible and my blood will be taken and that will be fine.
Elizabeth had also discussed her return to donation with her doctor, and had been advised
that she should consider reducing the frequency of her donations, and that she had been
donating more frequently than most people are able to tolerate.
5.4.7 Delaying return: “It’s an easy thing to put off”
A deferral reminds donors that not every donation attempt will be successful. Deferral can
decrease self-perceptions of being a healthy individual, and consequently donors may feel
less confident that a subsequent donation attempt will be successful. They wish to avoid the
bad feelings, confusion, and wasted efforts encountered at the previous donation attempt,
and as a result, they may delay return until they are certain they will be accepted.
Two donors explicitly described putting off their return until feeling more confident of
acceptance.
Rather than head down there, and say, not be eligible again, I will make sure
before I get there that I’m okay. So yeah, just so it doesn’t waste my time and
theirs and everybody again (Heather, 45)
If I was still living at college I’d probably put it off a bit longer because my diet is
not going to really consist of that much meat, so but if I’m cooking for myself or
164
living back home or something like that then I’d probably go back sooner Cassie,
21)
Several spoke about needing to make changes before they would be able to return to
donate. Most were confident in their ability to make the required changes.
I know if it was a problem that wasn’t going to be changed, then I guess, if I knew
it wasn’t going to get any better, I probably wouldn’t bother to donate. But the
impression I have at the moment is that it’s something you can change reasonably
easily. I assume that I’ll be right to donate if I just fix my lifestyle a bit, probably
the eating habits (Blake, 22)
I won't have any problems with it but I just certainly want to have it become a
lifestyle and not “I’m giving blood next week, I must eat steak”, just be mindful
(Kate, 44)
Towards the end of the interviews, participants were told that donors were less likely to
return to donate once they had been deferred for low Hb, and asked them to consider
reasons for the phenomenon. Most donors expressed surprise that this was the case, and
tended to describe reasons other donors might not return. When subsequently asked if those
reasons applied in their situation, they usually stated that the reasons did not apply to them
personally.
Several donors mentioned that the reduced likelihood of return could be attributed to
negative emotional responses. However, they also gave other reasons, suggesting they
didn’t believe this could be the sole cause.
Some could get huffy and say “oh they don’t want me so I won’t go” (Cynthia, 64)
Oh, maybe they feel like they’ve been rejected. But I guess that’s a pretty simplistic
kind of response (Blake, 22)
It could be perhaps they feel that the…blood people don't want them and they are
not going to go back (Dianne, 65)
One donor, however, recalled that bad feelings after a previous unsuccessful donation
attempt were responsible for her delaying return after an incident. However, she stated that
she did not have the same reaction to her recent low Hb deferral.

165
You want give and you’re being refused, it’s kind of like hangs around, bad
thoughts kind of hang around (Pam, 49)
In a similar vein, Judith felt the reason donors were less likely to return after deferral was
due to the poor explanation and staff treatment, which was a characteristic of her deferral
experience.
Probably because they have thought, oh okay, you are trying to do something to
help the community and then …they haven't explained it properly (Judith, 41)
The remaining explanations for non-return fell into four categories: suspected ineligibility,
feeling “off the hook” from giving blood, avoiding the hassle of a subsequent deferral, and
falling out of the habit of regular donation.
The first group felt that the main reason people would not return is due to a suspected or
actual ineligibility to donate. For example, Graham noted:
They may think there is obviously something wrong with them. I think that was the
first thing that went into my mind (Graham, 64)
Two donors, both deferred at their first donation attempt, thought that, among other
reasons, donors might use their deferral as an excuse not to return.
Because it is a fairly dramatic procedure, deferral is seen as an excuse, permission
to get out of it (Brian, 53)
And I guess it’s a bit of an excuse for it too (Sophie, 24)
Fear of a subsequent deferral was often suggested as the reason donors would be less likely
to return. This related to avoiding wasted time and feeling like a “failure” if deferred again.
Maybe [they] don’t want the… possible next knock back. They might have gone to
their doctor, find that they’re okay now, but they can’t chance being rejected
again, perhaps (Heather, 45)
If I know I’m low in iron and I need to be deferred for 6 months and I go back
again and if they say I’m still low in iron then I waste too much time to going back
(Jan, 18)
166
Maybe they are worried about rejection the second time…[we] don’t like to be
failures in whatever we do (Mary, 51)
Several participants thought that people might put off return as they don’t want to be
reminded that they are not as healthy as they thought. For example, Chloe noted:
You don’t want to be told that you’re not well, that you’re not sort of up to scratch.
You don’t really want to put yourself in the situation, that’s probably why people
would just take it as “oh I’ve got low haemoglobin, not going to go to the doctors,
just forget it. I was fine up until now, I’ll forget that happened” (Chloe, 18)
Finally, there were several donors who described how a temporary deferral interrupted the
routine of donation.
Just getting out of the routine… because you can change your job or you can
change it when you’re playing sport or something. Everything changes and you
reschedule it. So it’s an easy thing to put off (Blake, 22)
I guess it’s just part of a negative experience maybe and they’re scared of it
happening again, or… six months is a long time…I can understand the nerves that
probably creeping back up again…probably then tipping the scales towards “let’s
not worry about it at all” (Sasha, 26)
Or maybe you break the habit … then if you have a long enough break they’d say
“oh can’t be bothered” and you think it all gets too hard and give it away
(Cynthia, 64)
In summary, being deferred may increase the perceived inconvenience of giving blood.
Deferral “tips the scales” for a donor already juggling multiple demands, leading to the
conclusion that donation is too much of a hassle, particularly given the next attempt may be
unsuccessful. Additionally, the mandatory six month break disrupts the habit of regular
donation, from which donors find it particularly difficult to return.
5.4.8 Keys to understanding prompt return from deferral
Using the charting process within Framework analysis, I identified four aspects of a person
and his/her context associated with whether or not a donor returned promptly once eligible:
an individual’s responsibilities, particularly the presence of dependent children; whether
167
donation was facilitated by a supportive environment prior to deferral; a stronger blood
donor identity (incorporating a perception that giving blood was personally rewarding); and
whether deferral left the donor feeling valued by the organisation.
These factors will be considered individually. First, the finding that not one woman who
both worked and had dependent children returned within nine months of being eligible
suggests that donors with the most responsibilities and demands, for whom donation is
more conditional on fitting easily into their lives, are the most poorly placed to overcome
the disruption to their self-concepts and any increased hassle associated with giving blood
after deferral. This group also tended to give blood in their own time, rather then part of an
organised group. In contrast, the majority of older participants returned after deferral, even
though they tended to not give in an organised group. Few competing demands meant that
commitment was less contingent on the activity remaining easy.
Second, donors who had not yet had children seemed to have a greater chance of return if,
prior to deferral, donation was facilitated by a supportive environment. These supports
included giving blood in an organised work or social group, or having a collection site
convenient to their work or home. Notions of convenience differed between younger donors
and older donors, with retired donors noting that blood donation was convenient even if
they had to catch two buses to attend a collection site. In contrast, younger donors tended to
report giving blood was easy if they lived or worked in the same suburb as a collection site
or drove directly by one whilst commuting. Supportive structures were likely to facilitate
return by reducing the effort needed to give blood.
The third criterion, the strength of the donor identity, is drawn from Simon and McCall’s
theory of role identity. This theory provided a particularly good fit for the data, given those
with strong self-perceptions saw donation working well in their lives: they found the
activity personally rewarding, was something that they could do with competence, and
could be easily accommodated around their other commitments. Younger donors in
particular saw blood donation in this way. Many of those with a strong identity had
previously encountered difficulties giving blood, such as poor staff treatment, physical
reactions, and deferrals, suggesting that successful performance is only a small contributing
factor to strength of identity.
For example, Chloe had been deferred twice in her short donation career, and had in fact
returned earlier than permitted after the first deferral, resulting in her being turned away.

168
Chloe differed from other donors with similar levels of experience in that she appeared to
benefit from greater levels of reciprocity from giving blood. She emphatically described her
appreciation of the “rewards” of donation, such as the free health check, the social aspect of
donation (as she attends with a large group of friends), the refreshments, the atmosphere at
the donor centre, the way she was treated by the staff, and finally, positive self-perceptions
as a result of knowing she was “saving lives”. Being a blood donor gave her a unique
opportunity to demonstrate her compassion for others in a way that wasn’t possible within
the time and economic constraints associated with her life stage.
You do feel as if you are helping out, cause even in all other aspects of life where
you do selfish things like your life is focussed on yourself, so it’s all your job and
things that you want… so you can do something without having to give money or
without having to give a lot of time (Chloe, 18)
It is possible that because donation works for Chloe in so many ways, she was able to
emerge from a situation entailing considerable hassle unshaken in her commitment to
continue giving blood.
The final aspect related to non-return was poor treatment at the deferral event. Three donors
described aspects of unsatisfactory treatment, and two did not return promptly, while a third
was ineligible to return (deceased during the deferral period). Jan described a lack of
compassion from the staff at the donor centre at her most recent deferral (“I feel they don’t
really care. I’m sure they don’t care”). Judith received a very brief explanation about her
deferral, and felt that she was largely ignored by the nurses, which resulted in her feeling
“shafted” and leaving the collection centre with many unanswered questions. Mary also
reported receiving “snappy, abrupt” treatment from the nursing staff.
Each donor in this group was also represented in other categories found to be linked with a
reduced likelihood of return. All three donors reporting poor treatment did not find giving
blood to be personally rewarding, nor was their regular attendance facilitated by donating
with a group or during work time. Nevertheless, it should not be ruled out that poor
treatment from staff may substantially increase the impression of hassle resulting from
deferral, and give a greater reason to delay return in order to avoid a subsequent event.

169
5.4.8.1 Conceptual model
The final process of Framework analysis, mapping and interpretation, involved drawing
together the findings of the study in accordance with the key objective: to explain why
some donors returned promptly from deferral and others did not. The outcome of the
process was the development of a conceptual model, which is shown in Figure 31.
The model is based on the understanding that a deferral for a low Hb level disrupts
successful donation patterns, and therefore disturbs the habit of regular donation. This may
be attributed to donors being unable to reinforce the strength of the association between
context and donation behaviour during the six month deferral period (Masser, White et al.
2008). Examination of the circumstances leading to previous lapses from donation also
suggests people are particularly vulnerable to changes in their personal situation or
collection practices when they are deferred or otherwise unable to give blood. This may be
because changes affecting the environmental cues triggering donation are more damaging
when a donor is out of regular contact with the ARCBS and does not have the opportunity
to promptly establish alternative donation arrangements.
The perceived convenience of giving blood appears to be crucial. This model incorporates
perceived convenience in a number of ways: taking into account changes in a donor’s
lifestyle (such as moving work location); changes to collection practices that might make
donation more difficult (such as changing the location of a mobile or opening times); the
obligations and demands in a donors life reducing the opportunity to give (particularly
having children); and whether attendance is facilitated by supportive environments.
Assessments of convenience are also likely to be influenced by the unpleasantness of the
deferral event and the corresponding desire to avoid another occurrence, and whether the
donor expects to be accepted at a subsequent attempt.
Those who had to invest less effort into returning, such as those with fewer conflicting
responsibilities, who gave as part of a group, or found donation particularly convenient,
were more likely to return promptly from deferral, perhaps because they risked a lower
degree of wasted energy should the next attempt be unsuccessful.
The conceptual model is displayed in Figure 31 below.

170
Figure 31: Conceptual model explaining likelihood of return after a temporary deferral for low Hb Role identity theory has been incorporated into the model in two ways. McCall and
Simmon see the prominence of a role identity as being reliant on the level of rewards
enjoyed when enacting the identity. In this study, those with strong role identities also
tended to enjoy the most benefits from donation, and were more likely to return after
deferral, supporting the theory in the context of blood donation.
However, the salience of the role identity may diminish as a result of deferral. McCall and
Simon’s conceptualisation of how the salience of an identity changes is useful in this
context, as they view salience as being dependent, in part, on the opportunity for profitable
enactment of the identity. As previously discussed, deferral may diminish donors’
expectation of successful subsequent donations, and furthermore, the mandatory six month
deferral period means donors have no opportunity for profitable enactment for half a year,
nor any contact from the ARCBS beyond initial test results that could serve to keep their
identity in mind, even when ineligible to enact the behaviour.
Giddens writes that the biographical narratives informing self-identity are fragile. If the
continuity of a biography is vital for the integrity of the self-perception, the movement from
“I’m a capable blood donor” to “I have some problems giving blood” is likely to contribute
MOTIVATION TO RETURN
LIKELIHOOD OF RETURN AFTER TEMPORARY DEFERRAL
Lower likelihood of RETURN
Greater likelihood of RETURN
+ Perception of personal reward
Many obligations, particularly children Decreased opportunity to donate
• Lifestyle changes • Changes to collection practices
Desire to avoid another deferral • Deferral was unpleasant
Belief subsequent attempt will be unsuccessful • Diminished perception of health status • Effort required to become eligible for return
Returning is not easy Returning is easy
Personal relevance of
donation
High effort Effort required to return to give blood
Low effort
Retired donors or those with fewer obligations Busy donors with many obligations:
• Give blood in a work or social group • Donate during work time, especially at a
mobile collection
• Positive self-concepts
• Feel valued • Social solidarity • Enjoy tangible
benefits

171
to donation not being the highest priority after deferral. Similarly, Piliavin and Callero
wrote that unsuccessful donation attempts lead individuals to see themselves as “bad bets”,
unlikely to be successful in the future (Piliavin and Callero 1991).
Giddens also writes that particular behaviours reinforce other related role identities. This
finding is supported in the current study, with several participants believing donation
validates their good health, and that giving blood is a natural action for someone in their
position. An inability to meet the minimum health standard required for blood donation
could diminish the donors’ understanding of themselves as fit, healthy individuals,
throwing into question the assumption of a successful future attempt, and disrupting the
natural relationship between good health and giving blood. On the other hand, donors who
see themselves as healthy individuals may be more likely to attempt donation once eligible,
in part to validate their health status. There is evidence of this occurring in donors’ accounts
of previous assaults on self-perceptions. For example, Blake described how he fainted after
his first donation attempt, and part of his desire to return was based on wanting to “do it
again so I could do it right” (Blake, 22)
In summary, those who view giving blood as personally rewarding tend to have stronger
donor identities, and indeed, the presence of a “blood donor” self-concept means that
returning to successfully give blood is rewarding in its own right. However deferral may
reduce self-perceptions of both being a competent donor and a person of good health. Role
identities are recognised to be reliant on context, meaning that salience of the role identity
reduces in line with the diminished expectation of “profitable enactment”.
Figure 32 shows how the likelihood of returning changes after a low Hb deferral, by
shifting donors to the left on the horizontal plane. The degree of the change depends on the
amount of subjective effort required to return. Vertical placement on the axis, reflecting
greater personal relevance of the activity (from a greater perception that donation is
personally rewarding, and to a lesser degree, knowing a recipient or having family members
give blood), is not expected to change as a result of deferral, but is important nonetheless as
it places donors closer to having a “greater likelihood of return”.

172
Figure 32: Shift in likelihood of return after a temporary deferral for low Hb Figure 33 demonstrates that working mothers may begin further left in the diagram,
necessarily requiring more effort to attend than other donors, and then experience a
substantial shift left after deferral. The shift would not be expected to be so large if, for
example, the donor gave blood during work time, or as part of an organised group.
Figure 33: Shift in likelihood of return: for a working female donor with children Figure 34 shows how a shift after deferral may be smaller if return was facilitated by giving
in a social group. This donor also begins higher on the plane due to a perception that
donation is highly personally rewarding.
MOTIVATION TO RETURN
LIKELIHOOD OF RETURN AFTER TEMPORARY DEFERRAL
Lower likelihood of RETURN
Greater likelihood of RETURN
Personal relevance of
donation
High effort Effort required to return to give blood
Low effort
DYNAMIC- Size of shift in subjective effort dependent on experience of deferral, ease of return, and
expectation of future acceptance
**
* *
MOTIVATION TO RETURN
LIKELIHOOD OF RETURN AFTER TEMPORARY DEFERRAL For a working female donor with children
Lower likelihood of RETURN
Greater likelihood of RETURN
Personal relevance of
donation
High effort Effort required to return to give blood
Low effort
**
STATIC- personal relevance not expected to change at deferral. More relevant if rewarding and
personally meaningful

173
Figure 34: Shift in likelihood of return: when return is facilitated by giving in a group and donation is viewed as personally rewarding
MOTIVATION TO RETURN
LIKELIHOOD OF RETURN AFTER TEMPORARY DEFERRAL For a donor who gives in an organised group & finds donation personally rewarding
Lower likelihood of RETURN
Greater likelihood of RETURN
Personal relevance of
donation
High effortEffort required to return to give blood
Low effort
**

174
5.5 Summary
While non-return may be partly explained by the disruption of the habit of regular donation,
I theorise that deferral represents a “hassle”, consequently increasing the perceived
inconvenience of giving blood. This is particularly important as donation is viewed as a
way to help the community and access personal rewards with little personal effort.
Prompt return after deferral appears to be related to two main themes. The first is the
strength of the blood donor identity, which incorporates the extent to which donation is
personally rewarding. The second is the level of effort required to recommence donation,
encompassing: the individual’s other obligations, particularly parenting; whether the habit
of regular donation was facilitated by a range of supports prior to deferral; and to what
extent the deferral experience left the donor feeling valued and appreciated.
A conceptual model was developed to explain why some donors found it easier to return
after the low Hb deferral, and others did not.
5.6 Discussion and implications
Read in historical context, the results of this study suggest that the influences of economic
reform, globalisation, and rising individualisation have resulted in a public that is interested
in giving, yet overwhelmed with other priorities. They are unable to commit much time or
energy to giving blood, and consequently, when giving blood becomes more difficult or
they believe attendance may not result in a successful contribution, the activity is less likely
to be sustained. Those in the middle income earning years, particularly if they have
children, are the least able to accommodate the increased effort involved in returning after a
deferral. Those who find the activity personally relevant, such as those who find giving
blood rewarding, are most likely to return: akin to a cost-benefit analysis, those who get the
most out of donation appear more tolerant of the work involved, and more willing to make
the attempt even if there is a possibility it will be unsuccessful.
The literature on the new forms of civil engagement propose that volunteers are less likely
to form long-term commitments to a role or organisation, or engage in demanding
commitments than donors in the past (Robinson 1999; Hustinx and Lammertyn 2003; Stolle
and Hooghe 2004). Paradoxically, blood services may be better placed to maintain
community support than other voluntary organisations, as by its nature blood donation is

175
sporadic, requires low levels of commitment, and is more often than not performed alone.
The challenge for blood services is to recognise that current donors’ motivations and levels
of commitment are different to those of previous generations, and to work to maintain the
perception that blood donation is a good fit within individuals’ increasingly pressured lives.
There was evidence this did not always occur. First, a number of donors mentioned they did
not feel personally appreciated during their encounters with blood service staff, and tended
to relate this to brisk or unfriendly staff treatment and/or procedural aspects that made them
feel like they were in a “herd of cattle” (Mary, 51). Second, many note the frustration of
lengthy waiting times, and third, the negative impact of changes to collection practices that
reduce the opportunity to donate. Donors attending the collection site have already
undergone significant levels of effort to clear a space in their day and travel to the donor
centre, and any additional hardship encountered during the donation process is likely to
contribute to the understanding that donating blood is a hassle. While this was particularly
the case at deferral, good customer service and ensuring that donation remains easy and
convenient should be the focus of all donation encounters, particularly given diminishing
tolerance for poor experiences within increasingly busy and stressful lives.
Relatively few differences were found between returning and non-returning donors: for
example, levels of altruism or knowledge of the need for blood did not differ, nor did
donors’ experience of deferral, with the exception of those who felt particularly upset by
their treatment. These factors did not vary much across donors, or seem to change as a
result of deferral. The findings of this study support the proposal that opportunity for
donation is the most important predictor of whether an individual gave blood, and that
proximal factors, such as where and when to donate, should be the focus of recruitment
efforts (Robinson 1999). This finding was also supported by the research of Schreiber et al,
who found that donors who had not given blood for at least two years cited inconvenience
as the most common reason for their non-return (Schreiber, Schlumpf et al. 2006).
It has been recognised that in order to attract new donors, blood centres need to minimise
perceived costs associated with donation (Robinson 1999). Would-be donors recognise that
giving blood can be uncomfortable, involves a substance that makes many squeamish,
requires a level of inconvenience in both travel and time, may result in unpleasant news
about their health and may impact on their wellbeing. The notion of a cost-benefit analysis
can be extended to understanding donor responses to a temporary deferral. The donors
interviewed for this study noted that fitting donation into their lives required some degree

176
of effort, yet all had concluded that donation could be accommodated in their lives. Many
of the costs prohibiting donation amongst non-donors had been overcome by those who had
given at least once: they had overcome the squeamishness and fear and accommodated the
travel and time requirements to attend the donor centre. However, other potential costs had
been realised by their deferral. Those deferred for a low Hb level had been given
unpleasant, and mostly unexpected, news about their health status, and those seeking
further investigations may have been told that giving blood was a contributing factor in
their low levels, confirming that giving blood impacts on their wellbeing. Furthermore, they
may have been confused, treated poorly, and left with bad feelings. Efforts need to be made
to diminish these “costs” in order to allay fears about returning. Participants mentioned a
range of ways that deferral could be improved, which are incorporated into the
recommendations for procedural changes in the final discussion chapter.
Findings from this research suggest that traditional notions of the reciprocity of blood
donation need to be extended. Reciprocity, as traditionally understood in blood donation
research, tends to describe an expectation that blood will be available should they or their
family members need it. This study found evidence that reciprocity should be expanded to
include elements of social exchange, such as feelings of satisfaction, usefulness, and the
sharing of values and ideals (Arnett, German et al. 2003). In short, giving blood makes
people feel good about themselves. However, the personal benefits of donation appear to be
even broader. Donors mention other rewards, such as feelings of social solidarity, a free
health check, and refreshments. Future research could examine to what extent these
“rewards” are viewed as such by blood donors, and whether the understanding of
reciprocity should be extended and used to explore donor retention more generally.
The relationship between donors and the ARCBS can be viewed as a type of “psychological
contract”. A psychological contract has been defined as:
“An individual's belief regarding the terms and conditions of a reciprocal
exchange agreement between the focal person and another party” (Rousseau 1989)
The concept has been applied to volunteer commitment in a large US health advocacy
organisation (Farmer and Fedor 1999). The research found that volunteers had stronger
intentions to continue if they felt valued and appreciated, and that the organisation cared
about their wellbeing, while current levels of participation were associated with feeling that
the organisation met the needs of the volunteer, and that contributions were valued. In the

177
context of voluntary blood donation, individuals may expect that if they attend to give
blood, the ARCBS will accept their offer, the donation will be successfully collected, and
the donor will consequently feel good about their contribution and themselves. The
organisation will enhance their positive feelings by showing their donation is appreciated
and treating them with respect. Donation will be easy, convenient, and impact minimally on
other parts of their lives, and provide rewards such as a free health check, a pleasant
environment, social solidarity, and tangible benefits.
While deferral may be interpreted as not fulfilling several of these criteria, it does not
necessarily need to be like this. For example, a number of participants noted that the
notification of a low Hb level was in line with the health check “reward” of giving blood,
while others interpreted their deferral as an indication that the organisation cared about their
wellbeing. These aspects of deferral could be emphasised to maximise retention.
Similar to the findings in other phases of the project, this study found that emotional
responses are unlikely to be a direct cause of non-return. A negative response appeared to
occur due to disruption of self-concept as a healthy and competent individual, and
additionally reveals a degree of passionate engagement with giving blood. Adverse feelings
also occurred as a result of an inability to partake in an activity that helps others and
consequently makes individuals feel good about themselves, and from bewilderment and
confusion resulting from not fully understanding the reasons for their deferral. While
unlikely to be a direct cause of non-return, emotional responses probably contribute to the
perceived hassle of deferral. After the habit of regular donation patterns has been disrupted,
a donor may reflect on their recent experience prior to returning, concluding, perhaps
unconsciously, that being deferred made them feel bad, was confusing, made them feel a
little less sure about their health status, and involved considerable work before they were
able to return. A donor with those thoughts might delay return until they are completely
sure they will avoid the same event. As accounts of previous lapses in donation show, short
breaks easily become lengthy breaks from which donors do not readily return.
5.6.1 Limitations
The qualitative methodology was an appropriate choice in order to meet the study aims and
to complement quantitative work performed in earlier stages of this project. However,
results of this chapter should be interpreted with caution, and regarded as provisional rather
than definitive. Conclusions were drawn from analysis of return in a non-probability, self-

178
selected sample. It could be that individuals willing and able to be involved in research may
have stronger “blood donor” identities and greater opportunities to accommodate donation
into their lives. It is also likely that interaction with the researcher may have increased the
likelihood of return, as the interviews involved considerable reflection on the commitment
to give blood, as well as at least two additional contacts during the deferral period, which
together may have enhanced the salience of the role identity.
Furthermore, the results presented in this chapter represent an oversimplification of all
possible patterns in the data. This was a consequence of tailoring analysis to answering a
specific research question, which is a characteristic of framework analysis.
There are two circumstances where the model would have had limited effectiveness in
explaining return after deferral.
The first issue is that this research only explored early return. This time period was selected
as survival analysis identified that most donors returning within three years of being
eligible would do so within the first nine months. Nevertheless, it would be expected that
some groups of donors, particularly women and first time donors, would return after this
point, and the factors contributing to their return were not able to be considered in this
analysis.
The second issue is ineligibility to return, for example if the donors had difficulties building
their iron stores or were found to have an underlying condition. The model emphasised
suspected over actual ineligibility, but it is expected that some non-returning participants
may have fallen into the latter category. This situation was known to occur for two
participants (Mary and Dianne), and was detected only because the ARCBS had been
informed of the circumstances after the interviews had been completed.
Non-English speaking donors were excluded from this study, and therefore the findings
have limited applicability to this group.
5.7 Conclusion
This research has shown that, predominantly, individuals give blood because it represents
an easy and convenient way to help others, and provides personal rewards, such as
enhancing positive self-concepts and a free health check. Deferral disrupts the habit of
regular donation, and additionally, introduces an element of hassle to what is generally seen
as an undemanding activity.
179
All participants stated strong intentions to return once eligible, but donation records show
intentions did not necessarily translate into action. Donors’ accounts of previous lapses
from donation reveal that breaks are largely unintentional, and tend to occur after a
disruption to donation patterns, such as short-term ineligibility, combined with changes to
personal circumstances or collection practices that reduce the perceived convenience of
giving blood.
Non-return after a temporary deferral is likely to occur for similar reasons, that is,
difficulties in recommencing the activity once out of the habit, and a reduction in the
perceived opportunity for successful donation. Resilience after deferral appears to be
related to four aspects of a person and their context: an individual’s other obligations,
especially parenting; the presence of a strong “blood donor” identity (including the extent
to which donation is considered personally rewarding); whether deferral left the donor
feeling valued and appreciated; and whether donation arrangements were facilitated by a
range of supports prior to deferral.

180
6 Results: Part Three The experience of seeking further investigations after deferral and implications for intention to return A survey of donors three months after deferral
6.1 Chapter Outline
This chapter describes the results of a survey of blood donors three months after a low Hb
deferral. The survey investigated donors’ experiences in seeking advice and investigations
from medical professionals during the deferral period, perspectives on the deferral event,
reflections on being a donor, and intention to return once eligible.
As in previous chapters, the studies are referred to by acronyms: the Audit of Return study
as AR, the Qualitative Interviews study as QI, the Three Months Later study (described in
this chapter) as 3ML, and the Twelve Months Later study as 12ML.
6.2 Aim
In Australia, the proportion of deferred donors who consult their general practitioner (GP)
is unknown. Furthermore, the range of investigations undertaken has not been described,
nor do we know the advice and information given to donors regarding matters concerned
with rectifying their iron deficiency or returning to donate.
A range of pathological conditions may underlie a low Hb concentration and/or iron
deficiency, including infection, inflammation and malignancy (Whyte 1999). Accordingly,
a variety of investigations might be undertaken when a deferred donor presents to their GP.
Variability in practice is likely in view of controversy about the most appropriate way to
investigate the cause of anaemia (Farrell and LaMont 1998; Goddard, McIntyre et al. 1999;
Hin, Lehman et al. 1999).
The aims of this phase were twofold. First, the study aimed to confirm and expand on the
findings of the 12ML (presented in the following chapter, though completed first), as a
survey three months after the date of deferral would avoid some of the limitations of the
12ML survey, in particular that of the quality of recall. Specifically, the 3ML survey was
designed to measure assessments of the information and advice given during the deferral
event; to investigate donors’ understandings of the rationale for their deferral; to quantify
emotional reactions to deferral; and to quantify the types of investigations undertaken when

181
a donor presents to their doctor with a low Hb concentration. Key issues that had not been
specifically explored in the 12ML survey included identifying the proportion told to change
their donation patterns when they sought further testing from their doctor, and the
proportion believing the frequency of blood donation contributed to their low Hb
concentration.
The second aim was to investigate whether intention to return once eligible was associated
with specific aspects of the deferral event, or the experiences during the deferral period. Of
particular interest was whether, in the course of seeking further investigations, being
advised to delay return or reduce donation frequency was associated with a lower intention
to return. Items derived from the Theory of the Spurned Philanthropist (such as the level of
surprise and emotional responses to deferral) were included to explore whether the theory
might contribute to understanding non-return following temporary deferral.
6.3 Methods
6.3.1 Study design
This phase of the project was a cross-sectional study, using a mail survey. Results from the
12ML indicated that most deferred donors who had seen their GP did so within three
months of their deferral. Therefore this interval was chosen as the best time point to survey
experiences seeking investigations, as donors would be likely to remember details about
testing, results and advice.
Due to time constraints, it was not possible to follow up whether donors returned once
eligible. As survey responses were not going to be linked to donation records, the need for a
personal identifying code was not necessary, and the survey was completed and returned
anonymously.
Intention to return was considered an outcome in its own right, rather than used as a proxy
measurement of actual donation behaviour, as there is an imperfect relationship between
one’s intention to donate and subsequent action (findings from the 12ML, and elsewhere
e.g. Bagozzi 1981; Giles and Cairns 1995). Furthermore, this phase of the project sought to
measure the strength of the intention to return at a mid-point through the deferral, to enable
comparison between intentions at different time periods.
182
6.3.2 Sample
6.3.2.1 Inclusion criteria
The sampling frame was all Australian whole blood donors who had been deferred due to
low Hb (defined as having one or more of the eight deferral codes applicable to a donor
deferred for low haemoglobin) in April of 2008. The deferral threshold remained at
<120g/L for women, and <130g/L for men at the time this phase was conducted. Data on
the donors in all states of Australia had been migrated to the live database (National Blood
Management System (NBMS)) and in the Data Warehouse by 2008, meaning that
Australian donors from all states and territories could be included in the survey.
6.3.2.2 Exclusion criteria
Therapeutic donors (who donate to alleviate the symptoms of haemochromatosis),
apheresis donors (who donate plasma, platelets, or red cell components only), and
autologous donors (who donate blood for their own sole use) were excluded, as these types
of donation have different acceptance criteria, donation frequency, and, in the case of
therapeutic and autologous donors, a different motivation for donation.
Donors who were “off service” at the time of the survey, meaning that they had requested
not to be contacted by the ARCBS for a period of time, were also excluded. Donors with a
deferral code “448” were also excluded, as the pilot study found that a proportion of donors
with this code were not actually deferred, but the deferral status could not be determined
from the dataset alone.
6.3.2.3 Identification of sample
A new staff member of the ARCBS, with expertise in providing datasets of the required
nature, had been identified at the outset of this phase of the project. This individual was
able to provide a dataset that included all fields necessary for the mail-out and analysis
without the need for manual searching of the live database, as had been undertaken for the
12ML survey.
6.3.2.4 Sample Size Calculations
Sample size calculations for estimation of a proportion for a given precision were based on
the formula:
Sample size = p (1 - p) Z2 / E2

183
where p=the population estimate, Z=the standard normal deviate associated with the desired
two sided confidence interval, and E= the maximum acceptable deviation from the true
proportion (Machin and Campbell 1987).
Using the nQuery 6.0 software (Statistical Solutions 2005), the required sample size was
calculated as 217, based on assumptions that the proportion being told by their doctor to
change donation patterns would be around 10%, with estimates made with 95% confidence,
and tolerance of within 4% of the “true” proportion. After adjusting for the finite
population correction factor, the required sample size was calculated to be 178.
A response rate of 70% had been achieved in the 12ML. However, given that the survey in
this phase was to be completed anonymously, a lower response rate was expected.
Therefore, a random sample of 400 donors were selected from a list of all low Hb donors in
April 2008 (n=1882).
6.3.3 Development of the questionnaire
A questionnaire was developed based on the responses in the 12ML survey, and the
analysis of the QI. An initial version of the questionnaire was piloted with a sample of
donors deferred for low Hb in March of 2008 (n=20). These donors were invited to
participate by letter in June of 2008, and provided with a pilot survey, feedback form, and a
reply-paid envelope. A total of nine surveys were returned. These responses were used to
make minor improvements to the questionnaire (such as clarity of the wording). A second
version of the questionnaire was then sent to a second pilot group (n=12), and the responses
(n=6) used to make final improvements.
The final questionnaire was made up of five sections (A-E), which are described in detail
below. The questionnaire is included in Appendix 4.
6.3.3.1 Section A: Experience of deferral
The first section began by asking donors about aspects of their deferral experience, with the
questions largely informed by preliminary analysis of the QI. First, respondents were asked
to rate aspects of the deferral appointment. Next, donors indicated whether they felt
different rationales for low Hb deferral were more or less important considerations for their
deferral. On seven point scales, participants rated the extent to which their deferral was a
surprise (Rosen, Mickler et al. 1987), and believed they would have given blood despite
low levels if provided with a choice. Appropriateness of the length of deferral was

184
measured on a five-point scale (anchored at “much too long” and “much too short”).
Respondents were asked whether they were sent a letter explaining deferral, and whether
the letter was easy to understand.
Finally, affective reactions were measured using twelve seven-point scales adapted from
Rosen’s work on the reactions of spurned helpers (Rosen, Mickler et al. 1987), with
categories based on the emotional responses described in the 12ML survey and the QI.
Participants were asked to think back to immediately after they were told they were
deferred and indicate whether they felt particular affective states, where 1 represented “not
at all” and 7 “very much”. The Distress index was made up of “sad”, “bothered”,
“disappointed”, and “worried” (the latter two items replacing “alarmed”, and “hurt” in the
initial scales); the Irritation index was comprised of “angry”, “annoyed”, “offended” and
“rejected” (replacing “irritated” and “insulted” in the original scale); and finally,
“unconcerned”, “grateful”, “valued”, and “relieved" were regarded as a Purpose index
(replacing “proud”, “pleasant”, “needed”, and “effective” in the original “Joy” index). The
scores for the final scales in each index were summed, and divided by the number of items
in the index to supply the final scores. Cronbach’s alpha was calculated to measure
interitem correlations for the items in each Index, with alpha values of >0.7 regarded as
satisfactory (Bland and Altman 1997). Internal consistency was not achieved for Purpose
(Cronbach’s alpha=0. 43), or Distress (Cronbach’s alpha =0.62), while satisfactory internal
consistency was achieved for Irritation (Cronbach’s alpha =0.77). Thus, analysis was not
performed using the Purpose and Distress scales, but scales of individual emotional
responses were included in the final analysis.
6.3.3.2 Section B: Experience when seeking further investigations
Section B contained questions about participants’ behaviours and experiences when seeking
further investigations from their GP after deferral. Rather than the open-ended questions
utilised in the 12ML survey, many questions asked donors to choose from a range of pre-
defined categories drawn from the analysis of this earlier study, including the range of tests
undertaken, whether the donor had low Hb and/or low iron upon further investigation, and
the type of advice given, in particular whether the donor was told to change their donation
patterns, see a medical specialist, and have follow-up tests.
185
6.3.3.3 Section C: Changes since deferral and reason for low Hb
Subjects were asked if they had made any changes to their diet or lifestyle since deferral,
the source of those changes (selecting as many categories as applied, with the categories
drawn from analyses of responses in the 12ML survey), and their understanding of the
reason that they had low Hb (again, selecting as many categories as applied, with categories
drawn from the 12ML survey).
6.3.3.4 Section D: Being a blood donor
Section D began by asking respondents to rate how easy it was for them to donate on a
three point scale. “Role identity”, the extent to which being a “blood donor” had been
incorporated into their sense of self, was measured using a 5 item, 7 point scale developed
by Piliavin and Callero (Callero 1985). Cronbach’s alpha for this scale was 0.63, which was
below the satisfactory level (Bland and Altman 1997). Internal consistency was not
improved by removing items from the scale. Although the scale was used in further
analysis, caution should be used when interpreting the results. Intention to return was
measured by asking donors to rate probability of returning to give blood within six months
of being eligible, on a scale of 1 to 10 (from the “Australian Donor Satisfaction Survey”, an
ARCBS in-house questionnaire designed to elicit satisfaction with donors’ most recent
donation event). Finally, a four item scale measured the self-efficacy (the extent to which
an individual believes they have the ability to give blood) of returning to give blood once
eligible, based on a scale used by Giles et al (Giles, McClenahan et al. 2004). Cronbach’s
alpha for this scale was 0.91.
6.3.3.5 Section E: Demographic and donation characteristics
The final section asked about the participant’s history of low haemoglobin, deferral for low
Hb or other reasons, donation history, sex, and age. The last page was blank, and
respondents were invited to provide any comments on the survey, about their experience of
being deferred, or their experience of being a blood donor.
6.3.4 Administration of the questionnaire
Mail surveys were posted during the first week of July 2008. The packages contained the
questionnaire, an information letter (shown in Appendix 5) and a reply-paid envelope, and
were mailed in a non-standard ARCBS envelope, as anecdotal evidence suggested donors
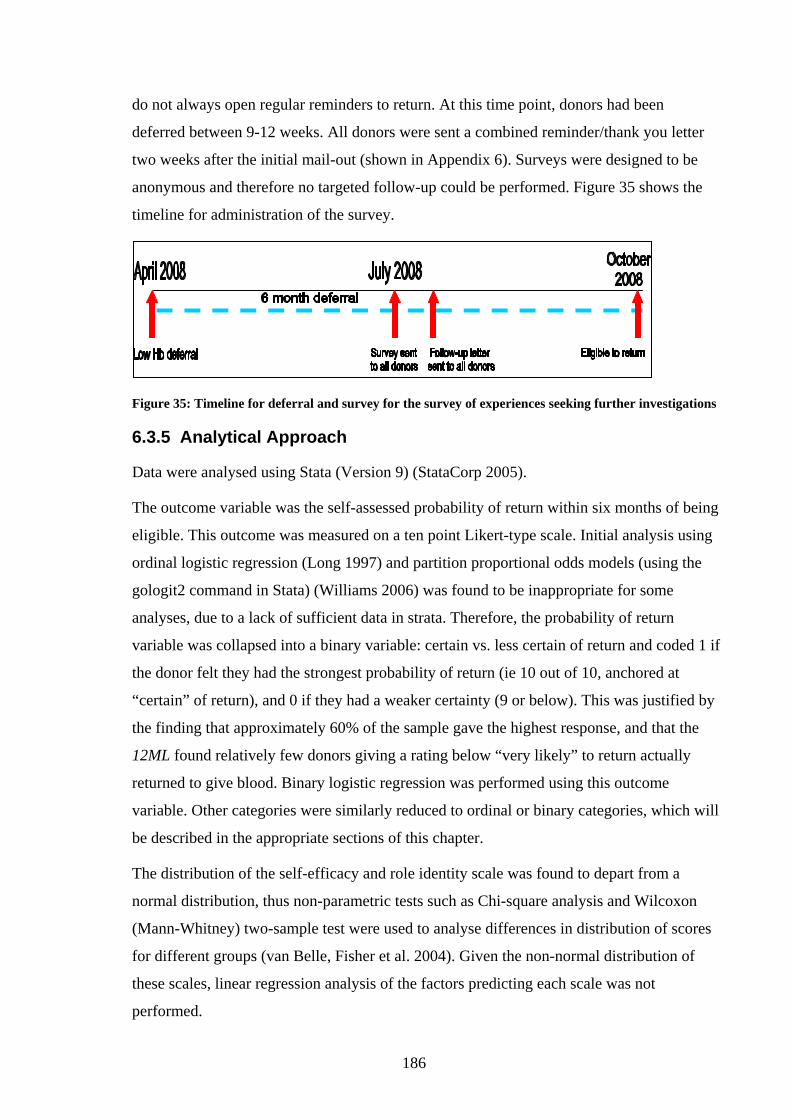
186
do not always open regular reminders to return. At this time point, donors had been
deferred between 9-12 weeks. All donors were sent a combined reminder/thank you letter
two weeks after the initial mail-out (shown in Appendix 6). Surveys were designed to be
anonymous and therefore no targeted follow-up could be performed. Figure 35 shows the
timeline for administration of the survey.
Figure 35: Timeline for deferral and survey for the survey of experiences seeking further investigations
6.3.5 Analytical Approach
Data were analysed using Stata (Version 9) (StataCorp 2005).
The outcome variable was the self-assessed probability of return within six months of being
eligible. This outcome was measured on a ten point Likert-type scale. Initial analysis using
ordinal logistic regression (Long 1997) and partition proportional odds models (using the
gologit2 command in Stata) (Williams 2006) was found to be inappropriate for some
analyses, due to a lack of sufficient data in strata. Therefore, the probability of return
variable was collapsed into a binary variable: certain vs. less certain of return and coded 1 if
the donor felt they had the strongest probability of return (ie 10 out of 10, anchored at
“certain” of return), and 0 if they had a weaker certainty (9 or below). This was justified by
the finding that approximately 60% of the sample gave the highest response, and that the
12ML found relatively few donors giving a rating below “very likely” to return actually
returned to give blood. Binary logistic regression was performed using this outcome
variable. Other categories were similarly reduced to ordinal or binary categories, which will
be described in the appropriate sections of this chapter.
The distribution of the self-efficacy and role identity scale was found to depart from a
normal distribution, thus non-parametric tests such as Chi-square analysis and Wilcoxon
(Mann-Whitney) two-sample test were used to analyse differences in distribution of scores
for different groups (van Belle, Fisher et al. 2004). Given the non-normal distribution of
these scales, linear regression analysis of the factors predicting each scale was not
performed.

187
Many of the tests performed in this analysis were not pre-specified and were exploratory in
nature. Inflated Type 1 errors are expected due to the multiple comparison problem (van
Belle, Fisher et al. 2004). All results presented in this chapter are unadjusted P values, and
should be interpreted accordingly.
6.4 Results
6.4.1 Response rate
A total of 400 surveys were sent, and 236 completed surveys were returned.
A total of 25 respondents were not eligible to be included based on answers or comments
on the questionnaire. This consisted of three donors who were notified of their deferral after
a successful donation, based on the laboratory test results, and three donors who were
giving plasma at the time of their deferral. A further nineteen donors did not attend the
donor centre in April of 2008, yet had a low Hb recorded during the month. The record
appeared to be generated from contact with ARCBS personnel: twelve had been told about
a low Hb by their doctor, but the organisation had been notified of their result; and seven
had been deferred at an earlier time point.
After taking into account the ineligible donors, a response rate of 52.8% was achieved.
Two surveys were returned after data analysis had commenced and were not included in the
analysis.
Comparison between the demographic and donation characteristics of respondents vs. non-
respondents is not possible, as the surveys were completed anonymously. Respondent
characteristics will be compared with those reported in other parts of this thesis (see
Results: Part One and Results: Part Four)
6.4.2 Demographic characteristics of respondents
The demographic and donation characteristics of the survey respondents are shown in Table
57. All data were self-reported. In order to allow comparisons with other populations, the
table also shows the demographic characteristics of samples reported in other chapters in
this thesis. “Results: Part One” utilised NBMS data from a retrospective cohort study (all
donors deferred in a time period included), and “Results: Part Four” utilised NBMS and
self-reported data from the 12ML (71.5% response rate).

188
The distribution of sex and age were similar to the proportions reported in other chapters of
this thesis. However, the small sample size resulted in very small numbers in some strata,
particularly amongst younger men. New donors and those with a shorter donation history
were also underrepresented, with just six respondents reporting they were deferred at their
first donation attempt. The findings of this study may have limited applicability to these
groups.
Table 57: Demographic characteristics of respondents CHARACTERISTIC COUNT AND
PROPORTION FROM SURVEY (ALL SELF-
REPORTED)
PROPORTION FROM
RESULTS: PART ONE
(NBMS)
PROPORTION FROM
RESULTS: PART FOUR
(NBMS & SELF-REPORTED)
n % NBMS % NBMS %
Sex (n=206) Male 30 14.8 14.6 15.2 Female 176 85.2 85.4 84.8
Age for females (n=176) Less than 18 9 5.1 7.9 8.3
18-24 24 13.6 17.8 15.5 25-34 33 18.8 14.1 12.5 35-44 40 22.7 23.3 24.6 45-54 44 25.0 22.1 25.0 55-64 14 8.0 11.4 10.3 65-74 12 6.8 3.5 3.8
Age for males (n=30) Less than 18 0 - 3.3 0.9
18-24 1 3.3 7.3 0.9 25-34 0 - 9.3 4.6 35-44 2 6.7 9.3 13.0 45-54 9 30.0 20.7 19.4 55-64 14 46.7 34.0 38.9 65-74 4 13.3 16.0 22.2
n % NBMS % Self-reported %
New donor status (n=207) New donor 6 2.9 12.8 14.0
Repeat donor 201 97.1 87.2 86.0
Number of donations (n=201) (repeat
1 or 2 21 10.4 19.3 18.5
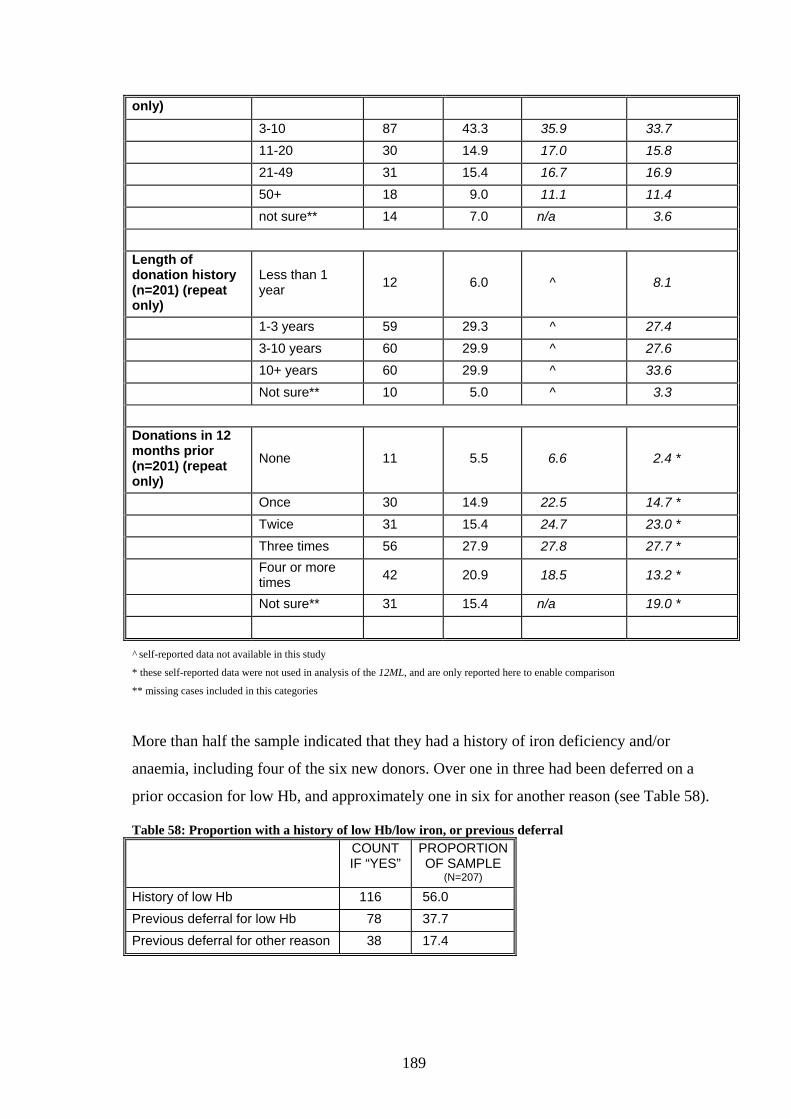
189
only) 3-10 87 43.3 35.9 33.7 11-20 30 14.9 17.0 15.8 21-49 31 15.4 16.7 16.9 50+ 18 9.0 11.1 11.4 not sure** 14 7.0 n/a 3.6
Length of donation history (n=201) (repeat only)
Less than 1 year 12 6.0 ^ 8.1
1-3 years 59 29.3 ^ 27.4 3-10 years 60 29.9 ^ 27.6 10+ years 60 29.9 ^ 33.6 Not sure** 10 5.0 ^ 3.3
Donations in 12 months prior (n=201) (repeat only)
None 11 5.5 6.6 2.4 *
Once 30 14.9 22.5 14.7 * Twice 31 15.4 24.7 23.0 * Three times 56 27.9 27.8 27.7 *
Four or more times 42 20.9 18.5 13.2 *
Not sure** 31 15.4 n/a 19.0 *
^ self-reported data not available in this study
* these self-reported data were not used in analysis of the 12ML, and are only reported here to enable comparison
** missing cases included in this categories
More than half the sample indicated that they had a history of iron deficiency and/or
anaemia, including four of the six new donors. Over one in three had been deferred on a
prior occasion for low Hb, and approximately one in six for another reason (see Table 58).
Table 58: Proportion with a history of low Hb/low iron, or previous deferral COUNT
IF “YES” PROPORTION OF SAMPLE
(N=207) History of low Hb 116 56.0 Previous deferral for low Hb 78 37.7 Previous deferral for other reason 38 17.4

190
6.4.3 Understanding of the rationale for deferral
Respondents were asked whether they believed a series of explanations were an “important
consideration”, a “minor consideration”, or “not at all a consideration” for their deferral.
The results are presented in Table 59. The most popular explanation considered to be an
“important consideration” was the wellbeing of the donor, followed by ARCBS regulations,
with a possible underlying condition and the wellbeing of the recipient as less popular
explanations. Nearly one in five donors considered that the health of the recipient was not
at all a consideration when it came to the reason for their deferral.
Table 59: Understanding of the extent to which rationales were a consideration for deferral IMPORTANT MINOR NOT AT ALL
Wellbeing of the donor 170 (82.9%) 30 (14.6%) 5 (2.4%)
Regulations of the ARCBS 162 (80.2%) 29 (14.4%) 11 (5.5%)
Possible underlying condition 137 (67.2%) 55 (27.0%) 12 (5.9%)
The health of the recipient 123 (60.0%) 45 (22.0%) 37 (18.1%)
6.4.4 Reflections on the deferral appointment
Respondents rated aspects of their deferral on a six point scale, anchored at “excellent” and
“very poor”, with an additional point for “don’t recall”. The majority of respondents
reported the explanation of the reason of their deferral was either “excellent” or “very
good”, while a small proportion (18.5%) of respondents found felt that the explanation
about their deferral was “good” or poorer. Ratings of the explanation about iron or Hb
levels were less favourable, with 25.8% of respondents rating the explanation as “good” or
poorer, including one donor rating the explanation as “very poor” (see Table 60).

191
Table 60: Rating of aspects of the deferral event Excellent Very
good
Good Fair Poor Very
Poor
Don’t
recall
Explanation of the reason for deferral (n=206)
84 (40.8%)
82 (39.8%)
31 (15.1%)
7 (3.4%)
0 0 2
(1.0%)
Explanation of Hb and Iron (n=206)
66 (32%)
83 (40.3%)
36 (17.5%)
16 (7.8%)
0 1
(0.5%) 4
(1.9%)
Nurses ability to answer questions (n=206)
67 (32.8%)
79 (38.7%)
40 (19.6%)
14 (6.9%)
0 1
(0.5%) 3
(1.5%)
Was made to feel appreciated (n=206)
88 (42.7%)
71 (34.5%)
27 (13.1%)
19 (9.2%)
1 (0.5%)
0 0
The nurse’s concern for them as a person (n=206)
79 (38.4%)
64 (31.1%)
38 (18.5%)
23 (11.2%)
1 (0.5%)
0 1
(0.5%)
Due to small numbers in many strata, design variables (dummy variables, 1/0) were created
for each item. Groupings were made at “excellent”, “very good” and “good” or poorer.
These variables were used in the analysis presented later in the chapter.
Donors were asked whether they received a letter from the ARCBS explaining their
deferral. Most responded in the affirmative, and reported the letter was easy to understand
(see Table 61).
Table 61: Proportion given and understanding letter N=207
n % Letter received 166 80.2
Letter NOT received 16 7.7 Unsure 25 12.1
If letter received: N=165
Easy to understand 150 90.9 A little hard to understand 15 9.1 Very hard to understand 0 0
Donors were asked to what extent their deferral came as a surprise. The responses are
graphed in Figure 36 below. Nearly one in four donors reported their deferral was a
complete surprise.

192
Males and females had similar levels of surprise to deferral (Mann-Whitney test P=0.52).
Donors who were aged <25 did not have significantly different levels of surprise to older
donors (P=0.19), nor did those aged >55 relative to younger donors (P=0.18). There was no
significant difference between the level of surprise in new donors and repeat donors
(P=0.31), but those who had been donating blood for at least 3 years had significantly lower
levels of surprise than those with shorter histories (P=0.04). Those who had stronger
frequencies prior to deferral (>2 donations) were no more surprised than those with lower
frequencies (P=0.13).
Those who reported having a history of anaemia and/or low iron were significantly less
surprised than those without that history (P<0.001), as were those who had been deferred
for low Hb on a previous occasion relative to those who had never been deferred for this
reason (P<0.001). Donors who had been previously deferred for another reason were no
more surprised than those who had not been deferred for another reason (P=0.95).
A binary design variable was created for those with higher vs. lower levels of surprise, with
a response of 6 or 7 classified as higher surprise, and a score below 5 classified as lower
surprise. The Irritation index of those with the highest levels of surprise was not found to be
significantly different to those with lower levels of surprise (Mann-Whitney test P=0.39).
However, when individual emotional responses were analysed, those who had higher levels
of surprise were significantly more disappointed (P=0.03), worried (P<0.001) and grateful
(P=0.02).
Figure 36: Rating of the extent to which deferral was a surprise
05
1015
2025
Pro
porti
on o
f sam
ple
not at all 2 3 4 5 6 complete surpriseExtent to which deferral was a surprise
Extent to which deferral was a surprise

193
Donors were also asked whether, given the choice, they would have gone ahead and
donated on the occasion of their deferral. Three in ten donors indicated they definitely
would have given blood if provided with the choice, even if they knew their levels were
low. The responses are shown in Figure 37.
Figure 37: Rating of whether the donor would have given at deferral Table 62 provides a summary of respondents’ ratings of the extent to which they
experienced emotional responses to deferral. The emotions with the highest median values
were “disappointed”, “valued”, “sad”, “worried” and “grateful”.
Table 62: Ratings of possible emotional responses to deferral NOT AT
ALL VERY
MUCH SO
1 2 3 4 5 6 7 Median
Disappointed 8 8 8 23 26 35 95 6 (n=203) (3.9%) (3.9%) (3.9%) (11.3%) (12.8%) (17.2%) (46.8%) Sad 63 15 14 30 28 18 20 4 (n=188) (33.5%) (8.0%) (7.5%) (16.0%) (14.9%) (9.6%) (10.6%) Bothered 68 23 23 35 18 13 7 3
(n=187) (36.4%) (12.3%) (12.3%) (18.7%) (9.6%) (7.0%) (3.7%)
Worried 47 24 20 36 31 18 11 4 (n=187) (25.1%) (12.8%) (10.7%) (19.3%) (16.6%) (9.6%) (5.9%) Angry 141 17 8 12 3 3 4 1
010
2030
Pro
porti
on o
f sam
ple
definitely would not2 3 4 5 6 definitely wouldWould the donor have given at deferral
Would the donor have given blood given the choice?

194
(n=188) (75.0%) (9.0%) (4.3%) (6.4%) (1.6%) (1.6%) (2.1%)
Annoyed 100 28 11 21 8 11 10 1
(n=189) (52.9%) (14.8%) (5.8%) (11.1%) (4.2%) (5.8%) (5.3%)
Offended 156 16 3 6 2 0 2 1
(n=185) (84.3%) (8.7%) (1.6%) (3.2%) (1.1%) (0%) (1.1%)
Rejected 87 17 19 23 17 16 9 2
(n=188) (46.3%) (9.0%) (10.1%) (12.2%) (9.0%) (8.5%) (4.8%)
Unconcerned 44 29 31 27 22 18 13 3
(n=184) (23.9%) (15.8%) (16.9%) (14.7%) (12.0%) (9.8%) (7.1%)
Grateful 49 11 19 51 22 12 19 4 (n=183) (26.8%) (6.0%) (10.4%) (27.9%) (12.0%) (6.6%) (10.4%) Valued 15 12 16 45 32 32 35 5 (n=187) (8.0%) (6.4%) (8.6%) (24.1%) (17.1%) (17.1%) (18.7%) Relieved 129 20 6 20 3 1 4 1
(n=183) (70.5%) (10.9%) (3.3%) (10.9%) (1.6%) (0.6%) (2.2%)
6.4.5 Seeking further investigations
The majority of respondents (76.8%) had seen their General Practitioner (GP) by the time
of the survey, which was approximately three months after their deferral. A total of 78% of
these donors made an appointment specifically to discuss their low Hb, while 22%
discussed the issue while attending for other reasons.
Males were significantly more likely to see a GP than females (93.3% vs.74.4%, P=0.023).
The majority of donors in every age group reported seeing their GP, however those aged
below 18, and those aged 44 and older, had the highest likelihood of doing so (chi-square
test P=0.003).
Participants who saw their GP were provided with a list of investigations that may be
performed upon presentation with a low Hb value, and asked which, if any, they had
undergone. The proportions having each test are shown in Table 63.
Table 63: Investigations performed to investigate low Hb PROPORTION HAVING TESTS/
INVESTIGATIONS N=159
n % Blood tests 132 83.0 Discussions about diet 101 63.5 Discussions of obstetric and menstrual history (% of females only) 66 50.4
Faecal occult blood test 38 23.9

195
Colonoscopy 31 19.5 Endoscopy 25 15.7 Urine sample 20 12.6 Barium enema 2 1.3 Other (eg ultrasound) 3 1.9
Some donors were more likely than others to undergo particular tests. Males were
significantly more likely than females to have a colonoscopy (39.3% of males vs. 15.5 % of
females, P=0.004) and an endoscopy (33.3% of males vs. 12.4% of females, P=0.007).
There was a significant association between certain tests and age. For males, donors aged
55 or over were significantly more likely to have an endoscopy than younger donors
(50.0% vs. 9.1%, P=0.027), though not significantly more likely to have any other tests.
For females, those aged above 55 were significantly less likely than younger donors to have
discussions about their diet (39.1% vs. 72.0%, P=0.003) or their obstetric and menstrual
history (13.4 vs. 58.9%, p<0.001). Older donors were not significantly more likely to
undergo any other tests.
Although the results were not significant when analysed by gender (perhaps due to smaller
numbers in cells), in analysis of all donors, colonoscopies were significantly more likely to
have taken place if the donor was in an older age category (38.4% vs. 13.6%, P=0.001).
6.4.5.1 Outcomes of further investigations
Participants were asked whether the investigations detected any underlying causes that
might have contributed to their low Hb. A total of 22% of those seeing their GP (n=35)
reported that underlying conditions had already been detected by the time of the interview.
Donors were asked to describe the condition identified through the investigations. The
responses were coded and are shown in Table 64. Some respondents gave an answer that
could be coded in more than one category, and as a result there are more responses than
donors reporting an underlying condition. Most commonly the underlying condition could
be classified as having low iron stores (including anaemia, or a low ferritin level).
Eight donors indicating they were unsure whether they had an underlying condition wrote
comments in the space provided. Six of these donors noted they were still awaiting the
outcome of their test result, one donor had confirmed low iron levels, and one reported high
ESR (likely to refer to erythrocyte sedimentation rate- a non-specific indication of
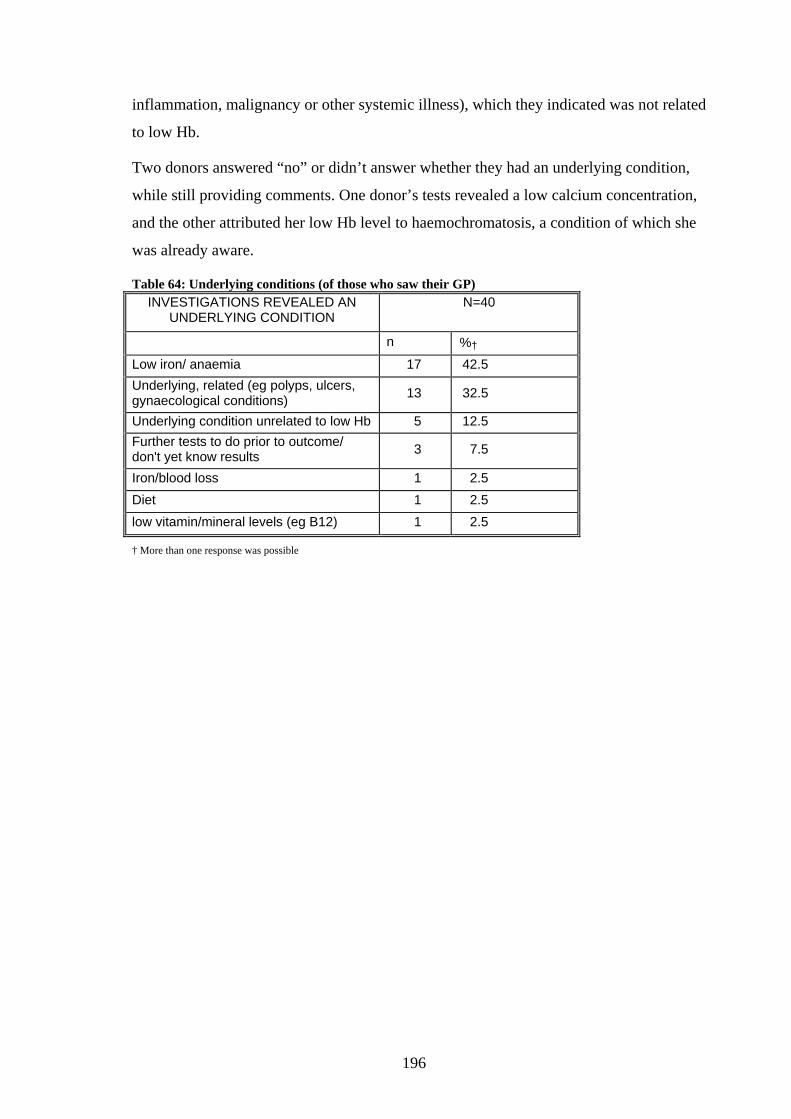
196
inflammation, malignancy or other systemic illness), which they indicated was not related
to low Hb.
Two donors answered “no” or didn’t answer whether they had an underlying condition,
while still providing comments. One donor’s tests revealed a low calcium concentration,
and the other attributed her low Hb level to haemochromatosis, a condition of which she
was already aware.
Table 64: Underlying conditions (of those who saw their GP) INVESTIGATIONS REVEALED AN
UNDERLYING CONDITION N=40
n %† Low iron/ anaemia 17 42.5 Underlying, related (eg polyps, ulcers, gynaecological conditions) 13 32.5
Underlying condition unrelated to low Hb 5 12.5 Further tests to do prior to outcome/ don't yet know results 3 7.5
Iron/blood loss 1 2.5 Diet 1 2.5 low vitamin/mineral levels (eg B12) 1 2.5
† More than one response was possible
197
Underlying conditions classified as associated with the low Hb concentration included:
• stomach ulcers (2 donors)
• coeliac disease (2 donors, one case was already known)
• haemorrhoids & hiatus hernia (1 donor)
• diverticulitis (2 donors)
• gynaecological conditions (including menorrhagia, growth on uterus, adenomyosis)
(4 donors)
• polyps (one case malignant) (3 donors).
Underlying conditions classified as unrelated to the low Hb concentration included:
• medication for another disease (liver disorder)
• abnormal liver function tests levels, which led to diagnosis of auto-immune hepatitis
• haemochromatosis (previously identified)
• abnormal thyroid function and blood sugar levels
• removal of gall bladder (unclear whether this had occurred earlier or as a result of
low Hb investigations).
Respondents indicating they had blood tests performed were asked whether their doctor
told them they had a low Hb level (anaemia) and/or iron deficiency. Nearly two thirds
(65.7%) of respondents had confirmed low Hb results at further testing, 26.3% were told
they had normal haemoglobin, while smaller proportions were not told of their results
(4.4%) or were not sure (3.7%). Over three quarters had confirmed iron deficiency (75.2%),
while 14.6% had normal iron stores, 4.4% said they were not told, and 5.8% were not sure
of their iron stores.
6.4.5.2 Explanation and advice
Respondents were asked whether their GP provided an explanation of the reasons for their
low haemoglobin level. The results are shown in

198
Table 65. Less than half of the donors had received an explanation as to why their levels
were low by the time of the survey.
Table 65: Donor provided with an explanation of why their Hb levels were low
EXPLANATION GIVEN OF WHY HB LEVELS LOW
N=156
n % Yes, given an explanation 68 45.6 No, as investigations are ongoing 36 23.1 No, as the levels were normal 23 14.7 No, no explanation was given 20 12.8 Don’t know 9 5.8
The text responses of those given an explanation were coded and are presented in Table 66
in order of descending frequency. Most commonly, blood donors were told that their low
Hb was caused by their diet, followed by underlying conditions (such as recent illness,
medication, or medical conditions), or menstrual cycles. Few (n=6) were told that the
frequency of blood donation contributed to their low levels.
Table 66: Explanation for low Hb levels EXPLANATION OF THE REASON FOR
LOW HB N=68
n %† Diet 17 27.0 Underlying condition 11 17.5 Menstrual cycles 8 12.7 Low in iron (iron deficient) 7 11.1 Age/sex of the donor 6 9.5 Frequency of blood donation 6 9.5 Lifestyle factors 4 6.3 No clear reason 3 4.8 Level is normal for the donor 1 1.6 Hereditary 2 3.2 Detail not provided 12 19.0
† More than one response was possible
Next, respondents were asked whether they were given specific pieces of advice from their
medical practitioner to increase their haemoglobin levels: whether to make changes to their
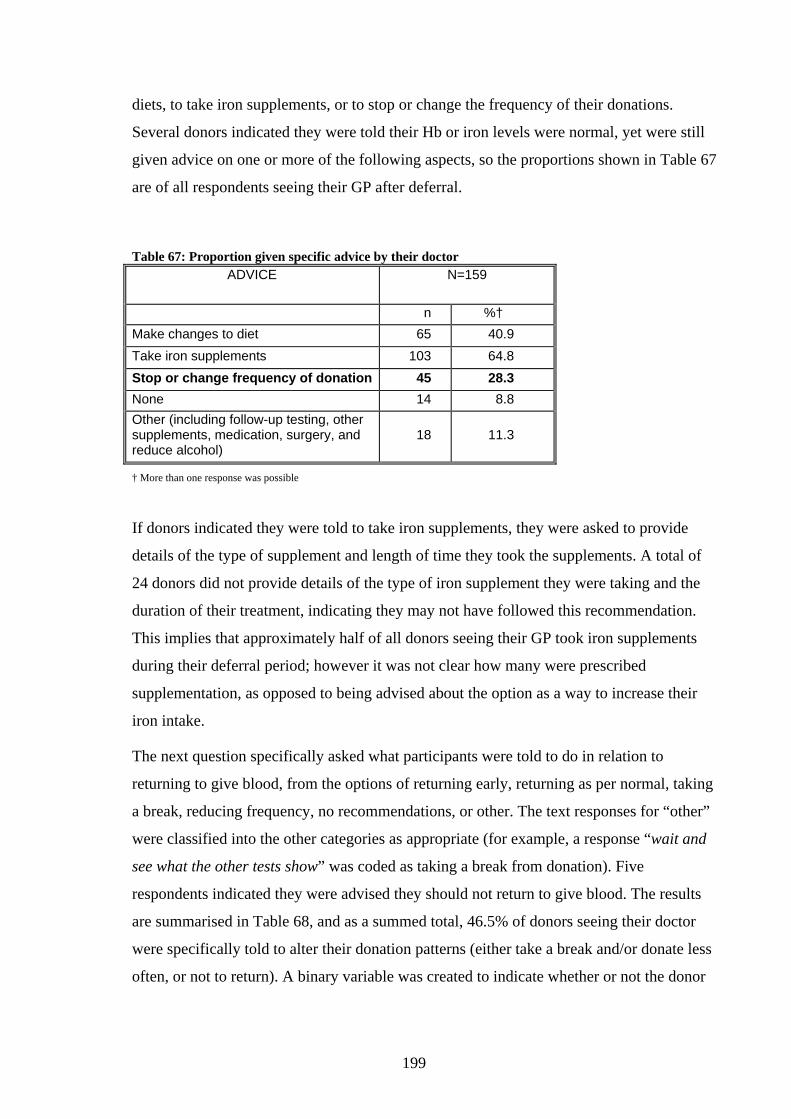
199
diets, to take iron supplements, or to stop or change the frequency of their donations.
Several donors indicated they were told their Hb or iron levels were normal, yet were still
given advice on one or more of the following aspects, so the proportions shown in Table 67
are of all respondents seeing their GP after deferral.
Table 67: Proportion given specific advice by their doctor ADVICE N=159
n %† Make changes to diet 65 40.9 Take iron supplements 103 64.8 Stop or change frequency of donation 45 28.3 None 14 8.8 Other (including follow-up testing, other supplements, medication, surgery, and reduce alcohol)
18 11.3
† More than one response was possible
If donors indicated they were told to take iron supplements, they were asked to provide
details of the type of supplement and length of time they took the supplements. A total of
24 donors did not provide details of the type of iron supplement they were taking and the
duration of their treatment, indicating they may not have followed this recommendation.
This implies that approximately half of all donors seeing their GP took iron supplements
during their deferral period; however it was not clear how many were prescribed
supplementation, as opposed to being advised about the option as a way to increase their
iron intake.
The next question specifically asked what participants were told to do in relation to
returning to give blood, from the options of returning early, returning as per normal, taking
a break, reducing frequency, no recommendations, or other. The text responses for “other”
were classified into the other categories as appropriate (for example, a response “wait and
see what the other tests show” was coded as taking a break from donation). Five
respondents indicated they were advised they should not return to give blood. The results
are summarised in Table 68, and as a summed total, 46.5% of donors seeing their doctor
were specifically told to alter their donation patterns (either take a break and/or donate less
often, or not to return). A binary variable was created to indicate whether or not the donor

200
was given any advice to restrict donation (e.g. delay return, donate less frequently, or cease
giving blood), which was used in later analysis.
Table 68: Proportion given advice about returning to give blood ADVICE N=159
n % Return early 3 1.9 Return as normal 23 14.5 Take a break 52 32.7 Donate less often 11 6.9 Take a break & donate less often 5 3.1 Don’t return 6 3.8 No recommendations 58 36.5 Other 1 0.6
Those indicating they were told to take a break detailed the length of the break. Most said a
time period (such as six months) while others were waiting until follow-up testing cleared
them to return. Those told to decrease frequency were most commonly advised to give a
maximum of two donations per year.
A total of 55.9% (n=85) of those who saw their GP were advised to have follow-up tests at
a later date. An open-ended question inviting detail on the follow-up tests indicated most
follow-up tests were still to be completed, and were planned for a set-time point, such as
three or six months after the initial tests, or after finishing a course of iron tablets. Some
were advised to have follow-up testing prior to returning to give blood. A small number of
donors described needing further investigations of their GI tract (e.g. a colonoscopy or
endoscopy) at a later point.
When asked whether they were told to see a specialist for further investigations, 20.9%
(n=33) of those seeing their GP answered “yes”. The majority were sent to a
gastroenterologist (n=14), gynaecologist (n=6), surgeon (n=7), a haematologist (n=1), and 5
selected “other”, nominating a dermatologist, an ear, nose and throat (ENT) specialist, an
endocrinologist, a liver specialist, and an unspecified specialist “to check for internal
bleeding”.

201

202
6.4.6 Changes since deferral
Nearly three quarters (74.2%) of respondents indicated they had made changes since their
deferral. Most commonly, the changes were dietary and/or taking supplements. Donors
were asked to select from a list the source/s of the information to make the changes. The
results are listed in Table 69. A substantial proportion utilised information given by the
ARCBS (22.2%), though this was not the most common source of information.
Table 69: Source of information for lifestyle changes INFORMATION SOURCE N=207
n % Doctor 95 45.9 Information they already knew 65 31.4 Information provided by the blood service 46 22.2
A friend or family member 28 13.5 The internet 18 8.7 Another health professional 13 6.3 Medical specialist 3 1.5 Other (including own professional knowledge, pharmacist, and personal trainer)
9 4.4
Respondents were asked to describe the reason for their low Hb level in a closed-response
question, choosing as many as were relevant to them. The number and proportion citing
each reason are shown in Table 70. Most commonly, donors associated their low
haemoglobin with a diet containing insufficient iron. Few attributed their low haemoglobin
to the frequency of blood donation.
Those who were told to change their donation patterns by their doctor were significantly
more likely to believe that their low Hb was caused by donation frequency than those not
given that advice (20.3% vs. 3.5%, P=0.001). Nevertheless, the majority of those told to
change donation patterns (79.7%) did not believe donation had contributed to their low
levels.
Table 70: Reason attributed to low Hb
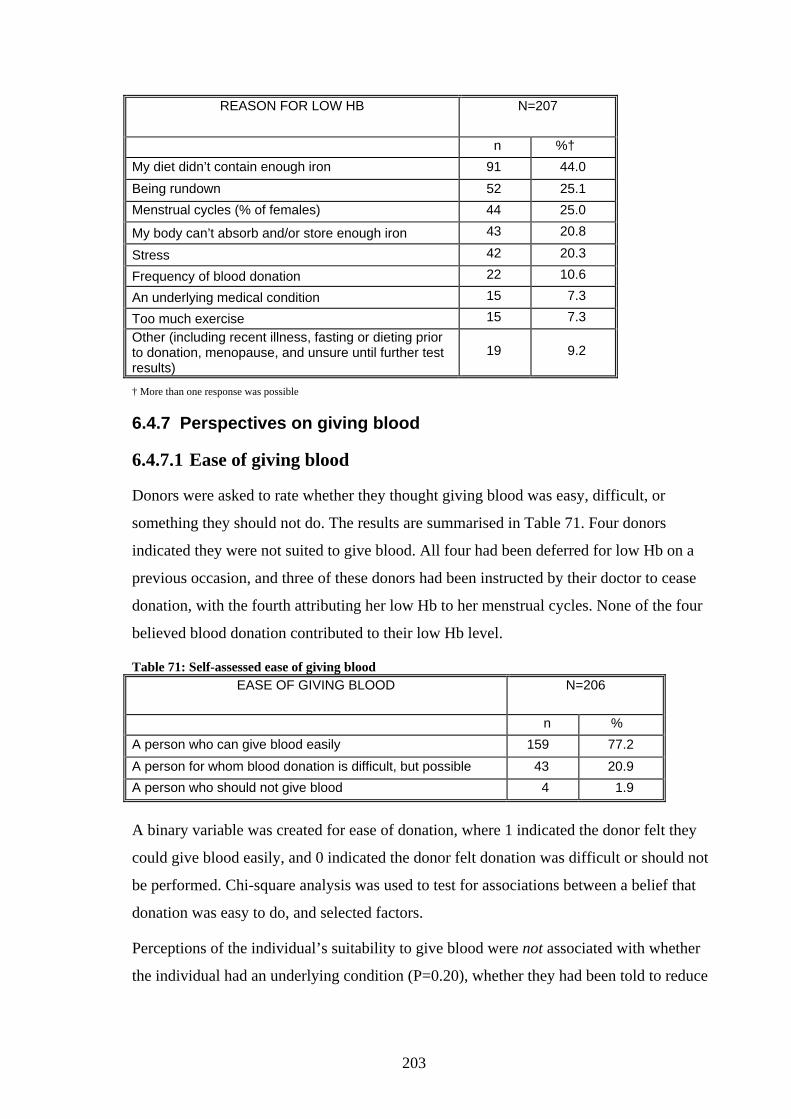
203
REASON FOR LOW HB
N=207
n %† My diet didn’t contain enough iron 91 44.0 Being rundown 52 25.1 Menstrual cycles (% of females) 44 25.0
My body can’t absorb and/or store enough iron 43 20.8
Stress 42 20.3
Frequency of blood donation 22 10.6
An underlying medical condition 15 7.3
Too much exercise 15 7.3 Other (including recent illness, fasting or dieting prior to donation, menopause, and unsure until further test results)
19 9.2
† More than one response was possible
6.4.7 Perspectives on giving blood
6.4.7.1 Ease of giving blood
Donors were asked to rate whether they thought giving blood was easy, difficult, or
something they should not do. The results are summarised in Table 71. Four donors
indicated they were not suited to give blood. All four had been deferred for low Hb on a
previous occasion, and three of these donors had been instructed by their doctor to cease
donation, with the fourth attributing her low Hb to her menstrual cycles. None of the four
believed blood donation contributed to their low Hb level.
Table 71: Self-assessed ease of giving blood EASE OF GIVING BLOOD N=206
n % A person who can give blood easily 159 77.2 A person for whom blood donation is difficult, but possible 43 20.9 A person who should not give blood 4 1.9
A binary variable was created for ease of donation, where 1 indicated the donor felt they
could give blood easily, and 0 indicated the donor felt donation was difficult or should not
be performed. Chi-square analysis was used to test for associations between a belief that
donation was easy to do, and selected factors.
Perceptions of the individual’s suitability to give blood were not associated with whether
the individual had an underlying condition (P=0.20), whether they had been told to reduce
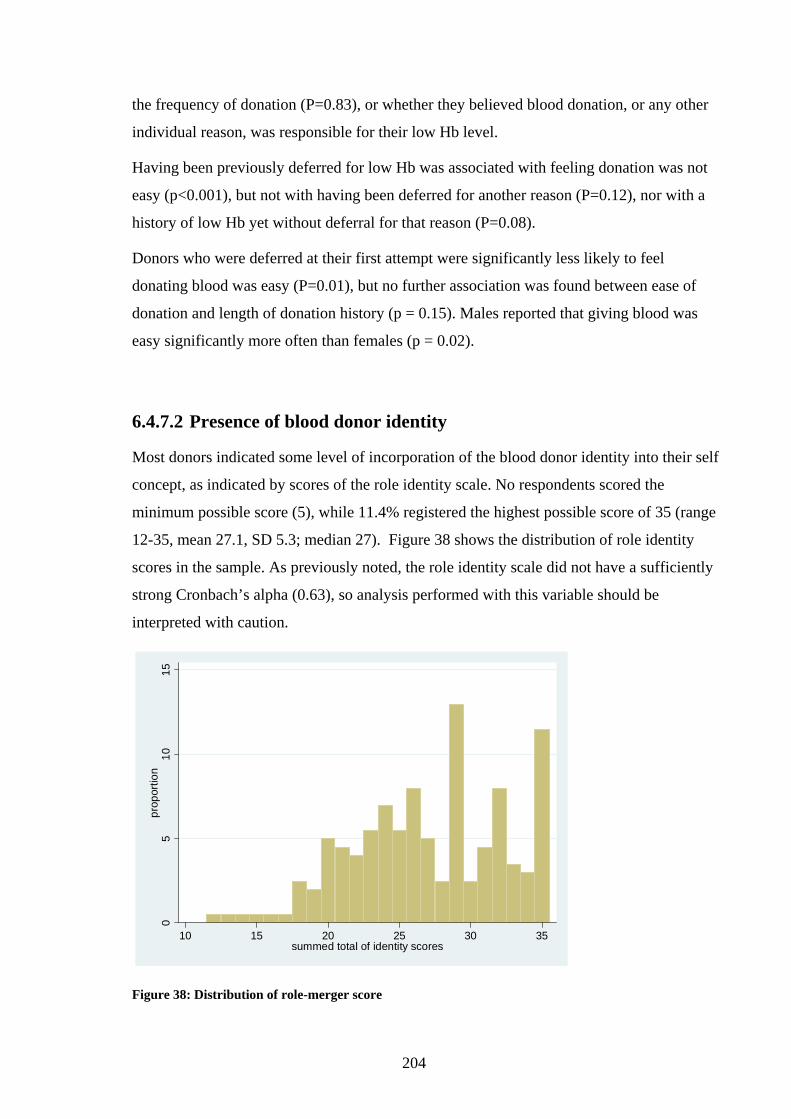
204
the frequency of donation (P=0.83), or whether they believed blood donation, or any other
individual reason, was responsible for their low Hb level.
Having been previously deferred for low Hb was associated with feeling donation was not
easy (p<0.001), but not with having been deferred for another reason (P=0.12), nor with a
history of low Hb yet without deferral for that reason (P=0.08).
Donors who were deferred at their first attempt were significantly less likely to feel
donating blood was easy (P=0.01), but no further association was found between ease of
donation and length of donation history (p = 0.15). Males reported that giving blood was
easy significantly more often than females (p = 0.02).
6.4.7.2 Presence of blood donor identity
Most donors indicated some level of incorporation of the blood donor identity into their self
concept, as indicated by scores of the role identity scale. No respondents scored the
minimum possible score (5), while 11.4% registered the highest possible score of 35 (range
12-35, mean 27.1, SD 5.3; median 27). Figure 38 shows the distribution of role identity
scores in the sample. As previously noted, the role identity scale did not have a sufficiently
strong Cronbach’s alpha (0.63), so analysis performed with this variable should be
interpreted with caution.
Figure 38: Distribution of role-merger score
05
1015
prop
ortio
n
10 15 20 25 30 35summed total of identity scores

205
Wilcoxon rank-sum tests were used to measure the difference in rank sums (reflecting
different distributions) of the role identity scale by demographic characteristic, donation
history, and other factors of interest.
Females had a significantly higher score than males (P=0.04). Identity score was not
associated with age, or with being a first time donor at the deferral event.
A higher score was not found to be significantly associated with a longer donation history
(having given longer than one year, versus less than one year, P=0.08). Role identity score
was significantly associated with having made a greater number of donations, with those
who had given less than 20 times having significantly higher scores than those with more
than 20 donations (P=0.03). However, distinctions at lower frequencies (such as less than
three donations, or less than ten donations) were not associated with significantly different
scores.
There was no significant difference between the role identity scores for those with a history
of low Hb, or who had been previously deferred for either low Hb or another reason.
Higher recent donation frequency was also associated with a higher role identity score.
Repeat donors who had not given blood in the twelve months prior to deferral had a
significantly lower identity score than those who had given at least once in the past year
(P=0.02), while those who gave three or more times had significantly higher scores than
those giving twice or less often (p<0.001).
Role identity score was not associated with whether the donor saw their GP, whether the
donor was told to change donation patterns, or whether the donor felt that donation was
easy to perform
The factors found to be significantly associated with role identity score are shown in Figure
39. As cross-sectional surveys cannot distinguish the direction of association, factors
relating to donation behaviour are shown with arrows travelling in both directions.

206
Figure 39: Factors associated with role identity score
Blood-donor identity
Given more times in previous 12 months
+
Female
+
Given 20+ donations
+
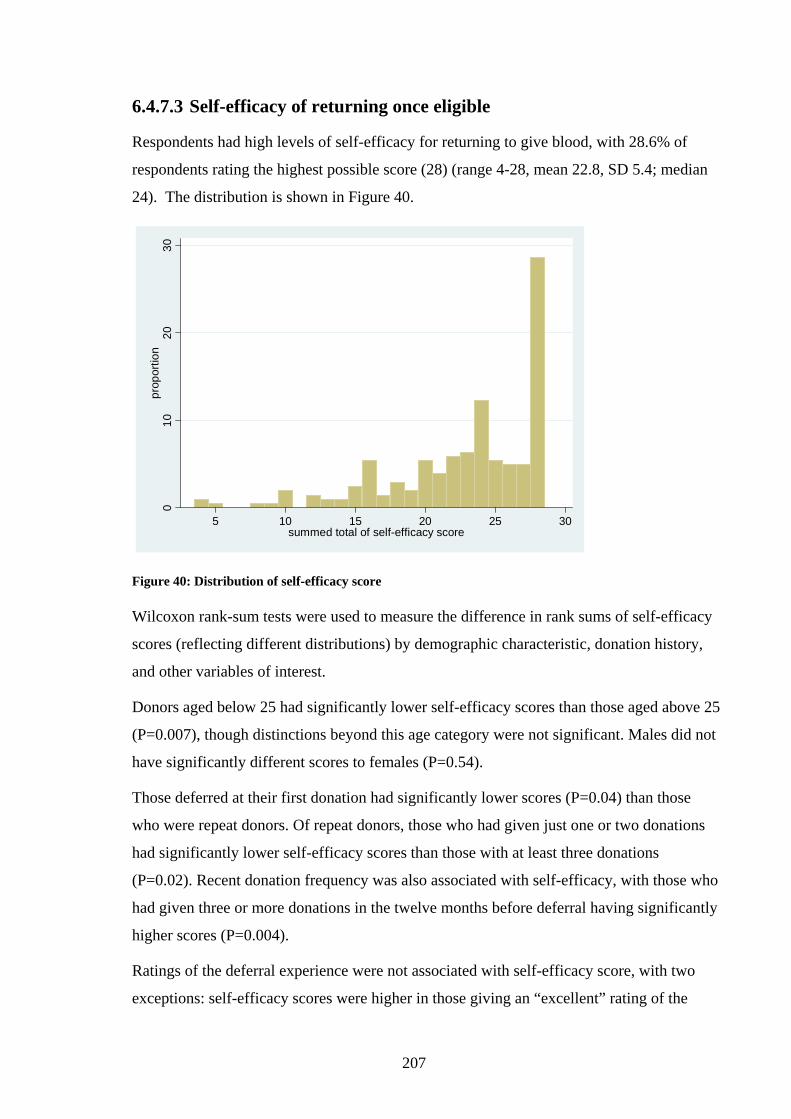
207
6.4.7.3 Self-efficacy of returning once eligible
Respondents had high levels of self-efficacy for returning to give blood, with 28.6% of
respondents rating the highest possible score (28) (range 4-28, mean 22.8, SD 5.4; median
24). The distribution is shown in Figure 40.
Figure 40: Distribution of self-efficacy score Wilcoxon rank-sum tests were used to measure the difference in rank sums of self-efficacy
scores (reflecting different distributions) by demographic characteristic, donation history,
and other variables of interest.
Donors aged below 25 had significantly lower self-efficacy scores than those aged above 25
(P=0.007), though distinctions beyond this age category were not significant. Males did not
have significantly different scores to females (P=0.54).
Those deferred at their first donation had significantly lower scores (P=0.04) than those
who were repeat donors. Of repeat donors, those who had given just one or two donations
had significantly lower self-efficacy scores than those with at least three donations
(P=0.02). Recent donation frequency was also associated with self-efficacy, with those who
had given three or more donations in the twelve months before deferral having significantly
higher scores (P=0.004).
Ratings of the deferral experience were not associated with self-efficacy score, with two
exceptions: self-efficacy scores were higher in those giving an “excellent” rating of the
010
2030
prop
ortio
n
5 10 15 20 25 30summed total of self-efficacy score
208
explanation about Hb and iron (P=0.044), and those giving an “excellent” rating of the way
they were made to feel appreciated as a donor (P=0.03), relative to those with poorer
ratings.
Self-efficacy score was associated with the donor reporting they would have gone ahead
with donation if given the choice (p<0.001). Higher levels of self-efficacy were found for
those who felt donation was easy for them to perform compared to those who felt it was
difficult or something they should not do (p<0.001).
Self-efficacy score was not associated with whether the donor had been deferred on a
previous occasion, or had a history of low Hb. Self-efficacy was also not significantly
associated with the level of surprise at deferral.
Those who saw their GP had levels of self-efficacy similar to those not visiting their GP
(P=0.4). However, amongst the respondents seeing their GP, those who reported that blood
tests performed by their doctor confirmed them as having normal Hb concentration had
significantly higher self-efficacy scores (P=0.03) than those found to be low, unsure, or not
told of their results. However, having confirmed normal iron stores was not associated with
self-efficacy score (P=0.17).
Whether or not the donor believed that the frequency of giving blood was the reason for a
low Hb level was not associated with self-efficacy of return, nor was being specifically told
to change donation patterns. Unexpectedly, those who reported that they had an underlying
condition detected by their GP had significantly higher self-efficacy scores than those who
saw their doctor but had no underlying cause identified (P=0.01).
Figure 41 shows the factors found to be associated with self-efficacy in the univariable
analysis presented in this section.

209
Figure 41: Factors associated with self-efficacy to return once eligible
6.4.8 Intention to return once eligible
Donors were asked to assess the likelihood that they would return to donate within six
months of being eligible to do so. More than 60% of donors selected the highest chance of
return (10 out of 10, anchored at “certain” of return), over a quarter rating a 7, 8 or 9 out of
10, and the remaining 15% were spread over the lower end of the scale. The responses are
graphed in Figure 42.
Normal Hb at Doctor
Underlying condition causing low Hb
+
Highest rating of low Hb explanation
+ ↑ Self-efficacy for returning once
eligible
Donation not easy
-
Age <25
-
Previous deferral for low Hb
+
Highest rating of feeling appreciated +
+
Higher recent freq. (3+ in previous 12
mths) +
+
-
Given 3+ donations during donation
history
First time donor
+
Female +
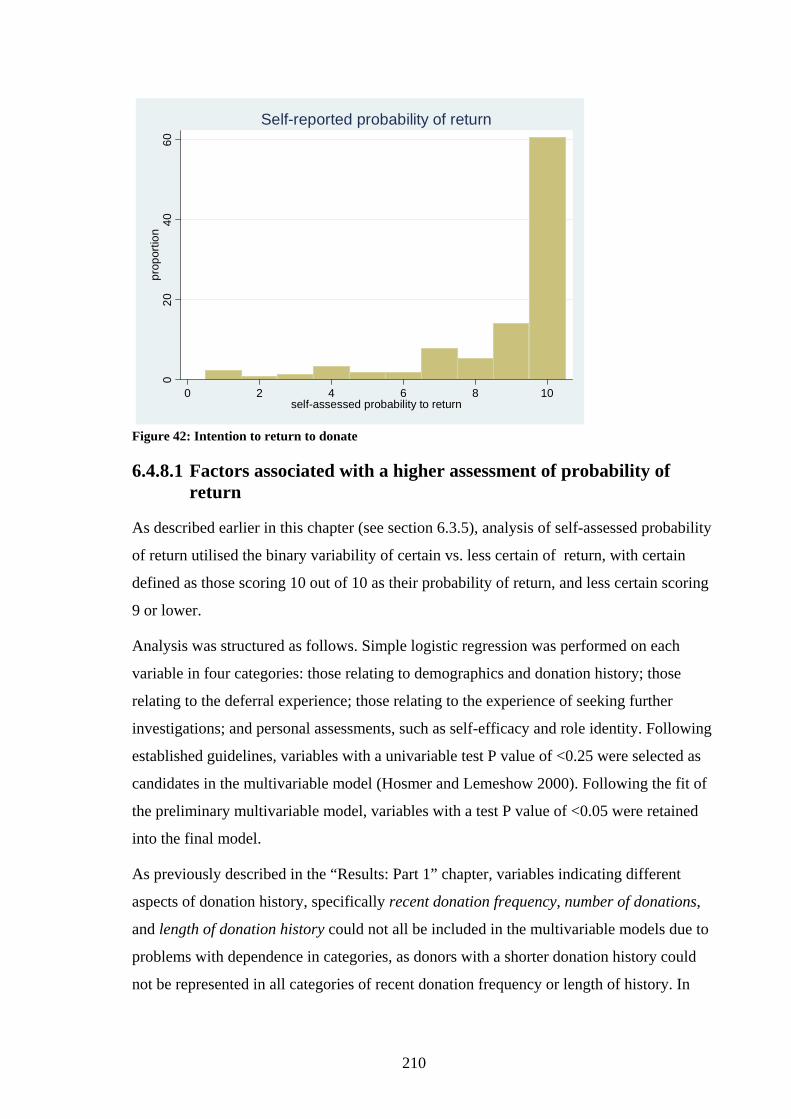
210
Figure 42: Intention to return to donate
6.4.8.1 Factors associated with a higher assessment of probability of return
As described earlier in this chapter (see section 6.3.5), analysis of self-assessed probability
of return utilised the binary variability of certain vs. less certain of return, with certain
defined as those scoring 10 out of 10 as their probability of return, and less certain scoring
9 or lower.
Analysis was structured as follows. Simple logistic regression was performed on each
variable in four categories: those relating to demographics and donation history; those
relating to the deferral experience; those relating to the experience of seeking further
investigations; and personal assessments, such as self-efficacy and role identity. Following
established guidelines, variables with a univariable test P value of <0.25 were selected as
candidates in the multivariable model (Hosmer and Lemeshow 2000). Following the fit of
the preliminary multivariable model, variables with a test P value of <0.05 were retained
into the final model.
As previously described in the “Results: Part 1” chapter, variables indicating different
aspects of donation history, specifically recent donation frequency, number of donations,
and length of donation history could not all be included in the multivariable models due to
problems with dependence in categories, as donors with a shorter donation history could
not be represented in all categories of recent donation frequency or length of history. In
020
4060
prop
ortio
n
0 2 4 6 8 10self-assessed probability to return
Self-reported probability of return
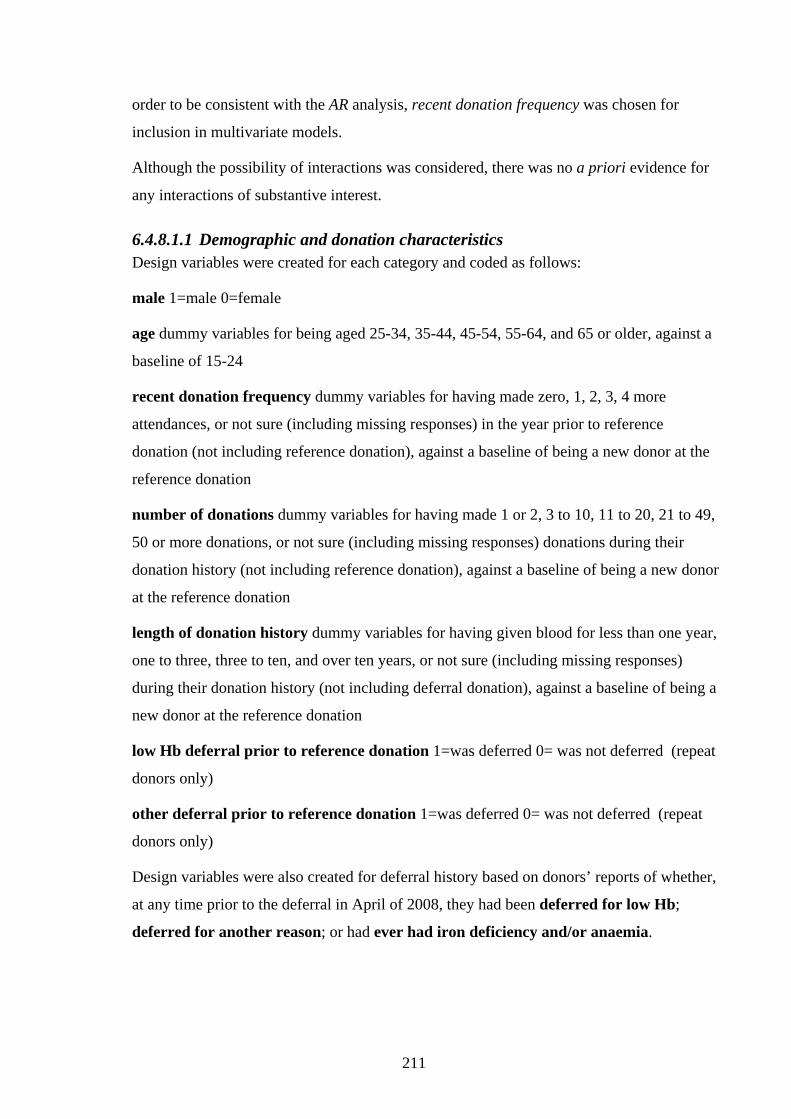
211
order to be consistent with the AR analysis, recent donation frequency was chosen for
inclusion in multivariate models.
Although the possibility of interactions was considered, there was no a priori evidence for
any interactions of substantive interest.
6.4.8.1.1 Demographic and donation characteristics Design variables were created for each category and coded as follows:
male 1=male 0=female
age dummy variables for being aged 25-34, 35-44, 45-54, 55-64, and 65 or older, against a
baseline of 15-24
recent donation frequency dummy variables for having made zero, 1, 2, 3, 4 more
attendances, or not sure (including missing responses) in the year prior to reference
donation (not including reference donation), against a baseline of being a new donor at the
reference donation
number of donations dummy variables for having made 1 or 2, 3 to 10, 11 to 20, 21 to 49,
50 or more donations, or not sure (including missing responses) donations during their
donation history (not including reference donation), against a baseline of being a new donor
at the reference donation
length of donation history dummy variables for having given blood for less than one year,
one to three, three to ten, and over ten years, or not sure (including missing responses)
during their donation history (not including deferral donation), against a baseline of being a
new donor at the reference donation
low Hb deferral prior to reference donation 1=was deferred 0= was not deferred (repeat
donors only)
other deferral prior to reference donation 1=was deferred 0= was not deferred (repeat
donors only)
Design variables were also created for deferral history based on donors’ reports of whether,
at any time prior to the deferral in April of 2008, they had been deferred for low Hb;
deferred for another reason; or had ever had iron deficiency and/or anaemia.

212
Simple logistic regression was performed for each of the variables outlined above. The
results are presented in Table 72, and estimates with a global probability of <0.25 are
indicated in bold font.
Table 72: Univariable logistic regression models for certainty of return, demographic and donation characteristics
VARIABLE OR 95% CONF. INTERVAL
P
Age (n=207) 0.75
<25 25-34 1.94 0.71 5.25 0.19 35-44 1.52 0.61 3.79 0.37 45-54 1.18 0.52 2.81 0.70 55-64 0.97 0.36 2.63 0.96 65+ 1.40 0.42 4.71 0.58
Male (relative to female) 0.72 0.33 1.57 0.41
Recent donation history <0.001
New donor 0 donation prior 0.20 0.01 2.88 0.24 1 donation prior 2.62 0.41 16.54 0.31 2 donations prior 1.88 0.30 11.78 0.50 3 donations prior 4.59 0.77 27.49 0.10 4 donations prior 6.40 1.02 40.29 0.049 Not sure 3.17 0.50 20.04 0.22
Number of donations 0.31
New donor 1 or 2 donations 2.67 0.40 17.91 0.31 3 to 10 donations 2.70 0.47 15.55 0.27 11 to 20 donations 4.00 0.62 25.68 0.14 21 to 49 donations 5.75 0.88 37.62 0.07 50+ donations 4.00 0.56 28.40 0.17 Not sure 1.50 0.20 11.09 0.69
Length of donation history 0.12
New donor Less than one year 1.43 0.18 11.09 0.73 1 to less than 3 years 3.13 0.53 18.49 0.21 3 to less than 10 years 3.71 0.63 21.99 0.15
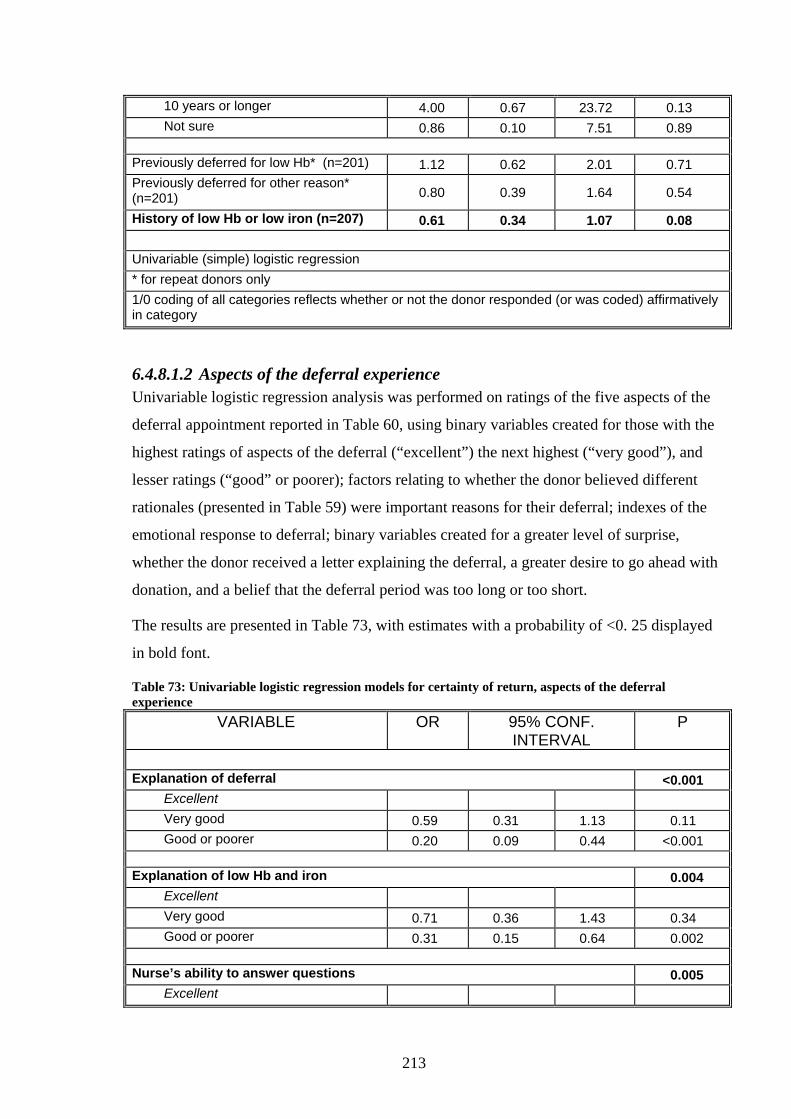
213
10 years or longer 4.00 0.67 23.72 0.13 Not sure 0.86 0.10 7.51 0.89
Previously deferred for low Hb* (n=201) 1.12 0.62 2.01 0.71 Previously deferred for other reason* (n=201) 0.80 0.39 1.64 0.54
History of low Hb or low iron (n=207) 0.61 0.34 1.07 0.08 Univariable (simple) logistic regression * for repeat donors only 1/0 coding of all categories reflects whether or not the donor responded (or was coded) affirmatively in category
6.4.8.1.2 Aspects of the deferral experience Univariable logistic regression analysis was performed on ratings of the five aspects of the
deferral appointment reported in Table 60, using binary variables created for those with the
highest ratings of aspects of the deferral (“excellent”) the next highest (“very good”), and
lesser ratings (“good” or poorer); factors relating to whether the donor believed different
rationales (presented in Table 59) were important reasons for their deferral; indexes of the
emotional response to deferral; binary variables created for a greater level of surprise,
whether the donor received a letter explaining the deferral, a greater desire to go ahead with
donation, and a belief that the deferral period was too long or too short.
The results are presented in Table 73, with estimates with a probability of <0. 25 displayed
in bold font.
Table 73: Univariable logistic regression models for certainty of return, aspects of the deferral experience
VARIABLE OR 95% CONF. INTERVAL
P
Explanation of deferral <0.001
Excellent Very good 0.59 0.31 1.13 0.11 Good or poorer 0.20 0.09 0.44 <0.001
Explanation of low Hb and iron 0.004
Excellent Very good 0.71 0.36 1.43 0.34 Good or poorer 0.31 0.15 0.64 0.002
Nurse’s ability to answer questions 0.005
Excellent

214
Very good 0.68 0.34 1.38 0.29 Good or poorer 0.31 0.15 0.65 0.002
Feeling appreciated as a donor 0.03
Excellent Very good 0.43 0.22 0.83 0.01 Good or poorer 0.54 0.26 1.12 0.10
Nurse’s concern for them as a person 0.04
Excellent Very good 0.68 0.34 1.36 0.28 Good or poorer 0.41 0.21 0.81 0.01
Reporting a rationale was “an important consideration” for deferral (relative to “a minor consideration” or “not at all” as a consideration )
Personal wellbeing 1.37 0.67 2.81 0.39 A possible underlying condition 1.60 0.89 2.88 0.12 Health of the recipient 1.36 0.78 2.40 0.28 ARCBS regulations 0.91 0.46 1.79 0.78
Emotional response index (for each one point increase on 7 point index)
Irritation 1.05 0.83 1.34 0.68
Emotional response index (for each one point increase on 7 point index) Sad 1.05 0.91 1.20 0.51 Bothered 1.02 0.87 1.20 0.80 Disappointed 1.35 1.14 1.61 0.001 Worried 0.93 0.80 1.08 0.33 Angry 1.20 0.95 1.52 0.12 Annoyed 1.05 0.90 1.22 0.53 Offended 0.91 0.67 1.24 0.56 Rejected 1.00 0.86 1.15 1.00 Unconcerned 1.05 0.90 1.22 0.54 Grateful 0.84 0.72 0.98 0.03 Valued 1.13 0.96 1.33 0.15 Relieved 0.79 0.63 0.98 0.03
High surprise (score 6 or 7, relative to score <6) 0.99 0.56 1.74 0.97
Would have gone ahead with donation (score 6 or 7, relative to score <6) 2.54 1.40 4.58 0.002
Sent a letter explaining deferral 2.32 1.16 4.64 0.02
Rating of the length of deferral <0.001
appropriate length Deferral too short 0.98 0.31 3.07 0.97

215
Deferral too long 7.71 3.52 16.9 <0.001 Univariable (simple) logistic regression N= 207 * for repeat donors only 1/0 coding of all categories reflects whether or not the donor responded (or was coded) affirmatively in category

216
6.4.8.1.3 Outcomes of seeking further investigations Design variables were created to indicate whether specific events took place during the
process of seeking further investigations. Binary variables were created to indicate whether
the donor was told to change the frequency and/or take a break from donation; was found to
have a normal Hb level upon further investigation; had normal iron stores upon further
investigation; or was found to have an underlying condition. Design variables were also
created to indicate whether the donor believed a pre-defined cause was responsible for their
low Hb concentration (for example, diet, or the frequency of blood donation).
Logistic regression was performed on each variable, and the results are presented in Table
74.
Table 74: Univariable logistic regression models for certainty of return, seeking further investigations and attributed cause of low Hb
OR 95% CONF. INTERVAL
P
Saw GP (relative to those who did not) 1.0 0.52 1.93 1.0
Change donation freq/ take break** (relative to those not told to do this) 0.75 0.40 1.43 0.38
Confirmed normal Hb level** (relative to those with low Hb or not sure) 1.39 0.65 2.96 0.40
Confirmed normal iron store** (relative to those found iron deficient or not sure)
2.86 0.92 8.89 0.07
Believing reason caused low Hb (relative to those not nominating reason)
Diet 1.11 0.63 1.94 0.73 Difficulty absorbing or storing iron 0.49 0.25 0.97 0.04
Stress 1.42 0.69 2.89 0.34 Frequency of blood donation 1.18 0.47 2.95 0.73 An underlying medical condition 0.55 0.19 1.59 0.27 Too much exercise 1.34 0.44 4.07 0.61 Being run down 1.34 0.70 2.59 0.38 Menstrual cycles 1.05 0.53 2.09 0.88 Don’t know 1.18 0.56 2.49 0.67
Univariable (simple) logistic regression N= 207, except if ** N=159
6.4.8.1.4 Self-perceptions as a donor Logistic regression was fitted to the data to measure the effect of a one point increase in
each of the self-efficacy and role identity scales on certainty of return. Analysis was also

217
performed to measure the effect of believing donation was easy vs. difficult to perform on
the certainty of return factor. The results of the univariable models are shown in Table 75.
Table 75: Univariable logistic regression models for certainty of return, self-perceptions as a donor OR 95% CONF.
INTERVAL P
Role identity (for each one point increase on 35 point scale) 1.14 1.07 1.21 <0.001
Self-efficacy (for each one point increase on 28 point scale) 1.18 1.11 1.26 <0.001
Giving blood is easy to do (relative to difficult or something they shouldn’t do)
2.72 1.41 5.27 0.003
Univariable (simple) logistic regression N= 207
6.4.8.1.5 Overall model predicting intention to return Factors found to be associated with self-assessed probability of return in the simple models
were included in the multivariable logistic regression model. Variables related to donation
history were re-coded to include “new donors” to allow all variables to be included in the
model, and the variable relating to medical investigations was re-coded so that all
individuals who did not see their GP were indicated by case=0. The results are shown in
Table 76. Global P values for variables with three or more categories were estimated using
a likelihood ratio test. The results are displayed in Table 76.
Table 76: Results of fitting a multivariable model with significant univariable effects VARIABLE OR 95% CONF.
INTERVAL P
Recent donation history 0.35
New donor 0 donation prior 0.17 0.00 6.60 0.34 1 donation prior 0.99 0.07 13.64 1.00 2 donations prior 1.17 0.08 18.00 0.91 3 donations prior 2.85 0.21 39.21 0.43 4 donations prior 2.37 0.17 33.68 0.52 Not sure 1.02 0.07 14.44 0.99
History of low Hb or low iron 0.86 0.33 2.28 0.77
Explanation of deferral 0.55 Excellent Very good 0.64 0.13 3.23 0.59

218
Good or poorer 0.33 0.04 2.64 0.29
Explanation of low Hb and iron 0.97 Excellent Very good 0.83 0.13 5.51 0.85 Good or poorer 0.75 0.08 7.05 0.81
Nurse’s ability to answer questions 0.78
Excellent Very good 1.97 0.28 13.65 0.49 Good or poorer 1.55 0.21 11.55 0.67
Feeling appreciated as a donor 0.16
Excellent Very good 1.39 0.28 6.84 0.69 Good or poorer 6.75 0.69 66.05 0.10
Nurse’s concern for them as a person 0.27
Excellent Very good 0.59 0.11 3.31 0.55 Good or poorer 0.20 0.02 1.71 0.14
Reporting a rationale was “an important consideration” for deferral (relative to “a minor consideration” or “not at all” as a consideration ) A possible underlying condition 2.06 0.76 5.62 0.16 Emotional response index (for each one point increase on 7 point index)
Disappointed 1.14 0.85 1.53 0.37 Angry 1.13 0.75 1.71 0.55 Grateful 0.76 0.57 1.00 0.05 Valued 0.98 0.73 1.32 0.89 Relieved 0.94 0.67 1.32 0.72
Would have gone ahead with donation (score 6 or 7, relative to score <6)
1.19 0.45 3.20 0.72
Sent a letter explaining deferral 1.58 0.47 5.33 0.46
Rating of the length of deferral 0.07
appropriate length Deferral too short 1.94 0.30 12.67 0.49 Deferral too long 3.88 1.15 13.06 0.03
Confirmed normal iron store (relative to those found iron deficient or not sure)
1.87 0.30 11.63 0.50
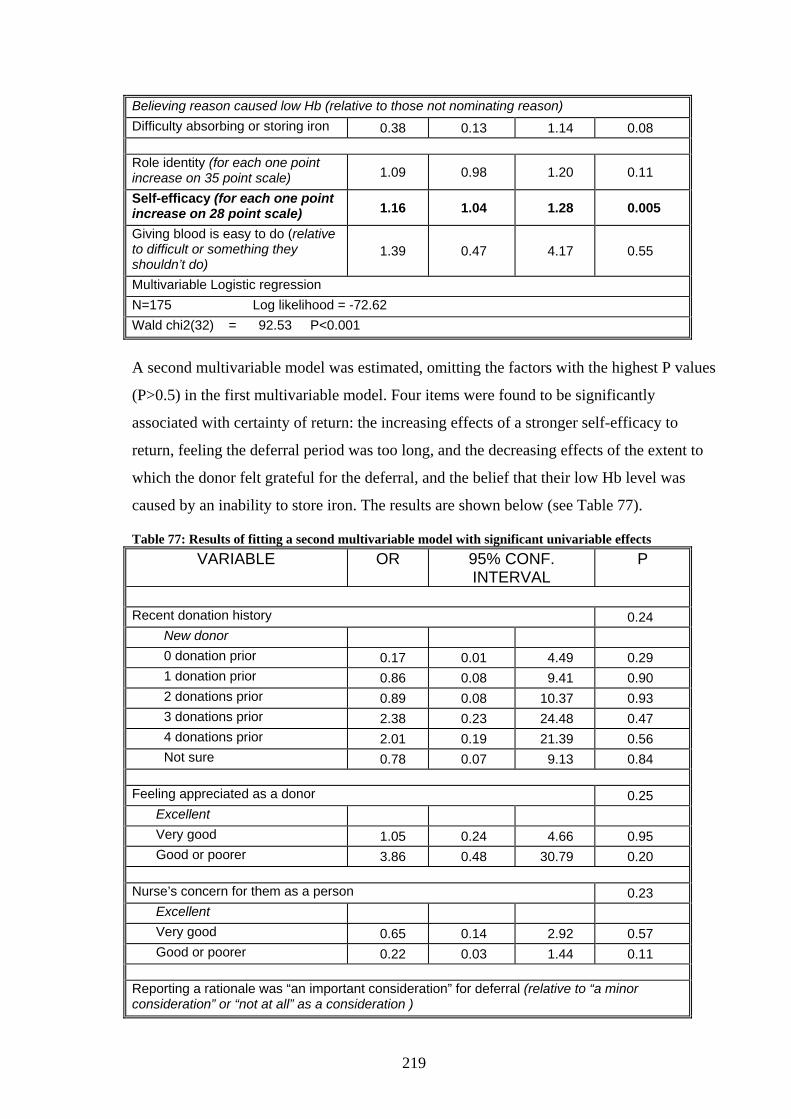
219
Believing reason caused low Hb (relative to those not nominating reason) Difficulty absorbing or storing iron 0.38 0.13 1.14 0.08
Role identity (for each one point increase on 35 point scale) 1.09 0.98 1.20 0.11
Self-efficacy (for each one point increase on 28 point scale) 1.16 1.04 1.28 0.005
Giving blood is easy to do (relative to difficult or something they shouldn’t do)
1.39 0.47 4.17 0.55
Multivariable Logistic regression N=175 Log likelihood = -72.62 Wald chi2(32) = 92.53 P<0.001
A second multivariable model was estimated, omitting the factors with the highest P values
(P>0.5) in the first multivariable model. Four items were found to be significantly
associated with certainty of return: the increasing effects of a stronger self-efficacy to
return, feeling the deferral period was too long, and the decreasing effects of the extent to
which the donor felt grateful for the deferral, and the belief that their low Hb level was
caused by an inability to store iron. The results are shown below (see Table 77).
Table 77: Results of fitting a second multivariable model with significant univariable effects VARIABLE OR 95% CONF.
INTERVAL P
Recent donation history 0.24
New donor 0 donation prior 0.17 0.01 4.49 0.29 1 donation prior 0.86 0.08 9.41 0.90 2 donations prior 0.89 0.08 10.37 0.93 3 donations prior 2.38 0.23 24.48 0.47 4 donations prior 2.01 0.19 21.39 0.56 Not sure 0.78 0.07 9.13 0.84
Feeling appreciated as a donor 0.25 Excellent Very good 1.05 0.24 4.66 0.95 Good or poorer 3.86 0.48 30.79 0.20
Nurse’s concern for them as a person 0.23
Excellent Very good 0.65 0.14 2.92 0.57 Good or poorer 0.22 0.03 1.44 0.11
Reporting a rationale was “an important consideration” for deferral (relative to “a minor consideration” or “not at all” as a consideration )

220
A possible underlying condition 1.91 0.74 4.91 0.18 Emotional response index (for each one point increase on 7 point index)
Disappointed 1.19 0.91 1.54 0.20 Grateful 0.71 0.56 0.91 0.01
Sent a letter explaining deferral 1.83 0.59 5.67 0.29
Rating of the length of deferral 0.02
appropriate length Deferral too short 1.93 0.38 9.88 0.43 Deferral too long 4.48 1.42 14.12 0.006
Confirmed normal iron store (relative to those found iron deficient or not sure)
1.93 0.36 10.33 0.44
Believing reason caused low Hb (relative to those not nominating reason) Difficulty absorbing or storing iron 0.36 0.13 1.00 0.049
Role identity (for each one point increase on 35 point scale) 1.09 0.99 1.19 0.08
Self-efficacy (for each one point increase on 28 point scale) 1.18 1.07 1.29 <0.001
Multivariable logistic regression N=177 Log likelihood = -75.25 Wald chi2(20) = 90.10 P<0.001
The significant predictors in the second multivariate model were included in the
preliminary final model. The results are shown in Table 78.

221
Table 78: Preliminary final model containing significant main effects OR 95% CONF.
INTERVAL P
Grateful (response to deferral) 0.78 0.64 0.95 0.01
Rating of the length of deferral 0.001 appropriate length Deferral too short 1.12 0.30 4.22 0.87 Deferral too long 4.75 1.93 11.66 0.001
Reason for low Hb inability to store iron 0.43 0.18 1.00 0.049
Self-efficacy score (for each one point increase on 28 point scale) 1.17 1.08 1.26 <0.001
Logistic regression N=179 Log likelihood = -94.19 Wald chi2(4) = 55.68 P<0.001
The goodness of fit of the preliminary final model (Pearson’s Chi-Square test) was
determined, showing that counts predicted by the regression model do not significantly
differ from the observed data (Pearson chi2 (115) = 124.07, P= 0.27). Prediction indices
were calculated on the assumption that a predicted probability >0.5 indicated a case. The
model was found to have a sensitivity of 78.6%, specificity 65.8%, and a positive predictive
value (PPV) of 75.7%. An ROC curve was plotted (see Figure 43), and confidence intervals
were calculated using bootstrapping methods, with 10,000 replications performed. The area
under the ROC curve was 0.81 (95% CI 0.74 - 0.87), indicating excellent discrimination
(Hosmer and Lemeshow 2000).

222
Figure 43: Plot of sensitivity versus 1-specificity (ROC curve) Figure 44 is a diagram showing the factors found to be significantly associated with
intention to return.
Figure 44: Factors associated with intention to return in final logistic regression model
0.00
0.25
0.50
0.75
1.00
Sen
sitiv
ity
0.00 0.25 0.50 0.75 1.001 - Specificity
Area under ROC curve = 0.8075
Deferral period was too long
Grateful for deferral
Low Hb caused by inability to store iron
↑ Intention to return within 6
months of being eligible
+
-
-
+
Self-efficacy for returning
223
The model was built without a strong a priori theory, and therefore is heavily dependent on
this data set. While it indicates fruitful areas for future research, the model should be
interpreted with caution.
6.5 Summary of results In this section the aims of the study are restated, with a brief summary of the corresponding
findings from the survey.
Aim 1: …to measure assessments of the information and advice given during the
deferral event; to investigate donors’ understandings of the rationale for their
deferral; to quantify emotional reactions to deferral; and to quantify the types of
investigations undertaken by physicians…To identify the proportion told to change
their donation patterns when they sought further testing from their doctor, and the
proportion believing the frequency of blood donation contributed to their low Hb
concentration.
The majority of donors gave favourable ratings of the deferral experience, however a
substantial proportion indicated aspects of the event were less than optimal, the most
common being the nurse’s concern for them as a person, and the nurse’s ability to answer
any questions.
The largest proportion of respondents believed that their wellbeing was an important
consideration for their deferral, followed by regulations of the ARCBS, while the smallest
proportion believed the health of the recipient was an important consideration. Three in ten
respondents indicated they would have gone ahead with giving blood if given the choice.
Donors most commonly reported feeling disappointment at their deferral, followed by
feeling valued and grateful. One in four donors found their deferral to be a complete
surprise.
The majority of respondents had already sought further investigations and advice from their
general practitioner (GP) at the time of the survey, with four out of five having made an
appointment specifically to do so. One in five of those seeing their GP were referred to a
specialist physician. Nearly all donors seeking further investigations from their GP had
tests performed, most commonly blood tests (83%), faecal occult blood test (23.9%), a
colonoscopy (19.5%), or an endoscopy (15.7%). Eighteen respondents (11.3%) of the 159
having further tests were found to have an underlying condition.

224
Three quarters of those having further blood tests were found to be iron deficient, and
nearly two thirds had their low Hb levels confirmed. Less than half of those seeking further
investigations were given an explanation of the reason for their low Hb, and a substantial
proportion (46.5%) were advised to either take a break from donation, donate less often, or
to not return at all. Only a small proportion of respondents attributed their low Hb
concentration to the frequency of blood donation (10.6%).
Aim 2: to investigate whether intention to return once eligible was associated with
specific aspects of the deferral event, or the experiences during the deferral
period…whether being advised to delay return or diminish frequency was
associated with a reduced intention to return…whether the Theory of the Spurned
Philanthropist might contribute to understanding non-return following a temporary
deferral.
A stronger intention to return was associated with a higher level of self-efficacy and a belief
that the deferral period was too long, while a lower intention was associated with feeling
grateful in response to the deferral, and a belief that their low Hb level was caused by an
inability to store iron. Intentions were not predicted by whether or not the donor was
advised by their GP to change their donation patterns, nor with a belief that their low Hb
was a result of frequent blood donation.
There was limited evidence to support the Theory of the Spurned Philanthropist in the
context of deferred blood donors.
6.6 Discussion
This study, conducted on donors three months after deferral, offers further understanding of
what happens when people seek further investigations into their low Hb following deferral,
including quantifying events that were only measured in open-ended questions in the 12ML
study. For example, this survey found one in five donors were told their low haemoglobin
levels could be attributed to an underlying condition.
Over half of those seeing their GP required follow-up tests at a later time point. The
majority of these have blood tests or more invasive investigations, make changes to their
diet and/or lifestyle, and then return for follow-up tests. This suggests that the majority of
deferred donors make substantial efforts to follow up the low Hb issue to completion.
225
A finding unique to this study is that nearly half of those who saw their GP were given
advice about changing their donation patterns, that is, told to delay their return, reduce the
frequency of donation, or stop giving blood altogether. This is far higher than the
proportion seen in coded responses to the 12ML (see Results: Part Four), when the question
was not explicitly asked. Being given this advice, however, was not significantly associated
with intention to return, level of self-efficacy, or believing donation was difficult for them
to perform. Also contrary to expectation, believing that one’s low Hb concentration was
caused by frequency of giving blood did not diminish intention to return.
A possible explanation for this finding might be due to the wording of the questionnaire.
First, the question designed to elicit intention to return was worded as follows: “What is the
probability that you will donate again within 6 months of being eligible to do so?” Donors
may have interpreted “returning once eligible” as when they were deemed to be eligible
based on their doctor’s assessment, rather than the mandatory time period set by the
ARCBS. Yet their intention to give blood soon after this time, whenever it happened to be,
was as high as those who were not told to change their patterns.
Given the factors of particular interest in this phase of the study were not found to be
associated with intention to return, analysis was completed to determine the impact of other
factors measured in the questionnaire. No factors relating to an individual’s demographic
characteristics or donation history predicted intention, including new donor status. It should
be noted that the recent donation frequency variable used in this analysis was based on self-
assessments, while the variable in other phases of the project was based on NBMS data.
Furthermore, there was a very small number of new donors participating in the survey.
The four factors found to predict stronger intentions related to believing the deferral period
was too long, feeling “grateful” in response to deferral, a belief about the cause of their low
Hb status, and a higher level of self-efficacy. As far as the author is aware, there is no
precedent for any but the latter finding (see Giles, McClenahan et al. 2004). Some expected
relationships with intention to return were not seen, such as role identity (for example
Piliavin and Callero 1991; Masser, White et al. 2009).
The first factor, the feeling that the deferral period was too long for their situation, can be
interpreted as relating to individuals who feel confident about their ability to improve their
haemoglobin levels in a short amount of time. They may also be a group with the strongest

226
desire to perform the activity, perhaps associating donation with a number of personal
rewards, and who wish to return to the activity as soon as possible.
The second factor, the feeling of gratitude in response to deferral, is not as readily
explained, particularly as it reduces intention to return. It is possible this item picked up
those who felt relieved at not having to actually give blood on the day, perhaps attending
under social or personal pressure. Consequently, these donors may have felt let “off the
hook” during their deferral and less inclined to return once eligible.
The third factor, a belief that their low Hb was caused by an inability to store iron, is likely
to reflect an expectation that improving their Hb concentration is beyond their control, as
common treatment options (such as iron supplements and an increased consumption of
iron-rich foods) will be largely ineffective. These donors may feel uncertain about their
ability to meet the acceptance criteria at a future attempt.
Finally, the finding that higher levels of self-efficacy predicted stronger intentions has been
previously shown in the literature (Giles, McClenahan et al. 2004; France, France et al.
2007; Masser, White et al. 2009). Univariable analysis found self-efficacy was associated
with a wide range of factors that were not associated with intention in the final model,
including a longer donation history and higher recent frequency, the giving of favourable
ratings of the explanation and feeling appreciated as a result of deferral, having a normal
Hb at further testing, and believing that giving blood was easy to do. This may indicate that
individuals with the most evidence that they are competent blood donors, who do not find
the deferral event to be particularly unpleasant, and who are more certain that they will
meet eligibility criteria at their next attempt, have the most confidence that they will be able
to give blood again in the near future.
Another unexpected finding was that those found to have a medical condition underlying
their low Hb had higher levels of self-efficacy about returning. This may be because those
with confirmed conditions had a treatment plan and were confident that whenever they
were eligible to return they would be able to do so, while those who had no underlying
condition detected may feel less certain about their next attempt being accepted.
Piliavin and Callero used attribution theory to explain reduced likelihood of return amongst
temporarily deferred donors (Piliavin and Callero 1991), suggesting that after deferral
donors see themselves as people who find it difficult to give, or “bad bets”, and that the
longer a donor puts off return, the more entrenched the belief becomes. This study found

227
that over a quarter of respondents felt donation was difficult for them to do, or something
they should not do, and that this was associated with a reduced self-efficacy of giving blood
once eligible, which in turn reduced the intention to return. It is not clear from these data
whether donors take this view as a result of deferral. However, it is highly likely that
deferral for low Hb reduces the perceived ease of donation, as indicated by the finding that
a previous deferral for low Hb was associated with viewing donation as more difficult to
do.
This section of the project could not assess actual return, however analysis of the likelihood
of return in 12ML (see Results: Part Four) found that relatively few donors returned during
a pre-defined period if they rated their likelihood of return as below the highest rating (i.e.
“somewhat likely”, “undecided”, “somewhat unlikely” or “very unlikely”, rather than “very
likely”). Approximately 40% of donors in the current study gave a response below the
highest rating: this was remarkably similar to the proportion stating lower intentions in the
12ML, even though the time period differed between the two studies, with the 3ML study
asking about respondents’ certainty of return within six months of being eligible, and the
12ML asking about the likelihood of return in the next six months. This finding suggests
that not only do most donors hold favourable intentions to return at some stage in the
future, over half have the strongest intentions to do so.
Qualitative interviews in the previous stage of the project indicated some donors resented
the lack of choice about whether or not they could donate on the day. Responses to the
survey three months after deferral confirmed this finding, with three in ten donors saying
they would have gone ahead with their donation on the day if given a choice. This may
indicate a prevalent belief that the donor would not personally suffer as a result of giving
blood with a low Hb concentration, especially since the cut-off used by the ARCBS is
placed within the lower end of the normal population range. Alternatively, the benefits of
giving blood, both for the individual and the community blood supply, may be seen to
outweigh any risk to the donor.
Over a third of respondents said that that they had been previously deferred for low Hb
concentration, a response which is consistent with other findings reported in this thesis.
However, unique to this phase of the research, over half of the respondents were found to
have a history of low Hb or iron levels. This suggests that many donors deferred for low Hb
would already have some knowledge of their status and may already have experience
making dietary and lifestyle changes to increase their iron intake.
228
6.6.1 Theory of the Spurned Philanthropist
A detailed description of the Theory of the Spurned Philanthropist, developed by Rosen and
colleagues (Rosen, Mickler et al. 1986), was provided in the literature review (see Chapter
Two). A brief summary is given here. The theory proposes that individuals who encounter
an unexpected spurning of an offer to help another undergo a number of cognitive,
affective, and behavioural outcomes as a result of the rejection. Rejected helpers are
thought to experience tension resulting from a “negative expectancy violation” (i.e. an
unpleasant surprise), which, amongst a range of other outcomes, leads to a greater negative
emotional response, reduced positive emotions, decreased desire for association with
recipient, and poorer assessments of the recipient.
This study tested several aspects of the theory, namely the extent to which the deferral was
a surprise, how this influenced the type of emotional response, and/or whether this
impacted on intention to return. In the context of blood donation, the “recipient” was
considered to be the ARCBS, as the donor only had contact with the organisation as
opposed to the actual transfusion recipient, and was responsible for the refusal. Therefore
any reduced desire for association may be seen as a reduced intention to return once
eligible.
This study provided limited evidence to support the application of the theory to the context
of low Hb deferral from blood donation. While many donors were surprised by their
deferral, particularly those who had never had anaemia and/or low iron, had not been
deferred for low Hb previously, and, contrary to expectations, had a shorter donation
history, the degree to which the deferral was a surprise was not associated with the
outcomes predicted by the theory. Surprise was not associated with bad feelings (the degree
of irritation), though highly surprised donors were more disappointed, worried, and
grateful, and the latter emotional response was significantly associated with diminished
intention in the final model. The level of surprise had no independent effect on intention to
return.
Given evidence for all aspects of the model has been reported in other contexts (Cheuk and
Rosen 1993; Cheuk and Rosen 1996), it appears alternative explanations may provide a
better fit in explaining the high likelihood of non-return amongst deferred donors. It may be
that deferral for low Hb is not necessarily perceived as a rejection of an offer of help, given
most donors recognise that concern for their own health is an important rationale of the

229
deferral. Alternatively, the personal benefits of giving blood, such as feelings of
satisfaction, positive personal attributes, and tangible rewards, may be stronger influences
on intentions than any diminished desire to associate with the organisation.
6.6.2 Limitations
The first limitation of this study was the relatively low response rate, and in particular, the
under-representation of several groups, such as new donors and younger men. It is possible
that recent donation frequency (incorporating new donor status) was not found to be a
significant predictor of intention to return in the final model because of the small group
size.
Next, the survey relied on self-reported accounts of all variables. Results presented in the
next chapter shows the analysis between self-reported vs. NBMS data for the same variable,
suggesting that self-reported accounts of some factors, such as the number of donations
made in the previous year, may not be accurate.
Finally, the finding that the role identity scale did not have satisfactory internal consistency
was unexpected, as the scale is commonly used in blood donor research, and a shorter
version was found to be valid in a recent Australian study (Masser, White et al. 2009).
Other findings were inconsistent with the underlying theory, in particular that there was no
difference between the identity scores of new and repeat donors (although this may have
been due to the small number of cases in the first category). One possibility is that there
were issues with the sample; however another explanation is that the concept of the donor
identity is more relevant for donors with uninterrupted patterns, who are able to return at
will, and may not be an appropriate construct once individuals are ineligible to give blood.
This point will be further discussed in the Final Discussion chapter.
6.7 Conclusion In general, those with the strongest intentions to return are confident that they have the
capacity to improve their Hb concentration, a firm belief in their ability to give blood in the
future, and a desire to return sooner rather than later.
Medical advice to restrict donation patterns, and a belief that frequency of donation
contributed to a low Hb level, appear unlikely to contribute to intentional non-return. The
Theory of the Spurned Philanthropist does not appear to be useful in explaining reduced
intentions to donate after deferral.
230
7 Results: Part Four What are the factors that influence prompt return from deferral? The Twelve Months Later study
7.1 Chapter outline
This chapter describes the results of a cross-sectional survey investigating deferred donors’
recollections of deferral and their experience of seeking investigations twelve months after
the deferral event. The survey responses were linked to donation records in order to
investigate the factors associated with return after the temporary deferral.
7.2 Aim
This study had seven aims. The first three aims were exploratory, as this section of the
project was completed first, and were accomplished using a survey. The first aim was to
explore donors’ recollections of the deferral event, including understandings of the reason
for deferral, emotional reactions to deferral, and perceptions of the information and advice
given. The second aim was to explore interactions with health professionals following
deferral. The third aim was to investigate intentions to return to give blood during the next
six months, at a stage when respondents were no longer deferred and, subject to meeting
acceptance criteria, could return whenever they wished.
The fourth aim, which was unique to this phase of the project, was to link the survey
responses with National Blood Management System (NBMS) data on return patterns, in
order to investigate whether prompt return after deferral was predicted by factors relating to
the deferral event, the experiences of seeking further investigations, demographic
characteristics, and donation history.
The fifth aim was to measure the factors predicting a stronger intention to return in the six
months following the survey.
The sixth aim was to determine the factors predicting return in the six months following the
survey, including the intention to give blood during this period.
Finally, the study offered an opportunity to validate the National Blood Management
System (NBMS) data, in particular, records on donation history.
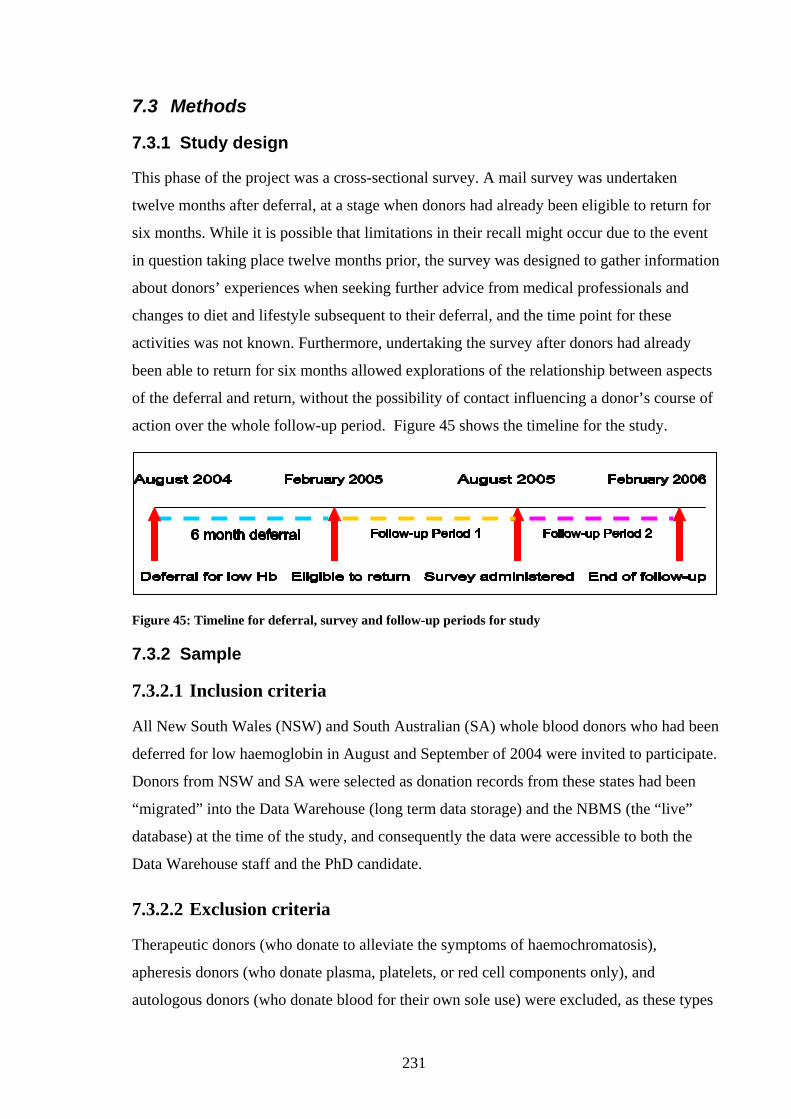
231
7.3 Methods
7.3.1 Study design
This phase of the project was a cross-sectional survey. A mail survey was undertaken
twelve months after deferral, at a stage when donors had already been eligible to return for
six months. While it is possible that limitations in their recall might occur due to the event
in question taking place twelve months prior, the survey was designed to gather information
about donors’ experiences when seeking further advice from medical professionals and
changes to diet and lifestyle subsequent to their deferral, and the time point for these
activities was not known. Furthermore, undertaking the survey after donors had already
been able to return for six months allowed explorations of the relationship between aspects
of the deferral and return, without the possibility of contact influencing a donor’s course of
action over the whole follow-up period. Figure 45 shows the timeline for the study.
Figure 45: Timeline for deferral, survey and follow-up periods for study
7.3.2 Sample
7.3.2.1 Inclusion criteria
All New South Wales (NSW) and South Australian (SA) whole blood donors who had been
deferred for low haemoglobin in August and September of 2004 were invited to participate.
Donors from NSW and SA were selected as donation records from these states had been
“migrated” into the Data Warehouse (long term data storage) and the NBMS (the “live”
database) at the time of the study, and consequently the data were accessible to both the
Data Warehouse staff and the PhD candidate.
7.3.2.2 Exclusion criteria
Therapeutic donors (who donate to alleviate the symptoms of haemochromatosis),
apheresis donors (who donate plasma, platelets, or red cell components only), and
autologous donors (who donate blood for their own sole use) were excluded, as these types
232
of donation have different acceptance criteria, donation frequency, and, in the case of
therapeutic and autologous donors, a different motivation for donation.
Donors who were “off service” at the time of the survey, meaning they had requested not to
be contacted by the ARCBS for a period of time, were also excluded.
7.3.3 Identification of sample
A dataset of this nature had not been extracted by the ARCBS staff, and so the most
efficient way of obtaining the full details of deferred donors was not yet known. To begin, a
dataset was extracted from the Data Warehouse containing the details of all donors initially
recording an Hb concentration below 118 g/L for women and 128 g/L for men (the Hb
minimum acceptance criteria at the time) in August and September 2004 (n=2162). I
checked each individual record in the NBMS to exclude those making a donation other than
whole blood at the time of their deferral (n=211) or listed as “off-service” (n=63). The
individual checking process revealed that an initial low haemoglobin value did not
necessarily result in a deferral for three groups of donors: 1) those who had a low Hb
concentration recorded but were deferred for another reason during the course of the pre-
donation interview (n=20); 2) those who had a second haemoglobin measurement taken
during their interview which was within the acceptable range (n=660); and 3) those who
had a ferritin result in the normal range and a Hb value in the “buffer zone”, which was
defined as a Hb level between the previous acceptance threshold levels and the new higher
levels (n=80). A further 63 donors could not be confirmed as deferred, leaving a total of
1065 donors confirmed as having been deferred due to low Hb from the original 2162
donors in the data extract.
The manual checking process identified eight unique deferral codes that had been applied in
a variety of combinations to the confirmed group, depending on the outcome of a second
finger-prick test, venous sample, or subsequent ferritin tests. These deferral codes were
used in subsequent phases of the project as a more accurate and efficient way of identifying
low Hb donors.
Some variables required for analysis were not provided in the dataset, so data on the results
of the ferritin test from the venous sample, and mail and telephone contact details were
manually obtained from the NBMS.

233
7.3.3.1 Sample Size Calculations
Sample size calculations for estimation of a proportion for a given precision were based on
the formula:
Sample size = p (1 - p) Z2 / E2
where p=the population estimate, Z=the standard normal deviate associated with the desired
two sided confidence interval, and E= the maximum acceptable deviation from the true
proportion (Machin and Campbell 1987).
Using the nQuery 6.0 software (Statistical Solutions 2005) the required sample size was
calculated as 600, based on speculation that approximately 50% of donors would return
within six months of being eligible, with estimates made with 95% confidence, and
tolerance of within 4% of the “true” proportion. After adjusting for the finite population
correction factor (with n=1065 confirmed low Hb donors from the August and September
of 2004) the required sample size was calculated to be 415. As this was the first piece of
work for the project, the survey response rate could not be anticipated, and it was decided
to err on the side of caution and invite all donors deferred for low Hb in August and
September of 2004 to participate.
7.3.4 Development of the questionnaire
The questionnaire was developed in line with the original aims of the study, which were to
obtain information about:
• The donor’s perception of advice provided by the ARCBS during the deferral event
• Intention to donate after the deferral period was over
• Whether their local GP was consulted
• Whether an underlying condition was detected during further testing
• The advice given by their doctor in relation to improving their Hb level
• Compliance with advice or treatment plan
• Previous experience with the blood service (if a repeat blood donor).
Little was known about the actions taken by donors after deferral from donation. Figure 46
shows potential pathways from deferral, and the questionnaire was designed, in part, to
explore the proportions of donors following particular paths.

234
Figure 46: Summary of pathways following deferral
An initial version of the questionnaire was piloted with a convenience sample of donors
who had been deferred for low Hb at any time in the past (n=5). Feedback from the initial
pilot study resulted in changes to the questionnaire, which was then piloted with a second
group, comprised of a random selection of donors deferred in June of 2004. This pilot
Donor found to have low Hb DEFERRED for 6 months and advised to seek further tests from GP
Donor visits GP Donor does NOT visit GP
Found to be
IRON DEFICIENT
Found to have
NORMAL iron stores
Not sure what donors do. Do they seek information from other sources? Do they take iron supplements?
Donor does NOT RETURN
(% PLANNED?)
Donor experiences a
range of feelings about
deferral Eg confused; distressed;
grateful; disappointed;
concerned
How many return early? How many choose not to return? Why do they choose not to return?
Seeks alternate
advice
Donor waits 6 M +
Donor able to
RETURN early
Donor RETURNS

235
group completed the questionnaire twelve months after their deferral, which was the same
time lag that would occur with the actual survey participants. A total of 20 donors were
contacted by telephone, with all consenting to participate and all returning a completed
survey. These responses were used to make minor improvements (such as clarity of the
wording) to the questionnaire.
The questionnaire was made up of four sections: a) the experience of being deferred, b)
experiences following deferral, including seeking further investigations, c) experience as a
donor prior to deferral, and d) intention to return to donate. The questionnaire is shown in
Appendix 7.
7.3.4.1 Section A: Deferral in hindsight
This part of the questionnaire contained ten items designed to explore the deferral
experience from the donor’s perspective. It contained closed questions about whether or not
particular events occurred, such as having a venous sample taken, being given information
brochures, and receiving a letter explaining the deferral. Other questions asked whether or
not the nurse provided reasons why their haemoglobin was low or information about how to
increase iron levels in the diet, and whether the donor was happy with the explanation,
advice, and care given during the deferral procedure. Each of these questions was
accompanied by an open-ended question to allow the donor to provide detail. Three open-
ended questions were used to ascertain how deferral made the donor feel, their
understanding of the rationale for the decision, and the length of time they believed they
were unable to donate.
7.3.4.2 Section B: What happened after deferral?
Respondents were asked to report whether they had made any changes to their diet or
lifestyle, and to nominate people with whom they had discussed their deferral (such as
family members, friends, or their GP). If the donor nominated that they discussed their low
Hb with their GP, they were directed to a section asking further details about the
investigations. Those who had seen their GP were asked to report how long after their
deferral they attended the consultation, whether any tests were performed, whether the low
Hb level was confirmed, to report any advice they were given about the reason for their low
Hb, whether they saw a specialist, and whether any further action was required.
236
7.3.4.3 Section C: Previous experience as a donor
This section contained questions exploring use of iron supplementation prior to deferral, the
length of time the individual had been giving blood, donation frequency, satisfaction with
various aspects of blood donation, and whether or not they had previously been deferred.
7.3.4.4 Section D: Intention to return
Respondents rated their intention to return to donate within the next six months (on a five
point scale ranging from very unlikely to very likely, with undecided as the midpoint), and
whether they had received from the ARCBS any communication inviting them to return to
donate blood since the deferral period had ended.
7.3.4.5 Administration of the survey
Donors were contacted by mail with a package containing an information letter (see
Appendix 8), the study questionnaire, and a reply paid envelope in August and September
of 2005. Questionnaires were packaged in envelopes that identified the ARCBS, but did not
resemble those used by the ARCBS for standard reminder letters, as anecdotal evidence
suggested that donors do not necessarily open regular reminders to give blood.
Questionnaires were marked with a unique identifying number that was recorded in the
dataset, to allow linkage to donor records, and donors were advised that their responses
were not anonymous. Donors who had not returned the questionnaire within two weeks
were contacted by telephone by the PhD candidate, and those who had either not received
or misplaced their questionnaire were forwarded a replacement. Three attempts at follow-
up contact were made.
A total of 1065 surveys were sent, and 709 (66.6%) completed surveys were returned. An
additional seventeen surveys were returned blank (though two respondents filled in
comments on the final page), and these were counted as non-returns. Fifteen envelopes
were returned due to an incorrect mailing address, a further forty donors were not able to be
contacted for follow-up on the telephone number listed in the live donor database, and nine
people were overseas at the time of the survey. Two people were too ill to complete the
survey, one person was deceased, and a final two donors did not speak English. Taking into
account those unable to be contacted or complete the survey, a response rate of 71.5% was
achieved.

237
Returned surveys were entered into a custom designed database developed by the PhD
candidate. The accuracy of data entry for a random sample of n=35 questionnaires was
assessed by myself and a supervisor (KD), with no errors in pre-coded response items, and
few typing errors in text fields. These errors were judged to be within acceptable levels.
Donation records of the donors who returned the survey were drawn from the Data
Warehouse from a period covering August 2003 to March 2005, allowing analysis of
donation rates for the twelve months following eligibility to return and the twelve months
prior to deferral.
7.3.5 Analytical Approach
Stata software (Version 9) was used to merge the survey data with datasets containing
donor demographics and donation records, based on the unique donor identification
number. The dates 365 days prior to deferral, 181 days after deferral (the date deferral is
automatically removed), and 365 days following eligibility to return were calculated for
each donor, and donation records outside these dates were removed. The approximate dates
of contact with the survey were determined for each participant to allow calculation of the
two follow-up periods.
Descriptive and inferential statistics (such as Chi-square analysis and Mann-Whitney tests)
were used to describe the study population according to the following attributes:
demographic characteristics, donation history, satisfaction with aspects of the deferral, and
experiences seeking medical investigations.
Content analysis was used to identify and classify sets of responses to open-ended
questions, and coding was performed by the PhD candidate on three separate occasions.
Creation of categories and preliminary coding was undertaken on the first occasion. The
text of the free responses was divided into content areas and 'meaning units' (collections of
words or statements that related to the same central meaning). On a second occasion,
meaning units were condensed and coded. Categories were reviewed on a third occasion to
increase accuracy and objectivity. Selected quotations from the open-ended responses are
presented in the results section to illustrate relevant concepts.
Chi-square analysis was used to determine associations between demographic
characteristics, aspects of the deferral experience, subsequent treatment seeking, and
whether or not a donor returned. The Donation Cycle framework was utilised for this phase,
which considers attendance to donate, rather than a successful donation, as the outcome of
238
interest (James and Matthews 1993). Logistic regression was use to develop models
explaining the relationship between outcomes that were binary in nature, such as whether or
not a donor returned prior to the survey, with predictor variables measured in the survey.
Further detail of the analysis is provided later in the chapter.
This study provided an opportunity to validate some NBMS data, particularly aspects of
donation history (including new donor status and how frequently they had given blood in
the year prior to deferral). The kappa coefficient was used to quantify agreement between
survey responses and NBMS records. In all the analysis presented in this chapter, donors
were classified as “new donors” if they self-reported to be in this category, even if they
were not identified as such in NBMS. Self-reported values were also used for donation
history variables (such as length of time as a blood donor, and the number of donations
given). However, NBMS records of donations made in the year prior to deferral were used
to analyse recent donation frequency, rather than self-reported frequency, due to concerns
about the accuracy of recall in a finite time period.
Numbers of missing responses tended to be small for any given question (typically <5%),
and proportions within categories are reported excluding missing values, unless stated
otherwise.
Many of the tests performed in this analysis were not pre-specified and are exploratory in
nature. Inflation of Type 1 errors are expected due to the multiple comparison problem (van
Belle, Fisher et al. 2004). All results presented in this chapter are unadjusted P values, and
should be interpreted accordingly.
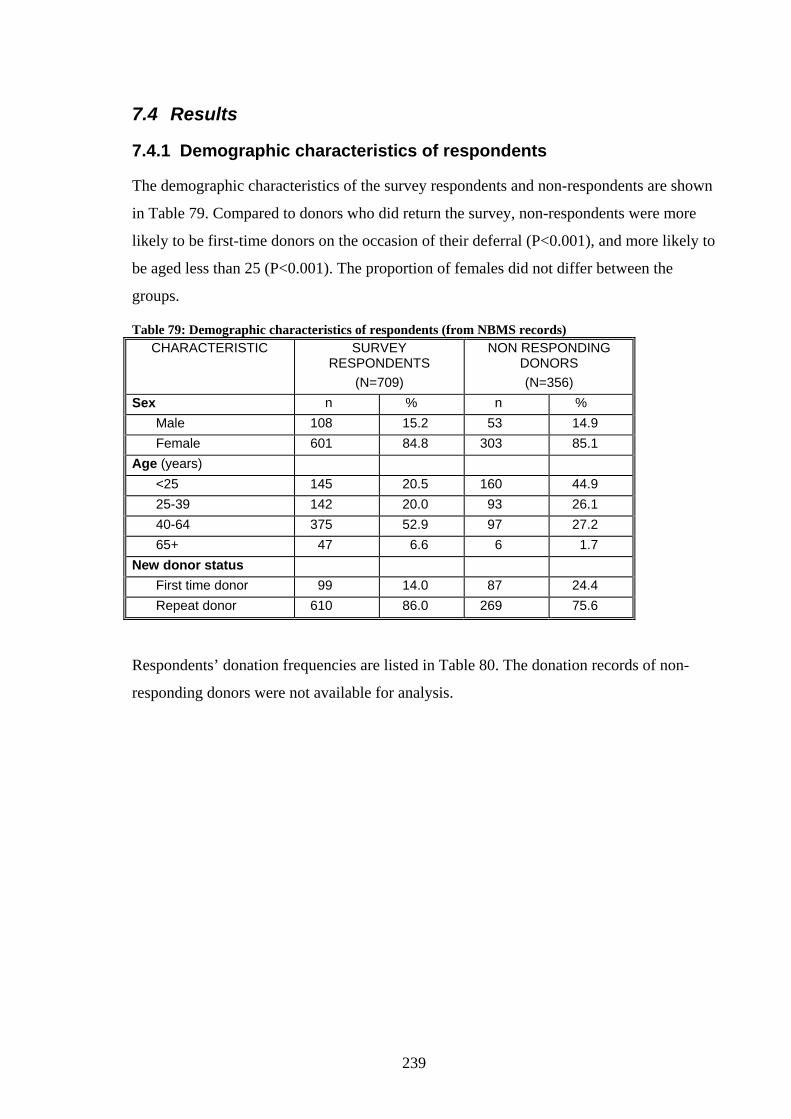
239
7.4 Results
7.4.1 Demographic characteristics of respondents
The demographic characteristics of the survey respondents and non-respondents are shown
in Table 79. Compared to donors who did return the survey, non-respondents were more
likely to be first-time donors on the occasion of their deferral (P<0.001), and more likely to
be aged less than 25 (P<0.001). The proportion of females did not differ between the
groups.
Table 79: Demographic characteristics of respondents (from NBMS records) CHARACTERISTIC SURVEY
RESPONDENTS (N=709)
NON RESPONDING DONORS (N=356)
Sex n % n % Male 108 15.2 53 14.9 Female 601 84.8 303 85.1
Age (years) <25 145 20.5 160 44.9 25-39 142 20.0 93 26.1 40-64 375 52.9 97 27.2 65+ 47 6.6 6 1.7
New donor status First time donor 99 14.0 87 24.4 Repeat donor 610 86.0 269 75.6
Respondents’ donation frequencies are listed in Table 80. The donation records of non-
responding donors were not available for analysis.

240
Table 80: Donation Characteristics of repeat donors (self-reported) CHARACTERISTIC SURVEY RESPONDENTS
Number of donations prior to deferral ^ (n=632) n %
First time donor at deferral 63 9.1 1-2 117 16.8 3-10 213 30.7 11-20 100 14.4 21-49 107 15.4 50+ 72 10.4 Not sure 23 3.3
Years of donation* ^ (n=628) Less than one year 51 8.1 1-3 years 172 27.4 3-10 years 173 27.6 More than 10 years 211 33.6 Not sure 21 3.3
Previous deferrals* ^ Deferred due to low Hb (n=620) 184 29.7 Deferred for other reasons (n=622) 91 14.7 Recent donation history* ^+
0 donations prior 72 11.2 1 donation prior 136 21.1 2 donations prior 145 22.5 3 donations prior 159 24.6 4 donations prior 124 19.2 5+ donations prior 10 1.6
^indicates there were some missing values for that question
* repeat donors only
+ NBMS records
Analysis was performed on the factors associated with having reported ever been deferred
for low Hb (prior to the attempt twelve months before the survey). Among repeat donors,
having been previously deferred for low Hb was associated with age, with the greatest
likelihood of a previous deferral amongst those aged 45-54 (45.5% of this group had been
previously deferred for low Hb, P<0.001). Previous deferral for low Hb was also associated
with having made a greater number of donations (P<0.001), as well as a longer donation
history, with nearly half of those who had given blood for over ten years (43.6%) having
been deferred for that reason, while less than 30% of those who had given for a shorter
duration had been deferred (P<0.001). Sex was not associated with likelihood of previous
low Hb deferral (P=0.48).

241
Respondents with the highest recent donation frequency were significantly more likely to
be male (P<0.001) and in an older age group (P<0.001). Those with a longer donation
history were also more likely to be older (P<0.001) and male (P<0.001).
7.4.2 Deferral in hindsight
7.4.2.1 Information and advice
Donors were asked questions about the deferral event, such as whether they recalled
receiving further testing, whether they had been given information brochures, and whether
they were satisfied with their explanation and care.
Respondents were asked whether they provided a venous blood sample for testing after
their capillary haemoglobin level was determined to be low, indicating serum ferritin
testing had been performed by the ARCBS. Of the 709 survey respondents, 2.8% (n=20)
did not provide an answer. Of those who did answer, approximately 4 in 5 provided a
sample. There was no association between whether a donor had been previously deferred
for low Hb and whether or not they elected to have a sample taken (P= 0.22).
Next, respondents were asked whether their interview nurse discussed any reasons why
their Hb level might have been low. Twenty nine respondents did not answer the question
(4.1% of respondents). Of the remaining respondents, just over three quarters reported
having reasons explained (76.9%) while around a quarter did not (23.1%). An open-ended
response question asked for the reasons that were given. These responses were coded and
are displayed in diminishing order of frequency in Table 81.
Table 81: Reasons for low Hb suggested by interview nurses, among those given this information at deferral
REASON SUB-CATEGORIES N=523
n %† Diet Inadequate diet; vegetarianism 360 68.8 Low iron Iron deficiency; anaemia 95 18.2 Menstrual cycle heavy periods 91 17.4 Lifestyle/stress Exercise; stress; general health 79 15.1
Underlying conditions Recent illness; blood loss; Thalassaemia; genetics 45 8.6
Other reasons Change in ARCBS guidelines; donation history; low “blood count”
43 8.2
Should see a doctor Advised to get further tests 25 4.8
Donation frequency Time between donations; too soon 23 4.4
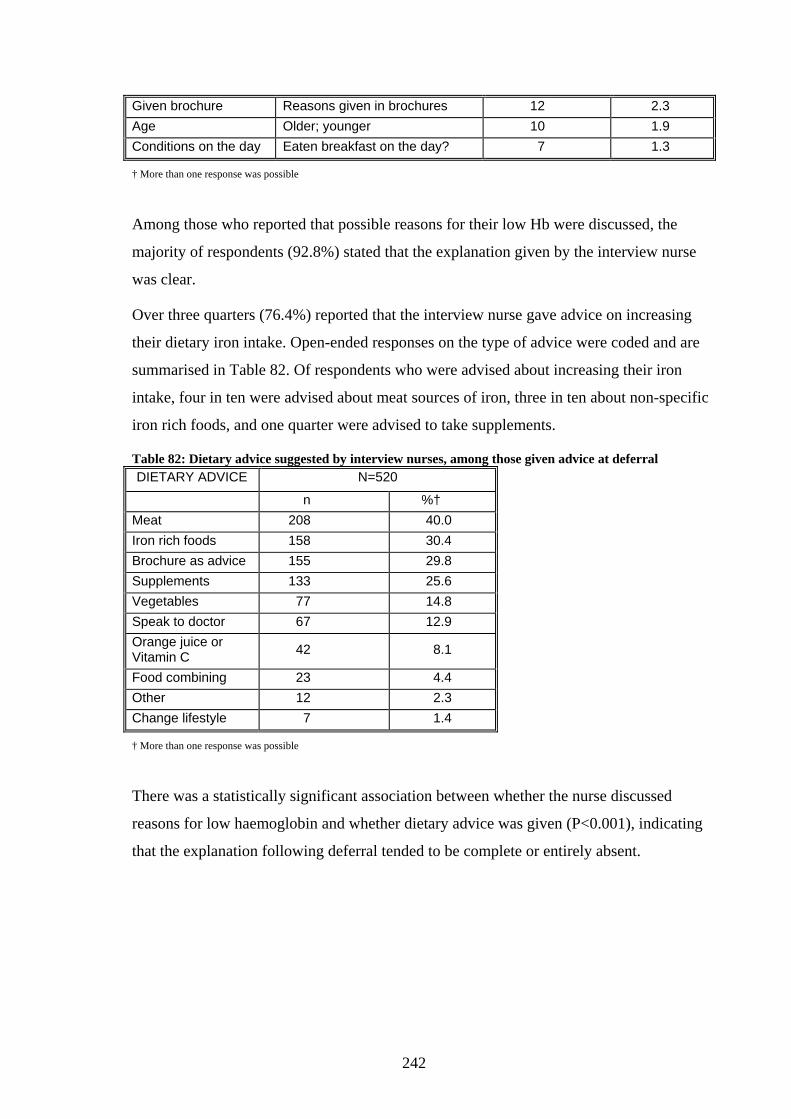
242
† More than one response was possible
Among those who reported that possible reasons for their low Hb were discussed, the
majority of respondents (92.8%) stated that the explanation given by the interview nurse
was clear.
Over three quarters (76.4%) reported that the interview nurse gave advice on increasing
their dietary iron intake. Open-ended responses on the type of advice were coded and are
summarised in Table 82. Of respondents who were advised about increasing their iron
intake, four in ten were advised about meat sources of iron, three in ten about non-specific
iron rich foods, and one quarter were advised to take supplements.
Table 82: Dietary advice suggested by interview nurses, among those given advice at deferral DIETARY ADVICE N=520
n %† Meat 208 40.0 Iron rich foods 158 30.4 Brochure as advice 155 29.8 Supplements 133 25.6 Vegetables 77 14.8 Speak to doctor 67 12.9 Orange juice or Vitamin C 42 8.1
Food combining 23 4.4 Other 12 2.3 Change lifestyle 7 1.4
† More than one response was possible
There was a statistically significant association between whether the nurse discussed
reasons for low haemoglobin and whether dietary advice was given (P<0.001), indicating
that the explanation following deferral tended to be complete or entirely absent.
Given brochure Reasons given in brochures 12 2.3 Age Older; younger 10 1.9 Conditions on the day Eaten breakfast on the day? 7 1.3
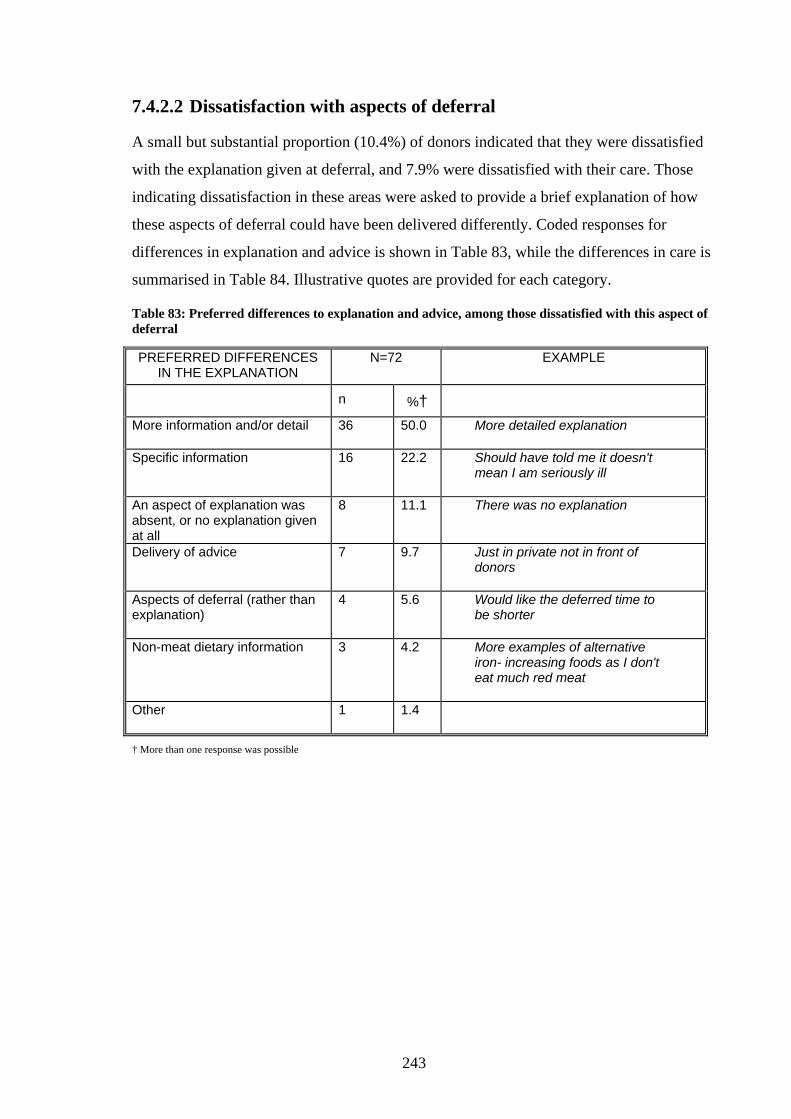
243
7.4.2.2 Dissatisfaction with aspects of deferral
A small but substantial proportion (10.4%) of donors indicated that they were dissatisfied
with the explanation given at deferral, and 7.9% were dissatisfied with their care. Those
indicating dissatisfaction in these areas were asked to provide a brief explanation of how
these aspects of deferral could have been delivered differently. Coded responses for
differences in explanation and advice is shown in Table 83, while the differences in care is
summarised in Table 84. Illustrative quotes are provided for each category.
Table 83: Preferred differences to explanation and advice, among those dissatisfied with this aspect of deferral
† More than one response was possible
PREFERRED DIFFERENCES IN THE EXPLANATION
N=72 EXAMPLE
n %†
More information and/or detail 36 50.0 More detailed explanation
Specific information 16 22.2 Should have told me it doesn't mean I am seriously ill
An aspect of explanation was absent, or no explanation given at all
8 11.1 There was no explanation
Delivery of advice 7 9.7 Just in private not in front of donors
Aspects of deferral (rather than explanation)
4 5.6 Would like the deferred time to be shorter
Non-meat dietary information 3 4.2 More examples of alternative iron- increasing foods as I don't eat much red meat
Other 1 1.4

244
Table 84: Preferred differences to care, among those dissatisfied with this aspect of deferral
† More than one response was possible
Those who did not receive any one component of the explanation (i.e. no explanation of the
reasons for low Hb) were significantly less likely to be satisfied with the overall
explanation and advice. A total of 21.8% of those not given an explanation of the reason for
low Hb were dissatisfied with the overall explanation and advice, compared to 7.5% of
those who were given this explanation (P<0.001), while 24.0% of those not advised about
increasing dietary iron intake were dissatisfied with the overall explanation and advice,
compared to 6.5% of those who were given this explanation (P<0.001).
Table 85 summarises the results of questions about whether the donor was given
information brochures at their deferral. Most respondents recalled receiving brochures at
their appointment, and of those who did, the majority reported that they had read them in
their entirety, with a smaller proportion having read some of the content, and two donors
reporting they had not read any of the content.
PREFERRED DIFFERENCES IN THE CARE
N=61 EXAMPLE
n %†
Aspects of process 32 52.5 It took an extremely long time only to be told I couldn't donate
Explanation and advice 19 31.1 Not so abrupt- more fully explained
Overreaction, just below level 4 6.6 …a slight overreaction as I felt fantastic & there were obvious reasons
No choice about donation /process
3 4.9 …not given a choice whether I wanted to still proceed
Negative emotional response 2 3.3 I was very emotional about not being able to donate
Regret 1 1.6 I was very sorry they would not take my blood
Not sure about return 1 1.6 When would I be able to give blood?

245
Table 85: Proportion given and reading brochures N=697
n % Brochures given 470 69.2 Brochures NOT given 209 30.8
If brochures given: N=470 Read all of content 346 73.6 Some of content 112 23.8 Not at all 2 0.4
7.4.2.3 Emotional responses to deferral
Respondents were asked to describe how they felt when they were told they would be
temporarily deferred from donating blood in an open-ended response question. These
answers were coded and then divided into one category for neutral (eg “ok”, “fine”) and
positive feelings (eg “grateful”), and one category for negative feelings. Categories are
shown in Table 86, with illustrative quotes provided for each category.
Respondents could give more than one answer, and many respondents nominated both
positive/neutral feelings and negative feelings, indicating the response to deferral is often
mixed. Just under half of respondents (46.8%) reported positive/neutral responses to their
deferral, including a group grateful that their low haemoglobin had been bought to their
attention so they might take steps to rectify the situation (3.7%), and another group who
described their deferral as a wake up call improve their health (3.1%). However, more than
three quarters of respondents (77.2%) described negative responses to their deferral, with
disappointment, unhappiness, concern, and frustration the most common responses. Smaller
proportions experienced feelings of guilt, confusion, rejection, and uselessness.
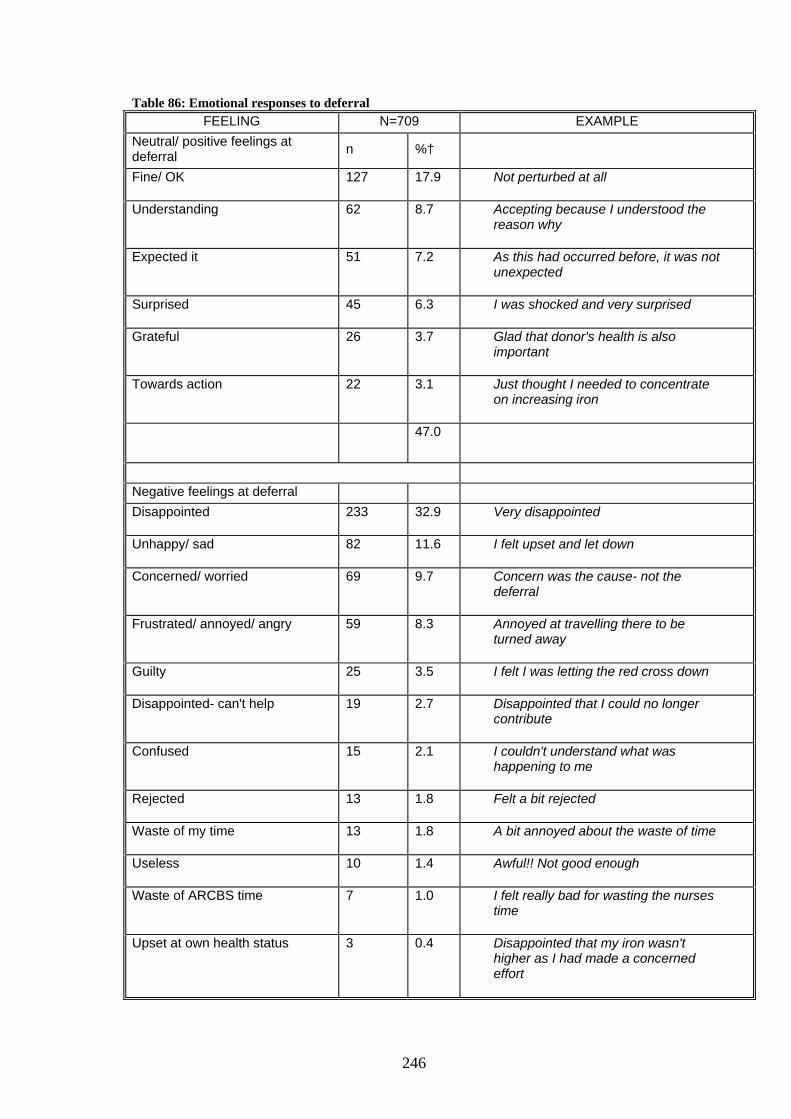
246
Table 86: Emotional responses to deferral FEELING N=709 EXAMPLE
Neutral/ positive feelings at deferral n %†
Fine/ OK 127 17.9 Not perturbed at all
Understanding 62 8.7 Accepting because I understood the reason why
Expected it 51 7.2 As this had occurred before, it was not unexpected
Surprised 45 6.3 I was shocked and very surprised
Grateful 26 3.7 Glad that donor's health is also important
Towards action 22 3.1 Just thought I needed to concentrate on increasing iron
47.0
Negative feelings at deferral Disappointed 233 32.9 Very disappointed
Unhappy/ sad 82 11.6 I felt upset and let down
Concerned/ worried 69 9.7 Concern was the cause- not the deferral
Frustrated/ annoyed/ angry 59 8.3 Annoyed at travelling there to be turned away
Guilty 25 3.5 I felt I was letting the red cross down
Disappointed- can't help 19 2.7 Disappointed that I could no longer contribute
Confused 15 2.1 I couldn't understand what was happening to me
Rejected 13 1.8 Felt a bit rejected
Waste of my time 13 1.8 A bit annoyed about the waste of time
Useless 10 1.4 Awful!! Not good enough
Waste of ARCBS time 7 1.0 I felt really bad for wasting the nurses time
Upset at own health status 3 0.4 Disappointed that my iron wasn't higher as I had made a concerned effort

247
"not again" 1 0.1 (Sigh) not again
77.4 Not classified
Other 48 6.8 Strange
Health 9 1.3 Explained my tiredness
8.0
† More than one response was possible

248
7.4.2.4 Understanding of the reason for deferral
Respondents were asked to explain, in their own words, their understanding of the reason
for their deferral. These responses were coded and are presented in Table 87. Donors gave a
wide range of reasons for their deferral. Nearly one in five understood that their levels did
not meet the threshold set by the blood service, and several of these donors noted that their
Hb level was not low relative to population norms. A quarter understood their deferral to be
about protecting their own health and wellbeing, and a smaller proportion believed that
their donation would have been unsuitable for a transfusion recipient (with 22 respondents
stating the deferral was for both their own health and that of the recipient).
Table 87: Descriptions of respondents’ understandings of the reason for their deferral UNDERSTANDING OF REASON N=709 EXAMPLES n %†
Low iron/ low haemoglobin (no further detail given)
253 35.7 My iron levels were too low
My haemoglobin was too low for lacking of iron
To protect the health and wellbeing of the donor
183 25.8 For my own good
Dangerous to donate when you have low haemoglobin levels
Levels didn’t meet threshold set by ARCBS
125 17.6 1 point below your 'extra' high restrictions
Below that which was considered ideal for donating but not a critically low level
Blood not suitable for recipient 51 7.2 Poor quality blood
Blood wasn’t good enough
Low levels attributed to diet/ lifestyle/ previous donation
38 5.4 Middle-aged, working too hard, borderline anaemic
To allow time for levels to build up
28 3.9 Maybe it takes that long for your levels to increase
“Incorrect” assumptions 20 2.8 I might have passed out if I donated blood
To allow time for investigations & changes
18 2.5 As my haemoglobin was low I needed to find the cause and improve my eating etc
Deferral due to an underlying condition (or suspicion of one)
15 2.1 The iron content in your blood is low &
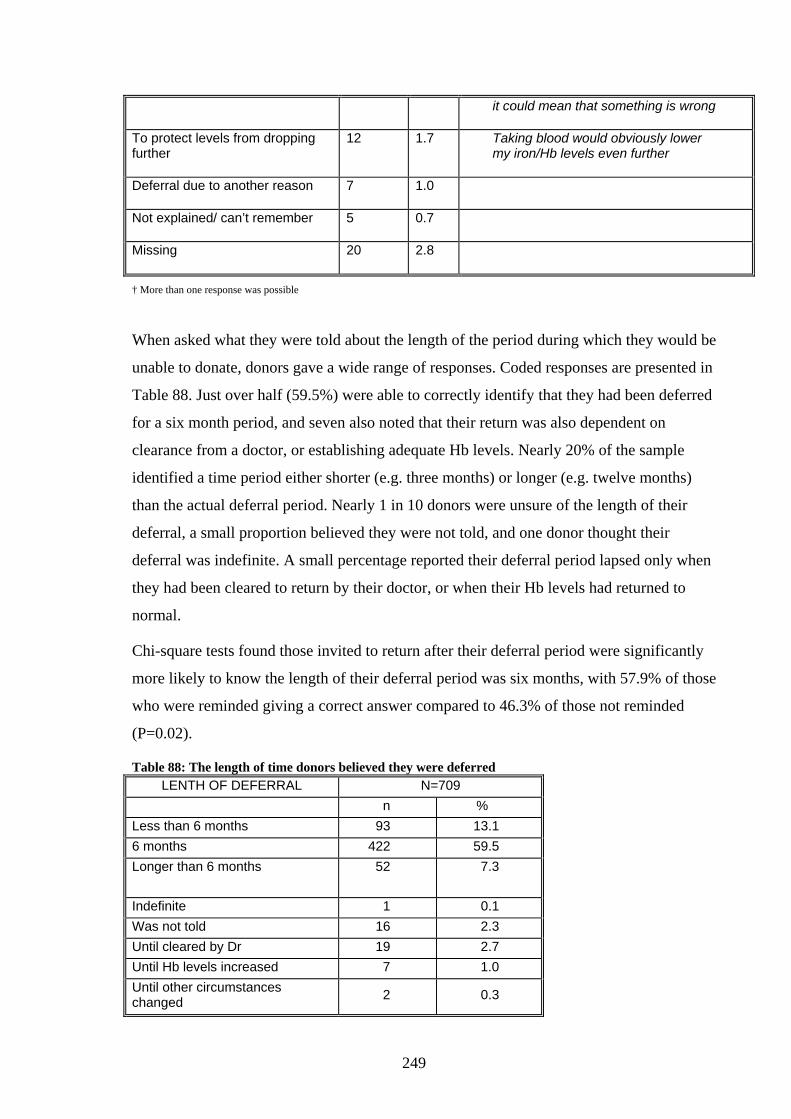
249
it could mean that something is wrong
To protect levels from dropping further
12 1.7 Taking blood would obviously lower my iron/Hb levels even further
Deferral due to another reason 7 1.0
Not explained/ can’t remember 5 0.7
Missing 20 2.8
† More than one response was possible
When asked what they were told about the length of the period during which they would be
unable to donate, donors gave a wide range of responses. Coded responses are presented in
Table 88. Just over half (59.5%) were able to correctly identify that they had been deferred
for a six month period, and seven also noted that their return was also dependent on
clearance from a doctor, or establishing adequate Hb levels. Nearly 20% of the sample
identified a time period either shorter (e.g. three months) or longer (e.g. twelve months)
than the actual deferral period. Nearly 1 in 10 donors were unsure of the length of their
deferral, a small proportion believed they were not told, and one donor thought their
deferral was indefinite. A small percentage reported their deferral period lapsed only when
they had been cleared to return by their doctor, or when their Hb levels had returned to
normal.
Chi-square tests found those invited to return after their deferral period were significantly
more likely to know the length of their deferral period was six months, with 57.9% of those
who were reminded giving a correct answer compared to 46.3% of those not reminded
(P=0.02).
Table 88: The length of time donors believed they were deferred LENTH OF DEFERRAL N=709
n % Less than 6 months 93 13.1 6 months 422 59.5 Longer than 6 months 52 7.3
Indefinite 1 0.1 Was not told 16 2.3 Until cleared by Dr 19 2.7 Until Hb levels increased 7 1.0 Until other circumstances changed 2 0.3

250
Missing 29 4.0 Not sure/ can’t remember 68 9.6
The majority of blood donors discussed their deferral with at least one person. Nearly four
in five reported discussing their deferral with their General Practitioner (GP) (79.0%), 8.3%
with a specialist, and 2.3% with another health professional.
Table 89: People told about deferral? PERSON N=709
n % GP 562 79.0 Family 524 73.7 Friends 330 46.4 Other blood donors 99 13.9 Specialist* 59 8.3 A representative of ARCBS 43 6.0 Another Health professional 16 2.3 Other (eg workmates) 8 1.1
* responses to subsequent questions revealed a larger proportion of donors visited a specialist following deferral
7.4.3 Seeking further investigations after deferral
This section focuses on the subgroup (79% of respondents) who sought further testing
and/or advice from their General Practitioner (GP).
The majority of those who saw their GP did so within one month of deferral (see Table 90).
Three quarters made an appointment specifically to discuss their low Hb (75.7%), while the
reminder discussed the issue when visiting for an unrelated reason (24.3%).
Table 90: Time taken to visit the GP TIME (N=562)
n % Within 1 month 396 70.7 1-3 months 112 20.0 3-6 months 25 4.5 More than 6 months 16 2.9
Table 91 shows a summary of the demographic characteristics and donation histories of
those who saw their GP vs. those who did not. Donors aged less than 34 were significantly
less likely to seek further investigations than donors in other age groups (P=0.003), and
those who had previously been deferred for low Hb were significantly less likely to seek
advice (P=0.04) There was no association between whether or not an individual saw his/her
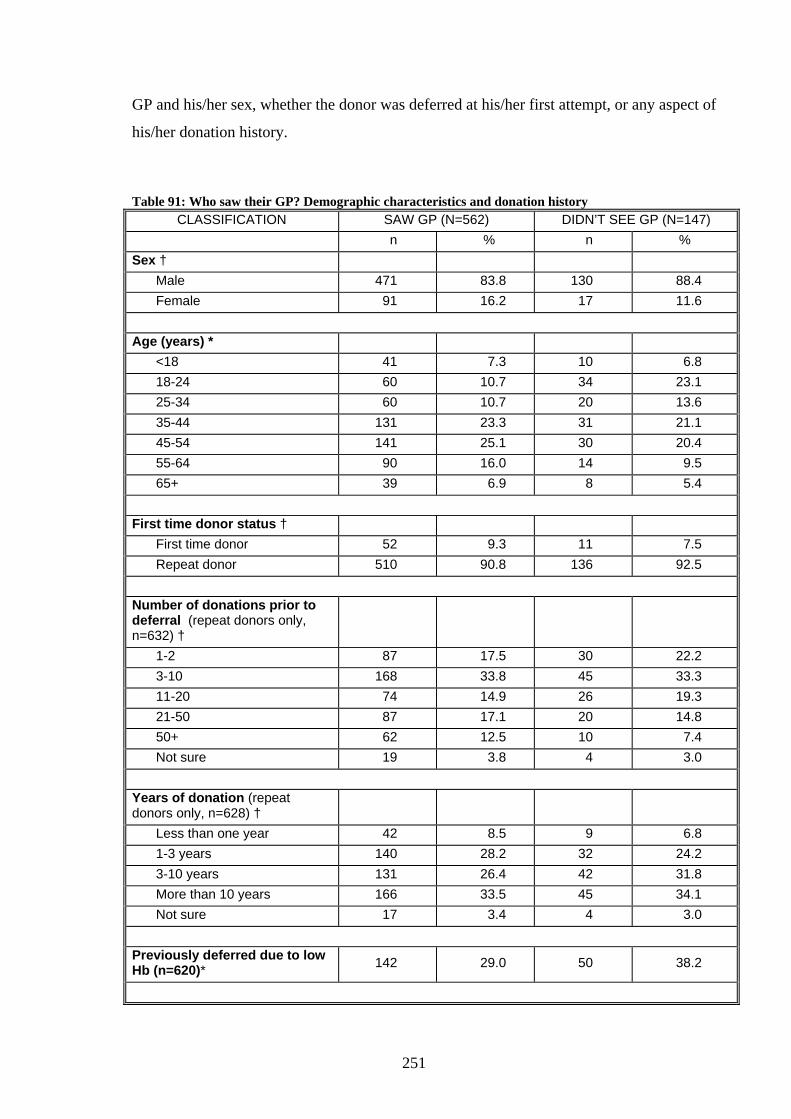
251
GP and his/her sex, whether the donor was deferred at his/her first attempt, or any aspect of
his/her donation history.
Table 91: Who saw their GP? Demographic characteristics and donation history CLASSIFICATION SAW GP (N=562) DIDN’T SEE GP (N=147)
n % n % Sex †
Male 471 83.8 130 88.4 Female 91 16.2 17 11.6
Age (years) *
<18 41 7.3 10 6.8 18-24 60 10.7 34 23.1 25-34 60 10.7 20 13.6 35-44 131 23.3 31 21.1 45-54 141 25.1 30 20.4 55-64 90 16.0 14 9.5 65+ 39 6.9 8 5.4
First time donor status †
First time donor 52 9.3 11 7.5 Repeat donor 510 90.8 136 92.5
Number of donations prior to deferral (repeat donors only, n=632) †
1-2 87 17.5 30 22.2 3-10 168 33.8 45 33.3 11-20 74 14.9 26 19.3 21-50 87 17.1 20 14.8 50+ 62 12.5 10 7.4 Not sure 19 3.8 4 3.0
Years of donation (repeat donors only, n=628) †
Less than one year 42 8.5 9 6.8 1-3 years 140 28.2 32 24.2 3-10 years 131 26.4 42 31.8 More than 10 years 166 33.5 45 34.1 Not sure 17 3.4 4 3.0
Previously deferred due to low Hb (n=620)* 142 29.0 50 38.2

252
Previously for other reasons (n=622) † 76 15.4 20 15.4
* difference statistically significant (P<0.05)
† difference not statistically significant
Table 92 shows a summary of the assessments of the deferral event from those who saw
their GP as opposed to those who did not. Those who had a venous sample taken at the
deferral event (indicating that further testing was performed by the ARCBS) were
significantly more likely to see their GP (P=0.001) There was no association between
whether a donor saw their GP and satisfaction with the explanation given by the interview
nurse (P=0.15), nor with the care received during the deferral (P=0.16). However, those
who were unhappy with the explanation given by the interview nurse tended to see their GP
more than three months after deferral, while those who found the explanation satisfactory
saw the GP sooner (P= 0.004).
Table 92: Who saw their GP? Aspects of the deferral appointment CLASSIFICATION SAW GP (N=562) DIDN’T SEE GP (N=147)
n % n % Further testing performed by ARCBS * 447 82.0 100 69.4
Dissatisfied with care † 41 7.4 15 10.3
Dissatisfied with explanation/ advice † 52 9.6 19 13.7
* difference statistically significant (P<0.05)
† difference not statistically significant
Most donors (83.3%) visiting their GP had tests performed, either directly with the GP or
upon referral to a medical specialist. Donors were invited to provide details of the type of
tests performed in an open-ended response question, and the coded responses are presented
in Table 93.
Table 93: Among those who had further tests performed by a medical practitioner, types of investigations
TESTS (N=468) n %† Blood test 419 87.4 Stool test/ faecal occult blood test 42 9.0 Colonoscopy/ Endoscopy/ barium enema
48 10.2
Urine test 10 2.1 Ultrasound/ scan 9 1.9

253
No detail given 32 6.8 Can’t remember / not specific 17 3.6
† More than one response was possible
Of those who reported having blood tests taken, nearly one quarter of respondents were told
that their haemoglobin levels were normal at the time of testing (22.0%), while the majority
(71.7%) had their low Hb results confirmed (see Table 94). Nine percent of donors with
normal Hb levels reported that their doctor informed the ARCBS of their results, while
38.1% were unsure whether the ARCBS had been advised.
Table 94: Among those who had blood tests taken by their GP, outcome of the test results RESULTS FROM TESTS (N=462)
n % Low Hb 332 71.9 Normal Hb 104 22.5 Not sure 26 5.6
Respondents were asked to provide detail of any explanation they were given for why they
had a low Hb concentration. While only donors with confirmed low Hb levels were asked
to answer the question, many respondents who gave an answer indicated they had normal
haemoglobin levels, were not sure of the results, or had no testing performed by their GP.
In addition, 62 donors stated they did not receive an explanation, yet were referred to a
specialist, suggesting suspicion of a possible underlying condition. In total, 276 donors
gave detail about an explanation received during the process of pursuing further
investigations after deferral. The reasons were coded and are shown in Table 95.
Table 95: Among those given a reason for low Hb by their doctor, summary of the reasons REASON FOR LOW HB LEVEL N=276* EXAMPLES
n %†
Diet 91 33.0 She said it was probably my diet
Donor was sent for further testing (no further detail about underlying condition)
62 22.4 My GP referred me to a gastroenterologist as I have reflux and he performed a gastroscopy & colonoscopy
Menstrual cycles 59 21.4 Heavy periods
Possible or actual underlying condition
31 11.2 Thalassaemia
Low iron stores 24 8.7 Low iron stores

254
Age and/or sex 14 5.1 Just because I was a young woman and it was common
Frequency of blood donation / length of donation history
14 5.1 That I was possibly donating too often
Anaemic, IDA 14 5.1 I suffer from iron deficiency anaemia
Stress / busy lifestyle/ heavy exercise
10 3.6 I was suffering akin to marathon runners- doing too much
Poor absorption and/or storage of iron
8 2.9 Low absorption of iron
The level is right for their body 5 1.8 My Hb is always on the lower side with no worries
GP agreed with ARCBS advice 5 1.8 She concurred with the Blood Donor Service
Dr said within normal range 2 0.7 She said that my levels were within normal error range
Hereditary 2 0.7 It's hereditary - my dad is anaemic, my mum is a carrier
Can't remember/ not specific 10 3.6 Yes but cannot remember
† More than one response was possible
* 15 of these donors had a normal Hb result when tested by their GP, and one donor was unsure of the test results. These donors were
likely to have been advised as to why they were low at the time of their deferral rather than at the time of testing
Most donors who consulted their GP were advised to take action to improve their low Hb
level. The results of the categorisation of what donors were told to “do” is shown in Table
96. Some donors appeared to describe the course of action recommended by a specialist or
other health care provider, so coding for this question drew on descriptions of guidance
provided by any health professional in the process of seeking further investigations. The
“Seek further investigations/advice with a specialist” category was restricted to donors who
specifically wrote that their doctor had recommended further investigations or advice from
another medical provider in that category. Nearly half of the participants seeking further
investigations were told to take iron supplements and over one third to make changes to
their diet (with suggestions such as “more red meat”, and “more leafy green vegetables”
common responses). Some of those advised to try supplements, change their diet, or make
changes to other aspects of their lifestyles were also advised to have follow-up blood tests
taken at a later date (8.8%). Small numbers were advised to donate less often (n=12) or
return after a break (n=12), while one donor was advised to stop donating altogether.

255
Table 96: Amongst those who saw their GP, what were donors told to do to improve their low Hb? WHAT WERE DONORS TOLD TO DO? N=562
n %† Iron supplements 289 49.7 Make changes to diet (e.g. more meat) 215 36.9 Not told to do anything, as levels were normal (or did not give detail of test result, or initially had low levels but subsequent testing found to be okay.
101 17.4
Further blood tests after other interventions 51 8.8 Seek further investigations/advice with a specialist 39 6.7 No detail given 20 3.4 Other treatment (e.g. B12 injections, going on the pill) 20 3.4 Not told to do anything (and was found to have low Hb at doctor’s tests, or “not sure” and commented on about the absence of information)
14 2.4
Take a break from donation 13 2.2 Donate less often 12 2.1 Lifestyle changes (e.g. less exercise, less stress) 12 2.1 Nothing that can/should be done (e.g. thalassaemia) 10 1.7 Iron injections 8 1.4 Confirmed advice given by ARCBS* 7 1.2
† More than one response was possible
* the responses to earlier questions about advice given by ARCBS was also coded if respondent said their Dr confirmed advice from
ARCBS
Reported compliance with advice given by the GP was high, with 77.5% of those told to
take iron tablets reporting they did so, and 70.6% of those told to make changes reporting
they did so.
7.4.3.1 Visiting a medical specialist and detecting underlying conditions
A total of 59 donors reported that they had discussed their low Hb with a specialist, and a
further 50 mentioned a specialist appointment and/or investigations in a subsequent
question. Therefore, a total of 109 donors (15.3% of all respondents, and 19.0% of those
seeing their GP) visited a specialist within twelve months after their deferral.
The questionnaire was structured in a way that only invited those who had been referred by
their GP to answer questions about their specialist appointment. As a consequence, no
information about investigations was collected for two donors who discussed their deferral
with a specialist, but did not seek investigations with their GP, or the six donors who
indicated that they discussed their low Hb with a specialist, but were not recommended to
do so by their GP (it was not clear whether they had seen the specialist previously).

256
A total of 111 (19.8%) of those seeing their GP were referred to a specialist for further
investigations. Donors were more likely to be referred to a specialist as they increased in
age, with 7.9% of those aged less than 25, 11.1% of those aged 25-39, 25.2% of those aged
40-64, and 30.8% of those aged over 65 referred to a specialist (P< 0.001). Males were also
more likely to be referred to a specialist than females (35.2% vs. 16.8% respectively,
P<0.001). Males were significantly more likely than females to be in the older age
categories (P<0.001), although males were still more likely to be referred to a specialist
even in the younger age groups.
Those referred to a specialist were invited to briefly describe the visit in an open-ended
response question. Respondents supplied a varying amount of detail in response to this
question. Some simply noted that they had been referred, without any detail as to whether
they had seen the specialist (n=6). At the other end of the spectrum, some respondents
noted that they had undergone further investigations and that the test results identified a
serious underlying condition. With the exception of data on underlying conditions, the
results are not presented here, as comparisons of particular aspects of the specialist visit
(e.g. the type of specialist seen, the range of investigations undertaken, and the results of
the investigations) would not be representative, as most respondents did not provide detail
for at least one area. However, the information was used to build the questionnaire for the
3ML survey (see the Results: Part Three chapter).
There were 21 clear examples where donors had medical conditions diagnosed during
investigations following deferral. Several of these conditions were likely to have
contributed to a low Hb status, while others were unlikely to be related to the donor’s iron
status but identified during the process of investigation, such as rheumatoid arthritis, an
“unrelated” blood disorder, and pre-diabetes. Donors revealed the details of their conditions
either in responses to questions about the range of medical investigations undertaken, or in
an open-ended response question inviting comments on any aspect of being deferred. For
reasons that will be discussed later in this chapter, the 21 cases are likely to be an
underestimation of the actual number of conditions in the deferred group.
Several donors expressed gratitude for being alerted to their low Hb status at their deferral,
and being encouraged to seek further investigations. For example, two respondents wrote:
"In my case, the Australian Red Cross Blood Service did me a great favour. They
suspected a problem, referred me to my doctor, who then referred me to a
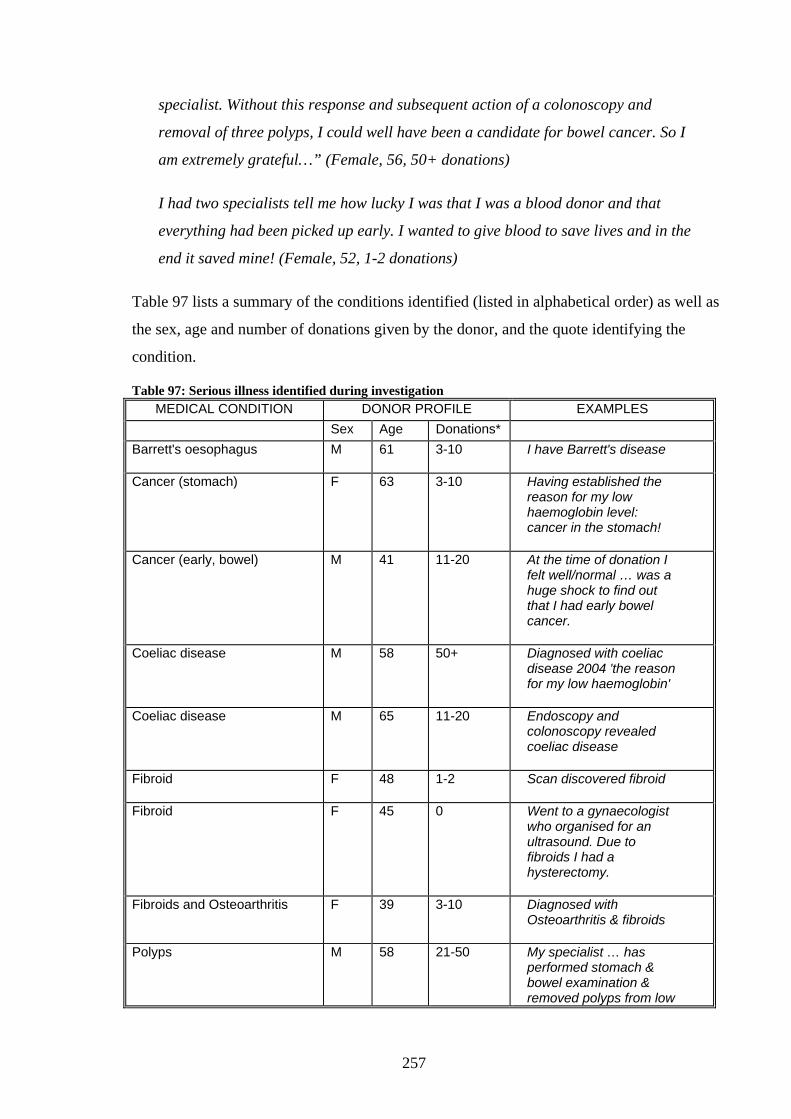
257
specialist. Without this response and subsequent action of a colonoscopy and
removal of three polyps, I could well have been a candidate for bowel cancer. So I
am extremely grateful…” (Female, 56, 50+ donations)
I had two specialists tell me how lucky I was that I was a blood donor and that
everything had been picked up early. I wanted to give blood to save lives and in the
end it saved mine! (Female, 52, 1-2 donations)
Table 97 lists a summary of the conditions identified (listed in alphabetical order) as well as
the sex, age and number of donations given by the donor, and the quote identifying the
condition.
Table 97: Serious illness identified during investigation MEDICAL CONDITION DONOR PROFILE EXAMPLES
Sex Age Donations* Barrett's oesophagus M 61 3-10 I have Barrett's disease
Cancer (stomach) F 63 3-10 Having established the reason for my low haemoglobin level: cancer in the stomach!
Cancer (early, bowel) M 41 11-20 At the time of donation I felt well/normal … was a huge shock to find out that I had early bowel cancer.
Coeliac disease M 58 50+ Diagnosed with coeliac disease 2004 'the reason for my low haemoglobin'
Coeliac disease M 65 11-20 Endoscopy and colonoscopy revealed coeliac disease
Fibroid F 48 1-2 Scan discovered fibroid
Fibroid F 45 0 Went to a gynaecologist who organised for an ultrasound. Due to fibroids I had a hysterectomy.
Fibroids and Osteoarthritis F 39 3-10 Diagnosed with Osteoarthritis & fibroids
Polyps M 58 21-50 My specialist … has performed stomach & bowel examination & removed polyps from low

258
bowel
Polyps F 56 50+ He did a colonoscopy & a gastrocopy- found 3 polyps and removed them
Polyps M 67 50+ He also performed a colonoscopy & removed 2 small polyps
Pre-diabetes M 57 3-10 My test showed that I had early signs of pre diabetes
Rheumatoid arthritis F 60 0 Rheumatoid arthritis- diagnosed November 2004
Ulcerated nodule (stomach) M 62 3-10 Had a gastrocopy and a colonoscopy which showed an ulcerated nodule in the stomach
Ulcer (small intestine) F 56 21-50 Specialist performed colonoscopy and gastrocopy- found ulcer in small intestine (lower end)
Ulcer (and heart murmur) F 52 1-2 I now know that I have a heart condition, an ulcer
Unidentified gastro-intestinal condition (resulting in surgery)
M 54 50+ Bowel operation to stop blood loss
Unspecified blood disorder F 18 1-2 Since discovered a …non related blood disorder
Unspecified gynaecological condition (resulting in endometrial ablation)
F 39 50+ Endometrial Ablation
Unspecified gynaecological condition (resulting in endometrial ablation)
F 52 3-10 Visit my gyn/obs & have since had an endometrial ablation performed
Unspecified gynaecological condition (resulting in hysterectomy)
F 33 1-2 Gynaecologist - I required a hysterectomy
* Self-reported number of donations
7.4.3.2 Changes resulting from deferral
Respondents were asked whether they had made any changes to their diet or lifestyle since
their deferral. The overwhelming majority reported changes, and those who sought further
259
investigations from their GP were significantly more likely to have made changes than
those not seeking investigations (85.1 vs. 62.6%, P<0.001). The responses were coded for
each group and are presented in Table 98. The largest proportion of those who saw their GP
took iron supplements following deferral, while the largest proportion of those not seeking
further investigations made changes to their diet. Three donors reported deliberately
amending their donation frequency after deferral.
The duration and intensity of supplementation varyied widely. For example, some
described trying supplementation and stopping after experiencing gastro-intestinal side
effects, others took tablets occasionally, while several remained on daily supplementation
for several months.
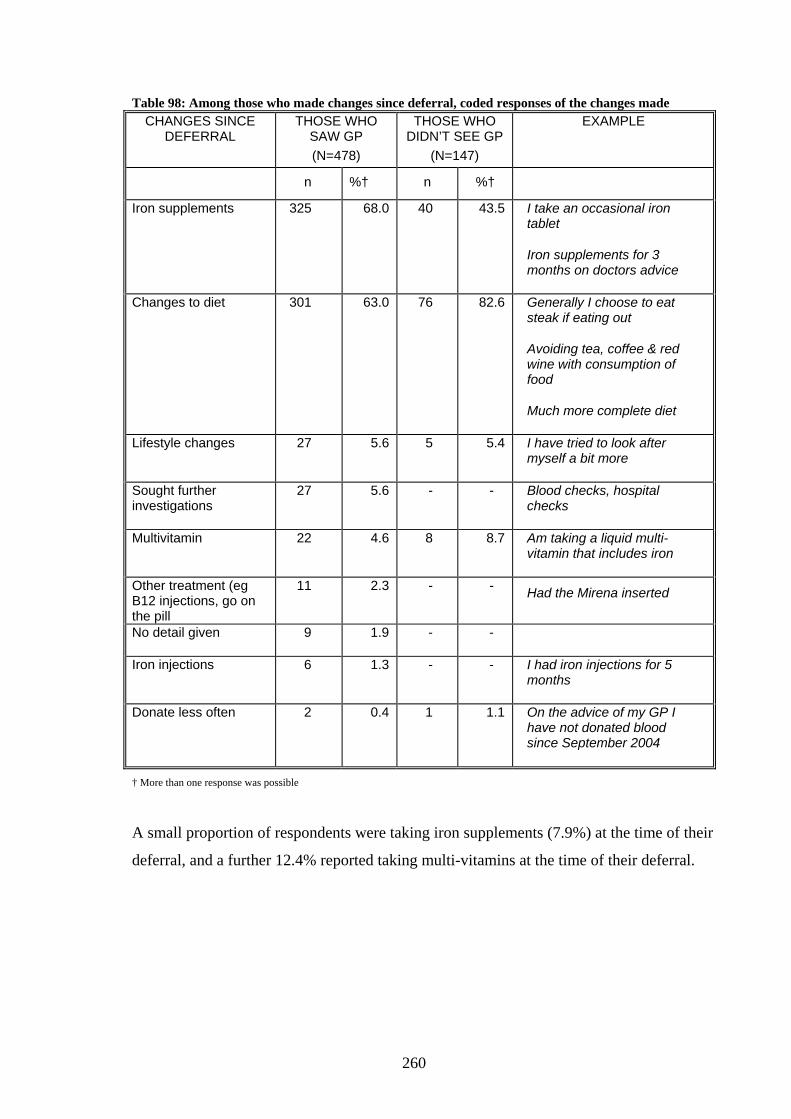
260
Table 98: Among those who made changes since deferral, coded responses of the changes made CHANGES SINCE
DEFERRAL THOSE WHO
SAW GP (N=478)
THOSE WHO DIDN’T SEE GP
(N=147)
EXAMPLE
n %† n %†
Iron supplements 325 68.0 40 43.5 I take an occasional iron tablet
Iron supplements for 3 months on doctors advice
Changes to diet 301 63.0 76 82.6 Generally I choose to eat steak if eating out
Avoiding tea, coffee & red wine with consumption of food
Much more complete diet
Lifestyle changes 27 5.6 5 5.4 I have tried to look after myself a bit more
Sought further investigations
27 5.6 - - Blood checks, hospital checks
Multivitamin 22 4.6 8 8.7 Am taking a liquid multi-vitamin that includes iron
Other treatment (eg B12 injections, go on the pill
11 2.3 - - Had the Mirena inserted
No detail given 9 1.9 - -
Iron injections 6 1.3 - - I had iron injections for 5 months
Donate less often 2 0.4 1 1.1 On the advice of my GP I have not donated blood since September 2004
† More than one response was possible
A small proportion of respondents were taking iron supplements (7.9%) at the time of their
deferral, and a further 12.4% reported taking multi-vitamins at the time of their deferral.
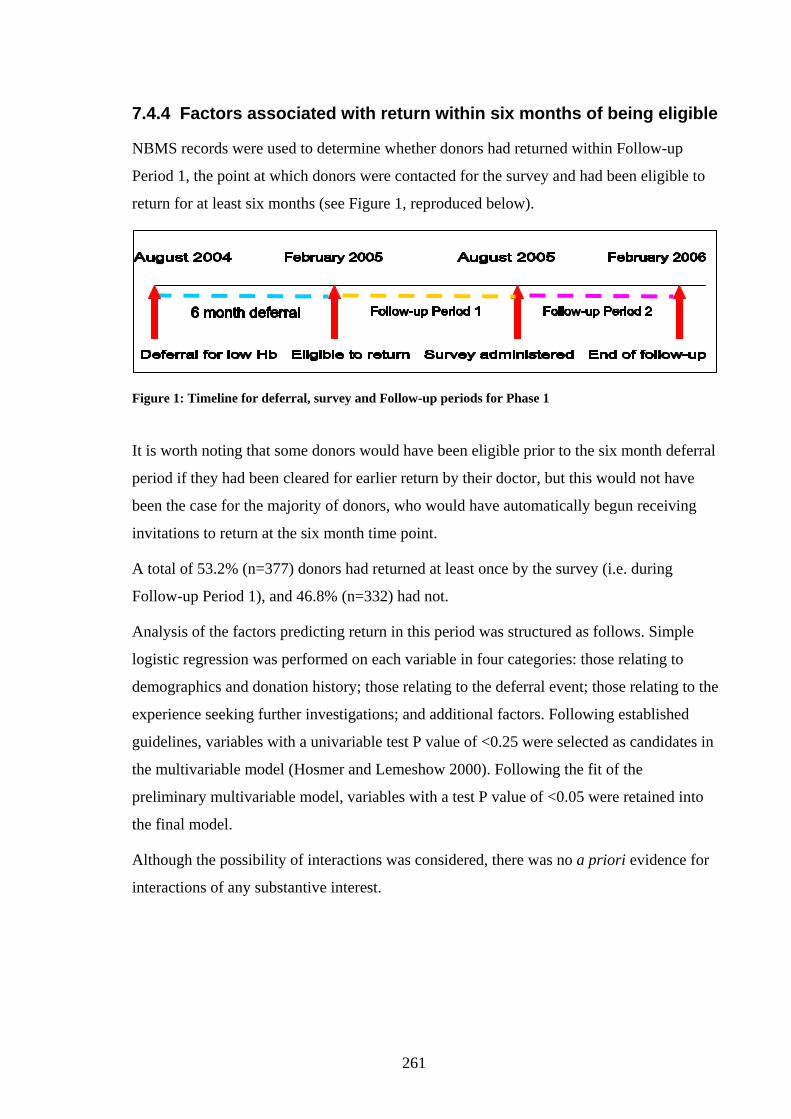
261
7.4.4 Factors associated with return within six months of being eligible
NBMS records were used to determine whether donors had returned within Follow-up
Period 1, the point at which donors were contacted for the survey and had been eligible to
return for at least six months (see Figure 1, reproduced below).
Figure 1: Timeline for deferral, survey and Follow-up periods for Phase 1
It is worth noting that some donors would have been eligible prior to the six month deferral
period if they had been cleared for earlier return by their doctor, but this would not have
been the case for the majority of donors, who would have automatically begun receiving
invitations to return at the six month time point.
A total of 53.2% (n=377) donors had returned at least once by the survey (i.e. during
Follow-up Period 1), and 46.8% (n=332) had not.
Analysis of the factors predicting return in this period was structured as follows. Simple
logistic regression was performed on each variable in four categories: those relating to
demographics and donation history; those relating to the deferral event; those relating to the
experience seeking further investigations; and additional factors. Following established
guidelines, variables with a univariable test P value of <0.25 were selected as candidates in
the multivariable model (Hosmer and Lemeshow 2000). Following the fit of the
preliminary multivariable model, variables with a test P value of <0.05 were retained into
the final model.
Although the possibility of interactions was considered, there was no a priori evidence for
interactions of any substantive interest.
262
7.4.4.1 Univariable analysis
Demographic and donation characteristics Design (dummy) variables were created for age category (aged less than 25, 25-34, 35-44,
45-54, 55-64, and 65 and over), and sex (male vs. female).
Design variables were also created for different aspects of donation history. Donors were
coded for length of donation history and number of donations given, both self-reported
variables, and recent donation frequency, an NBMS derived variable.
Donation history variables were coded as follows:
Length of donation history less than one year, 1-3 years, 3-10 years, 10+ years, or not
sure (including missing responses) against the baseline of being a new donor
Number of donations 1 or 2 donations, 3 to 10 donations, 11 to 20 donations, 21 to 49
donations, more than 50 donations, or not sure (including missing responses), against the
baseline of being a new donor
Recent donation frequency those who made zero, one, two, three, and four, or five or
more donations in the year prior to deferral, against the baseline of being a new donor
As noted in previous chapters, variables describing different aspects of donation history
could not all be included in the multivariable models due to problems with dependence in
categories. To maintain consistency across studies, recent donation frequency was chosen
for inclusion in multivariable analysis.
Design variables were also created for deferral history based on repeat donors’ reports of
whether, prior to the deferral in August and September of 2004, they had been deferred for
low Hb, or deferred for another reason.
Univariable logistic regression was performed for each of the variables outlined above. The
results are presented in Table 99, and estimates with a global P value of <0.25 are indicated
in bold font.

263
Table 99: Univariable logistic regression models for return within 6 months of being eligible, demographic and donation characteristics
VARIABLE OR 95% CONF. INTERVAL P Age (n=709) 0.04
<25 25-34 1.06 0.61 1.83 0.83 35-44 0.79 0.50 1.23 0.30 45-54 1.20 0.77 1.87 0.42 55-64 1.31 0.79 2.17 0.30 65+ 2.26 1.12 4.58 0.02
Male (relative to female) (n=709) 1.53 1.01 2.34 0.04
Recent attendance frequency (n=709) <0.001 New donor 0 donation prior 2.26 1.02 5.00 0.04 1 donation prior 3.26 1.59 6.65 0.001 2 donations prior 7.16 3.51 14.62 <0.001 3 donations prior 7.61 3.75 15.43 <0.001 4 donations prior 8.01 3.86 16.60 <0.001 5+ donations prior 9.92 2.23 44.07 0.003
Number of donations* (ever made, self-reported) (n=709) <0.001 New donor 1 or 2 donations 2.82 0.94 3.13 0.002 3 to 10 donations 4.38 1.35 4.81 <0.001 11 to 20 donations 4.68 1.60 4.52 <0.001 21 to 49 donations 6.41 2.19 5.45 <0.001 50+ donations 10.59 4.09 6.10 <0.001 Not sure 2.71 1.36 1.99 0.05
Length of donation history (self-reported) * (n=709) 0.024 New donor Less than one year 3.78 1.64 8.71 0.002 1 to less than 3 years 4.56 2.27 9.14 <0.001 3 to less than 10 years 6.56 3.26 13.20 <0.001 10 years or longer 6.82 3.43 13.56 <0.001 Not sure 3.28 1.35 8.01 0.009
Previously deferred for low Hb* (self-reported) (n=646)
0.93 0.66 1.30 0.67
Previously deferred for other reason* (self-reported) (n=646)
1.09 0.70 1.69 0.70
Univariable (simple) logistic regression * for repeat donors only

264
1/0 coding of all categories reflects whether or not the donor responded (or was coded) affirmatively in category (missing responses not analysed)
7.4.4.1.1 Aspects of the deferral experience Design variables were created to indicate whether specific aspects of the deferral event
were reported by the donor: whether the ARCBS performed further testing (indicated by
whether a venous sample was taken); whether the interview nurse discussed reasons for
their low Hb; whether possible ways to increase dietary iron intake were discussed; whether
the explanation of the reason for deferral was clear; whether the donor was dissatisfied with
care; whether the donor was dissatisfied with the explanation and advice; whether the donor
was given information brochures; and whether the donor experienced a negative emotional
response to deferral.
Univariable analysis was performed on the binary variables indicated above, and the results
are presented in Table 100, with estimates with a probability of <0. 25 indicated in bold
font. Several factors related to the presence of particular advice were associated with an
increased likelihood of return, while poorer ratings were associated with a decreased
likelihood of return.
Table 100: Univariable logistic regression models for return within 6 months of being eligible, aspects of the deferral experience
OR 95% CONF. INTERVAL
P
Further testing performed by ARCBS (n=689) 0.99 0.69 1.44 0.97 Reasons for low Hb discussed (n=680) 1.33 0.94 1.92 0.11 Increasing dietary iron discussed (n=681) 1.83 1.28 2.61 0.001 Explanation of deferral clear (n=703) 1.84 1.03 3.30 0.04 Dissatisfied with care (n=699) 0.55 0.31 0.96 0.04 Dissatisfied with explanation/ advice (n=681)
0.61 0.37 0.99 0.047
Given brochures (n=679) 2.13 1.53 2.97 <0.001 Negative emotional response (n= 709) 1.03 0.75 1.43 0.84 Univariable (simple) logistic regression 1/0 coding of all categories reflects whether or not the donor responded (or was coded) affirmatively in category (missing responses not analysed)
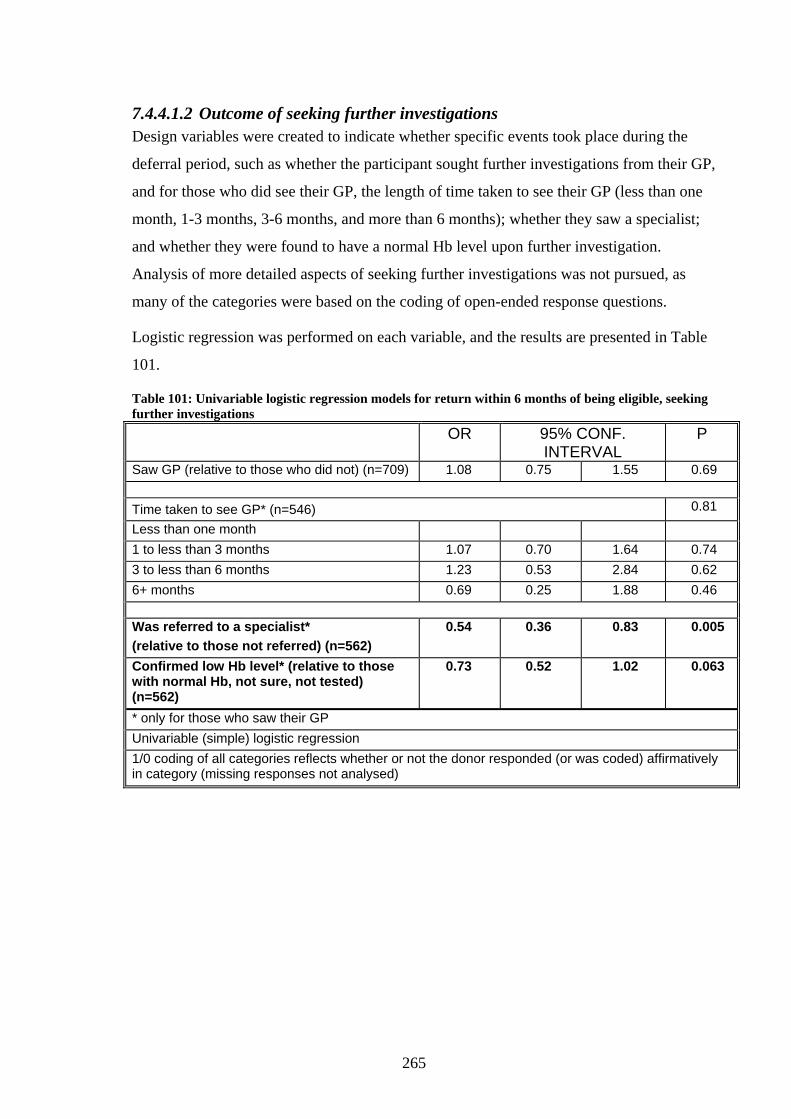
265
7.4.4.1.2 Outcome of seeking further investigations Design variables were created to indicate whether specific events took place during the
deferral period, such as whether the participant sought further investigations from their GP,
and for those who did see their GP, the length of time taken to see their GP (less than one
month, 1-3 months, 3-6 months, and more than 6 months); whether they saw a specialist;
and whether they were found to have a normal Hb level upon further investigation.
Analysis of more detailed aspects of seeking further investigations was not pursued, as
many of the categories were based on the coding of open-ended response questions.
Logistic regression was performed on each variable, and the results are presented in Table
101.
Table 101: Univariable logistic regression models for return within 6 months of being eligible, seeking further investigations
OR 95% CONF. INTERVAL
P
Saw GP (relative to those who did not) (n=709) 1.08 0.75 1.55 0.69 Time taken to see GP* (n=546) 0.81
Less than one month 1 to less than 3 months 1.07 0.70 1.64 0.74 3 to less than 6 months 1.23 0.53 2.84 0.62 6+ months 0.69 0.25 1.88 0.46 Was referred to a specialist* (relative to those not referred) (n=562)
0.54 0.36 0.83 0.005
Confirmed low Hb level* (relative to those with normal Hb, not sure, not tested) (n=562)
0.73 0.52 1.02 0.063
* only for those who saw their GP Univariable (simple) logistic regression 1/0 coding of all categories reflects whether or not the donor responded (or was coded) affirmatively in category (missing responses not analysed)
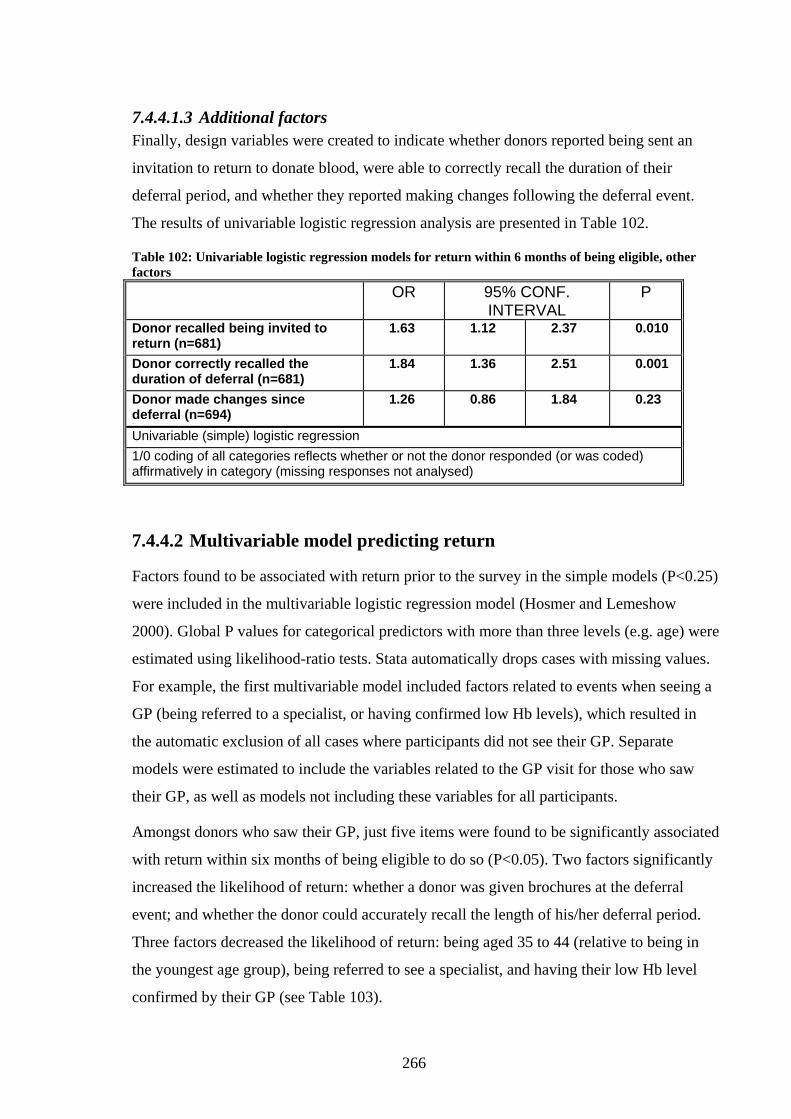
266
7.4.4.1.3 Additional factors Finally, design variables were created to indicate whether donors reported being sent an
invitation to return to donate blood, were able to correctly recall the duration of their
deferral period, and whether they reported making changes following the deferral event.
The results of univariable logistic regression analysis are presented in Table 102.
Table 102: Univariable logistic regression models for return within 6 months of being eligible, other factors
OR 95% CONF. INTERVAL
P
Donor recalled being invited to return (n=681)
1.63 1.12 2.37 0.010
Donor correctly recalled the duration of deferral (n=681)
1.84 1.36 2.51 0.001
Donor made changes since deferral (n=694)
1.26 0.86 1.84 0.23
Univariable (simple) logistic regression 1/0 coding of all categories reflects whether or not the donor responded (or was coded) affirmatively in category (missing responses not analysed)
7.4.4.2 Multivariable model predicting return
Factors found to be associated with return prior to the survey in the simple models (P<0.25)
were included in the multivariable logistic regression model (Hosmer and Lemeshow
2000). Global P values for categorical predictors with more than three levels (e.g. age) were
estimated using likelihood-ratio tests. Stata automatically drops cases with missing values.
For example, the first multivariable model included factors related to events when seeing a
GP (being referred to a specialist, or having confirmed low Hb levels), which resulted in
the automatic exclusion of all cases where participants did not see their GP. Separate
models were estimated to include the variables related to the GP visit for those who saw
their GP, as well as models not including these variables for all participants.
Amongst donors who saw their GP, just five items were found to be significantly associated
with return within six months of being eligible to do so (P<0.05). Two factors significantly
increased the likelihood of return: whether a donor was given brochures at the deferral
event; and whether the donor could accurately recall the length of his/her deferral period.
Three factors decreased the likelihood of return: being aged 35 to 44 (relative to being in
the youngest age group), being referred to see a specialist, and having their low Hb level
confirmed by their GP (see Table 103).

267
Table 103: Results of fitting multivariable model of return prior to survey, using significant univariable effects (amongst donors who saw their GP)
VARIABLE OR 95% CONF. INTERVAL
P
Age 0.046
<25 25-34 0.64 0.25 1.64 0.35 35-44 0.32 0.15 0.67 <0.001 45-54 0.72 0.34 1.53 0.39 55-64 0.59 0.24 1.49 0.27 65+ 0.84 0.25 2.86 0.78
Male (relative to female) 2.22 1.02 4.82 0.04 Recent donation history 0.004
New donor 0 donation prior 2.81 0.86 9.18 0.09 1 donation prior 2.03 0.72 5.74 0.18 2 donations prior 5.60 2.04 15.40 0.001 3 donations prior 4.57 1.66 12.63 0.003 4 donations prior 4.90 1.66 14.42 0.004 5+ donations prior 10.31 0.84 126.44 0.07
Reasons for low Hb discussed 1.39 0.70 2.73 0.34 Increasing dietary iron discussed 0.84 0.41 1.72 0.63 Explanation of deferral clear 0.69 0.16 3.03 0.62 Dissatisfied with care 0.70 0.20 2.38 0.57 Dissatisfied with explanation/ advice 0.47 0.15 1.48 0.20 Given brochures 2.20 1.23 3.95 0.008 Was referred to a specialist 0.58 0.31 1.09 0.09 Confirmed low Hb level 0.36 0.20 0.66 0.001 Donor recalled being invited to return once eligible 1.37 0.74 2.56 0.32
Donor correctly recalled the duration of deferral 2.05 1.26 3.33 0.004
Donor made changes since deferral 1.18 0.59 2.38 0.64 Logistic regression N= 373 Log likelihood = -211.79 LR chi2(23) = 86.51 P<0.0001 Cases with missing responses automatically dropped from analysis
Models that did not include variables relating to medical investigations were built for all
donors, and the results are presented in Table 104. No new variables became significant
predictors of return, with just three variables found to be associated with return in this

268
model: recent donation frequency, whether the donor was given brochures, and whether the
donor could correctly identify the length of the deferral period.
Table 104: Results of fitting multivariable model of return prior to survey, with significant univariable effects (amongst all donors (no GP variables))
VARIABLE OR 95% CONF. INTERVAL
P
Age 0.06
<25 25-34 1.03 0.54 1.98 0.92 35-44 0.55 0.32 0.95 0.03 45-54 1.05 0.60 1.83 0.87 55-64 0.72 0.36 1.43 0.35 65+ 1.72 0.64 4.64 0.29
Male (relative to female) 1.73 0.94 3.18 0.08 Recent donation history <0.001
New donor 0 donation prior 2.49 0.98 6.35 0.06 1 donation prior 3.32 1.45 7.60 0.005 2 donations prior 6.69 2.92 15.31 <0.001 3 donations prior 6.01 2.62 13.83 <0.001 4 donations prior 7.43 3.09 17.86 <0.001 5+ donations prior 12.42 1.22 126.04 0.03
Reasons for low Hb discussed 1.28 0.78 2.12 0.33 Increasing dietary iron discussed 1.08 0.63 1.85 0.78 Explanation of deferral clear 1.22 0.51 2.90 0.66 Dissatisfied with care 0.89 0.40 1.96 0.77 Dissatisfied with explanation/ advice 0.65 0.31 1.38 0.27 Given brochures 1.82 1.17 2.83 0.007 Donor recalled being invited to return once eligible 1.31 0.83 2.09 0.25
Donor correctly recalled the duration of deferral 1.87 1.29 2.71 0.001
Donor made changes since deferral 0.99 0.61 1.61 0.98 Logistic regression N= 570 Log likelihood = -344.32 LR chi2(21) = 97.50 P<0.0001 Cases with missing responses automatically dropped from analysis
As no new predictors emerged in the model of return amongst all donors, a preliminary
final model was estimated including just the variables found to be significant in the first
multivariable model. The results are shown in Table 105.

269
Table 105: First preliminary model of return prior to survey VARIABLE OR 95% CONF.
INTERVAL P
Age 0.11
<25 25-34 0.76 0.32 1.79 0.53 35-44 0.39 0.20 0.76 0.01 45-54 0.71 0.37 1.38 0.31 55-64 0.58 0.27 1.25 0.16 65+ 0.75 0.28 2.02 0.57
Male (relative to female) 1.44 0.78 2.66 0.25 Recent donation history 0.002
New donor 0 donation prior 1.66 0.59 4.61 0.34 1 donation prior 1.46 0.57 3.71 0.43 2 donations prior 4.07 1.65 10.04 0.002 3 donations prior 3.88 1.57 9.60 0.003 4 donations prior 3.76 1.46 9.72 0.006 5+ donations prior 3.18 0.44 22.98 0.25
Given brochures 1.98 1.24 3.18 0.004 Confirmed low Hb level 0.42 0.26 0.68 <0.001 Donor correctly recalled the duration of deferral 1.98 1.30 3.02 0.004
Logistic regression N= 434 Log likelihood = -211.79 LR chi2(15) = 74.40 P<0.0001 Cases with missing responses automatically dropped from analysis
Sex and age were not significant predictors in this model. These variables were dropped in
the second preliminary model (see Table 106). In this model, having a higher frequency of
donation prior to deferral, being given brochures at deferral, and correctly identifying the
length of the deferral period was associated with having already returned before the survey.
Having had their low Hb level confirmed by their GP was associated with a reduced
likelihood of return. Respondents who were deferred at their first donation attempt did not
have a significantly lower likelihood of return compared to repeat donors who had given
zero or one donation in the year prior to deferral.
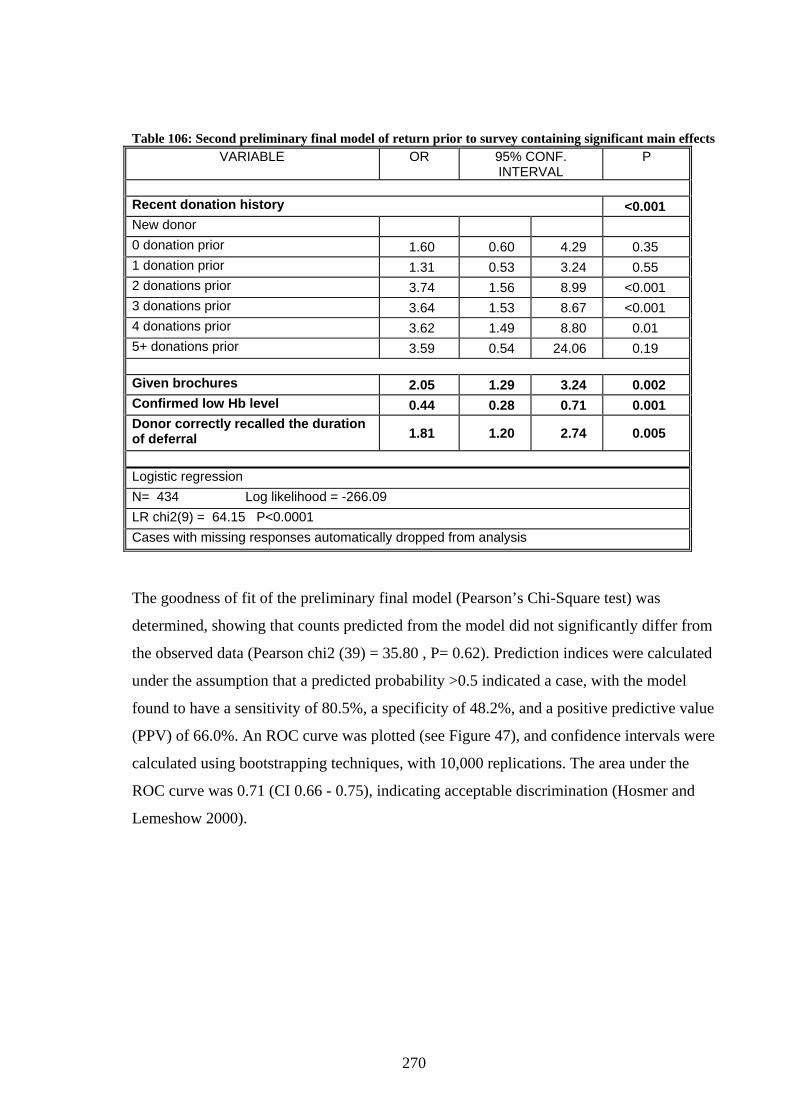
270
Table 106: Second preliminary final model of return prior to survey containing significant main effects VARIABLE OR 95% CONF.
INTERVAL P
Recent donation history <0.001 New donor 0 donation prior 1.60 0.60 4.29 0.35 1 donation prior 1.31 0.53 3.24 0.55 2 donations prior 3.74 1.56 8.99 <0.001 3 donations prior 3.64 1.53 8.67 <0.001 4 donations prior 3.62 1.49 8.80 0.01 5+ donations prior 3.59 0.54 24.06 0.19
Given brochures 2.05 1.29 3.24 0.002 Confirmed low Hb level 0.44 0.28 0.71 0.001 Donor correctly recalled the duration of deferral 1.81 1.20 2.74 0.005
Logistic regression N= 434 Log likelihood = -266.09 LR chi2(9) = 64.15 P<0.0001 Cases with missing responses automatically dropped from analysis
The goodness of fit of the preliminary final model (Pearson’s Chi-Square test) was
determined, showing that counts predicted from the model did not significantly differ from
the observed data (Pearson chi2 (39) = 35.80 , P= 0.62). Prediction indices were calculated
under the assumption that a predicted probability >0.5 indicated a case, with the model
found to have a sensitivity of 80.5%, a specificity of 48.2%, and a positive predictive value
(PPV) of 66.0%. An ROC curve was plotted (see Figure 47), and confidence intervals were
calculated using bootstrapping techniques, with 10,000 replications. The area under the
ROC curve was 0.71 (CI 0.66 - 0.75), indicating acceptable discrimination (Hosmer and
Lemeshow 2000).

271
Figure 47: Plot of sensitivity versus 1-specificity (ROC Curve)
7.4.5 Early return from deferral
According to NMBS records, 62 donors returned prior to the end of the six month deferral
period. One in four of those who returned early gave no detail about visiting their GP, so it
was not clear whether the donors had received clearance for their early return, or whether
they had returned early in error. It appears 6 in 10 donors who returned early successfully
gave whole blood or, in one case, a plasma donation, but the remaining 4 in 10 did not
successfully donate, with their record indicating a donation was either not taken, or “sample
only”, thus indicating that the attempt resulted in a subsequent deferral (see Table 107).
Table 107: Outcome of early return donation COUNT PERCENTAGE
Whole blood (including plasma only) 36 58.1 Apheresis Plasma 1 1.6 Not taken 16 25.8 Sample only (indicating a subsequent deferral) 9 14.5
0.00
0.25
0.50
0.75
1.00
Sen
sitiv
ity
0.00 0.25 0.50 0.75 1.001 - Specificity
Area under ROC curve = 0.7108

272
7.4.6 Intention to return in the future
Respondents were asked to rate the likelihood that they would return to donate within the
six months following the survey, which corresponds to the “Follow-up Period 2” in the
timeline reproduced below.
Figure 45: Timeline for deferral, survey and follow-up periods for study Thirty seven respondents (5.2%) declined to answer the question, and a summary of the
proportions of those who did respond is shown in Table 108. The majority of donors stated
they were very likely to return: however there were over one quarter of respondents who
indicated they were either undecided about their intention, or believed they were very or
somewhat unlikely to return.
Table 108: Intention to return within next 6 months LIKELIHOOD OF RETURN (N=672)
n % Very unlikely 58 8.6 Somewhat unlikely 46 6.9 Somewhat likely 82 12.2 Very likely 404 60.1 Undecided 82 12.2
Donors were asked to indicate the reason for being somewhat unlikely, very unlikely, or
undecided as to whether they would return. Donors who were “very unlikely” to return
(n=58) most commonly said that they were ineligible due to reasons other than their low
haemoglobin (47.4%), had been advised not to donate by a medical practitioner (15.8%), or
their levels were still low (14.0%) (see Table 109).

273
Table 109: Reason given for being “very unlikely” to return REASONS N=58 EXAMPLES
n %†
Ineligible (other reasons) 27 47.4 I'm currently 6 months pregnant
GP or specialist advice 9 15.8 The haematologist recommended NOT to donate again
Ongoing iron/ Hb issues 8 14.0 Can't donate since I have low haemoglobin naturally
Inconvenience of donation 4 7.0 I am in Yr 12 and have final exams coming, I have no time because of study for it.
Discouraged by deferral / fear of subsequent deferral
3 5.3 I have been 3 times and each time told my level was too low!
Difficulty improving Hb due to lifestyle
2 3.5 Think I've reached my limit of donating. I have a good diet & I exercise but don't wish to take iron tablets
Bad experiences with donation 2 3.5 I tried 3 weeks ago...one arm bruised straight away when needle was inserted. Tried other arm but missed the vein.
No response given 2 3.5
Low Hb deferral since return 1 1.8 Failed with low haemoglobin again
† More than one response was possible
Those who indicated they were “somewhat unlikely” to return (n=46) most commonly
stated they had received advice from a medical practitioner that they should not return
(23.9%), that their iron levels were still low (21.7%), or that it was inconvenient for them to
donate (15.2%). A summary of all reasons for being “somewhat unlikely” to return is given
in Table 110.
Table 110: Reason given for being “somewhat unlikely” to return REASONS N=46 EXAMPLES
n %†
GP or specialist advice 11 23.9 GP has advised not to donate until further notice
Ongoing iron/ Hb issues 10 21.7 Knowing I am low in iron ... the chances of donating successfully are pretty slim
Inconvenience of donation 7 15.2 Haven't got the time. Times don't
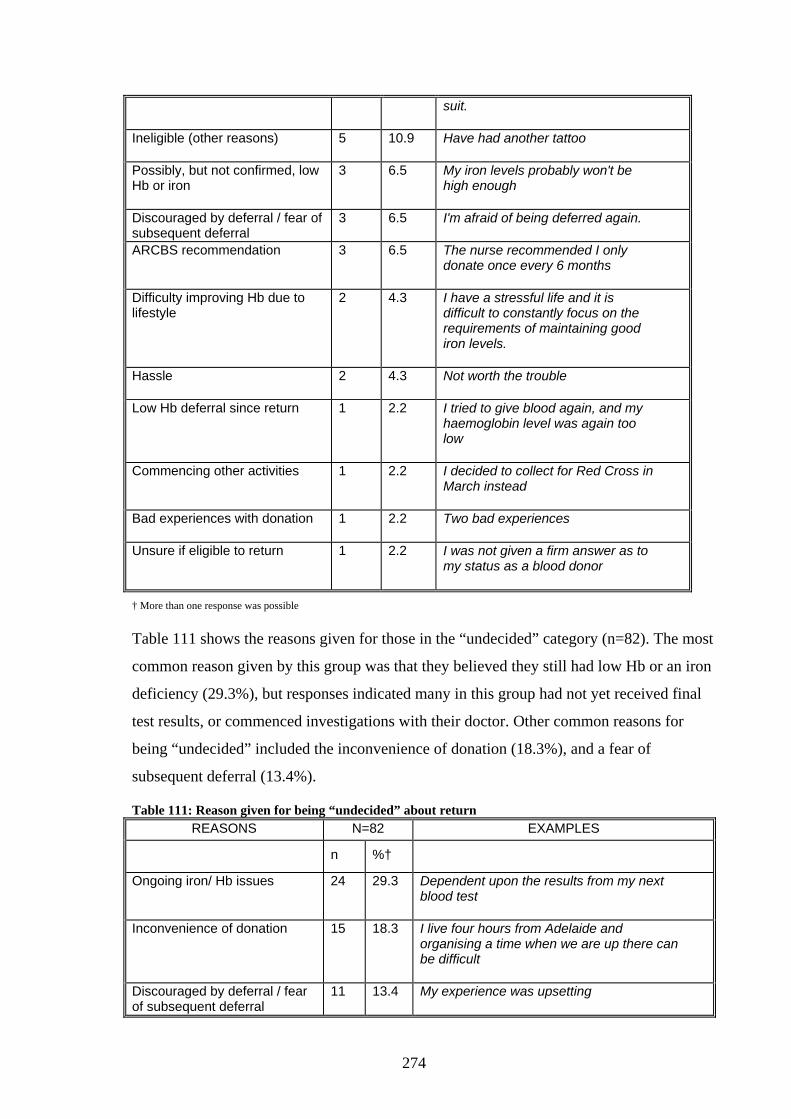
274
suit.
Ineligible (other reasons) 5 10.9 Have had another tattoo
Possibly, but not confirmed, low Hb or iron
3 6.5 My iron levels probably won't be high enough
Discouraged by deferral / fear of subsequent deferral
3 6.5 I'm afraid of being deferred again.
ARCBS recommendation 3 6.5 The nurse recommended I only donate once every 6 months
Difficulty improving Hb due to lifestyle
2 4.3 I have a stressful life and it is difficult to constantly focus on the requirements of maintaining good iron levels.
Hassle 2 4.3 Not worth the trouble
Low Hb deferral since return 1 2.2 I tried to give blood again, and my haemoglobin level was again too low
Commencing other activities 1 2.2 I decided to collect for Red Cross in March instead
Bad experiences with donation 1 2.2 Two bad experiences
Unsure if eligible to return 1 2.2 I was not given a firm answer as to my status as a blood donor
† More than one response was possible Table 111 shows the reasons given for those in the “undecided” category (n=82). The most
common reason given by this group was that they believed they still had low Hb or an iron
deficiency (29.3%), but responses indicated many in this group had not yet received final
test results, or commenced investigations with their doctor. Other common reasons for
being “undecided” included the inconvenience of donation (18.3%), and a fear of
subsequent deferral (13.4%).
Table 111: Reason given for being “undecided” about return REASONS N=82 EXAMPLES
n %†
Ongoing iron/ Hb issues 24 29.3 Dependent upon the results from my next blood test
Inconvenience of donation 15 18.3 I live four hours from Adelaide and organising a time when we are up there can be difficult
Discouraged by deferral / fear of subsequent deferral
11 13.4 My experience was upsetting
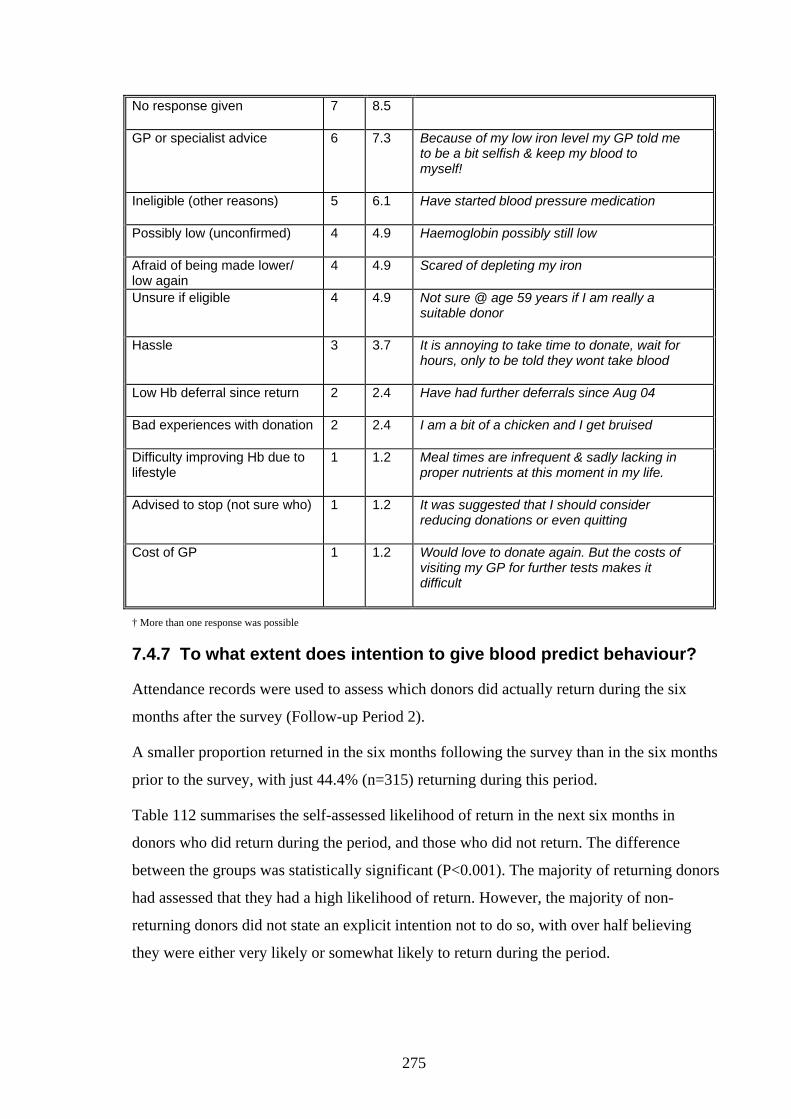
275
No response given 7 8.5
GP or specialist advice 6 7.3 Because of my low iron level my GP told me to be a bit selfish & keep my blood to myself!
Ineligible (other reasons) 5 6.1 Have started blood pressure medication
Possibly low (unconfirmed) 4 4.9 Haemoglobin possibly still low
Afraid of being made lower/ low again
4 4.9 Scared of depleting my iron
Unsure if eligible 4 4.9 Not sure @ age 59 years if I am really a suitable donor
Hassle 3 3.7 It is annoying to take time to donate, wait for hours, only to be told they wont take blood
Low Hb deferral since return 2 2.4 Have had further deferrals since Aug 04
Bad experiences with donation 2 2.4 I am a bit of a chicken and I get bruised
Difficulty improving Hb due to lifestyle
1 1.2 Meal times are infrequent & sadly lacking in proper nutrients at this moment in my life.
Advised to stop (not sure who) 1 1.2 It was suggested that I should consider reducing donations or even quitting
Cost of GP 1 1.2 Would love to donate again. But the costs of visiting my GP for further tests makes it difficult
† More than one response was possible
7.4.7 To what extent does intention to give blood predict behaviour?
Attendance records were used to assess which donors did actually return during the six
months after the survey (Follow-up Period 2).
A smaller proportion returned in the six months following the survey than in the six months
prior to the survey, with just 44.4% (n=315) returning during this period.
Table 112 summarises the self-assessed likelihood of return in the next six months in
donors who did return during the period, and those who did not return. The difference
between the groups was statistically significant (P<0.001). The majority of returning donors
had assessed that they had a high likelihood of return. However, the majority of non-
returning donors did not state an explicit intention not to do so, with over half believing
they were either very likely or somewhat likely to return during the period.

276
Table 112: Comparison of self-assessed likelihood of return, and actual return during follow-up period 2 LIKELIHOOD OF RETURN
(N= 672) RETURNED DID NOT RETURN
n % n % Very unlikely 3 1.0 55 14.9 Somewhat unlikely 6 1.2 40 10.8 Somewhat likely 25 8.3 57 15.5 Very likely 285 85.2 146 39.6 Undecided 11 3.6 71 19.2
Logistic regression analysis was performed to estimate the relationship between actual
donation behaviour and the strength of the intention to return in the same time period.
Design variables were created to indicate whether or not the donor nominated each level of
intention. The likelihood of actual return increased as donors rated stronger intentions to
given blood during the period (see Table 113), however the likelihood of return did not
significantly differ between the lowest assessment (“very unlikely”) and “somewhat
unlikely” or “undecided”. Based on this analysis, it was decided to perform further analysis
on intention to return based on three ordinal categories: “very likely”, “somewhat likely”,
and “less likely”, a category encompassing the three lower assessments.
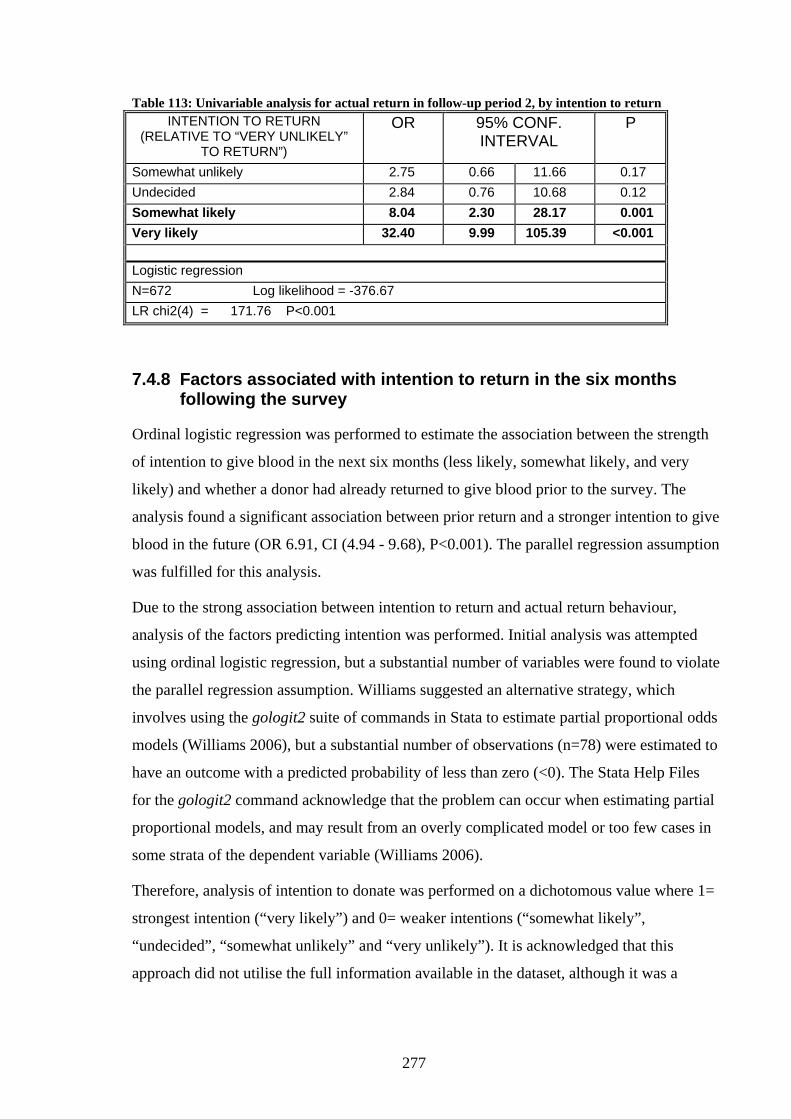
277
Table 113: Univariable analysis for actual return in follow-up period 2, by intention to return INTENTION TO RETURN
(RELATIVE TO “VERY UNLIKELY” TO RETURN”)
OR 95% CONF. INTERVAL
P
Somewhat unlikely 2.75 0.66 11.66 0.17 Undecided 2.84 0.76 10.68 0.12 Somewhat likely 8.04 2.30 28.17 0.001 Very likely 32.40 9.99 105.39 <0.001 Logistic regression N=672 Log likelihood = -376.67 LR chi2(4) = 171.76 P<0.001
7.4.8 Factors associated with intention to return in the six months following the survey
Ordinal logistic regression was performed to estimate the association between the strength
of intention to give blood in the next six months (less likely, somewhat likely, and very
likely) and whether a donor had already returned to give blood prior to the survey. The
analysis found a significant association between prior return and a stronger intention to give
blood in the future (OR 6.91, CI (4.94 - 9.68), P<0.001). The parallel regression assumption
was fulfilled for this analysis.
Due to the strong association between intention to return and actual return behaviour,
analysis of the factors predicting intention was performed. Initial analysis was attempted
using ordinal logistic regression, but a substantial number of variables were found to violate
the parallel regression assumption. Williams suggested an alternative strategy, which
involves using the gologit2 suite of commands in Stata to estimate partial proportional odds
models (Williams 2006), but a substantial number of observations (n=78) were estimated to
have an outcome with a predicted probability of less than zero (<0). The Stata Help Files
for the gologit2 command acknowledge that the problem can occur when estimating partial
proportional models, and may result from an overly complicated model or too few cases in
some strata of the dependent variable (Williams 2006).
Therefore, analysis of intention to donate was performed on a dichotomous value where 1=
strongest intention (“very likely”) and 0= weaker intentions (“somewhat likely”,
“undecided”, “somewhat unlikely” and “very unlikely”). It is acknowledged that this
approach did not utilise the full information available in the dataset, although it was a

278
reasonable approach given the difficulties in estimating the ordinal logistic regression
model, and allowed for easier interpretation than a multinomial logistic regression model.
7.4.8.1 Univariable analysis
Following the techniques used to model return prior to the survey (see section 7.4.4),
univariable analysis was performed on variables in four categories described earlier: those
relating to demographics and donation history; those relating to the deferral experience;
those relating to the experience seeking further investigations; and additional factors.
Variables with a univariable test P value of <0.25 were selected as candidates in the
multivariable model (Hosmer and Lemeshow 2000). Following the fit of the preliminary
multivariable model, variables with a test P value of <0.05 were retained into the final
model.
The results of the univariable analysis of demographic and donation characteristics are
presented in Table 114, aspects of the deferral experience in Table 115, of seeking further
investigations Table 116, and other factors in Table 117, with the variables with a global P
value of <0.25 shown in bold.
Table 114: Univariable logistic regression models for intention to return, demographic and donation characteristics
VARIABLE OR 95% CONF. INTERVAL P Age (n=672) 0.13
<25 25-34 0.94 0.54 1.64 0.82 35-44 1.13 0.71 1.79 0.61 45-54 1.53 0.96 2.43 0.08 55-64 1.86 1.06 3.25 0.03 65+ 1.31 0.66 2.63 0.44
Male (relative to female) (n=672) 1.49 0.95 2.35 0.08 New donor (relative to repeat) (n=672) 0.23 0.13 0.41 <0.001 Recent donation history (n=672) 0.006
New donor 0 donation prior 2.31 1.11 4.84 0.03 1 donation prior 3.10 1.60 5.99 0.001 2 donations prior 5.06 2.60 9.82 <0.001 3 donations prior 6.27 3.23 12.14 <0.001 4 donations prior 4.81 2.44 9.48 <0.001 5+ donations prior 8.85 1.67 46.97 0.01

279
Number of donations (n=672) <0.001
New donor 1 or 2 donations 2.33 1.26 4.30 0.07 3 to 10 donations 3.25 1.85 5.71 <0.001 11 to 20 donations 4.00 2.10 7.64 <0.001 21 to 49 donations 3.55 1.89 6.68 <0.001 50+ donations 3.35 1.66 6.78 <0.001 Not sure 3.76 1.34 10.52 0.01
Length of donation history (n=672) <0.001 New donor Less than one year 3.13 1.40 7.00 0.005 1 to less than 3 years 4.10 2.15 7.79 <0.001 3 to less than 10 years 4.97 2.61 9.48 <0.001 10 years or longer 4.59 2.44 8.64 <0.001 Not sure 3.61 1.49 8.75 0.004
Previously deferred for low Hb* (self-reported) (n=612)
0.76 0.53 1.08 0.13
Previously deferred for other reason* (self-reported) (n=612)
0.93 0.59 1.46 0.74
Univariable (simple) logistic regression * for repeat donors only 1/0 coding of all categories reflects whether or not the donor responded (or was coded) affirmatively in category (missing responses not analysed)
Table 115: Univariable logistic regression models for intention to return, aspects of the deferral experience
OR 95% CONF. INTERVAL
P
Further testing performed by ARCBS (n=652) 0.97 0.66 1.44 0.90 Reasons for low Hb discussed (n=646) 1.43 0.99 2.07 0.06 Increasing dietary iron discussed (n=645) 1.29 0.89 1.85 0.18 Explanation of deferral clear (n=666) 1.70 0.94 3.06 0.08 Dissatisfied with care (n=662) 0.64 0.37 1.12 0.12 Dissatisfied with explanation/ advice (n=644) 0.58 0.35 0.95 0.03
Given brochures (n=644) 1.34 0.96 1.88 0.09 Negative emotional response (n= 672) 1.01 0.72 1.42 0.94 Univariable (simple) logistic regression 1/0 coding of all categories reflects whether or not the donor responded (or was coded) affirmatively in category (missing responses not analysed)

280
Table 116: Univariable logistic regression models for intention to return, seeking further investigations OR 95% CONF.
INTERVAL P
Saw GP (relative to those who did not) (n=672) 0.95 0.65 1.40 0.81
Time taken to see GP* (n=516) 0.30
Less than one month 1 to less than 3 months 0.68 0.44 1.05 0.08 3 to less than 6 months 0.71 0.31 1.63 0.42 6+ months 0.69 0.24 1.93 0.47
Was referred to a specialist* (relative to those not referred) (n=531)
0.61 0.39 0.94 0.03
Confirmed low Hb level* (relative to those with normal Hb, not sure, not tested) (n=562)
0.85 0.60 1.22 0.38
* only for those who saw their GP Univariable (simple) logistic regression 1/0 coding of all categories reflects whether or not the donor responded (or was coded) affirmatively in category (missing responses not analysed)
Table 117: Univariable logistic regression models for intention to return, other factors OR 95% CONF.
INTERVAL P
Donor recalled being invited to return (n=667)
2.18 1.49 3.19 <0.001
Donor correctly recalled the duration of deferral (n=645)
1.42 1.04 1.96 0.03
Donor made changes since deferral (n=660)
1.48 1.00 2.19 0.05
Donor returned in first 6 months of being eligible to do so (n=672)
6.92 4.90 9.79 <0.001
Univariable (simple) logistic regression 1/0 coding of all categories reflects whether or not the donor responded (or was coded) affirmatively in category (missing responses not analysed)
7.4.8.2 Multivariable model predicting intention to return
Variables found to have a P value <0.25 in the univariable analysis were included in a
multivariable logistic regression model of intention to return. The first multivariable model
only included repeat donors, as it included the variable indicating whether they had been
previously deferred for low Hb, and those who saw their GP, as it included the variable
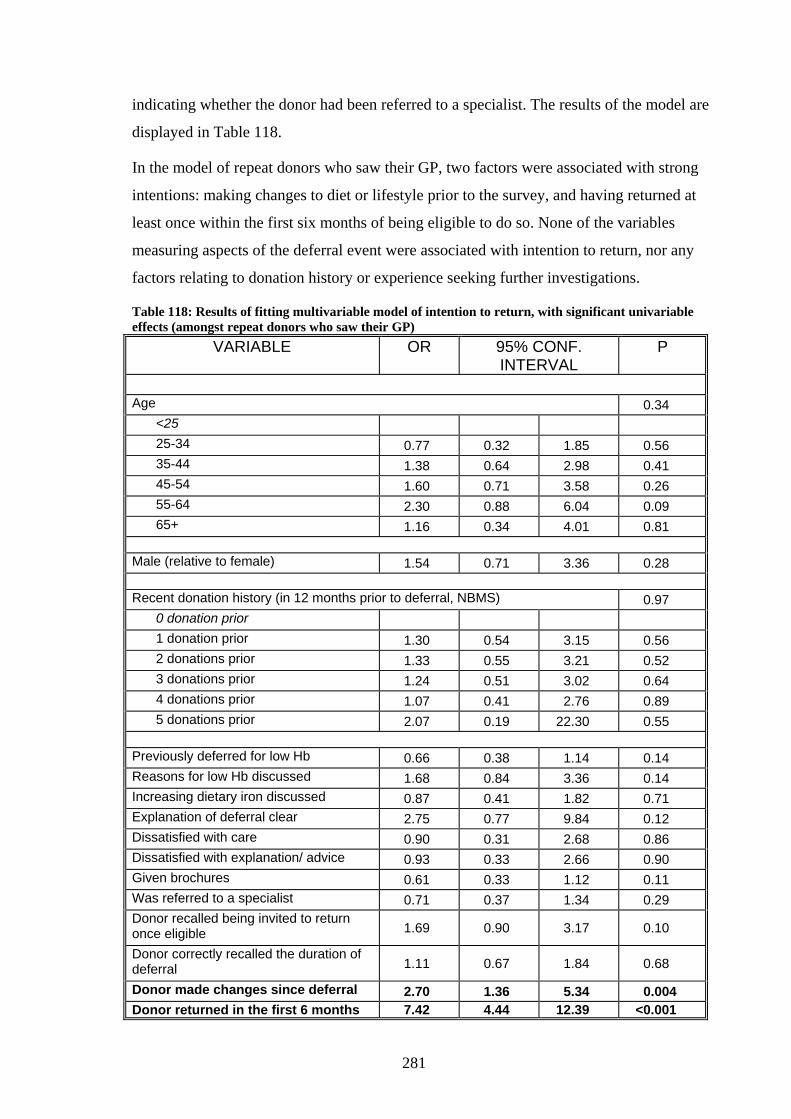
281
indicating whether the donor had been referred to a specialist. The results of the model are
displayed in Table 118.
In the model of repeat donors who saw their GP, two factors were associated with strong
intentions: making changes to diet or lifestyle prior to the survey, and having returned at
least once within the first six months of being eligible to do so. None of the variables
measuring aspects of the deferral event were associated with intention to return, nor any
factors relating to donation history or experience seeking further investigations.
Table 118: Results of fitting multivariable model of intention to return, with significant univariable effects (amongst repeat donors who saw their GP)
VARIABLE OR 95% CONF. INTERVAL
P
Age 0.34
<25 25-34 0.77 0.32 1.85 0.56 35-44 1.38 0.64 2.98 0.41 45-54 1.60 0.71 3.58 0.26 55-64 2.30 0.88 6.04 0.09 65+ 1.16 0.34 4.01 0.81
Male (relative to female) 1.54 0.71 3.36 0.28 Recent donation history (in 12 months prior to deferral, NBMS) 0.97
0 donation prior 1 donation prior 1.30 0.54 3.15 0.56 2 donations prior 1.33 0.55 3.21 0.52 3 donations prior 1.24 0.51 3.02 0.64 4 donations prior 1.07 0.41 2.76 0.89 5 donations prior 2.07 0.19 22.30 0.55
Previously deferred for low Hb 0.66 0.38 1.14 0.14 Reasons for low Hb discussed 1.68 0.84 3.36 0.14 Increasing dietary iron discussed 0.87 0.41 1.82 0.71 Explanation of deferral clear 2.75 0.77 9.84 0.12 Dissatisfied with care 0.90 0.31 2.68 0.86 Dissatisfied with explanation/ advice 0.93 0.33 2.66 0.90 Given brochures 0.61 0.33 1.12 0.11 Was referred to a specialist 0.71 0.37 1.34 0.29 Donor recalled being invited to return once eligible 1.69 0.90 3.17 0.10
Donor correctly recalled the duration of deferral 1.11 0.67 1.84 0.68
Donor made changes since deferral 2.70 1.36 5.34 0.004 Donor returned in the first 6 months 7.42 4.44 12.39 <0.001
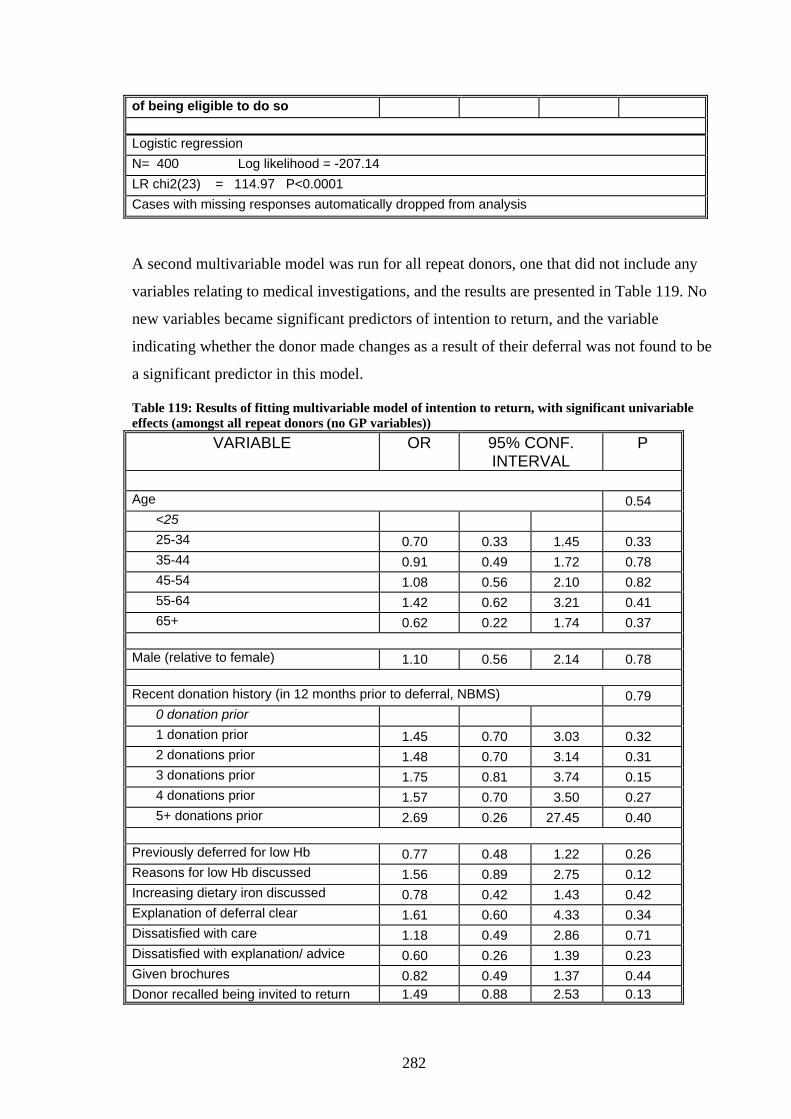
282
of being eligible to do so Logistic regression N= 400 Log likelihood = -207.14 LR chi2(23) = 114.97 P<0.0001 Cases with missing responses automatically dropped from analysis
A second multivariable model was run for all repeat donors, one that did not include any
variables relating to medical investigations, and the results are presented in Table 119. No
new variables became significant predictors of intention to return, and the variable
indicating whether the donor made changes as a result of their deferral was not found to be
a significant predictor in this model.
Table 119: Results of fitting multivariable model of intention to return, with significant univariable effects (amongst all repeat donors (no GP variables))
VARIABLE OR 95% CONF. INTERVAL
P
Age 0.54
<25 25-34 0.70 0.33 1.45 0.33 35-44 0.91 0.49 1.72 0.78 45-54 1.08 0.56 2.10 0.82 55-64 1.42 0.62 3.21 0.41 65+ 0.62 0.22 1.74 0.37
Male (relative to female) 1.10 0.56 2.14 0.78
Recent donation history (in 12 months prior to deferral, NBMS) 0.79 0 donation prior 1 donation prior 1.45 0.70 3.03 0.32 2 donations prior 1.48 0.70 3.14 0.31 3 donations prior 1.75 0.81 3.74 0.15 4 donations prior 1.57 0.70 3.50 0.27 5+ donations prior 2.69 0.26 27.45 0.40
Previously deferred for low Hb 0.77 0.48 1.22 0.26 Reasons for low Hb discussed 1.56 0.89 2.75 0.12 Increasing dietary iron discussed 0.78 0.42 1.43 0.42 Explanation of deferral clear 1.61 0.60 4.33 0.34 Dissatisfied with care 1.18 0.49 2.86 0.71 Dissatisfied with explanation/ advice 0.60 0.26 1.39 0.23 Given brochures 0.82 0.49 1.37 0.44 Donor recalled being invited to return 1.49 0.88 2.53 0.13
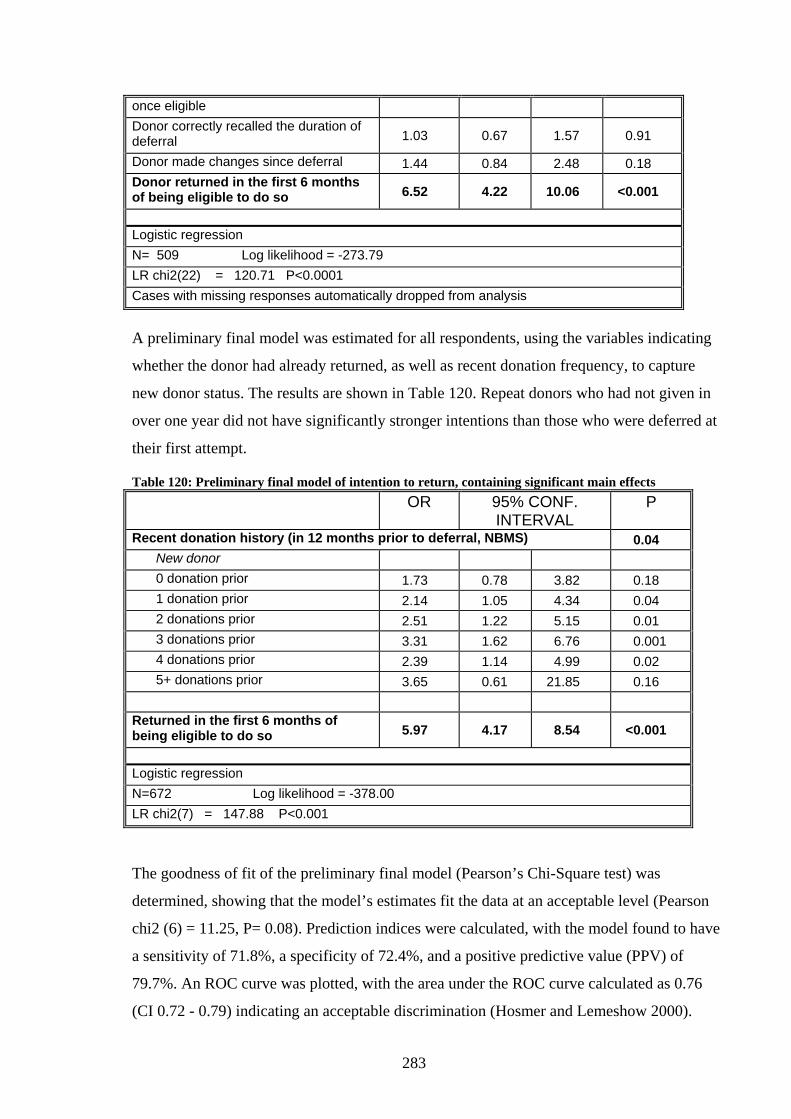
283
once eligible Donor correctly recalled the duration of deferral 1.03 0.67 1.57 0.91
Donor made changes since deferral 1.44 0.84 2.48 0.18 Donor returned in the first 6 months of being eligible to do so 6.52 4.22 10.06 <0.001
Logistic regression N= 509 Log likelihood = -273.79 LR chi2(22) = 120.71 P<0.0001 Cases with missing responses automatically dropped from analysis
A preliminary final model was estimated for all respondents, using the variables indicating
whether the donor had already returned, as well as recent donation frequency, to capture
new donor status. The results are shown in Table 120. Repeat donors who had not given in
over one year did not have significantly stronger intentions than those who were deferred at
their first attempt.
Table 120: Preliminary final model of intention to return, containing significant main effects OR 95% CONF.
INTERVAL P
Recent donation history (in 12 months prior to deferral, NBMS) 0.04 New donor 0 donation prior 1.73 0.78 3.82 0.18 1 donation prior 2.14 1.05 4.34 0.04 2 donations prior 2.51 1.22 5.15 0.01 3 donations prior 3.31 1.62 6.76 0.001 4 donations prior 2.39 1.14 4.99 0.02 5+ donations prior 3.65 0.61 21.85 0.16
Returned in the first 6 months of being eligible to do so 5.97 4.17 8.54 <0.001
Logistic regression N=672 Log likelihood = -378.00 LR chi2(7) = 147.88 P<0.001
The goodness of fit of the preliminary final model (Pearson’s Chi-Square test) was
determined, showing that the model’s estimates fit the data at an acceptable level (Pearson
chi2 (6) = 11.25, P= 0.08). Prediction indices were calculated, with the model found to have
a sensitivity of 71.8%, a specificity of 72.4%, and a positive predictive value (PPV) of
79.7%. An ROC curve was plotted, with the area under the ROC curve calculated as 0.76
(CI 0.72 - 0.79) indicating an acceptable discrimination (Hosmer and Lemeshow 2000).
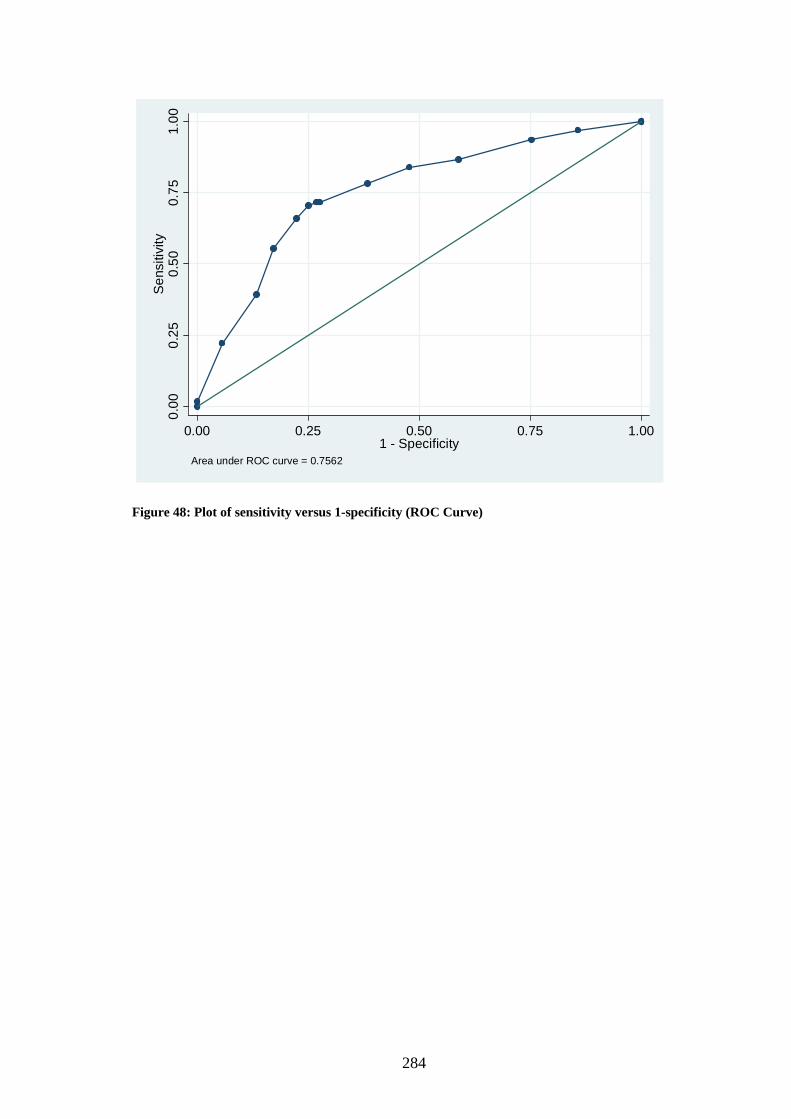
284
Figure 48: Plot of sensitivity versus 1-specificity (ROC Curve)
0.00
0.25
0.50
0.75
1.00
Sen
sitiv
ity
0.00 0.25 0.50 0.75 1.001 - Specificity
Area under ROC curve = 0.7562
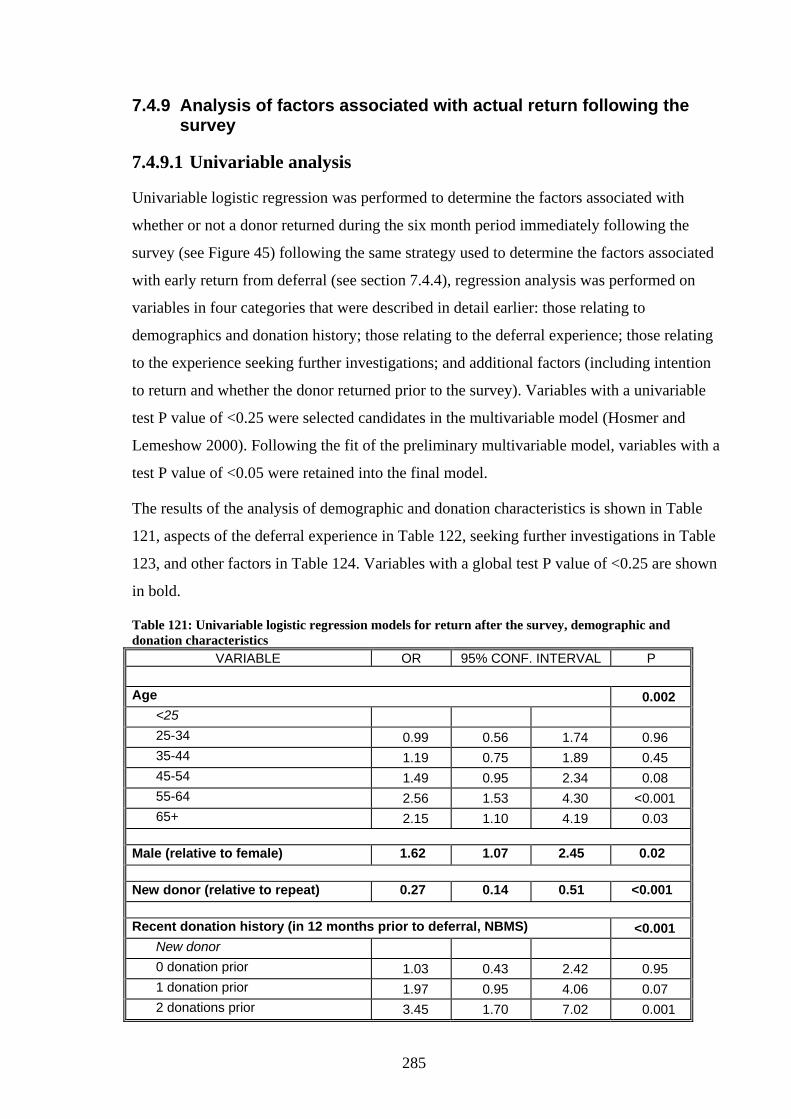
285
7.4.9 Analysis of factors associated with actual return following the survey
7.4.9.1 Univariable analysis
Univariable logistic regression was performed to determine the factors associated with
whether or not a donor returned during the six month period immediately following the
survey (see Figure 45) following the same strategy used to determine the factors associated
with early return from deferral (see section 7.4.4), regression analysis was performed on
variables in four categories that were described in detail earlier: those relating to
demographics and donation history; those relating to the deferral experience; those relating
to the experience seeking further investigations; and additional factors (including intention
to return and whether the donor returned prior to the survey). Variables with a univariable
test P value of <0.25 were selected candidates in the multivariable model (Hosmer and
Lemeshow 2000). Following the fit of the preliminary multivariable model, variables with a
test P value of <0.05 were retained into the final model.
The results of the analysis of demographic and donation characteristics is shown in Table
121, aspects of the deferral experience in Table 122, seeking further investigations in Table
123, and other factors in Table 124. Variables with a global test P value of <0.25 are shown
in bold.
Table 121: Univariable logistic regression models for return after the survey, demographic and donation characteristics
VARIABLE OR 95% CONF. INTERVAL P Age 0.002
<25 25-34 0.99 0.56 1.74 0.96 35-44 1.19 0.75 1.89 0.45 45-54 1.49 0.95 2.34 0.08 55-64 2.56 1.53 4.30 <0.001 65+ 2.15 1.10 4.19 0.03
Male (relative to female) 1.62 1.07 2.45 0.02 New donor (relative to repeat) 0.27 0.14 0.51 <0.001 Recent donation history (in 12 months prior to deferral, NBMS) <0.001
New donor 0 donation prior 1.03 0.43 2.42 0.95 1 donation prior 1.97 0.95 4.06 0.07 2 donations prior 3.45 1.70 7.02 0.001

286
3 donations prior 6.83 3.37 13.82 <0.001 4 donations prior 6.73 3.26 13.90 <0.001 5+ donations prior 9.92 2.23 44.07 0.003
Number of donations (ever made, self-reported) <0.001
New donor 1 or 2 donations 1.29 0.66 2.50 0.46 3 to 10 donations 2.69 1.49 4.87 0.001 11 to 20 donations 3.28 1.70 6.33 <0.001 21 to 49 donations 4.35 2.26 8.34 <0.001 50+ donations 6.98 3.39 14.40 <0.001 Not sure 1.75 0.64 4.79 0.28
Length of donation history (self-reported) 0.04
New donor Less than one year 1.31 0.53 3.22 0.56 1 to less than 3 years 3.29 1.64 6.60 0.001 3 to less than 10 years 4.30 2.14 8.62 <0.001 10 years or longer 5.19 2.62 10.29 <0.001 Not sure 2.13 0.85 5.31 0.11
Previously deferred for low Hb* (self-reported) (n=646)
0.89 0.63 1.24 0.48
Previously deferred for other reason* (self-reported) (n=646)
0.95 0.62 1.47 0.82
Univariable (simple) logistic regression * for repeat donors only 1/0 coding of all categories reflects whether or not the donor responded (or was coded) affirmatively in category (missing responses not analysed)

287
Table 122: Univariable logistic regression models for return after the survey, aspects of the deferral experience
OR 95% CONF. INTERVAL
P
Further testing performed by ARCBS (n=689) 0.94 0.65 1.36 0.74
Reasons for low Hb discussed (n=680) 1.24 0.86 1.78 0.25 Increasing dietary iron discussed (n=681) 1.53 1.06 2.21 0.022 Explanation of deferral clear (n=703) 1.66 0.91 3.04 0.098 Dissatisfied with care (n=699) 0.57 0.32 1.03 0.061 Dissatisfied with explanation/ advice (n=681) 0.78 0.47 1.28 0.33 Given brochures (n=679) 1.85 1.32 2.60 <0.001 Negative emotional response (n= 709) 0.99 0.72 1.37 0.97 Univariable (simple) logistic regression 1/0 coding of all categories reflects whether or not the donor responded (or was coded) affirmatively in category (missing responses not analysed)
Table 123: Univariable logistic regression models for return after the survey, seeking further investigations
OR 95% CONF. INTERVAL
P
Saw GP (relative to those who did not) (n=709)
1.08 0.75 1.56 0.67
Time taken to see GP* (n=546) 0.10
Less than one month 1 to less than 3 months 0.91 0.60 1.39 0.67 3 to less than 6 months 0.37 0.14 0.95 0.04 6+ months 0.51 0.17 1.48 0.21
Was referred to a specialist* (relative to those not referred) (n=562)
0.84 0.55 1.28 0.42
Confirmed low Hb level* (relative to those with normal Hb, not sure, not tested) (n=562)
0.95 0.67 1.32 0.75
* only for those who saw their GP Univariable (simple) logistic regression 1/0 coding of all categories reflects whether or not the donor responded (or was coded) affirmatively in category (missing responses not analysed)

288
Table 124: Univariable logistic regression models for return after the survey, other factors OR 95% CONF.
INTERVAL P
Donor recalled being invited to return (n=681)
1.87 1.27 2.76 0.002
Donor correctly recalled the duration of deferral (n=681)
1.66 1.22 2.25 0.001
Donor made changes since deferral (n=694)
1.19 0.81 1.75 0.37
Intention “very likely” to return (n=672)
8.76 6.00 12.79 <0.001
Donor returned in first 6 months of being eligible to do so (n=672)
8.61 6.08 12.19 <0.001
Univariable (simple) logistic regression 1/0 coding of all categories reflects whether or not the donor responded (or was coded) affirmatively in category (missing responses not analysed)
7.4.9.2 Multivariable model predicting return following the survey
Factors found to be associated with return within the six months following the survey in the
simple models (P<0.25) were included in the multivariable logistic regression model
(Hosmer and Lemeshow 2000). The results of the model for donors who saw their GP is
displayed in Table 125, and for all donors in Table 126.
Items significantly associated with return amongst donors who saw their GP (P<0.05) are
indicated in bold. There were three significant predictors of return during this period: the
frequency of donation in the year prior to deferral, whether the donor had already returned
prior to the survey, and whether the donor reported a strong intention to return during the
period.
Table 125: Results of fitting multivariable model of return following the survey, with significant univariable effects (amongst all donors who saw their GP)
VARIABLE OR 95% CONF. INTERVAL
P
Age 0.44
<25 25-34 1.12 0.47 2.64 0.80 35-44 1.03 0.50 2.10 0.94 45-54 1.36 0.66 2.80 0.40 55-64 2.32 0.96 5.59 0.06 65+ 1.42 0.43 4.65 0.56
Male (relative to female) 0.99 0.48 2.04 0.99

289
Recent donation history (in 12 months prior to deferral, NBMS) 0.004 New donor 0 donation prior 0.39 0.12 1.27 0.12 1 donation prior 0.60 0.22 1.62 0.32 2 donations prior 0.81 0.32 2.06 0.65 3 donations prior 1.97 0.77 5.07 0.16 4 donations prior 1.11 0.40 3.05 0.85 5+ donations prior 5.11 0.40 65.69 0.21
Increasing dietary iron discussed 0.95 0.51 1.80 0.89 Explanation of deferral clear 1.33 0.43 4.05 0.62 Dissatisfied with care 0.64 0.22 1.83 0.40 Given brochures 1.37 0.79 2.38 0.27 Time taken to see GP* (self-reported) 0.10
Less than one month 1 to less than 3 months 0.93 0.53 1.63 0.79 3 to less than 6 months 0.33 0.10 1.13 0.08 6+ months 0.25 0.05 1.25 0.09
Donor recalled being invited to return once eligible 1.24 0.67 2.30 0.49
Donor correctly recalled the duration of deferral 1.46 0.91 2.34 0.12
Intention “very likely” to return 4.10 2.45 6.87 <0.001 Donor returned in first 6 months of being eligible to do so 3.97 2.39 6.59 <0.001
Logistic regression N= 460 Log likelihood= -228.21 LR chi2(23) = 179.05 P<0.0001 Cases with missing responses automatically dropped from analysis
The results of the model that did not include variables relating to medical investigations
(e.g. time taken to see GP) were run for all donors, and the results are presented in Table
126. The same three variables remained significant predictors of return as were those in the
model of return amongst donors who saw their GP.
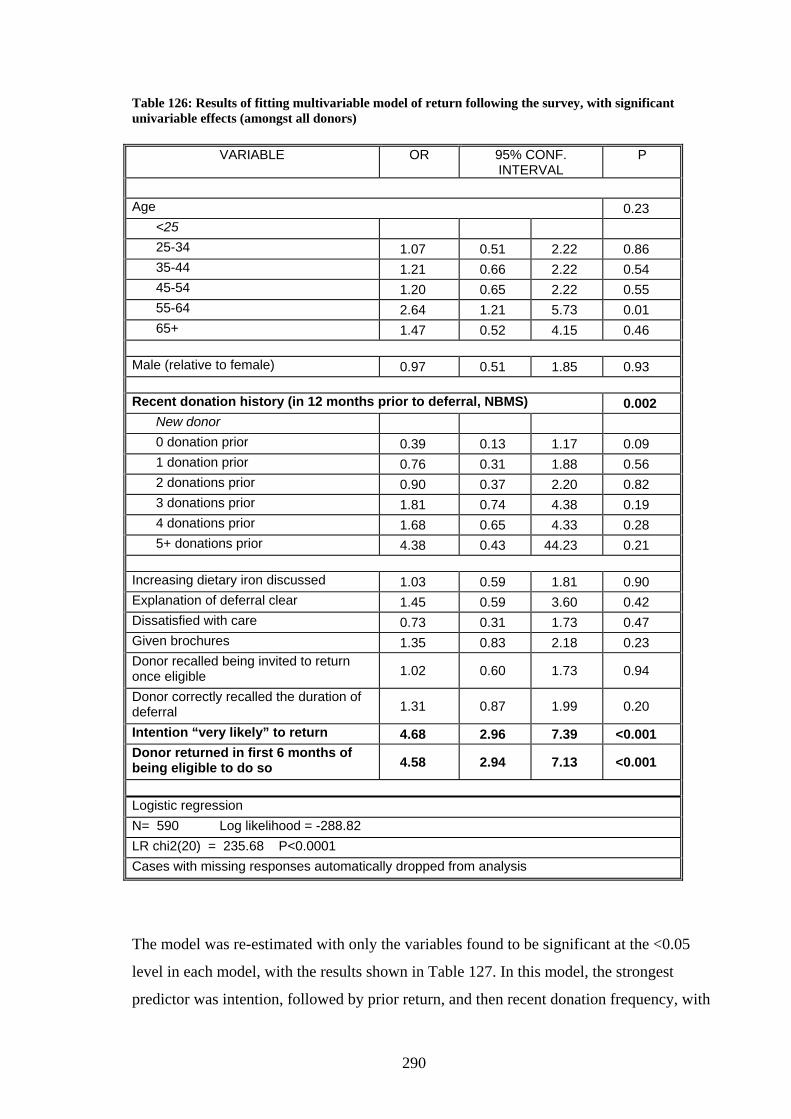
290
Table 126: Results of fitting multivariable model of return following the survey, with significant univariable effects (amongst all donors)
VARIABLE OR 95% CONF. INTERVAL
P
Age 0.23
<25 25-34 1.07 0.51 2.22 0.86 35-44 1.21 0.66 2.22 0.54 45-54 1.20 0.65 2.22 0.55 55-64 2.64 1.21 5.73 0.01 65+ 1.47 0.52 4.15 0.46
Male (relative to female) 0.97 0.51 1.85 0.93
Recent donation history (in 12 months prior to deferral, NBMS) 0.002 New donor 0 donation prior 0.39 0.13 1.17 0.09 1 donation prior 0.76 0.31 1.88 0.56 2 donations prior 0.90 0.37 2.20 0.82 3 donations prior 1.81 0.74 4.38 0.19 4 donations prior 1.68 0.65 4.33 0.28 5+ donations prior 4.38 0.43 44.23 0.21
Increasing dietary iron discussed 1.03 0.59 1.81 0.90 Explanation of deferral clear 1.45 0.59 3.60 0.42 Dissatisfied with care 0.73 0.31 1.73 0.47 Given brochures 1.35 0.83 2.18 0.23 Donor recalled being invited to return once eligible 1.02 0.60 1.73 0.94
Donor correctly recalled the duration of deferral 1.31 0.87 1.99 0.20
Intention “very likely” to return 4.68 2.96 7.39 <0.001 Donor returned in first 6 months of being eligible to do so 4.58 2.94 7.13 <0.001
Logistic regression N= 590 Log likelihood = -288.82 LR chi2(20) = 235.68 P<0.0001 Cases with missing responses automatically dropped from analysis
The model was re-estimated with only the variables found to be significant at the <0.05
level in each model, with the results shown in Table 127. In this model, the strongest
predictor was intention, followed by prior return, and then recent donation frequency, with

291
the effect most apparent amongst those who had given at least three donations prior to
deferral.
Table 127: First preliminary final model of return following the survey, containing significant main effects
OR 95% CONF. INTERVAL
P
Recent donation history (in 12 months prior to deferral, NBMS) <0.001New donor 0 donation prior 0.54 0.20 1.46 0.23 1 donation prior 0.93 0.40 2.20 0.87 2 donations prior 1.19 0.51 2.76 0.69 3 donations prior 2.61 1.13 6.00 0.02 4 donations prior 2.61 1.10 6.23 0.03 5+ donations prior 5.47 0.67 44.99 0.11
“Very likely” to return 5.14 3.37 7.82 <0.001 Returned in the first 6 months of being eligible to do so 4.56 3.06 6.82 <0.001
Logistic regression N=672 Log likelihood = -332.58 LR chi2(8) = 259.95 P<0.001
The goodness of fit of the preliminary final model (Pearson’s Chi-Square test) was
determined, showing that the model’s estimates were a good fit for the data (Pearson chi2,
17 d.f. = 18.01, P= 0.39). The model had a sensitivity of 78.2%, a specificity of 75.6%, a
PPV of 72.5%. The ROC curve is shown in Figure 49, with the area under the ROC
calculated as 0.84 (CI 0.81- 0.87), indicating excellent discrimination (Hosmer and
Lemeshow 2000).
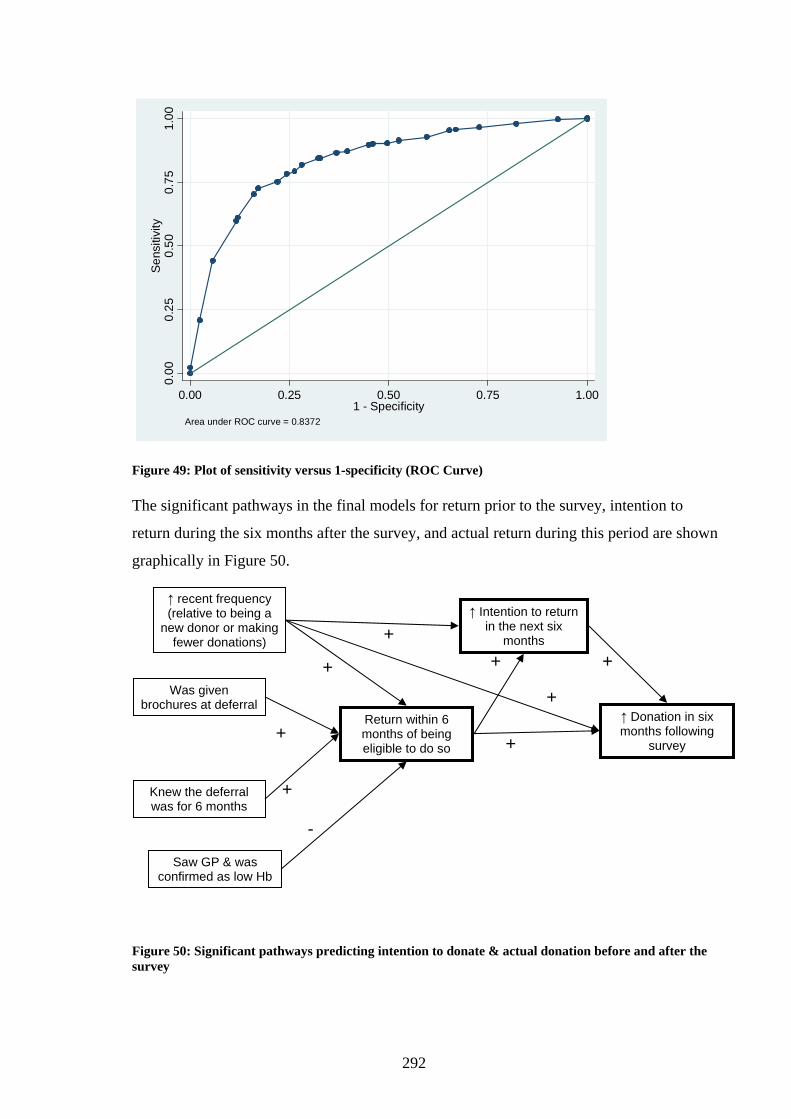
292
Figure 49: Plot of sensitivity versus 1-specificity (ROC Curve) The significant pathways in the final models for return prior to the survey, intention to
return during the six months after the survey, and actual return during this period are shown
graphically in Figure 50.
Figure 50: Significant pathways predicting intention to donate & actual donation before and after the survey
0.00
0.25
0.50
0.75
1.00
Sen
sitiv
ity
0.00 0.25 0.50 0.75 1.001 - Specificity
Area under ROC curve = 0.8372
↑ Intention to return in the next six
months
Return within 6 months of being eligible to do so
↑ Donation in six months following
survey
+ +
↑ recent frequency (relative to being a
new donor or making fewer donations)
Saw GP & was confirmed as low Hb
-
Was given brochures at deferral
+
Knew the deferral was for 6 months
+
+
+ + +
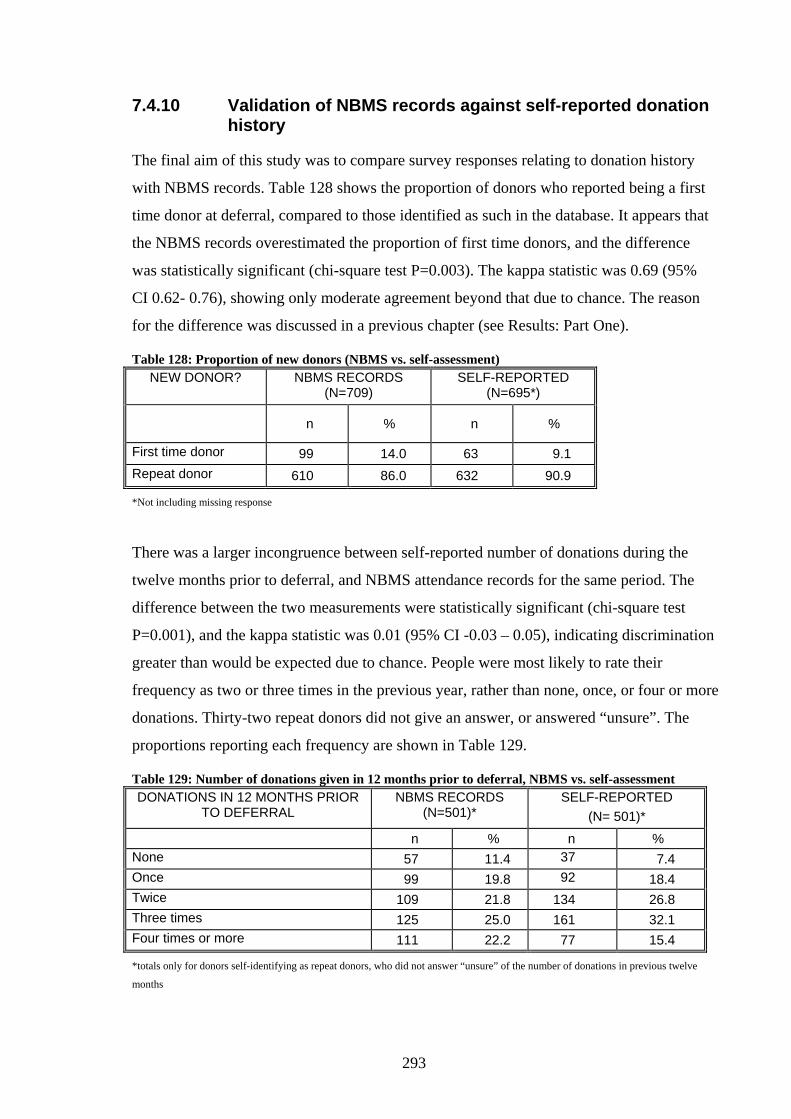
293
7.4.10 Validation of NBMS records against self-reported donation history
The final aim of this study was to compare survey responses relating to donation history
with NBMS records. Table 128 shows the proportion of donors who reported being a first
time donor at deferral, compared to those identified as such in the database. It appears that
the NBMS records overestimated the proportion of first time donors, and the difference
was statistically significant (chi-square test P=0.003). The kappa statistic was 0.69 (95%
CI 0.62- 0.76), showing only moderate agreement beyond that due to chance. The reason
for the difference was discussed in a previous chapter (see Results: Part One).
Table 128: Proportion of new donors (NBMS vs. self-assessment) NEW DONOR? NBMS RECORDS
(N=709) SELF-REPORTED
(N=695*)
n % n %
First time donor 99 14.0 63 9.1 Repeat donor 610 86.0 632 90.9
*Not including missing response
There was a larger incongruence between self-reported number of donations during the
twelve months prior to deferral, and NBMS attendance records for the same period. The
difference between the two measurements were statistically significant (chi-square test
P=0.001), and the kappa statistic was 0.01 (95% CI -0.03 – 0.05), indicating discrimination
greater than would be expected due to chance. People were most likely to rate their
frequency as two or three times in the previous year, rather than none, once, or four or more
donations. Thirty-two repeat donors did not give an answer, or answered “unsure”. The
proportions reporting each frequency are shown in Table 129.
Table 129: Number of donations given in 12 months prior to deferral, NBMS vs. self-assessment DONATIONS IN 12 MONTHS PRIOR
TO DEFERRAL NBMS RECORDS
(N=501)* SELF-REPORTED
(N= 501)* n % n % None 57 11.4 37 7.4 Once 99 19.8 92 18.4 Twice 109 21.8 134 26.8 Three times 125 25.0 161 32.1 Four times or more 111 22.2 77 15.4
*totals only for donors self-identifying as repeat donors, who did not answer “unsure” of the number of donations in previous twelve
months

294
7.5 Summary of results
This section is a brief summary of the most important findings of the study, related to the
aims stated at the beginning of the chapter.
Aim 1: to explore recollections of the deferral event
Most respondents appeared to be happy with their experience of deferral; however a small
but substantial proportion would have preferred differences in the explanation and care
provided. The majority reported a negative emotional response to deferral. Respondents
were more likely to believe deferral was motivated by a concern for their own health, or
due to the relatively high minimum Hb levels set by the ARCBS, than by concerns about
the transfusion recipient. Nearly four in ten were not able to accurately recall the length of
the deferral period.
Aim 2: to explore interactions with health professionals following deferral
The majority of donors saw their GP, with younger donors and those deferred on a previous
occasion less likely to do so. The majority had further testing performed, with nearly one
quarter of those having blood tests found to have normal Hb levels. Nearly half of those
seeking further investigations were told to take iron supplements, and over a third to make
changes to their diet. Nearly 20% were referred to a medical specialist, and 21 respondents
reported serious medical conditions were discovered as a result of these investigations.
Aim 3: to record intentions to return in the six months following the survey
Most donors believed they were “very likely” to return during this period (60.1%) although
a substantial proportion believed they were unlikely to do so. Those “very unlikely” to
return were most commonly ineligible for other reasons, while those who were “somewhat
unlikely”, or “undecided” commonly had confirmed or suspected ongoing issues with their
Hb level. A substantial proportion in all three groups had been advised to delay return by a
medical practitioner.
Aim 4: to measure the relationship between return prior to the survey (within six
months of being eligible to return) and predictor variables
Four variables were associated with return during this period: an increased likelihood of
return for donors who were given brochures at the deferral event, who were able to
295
correctly recall the duration of the deferral period, or who had made at least two donations
in the year prior to deferral; and a decreased likelihood amongst those who had their
haemoglobin level confirmed as low when they saw their GP.
Aim 5: to measure the relationship between intention to return (in the six months
following the survey) and predictor variables
Having the strongest intention to return (believing it “very likely” that they would come
back) was associated with only two factors: having already returned at least once before the
survey, and having made more donations in the year prior to deferral.
Aim 6: to measure the relationship between return in the six months following the
survey and predictor variables (including intention to return during the period)
Intentions were significantly associated with actual return following the survey. Additional
predicting variables included whether a respondent had already returned prior to the survey
and a higher donation frequency in the year before deferral.
Aim 7: to validate some fields of NBMS data of donation history
Self-assessed and NBMS derived classifications of first time donor status were significantly
different, as were recollections of the number of donations in the year prior to deferral
compared to NMBS records of attendance.
7.6 Discussion
The research described in this chapter aimed to describe the experience of temporary
deferral from a donor’s perspective, and this had not been attempted in previous studies of
donor return. The study explored whether aspects of the deferral experience, or donors’
experience seeking further investigations, were associated with whether the donor was
likely to return once eligible.
This research is the first study that has attempted to determine donors’ understanding of the
reason for their temporary deferral. The ARCBS sets minimum acceptance levels for whole
blood donation based on the Council of Europe (12th Ed.) Guide to the Preparation, Use
and Quality Assurance of Blood Components (Council of Europe 2006), with the rationale
of protecting donors’ health. Approximately one in four reported understanding the deferral
to be about protecting their own health. A substantial proportion (17.6%) noted that their
Hb levels didn’t meet the requirements of the ARCBS, with some also recognising that
296
their level was not low according to population norms, or at a level critically low for their
own wellbeing. A small proportion (7%) thought their deferral was due to concerns about
suitability of their donation for transfusion, and these donors tended to use quite negative
language (such as “blood wasn’t good enough” and “poor quality blood”). Relatively few
(n=20) gave a reason that appeared to be incorrect. Several donors displayed an awareness
that the ARCBS had recently increased the minimum acceptable levels, and that they were
no longer able to satisfy the new requirements.
This study found that a higher proportion of donors sought further investigations than had
been reported by other studies in the literature. One US study found that just 18% of donors
deferred due to an irregular pulse or cardiovascular symptoms sought further investigations
(Blumberg, Shah et al. 1982), while another US study reported 60% of those given
counselling following low hematocrit deferral sought further investigations (vs. 25% of
those given a standard deferral explanation) (Falter and Reiss 1981). These reports do not
state the length of the deferral periods, although many US blood services currently apply
shorter deferral periods than the ARCBS (personal communication with Brian Custer,
Blood Centres of the Pacific). It is possible that donors perceive the six month deferral
period as a strong message that their low Hb concentration may have negative implications
for their health, and are accordingly more likely to seek further advice and investigations
from a medical provider. It is also possible that the ARCBS more strongly encourages
donors to seek investigations than the blood services in those studies, and that the
Australian health system, with supportive characteristics such as bulk billing, minimises the
personal costs associated with pursuing investigations.
The overwhelming majority of those consulting their GP had further tests performed (most
commonly a blood test), and while most had their low Hb level confirmed, nearly a quarter
found their levels were normal at the time of the tests. There are three likely reasons: first,
the time lag between deferral and subsequent tests, in which time the levels may have
increased; second, because donors may have been unable to distinguish between the
haemoglobin and other test results (such as ferritin concentration); and third, that the
ARCBS deferral threshold is set at the lower end of the population norm, meaning that an
individual can have a normal haemoglobin concentration and still be below the acceptable
range for donation. Whatever the reason, the difference in test results is likely to lead to
confusion and distress for the donor, and perhaps distrust in the screening methods used by
the ARCBS. For example, one donor wrote:
297
Maybe you need to get to the root of the reason why the tests done by Red Cross
and those done by the other pathological laboratories differ (Female, 40, first time
donor)
Further investigation is required to explore how donors responded to differing test results.
An important finding of this research was the identification of a substantial number of
donors found to have an underlying condition during follow-up testing. Information about
donors’ illness is not routinely gathered by the ARCBS, and the organisation would only be
aware of conditions contributing to low Hb if the donor, or their medical practitioner,
notified the organisation. To the author’s knowledge, this research is the first time the
proportion of donors found to have an underlying medical condition has been quantified.
The results of this study show that at least 3% of those deferred for low Hb (and 19% of
those who saw a medical specialist) were diagnosed with a serious illness during the course
of investigations into the cause of low Hb.
As noted earlier in the chapter, the 21 clear cases of diagnosed medical conditions are likely
to be an underestimate of the actual disease in the cohort. There are several reasons for this.
First, the questionnaire did not specifically ask whether medical investigations identified
conditions, nor the “outcomes” of any tests. While some donors revealed this information
when they outlined what happened when they visited a specialist, others simply volunteered
they had a colonoscopy performed without listing the result. Therefore, it is possible that
more donors who saw a specialist had underlying conditions detected, but did not volunteer
this information. A question specifically asking about underlying conditions was included
in the 3ML (reported in the previous chapter). Second, those who were seriously ill or
deceased at the time of the survey would not have been able to participate. Third, 21% of
donors did not visit a GP, and a small proportion of those who did see their GP had no
further tests (including blood tests) performed. These donors may have had an undetected
medical condition. Unsworth and colleagues found that 4.6% of a sample of anaemic UK
donors had coeliac disease, and the majority of this group (14 out of 22 donors) had no
further tests performed when they consulted their GP following deferral (Unsworth, Lock et
al. 2000).
It is not suggested, however, that all donors should have invasive medical investigations
following deferral. Indeed, considering the numbers in a different way, up to 4 out of 5
donors who saw a specialist did not report any underlying conditions, suggesting many

298
donors underwent unnecessary investigations at the cost of considerable stress, discomfort
and inconvenience, and possibly at their own personal expense.
Like the other studies reported in this thesis, this study confirms that low Hb levels are a
chronic issue for many blood donors, with nearly one in three deferred donors reporting
that they had been deferred for low Hb on a previous occasion. While it seems reasonable
to assume that donors who face repeat deferrals may stop presenting altogether (Newman
2004), this research did not find this to be the case, with those previously deferred for low
Hb no more or less likely to return than those deferred for the first time. It is possible that
there is a group who are discouraged by their multiple deferrals, but their non-return is
hidden by the presence of a group of strongly committed donors, who had already shown
their willingness and ability to return by presenting at least once following their previous
deferral. There is evidence that patience in the face of repeat deferral is finite, and this is
particularly true for those deferred at their first attempts at donation. One donor, who had
been deferred at each of his two donation attempts, wrote:
“2 Times I have been deferred. 2 Times I have been to see my doctor for tests only
to be told that there is nothing wrong with me. This is quite upsetting so the next
time I go to give blood and are deferred- for the Red Cross Blood Service it will be
3 strikes and your are out” (Male, 63, 1-2 donations)
Though univariable analysis found several factors relating to the deferral experience
predicted return within six months of being eligible to do so, just one factor predicted return
in the multivariable analysis: whether the donor received brochures. This finding was
unexpected, particularly as a group has previously shown that brochures did not
significantly increase the likelihood of return amongst deferred donors (Gimble, Kline et al.
1994). The brochures are available for all donors deferred for a low Hb, but the findings in
other phases of this research show that many donors do not receive them. It may be that
those with the strongest interest in returning may have requested further information about
improving their Hb concentrations, and were correspondingly given the brochures. Another
possible explanation is that if donors were provided with written materials without
specifically requesting them, they perceived the deferral event as an opportunity to learn
more about their health (and therefore somewhat rewarding), as well as a confirmation that
the ARCBS not only cared about their health and wellbeing, but wished for them to
improve their levels so they could continue to donate in the future.

299
The finding that those who could accurately report the duration of the deferral period were
more likely to return promptly may be a consequence of a clearer explanation at the deferral
event, or alternatively may indicate that those with higher levels of commitment to the
activity more readily remembered the details relating to their eligibility to return. Another
explanation may be recall bias, in that donors who had re-engaged with the blood service
prior to the survey more accurately recalled aspects of the interactions.
A reduced likelihood of prompt return amongst new donors reflects findings at other phases
of this research and in the literature (e.g. Custer, Chinn et al. 2007). A finding not
previously identified in the literature was that those with lower donation frequencies prior
to their deferral were no more likely to return promptly than those who were deferred at
their first attempt. Similar findings were also reported in the AR (see Results: Part One),
which found similarities between the donation patterns of new donors and repeat donors
who had not given blood in the year prior to deferral.
The final predictor of return in the multivariable model was whether the donor had their Hb
concentration confirmed by their doctor. Donors who were found to have normal Hb levels
had effectively been cleared to return by their doctor, and would have been confident that
they would meet the acceptance criteria when they returned. Conversely, those with
confirmed low levels would have avoided returning if they suspected their Hb levels were
still too low to give blood.
This study was able to determine the extent to which non-return is planned. The findings
presented in this chapter show that donors have a tendency to rate their chance of future
donation favourably, and need to have a specific reason to be undecided about their
prospects for future donation, let alone report with certainty that they would not return.
They also show that most of the non-return amongst low Hb deferred donors is not planned.
More than half of those who did not return in the six months following the survey thought
themselves somewhat or very likely to donate. However, if donors rated a low likelihood of
future return, more often than not they did not come back. For the most part, these donors
indicated the decision to return was beyond their control. Many had been advised not to
return by their doctor, or had ongoing problems with their iron levels, and several indicated
they had been deferred a second time prior to being surveyed. Others were ineligible to
return for reasons unrelated to their low haemoglobin. However, one in ten donors who did
not believe they would return stated that they had been discouraged by their donation or
were afraid of a subsequent deferral.

300
The only variables found to be associated with strong intentions in this study were related
to donation experience: those who had given more donations in the recent past had
significantly stronger intentions to return than those deferred at their first attempt, as did
those who had already returned at least once since their deferral. Intentions to return were
not significantly different between those deferred at their first attempt and repeat donors
who had not given blood in over a year. None of the factors related to the deferral event or
the seeking of further investigation were associated with intentions in the multivariable
analysis. Intention was the strongest predictor of return following the survey.
Taken as a whole, the results presented in this chapter highlight the importance of past
behaviour in predicting future donation behaviour, influencing both resilience from a
temporary deferral, and the likelihood of return during a later time period. Past behaviour
was seen to influence future behaviour in its own right, as well as through increasing
favourable intentions to return. The importance of past behaviour may reflect a number of
explanations, which were already discussed in the AR (see Results: Part One): stronger
habits, the better fit within a donor’s life, and a stronger blood donor role identity, though
the results of the 3ML do not support the latter explanation, at least in the way role identity
has traditionally been conceptualised in blood donor research (see Results: Part Three).
While the majority of respondents indicated they were satisfied with all aspects of the
deferral event, a small but substantial group of donors reported they would have preferred
aspects of their care, and the explanation and advice received at deferral, to have been
carried out differently. Some donors took issue with the lack of explanation, while others
found the explanation to be inadequate, or aspects of the visit unpleasant (for example,
waiting a lengthy period of time before being deferred, a lack of privacy during testing and
counselling, or the manner of the staff delivering the information). Nearly a third of donors
did not recall being given any brochures to take away, despite the fact that the organisation
had developed written materials specifically for this purpose. Ensuring that all donors are
given a thorough, private, and compassionate explanation at the time of deferral, with
adequate opportunity for questions and the provision of written materials to take away,
combined with optimal efficiency in donor processing to reduce waiting times, offer clear
opportunities to reduce the “hassle” of the deferral experience and maximise retention. Full
recommendations of potential improvements to the deferral procedure will be given in the
final results chapter.

301
For reasons previously discussed (see section 7.3.5), self-reported new donor status was
assumed to be more reliable than National Blood Management System (NBMS) new donor
status, as the database identified those who were new to the database (i.e. had not donated
for a long period of time, or in a different state) rather than new to donation. In contrast,
self-reported number of donations in the previous twelve months may not have been as
reliable as the number reported in the NBMS. Some of the difference was likely to be due
to issues with recall, and some because of differences in the outcome being measured, as
respondents were asked about how many donations they had made during the twelve month
period prior to deferral, whereas the NBMS counted the number of attendances (which did
not necessarily result in successful donation).
A final point to note is that many donors reported they took iron supplements following
deferral, including the majority of those who saw their GP. It is not clear what proportion
were prescribed iron supplements, and what proportion had iron supplements merely
suggested as a way to improve iron stores. The ARCBS does not accept donations from
individuals who are taking iron supplements under medical advice. Therefore, some donors
who follow their doctor’s treatment regimen will find that they are not allowed to donate at
their next attempt, which some may find a distressing experience. For example, one donor
reported:
The second time I got refused I told the nurse that I'd taken supplements to boost
my iron levels and she told me I shouldn't be donating while on supplements. That's
why I haven't gone back. (Female, 29, 1-2 donations)
7.6.1 Data limitations
The first limitation of this work is that it was the first piece of research completed for the
overall study, when it was not yet known to what extent low Hb deferral affected
subsequent donation patterns, and theoretical perspectives underpinning the reduced
likelihood of return had not yet been fully utilised. The purpose of the current phase of the
study was exploratory, designed to investigate whether aspects of the deferral event,
donors’ understanding of the reason for deferral, emotional responses, or their subsequent
experience seeking further information might be associated with whether or not a donor
returned. To this end, the research described in this chapter fulfilled its purpose, and the
findings shaped the investigations completed in other phases of the project.
302
One further limitation of this phase was that the survey relied on recall of events that
occurred twelve months prior. This was likely to have resulted in recall bias, in that those
who had particularly negative or positive experiences might have recalled events with
greater detail (Gordis 2000). Furthermore, limitations of recall were known to occur. A
small number of potential respondents returned blank surveys with a message that they
could not recall their deferral with enough clarity to contribute, and others noted at
particular questions they could not recall the exact events, for example:
Being 12 months after the date it is hard to remember specifics of what I was told
(Twelve Months Later survey)
The majority of respondents were able to provide details on all aspects of their experience.
Some indicated that their deferral was a significant event in their lives, and several
welcomed the opportunity to provide feedback on their view on deferral.
I haven't thought much about the deferral, for several months, as it was a year ago
but I do feel strongly about the experience (Twelve Months Later survey)
I think this survey is a great idea. Hope you find some answers; Knowing this is of
concern to you may make me try again (Twelve Months Later survey)
I appreciate the opportunity to 'air my concerns' (Twelve Months Later survey)
The majority of the recollections on the deferral event and the encounters seeking further
investigations during the deferral period were found to be remarkably similar to those
reported in the 3ML (see Results: Part Three in the previous chapter).
Despite the reasonably high response rate achieved in the survey, there were demographic
differences between those who responded to the survey and those who did not: non-
responders were more likely to be new donors and aged less than 25. Therefore, the
findings may not accurately reflect the experiences of these groups. The donation history of
non-responders is not known as their donation records were not extracted from the Data
Warehouse. It is likely that those who did not respond were also less likely to have returned
once eligible. It is also possible that those who were particularly upset about their deferral,
or their experience as a donor, would have been less inclined to complete the survey.
Finally, the dummy variable indicating that a donor had given the highest (5+) number of
donations in the year before their deferral was rarely found to be a significant predictor of

303
the outcomes measured in the analysis presented in this chapter, even thought the odds
ratios tended to be higher than those of lower donation frequencies. This is likely to be due
to the small number of cases in this group (n=10).
7.7 Conclusion
A small proportion of donors indicated dissatisfaction with the deferral event, most
commonly taking issue with the explanation and the process (such as waiting times).
However, after adjusting for other factors, these assessments were not associated with
whether or not a donor returned.
Return within six months of being eligible to return was associated with four factors: two
relating to the deferral event (being given brochures at deferral, and knowing the duration
of the deferral period); one relating to the individual (having made fewer donations in the
previous year); and one relating to seeking further investigations (having their low Hb
concentration confirmed through further tests).
The strongest predictor of return in the six months after the survey was having strong
intentions to do so, followed by having already returned at least once (which also predicted
intention), and having a higher donation frequency prior to their deferral. Few donors
returned if they reported they were anything less than “very likely” to return.

304
8 Final Discussion
8.1 Introduction The research presented in this thesis investigated the impact of a temporary deferral due to
a low haemoglobin concentration on donors’ treatment seeking behaviours, their intentions
to give blood in the future, and their donation patterns once eligible to return. The project
sought to understand the processes that contributed to the reduced likelihood of returning
once eligible. A mixed-method approach was utilised to address these aims.
This chapter begins by drawing together the findings from each phase of the study. The
findings are then discussed with reference to the relevant literature and theories that guided
the research. Next, the strengths and limitations of the methodological approach are
discussed. Finally, the chapter discusses the implications of the findings, including
recommendations for donor retention policies that arose from the research, and
recommendations for future research.
As before, acronyms will be used to refer to each of the four studies in the overall project:
the Audit of return study as AR, the Qualitative Interviews study as QI, the Three Months
Later study as 3ML, and the Twelve Months Later study as 12ML.
8.2 Overview of key findings
8.2.1 The impact of deferral on subsequent donation patterns
Analysis of the donation patterns of a large group of donors revealed that deferral has a
strong negative impact on donation patterns in four ways. First, deferred donors were far
less likely than their peers to come back within three years of being eligible to do so.
Second, those who did return were slower to do so than their non-deferred peers. Third,
deferred donors contributed substantially fewer donations once eligible to return. Finally,
they were more likely to drop-out of donation again in a subsequent year, even after
returning at least once. The last two effects were largely, though not entirely, explained by
the higher likelihood of non-return, and in returning donors, by the slower period to the first
return, the smaller number of donations given in the first year of being eligible, and the
greater chance of another deferral.

305
8.2.2 What processes are responsible for the disruption to donation patterns?
Results of the QI highlight the understanding that people predominantly give blood because
they see it as a relatively easy way to help their community, while requiring little personal
effort and minimal levels of commitment. Lengthy breaks from donation in the past were
attributed to the disruption of habit and changes in collection practices and/or personal
circumstances that altered the fit of donation with individuals’ lives.
The QI study suggested that deferral reduces the likelihood of return through a number of
processes. First, deferral disrupts the habit of regular donation, which also increases
vulnerability to changes in personal circumstances and collection practices. Second, the
deferral experience is somewhat unpleasant and introduces a level of hassle to what was
previously an undemanding activity. Third, deferral can diminish expectations that a future
attempt will be accepted, partly through reducing self-perceptions of good health and
competence as a donor. In other words, deferral may “tip the scales” for a donor already
juggling multiple demands, leading to the conclusion that donation is too much of a hassle,
particularly given the next attempt may be unsuccessful. Finally, the experience may reduce
the strength of the blood donor identity if interpreted as an unsuccessful role performance,
and through limiting the opportunity for successful enactment.
All studies found that some donors were less likely to return from deferral than others. The
AR found the likelihood of return within a year of deferral was lower if the donor was
deferred at their first attempt or had made fewer donations in the year before deferral.
Return in later years was less likely amongst those with a lower previous donation
frequency, aged below 44 or above 65 years, and those who had not yet returned since
being eligible to do so.
The QI indicated links between those who did not return within nine months of being
eligible to return and those with certain attributes: those who did not find donation
personally rewarding, those who did not feel valued and appreciated at the deferral event,
and those requiring greater levels of effort to recommence donation due to the presence of
conflicting demands or not having their donation arrangements facilitated by supportive
environments. This suggests that donors perform an informal cost-benefit analysis when
assessing whether or not to return.

306
The 3ML did not track actual return, but found lower intention to return was associated with
individuals holding particular beliefs and responses to deferral: believing they had
difficulty storing iron, believing they required the full deferral period to restore their Hb
levels, having lower levels of self-efficacy, and feeling grateful in response to the deferral.
The 12ML found that return prior to the survey, when participants had not yet had contact
with the researchers, was less likely amongst those deferred at their first attempt or who had
made fewer donations in the year prior to deferral, who were not given a brochure at the
deferral event, who could not accurately recall their deferral period, and who had their Hb
confirmed as low by their GP. Diminished return following the survey was predicted by
lower intention, not having already returned, and having given fewer donations in the year
prior to deferral.
8.2.3 Factors mediating return after deferral
Considered overall, the results from each study clearly show that there are three factors
explaining why some donors find it easier than others to restore their donation patterns
following deferral for a low Hb.
The first factor mediating the impact of deferral is the strength of the habit of donation.
Previous donation history has been shown to predict future behaviour in samples of non-
deferred donors beyond the effects of the donor identity or other factors (see Bagozzi 1981;
Charng, Piliavin et al. 1988; Piliavin and Callero 1991; Holdershaw, Gendall et al. 2003;
Godin, Conner et al. 2007). However, donation habits have not been previously considered
as a predictor of return in temporarily deferred donors. This study contributes to the
literature by demonstrating that donation habits are strong predictors of future behaviour
even in a deferred population. The importance of habit was also highlighted in the finding
that those who had not given for over a year before their deferral had a similar chance of
returning as those deferred at their first attempt.
During a six month deferral, donors are not able to engage in the activity that reinforces the
strength of the association between the context and its behaviour (Masser, White et al.
2008). In this way deferral may disrupt regular donation habits even if they are not broken
entirely. Habits also rely on continuity of the context of a behaviour (Wood, Tam et al.
2005). Consequently, their chances for future return may be particularly vulnerable to
changes to personal circumstances, such as moving house, changing work locations, or
embarking on a new life stage (such as having a child), that disrupt the environmental cues
307
triggering or facilitating blood donation during this period. This may be the reason that
other disruptions during a deferral period, such as changes to personal circumstances or
collection practices, were related to “unintentionally lapsing” from donation (QI). The
disruption presented by deferral may also allow a donor to reflect on their suitability to
continue, and this may be particularly detrimental if the event diminished self-perceptions
of competence and good health, or reduced the perceived convenience of the activity.
There was some evidence that the habit of regular donation can be largely re-established,
provided a donor can be encouraged to return promptly and often in the year immediately
following their deferral period. For example, the AR found that those giving the most
donations in the first year of follow-up made more donations overall and were less likely to
drop out in later years. Furthermore, those who were deferred again during the first year of
being eligible to return were less likely to give blood in the next year. However, provided
they gave blood at least once during this period, they were just as likely to return in the
third year.
Moreover, it appears that deferral impacts on donation behaviour for a number of years
after the event, above and beyond the effect explained by donation patterns in the first year
after deferral. The AR found that, relative to those in the comparison group, deferred donors
were more likely to drop out in the third year of follow-up even if they had already returned
in the first and second years, and gave fewer donations in the third year even after adjusting
for differences in earlier return patterns and the greater likelihood of subsequent deferral.
One possible explanation is that the hypothesised effects of deferral (such as disrupted
habits, a less salient donor identity, and diminished self-perceptions) may influence future
behaviour regardless of the effect on initial donation patterns. It may be that these factors
take longer to restore than one year of successful donations, making donors more
vulnerable to disruptions caused by changing personal circumstances or collection practices
in later years.
The second factor mediating the impact of deferral is the level of hassle that deferral
introduces into what was previously an undemanding activity. Perceptions of hassle are
likely to differ based on experiences at the deferral event and the level of effort required to
attend the collection site. Further hassle may be encountered when donors seek advice from
their doctor (which the majority of deferred donors were found to do) and are required to
undergo invasive investigations with a reasonable possibility that there is no underlying
pathology.
308
Donors wish to avoid the hassle of another deferral and therefore may delay return if there
is any suspicion that they may be deferred again. It appears donors’ beliefs about their
ability to give blood again mediate the decision-making process. For example, the 3ML
found an association between self-beliefs and intention to return, and the 12ML showed that
those found to have low Hb when their doctor performed more tests were less likely to
return. Furthermore, the 12ML found that most donors stating low intention to return had
real or suspected ongoing issues with their Hb level or were discouraged by their recent
deferral.
The third factor mediating the impact of deferral is the personal circumstances of the
deferred donor. Findings from the QI suggest that donors perform an informal cost-benefit
analysis when considering returning to give blood, and are more willing to risk an
unsuccessful attempt if: they have fewer demands competing with blood donation
(particularly those associated with the presence of dependent children); they can obtain a
greater personal benefit from giving blood; and they have their donating arrangements
facilitated by supportive environments. The latter two findings were not able to be
investigated in other phases of the study.
In relation to the first finding, the 12ML and the AR did not show a decreased likelihood of
return amongst donors in all age groups corresponding to a greater chance of having
dependent children. However, both studies indicated that those with higher donation
frequencies were more likely to be male and of an older age, with a higher recent frequency
significantly associated with return. The AR also found that males returned significantly
faster than females (though this finding could not be demonstrated in multivariate models
due to failure of the proportional hazard assumption). These findings suggest that an
individual’s life stage affects their ability to accommodate blood donation around their
other responsibilities and obligations. Those with a greater capacity to give blood are likely
to form stronger habits, and this is an important predictor of future return. Thus, donation
habits and the capacity to give blood prior to deferral influence the likelihood of returning
after a deferral, though life stage may have no independent effect on re-establishing
donation patterns.
Recent studies of lapsed donors have concluded that the opportunity for donation is crucial
for donor retention (Schreiber, Schlumpf et al. 2006; Schlumpf, Glynn et al. 2008). This
research supports these findings. The 12ML found a substantial proportion of those with
low intention to return cited the inconvenience of donation as their reason for their decision.

309
The QI also highlights the importance of convenience by showing links between prompt
return and having their donation arrangements facilitated by a supportive environment, such
as giving blood in a social or work group, during work hours, or at a mobile collection unit
that visited the workplace. It may be that individuals requiring less subjective effort to give
blood were less perturbed by having their time wasted by deferral and had less to lose if
deferred again when they returned. In contrast, those who had to expend greater subjective
effort to attend a collection site may be more bothered by the wasted time and less inclined
to risk a repeat of the experience.
The opportunity to give blood can change over time. Decreased opportunity may result
from lifestyle or life stage changes, such as changing work location, moving house, or
having children, as well as changes to the way blood services offer donation opportunities,
such as changes to the location or frequency of a mobile collection, or changes to opening
hours. Changes not only impact on the environmental cues that trigger or facilitate habit,
but may increase the level of effort required to access a collection or take time out of a
routine. A further barrier to return is that donors unable to use their previous arrangements
are required to seek “tactical information” (i.e. where and when to give) before they are
able to recommence, and previous research has shown that such seeking of information is
unlikely to occur (Robinson 1999).
The impact of changes to donors’ convenience was clearly seen in descriptions of the
circumstances leading to long breaks during a donor’s career. Several participants who had
“unintentionally lapsed” in the past had favourable attitudes to giving blood, strong donor
identities and substantial experience as a donor, showing that any donor is vulnerable to
lapsing in the right combination of circumstances. This supports recent research showing
that donors with lower donation frequencies only have minor differences in level of
altruism, empathy, and social responsibility compared to those with higher frequencies
(Steele, Schreiber et al. 2008).
8.2.4 Intention to return
The 12ML found that intention to give blood played a very clear role in determining future
donation behaviour. Therefore, intention to return was assessed in each subsequent study,
providing evidence of intentions at three different time points. It seems that in the absence
of a good reason to doubt their ability to give blood, most donors view their chances of
returning favourably. Soon after deferral, all donors report having strong intentions to

310
return once eligible to do so. Assessment at later time points reveals smaller proportions
(though still a majority of deferred donors) believe they will return. It is unclear why
intentions change over time. One possibility is that donors reassess their intention in light
of information obtained from medical practitioners, or whilst attempting to improve their
iron stores. Alternatively intentions may diminish the longer donors do not have the
opportunity to reinforce their habits and successfully enact their identity as a “blood donor”
However, the relationship between intention to return and actual donation was far from
perfect. Although intention to return was found to be the strongest predictor of behaviour in
a specific time period, nearly half of those not returning during the relevant period had the
greatest intention to do so (the 12ML). Similarly, around half of the participants in the QI
did not come back within nine months of being eligible, even thought they firmly believed
they would do so. In contrast, lower intentions had a greater chance of corresponding with
behaviour, with few donors returning if they were unsure whether they would return, or
believed it was unlikely.
8.2.5 Perceptions of the deferral event
Although the majority of donors in each study were happy with the explanations, advice,
and care they were given at the deferral event, there was a substantial minority who were
dissatisfied with one or more aspects of their experience. The most predominant negative
feelings resulting from deferral appeared to be related to staff responses to their failure to
donate rather than the unsuccessful attempts itself. For example, a participant in the QI felt
“shafted” after not being given much personal attention after her deferral, rather than at not
being allowed to give blood, and a first time donor noted that after being confirmed to have
a low Hb concentration she “entered into a different sphere…not visibly hostile but like
"unnecessary work"… they appeared to lose interest when I became unsuitable donor”
(12ML).
Univariable analysis found poor ratings of the deferral experience were associated with
lower intentions to return in the 3ML and a lower likelihood of donation within six months
in the 12ML. However, poor ratings were not associated with the outcomes in any
multivariable analysis. Furthermore, the QI suggested that none of the donors describing
unsatisfactory staff treatment reported that giving blood was personally rewarding, or
reported having a strong identity as a “blood donor”, and none returned within nine months
of being eligible to do so.

311
These results might be explained in a number of ways. First, that the habit of regular
donation is a more important predictor of future return than any individual experience at
deferral. Second, the findings may indicate that those with the strongest habits to give
blood, who find donation relatively easier to accommodate in their lives and have a more
salient donor identity, might be more tolerant of negative experiences at deferral. This may
be because they have more recollections of positive experiences to offset the negative
encounter, and a higher level of commitment to their identity. Those with the most regular
patterns may also represent those who most enjoy personal benefits of giving blood, which
may be a stronger influence on intention to return than any bad feelings resulting from the
experience.
8.3 How do the findings compare to the literature on return after temporary deferral?
8.3.1 Literature on return from temporary deferral
There are a number of US based studies investigating the impact of temporary deferral on
subsequent return (Jobuck, Lau et al. 1980; Noonan, Menitove et al. 1981; Piliavin 1987;
Halperin, Baetens et al. 1998; Custer, Chinn et al. 2007; Katz and Kabat 2007). The results
of this research differ from the findings of a number of these studies. The AR found deferral
reduced the likelihood of return and subsequent donation frequency in both first time and
repeat donors, and that it had the largest impact on first time donors and those who had not
donated in at least a year.
In contrast, two previous studies did not find deferral had any impact on the likelihood of
return amongst repeat donors (Piliavin 1987; Custer, Chinn et al. 2007) and Katz found that
a deferral due to travel in a malarial endemic country actually increased donation frequency
(Katz and Kabat 2007). The donation frequencies of both the deferred and non-deferred
groups were also higher than those reported elsewhere (Custer, Chinn et al. 2007), and the
proportion of deferred first time donors returning during the three year follow-up period
was substantially higher (20.9%) than those reported in some studies: for example, 2.8%
returned during a six month follow-up period (Piliavin 1987), and zero in an undisclosed
follow-up period (Noonan, Menitove et al. 1981). Conflicting findings may reflect
differences in blood service policies around deferral and retention, such as the length of the
deferral period, the minimum period between whole blood donation, and communication
strategies to re-engage donors at the end of their deferral period.
312
While no study had investigated the reasons temporary deferral has such as strong impact
on future return, several authors had speculated on a number of possible explanations:
medical ineligibility (real or imagined), misinterpretation of a temporary deferral as
permanent, negative emotional responses to deferral, feeling let “off the hook”, frustration
at having their time wasted, and negative self-attributions. This study found evidence to
support some, but not all, of these suggestions.
Piliavin and Callero proposed that medical ineligibility, real or imagined, may result in self-
deferral (Piliavin and Callero 1991). The evidence from this research strongly supports this
suggestion. The 12ML found that many donors who reported that they were unlikely to
return, or were undecided whether to do so, had either confirmed or suspected problems
maintaining their Hb level, or were afraid of another deferral. This reason was also
suggested by a number of participants in the QI.
Experiences whilst seeking further investigations are likely to play a role in perceived
ineligibility. Varying proportions of donors indicated they were told by their doctor to
change their donation patterns: a small proportion (<5%) giving the response in an open-
ended response question in the 12ML, and nearly half in the 3ML in response to a direct
question. The latter study did not find any association between being given this advice and
having lower intention to return. This may reflect the donors’ favourable intention to return
once they were eligible as determined by their physician, rather than when eligible to return
as determined by the lapsing of their deferral period. It is possible that advice to change
donation patterns results in non-intentional lapsing, either by prolonging the deferral period
and thus the potential for external disruptions during the deferral period, or through further
erosion of habits and the strength of the donor identity.
Furthermore, both the 3ML and 12ML indicated that substantial numbers of donors were
found to have underlying conditions while seeking further investigations. While this factor
was not associated with either intention or actual return, small numbers may have been
responsible for this finding.
It does not appear that non-return after a low Hb deferral is due to misinterpretation of the
temporary deferral as permanent (Mathew, King et al. 2007), with just one donor in the
12ML believing their deferral was permanent. However, of some concern was the finding
that only six in ten donors were able to correctly identify their deferral period as six

313
months, particularly as this sub-group were more likely to return than those with incorrect
estimates or no recollection.
Other researchers have suggested that emotional responses to deferral were responsible for
non-return, including feeling “off the hook”, rejected or disappointed (Piliavin 1987), or a
sense of frustration at having their time wasted (Halperin, Baetens et al. 1998). This
research provided evidence that donors may experience any or all of these responses, but
that there was no direct link with return.
Findings from the QI lends support to the proposal that donors are frustrated at having their
time wasted. The perception of wasted time was compounded by lengthy waits before
seeing an interview nurse, or being made to wait for additional samples to be taken after the
initial test of Hb concentration. It would be expected that those who exerted the most effort
to attend the collection site in the first place might be more frustrated by deferral. Poor staff
treatment, such as inadequate explanations and abrupt treatment, may further exacerbate the
problem. Frustration at wasted time is likely to contribute to the perception that deferral is a
hassle. However, this explanation was not explored quantitatively, and so this study only
provides preliminary and limited evidence that frustration contributed to non-return.
Small proportions of donors in the 3ML and 12ML reported they felt let “off the hook” or
rejected, while the largest proportion reported feeling disappointed. The emotional
responses were not necessarily associated with intentions in the expected direction: for
example, univariable analysis found that those disappointed and angry at their deferral had
higher intentions to return, while those feeling grateful and relieved had lower intentions.
The only emotional response predicting intentions in the final model was feeling grateful in
response to deferral. It is possible that this response tapped into a group donating under
social or personal pressure and subsequently feeling relieved at not having to donate for
some time.
It is possible that donors with the strongest negative reactions to deferral may be those with
the strongest blood donor identity, and deferral may have galvanised their desire to
successfully donate in the future. This sub-group may have masked any drop in return seen
amongst those discouraged by deferral. Another explanation is that negative emotional
responses to deferral do not directly influence intentions to return, but may contribute to the
perception that a deferral is a hassle.
314
Finally, Piliavin and Callero used attribution theory to explain reduced intentions to return
amongst temporarily deferred donors (Piliavin and Callero 1991). This theory proposes that
following a temporary deferral, donors see themselves as “bad bets” for successful donation
in the future, and that the belief becomes more entrenched the longer they put off returning.
This theory is supported by the findings in several phases of this research. Although it was
not possible with these study designs to assess how self attributions changed following a
deferral, the 3ML found over a quarter of respondents felt donation was difficult for them to
do, and that this response was more common in donors who had been deferred for low Hb
on a previous occasion. Furthermore, other phases of this research showed that donors who
had already returned had the greatest levels of confidence that they would give blood in the
near future (the 12ML), and the highest likelihood of actual return (both the AR and the
12ML).
In summary, the results presented in this thesis support most of the explanations proposed
in the literature, but not all. There was strong evidence that real or imagined ineligibility
delays return, and that individuals may consider themselves “bad bets” for future donation.
The role of emotional responses to deferral was unclear, with evidence that feeling let “off
the hook” led to lower intentions, but no evidence that negative emotional responses and
frustration at wasted time influenced intentions or return. There was scant evidence that
donors misinterpret their temporary deferral as permanent, though knowing the precise
duration of the deferral period was found to be important in predicting return.
8.3.2 To what extent does theory explain the effect of deferral for a low Hb concentration?
This study drew on three theoretical perspectives that had not been utilised in previous
research into the effect of temporary deferral, but that offered plausible explanations for the
effect of deferral on subsequent donation patterns. The results provide limited evidence for
the Theory of the Spurned Philanthropist or traditional conceptualisations of Role Identity
Theory. There was some evidence for aspects of the Theory of Planned Behaviour, and for
Role Identity Theory as conceptualised by McCall and Simmons (1978) and Giddens
(1991).
The research in this thesis explored a number of aspects of the Theory of the Spurned
Philanthropist: the level of surprise at deferral, the donors’ perceptions of the ARCBS,
negative emotional responses, and desire for future association (intention to return).

315
As already described in the discussion section of the 3ML, there was limited evidence to
support the Theory of the Spurned Philanthropist in the context of low Hb deferral from
blood donation. The level of surprise at deferral was not associated with the level of
“irritation”, and although surprise was associated with individual emotional responses
(disappointment, worry, and gratitude), the factor had no independent effect on intention to
return. The QI found that most participants had highly favourable attitudes towards the
ARCBS, and although a few donors felt “rejected” by their deferral, many articulated an
understanding of the reasons for their deferral, and in many cases appreciated notification
about their health. As already mentioned, most bad feelings resulting from deferral
reflected not being treated as well as donors expected by collection staff, rather than the
rejection of deferral.
There are other reasons why the theory may not have been appropriate in the context of
deferral for a low Hb. The theory was developed based on research into the reactions to
refusal of one-off offers of assistance, but may not be applicable in the context of habitual
helping behaviours. It seems that deferral for low Hb is not necessarily perceived as a
rejection of an offer of help, as most donors recognise that concern for their own health is
an important rationale of a low Hb deferral, and consequently deferral could be perceived
as an indication that the organisation cares about their wellbeing. Moreover, notification of
a low Hb concentration was in line with the “free health check” reward of giving blood,
particularly as the notification tended to occur before donors were aware that their levels
were low (a “wake up call” (QI)), and was found to indicate underlying pathology in a
small but substantial proportion of donors in the 12ML and the 3ML.
There was limited evidence for the importance of role identity in explaining reduced return
after a temporary deferral, at least in the sense it is traditionally used in the blood donation
literature. Research into the “blood donor” role identity was informed by theory developed
initially by Stryker and expanded by Burke (Sets and Burke 2003), which was used by
Callero to develop a scale to measure the salience of the role identity (Callero 1985). The
3ML found that the role identity scale did not have satisfactory internal consistency, which
was unexpected as the scale is commonly used in blood donor research, including a recent
Australian study (Masser, White et al. 2009). Notably, the scale does not appear to have
been used and validated in a deferred donor population, and evidence from the QI raises
doubts about the applicability of the scale in a group of people temporarily unable to give
blood.

316
However, there was evidence that many deferred donors identified with a “blood donor”
identity in some form. Most participants in the QI, though not all, perceived themselves in
this way. Those with strong self-perceptions saw donation working well in their lives: the
activity often had personal relevance, was experienced as rewarding, could be performed
with competence, and was easily accommodated around other commitments. These
findings support McCall and Simmon’s conceptualisation of the role identity against that
used by Piliavin and Callero (and consequently much of the current research in the field: for
example see (Callero and Piliavin 1983; Charng, Piliavin et al. 1988; Piliavin and Callero
1991; Lee 1999)).
McCall and Simmon’s theory, described previously in the Literature Review, proposes that
the salience of a role identity (and therefore its likelihood of being enacted in a given
situation) is influenced by a number of factors. The factors include previous successful
performance, the level of commitment and investment in the identity, the rewards offered
by the identity, and the perceived opportunity for successful, “profitable”, enactment
(McCall and Simmons 1978).
The results presented in this thesis resonate with several aspects of the theory. Two aspects
help explain why deferral may disrupt the salience of the donor identity, and
correspondingly reduce the likelihood of return. A low Hb deferral may be interpreted by
many as an unsuccessful performance of the activity, and during the six month deferral
period donors have no opportunity for profitable enactment. Following the deferral event,
salience appears to be higher in those with the highest levels of commitment and
investment in the identity, which was seen in the consistent finding that those with the
highest recent frequencies were most likely to return from deferral. There was a clear link
between feeling donation was personally rewarding and being more likely to return once
eligible in the QI. Finally, it is proposed that salience shifts in line with changes to the
opportunity for profitable enactment of the identity. This shift corresponds with diminished
expectations that future attempts to give blood will be successful, a lack of opportunity for
profitable enactment for half a year, and no contact from the ARCBS beyond initial test
results that may have served to keep their identity in mind whilst ineligible to give blood.
A number of rewards were experienced through being a blood donor, including positive
self-perceptions, feeling valued and appreciated, a “free health check”, feelings of social
solidarity, time out for oneself, and refreshments. Tangible rewards, such as key rings and
the blood donor identity card were viewed as acknowledging the contribution made and

317
facilitating a sense of belonging. There has been limited research into the role of rewards in
encouraging donor retention. One exception is the use of incentives, with the literature
showing that incentives play a role in predicting intentions to give blood, particularly
amongst younger and first time donors (Glynn, Williams et al. 2003). However, the
implications for practice are less clear, with two studies showing that donors offered
incentives are no more likely to give blood than those only requested to return (Reich,
Roberts et al. 2006; Goette, Stutzer et al. 2009). It is possible that rewards associated with
giving blood are particularly important to deferred donors, who must decide whether to
return when the outcome may be another deferral.
An alternative and contemporary perspective concerning identity was described by
Giddens, who wrote about the fragility of the biographical narratives informing self-identity
(Giddens 1991). If the continuity of a biography is vital for the integrity of the self-
perception, the movement from “I’m a capable blood donor” to “I have some problems
giving blood” is likely to contribute to a lower inclination to return once eligible. Donors
may also move from viewing themselves as healthy individuals to people with health
issues, not only diminishing the assumption of a successful future attempt, but disrupting
the natural relationship between good health and blood donation (Alessandrini 2006). This
is also aligned with attribution theory, which suggests that unsuccessful donation attempts
lead individuals to see themselves as “bad bets” for future donation (Piliavin and Callero
1991), and with the importance of self-efficacy in the extended theory of planned behaviour
(Giles, McClenahan et al. 2004; Masser, White et al. 2009).
There was evidence that the measured aspects of the extended Theory of Planned
Behaviour explained a substantial proportion of intention to return. In line with the theory,
intention was the strongest predictor of actual donation behaviour (the 12ML), and higher
levels of self-efficacy were associated with stronger intentions (3ML).
8.4 Discussion of methods
8.4.1 Advantages of the approach A mixed-methods approach has the potential advantage of overcoming the limitations of
any single methodological approach. Using a number of different studies, each with
different methods, allowed different questions to be addressed, and comparing the findings
in each study allowed for a pluralistic explanation of the phenomena under investigation.
The strategy also provided an opportunity to explore the range of factors associated with
318
return behaviour without requiring presumptions about which variables would be
predictive.
Analysis of donation patterns in a group who were not contacted by the researcher was vital
in ensuring the rigour of the findings of the AR. Survey respondents in the 12ML had a
higher likelihood of return in the first year of follow-up than those tracked in the AR,
showing that the survey respondents were a highly motivated group who did not reflect the
deferred population perfectly. Self-selection bias and the effect of additional contact
through the survey may have been responsible for the difference in return.
Much of the literature on blood donation emphasises attitudes and norms in predicting
intention to give blood and actual donation behaviour. The research presented in this thesis
explored factors related to the individual’s circumstances and the deferral experience. This
was done deliberately, as analysis based on donors’ circumstances and their experience of
deferral was thought to offer clear guidelines for how procedures could be improved and
which donors could be targeted with specific strategies.
8.4.2 Limitations The limitations and data issues of each individual study have been discussed in the
appropriate results chapters. The limitations discussed here relate only to the overall study
design.
Although not strictly a limitation, an issue that impacted on every stage of the project was
the difficulty of both obtaining and working with institutional datasets. As previously
stated, a dataset suitable for performing the AR had not previously been extracted by
ARCBS staff, and the first datasets provided for the project did not reflect the
specifications. Early analysis of those datasets (not presented in this thesis) yielded
completely different results to those performed on later datasets, thus stressing the
importance of researchers working closely with those involved in the data extraction
process.
The difficulties in obtaining suitable datasets for the AR caused delays in the project,
severely impacting on the timelines of the remaining studies. The time constraints
associated with a PhD candidature meant that the QI and the 3ML had to be commenced
before analysis of the previous studies had been completed, which is not the way the project
would be completed in an ideal world. Consequently, there were missed opportunities for

319
triangulation. For example, the finding that receiving a brochure predicted return in the
12ML could not be investigated further in the 3ML, as that survey was designed to quantify
other aspects of the deferral experience and the importance of receiving brochures was not
yet known.
The order in which the studies were completed also influenced opportunities for
triangulation. For example, the impact of changes to personal circumstances, competing
obligations, and the effort of returning on subsequent donation patterns could not be
quantified in this research, as the finding first arose in the QI, which was completed second,
and the only study that would have allowed this type of investigation (the 12ML) was
completed first.
Finally, only recent donation frequency was used to explore the impact of donation history
on future behaviour. This variable was chosen as it reflected aspects of theoretical interest,
including recent habits and the opportunity to give blood. While alternative measurements
were available, such as the number of donations given or the number of years since the first
donation, dependence within categories meant that only one measure could be used in the
multivariable analysis. Univariable analysis showed that return was associated with other
measurements of donation history, and it is possible that these would also be significant
predictors if substituted for frequent donation frequency in the final models.
This concludes the discussion of the findings, methods, and limitations. The next section is
concerned with the implications of the results, both for practice and for future research.
8.5 Implications
8.5.1 Recommendations for practice The results presented in thesis provide evidence that return after a low Hb deferral is related
to previous donation habits, the extent to which deferral is perceived as a hassle, the
strength of the blood donor identity, expectations of future acceptance, opportunity for
donation, and whether the activity is experienced as personally rewarding. These findings
suggest clear opportunities for intervention, and a number of recommendations are
suggested. It is expected that many of these recommendations could be successfully applied
to donors deferred for a range of reasons, and that some strategies may also contribute to
retention amongst all donors.
320
These recommendations have been developed based on the results of this study, and
considerations of feasibility from a systems perspective are beyond the scope of the thesis.
It is anticipated that individuals from the ARCBS with expertise in donor retention might
use these recommendations as a starting point for developing strategies, in light of better
understandings than the candidate around practicality, risk, and resource constraints.
Some of the recommendations are not new. For example, the issues relating to optimising
the quality of the donation experience have been previously reported (Daigneault and Blais
2004), as has the importance of convenience and facilitation of donation arrangements
(Robinson 1999). It is likely that many of these recommendations have been previously
considered by the ARCBS and strategies attempting to address these issues may already be
in place.
A number of challenges impact on any decisions on potential strategies to optimise donor
retention. First, the ARCBS must collect enough blood to meet clinical needs with limited
resources and in a heavily regulated environment. Second, a tension exists between
encouraging donors to give frequently and safeguarding their health and wellbeing. Finally,
interactions between collection services and blood donors require a delicate balance
between making donors feel that their contribution is recognised and valued, yet not
making them feel obligated or depended upon. The following recommendations are offered
while acknowledging these difficulties.
Recommendation 1: Encourage regular donation
Past donation patterns were consistently found to predict future donation patterns.
Recommendation 1a and 1b relate to facilitating regular donation behaviour and prompt
return after deferral.
Recommendation 1a: Encourage frequent donation habits
A higher donation frequency emerged as a strong (and often the only) predictor of
future behaviour in both the deferred and non-deferred populations. The relationship
between past and future donation behaviour emphasises the importance of
encouraging donors to give as often as possible to build their resilience to disruption
to their donation patterns, and would have the added bonus of contributing to the
sufficiency of the blood supply.
It is difficult to identify effective strategies to increase donation frequency, as much
of the literature only explores changes in donor’s intentions, rather than their
321
behaviour. However, the results from two randomised controlled trials show that
specific communication messages can increase return, particularly by providing
messages aiming to increase self-efficacy (Chamla, Leland et al. 2006) and pointing
out examples of how giving blood benefits specific recipients (Reich, Roberts et al.
2006).
This project suggests other strategies may increase frequency, including improving
the convenience of donation, facilitating donation arrangements, and enhancing the
personal rewards of donation. These are specifically addressed in later
recommendations. It should also be noted that those with higher donation frequency
are at an increased risk of deferral for a low Hb, so strategies to increase donation
frequency should be accompanied by measures to safeguard donors’ iron stores (see
Recommendation 8).
Recommendation 1b: Encourage prompt return
Donors should be encouraged to return as soon after the deferral period as possible,
and then as often as possible after their first return. Contact during the deferral
period has been shown to increase return (Jobuck, Lau et al. 1980; Walz, McMullen
et al. 1985), particularly contact in the initial days after the deferral event. Donors
could be contacted by a medical officer or nurse educator early in deferral period to
monitor donors’ attitudes and behaviour in relation to follow up investigations,
perhaps with an offer to correspond with the donors’ physician should further
information be required.
Donors could also be approached with personalised telephone calls towards the end
of their deferral period, offering to book an appointment as soon as the donor is
eligible to return. Those deferred at their first attempt, or returning after a break,
should be particularly targeted as these groups do not yet have regular habits or a
strong donor identity to motivate future attendance. The length of the deferral period
should be explicitly stated in all communications to reduce confusion about the
length of the deferral period, and all donors should be given brochures at their
deferral (see Recommendation 2a).
Recommendation 2: Reduce the hassle of deferral and enhance the benefits by
improving aspects of the deferral procedure

322
A small number of donors in the QI and the survey studies noted that their treatment at
deferral was far from satisfactory, most commonly reporting feeling confused by
inadequate explanations, or upset by abrupt and uncaring staff treatment. There is an
opportunity to offer a service during and following deferral that makes donors feel that their
health is important to the organisation, and that they are personally valued and appreciated.
This may add value to their experience as a donor, enhancing the benefit of the “free health-
check” that some donors perceived that deferral provided.
Several recommendations correspond to improving the deferral procedures:
Recommendation 2a: Giving brochures to all low Hb deferred donors
All donors need to be provided with brochures to take away at the deferral event.
This was seen to have a direct influence on the likelihood of return, possibly by
helping donors feel they were getting value out of the deferral experience. This is
easy to implement as brochures have already been created for this purpose.
Recommendation 2b: More comprehensive and clearer explanations
Some participants in the QI requested further explanation of some of the terms used
in correspondence following their deferral, such as “ferritin”, which was not
mentioned at the deferral event. Some were also confused about the way iron was
related to haemoglobin, and about the role of Hb in the body. Brochures could be
improved by providing clear explanations of these terms, not only to anticipate and
overcome confusion, but also to take advantage of an opportunity to provide health
education to an interested and motivated group.
Recommendation 2c: Offer nutritional counselling sessions
Following on from the previous recommendation, deferred donors could be offered
individual counselling sessions by a trained nurse educator immediately after their
low Hb deferral. Counselling could include dietary advice, a thorough explanation
of the reason for deferral, and explanation of the role of haemoglobin, iron, and
ferritin in the body, and should be delivered privately, with enough detail that
donors are not confused, yet balanced so that donors are not over-worried.
Individual counselling from a trained nurse educator would also minimise the
chance of donors being given misleading information (which occurred in my
personal experience of deferral). In circumstances when a nurse educator is not
available, such as during busy sessions or on mobiles, deferred donors could be

323
contacted soon after their deferral to offer this service in person or over the
telephone.
Recommendation 2d: Emphasise customer service
Several participants did not feel valued or appreciated as a result of their deferral
experience. Additionally, some spoke about previous occasions when they were not
treated by collection staff as well as they would have liked. Good customer service
should be a top priority for all donors on all occasions, particularly when a donor is
disappointed and frustrated at an unsuccessful attempt. This may also reduce the
possibility of deferral being the “last straw” after a series of unsatisfactory episodes.
Efforts to improve customer service may be addressed through staff selection and
staff training and development. The way that collection services are organised
should be examined in order to identify ways to reduce time pressures and other
processes that lead donors to feel devalued and unappreciated.
Recommendation 2e: Facilitate further testing
Most donors seek further investigations following deferral, but this represents
personal costs in terms of time, money, and hassle. Some participants in the 12ML
noted that they had not yet visited their doctor due to the expense. The ARCBS
might consider facilitating this process by suggesting medical clinics where donors
could access bulk-billing, or, subject to funding, offer to fund the gap in
circumstances where bulk-billing is not possible.
Recommendation 2f: Promote ferritin testing as an additional testing service
The ARCBS currently offers serum ferritin testing (the “venous sample”) to donors
with a low Hb concentration, which most donors take up. The reason for the test is
to determine whether the donor is iron deficient, yet the participants of the QI did
not understand the purpose of the testing, did not realise that it was an additional
service, and furthermore did not know how to interpret the ferritin test result when
notified by letter. This represents a wasted opportunity to present the testing as a
benefit of the deferral encounter. The purpose of the testing should be fully
explained to donors, and the test result accompanied by information that allows the
donor to understand the meaning of the result.
Recommendation 3: Improve the convenience of blood donation for all donors

324
Blood donation must accommodate the changing needs and desires of volunteers in the
current period of late modernity (Pusey 2000; Hustinx and Lammertyn 2003; Stolle and
Hooghe 2004). Relative to other forms of organised helping behaviour, blood donation
requires little commitment, and can be spontaneous and sporadic, which is particularly
important for those with many competing obligations. The ARCBS needs to recognise that
this is the new context from which they must obtain adequate blood supplies, and continue
to adapt their collection services accordingly. The next five recommendations relate to
enhancing and facilitating opportunities for donation
Recommendation 3a: Facilitate spontaneous opportunities to give blood
New, lapsed, and repeat donors alike report responding to spontaneous opportunities
for donation (the QI). This suggests that mobile and static collection sites must be
well advertised and have an obtrusive presence in their local area. This might
include street signage notifying the proximity of a collection site, and posters in
community spaces notifying about upcoming mobile collections. Furthermore,
appointments space needs to be set aside to accommodate walk-in donors.
Recommendation 3b: Allow donors to book their next attendance immediately
after donation
Some donors appreciate being able to book their next appointment in advance. The
QI was conducted in Adelaide, where donors are able to book their next
appointment immediately after their last, and this serves to commit donors to a
future attendance whilst the activity is most proximal in their mind. If not already
the case, this practice should be utilised in all collection sites. Deferred donors
should be offered the chance to book their first return after deferral ahead of time,
perhaps through personal solicitation near the end of their deferral period. The
ARCBS should also prioritise using newer forms of communication and
appointment booking services, such as email and SMS notifications with links to a
website allowing donors to book their own future appointments.
Recommendation 3c: Streamline the deferral appointment
Collection practices must be streamlined in order to improve the perceived
convenience of donation. Any aspect of hassle should be minimised, including
lengthy waiting periods, difficulty parking, or inconvenient opening hours. Free
shuttle bus services (if available) should be promoted to overcome difficulties in
325
arranging travel to collection sites. Any changes to opening hours and collection
locations should be based on consultation with the affected donor population.
Recommendation 3d: Improve access to collection facilities for women with
children
This research found that several female participants stopped giving blood for over a
decade after becoming pregnant with their first child, far beyond the temporary
deferral period associated with pregnancy and breastfeeding (QI). Disrupted habits
and lifestyle/ life stage changes appeared to be responsible for the long breaks.
Additional services at collection sites, such as child minding facilities, and shuttle
bus transport to a local collection site, might assist those with small children to give
blood, and allow them to re-establish the habit of regular donation.
It is worth noting that the women with dependent children interviewed in the QI,
none of whom returned after deferral, all had older children and would not have
been enticed by child minding facilities. This group is likely to have many demands
on their time, and may be more responsive to giving blood during their work time.
The ARCBS could negotiate with workplaces to allow staff to give during work
time, notify local workplaces when a mobile will be visiting their local area, support
workplaces to set up staff donation groups, assist with transportation from the
workplace to the collection site, and ensure the collection process is quick and
efficient.
Recommendation 3e: Work hard to re-engage donors who are affected by
changes in collection practices
Changes to collection practices, such as opening hours, collection locations, and
eligibility criteria, are inevitable over time. This research shows that these changes
can be enough to result in significant breaks from donation, particularly when they
occur in conjunction with lifestyle changes or a temporary deferral. Great care
should be taken to notify donors well in advance of upcoming changes, and as much
as possible, should facilitate their transfer to new donation arrangements so donors
do not have to personally seek out information about where and when to give blood.
Recommendation 4: Enhance the positive aspects of giving blood
The introduction of additional rewards needs to be carefully considered, given incentives
must be small enough not to encourage donors to lie about risky behaviours (Sanchez,

326
Ameti et al. 2001) or “crowd out” those who are strongly motivated by altruism (Bénabou
and Tirole 2006). There is not much evidence that offering incentives increases donation
(Reich, Roberts et al. 2006; Goette, Stutzer et al. 2009). However, a number of rewards that
donors already associate with giving blood could be enhanced through simple measures.
Some donors appreciated the quality of their refreshments and the efforts of the volunteer
staff that provided service in this area. Although the main rationale behind providing
refreshments is to reduce the likelihood of a vasovagal reaction after giving blood, the
quality and range of refreshments is appreciated and should remain a priority, and reviewed
if donor feedback indicates dissatisfaction.
Some participants noted that giving blood in a work or social group added a social
dimension to the donation experience. Community and work groups could be encouraged
and supported to set up donor groups.
As described in Recommendation 2, a deferral for a low Hb concentration may be
conceptualised as a “free health check”, and this benefit can be further enhanced using the
recommendations provided earlier.
Finally, many donors, though not all, reported feeling valued and appreciated as a blood
donor. These feelings are likely to contribute to building positive self-perceptions, and
highlight the need for compassionate and respectful treatment by collection staff at all
times.
Recommendation 5: Increase donors’ self-efficacy
This research found that lower self-efficacy is associated with a lower intention to return,
and that communications that aim to increase self-efficacy may contribute to more
favourable intentions and therefore a greater likelihood of return. One study compared
communications based on increasing self-efficacy (by stressing that they were part of only a
small proportion of the population who gave blood with their blood type) with a standard
communication letter, and found that the self-efficacy message substantially increased the
likelihood of return (Chamla, Leland et al. 2006). A similar approach could be taken with
deferred donors, with a message highlighting the value of their contribution, the rarity of
the number of people who give blood with their blood type, and addressing concerns about
future acceptance by stating that the majority of donors are accepted to give blood after a
temporary deferral.

327
Recommendation 6: Strengthen the donor identity, even whilst the donor is unable to
give
Applied to the context of blood donation, McCall and Simmon’s role identity theory
emphasises the importance of opportunity to donate, perceived rewards associated with the
activity, and successful performance in maintaining a salient identity. Strategies addressing
each of these areas would be expected to improve salience and correspondingly the
likelihood that an individual will return to give blood. Additional measures could serve to
keep the identity in mind even whilst the donor is unable to give blood, as well as
highlighting the fact that the donor is valued by the organisation even whilst they are
unable to contribute. This approach may also help identify those who had a change to their
personal circumstances or who will be affected by changes to collection practices, so these
donors can be moved toward alternative donation arrangements when they are eligible to
return.
Recommendation 6a: Additional contact with deferred donors
As noted in earlier recommendations, donors could be contacted at several stages
throughout their deferral period, preferably by telephone, to avoid making donors
feeling “processed”. However, letters may be a more cost-effective way to keep in
contact throughout the deferral period, and could emphasise appreciation of donors’
previous efforts to attend and the fact that they are very much wanted back once
eligible.
Recommendation 6b: Re-engagement contact
Current deferral procedures have donors re-entering the regular communications
system at the end of their deferral period. A more tailored re-engagement process
may be more effective. As previously stated, donors could be approached by
telephone towards the end of the deferral period and encouraged to make an
appointment as soon as they are eligible to do so.
Recommendation 7: All donors should be re-contacted
There is a small group of deferred donors given an “indefinite deferral” in response to
combination of a low Hb concentration and a normal ferritin level. The indefinite deferral
code means they are strongly encouraged to see their doctor for further tests, and are
eligible to return as long as they met the eligibility criteria, but are not contacted to do so
after six months like other donors deferred for a low Hb. Two of these donors were
328
encountered in the QI. Neither returned promptly once eligible, neither realised that it was
imperative that they see their doctor before returning, and one donor had no intention of
doing so. The 12ML found those who had not yet been invited to return once eligible had a
lower likelihood of doing so. The necessity of the indefinite deferral should be reviewed,
particularly as it means this group is not recontacted, and, if donors are required to see their
doctor prior to returning, they should be explicitly advised and supported to do so.
Recommendation 8: Reduce the likelihood of deferral for low Hb
The ARCBS can minimise the chance that donors will be deferred for a low Hb
concentration by providing iron supplementation to replace iron lost through a whole blood
donation. The strategy has been demonstrated to be effective in a number of donor
populations, particularly pre-menopausal females (Gordeuk, Brittenham et al. 1987;
Gordeuk, Brittenham et al. 1990) (Garry, Koehler et al. 1995; Brittenham, Gordeuk et al.
1996). The ARCBS is currently investigating the effect of daily supplementation of 45mg
of elemental iron post-donation in female, pre-menopausal donors. The outcomes of
interest are whether this level of supplementation is well tolerated, can maintain the iron
status of whole blood donors between donations, and reduces the likelihood of low Hb
deferral at the next donation (Candy 2009). If successful, the strategy should be
implemented in conjunction with any efforts to encourage more frequent donation, in light
of the association between higher recent frequency and the likelihood of deferral (AR).
Routine supplementation is likely to dramatically reduce the risk of being deferred for a
low Hb concentration, but is not expected to eliminate the issue entirely, as first time
donors, those returning after a substantial break, and those ineligible for supplementation
will still be at risk of deferral for this reason.
As a final note, all of the recommendations suggested above should be optional and, where
possible, tailored to individual preferences. Several participants in the QI noted they were
not given the choice they desired in many aspects of their deferral, such as being made to
wait for further samples to be taken when they were in a rush and needed to leave.
Additionally, there is evidence that unwanted contact may decrease intentions to give blood
in the future (Glynn, Kleinman et al. 2002).
8.5.2 Future research There were a number of interesting findings that highlight avenues for future research.
329
Several factors were identified as linked with return in the QI, but could not be investigated
in other phases of the project, and these warrant further exploration. The first was the
importance of rewards in predicting future donation behaviour. In the context of blood
donation, reciprocity has been understood to describe the expectation that a donor will have
blood available for them and their family should they need it in the future (Alessandrini
2006). However this research found that many donors experience a wide range of rewards
associated with the activity. The role of these rewards in encouraging return from deferral,
as well as their role in encouraging donation in a non-deferred population, should be
explored. Other research could investigate which rewards are most useful in eliciting return
through field experiments, along the lines of recent research on the effect of offering
cholesterol screening (Goette, Stutzer et al. 2009).
The second factor is the importance of having donation arrangements facilitated by
supportive environments, such as donating in a group, at a mobile collection at a
workplace, or during work hours. This factor is likely to increase donation frequency
amongst all donors, as well as those returning after interrupted donation patterns, and
should be investigated in both populations.
The third factor is the extent to which changes to personal circumstances and collection
practices influence future donation patterns, and whether the effect is particularly
pronounced amongst those affected by changes whilst temporarily ineligible to give blood.
Further qualitative work could explore the reasons given by returning and non-returning
deferred donors after they have already been eligible to return for a period of time, to
confirm whether additional processes influence return. Qualitative work could also explore
the multi-dimensional nature of commitment to blood donation, which was suggested by
the qualitative research in this thesis.
This research suggested that most lapsing from donation occurs unintentionally, and that re-
engagement with donation often occurs through a spontaneous encounter, such as seeing a
mobile collection in their local area. Further research could be conducted into which
triggers are responsible for re-engaging donors after lengthy breaks, with a view to
informing strategies that encourage lapsed donors to return.
The ARCBS is currently engaging in a randomised controlled trial to investigate the
efficacy and tolerance of iron supplements in female pre-menopausal whole blood donors.
A possible negative outcome of providing supplementation is an implied acknowledgement
330
that blood donation depletes donor’s iron stores. Interview participants generally did not
recognise that donation contributed to their low Hb status, and research should be done to
explore how donors feel about blood donation impacting on their health in this way, and
their attitudes towards supplementation.
The research reported in this thesis supported McCall and Simmon’s (1978) and Gidden’s
(1991) contemporary conceptualisations of identity rather than conceptualisations
traditionally applied to research into the “blood donor” identity. Further work could be
undertaken to explore the applicability of the alternative theories in a deferred donor
context, as well as in explaining motivation and behaviour in the wider donor population.
Finally, further research into the effectiveness of different strategies to improve donor
retention is thoroughly recommended.
8.6 Conclusion Overall, this research has shown that non-return from deferral for a low Hb may be partly
attributed to disrupting the habit of regular donation, but also to the hassle deferral brings to
what was previously an undemanding activity. Deferral represents wasted effort, and may
result in negative emotional responses, bewilderment from inadequate explanations, and
feeling unvalued as a result of poor treatment from collection staff. Donors wish to avoid
another deferral and appear particularly likely to do so if they have confirmed or suspected
issues with their Hb, need to exert more effort to return, have more competing demands and
obligations, and do not find donation to be personally rewarding. Changes in self-
perceptions relating to competence and good health may contribute to expectations that a
future attempt will be unsuccessful. In short, deferral for low Hb reduces both the perceived
fit of the activity in a person’s life and the suitability of the person for the activity.
Those with the strongest habits, the most salient blood donor identities, those with the
firmest expectations of future acceptance, and those requiring the lowest levels of effort to
give blood appear to be most likely to give blood promptly after deferral and re-establish
their previous donation habits.
The research findings have important implications for promoting the retention of blood
donors after a temporary deferral for a low Hb concentration. Moreover, this thesis furthers
understandings of blood donation behaviour more generally, including the circumstances
contributing to lapsing from donation, the role of life stage in predicting the opportunity to

331
give blood, and the importance of donation habits in predicting future behaviour. The
findings support conceptualisations of the “blood donor” identity that incorporate the
importance of opportunity and the perception of blood donation as personally rewarding.
The research also contributes to understanding formal helping behaviours in the current
period of late modernity.
Recommendations arising from this research relate to encouraging strong donation habits,
improving the customer service and information provided at the deferral event, facilitating
further testing, improving the convenience of blood donation, enhancing the rewards of
giving blood, maintaining contact with donors during the deferral period, and the reduction
of the likelihood of deferral by offering iron supplements following successful whole blood
donation.
332
Bibliography
Ajzen, I. (1985). From intentions to actions: A theory of planned behaviour. Action-control: from cognition to behaviour. J. Kuhl and J. Beckmann. Heidelberg, Springer-Verlag: 11-39.
Alessandrini, M. (2006). Reading the social future of the Australian Red Cross Blood Service, Australian Red Cross Blood Service & University of Tasmania.
Ali, A. M., C. H. Goldsmith, et al. (1989). "A prospective study evaluating the lowering of hemoglobin standards for blood donors." Transfusion 29(3): 268-72.
Ali, A. M., A. T. McAvoy, et al. (1985). "An approach to determine objectively minimum hemoglobin standards for blood donors." Transfusion 25(3): 286-8.
Alpert, P. T. (2004). "New and emerging theories of cardiovascular disease: infection and elevated iron." Biol Res Nurs 6(1): 3-10.
Arnett, D. B., S. D. German, et al. (2003). "The Identity Salience Model of Relationship Marketing Success: The Case of Nonprofit Marketing." Journal of Marketing 67(2): 89-105.
Australian Red Cross Blood, S. (2007). "Australian Red Cross Blood Service website." Retrieved 30/11/2007, 2007, from http://www.donateblood.com.au.
Australian Red Cross Blood Service. (2008). "Blood Donor Eligibility." Retrieved March 11th, 2008, from http://www.donateblood.com.au/page.aspx?IDDataTreeMenu=39&parent=30.
Bagozzi, R. P. (1981). "Attitudes, intentions, and behavior: a test of some key hypotheses." Journal of Personality and Social psychology 41(4): 607-627.
Bampton, P. A. and R. H. Holloway (1996). "A prospective study of the gastroenterological causes of iron deficiency anaemia in a general hospital." Australian and New Zealand Journal of Medicine 26(6): 793-9.
Bekker, H., G. Denniss, et al. (1994). "The impact of population based screening for carriers of cystic fibrosis." J Med Genet 31(5): 364-8.
Belda Suarez, I. M., A. Fernandez-Montoya, et al. (2004). "How regular blood donors explain their behavior." Transfusion 44(10): 1441-1446.
Bénabou, R. and J. Tirole (2006). "Incentives and Prosocial Behavior." American Economic Review 96(5): 1652-1678.
Bianco, C., G. Brittenham, et al. (2002). "Maintaining iron balance in women blood donors of childbearing age: summary of a workshop." Transfusion 42(6): 798-805.
Bland, J. M. and D. G. Altman (1997). "Statistics notes: Cronbach's alpha." BMJ 314: 572. Blood Centres of the Pacific. (2007). "Blood donors now receive cholesterol test with every
blood donation." Retrieved 3/12/2007, from http://www.bloodcenters.org/press/34.htm.
Blumberg, N., I. Shah, et al. (1982). "Evaluation of individuals deferred from blood donation for medical reasons." Vox Sang 42(1): 1-7.
Bosnes, V., M. Aldrin, et al. (2005). "Predicting blood donor arrival." Transfusion 45(2): 162-70.
Boulton, F. (2004). "Managing donors and iron deficiency." Vox Sang 87(s2): 22-24. Brittenham, G., V. R. Gordeuk, et al. (1996). "Carbonyl iron supplementation for female
blood donors." Blood 88(10(suppl)): 896. Brittenham, G. M., H. G. Klein, et al. (2001). "Preserving the national blood supply."
Hematology: 422-32.
333
Burke, P. J. and D. C. Reitzes (1981). "The link between identity and role performance." Social psychology quarterly 44(2): 83-92.
Cable, R. (1999). "The effect of blood donor syncopal reactions on subsequent blood donations (abstract)." Transfusion 39(S114).
Cable, R. G. (1995). "Hemoglobin determination in blood donors." Transfusion Medicine Reviews 9(2): 131-44.
Callero, P. (1985). "Role-Identity Salience." Social Psychology Quarterly 48(3): 203-215. Callero, P. and J. Piliavin (1983). "Development a commitment to blood donation: the
impact of one's first experience." Journal of Applied Social Psychology 13(1): 1-16. Cancado, R. D., C. S. Chiattone, et al. (2001). "Iron deficiency in blood donors." Sao Paulo
Med J 119(4): 132-4; discussion 131. Candy, S. (2009). personal communication. Chamla, J. H., L. S. Leland, et al. (2006). "Eliciting repeat blood donations: tell early career
donors why their blood is special and more will give again." Vox Sanguinis 90: 302-307.
Charng, H., J. Piliavin, et al. (1988). "Role identity and reasoned action in the prediction of repeated behavior." social psychology quarterly 51(4): 303-317.
Cheuk, W. H. and S. Rosen (1993). "How efficacious, caring Samaritans cope when their help is rejected unexpectantly." Current Psychology 12(2): 99-112.
Cheuk, W. H. and S. Rosen (1996). "The moderating influence of percieved importance on rejected helpers' reactions." Basic and Applied Social Psychology 18(2): 195-210.
Cheuk, W. H., K. S. Wong, et al. (2000). "Further efforts in validating a 'spurning scale' for teachers." Educational research 42(2): 219-225.
Cheuk, W. H., K. S. Wong, et al. (2002). "Validation of a 'spurning scale' for teachers: the Chinese sample." Educational research 44(3): 289-297.
Cheuk, W. H., K. S. Wong, et al. (2003). "Validating a 'spurning scale' for nurses in Hong Kong." Current Psychology: Developmental, Learning, Personality, Social 22(1): 47-56.
Corbaic, L. and K. Baghurst (1993). Iron status and dietary iron intakes of Australians. Adelaide, CSIRO Division of Human Nutrition.
Council of Europe (2006). Guide to the preparation, use and quality assurance of blood components., Council of Europe Publishing.
Creswell, J. W., V. L. Plano Clark, et al. (2003). Advanced mixed methods research designs. Handbook of mixed methods in social and behavioural research. A. Tashakkori and C. Teddlie. Thousand Oaks, Sage publications: 209-240.
Custer, B., A. Chinn, et al. (2007). "The consequences of temporary deferral on future whole blood donation." Transfusion 47(8): 1514-1523.
Custer, B., E. S. Johnson, et al. (2004). "Quantifying losses to the donated blood supply due to donor deferral and miscollection." Transfusion 44(10): 1417-26.
Daigneault, S. and J. Blais (2004). "Rethinking the donation experience: an integrated approach to improve the efficiency and the quality of each blood donation experience." Vox Sang 87 Suppl 2: 72-5.
Daly, J., K. Willis, et al. (2007). "A hierarchy of evidence for assessing qualitative health research." Journal of clinical epidemiology 60: 43-49.
Davey, R. J. (2004). "Recruiting blood donors: challenges and opportunities." Transfusion 44(4): 597-600.
Devine, D., M. Goldman, et al. (2007). "Donor recruitment research." Vox Sanguinis 93(3): 250-259.
Doust, J. (2003). "Diagnostic and management strategies for anaemia in adults." Aust Fam Physician 32(11): 889-94.

334
Falter, E. and R. F. Reiss (1981). "Effect of counselling rejected blood donors to seek health care." Patient Couns Health Educ 3(2): 67-70.
Farmer, S. M. and D. B. Fedor (1999). "Volunteer Participation and Withdrawal: A Psychological Contract Perspective on the Role of Expectations and Organizational Support." Nonprofit management and leadership 9(4): 349-367.
Farrell, R. J. and J. T. LaMont (1998). "Rational approach to iron-deficiency anaemia in premenopausal women." Lancet 352(9145): 1953-4.
Ferguson, B. J., B. S. Skikne, et al. (1992). "Serum transferrin receptor distinguishes the anemia of chronic disease from iron deficiency anemia." journal of laboratory and clinical medicine 119(4): 385-90.
Ferguson, E. (1996). "Predictors of future behaviour: A review of the psychological literature on blood donation." British Journal of health psychology 1: 287-308.
Ferguson, E. and P. A. Bibby (2002). "Predicting future blood donor returns: past behavior, intentions, and observer effects." Health Psychology: Official Journal of the Division of Health Psychology, American Psychological Association 21(5): 513-8.
Fernandez-Montoya, A. (1997). "Altruism and payment in blood donation." Transfus Sci 18(3): 379-86.
Fishbein, M. and I. Ajzen (1975). Belief, attitude, intention, and behavior: An introduction to theory and research. Reading, M.A., Addison-Wesley.
Flegel, W. A., W. Besenfelder, et al. (2000). "Predicting a donor's likelihood of donating within a preselected time interval." Transfusion Medicine (Oxford, England) 10(3): 181-92.
France, C. R., J. L. France, et al. (2004). "Mild reactions to blood donation predict a decreased likelihood of donor return." Transfus Apheresis Sci 30(1): 17-22.
France, J. L., C. R. France, et al. (2007). "A path analysis of intention to redonate among experienced blood donors: an extension of the theory of planned behavior." Transfusion 47: 1006-13.
Garry, P. J., K. M. Koehler, et al. (1995). "Iron stores and iron absorption: effects of repeated blood donations." american journal of clinical nutrition 62(3): 611-20.
Germain, M., S. A. Glynn, et al. (2007). "Determinants of return behavior: a comparison of current and lapsed donors." Transfusion 47(10): 1862-70.
Giddens, A. (1991). Modernity and self-identity. Stanford, Stanford University Press. Giles, M. and E. Cairns (1995). "Blood donation and Ajzen's theory of planned behaviour:
an examination of perceived behavioural control." The British Journal of Social Psychology / the British Psychological Society 34 (Pt 2): 173-88.
Giles, M., C. McClenahan, et al. (2004). "An application of the Theory of Planned Behaviour to blood donation: the importance of self-efficacy." Health Education Research 19(4): 380-391.
Gillespie, T. W. and C. D. Hillyer (2002). "Blood donors and factors impacting the blood donation decision." Transfusion Medicine Reviews 16(2): 115-30.
Gimble, J. G., L. Kline, et al. (1994). "Effects of new brochures on blood donor recruitment and retention." Transfusion 34(7): 586-91.
Glynn, S. A., S. H. Kleinman, et al. (2002). "Motivations to donate blood: demographic comparisons." Transfusion 42(2): 216-225.
Glynn, S. A., A. E. Williams, et al. (2003). "Attitudes toward blood donation incentives in the United States: implications for donor recruitment." Transfusion 43(1): 7-16.
Goddard, A. F., A. S. McIntyre, et al. (1999). "Iron-deficiency anaemia in premenopausal women." Lancet 353(9157): 1014-5; discussion 1015-6.
Godin, G., M. Conner, et al. (2007). "Determinants of repeated blood donation among new and experienced blood donors." Transfusion 47: 1607-1615.

335
Goette, L., A. Stutzer, et al. (2009). "Free cholesterol testing as a motivation device in blood donations: evidence from field experiments." Transfusion 49: 524-531.
Gordeuk, V. R., G. M. Brittenham, et al. (1990). "Prevention of iron deficiency with carbonyl iron in female blood donors." Transfusion 30(3): 239-45.
Gordeuk, V. R., G. M. Brittenham, et al. (1987). "Carbonyl iron for short-term supplementation in female blood donors." Transfusion 27(1): 80-5.
Gordis, L. (2000). Epidemiology. Philadelphia, W.B. Saunders Company. Greene, J. and V. J. Caracelli (2003). Making paradigmatic sense of mixed methods
practice. Handbook of mixed methods in social and behavioural research. A. Tashakkori and C. Teddlie. Thousand Oaks, Sage Publications: 91-110.
Halperin, D., J. Baetens, et al. (1998). "The effect of short-term, temporary deferral on future blood donation." Transfusion 38(2): 181-3.
Hart, A. R., B. Jestico, et al. (1996). "Blood donor centres can effectively publicise cancer screening." Public Health 110(4): 247-9.
Healy, K. (2000). "Embedded altruism: blood collection regimes and the European Union's donor population." The American Journal of Sociology 105(6): 1633-1657.
Heath, A. L., C. M. Skeaff, et al. (2001). "Can dietary treatment of non-anemic iron deficiency improve iron status?" J Am Coll Nutr 20(5): 477-84.
HemoCue AB. (2007). "HemoCue product website." Retrieved 31st December, 2007, from http://www.hemocue.com/.
Herrmann, R. P. (1994). "Iron deficiency. Current trends and fads." australian family physician 23(8): 1457-61.
Hin, H., R. Lehman, et al. (1999). "Iron-deficiency anaemia in premenopausal women." Lancet 353(9157): 1015-6.
Holdershaw, J., P. Gendall, et al. (2003). "Predicting Willingness to Donate Blood." Australasian Marketing Journal 11(1): 87-96.
Hosmer, D. W. and S. Lemeshow (2000). Applied logistic regression. New York, Wiley-Interscience Publication.
Howden-Chapman, P., J. Carter, et al. (1996). "Blood money: blood donors' attitudes to changes in the New Zealand blood transfusion service." Bmj (Clinical Research Ed.) 312(7039): 1131-2.
Hupfer, M. E., D. W. Taylor, et al. (2005). "Understanding Canadian student motivations and beliefs about giving blood." Transfusion 45: 149-161.
Hustinx, L. and F. Lammertyn (2003). "Collective and reflexive styles of volunteering: a sociological modernization perspective." Voluntas: International Journal of Voluntary and Nonprofit Organisations 14(2): 167-187.
James, R. C. and D. E. Matthews (1993). "The donation cycle: a framework for the measurement and analysis of blood donor return behaviour." Vox Sanguinis 64(1): 37-42.
Jobuck, J., P. Lau, et al. (1980). "Deferred blood donors- The neglected resources." Transfusion 20(5): 614-615.
Katz, A. J. and A. Kabat (2007). "Return behavior of blood donors after expiration of a 1-year malarial travel deferral." Transfusion 47(2): 356–357.
Keown, J. (1997). "The gift of blood in Europe: an ethical defence of EC directive 89/381." J Med Ethics 23(2): 96-100.
Kleinman, S., B. Wang, et al. (2004). "The donor notification process from the donor's perspective." Transfusion 44(5): 658-66.
Kolins, J. and R. Herron (2003). "On bowling alone and donor recruitment: lessons to be learned." Transfusion 43(11): 1634-8.
Labaw, P. J. (1980). Advanced questionnaire design. Cambridge, Abt books.

336
Lee, L. (1999). "Giving time, money and blood: similarities and differences." Social psychology quarterly 62(3): 276-290.
Leggett, B. A., N. N. Brown, et al. (1990). "Factors affecting the concentrations of ferritin in serum in a healthy Australian population." Clin Chem 36(7): 1350-5.
Logan, E. C., J. M. Yates, et al. (2002). "Investigation and management of iron deficiency anaemia in general practice: a cluster randomised controlled trial of a simple management prompt." Postgrad Med J 78(923): 533-7.
Long, J. S. (1997). Regression models for categorical and limited dependent variables. Thousand Oaks, Sage publications.
Love, R. (2007). Personal communication. Machin, D. and M. J. Campbell (1987). Statistical Tables for the Design of Clinical Trials.
Oxford, Blackwell Scientific Publications. Masser, B. M., K. M. White, et al. (2008). "The Psychology of Blood Donation: Current
Research and Future Directions." Transfusion Medicine Reviews 22(3): 215-233. Masser, B. M., K. M. White, et al. (2009). "Predicting blood donation intentions and
behavior among Australian blood donors: testing an extended theory of planned behavior model." Transfusion 49: 320-329.
Mathew, S. M., M. R. King, et al. (2007). "Opinions about donating blood among those who never gave and those who stopped: a focus group assessment." Transfusion 47(4): 729-735.
Mauss, M. (1970). The gift: forms and functions of exchange in archaic societies. London, Cohen and West LTD.
McCall, G. J. and J. L. Simmons (1978). Identities and interactions. New York, The Free Press.
McCredie, J. (2005). "Haemoglobin extremes a risk." Australian Doctor Retrieved 7/11/2005, 2005, from http://www.australiandoctor.com.au/articles/c3/0c037fc3.asp.
McCullagh, P. and J. A. Nelder (1989). Generalised linear models. London, Chapman and Hall.
Misje, A. H., V. Bosnes, et al. (2005). "Motivation, recruitment and retention of voluntary non-remunerated blood donors: a survey-based questionnaire study." Vox Sang 89(4): 236-44.
Morse, J. E. (2003). Principles of mixed methods and multimethod research design. Handbook of mixed methods in social and behavioral research. A. Tashakkori and C. Teddlie. Thousand Oaks, Sage Publications.
Nemo, G., L. Harvath, et al. (2001). "Workshop on maintaining iron balance in women blood donors of child-bearing age: meeting summary." Retrieved 17/11/2004, 2004, from http://www.nhlbi.nih.gov/meetings/ironmtg.htm.
Newman, B. (2006). "Iron depletion by whole-blood donation harms menstruating females: the current whole-blood-collection paradigm needs to be changed." Transfusion 46(10): 1667-81.
Newman, B. H. (2004). "Adjusting our management of female blood donors: the key to an adequate blood supply." Transfusion 44(4): 591-6.
Newman, B. H., S. Pichette, et al. (2003). "Adverse effects in blood donors after whole-blood donation: a study of 1000 blood donors interviewed 3 weeks after whole-blood donation." Transfusion 43(5): 598-603.
Nilsson-Sojka, B. and P. Sojka (2003). "The blood-donation experience: perceived physical, psychological and social impact of blood donation on the donor." Vox Sanguinis 84(2): 120-8.

337
Noonan, A. E., J. E. Menitove, et al. (1981). "Temporarily deferred donors: Do you love them or leave them?" Transfusion 21(5): 591.
O'Brien, S. F. (2006). "Donor research: the foundation for a healthy blood supply." Transfusion 46: 1069-1071.
O'Cathain, A. and K. Thomas (2006). Combining qualitative and quantitative methods. Qualitative research in health care. C. Pope and N. Mays. London, BMJ Books.
Oswalt, R. M. (1977). "A review of blood donor motivation and recruitment." Transfusion 17(2): 123-35.
Ownby, H. E., F. Kong, et al. (1999). "Analysis of donor return behavior. Retrovirus Epidemiology Donor Study." Transfusion 39(10): 1128-35.
Patterson, A. J., W. J. Brown, et al. (2000). "Iron deficiency, general health and fatigue: results from the Australian Longitudinal Study on Women's Health." Qual Life Res 9(5): 491-7.
Piliavin, J. (1987). "Temporary deferral and donor return." Transfusion 27(2): 199-200. Piliavin, J. and P. Callero (1991). Giving blood: the development of an altruistic identity.
Baltimore, The John Hopkins University Press. Piliavin, J., D. Evans, et al. (1984). Learning to "give to unnamed strangers": The process
of commitment to regular blood donation. Development and maintenance of prosocial behaviour. E. Staub, D. Bar-Tal, J. Karylowski and J. Reykowski. New York, Plenum Press: 471-492.
Piliavin, J. A. (1990). "Why do they give the gift of life? A review of research on blood donors since 1977." Transfusion 30(5): 444-59.
Popay, J., A. Rogers, et al. (1998). "Rationale and standards for the systematic review of qualitative literature in health services research." Qualitative Health Research 8(3): 341.
Power, T. E. and P. C. Adams (2001). "Psychosocial impact of C282Y mutation testing for hemochromatosis." Genet Test 5(2): 107-10.
Pusey, M. (2000). Midde Australians in the grip of economic "reform".Will they volunteer? Volunteers and volunteering. J. Warbuton and M. Oppenheimer, The federation press: 19-31.
QSR International (2007). NVivo7. Radtke, H., T. Meyer, et al. (2005). "Rapid identification of iron deficiency in blood donors
with red cell indexes provided by Advia 120." Transfusion 45(1): 5-10. Radtke, H., J. Tegtmeier, et al. (2005). "Compensating for iron loss in regular blood donors
using ferrous gluconate and ascorbic acid." Transfusion 45(7): 1236-7. Ranasinghe, E. and J. F. Harrison (2000). "Bruising following blood donation, its
management and the response and subsequent return rates of affected donors." Transfus Med 10(2): 113-6.
Rangan, A. M., I. Aitkin, et al. (1997). "Factors affecting iron status in 15-30 year old female students." Asia Pacific J Clin Nutr 6(4): 291-295.
Rapport, F. L. and C. J. Maggs (2002). "Titmuss and the gift relationship: altruism revisited." Journal of Advanced Nursing 40(5): 495-503.
Reed, A. (2002). "Social identity as a useful perspective for self-concept-based consumer research." Psychology and Marketing 19(3): 235-266.
Reich, P., P. Roberts, et al. (2006). "A randomized trial of blood donor recruitment strategies." Transfusion 46: 1090-1096.
Ritchie, J. and L. Spencer (1993). Qualitative data analysis for applied policy research. Analysing qualitative data. A. Bryman and R. Burgess. London, Routledge: 173-194.
Robinson, E. A. (1999). "Altruism: is it alive and well?" Transfusion Medicine 9: 351-382.

338
Ronis, D. L., J. F. Yates, et al. (1989). Attitudes, decisons and habits as determinants of repeat behaviour. Attitude Structure and Function. A. R. Pratkanis, S. J. Breckler and A. G. Greenwald, Lawrence Erlbaum Associates.
Rosen, S., S. Mickler, et al. (1986). "The spurned philanthropist." Humboldt Journal of Social Relations 13(1): 145-158.
Rosen, S., S. E. Mickler, et al. (1987). "Reactions of would-be helpers whose offer of help is spurned." Journal of Personality and Social psychology 53(2): 288-297.
Ross, E. M. (2002). "Evaluation and treatment of iron deficiency in adults." Nutr Clin Care 5(5): 220-4.
Rousseau, D. M. (1989). "Psychological and implied contracts in organizations." Employee responsibilities and rights journal 2(2): 121-139.
Sanchez, A. M., D. I. Ameti, et al. (2001). "The potential impact of incentives on future blood donation behavior." Transfusion 41(2): 172-8.
Schlumpf, K. S., S. A. Glynn, et al. (2008). "Factors influencing donor return." Transfusion 48: 264-272.
Schreiber, G. B., K. S. Schlumpf, et al. (2006). "Convenience, the bane of our existence, and other barriers to donating." Transfusion 46(4): 545-553.
Schreiber, G. B., U. K. Sharma, et al. (2005). "First year donation patterns predict long-term commitment for first-time donors." Vox Sanguinis 88(2): 114-121.
Schwartz, J. (1999). "Blood and altruism- Richard M. Titmuss' criticism on the commercialization of blood." Public Interest Summer, 1999.
Sempos, C. T. (2002). "Do body iron stores increase the risk of developing coronary heart disease?" Am J Clin Nutr 76(3): 501-3.
Sets, J. and P. Burke (2003). A sociological approach to self and identity. Handbook of self and identity. New York, The Guilford Press: 128-152.
Simon, T. L. (2002). "Iron, iron everywhere but not enough to donate." Transfusion 42(6): 664-664.
Simon, T. L. (2003). "Where have all the donors gone? A personal reflection on the crisis in America's volunteer blood program." Transfusion 43(2): 273-9.
StataCorp (2005). Stata Statistical Software: Release 9. College Station, TX, StataCorp LP. Statistical Solutions (2005). nQuery Advisor 6.0. Steele, W. R., G. B. Schreiber, et al. (2008). "The role of altruistic behavior, empathetic
concern, and social responsibility motivation in blood donation behavior." Transfusion 48(1): 43-54.
Stellon, A. J. and S. E. Kenwright (1997). "Iron deficiency anaemia in general practice: presentations and investigations." Br J Clin Pract 51(2): 78-80.
Stewart, K. R., C. R. France, et al. (2006). "Phlebotomist interpersonal skills predicts a reduction in reactions among volunteer blood donors." Transfusion 46: 1394-1401.
Stolle, D. and M. Hooghe (2004). "Inaccurate, exceptional, one-sided or irrelevant? The debate about the alleged decline of social capital and civic engagement in western societies." British Journal of Political Science 35: 149-167.
Tausend, S., T. Koepsell, et al. (1991). "Survival curve analysis as a means of evaluating donor return rates. (Abstract)." Transfusion 31 (Suppl): 71S.
Titmuss, R. M. (1997). The Gift Relationship: From human blood to social policy. New York, The New Press.
Unsworth, D. J., R. J. Lock, et al. (2000). "Improving the diagnosis of coeliac disease in anaemic women." British Journal of Haematology 111(3): 898-901.
Valentine, K. (2005). "Citizenship, Identity, Blood donation." Body and Society 11(2): 113-128.

339
van Belle, G., L. D. Fisher, et al. (2004). Biostatistics: A methodology for the health sciences. Hoboken, John Wiley & Sons.
Verplanken, B. and W. Wood (2006). "Interventions to Break and Create Consumer Habits." Journal of public policy and marketing 25(1): 90–103.
Walter, M. (2006a). The nature of social science research. Social research methods: an Australian perspective. M. Walter. Melbourne, Oxford University Press: 1-28.
Walter, M. (2006b). Surveys and Sampling. Social research methods. M. Walter. South Melbourne, Oxford University Press.
Walz, E., D. McMullen, et al. (1985). "The recruitment of donors who have been temporarily deferred for upper respiratory infection or low hematocrit." Transfusion 25(5): 485 (A10).
Whittaker, S., N. Carter, et al. (2008). "Understanding the meaning of permanent deferral for blood donors." Transfusion 48: 64-72.
WHO. (2008, 2008). "Voluntary blood donation." Retrieved 4th of March, 2008, from http://www.who.int/bloodsafety/voluntary_donation/en/.
Whyte, G. (1999). "Quantitating donor behaviour to model the effect of changes in donor management on sufficiency in the blood service." Vox Sanguinis 76(4): 209-15.
Williams, R. (2006). "Generalised ordered logit/ partial proportional odds models for ordinal dependent variables." The Stata Journal 6(1): 58-82.
Willis, K. (2006). Analysing qualitative data. Social research methods: An Australian perspective. M. Walter. South Melbourne, Oxford University Press: 257-279.
Wood, W., L. Tam, et al. (2005). "Changing circumstances, dirsupting habits." Journal of Personality and Social Psychology 88(6): 918–933.
World Health Organisation (2001). Iron Deficiency Anaemia: Assessment, Prevention, and Control. A guide for programme managers.
World Health Organisation. (2003, 09/04/2003). "Battling iron deficiency anaemia." Retrieved 18/04/2005, 2005, from www.who.int.nut.ida.htm.
Yates, J. M., E. C. Logan, et al. (2004). "Iron deficiency anaemia in general practice: clinical outcomes over three years and factors influencing diagnostic investigations." Postgrad Med J 80(945): 405-10.
Yu, P. L. H., K. H. Chung, et al. (2007). "Predicting potential drop-out and future committment for first-time donors based on first 1.5-year donation patterns: the case in Hong Kong Chinese donors." Vox Sanguinis 93: 57-63.
Zuck, T. F., R. A. Thomson, et al. (1995). "The Retrovirus Epidemiology Donor Study (REDS): rationale and methods." Transfusion 35(11): 944-951.

340
Appendices

Appendix 1: Interview Guide for the Qualitative Interviews

Key Question Factors Requiring Exploration Can you tell me about your experience as a blood donor?
• How long have you been donating? • Where do you usually go? • Why did you start donating (What drew you)? • What keeps you coming back? • Who do you see yourself helping? • What does being a blood donor mean to you? • Have you ever thought about not donating any more?
o What made you come back? o (if no) What would make you think about not donating?
• Have you had any breaks from donating since you started? • Are there any positive aspects of donating blood for you? • Are there any negative aspects of blood donation for you?
What is your understanding about what the Australian Red Cross Blood Service does?
• What does it do? • Who does it do it for? • What does it offer donors? • How well do you think it does this? • Do you think the blood service encourages commitment from blood
donors? Why/ why not? How does it do this/not do this? • Do you think the blood service shows appreciation to blood donors?
Why/ why not? How does it do this/not do this?
I’d now like to ask you about your deferral. Could you tell me what happened when you were deferred, in as much detail as you remember?
• Do you remember what you were told by the interview nurse? • Did you discuss any reasons why your levels might be low? • How did you feel when you were deferred? • How do you feel now that time has passed? • Have you talked to anyone about what happened?
What is your understanding of the reason you were deferred at that level?
• Why do you think your levels are low? • What is your understanding of what haemoglobin does? • What does it mean to have low haemoglobin? • What are your thoughts about the length of time you have been deferred?
How should the blood service look after people who have low haemoglobin?
• What should happen from here on in? • Is there anything that should change about the way donors are deferred?
Did you have any idea you might have been deferred?
• Did you know you had low haemoglobin? • Did you know donors could be deferred?
What are you thoughts about returning to donate?
• What would happen if you were deferred again? • Do you think being deferred has changed your thoughts about donating
blood? – (if it didn't change their mind, why didn't it? if it did, in what ways?)
• What would you do if you weren’t able to donate anymore? • Some research has shown that donors are less likely to return to donate
after they’ve been deferred. Why do you think this might be?
I’d now like to ask you to think about volunteering.
• Do you currently do any volunteer work? • Do you think blood donation is a type of volunteer activity? Why/ why
not? • How do you think blood donation compares to volunteering? • How do you think blood donation compares donating money to a charity?

Appendix 2: Information letter for Qualitative Interviews
Date
Address
Dear,
This letter is an invitation to consider participating in a study I am conducting as part of my Doctorate degree in the Department of Public Health at the University of Adelaide, in conjunction with the Australian Red Cross Blood Service. This research will be conducted under the supervision of A/Prof Philip Ryan and Dr Vivienne Moore of the Department of Public Health, and Dr Kathleen Doherty of the Australian Red Cross Blood Service. I would like to provide you with some information about this project and what your involvement will entail if you decide to take part.
To protect blood donors’ health and wellbeing, the Australian Red Cross Blood Service has recently changed the acceptable haemoglobin range for blood donation. Haemoglobin is the oxygen-carrying substance in red blood cells and levels are checked by a finger-prick test before your donation. You may have heard this referred to as checking your “iron” levels. If haemoglobin levels are too low, donors are deferred temporarily from donating blood.
We do not know how donors feel about the explanation and advice they are given regarding their temporary deferral from donating blood, and we would like to find out.
You are a donor recently deferred for low haemoglobin levels. I am very keen to speak to you about your satisfaction with the information and advice you received at your deferral. I am also interested in your previous experience as a blood donor (if any) and how being deferred made you feel.
Participation in this study is entirely voluntary. It will involve an interview of approximately 30 minutes in length to take place in a mutually agreed upon location. You may decline to answer any of the interview questions if you so wish. Further, you may decide to withdraw from this study at any time, without any negative consequences, by advising the researcher. With your permission, the interview will be tape-recorded to facilitate collection of information and later transcribed for analysis. Shortly after the interview has been completed, I will send you a copy of the transcript to give you an opportunity to confirm the accuracy of our conversation and to add or clarify any points that you wish.

All the information you provide will be considered completely confidential. Your name will not appear in any thesis or report resulting from this study; however, with your permission, anonymous quotations may be used. The study is being supported by the Australian Red Cross Blood Service and will build on previous research in this area. Data collected during this study will be securely retained for 20 years and only researchers associated with this project will have access. There are no known or anticipated risks to you as a participant in this study.
If you have any questions regarding this study, or would like additional information to assist you in reaching a decision about participation, please contact me at 08 8422 1364 or by email at [email protected]. You can also contact my supervisor, A/Prof Philip Ryan at (08) 8303 3570 or email [email protected].
I would like to assure you that this study has been reviewed and has received ethics clearance through both the University of Adelaide and the Australian Red Cross Blood Service Human Research Ethics Committees. However, the final decision about participation is yours. If you have any comments or concerns resulting from your participation in this study, please contact the Secretary of the Human Research Ethics Committee, Australian Red Cross Blood Service on (03) 9863 1606 (phone) or (03) 9863 1620 (fax).
I hope that the results of my study will be of benefit to the Australian Red Cross Blood Service, other voluntary organizations not directly involved in the study, as well as to the broader research community.
It is my intention to telephone you a few days after you receive this letter to determine your interest in participating and, if you are happy to be involved, to establish a time and place for our meeting. If you would prefer not to be contacted, you are invited to notify the research team on (08) 8422 1364. Alternatively, please leave a message with the ARCBS reception desk on (08) 8422 1200. Your decision as to whether or not to participate will not in any way affect your future relations with the Australian Red Cross Blood Service.
I look forward very much to speaking with you and I thank you in advance for your assistance in this project.
Yours sincerely,
Tessa Hillgrove
Doctoral Candidate
Department of Public Health, University of Adelaide

Appendix 3: Section of coded transcript showing selected codes

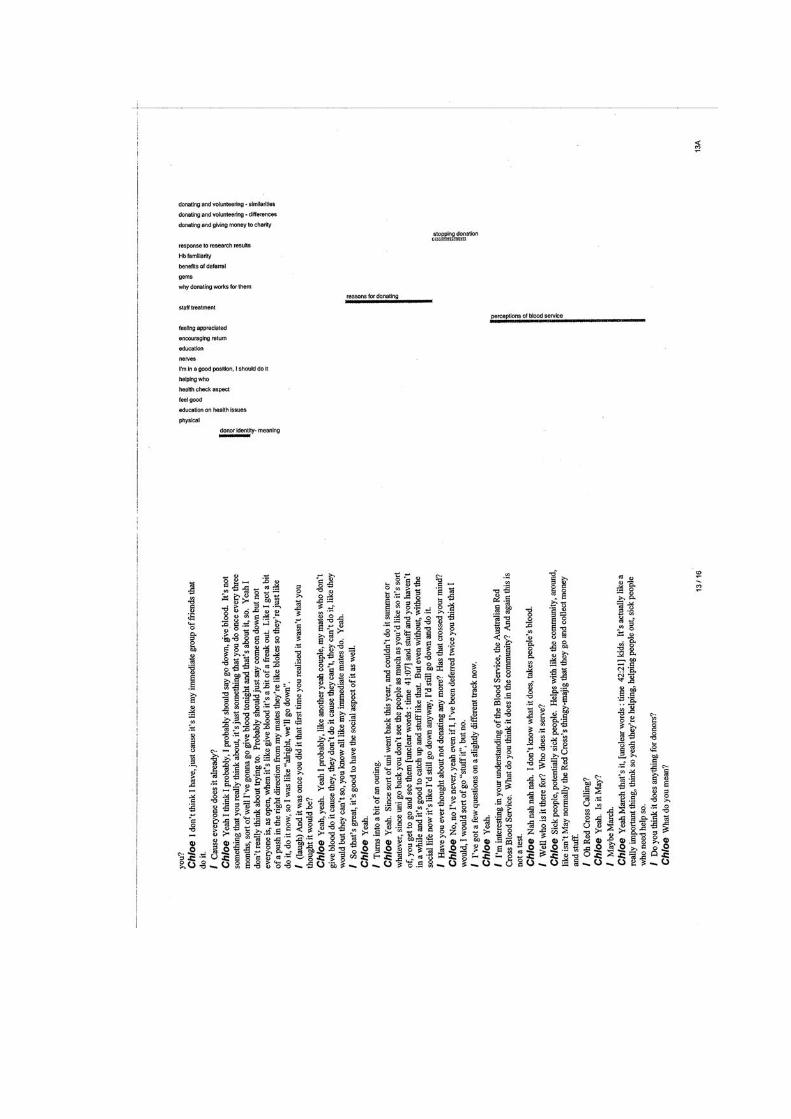

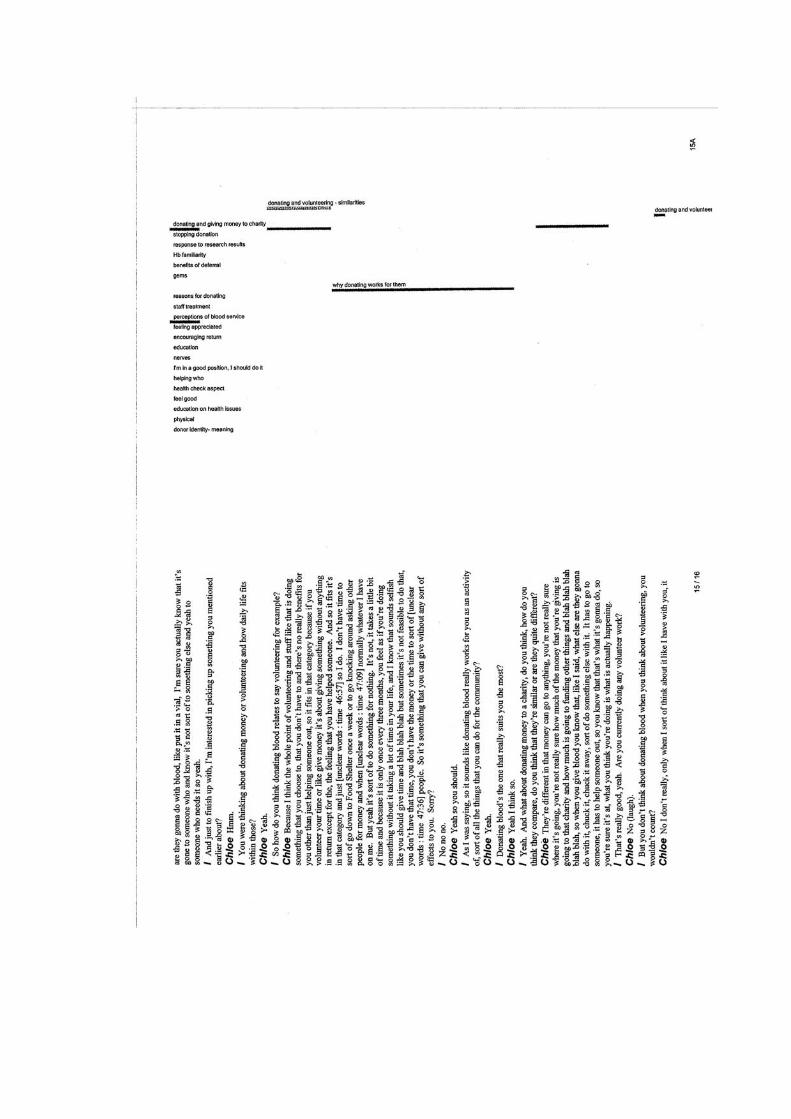

Appendix 4: Questionnaire for the Three Months Later study
Survey of Blood Donors Deferred due to Low Haemoglobin
Instructions:
Please answer ALL the questions that apply to you. Follow the directions for each set of questions. Some questions require you to tick boxes, and other to circle your response. Some questions will ask you to provide a brief written response. There are no right or wrong answers. People have a range of experiences when they are deferred, and we are interested in your experience. Please answer questions as honestly as possible. We will not be able to identify your individual responses.

SECTION A When you came to donate blood in April of 2008, you had a finger-prick test to check your haemoglobin level. This test showed that your haemoglobin level was below the acceptable range for donation. The following questions relate to your experience at that visit.
1. Please rate the following aspects of your deferral from blood donation, by ticking the corresponding box.
ExcellentVery Good Good Fair Poor
Very Poor
Don’t recall
1 2 3 4 5 6 7 a)
The nurse’s explanation of the reason for my deferral, in a way that I could understand
1 2 3 4 5 6 7 b)
The nurse’s explanation about haemoglobin and/or iron levels, in a way that I could understand
1 2 3 4 5 6 7 c) The nurse’s ability to answer any
questions
1 2 3 4 5 6 7 d) The way I was made to feel
appreciated as a donor
1 2 3 4 5 6 7 e) The nurse’s concern for me as a
person
2. What do you think were the most important considerations when you were deferred from donating blood? (tick the corresponding box)
Not at all a consideration
A minor consideration
An important consideration
1 2 3 a) My own health- my wellbeing
1 2 3 b) My own health- a possible
underlying condition 1 2 3 c) The health of the person receiving
my blood 1 2 3 d) Blood service regulations about
acceptance levels
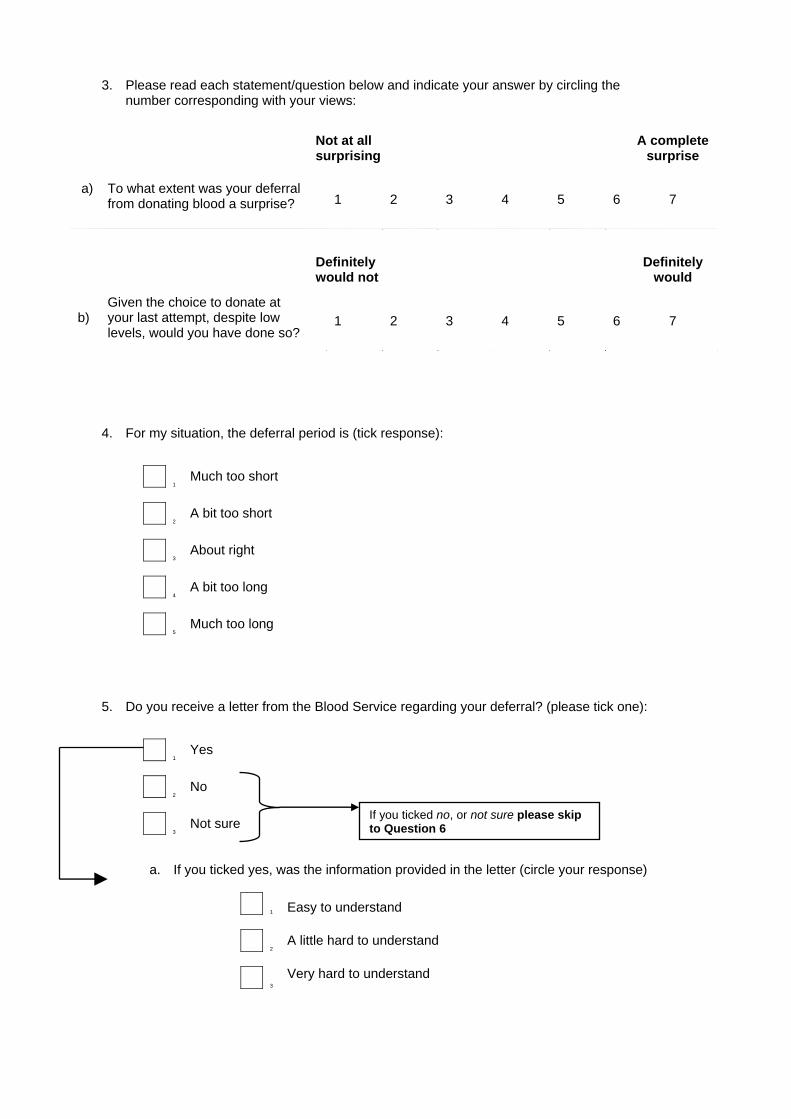
3. Please read each statement/question below and indicate your answer by circling the
number corresponding with your views:
Not at all surprising
A complete surprise
1 2 3 4 5 6 7
a)
To what extent was your deferral from donating blood a surprise?
Definitely would not
Definitely would
1 2 3 4 5 6 7 b)
Given the choice to donate at your last attempt, despite low levels, would you have done so?
4. For my situation, the deferral period is (tick response):
1 Much too short
2 A bit too short
3 About right
4 A bit too long
5 Much too long
5. Do you receive a letter from the Blood Service regarding your deferral? (please tick one):
1 Yes
2 No
3 Not sure
a. If you ticked yes, was the information provided in the letter (circle your response)
1 Easy to understand
2 A little hard to understand
3 Very hard to understand
If you ticked no, or not sure please skip to Question 6
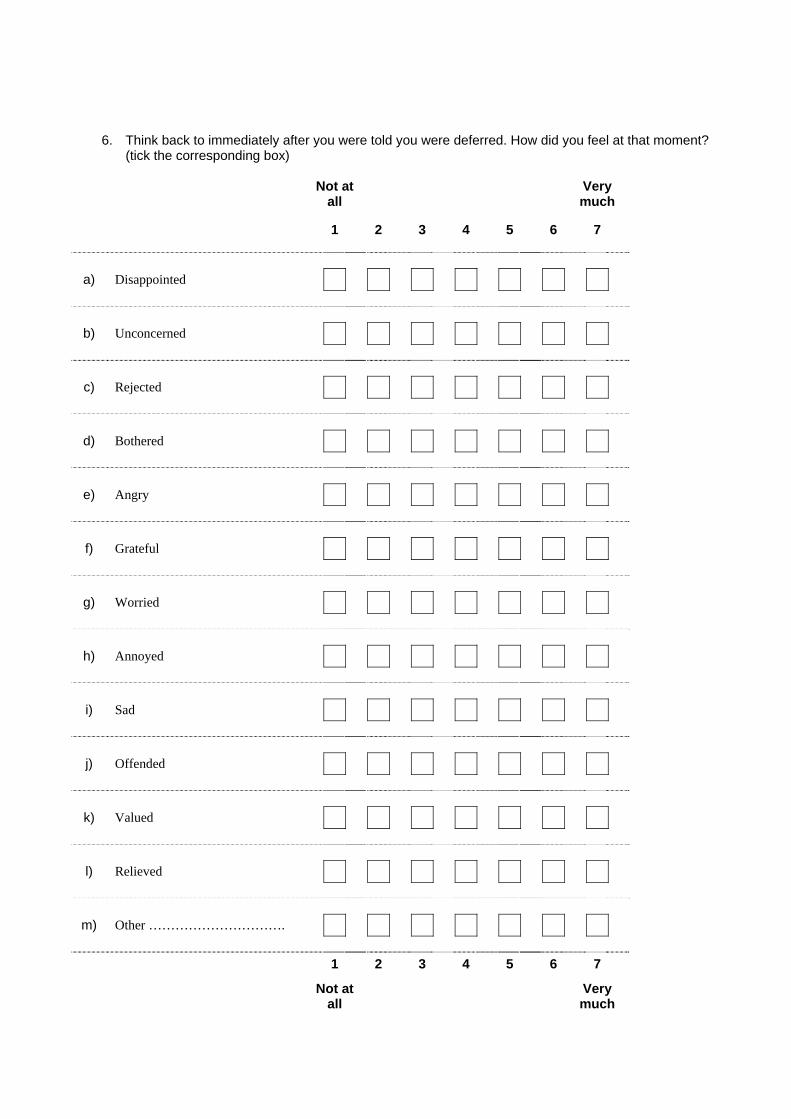
6. Think back to immediately after you were told you were deferred. How did you feel at that moment? (tick the corresponding box)
Not at all
Very much
1 2 3 4 5 6 7
a) Disappointed b) Unconcerned c) Rejected d) Bothered e) Angry f) Grateful g) Worried h) Annoyed i) Sad j) Offended k) Valued l) Relieved m) Other ………………………….
1 2 3 4 5 6 7
Not at
all Very much
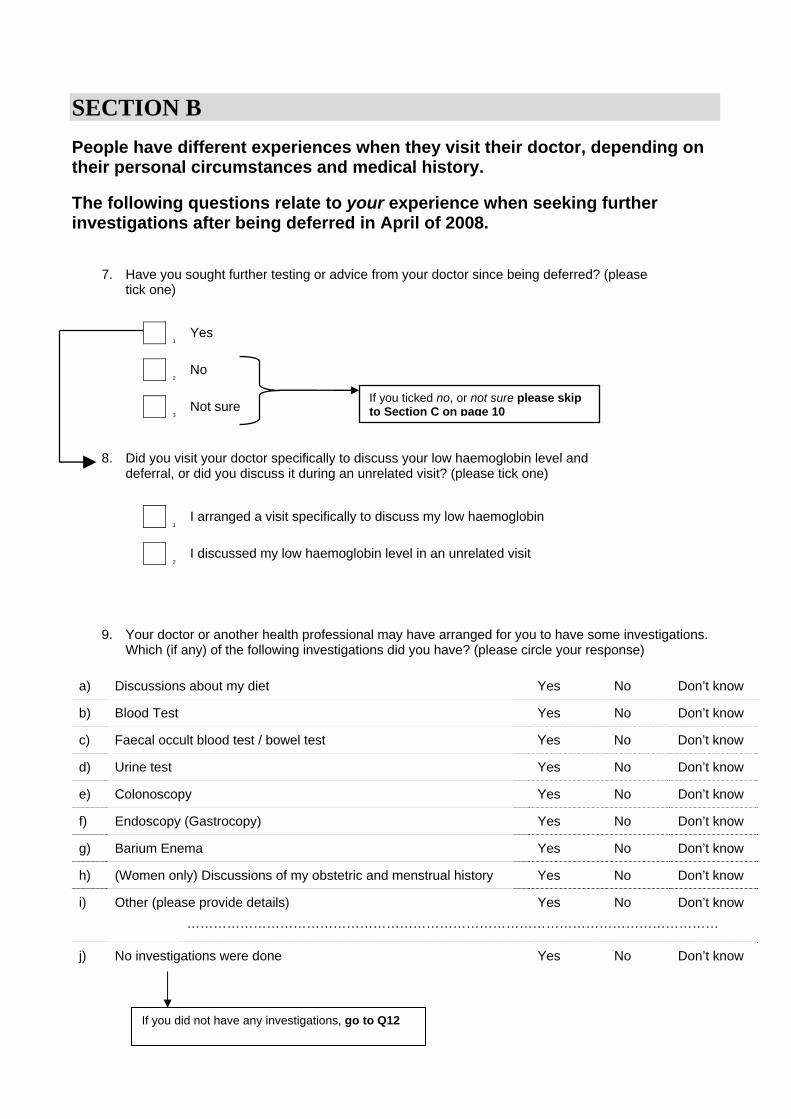
SECTION B People have different experiences when they visit their doctor, depending on their personal circumstances and medical history.
The following questions relate to your experience when seeking further investigations after being deferred in April of 2008.
7. Have you sought further testing or advice from your doctor since being deferred? (please
tick one)
1 Yes
2 No
3 Not sure
8. Did you visit your doctor specifically to discuss your low haemoglobin level and
deferral, or did you discuss it during an unrelated visit? (please tick one)
1 I arranged a visit specifically to discuss my low haemoglobin
2 I discussed my low haemoglobin level in an unrelated visit
9. Your doctor or another health professional may have arranged for you to have some investigations. Which (if any) of the following investigations did you have? (please circle your response)
a) Discussions about my diet Yes No Don’t know
b) Blood Test Yes No Don’t know
c) Faecal occult blood test / bowel test Yes No Don’t know
d) Urine test Yes No Don’t know
e) Colonoscopy Yes No Don’t know
f) Endoscopy (Gastrocopy) Yes No Don’t know
g) Barium Enema Yes No Don’t know
h) (Women only) Discussions of my obstetric and menstrual history Yes No Don’t know
i) Other (please provide details) Yes No Don’t know …………………………………………………………………………………………………………
j) No investigations were done Yes No Don’t know
If you ticked no, or not sure please skip to Section C on page 10
If you did not have any investigations, go to Q12
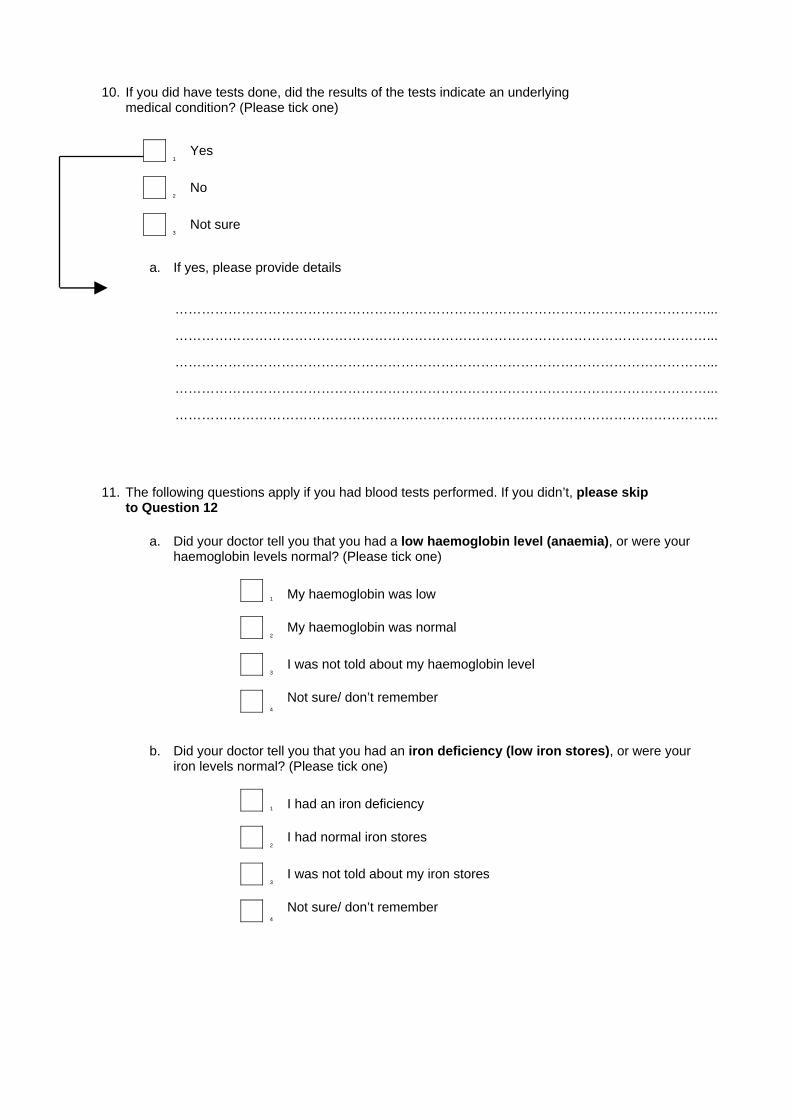
10. If you did have tests done, did the results of the tests indicate an underlying
medical condition? (Please tick one)
1 Yes
2 No
3 Not sure
a. If yes, please provide details
…………………………………………………………………………………………………………...
…………………………………………………………………………………………………………...
…………………………………………………………………………………………………………...
…………………………………………………………………………………………………………...
…………………………………………………………………………………………………………...
11. The following questions apply if you had blood tests performed. If you didn’t, please skip to Question 12
a. Did your doctor tell you that you had a low haemoglobin level (anaemia), or were your
haemoglobin levels normal? (Please tick one)
1 My haemoglobin was low
2 My haemoglobin was normal
3 I was not told about my haemoglobin level
4 Not sure/ don’t remember
b. Did your doctor tell you that you had an iron deficiency (low iron stores), or were your iron levels normal? (Please tick one)
1 I had an iron deficiency
2 I had normal iron stores
3 I was not told about my iron stores
4 Not sure/ don’t remember

12. Did your GP give you an explanation of why your haemoglobin levels were low? (tick one response)
1 No- my levels were found to be normal
2 No- investigations are still ongoing
3 No- no explanation was given
4 Don’t know/ don’t remember
5 Yes- I received an explanation
…………………………………………………………………………………………………………...
…………………………………………………………………………………………………………...
…………………………………………………………………………………………………………...
13. Did your doctor give you any of the following advice? (tick all that apply)
1 Make changes to my diet
2
Take iron supplements If you did take iron supplements, what sort were they?………………........ How long did you take the supplements? ……………………………..........
3 Stop or change the frequency of my blood donations
4 No recommendations were given
5 Other ……………………………………………………………………………………
14. What did your doctor recommend about your return to donating? (tick one response)
1 Return early
2 Return as normal
3 Take a break from donating (if yes, approximately how long? ………………………….)
4 Donate less often (if yes, how often?.............................................................................)
5 My doctor didn’t make any recommendations about donation
4 Other ………………………………………………………………………………………..
If yes, please provide detail

15. Did your GP advise you to see a Specialist for further investigations? (Please tick one)
1 Yes
2 No
3 Not sure
a. If yes, what sort of specialist were you advised to see? (tick all that apply)
1 Gastroenterologist
2 Gynaecologist
3 Surgeon
4 Haematologist
5 Other ……….……………………………………………………………
b. Please provide brief detail about any investigations or tests performed by the specialist,
and whether a diagnosis was made.
…………………………………………………………………………………………………………...
…………………………………………………………………………………………………………...
…………………………………………………………………………………………………………...
…………………………………………………………………………………………………………...
…………………………………………………………………………………………………………...
16. Did your doctor recommend you have follow-up testing (such as another blood test) in the future? (Please tick one)
1 Yes
2 No
3 Not sure
a. If yes, please provide detail of any planned follow-up testing
…………………………………………………………………………………………………………...
…………………………………………………………………………………………………………...
…………………………………………………………………………………………………………...
If you ticked no, or not sure please skip to Question 16
If you ticked no, or not sure please skip to Question 17
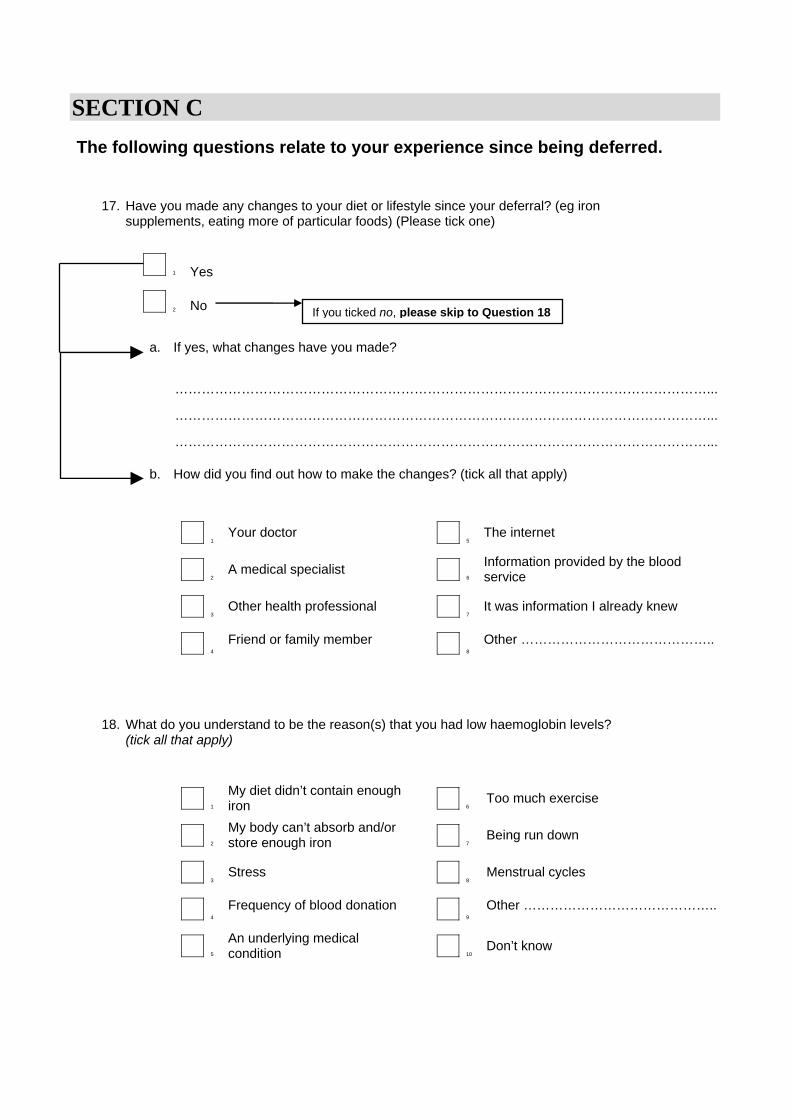
SECTION C The following questions relate to your experience since being deferred.
17. Have you made any changes to your diet or lifestyle since your deferral? (eg iron
supplements, eating more of particular foods) (Please tick one)
1 Yes
2
No
a. If yes, what changes have you made?
…………………………………………………………………………………………………………...
…………………………………………………………………………………………………………...
…………………………………………………………………………………………………………... b. How did you find out how to make the changes? (tick all that apply)
1 5 Your doctor The internet
2 6 A medical specialist Information provided by the blood
service
3 7 Other health professional It was information I already knew
4 Friend or family member 8
Other ……………………………………..
18. What do you understand to be the reason(s) that you had low haemoglobin levels? (tick all that apply)
1 6 My diet didn’t contain enough iron Too much exercise
2 7 My body can’t absorb and/or store enough iron Being run down
3 8 Stress Menstrual cycles
4 Frequency of blood donation 9
Other ……………………………………..
5 10 An underlying medical condition Don’t know
If you ticked no, please skip to Question 18

SECTION D The following questions ask about your opinions as a blood donor.
19. In general, would you say that you are (please tick one):
1 A person who can give blood easily
2 A person for whom blood donation is difficult, but possible
3 Or a person who should not give blood
20. Please read each statement/questions below and indicate your answer to the statement by ticking the box that best describes your views:
Strongly disagree Neutral
Strongly agree
1 2 3 4 5 6 7
a)
Blood donation is something I rarely even think about
b)
I would feel at a loss if I were forced to give up donating blood
c)
I really do not have any clear feelings about blood donation
d)
For me, being a blood donor means more than just donating blood
e)
Blood donation is an important part of who I am
21. What is the probability that you will donate again within 6 months of being eligible to do so? (circle the likelihood that you will return, rated out of 10)
No
chance Some chance Probably Certain
1 2 3 4 5 6 7 8 9 10

22. Thinking about donating again once you are eligible to do so, please circle your response to each question
Not at all confident
Very confident
1 2 3 4 5 6 7
a)
How confident are you that you will be able to give blood?
Strongly disagree
Strongly agree
1 2 3 4 5 6 7 b)
If it were entirely up to me, I am confident that I would be able to give blood
Definitely do not
Definitely do
1 2 3 4 5 6 7
c)
I believe I have the ability to give blood
Extremely incapable
Extremely capable
1 2 3 4 5 6 7 d)
To what extent do you see yourself as capable of giving blood?
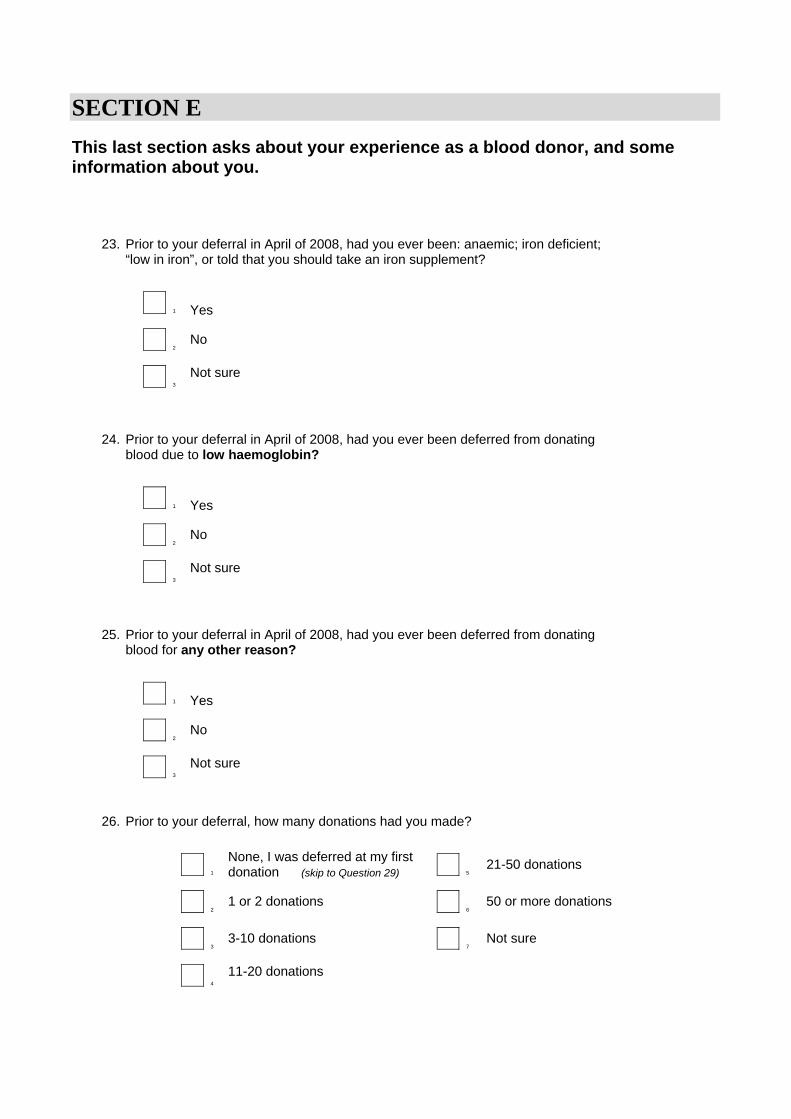
SECTION E This last section asks about your experience as a blood donor, and some information about you.
23. Prior to your deferral in April of 2008, had you ever been: anaemic; iron deficient; “low in iron”, or told that you should take an iron supplement?
1 Yes
2 No
3 Not sure
24. Prior to your deferral in April of 2008, had you ever been deferred from donating blood due to low haemoglobin?
1 Yes
2 No
3 Not sure
25. Prior to your deferral in April of 2008, had you ever been deferred from donating blood for any other reason?
1 Yes
2 No
3 Not sure
Q12
26. Prior to your deferral, how many donations had you made?
1 5 None, I was deferred at my first donation (skip to Question 29)
21-50 donations
2 6 1 or 2 donations 50 or more donations
3 7 3-10 donations Not sure
4 11-20 donations
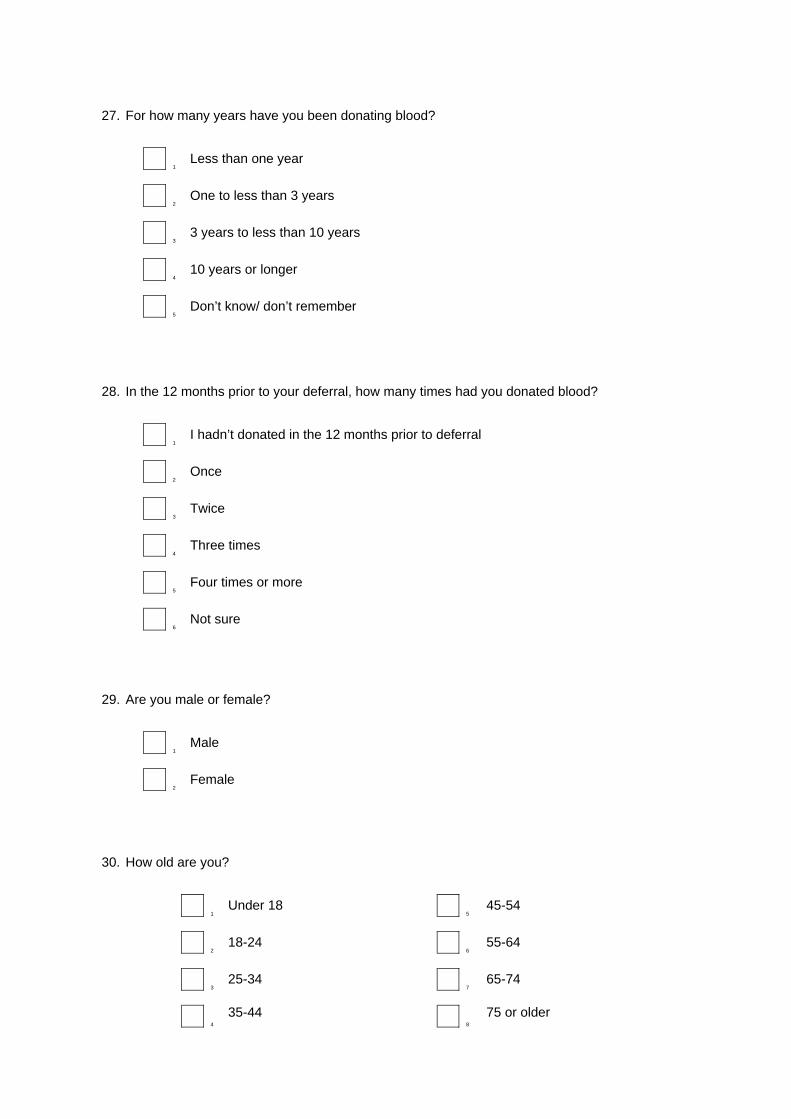
27. For how many years have you been donating blood?
1 Less than one year
2 One to less than 3 years
3 3 years to less than 10 years
4 10 years or longer
5 Don’t know/ don’t remember
28. In the 12 months prior to your deferral, how many times had you donated blood?
1 I hadn’t donated in the 12 months prior to deferral
2 Once
3 Twice
4 Three times
5 Four times or more
6 Not sure
29. Are you male or female?
1 Male
2 Female
30. How old are you?
1 5 Under 18 45-54
2 6 18-24 55-64
3 7 25-34 65-74
4 35-44 8
75 or older

Please write any comments you would like to make about the survey, being a deferred donor, or the Australian Red Cross Blood Service in the space below.
…………………………………………………………………………………………………………
…………………………………………………………………………………………………………
…………………………………………………………………………………………………………
…………………………………………………………………………………………………………
…………………………………………………………………………………………………………
…………………………………………………………………………………………………………
…………………………………………………………………………………………………………
…………………………………………………………………………………………………………
…………………………………………………………………………………………………………
…………………………………………………………………………………………………………
…………………………………………………………………………………………………………
…………………………………………………………………………………………………………
…………………………………………………………………………………………………………
…………………………………………………………………………………………………………
…………………………………………………………………………………………………………
…………………………………………………………………………………………………………
…………………………………………………………………………………………………………
…………………………………………………………………………………………………………
…………………………………………………………………………………………………………
…………………………………………………………………………………………………………
…………………………………………………
Your contribution to this survey is greatly appreciated.
Please return the completed questionnaire in the reply paid envelope provided (no stamp is necessary).
If the envelope has been mislaid, please forward to:
Australian Red Cross Blood Service Reply Paid 70194 Adelaide SA 5000

Appendix 5: Information letter for the Three Months Later study

Date Address Dear, Haemoglobin is the oxygen carrying substance in red blood cells, and levels are checked by a finger-prick test before your donation. You may have heard this referred to as checking your “iron” levels. If haemoglobin levels are too low, donors are temporarily deferred from donating blood. We would like to find out more about what donors do after they have been temporary deferral from donating blood. We are inviting a selection of donors who were deferred due to low haemoglobin in April of 2008 to participate in an anonymous survey. The results of this study will help the Australian Red Cross Blood Service ensure it provides the best possible service and information to blood donors. This study is being carried out in conjunction with The University of Adelaide, which is committed to research in health service provision. The results of the study will be written up as PhD Thesis, and we plan to publish the findings. The questionnaire takes around 10 minutes to complete. Your responses are anonymous, and will not be linked to your name or any information that could personally identify you. You may be assured that no one outside of the research team will see your completed questionnaire. In order that the results will truly represent the experiences of deferred blood donors, we would appreciate it if you would complete the enclosed questionnaire and return it in the reply paid envelope provided within the next 7 days. Participation in the study is completely voluntary. Your decision whether or not to participate will not in any way affect your future relations with the Australian Red Cross Blood Service. By returning your completed questionnaire, you are consenting to being part of this study. If you have any questions or concerns about any aspect of the study, or if you believe you have received this questionnaire in error, please feel free to contact me on (08) 8422 1364. You can also contact my supervisor, A/Prof Philip Ryan at (08) 8303 3570 or email [email protected]. Thank you for your assistance.
Yours sincerely,
Tessa Hillgrove PhD Candidate Australian Red Cross Blood Service & The University of Adelaide

Appendix 6: Follow-up letter for the Three Months Later study

Date Address Dear , Two weeks ago we mailed you a questionnaire seeking your experiences following a temporary deferral from giving blood. We would like to thank those who have already returned the questionnaire. Your participation will help us understand more about the experiences of deferred blood donors, which assists us in providing the best possible service and information to donors. There is still time to complete the survey if you have not yet done so. If you did not receive the questionnaire, or it was misplaced, please contact me on (08) 8422 1364, and I will ensure you are sent another questionnaire immediately Thank you for your assistance. Yours sincerely, Tessa Hillgrove PhD Candidate Australian Red Cross Blood Service & The University of Adelaide

Appendix 7: Questionnaire for the Twelve Months Later study

Survey of Blood Donors Deferred due to Low Haemoglobin
CONFIDENTIAL
We would like to ask you some questions about the explanation and advice provided to you regarding your temporary deferral from donating blood in August of 2004. We are collecting this information to ensure we provide the best possible service and information to our blood donors. There are no right or wrong answers. Not everyone has the same type of experience when they are deferred, and we are interested in hearing about your experience. If you wish to comment on any of the questions, or need more room for your answers, please use the space provided on the back cover of the questionnaire. When you have completed the questionnaire, please return it using the reply paid envelope provided. There is no need to use a stamp.
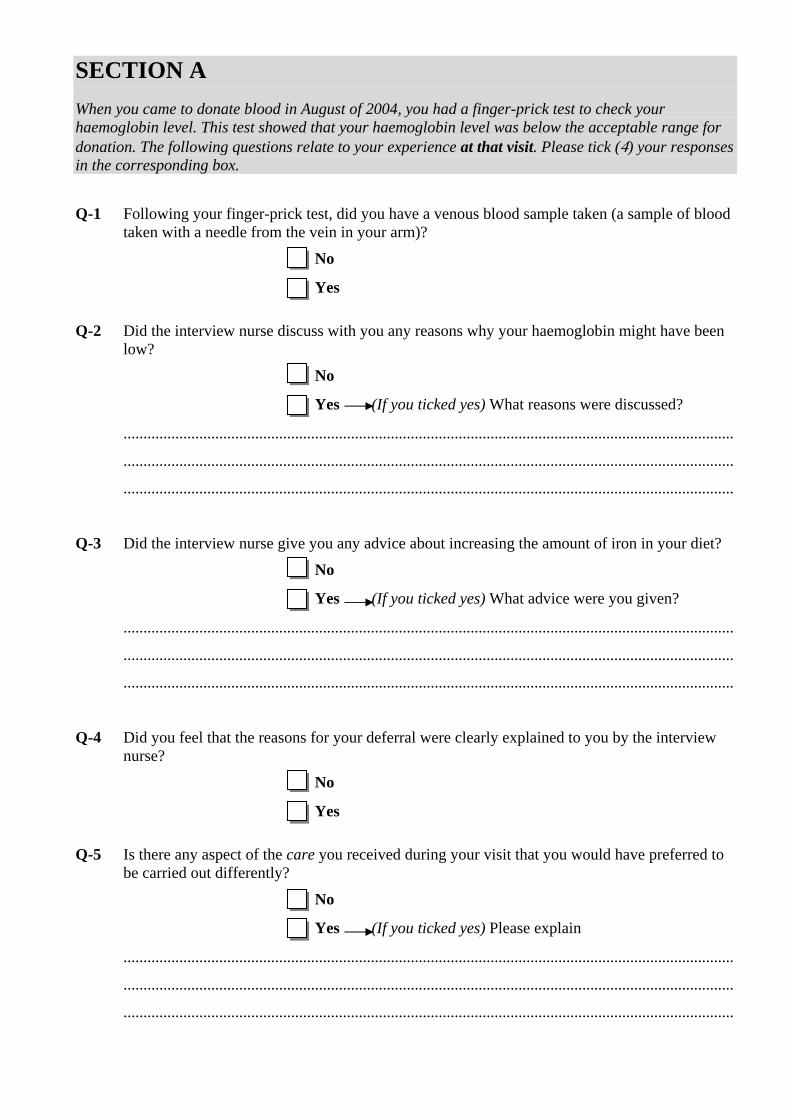
SECTION A When you came to donate blood in August of 2004, you had a finger-prick test to check your haemoglobin level. This test showed that your haemoglobin level was below the acceptable range for donation. The following questions relate to your experience at that visit. Please tick (4) your responses in the corresponding box. Q-1 Following your finger-prick test, did you have a venous blood sample taken (a sample of blood
taken with a needle from the vein in your arm)?
No
Yes
Q-2 Did the interview nurse discuss with you any reasons why your haemoglobin might have been low?
No
Yes (If you ticked yes) What reasons were discussed?
.........................................................................................................................................................
.........................................................................................................................................................
.........................................................................................................................................................
Q-3 Did the interview nurse give you any advice about increasing the amount of iron in your diet?
No
Yes (If you ticked yes) What advice were you given?
.........................................................................................................................................................
.........................................................................................................................................................
.........................................................................................................................................................
Q-4 Did you feel that the reasons for your deferral were clearly explained to you by the interview nurse?
No
Yes
Q-5 Is there any aspect of the care you received during your visit that you would have preferred to be carried out differently?
No
Yes (If you ticked yes) Please explain
.........................................................................................................................................................
.........................................................................................................................................................
.........................................................................................................................................................

Q-5a Is there any aspect of the explanation and advice you received during your visit that you would have preferred to be carried out differently?
No
Yes (If you ticked yes) Please explain
.........................................................................................................................................................
.........................................................................................................................................................
.........................................................................................................................................................
Q-6 Did the nurse provide you with any information brochures during your visit?
No
Yes (If you ticked yes) Did you read the brochures?
1 Not at all
2 Some of the content
3 All of the content
Q-7 How did you feel when you were told that you would be temporarily deferred from donating blood?
.........................................................................................................................................................
.........................................................................................................................................................
.........................................................................................................................................................
Q-8 Do you remember being mailed a letter from the Blood Service explaining your deferral?
No
Yes
Q-9 What period of time that you were told you would not be able to donate blood?..........................
Q-10 In your own words, what is your understanding of the reason you were deferred from donating blood?
.........................................................................................................................................................
.........................................................................................................................................................
.........................................................................................................................................................
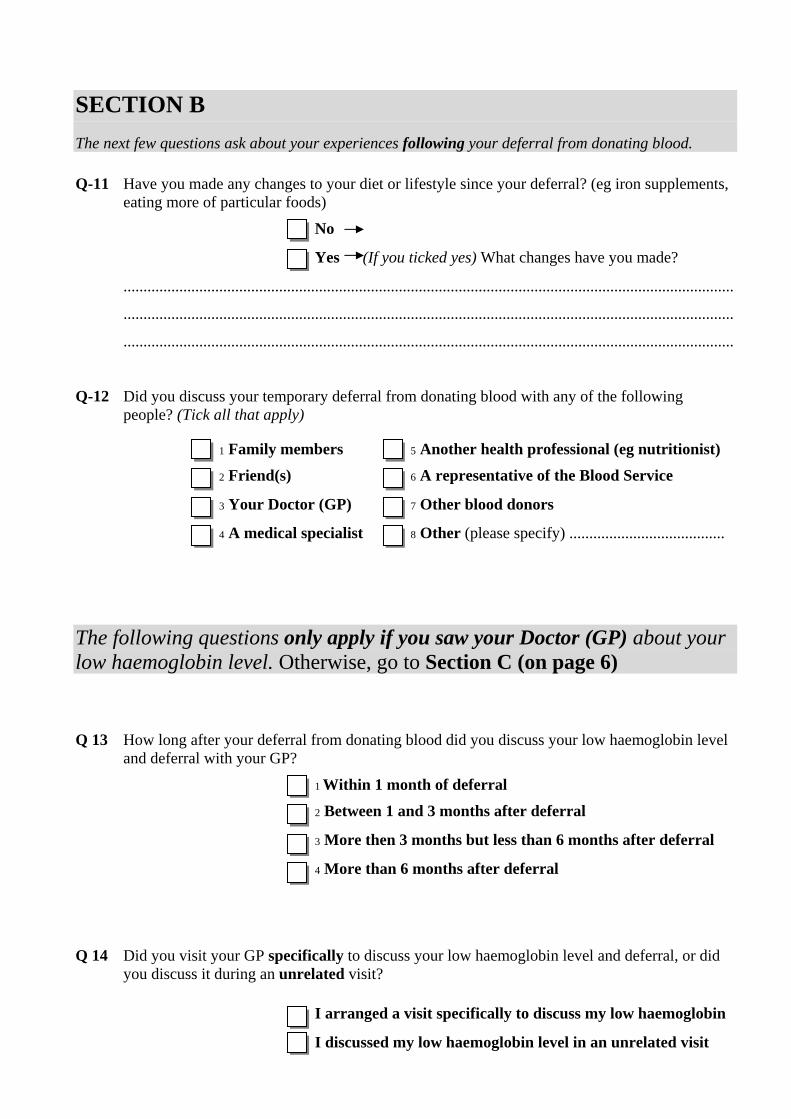
SECTION B The next few questions ask about your experiences following your deferral from donating blood. Q-11 Have you made any changes to your diet or lifestyle since your deferral? (eg iron supplements,
eating more of particular foods)
No
Yes (If you ticked yes) What changes have you made?
.........................................................................................................................................................
.........................................................................................................................................................
.........................................................................................................................................................
Q-12 Did you discuss your temporary deferral from donating blood with any of the following people? (Tick all that apply)
1 Family members 5 Another health professional (eg nutritionist)
2 Friend(s) 6 A representative of the Blood Service
3 Your Doctor (GP) 7 Other blood donors
4 A medical specialist 8 Other (please specify) .......................................
The following questions only apply if you saw your Doctor (GP) about your low haemoglobin level. Otherwise, go to Section C (on page 6)
Q 13 How long after your deferral from donating blood did you discuss your low haemoglobin level
and deferral with your GP?
1 Within 1 month of deferral
2 Between 1 and 3 months after deferral
3 More then 3 months but less than 6 months after deferral
4 More than 6 months after deferral
Q 14 Did you visit your GP specifically to discuss your low haemoglobin level and deferral, or did you discuss it during an unrelated visit?
I arranged a visit specifically to discuss my low haemoglobin
I discussed my low haemoglobin level in an unrelated visit

Q-15 When you saw your GP about your low haemoglobin, were any tests performed?
No Go to Q 17
Yes (If you ticked yes) Do you know which tests (eg blood test)?
.........................................................................................................................................................
.........................................................................................................................................................
.........................................................................................................................................................
Q 16 Did the GP’s test results confirm that you had a low haemoglobin level, or did your GP find your level to be in the normal range?
My GP found I had a low haemoglobin level Go to Q17
Not sure Go to Q18
My GP found I had a normal haemoglobin level
(If you ticked normal) Did your GP contact the blood service about your results?
1 No
2 Yes Go to Section C
3 Don’t Know
Q-17 Was your GP able to tell you the reason for your low haemoglobin level?
No
Yes (If you ticked yes) What was the reason?
.........................................................................................................................................................
.........................................................................................................................................................
.........................................................................................................................................................
Q 18 Did your GP advise you to see a Specialist for further investigations?
No
Yes (If you ticked yes) Please provide brief details below.
.........................................................................................................................................................
.........................................................................................................................................................
.........................................................................................................................................................
Q-19 What did your GP tell you to do about your low haemoglobin level?
.........................................................................................................................................................
.........................................................................................................................................................
.........................................................................................................................................................

SECTION C The following section contains questions about your experience as a donor prior to your deferral for low haemoglobin in August of 2004. Q-20 When you were deferred due to low haemoglobin, were you taking any iron supplements?
1 No
2 Yes
3 Not sure
Q-21 When you were deferred due to low haemoglobin, were you taking any multivitamins?
1 No
2 Yes (If you ticked yes) Which ones?.......................................
3 Not sure
Q-22 Prior to your deferral, approximately how many donations had you made?
1 None, I was deferred at my first donation Go to Section D
2 1 or 2 donations
3 3-10 donations
4 11-20 donations
5 21-50 donations
6 50+ donations
7 Not sure
Q-23 For how many years have you been donating blood?
1 Less than one year
2 One to less than 3 years
3 3 years to less than 10 years
4 10 years or longer
5 Not sure
Q-24 In the 12 months prior to your deferral, how many times did you donate blood?
1 I hadn’t donated in the 12 months before I was deferred
2 Once
3 Twice
4 Three times
5 Four times or more
6 Not sure

Q-25 On a scale of 1-7, with 1 being “Completely Dissatisfied”, and 7 being “Completely Satisfied” how would you rate the following aspects of your experience as a blood donor prior to your deferral? (Please circle your response for each statement)
Completely Completely
Dissatisfied Satisfied
Communications from the ARCBS reminding you to donate blood. 1 2 3 4 5 6 7
The times that are available to donate blood...................................... 1 2 3 4 5 6 7
The convenience of the location of your usual blood donation centre 1 2 3 4 5 6 7
Waiting times...................................................................................... 1 2 3 4 5 6 7
The refreshments and the recovery facilities......................................... 1 2 3 4 5 6 7
The ability of the staff to put you at ease .............................................. 1 2 3 4 5 6 7
The professionalism of staff................................................................... 1 2 3 4 5 6 7
The way the Blood Service made you feel appreciated as a donor ........ 1 2 3 4 5 6 7
Your overall experience as a blood donor.............................................. 1 2 3 4 5 6 7
Q-26 Prior to your deferral in August 2004, had you ever been deferred for low haemoglobin before?
No
Yes
Q-27 Prior to your deferral in August 2004, had you ever been deferred from donating for any other reason?
No
Yes
Questionnaire continued over the page.......
SECTION D Q-28 Do you recall receiving any letters or phone calls from the Australian Red Cross Blood Service
since your deferral, asking you to donate blood again?
No
Yes
Q-29 What would you say is the likelihood of you making a blood donation in the next 6 months?
1 Very likely
2 Somewhat likely
3 Undecided
4 Somewhat unlikely Would you mind briefly explaining
5 Very unlikely the reason/s why?
.........................................................................................................................................................
.........................................................................................................................................................
Q-30 If we need to clarify any of your answers, or have any further questions about your deferral, would you allow us to telephone you at a later date?
No
Yes Please provide your name, phone number, and best
day/time to call below
Name ...............................................................................
Phone number....................................................................
Best day/time ....................................................................
Questionnaire continued over the page.......

If you have any comments you would like to make about the survey, being a deferred donor, or the Australian Red Cross Blood Service, please write them in this section.
____________________________________________________________________________________________________________________________________________________________________________________________________________________________________________________________________________________________________________________________________________________________________________________
____________________________________________________________________________________________________________________________________________________________________________________________________________________________________________________________________________________________________________________________________________________________________________________ ____________________________________________________________________________________________________________________________________________________________________________________________________________________________________________________________________________________________________________________________________________________________________________________
____________________________________________________________________________________________________________________________________________________________________________________________________________________________________________________________________________________________________________________________________________________________________________________
Your contribution to this survey is greatly appreciated.
Please return the completed questionnaire in the reply paid envelope provided
(no stamp is necessary). If the envelope has been mislaid, please forward to
Australian Red Cross Blood Service Reply Paid 70194 Adelaide SA 5000

Appendix 8: Information Letter for the Twelve Months Later study

Date Address Dear, To protect blood donors’ health and wellbeing, the Australian Red Cross Blood Service has recently changed the acceptable haemoglobin range for blood donation. The new acceptable range is important to ensure that blood donors remain in a healthy range after donating blood. However, as a result of these changes, more people than ever are being deferred for low haemoglobin levels. Haemoglobin is the oxygen carrying substance in red blood cells, and levels are checked by a finger-prick test before your donation. You may have heard this referred to as checking your “iron” levels. If haemoglobin levels are too low, donors are temporarily deferred from donating blood. It is not known how donors feel about the explanation and advice they were given regarding their temporary deferral from donating blood, and we would like to find out. We are inviting all donors who were deferred due to low haemoglobin in August of 2004 to participate in our research. The results of this study will help the Australian Red Cross Blood Service ensure we provide the best possible service and information to our blood donors. The questionnaire takes around 10 to 15 minutes to complete. In order that the results will truly represent the experiences of deferred blood donors, we would appreciate it if you would complete the enclosed questionnaire and return it in the reply paid envelope provided within the next 7 days. You may be contacted by a member of the research team with a reminder letter and/or phone call if we have not received a questionnaire from you within this time. This study is being carried out in conjunction with The University of Adelaide, which is committed to research in health service provision. The questionnaire has an identification number for follow-up purposes, which we will link to your donor identification number to obtain recent donation frequency and non-specific information such as gender and age. Your responses will not be linked to your name or any information that could personally identify you. You may be assured that no one outside of the research team will see your individual responses. The results of the study will be written up as PhD Thesis, and we plan to publish the findings, however the data will be presented in a way that you cannot be individually identified. Participation in the study is completely voluntary, and you can withdraw at any time. If you do not wish to be part of this study, you may return the blank questionnaire in the reply paid envelope provided. Your decision whether or not to participate will not in any way affect your future relations with the Australian Red Cross Blood Service. By returning your completed questionnaire, you are consenting to being part of this study. If you have any questions or concerns about any aspect of the study, or if you believe you have received this questionnaire in error, please feel free to contact me on (08) 8422 1364.
If you would like to speak to someone who is not directly involved in the study, contact the Secretary of the Human Research Ethics Committee, Australian Red Cross Blood Service on (03) 9412 1911 (phone) or (03) 9412 1901 (fax). Please also refer to the attached independent complaint form provided by the University of Adelaide (on the back of this letter).
Thank you for your assistance.
Yours sincerely,
Tessa Hillgrove Project Officer & PhD Candidate Australian Red Cross Blood Service-SA
Recommended