MAY AVENUE URBAN INTERVENTIONS:
Using GIS to assess the quality of urban form and simulate effects of possible solutions in Oklahoma City
Shane Hampton

URBAN FORM • Street layout and design elements • Block size and shape • Parcel size and shape • Population or employment density • Floor area ratios • Land use mix • Open space network • Shape and position of buildings on parcels • Parking lots • Details like window or door placement

URBAN FORM

URBAN FORM

URBAN FORM

URBAN FORM

IMPACTS OF URBAN FORM
• Public Health • Society and Community • Fiscal Sustainability • Economy • Environment
PUBLIC HEALTH
Counties with low density and large block size have lower rates of physical activity and higher rates of obesity and high blood pressure.
Reid Ewing et al (2003). Relationship Between Urban Sprawl, Physical Activity, Obesity, and Morbidity.
American Journal of Health Promotion.

PUBLIC HEALTH
Higher housing densities predicted less depression. Areas with higher density of car commuters had more depression.
Rebecca Miles et al (2011) Neighborhood Urban Form, Social Environment, and Depression.
Journal of Urban Health

HEALTH IN OKLAHOMA
• 1/3 Obese • 2/3 Obese or Overweight (#6 in USA) • Top ten for diabetes, physical inactivity, hypertension

SOCIETY & COMMUNITY
Automobile dependency and social isolation take away from community, while urbanist approaches could enhance or stimulate a sense of community.
Steven Cochrun (1994) Understanding and Enhancing Neighborhood Sense of Community.
Journal of Planning Literature.

SOCIETY & COMMUNITY
Architectural elements are thought to encourage people to spend time in the public realm and increase social interaction. However, “the theoretical and empirical support for the notion that sense of community can be created via physical design factors is ambiguous at best”
Emily Talen (1998) Sense of Community and Neighbourhood Form:
An Assessment of the Social Doctrine of New Urbanism. Urban Studies.

FISCAL & ECONOMIC
Compact urban form saves money on infrastructure and improves the efficiency of emergency services.
William Coyne (2003) The Fiscal Cost of Sprawl: How Sprawl Contributes to Local Governments’ Budget Woes.
Environment Colorado Research and Policy Center Report.

FISCAL & ECONOMIC
Economic development may depend on creating walkable urban centers as consumer preferences change.
Gary Pivo & Jeff Fisher (2011) The Walkability Premium in Commercial Real Estate Investments.” Real Estate
Economics

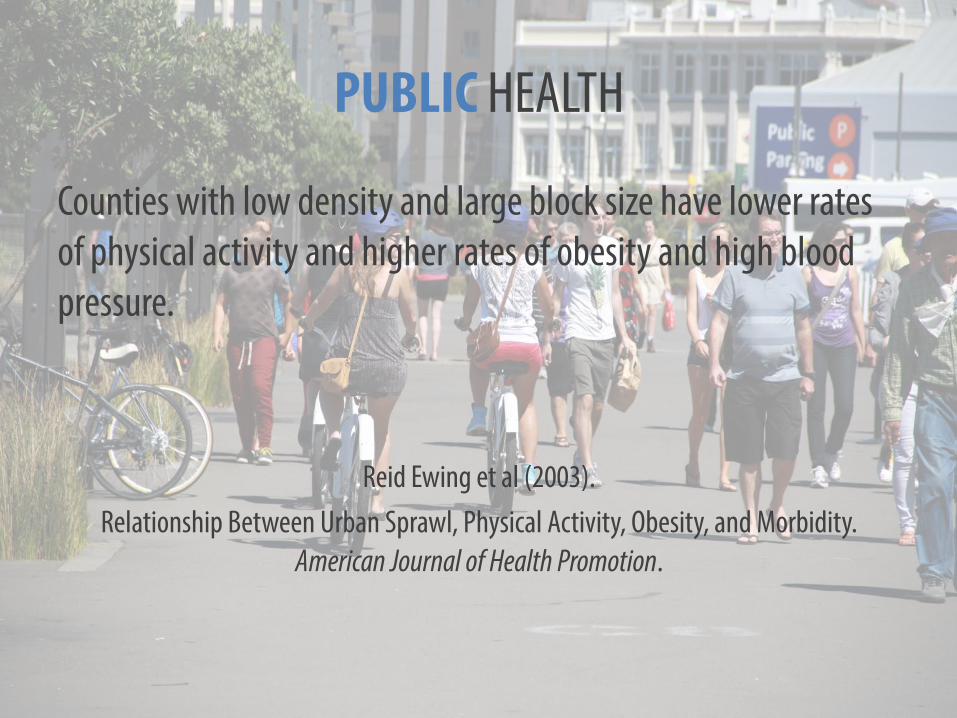
ENVIRONMENTAL IMPACTS
Sprawl consumes open space, farmland, and natural habitat at a much greater rate than compact development.
Burchell et al (2005) Sprawl Costs: Economic Impacts of Unchecked Development

ENVIRONMENTAL IMPACTS
Automobile-oriented design requires more impervious surfaces that increase runoff, erosion, and water pollution.
John Bailey et al (2009) Our Way to Water Shortages: How Sprawl Aggravates the Effects of Drought.
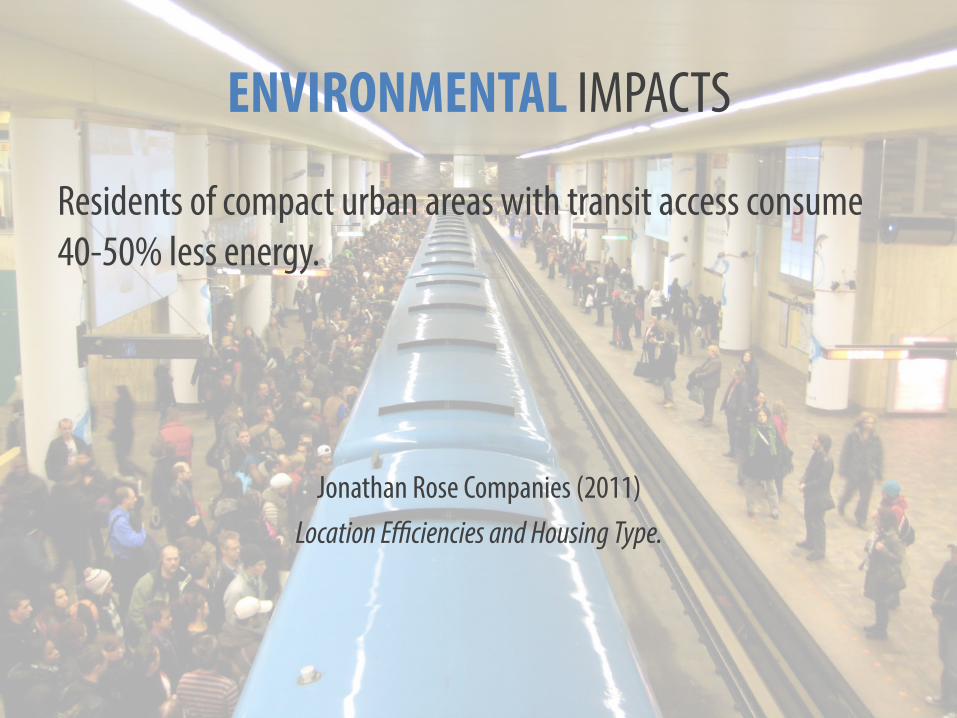
ENVIRONMENTAL IMPACTS
Residents of compact urban areas with transit access consume 40-50% less energy.
Jonathan Rose Companies (2011) Location Efficiencies and Housing Type.

DISSENTING VIEWPOINT
“In attributing primary causal power to physical form… the New Urbanism rei#es and conceals a wider range of causal forces at work.”
Charles Rutheiser (1997)

MEASURING URBAN FORM
“What gets measured gets done.”

MeasureExisting
Conditions
AnalyzeStrengths &Weaknesses
ProposeInterventions
Simulate andEvaluate
Inform Policiesand Development
Incentives

MEASURING URBAN FORM
• Accesibility • Connectivity • Density • Diversity • Nodality
Emily Talen (2011) Sprawl retro#t: sustainable urban form in unsustainable places.
Environment and Planning B: Planning and Design

MEASURING URBAN FORM
• Population density • Geographic proximity to services • Block size • Sidewalks and bike lanes
Chanam Lee and Anne Moudon (2006) The 3Ds + R: Quantifying land use and urban form correlates of walking.
Transportation Research Part D

MEASURING URBAN FORM
• Street network: Block perimeter, cul-de-sac ratio • Density: Lot size, housing unit density • Land use mix ratio • Accessibility: Distance to commercial, transit, park • Pedestrian access: % of units within ¼ mile of commercial land
use, % of units within ¼ mile of transit
Yan Song & Gerrit-Jan Knapp (2004) Measuring Urban Form: Is Portland Winning the War on Sprawl?
Journal of the American Planning Association

MEASURING URBAN FORM
• Population Density • Land Use Mix • Accessibility – Proximity to Commerce – Proximity to Park Space – Proximity to Transit
• Connectivity – Area within ¼ Mile – Intersection Density

MEASURING URBAN FORM

OKLAHOMA CITY
NORTH MAY AVENUE I-44 to 63rd St.


NW EXPRESSWAY
LAKE
HEF
NER P
KWY
W I-44 HWY
N M
AY AV
E
NW 63RD ST
N VI
LLA A
VE
N
Study AreaCensus Blocks & Parcels

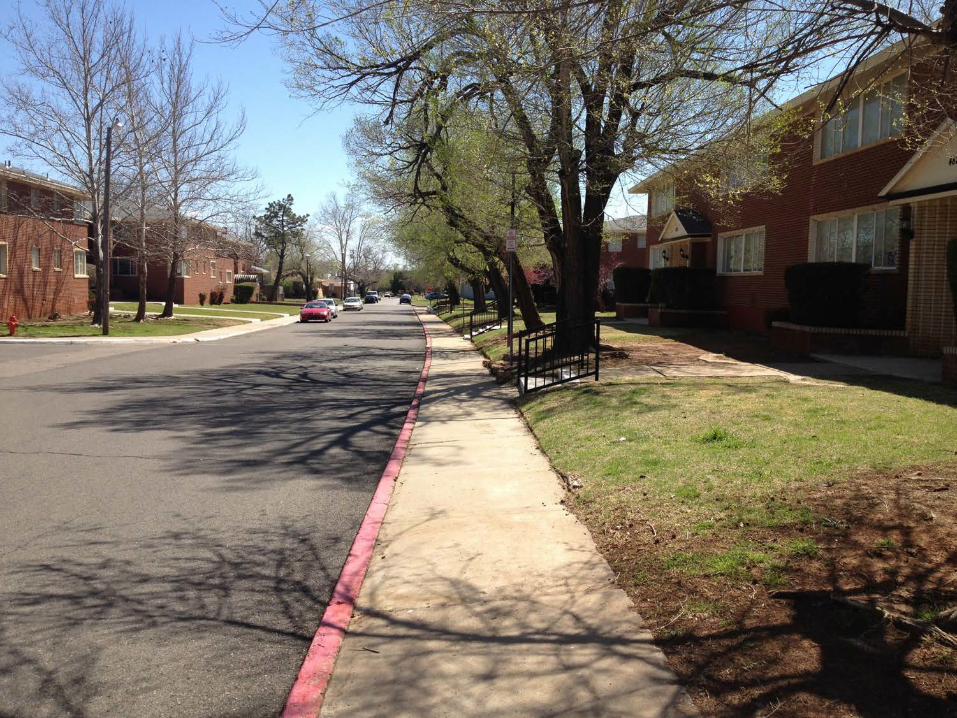
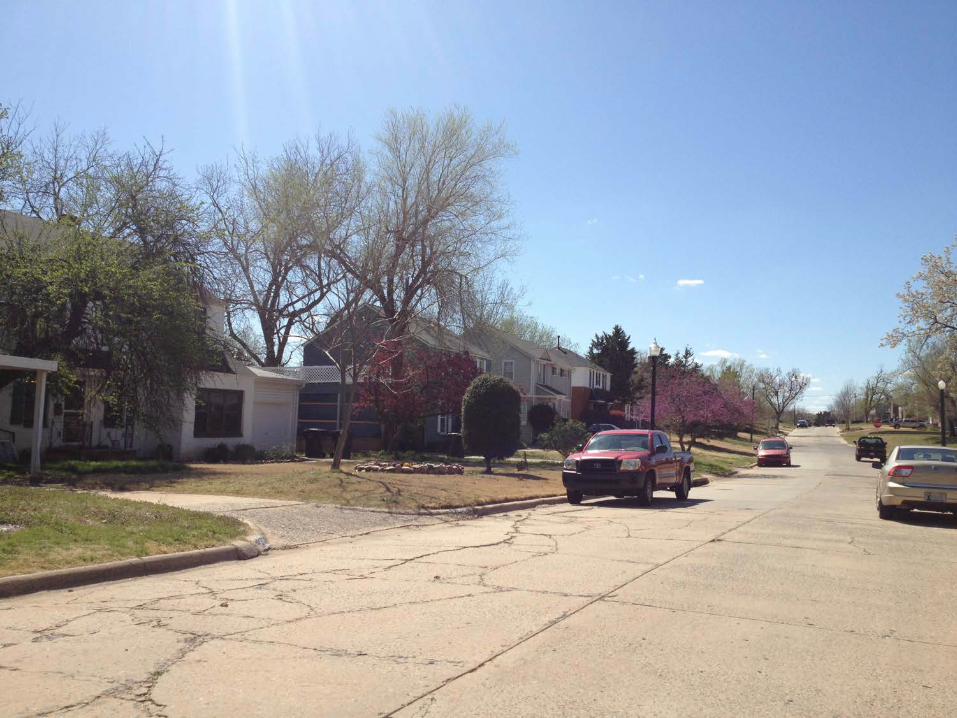
MID-CENTURY URBAN FORM
“Blighted… obsolete… inadequate… leapfrogged”
Galina Tachieva (2010) The Sprawl Repair Manual
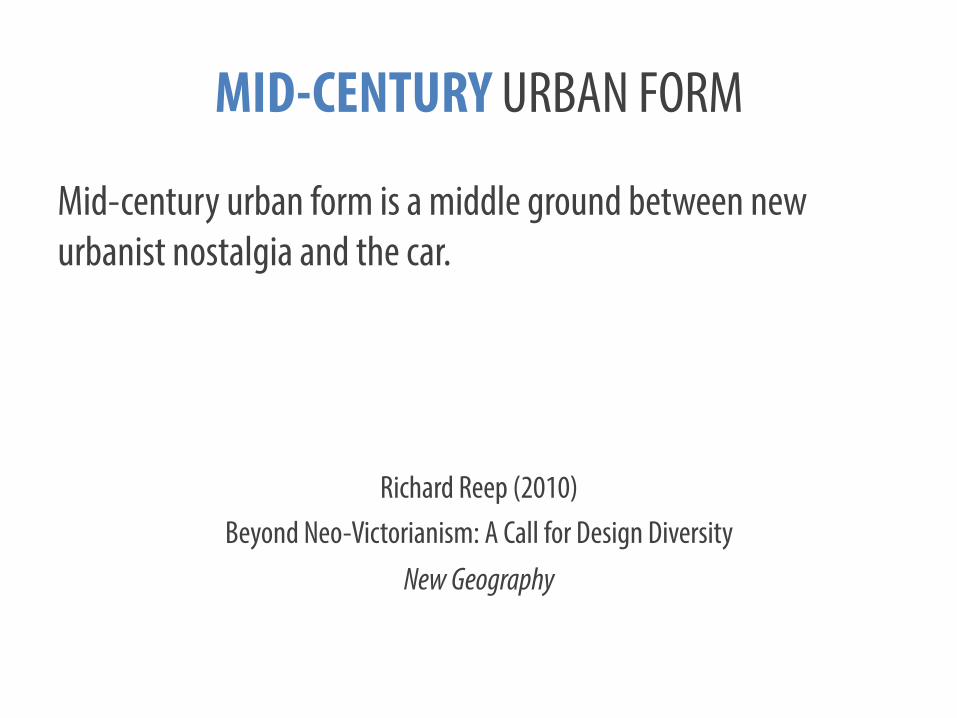
MID-CENTURY URBAN FORM
Mid-century urban form is a middle ground between new urbanist nostalgia and the car.
Richard Reep (2010) Beyond Neo-Victorianism: A Call for Design Diversity
New Geography


GIS MEASURES
• Block-level Census Data • Parcels • Streets • Zoning • Building Footprints (2004) • Public Parks • Transit Routes

NW EXPRESSWAY
LAKE
HEF
NER P
KWY
W I-44 HWY
N M
AY AV
E
NW 63RD ST
N VI
LLA A
VE
Population Density(Per Square Mile)
Legend
0 - 1,293
1,294 - 3,848
3,849 - 5,978
5,979 - 9,925
9,926 - 19,139
N
Warwick West
Ti!any House
LakeviewTowers
Big Box Stores
Big Box Stores
United FoundersBoulevard
Hospital

NW EXPRESSWAY
LAKE
HEF
NER P
KWY
W I-44 HWY
N M
AY AV
E
NW 63RD ST
N VI
LLA A
VE
Land Use Mix within 1/4 Mile0 = Homogenous, 1 = Even Mix
Legend0.0000 - 0.1268
0.1269 - 0.4058
0.4059 - 0.5926
0.5927 - 0.7844
0.7845 - 0.9680
N

NW EXPRESSWAY
LAKE
HEF
NER P
KWY
W I-44 HWY
N M
AY AV
E
NW 63RD ST
N VI
LLA A
VE
Percent of ParcelsWithin 1/4 Mile of Park or Open Space
Legend0% - 11%
12% - 31%
32% - 44%
45% - 73%
74% - 100%
N
Park
Med
ian
Smitty
Ross

NW EXPRESSWAY
LAKE
HEF
NER P
KWY
W I-44 HWY
N M
AY AV
E
NW 63RD ST
N VI
LLA A
VE
Percent of ParcelsWithin 1/4 Mile of Transit
Legend0% - 12%
13% - 34%
35% - 67%
68% - 89%
90% - 100%
N
Bus Route
7
7
8
10
107
7 88 10
7
7

NW EXPRESSWAY
LAKE
HEF
NER P
KWY
W I-44 HWY
N M
AY AV
E
NW 63RD ST
N VI
LLA A
VE
Percent of ParcelsWithin 1/4 Mile of Commercial
Legend0% - 6%
7% - 24%
25% - 48%
49% - 80%
81% - 100%
N

NW EXPRESSWAY
LAKE
HEF
NER P
KWY
W I-44 HWY
N M
AY AV
E
NW 63RD ST
N VI
LLA A
VEArea of 1/4 Mile Network Bu!erSquare Miles
Legend0.0065 - 0.0281
0.0282 - 0.0553
0.0554 - 0.0740
0.0741 - 0.0937
0.0938 - 0.1146
N

NW EXPRESSWAY
LAKE
HEF
NER P
KWY
W I-44 HWY
N M
AY AV
E
NW 63RD ST
N VI
LLA A
VEIntersection DensityPer Square Mile
Legend0.0000 - 52.0513
52.0514 - 101.0599
101.0600 - 130.9415
130.9416 - 157.1434
157.1435 - 227.0958
N

NW EXPRESSWAY
LAKE
HEF
NER P
KWY
W I-44 HWY
N M
AY AV
E
NW 63RD ST
N VI
LLA A
VEComposite Score
LegendLowest Performing
Highest Performing
N


SPRAWL REPAIR
“Propose strategically located interventions addressing explicit de#ciencies.”
Emily Talen (2011) Sprawl retro#t: sustainable urban form in unsustainable places.
Environment and Planning B: Planning and Design.

SPRAWL REPAIR
• Retro#tting Suburbia (Ellen Dunham Jones and June Williamson 2008)
• Sprawl Repair Manual (Galina Tachieva 2010)

SPRAWL REPAIR
• New street connectivity • New building types and land use mixes • Redevelopment of sprawl land uses • Parking lot in#ll development • Arterial street redesign

SPRAWL REPAIR

SPRAWL REPAIR

SPRAWL REPAIR

SPRAWL REPAIR

SPRAWL REPAIR

SPRAWL REPAIR

Figure Ground: Before

Figure Ground: After
Northwest Expressway
United Founders Boulevard

NW EXPRESSWAY
LAKE
HEF
NER P
KWY
W I-44 HWY
N M
AY AV
E
NW 63RD ST
N VI
LLA A
VE
Percent of ParcelsWithin 1/4 Mile of Park or Open Space
Legend0% - 11%
12% - 31%
32% - 44%
45% - 73%
74% - 100%
N
Park
Med
ian
Smitty
Ross

NW EXPRESSWAY
LAKE
HEF
NER P
KWY
W I-44 HWY
N M
AY AV
E
NW 63RD ST
N VI
LLA A
VEPost-Intervention Percent of ParcelsWithin 1/4 Mile of Park
Legend0% - 6%
7% - 28%
29% - 44%
45% - 80%
81% - 100%
N
Med
ian
Smitty
Ross
New

NW EXPRESSWAY
LAKE
HEF
NER P
KWY
W I-44 HWY
N M
AY AV
E
NW 63RD ST
N VI
LLA A
VE
Population Density(Per Square Mile)
Legend
0 - 1,293
1,294 - 3,848
3,849 - 5,978
5,979 - 9,925
9,926 - 19,139
N
Warwick West
Ti!any House
LakeviewTowers
Big Box Stores
Big Box Stores
United FoundersBoulevard
Hospital

NW EXPRESSWAY
LAKE
HEF
NER P
KWY
W I-44 HWY
N M
AY AV
E
NW 63RD ST
N VI
LLA A
VEPost-Intervention Population Density(Per Square Mile)
Legend0 - 1,301
1,302 - 3,848
3,849 - 5,979
5,980 - 9,925
9,926 - 19,153
N

NW EXPRESSWAY
LAKE
HEF
NER P
KWY
W I-44 HWY
N M
AY AV
E
NW 63RD ST
N VI
LLA A
VEArea of 1/4 Mile Network Bu!erSquare Miles
Legend0.0065 - 0.0281
0.0282 - 0.0553
0.0554 - 0.0740
0.0741 - 0.0937
0.0938 - 0.1146
N
NW EXPRESSWAY
LAKE
HEF
NER P
KWY
W I-44 HWY
N M
AY AV
E
NW 63RD ST
N VI
LLA A
VE
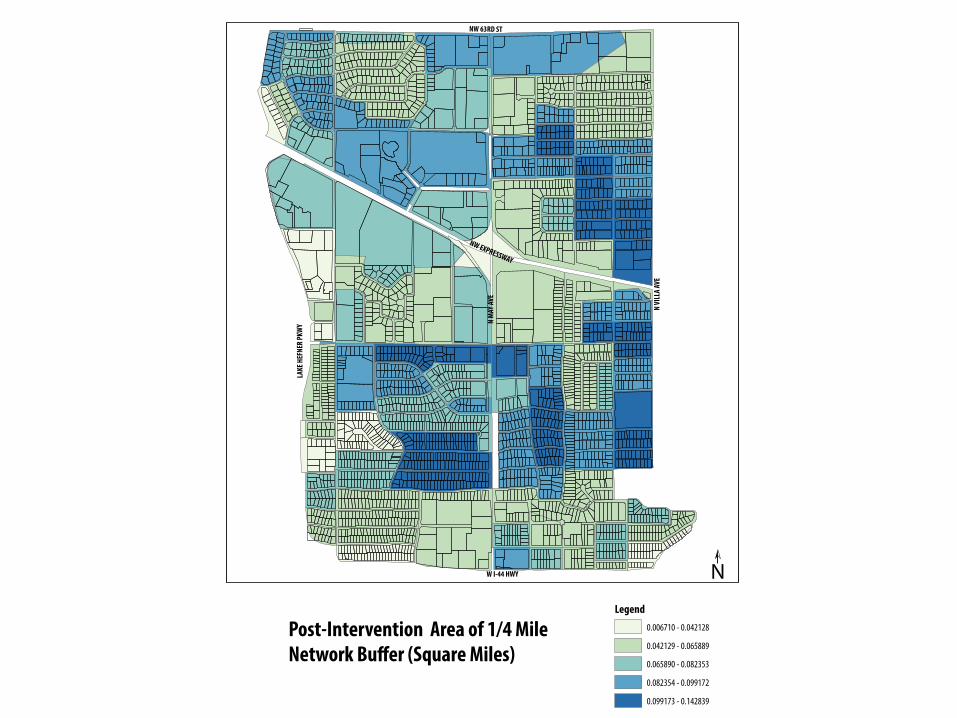
Post-Intervention Area of 1/4 MileNetwork Bu!er (Square Miles)
Legend0.006710 - 0.042128
0.042129 - 0.065889
0.065890 - 0.082353
0.082354 - 0.099172
0.099173 - 0.142839
N

NW EXPRESSWAY
LAKE
HEF
NER P
KWY
W I-44 HWY
N M
AY AV
E
NW 63RD ST
N VI
LLA A
VEComposite Score
LegendLowest Performing
Highest Performing
N

NW EXPRESSWAY
LAKE
HEF
NER P
KWY
W I-44 HWY
N M
AY AV
E
NW 63RD ST
N VI
LLA A
VEPost-Intervention Composite Score
LegendLowest Performing
Highest Performing
N

EVALUATION OF MODEL
• Reliable, but not independent • Easily replicable over larger scale • Macro land use ratio • Variables measure street network more than once • Z-scores are relative • Variable scores may be more relevant than composites

POTENTIAL IMPROVEMENTS
• More consistent indexing • Establish regional ideal values for each variable

FUTURE APPLICATIONS
• Set urban form target achievements • Determine weaknesses • Identify sites for “urban triage” • Test impact of solutions, proposed developments • Measure performance • In%uence development incentives & policy

MAY AVENUE URBAN INTERVENTIONS:
Using GIS to assess the quality of urban form and simulate effects of possible solutions in Oklahoma City
Shane Hampton
Recommended