
GfK Association
02
/ 2
01
0 {CONTENTS} Editorial / / / Does Quality Win? Competing Against an Entrenched Market Leader in High-Tech Markets > Gerard J. Tellis,
Eden Yin and Rakesh Niraj / / / “Call. Mail. Shoot. Listen. Play”. But What Functionalities Add Real Value in Convergent Products? > Tripat
Gill / / / Customization: A Goldmine or a Wasteland? > Nikolaus Franke, Peter Keinz and Christoph J. Steger / / / Left Behind Expectations.
How to Prevent CRM Implementations from Failing > Jan U. Becker, Goetz Greve and Sönke Albers / / / Proving Marketing Success Pays Off!
Marketing Performance Measurement and its Effects on Marketing’s Stature and Firm Success > Don O’Sullivan and Andrew V. Abela / / /
Trying Harder and Doing Worse: How Grocery Shoppers Track In-Store Spending > Van Ittersum, Koert, Joost M. E. Pennings and Brian Wansink
/ / / MIR talks to Vinita Bali, Managing Director and CEO of Britannia Industries > Interview by Srinivas K. Reddy / / / Vol. 2 / No. 2 / 2010
GfK
Ass
oci
ati
on
GfK
Mar
ket
ing
Inte
llig
ence
Rev
iew


3
Editorial
/ / /
Editorial Board
/ / /
Does Quality Win? Competing Against an Entrenched Market Leader
in High-Tech Markets
Gerard J. Tellis, Eden Yin and Rakesh Niraj
/ / /
“Call. Mail. Shoot. Listen. Play”.
But What Functionalities Add Real Value in Convergent Products?
Tripat Gill
/ / /
Customization: A Goldmine or a Wasteland?
Nikolaus Franke, Peter Keinz and Christoph J. Steger
/ / /
Left Behind Expectations.
How to Prevent CRM Implementations from Failing
Jan U. Becker, Goetz Greve and Sönke Albers
/ / /
Proving Marketing Success Pays Off! Marketing Performance
Measurement and its Effects on Marketing’s Stature and Firm Success
Don O’Sullivan and Andrew V. Abela
/ / /
Trying Harder and Doing Worse:
How Grocery Shoppers Track In-Store Spending
Van Ittersum, Koert, Joost M. E. Pennings and Brian Wansink
/ / /
MIR talks to Vinita Bali, Managing Director and CEO of
Britannia Industries
Interview by Srinivas K. Reddy
/ / /
German Summaries
/ / /
Next Issue Preview
/ / /
Imprint
Contents / Vol. 2, No. 2, 2010 / GfK MIR
CONTENTSVol. 2, No. 2, November 2010
4
6
8
16
26
34
42
50
52
61
66
67
4 GfK MIR / Vol. 2, No. 2, 2010 / Editorial
can even be counterproductive if consumers feel
swamped. Tripat Gill’s study (“Call. Mail. Shoot. Listen.
Play. But What Functionalities Add Real Value in Conver-
gent Products?“) investigates such effects. Specifi cally,
the author analyzes differences in evaluations depen-
dent on the match of the original consumption goal of
the basic product and the new feature. Apparently it
matters whether the base product and the extended
utility are of hedonic or functional value and whether
the quality of the brand is high or low.
Innovation efforts are further refl ected in the strategic
orientation towards customization. Companies aim to
strengthen their competitive position by creating offers
specifi cally designed to meet the desires and needs of in-
dividual customers. Some companies have been tremen-
dously successful in this, but others have clearly failed. In
their study “Customization: A Goldmine or a Wasteland?”
Nikolaus Franke, Peter Keinz and Christoph J. Steger test
whether, and in particular under what conditions, a strat-
egy of individualized product development proves suc-
cessful. In an experiment, respondents directly compared
individualized and mass products. The results are clear
and support marketing theory: individualized offers pro-
duce much better consumer evaluations than standard-
ized products. However, customers must be able and will-
ing to refl ect on and articulate their preferences.
Another very common marketing innovation in previous
years was Customer Relationship Management (CRM).
Its objective is to make customer acquisition and care
more effi cient and effective. Jan U. Becker, Goetz Greve
and Sönke Albers (“Left Behind Expectations: How to
Prevent CRM Implementations from Failing“) investigate
in a comprehensive study why CRM implementations
and CRM investments fail. Were the managers’ expecta-
tions of CRM solutions wrong right from the beginning
or were the systems poorly implemented? The results of
the study indicate the latter and reveal serious manage-
Innovations rank among the most important drivers of
corporate success and enhancements of national econo-
mies. More than anything, they are not just technical ac-
complishments of labs and R&D departments. We also or
even primarily encounter marketing innovations in the
sense of variations of certain marketing instruments
and processes. Even technically convincing new products
need a well-balanced marketing mix right from the start
to be ultimately successful. However, awareness of the
important role of marketing within the innovation pro-
cess is not very high in many companies or among the
general public.
The seven contributions in the fourth issue of our GfK
Marketing Intelligence Review deal with this topic of “in-
novation and marketing” in a variety of ways. In their
article “Does Quality Win? Competing Against an En-
trenched Market Leader in High-Tech Markets”, Gerard
J.Tellis, Eden Yin and Rakesh Niraj investigate whether
higher product quality succeeds or whether a high num-
ber of users and the corresponding network effects ac-
tually wall off markets. Their results, taken from a long-
term study focusing on various high-tech markets
(primarily computer software), are encouraging. Quality
(inferred from ratings in computer magazines) prevails:
in the long run, it pays off for marketing to invest in
products of higher quality.
The innovation policy of many fi rms producing consum-
er durables entails a strategy of combining different
types of devices, forming “convergent products”. Exist-
ing base products are equipped with additional func-
tionalities from different product categories (e.g., cell
phones can also be used as cameras, MP3 players or to
access the internet). Similar approaches are applied in
added value strategies, where complementary services
are more or less connected to the basic product value.
Often, it remains unclear if or to what extent consumers
actually value such additions. Too many functionalities
EDITORIAL

5Editorial / Vol. 2, No. 2, 2010 / GfK MIR
ment mistakes. Many companies seem to underestimate
how carefully the objectives and scope of CRM systems
need to be planned, as well as the necessary organiza-
tional adaptations in the course of their implementation.
The article by Don O’Sullivan and Andrew V. Abela con-
cerning “Proving Marketing Success Pays Off! Marketing
Performance Measurement and its Effects on Market-
ing’s Stature and Company Success” focuses on a very
different aspect of innovative action. In a comparative
study they document that it is not enough to carry out
sound marketing: it is also necessary to prove and com-
municate results. This would not only increase the stat-
ure of marketing departments within the company but
also the overall success of the company. Marketing ac-
counting helps to gain wide acceptance for good market-
ing ideas.
Besides these fi ve articles, issue 4 of GfK-MIR contains a
fi rst example of our new “Flashlight” category, where we
offer interesting insights from marketing research in a
special compressed format. In this issue we report on
how consumers track their spendings within a super-
market shopping trip. Interestingly enough, more moti-
vated consumers try harder to calculate the right
amount of spending but perform worse in this task. This
shows that simple models of consumer behavior are not
always the most suitable ones. Even consumer behavior
theory needs innovation sometimes!
Finally, I would like to draw your special attention to the
MIR interview with Vinita Bali. She heads the Britannia
company, one of the best known brands in India, as CEO
and Managing Director. The Economic Times’s “Business
Woman of the Year 2009” illuminates how various in-
novations drive growth and profi tability in emerging
economies. With striking examples, she illustrates the
hybrid economic development of nations like India and
explains how successful companies immediately adopt
international marketing trends like process orientation
or market segmentation. The international marketing
approach of global players in the market demands brave
marketing decisions guided by insights gained from sys-
tematically researching local consumer behavior.
Once again our objective for this issue of MIR is to help
you gain important insights into the complex functional
chains of marketing and therefore to improve the pro-
fessionalism of marketing practice. Today, innovation is
necessary for all of us in one way or another!
Nuremberg, October 2010
Hermann Diller
Editor-in-Chief
CONTACT
You can contact us at
by phone on
+ 49 911 5302-214,
or by fax on
+ 49 911 5302-210
Dr. Dr. h. c. H. Diller,
GfK-MIR,
University of Erlangen-
Nuremberg,
Lange Gasse 20,
D-90403 Nuremberg,
Germany
6
{ Editorial Board }
GfK MIR / Vol. 2, No. 2, 2010 / Editorial Board
Manfred Bruhn Sunil Gupta
Srinivas Reddy
Alain Jolibert Nicole Koschate Hans Stamer
Werner Reinartz Hans-Willi Schroiff
Bernd Skiera Markus Voeth

7Editorial Board / Vol. 2, No. 2, 2010 / GfK MIR
EDITORIAL BOARD
Manfred Bruhn, Professor of Marketing, University
of Basel, Switzerland
/ / /
Sunil Gupta, Edward W. Carter Professor of Business
Administration, Harvard Business School, Boston, USA
/ / /
Alain Jolibert, Professor of Marketing Research,
University of Grenoble, France
/ / /
Nicole Koschate, GfK Professor of Marketing Intelligence,
University of Erlangen-Nuremberg, Germany
/ / /
Srinivas Reddy, Professor of Marketing, Singapore
Management University, Singapore
/ / /
Werner Reinartz, Professor of Marketing and Retailing,
University of Cologne, Germany
/ / /
Hans-Willi Schroiff, Corporate Vice President Global
Market Research, Henkel KG & Co. KGaA, Dusseldorf, Germany
/ / /
Bernd Skiera, Professor of Marketing,
University of Frankfurt/Main, Germany
/ / /
Dr. Hans Stamer, Senior Manager Global Market Intelligence,
Wrigley GmbH, Unterhaching, Germany
/ / /
Markus Voeth, Professor of Marketing,
University of Stuttgart-Hohenheim, Germany
/ / /
/ / /
EDITOR IN CHIEF:
Hermann Diller, Professor of Marketing,
University of Erlangen-Nuremberg, Germany
/ / /
OPERATING EDITOR:
Dr. Christine Kittinger-Rosanelli,
GfK Marketing Intelligence Review
8 GfK MIR / Vol. 2, No. 2, 2010 / New Insights
{ New Insights }
9New Insights / Vol. 2, No. 2, 2010 / GfK MIR
Contradictory conclusions on market evolution
Microsoft Windows. Internet Explorer. Oracle relational
databases. These high-tech innovations have survived
numerous challenges and dominate their respective cat-
egories. The antitrust litigation against Microsoft in the
US and the European Union in the 1990s suggested great
concern about whether the dominance of Microsoft was
based on superior quality or abuse of market power. The
question arises if market forces support ineffi cient prod-
ucts of established fi rms even with the entry of superior
alternatives. For example, did Internet Explorer win in the
market because it was superior or because of Microsoft’s
monopoly power? If so, should these potential problems
be the focus of antitrust policy? Or can we rely on the
effi ciency of free markets to pick the best products even
when some fi rms dominate their markets?
Network or quality, what prevails?
So called “network effects” may play an important role in
hindering healthy market evolution. Such effects refer to
the tendency of consumers to choose products depend-
ing on what other consumers do so. Technically, network
effects can be explained as an increase in a consumer’s
utility from a product when the number of other users of
that product rises. Examples would be the popularity and
continual use of Facebook or Word. As a result, consum-
ers may decide to buy and use a product not because
it is superior but because their friends and colleagues
use it. If most consumers in the market follow this rule
of thumb, economists fear that such effects may lead
to consumer inertia and lock-in in favor of established
inferior products even when newer superior ones exist.
Paul Krugman, winner of the Nobel Memorial Prize in
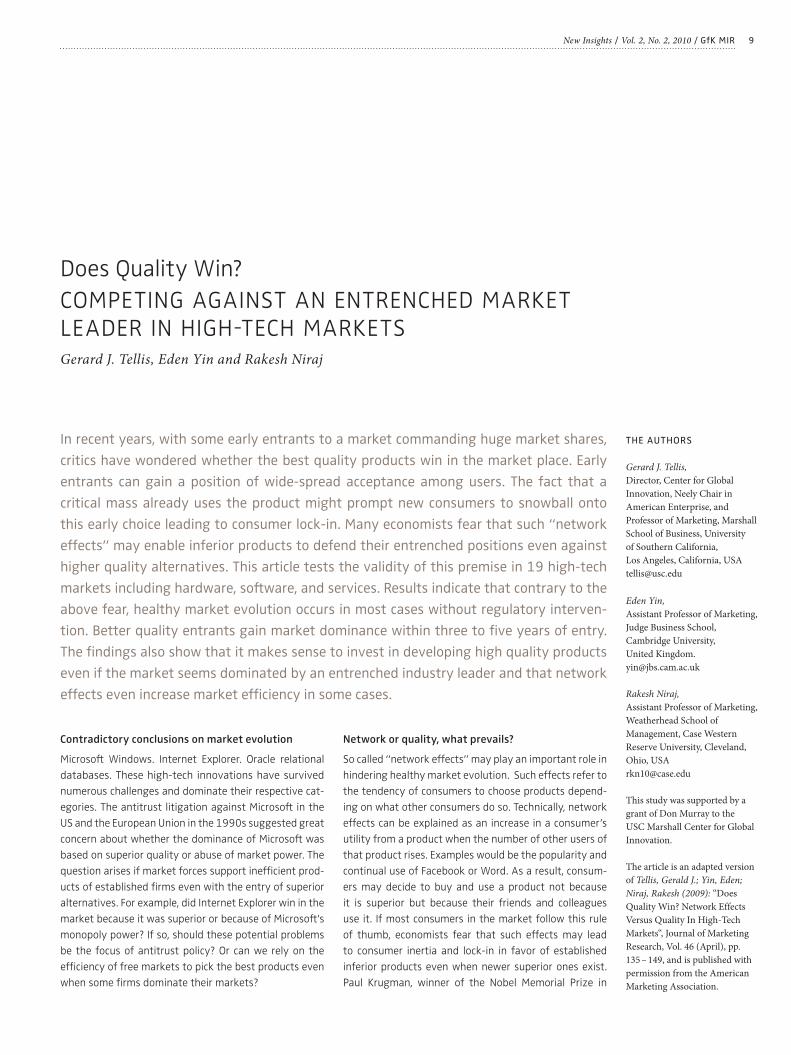
Does Quality Win?
COMPETING AGAINST AN ENTRENCHED MARKET LEADER IN HIGH-TECH MARKETSGerard J. Tellis, Eden Yin and Rakesh Niraj
THE AUTHORS
Gerard J. Tellis,
Director, Center for Global
Innovation, Neely Chair in
American Enterprise, and
Professor of Marketing, Marshall
School of Business, University
of Southern California,
Los Angeles, California, USA
Eden Yin,
Assistant Professor of Marketing,
Judge Business School,
Cambridge University,
United Kingdom.
Rakesh Niraj,
Assistant Professor of Marketing,
Weatherhead School of
Management, Case Western
Reserve University, Cleveland,
Ohio, USA
This study was supported by a
grant of Don Murray to the
USC Marshall Center for Global
Innovation.
The article is an adapted version
of Tellis, Gerald J.; Yin, Eden;
Niraj, Rakesh (2009): “Does
Quality Win? Network Effects
Versus Quality In High-Tech
Markets“, Journal of Marketing
Research, Vol. 46 (April), pp.
135 – 149, and is published with
permission from the American
Marketing Association.
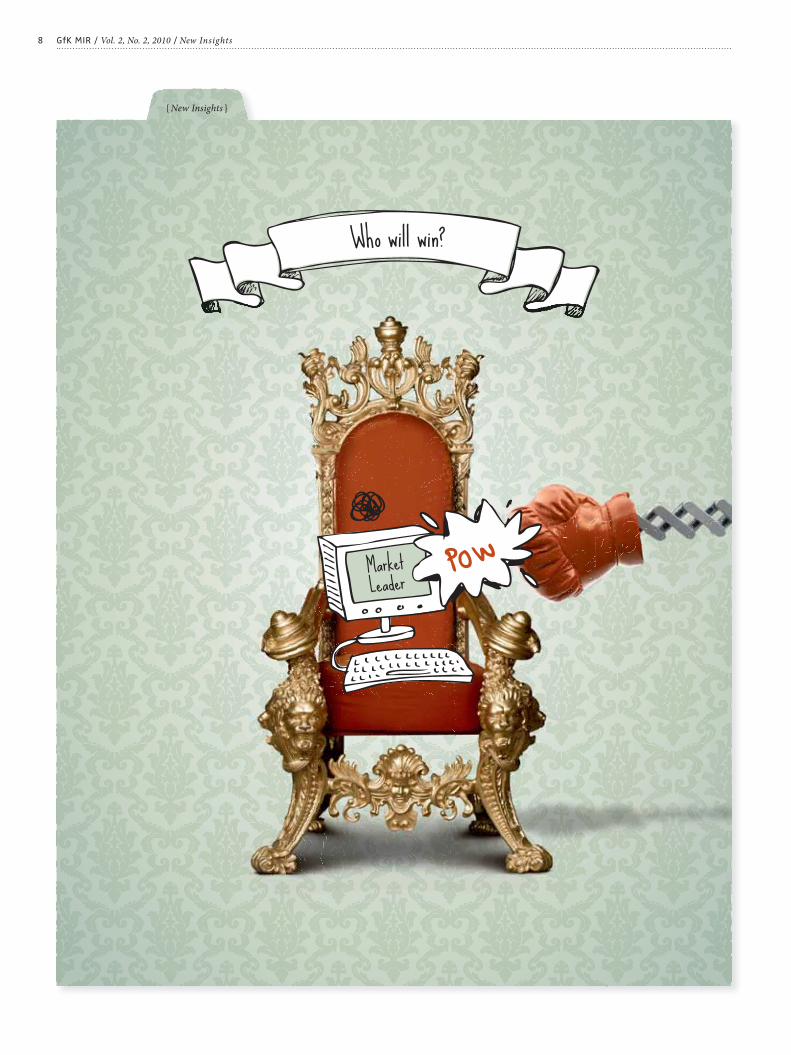
In recent years, with some early entrants to a market commanding huge market shares,
critics have wondered whether the best quality products win in the market place. Early
entrants can gain a position of wide-spread acceptance among users. The fact that a
critical mass already uses the product might prompt new consumers to snowball onto
this early choice leading to consumer lock-in. Many economists fear that such “network
effects” may enable inferior products to defend their entrenched positions even against
higher quality alternatives. This article tests the validity of this premise in 19 high-tech
markets including hardware, software, and services. Results indicate that contrary to the
above fear, healthy market evolution occurs in most cases without regulatory interven-
tion. Better quality entrants gain market dominance within three to fi ve years of entry.
The fi ndings also show that it makes sense to invest in developing high quality products
even if the market seems dominated by an entrenched industry leader and that network
effects even increase market effi ciency in some cases.
10
Economics in 2008, for instance, doubts that “markets
invariably lead the economy to a unique best solution”.
Instead, he asserts, “the outcome of market competition
often depends crucially on historical accidents”. A tech-
nology that by chance gains an early lead in adoption
may eventually corner the market of potential adopters,
with the other technologies locked out even though the
latter are superior.
Contrary to this position, scattered empirical research
suggests that markets do respond to quality. Superior
quality brands do command higher prices, market share,
and profi ts. The key question is, does this also hold in
modern markets in the presence of network effects. That
is, when a large number of consumers choose brands
based on which brand prior consumers chose, does the
whole market converge on an inferior quality product?
Explaining the contradictions
The resolution to this problem depends critically on two
conditions. First, is quality distinguishable prior to pur-
chase? Second, are at least a small segment of consum-
ers informed on quality? If consumers cannot distinguish
the quality of the products prior to purchase, or if all con-
sumers are uninformed on quality, then network effects
are likely to dominate the market. As a result, markets
will be ineffi cient, and a brand that fi rst enters the mar-
ket, will dominate the market even in the presence of
superior, later entrants.
On the other hand, if quality is distinguishable prior to
purchase and even a small segment of consumers are
informed on quality, then superior quality brands can
win. How will this happen? Each period, these informed
consumers will evaluate the brands in the market and
will choose the best quality brands. Those who cannot
evaluate quality will consult prior buyers of the brands.
At least some of them will be informed consumers and
would have chosen the best quality brands in the mar-
ket. So every period, the set of new consumers who
choose the best quality brands will increase. As further
new consumers consult these informed consumers,
more of them will choose the better quality brands and
the market will converge on the best quality brands.
The above argument is a hypothetical one depending
on certain conditions. What actually happens in practice
depends on the actual number of informed consumers in
the market. This is an empirical issue.
To empirically sort out whether inferior or better brands
actually prevailed in the market, we conducted a study
of 19 individual products and services within the per-
sonal computer industry in the 80s and 90s. The next
section describes the procedure of getting the relevant
measures as well as the analyses conducted to answer
the open research questions.
MARKET EVOLUTION IN THE PERSONAL
COMPUTER INDUSTRY
Market characteristic and relevant variables
The personal computer products and services markets
were selected for the analysis since these are supposed
to exhibit strong network effects. Thus, they would
generally favor the received wisdom of the superiority
of network effects over those of quality. A total of 19
hardware and software products as well as some services
were included in the sample. Different platforms, such
as PC and Mac, were treated as different product mar-
kets. However, the two PC operating platforms, DOS and
Windows, which emerged sequentially, were defi ned as
representing one market. In most of these markets, there
were usually two or three major competitors at any given
time, usually with one dominant brand that often kept
changing. Different product categories were tracked for
between 4 and 17 years. Table 1 (page 12) provides a
list of included product categories as well as some sum-
mary statistics like number of brands in each category,
the time period and the evolution of market leadership.
GfK MIR / Vol. 2, No. 2, 2010 / New Insights
» Fairly frequent changes in market
leadership were observed in the
sample. Market leadership rarely
rests with a single brand. «
11
Though pricing was not an explicit part of the study,
pricing information was necessary as a control variable.
The price data was scattered around each issue of mag-
azines in either the articles/features or the ads. Two
graduate students located all relevant pricing data for
the brands in the sample. Then all the price data was
compiled into a meaningful format by brand and aver-
aged per year.
A series of different analyses investigated the personal
computer market using the described variables. Some of
the key analyses and conclusions of the study are pre-
sented below.
EFFICIENCY, QUALITY AND NETWORK EFFECTS
IN THE PERSONAL COMPUTER INDUSTRY
If network effects were dominant, an early entrant
would dominate a market and one would not see chang-
es in market leadership. So a test of network effects was
an answer to this question:
Were Changes in Market Leadership Observed Over
the Years?
Indeed, fairly frequent changes in market leadership
were observed in the sample. Market leadership rarely
rests with a single brand. In a categorical analysis all
switches from being sub-dominant to being dominant in
either market share or quality were compared pair-wise.
> In 17 of the 19 markets, at least one switch in mar-
ket share leadership occurs during an average period
of 9.3 years sampled for these markets.
> The average duration of market leadership ranges
from 5.5 years in operating systems to as short as
2 years in web browser. Across all categories exam-
ined in this exercise, the average duration for market
leadership is only 3.8 years.
> Further, in 10 of these markets, there are multiple
switches in market share.
> Overall, a total of 34 switches in market share across
all the markets were observed.
A simple graphical analysis of markets reveals the same
picture: market shares are in a state of constant fl ux.
This observation does not support the existence of sim-
ple markets where consumers care only about the net-
work or randomly choose products ignoring network as
well as quality. Figure 1 (page 12) gives an overview of
these results.
The key variables used in the analysis include market
share, quality and network effects. Relative prices and
market growth were also considered in some analyses.
Quality is defi ned as the composite of a brand’s attri-
butes, on each of which consumers prefer more to less
(e.g. reliability, performance, and convenience). Networks
refer to the proportion of prior users of a brand. Effi ciency
of markets is measured as the best quality brand (after
adjusting for prices) emerges with the largest market
share. Other factors such as price, advertising, distribu-
tion, and market growth might also play a role in these
markets, but for most analyses they seemed uncritical in
assessing the role of network versus quality. Wherever
possible, price data was also collected and controlled for.
The Art of Collecting Data that Does Not Exist
The main challenges of collecting the data needed were
the long time period and the qualitative and scattered
characteristic of some key variables. The majority of the
market share data was taken from IDC (International
Data Corporation) and partly from Dataquest. However,
even these fi rms did not have complete or adequate data
on a number of categories. In those instances where the
data was not available from any syndicated source, other
archival sources were used to complement the data.
The quality measure was based on the ratings or reviews
in the three most respected and widely circulated com-
puter magazines: PC Magazine, PC/Computing, and PC
World plus the leading magazine for Mac products, Mac-
world. However, since many of the magazines published
reviews without numerical ratings, a content analysis of
the reviews was necessary to arrive at numerical ratings.
First, a set of terms was collected that reviewers often
use to describe these products. Then these terms were
grouped into fi ve levels expressing increasing quality.
Two specifi cally trained raters analyzed all reviews in-
dependently for content and converted the result into a
numerical score based on the prevalence of such terms
in the review (intercoder reliability 87 %).
In creating a measure for network effects, the repurchase
cycle for all markets in the sample was estimated to be
about three years. This assessment is based on personal
experience, interviews with some senior IT managers,
and interviews with some consumers. The information
collected indicated that software and hardware is typi-
cally upgraded or repurchased within three years. Thus,
the relevant network size was measured using the accu-
mulated market share of a brand in the past three years.
New Insights / Vol. 2, No. 2, 2010 / GfK MIR
12 GfK MIR / Vol. 2, No. 2, 2010 / New Insights
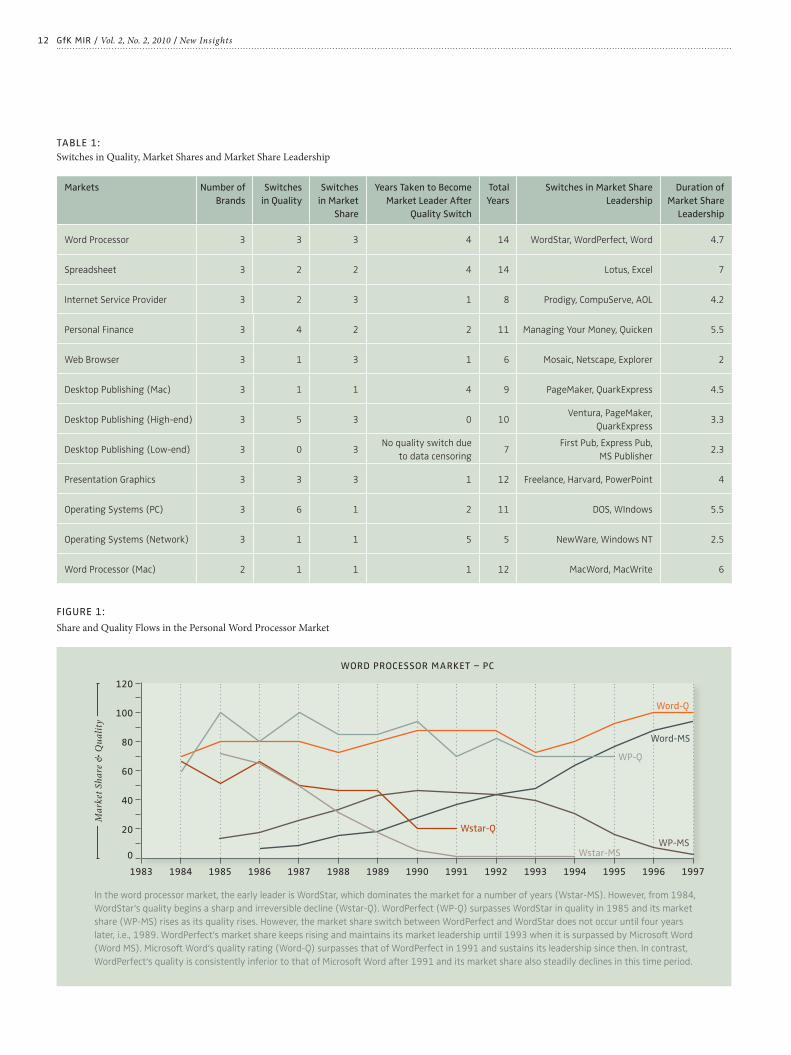
FIGURE 1:
Share and Quality Flows in the Personal Word Processor Market
TABLE 1:
Switches in Quality, Market Shares and Market Share Leadership
Markets Number of
Brands
Switches
in Quality
Switches
in Market
Share
Years Taken to Become
Market Leader After
Quality Switch
Total
Years
Switches in Market Share
Leadership
Duration of
Market Share
Leadership
Word Processor 3 3 3 4 14 WordStar, WordPerfect, Word 4.7
Spreadsheet 3 2 2 4 14 Lotus, Excel 7
Internet Service Provider 3 2 3 1 8 Prodigy, CompuServe, AOL 4.2
Personal Finance 3 4 2 2 11 Managing Your Money, Quicken 5.5
Web Browser 3 1 3 1 6 Mosaic, Netscape, Explorer 2
Desktop Publishing (Mac) 3 1 1 4 9 PageMaker, QuarkExpress 4.5
Desktop Publishing (High-end) 3 5 3 0 10Ventura, PageMaker,
QuarkExpress3.3
Desktop Publishing (Low-end) 3 0 3No quality switch due
to data censoring7
First Pub, Express Pub,
MS Publisher2.3
Presentation Graphics 3 3 3 1 12 Freelance, Harvard, PowerPoint 4
Operating Systems (PC) 3 6 1 2 11 DOS, WIndows 5.5
Operating Systems (Network) 3 1 1 5 5 NewWare, Windows NT 2.5
Word Processor (Mac) 2 1 1 1 12 MacWord, MacWrite 6
In the word processor market, the early leader is WordStar, which dominates the market for a number of years (Wstar-MS). However, from 1984,
WordStar‘s quality begins a sharp and irreversible decline (Wstar-Q). WordPerfect (WP-Q) surpasses WordStar in quality in 1985 and its market
share (WP-MS) rises as its quality rises. However, the market share switch between WordPerfect and WordStar does not occur until four years
later, i.e., 1989. WordPerfect‘s market share keeps rising and maintains its market leadership until 1993 when it is surpassed by Microsoft Word
(Word MS). Microsoft Word‘s quality rating (Word-Q) surpasses that of WordPerfect in 1991 and sustains its leadership since then. In contrast,
WordPerfect‘s quality is consistently inferior to that of Microsoft Word after 1991 and its market share also steadily declines in this time period.
WORD PROCESSOR MARKET – PC
Ma
rket
Sh
are
& Q
ua
lity
0
20
40
60
80
100
120
1983 1984 1985 1986 1987 1988 1989 1990 1991 1992 1993 1994 1995 1996 1997
Word-Q
Word-MS
WP-Q
WP-MS
Wstar-Q
Wstar-MS
13New Insights / Vol. 2, No. 2, 2010 / GfK MIR
If there are Changes in Market Leadership, are they
Related to Quality?
Again, the answer is a clear “yes”. Figure 1 gives an exam-
ple of the graphical analysis of the word processor market.
The other submarkets show a very similar picture. The
market shares of brands appear to rise following the rise
in their level of quality. Most switches in quality leadership
seem related to and precede switches in market leader-
ship. Hence, quality seems to play an important role in
infl uencing market dynamics. Moreover, these simple
graphical plots do not indicate that these markets are per-
verse. That is, there is no evidence that early market share
leaders dominate the market for long or do so if they lose
their quality edge for most markets analyzed. Categorical
analyses confi rmed that out of all the 34 switches in share
analyzed, 18 % are related to a switch in quality in the
same year, 50 % are related with a switch in quality in prior
years and 20 % are related to the sub-dominant brand al-
ready having a superior quality to the dominant brand. So,
in total, 88 % of the switches are related to the switches
or superiority in quality of the sub-dominant brands, but
only about 12 % have no relationships to quality changes.
In contrast, when there is no switch in share, we see that
quality of the inferior brand mostly stays inferior.
Overall, these results provide strong evidence that a su-
perior quality or a switch in quality of a subdominant
brand results in a switch in market share over the domi-
nant brand. A logit analysis further confi rms the link be-
tween quality and market share switches and fi nds the
strongest effects of quality switches two years prior to
the market share switch.
The results indicate that markets are responsive to qual-
ity, as is evidenced by the fact that prior switches in
quality signifi cantly increases the probability of a mar-
ket share switch in the immediate subsequent years. To
investigate the strength of the quality effect, a hazard
analysis of time to market share leadership was also
conducted for the data. It shows that the time it takes
for the smaller share brand to achieve market leadership
is affected positively and signifi cantly by the improve-
ment in quality of the smaller share brand over the larg-
er share brand. The probability of such a switch is much
higher when the gap in quality (of the lower share brand
over the high share brand) is higher. The leadership du-
ration variable has a negative and signifi cant effect on
the probability of market-share switch indicating that
a switch in market leadership takes longer in inertial or
slow moving markets.
Do Network Effects Inhibit a Healthy Market
Evolution?
Here, the answer is “no”. An indication for the presence
of strong network effects and a perverse market would
be the absence of changes in market leadership. This, as
outlined before, was not the case here. Another, softer,
indication of market effi ciency is whether a subdomi-
nant brand becomes a market leader within or beyond
the average repurchase cycle.
The frame of reference in this study is three years,
because prior research indicated that repurchase in
this product category happens approximately every
three years. Categorical analysis showed that, for web
browser, Internet service provider, image management
software, presentation graphics, and personal fi nance, it
takes less than three years for a sub-dominant brand to
become the new market leader after its quality exceeds
that of the dominant brand. For products like word pro-
cessor, spreadsheet, desktop publishing and network
operating systems, the time to attain market leadership
was usually longer, e.g., four to fi ve years. These results
demonstrate that the markets for the fi rst group of
products are highly effi cient. Superior products quickly
{ Box 1 }
Logit analysis is a technique which allows the probability
of an event occurring or not occurring to be estimated. It
predicts a binary outcome (in our case whether there is a
switch in market share or not) from a set of independent
variables. Only current or previous quality switches were
considered as independent variables in this analysis. The
relative role of quality and network size differences were
not analyzed and differences in product category inertia
was also not controlled.
A hazard analysis of time to market share leadership can
reveal the relative impact of independent variables on
how quickly a high quality brands becomes a market lead-
er. The study modeled time to market leadership as a
discrete time hazard process infl uenced by quality gap
and relative network sizes while controlling for leadership
duration within the market.
SELECTING APPROPRIATE METHODS TO REVEAL PATTERNS
14 GfK MIR / Vol. 2, No. 2, 2010 / New Insights
gain market leadership once their quality dominates
that of rivals. The markets for the second group of prod-
ucts are also effi cient, albeit markets settle down on
superior brands more slowly than the repurchase cycle.
The case of the PC operating system seems a notable
anomaly. This product category supposedly exhibits
strong network effects, but a superior Windows quickly
replaces DOS two years after its quality surpasses that
of DOS. One reason for this result is that the quality of
Windows is so much better than that of DOS. A suffi cient
quality gap overwhelms the power of network effects. It
again shows that quality rules in these markets and net-
work effects cannot protect the incumbent leaders from
competition. However, this advantage may have been
facilitated by the backward compatibility of Windows to
DOS.
These results make intuitive sense because the fi rst
group of products is generally believed to exhibit weaker
network effects whereas the second group of products is
much more infl uenced by network effects due to their in-
trinsic communication or sharing-oriented nature. Haz -
ard analysis confi rms some infl uence of network size on
switch in market leadership, but the effect of quality is
much stronger.
A CHALLENGE TO PRIOR “RECEIVED WISDOM”
Even if this study is limited to one industry and a lim-
ited set of key variables, the results have some impor-
tant implications for business strategy and public policy
and challenge some widespread assumptions on market
mechanisms. They apply whenever there is an increase
in utility of a product for any one user from more users
of the product. Examples are the increase in value of a
cell phone, email, or a multi-person game to one person
as more people own these products.
Is “rush to market” a right mantra to follow?
As previously discussed, high-tech fi rms spend enor-
mous resources in rushing new products to market in an
attempt to outpace their respective competitors. How-
ever, the undeniable truth is that many new products
fail. One of the major reasons for these failures is the
premature product launch undertaken by many high-
{ Box 2 }
Summary of Results
> Markets are effi cient in general.
> Market leadership changes frequently and market
leaders hold sway for an average of a mere 3.8
years.
> Change in market leadership is generally associated
with a change in quality the same year or a few
years earlier.
> Both network effects and quality are factors in
determining market share, but quality seems more
important.
> Even in the presence of network effects, the market
is not ineffi cient.
> The presence of network effects enhances the
effi ciency of the market that derives from a quality
conscious segment of consumers.
EFFICIENCY, QUALITY AND NET-WORK EFFECTS IN THE PERSONAL COMPUTER INDUSTRY
» Time for market leadership by
the smaller share brand is affected
positively and significantly by the
improvement in quality of the
smaller share brand over the larger
share brand. «
15
Krugman, Paul (1994), Peddling Prosperity, New York:
Norton
Tellis, Gerard J. and Peter N. Golder (1996), “First to
Market, First to Fail? The Real Causes of Enduring
Market Leadership“, Sloan Management Review, 37 (2),
pp. 65 – 75.
Tellis, Gerard J. and Peter Golder (2001), “Will and
Vision: How Latecomers Grow to Dominate Markets“,
McGraw Hill.
FURTHER READING
KEYWORDS:
Competition, Product Quality,
Network Eff ects, Market
Evolution, Market Leadership,
Market Effi ciency, Computer
Industry
New Insights / Vol. 2, No. 2, 2010 / GfK MIR
tech managers who rush to market, encouraged by the
popular myth of pioneering advantage. The results of
this study suggest that superior quality appears to be a
very important driver of success and market leadership
changes frequently. Thus, companies may need to put
a premium on quality rather than on speed to market.
Are network effects a reliable shield for
existing leaders?
This study shows that switches in quality consistently re-
sult in switches in market share, albeit with a lag of some
years. Network effects may delay but do not prevent su-
perior brands taking over the market. On the contrary,
even established market leaders, though they enjoy a
large network of users, are vulnerable to threats from
new entrants that introduce superior alternatives. A net-
work is not a reliable shield on which an existing leader
can rely. Constant quality enhancement is an effective
way for existing leaders to defend their current positions.
Are network effects responsible for
perverse markets?
Network effects have been blamed as the devil that
causes market ineffi ciency, e.g., an inferior product or
standard can dominate the market simply because of its
large network size. This was not generally observed in
this study. In some cases strong networks did slow down
the switch in market leadership. However, the study also
revealed that networks effects, under certain circum-
stances, could even make the market more effi cient.
If suffi cient consumers care about quality, then network
effects enhance the role of quality, because other con-
sumers also benefi t from the choices of quality-con-
scious ones. Consequently, the entire market settles on
the better products more quickly and at a higher level
than it would have in the absence of network effects. In
this case, network effects speed the transfer of informa-
tion from the informed to the uninformed.
Should government act as a substitute for
“the invisible hand”?
This study shows that quality drives the success of high-
tech giants, even though network effects are present. It
seems that markets do settle on the best option while
remaining open to better ones. Therefore, high-tech
markets are reasonably effi cient and rational. Govern-
ment intervention, which is intended to assume the role
of “the invisible hand” in high-tech markets, may be
costly and unnecessary. •
16
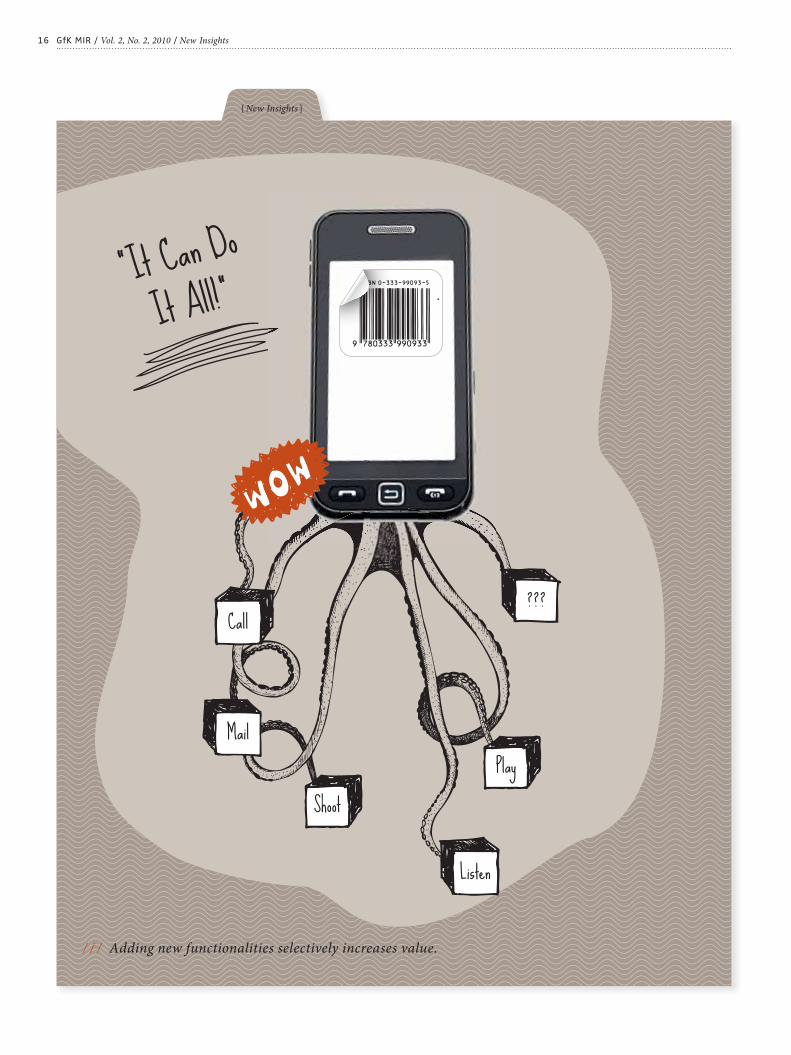
/ / / Adding new functionalities selectively increases value.
GfK MIR / Vol. 2, No. 2, 2010 / New Insights
{ New Insights }
17
It Can Do It All!
Convergence is a dominant paradigm in the contempo-
rary high-tech electronics sector — specifi cally, the in-
tersection of computers, communications, and con-
sumer electronics industries.
It is not uncommon to watch television on a cell phone,
to access the internet on a personal digital assistant
(PDA) or to watch a movie on a portable gaming con-
sole. Products that are formed by adding a new func-
tionality (from another category) to an existing base
product are referred to as “convergent products” (CPs).
The technical possibilities to integrate new functional-
ities are almost endless, but do consumers really value
all new features alike? Or are there any guidelines that
“Call. Mail. Shoot. Listen. Play“.
BUT WHAT FUNCTIONALITIES ADD REAL VALUE IN CONVERGENT PRODUCTS?Tripat Gill
THE AUTHOR
Tripat Gill
is Assistant Professor of
Marketing, Faculty of Business
and Information Technology,
University of Ontario Institute
of Technology, Oshawa, ON,
Canada
This article is an updated version
of: Gill, T. (2008): “Convergent
products: What functionalities
add more value to the base?“,
Journal of Marketing, 72 (2),
pp. 46 – 62, and is published with
the permission of the American
Marketing Association.
could aid manufactures in their decision of what to inte-
grate into a given base product? For example, a manu-
facturer of PDAs may wonder whether it is a good idea
to add mobile television to a PDA, which would mean
adding a new functionality that is dissimilar to the exist-
ing capabilities. Conversely, it might be better to add a
new functionality that is similar to the existing features
of a PDA (e.g., adding more information and organizing
abilities, such as electronic Yellow Pages). Similarly, a
manufacturer of MP3 players (e.g., Apple’s iPod) may
debate the addition of satellite radio (a functionality
congruent with the existing capabilities) versus adding
information-associated functions, such as electronic
newscasts or weather forecasts (i.e., incongruent new
functionalities).
It is very common to add diverse new functionalities to existing base products (e.g., add-
ing mobile television to a cell phone or internet access to a personal digital assistant).
These convergent products offer users a broad choice of potential applications. However,
it is not clear what additions are actually valued by consumers, and therefore also make
sense from a manufacturer’s perspective. The current research addresses this very issue.
It investigates the role of three factors on the evaluation of such convergent products
(CPs); namely, (1) the consumption goal (utility versus fun-oriented) associated with the
base product and the added functionality, (2) the prior ownership of the base product,
and (3) the quality of the brand introducing the new functionality. In three experimental
studies, the author explores the effect of each of the above three factors in the evaluation
of CPs. On the basis of the results he presents some guidelines on how to extend existing
products to create more value for consumers and manufacturers.
New Insights / Vol. 2, No. 2, 2010 / GfK MIR
18
Fun Versus Utility
Consumers are known to have both utilitarian and he-
donic considerations when evaluating products and
functionalities. Whereas hedonic goals (and value) are
associated with experiential consumption, pleasure, fun
and excitement (e.g., the pleasure experienced while lis-
tening to music on an MP3 player), utilitarian goals (and
value) are related to more instrumental/practical con-
siderations (e.g., the convenience of using a PDA to keep
appointments and contact addresses). In CPs, the base
product and the added new functionality can each have
associations with fun or utility. Thus, combining a base
product with a new functionality can entail adding more
fun or more utility to an existing base product. In es-
sence, four combinations of hedonic (fun) and utilitarian
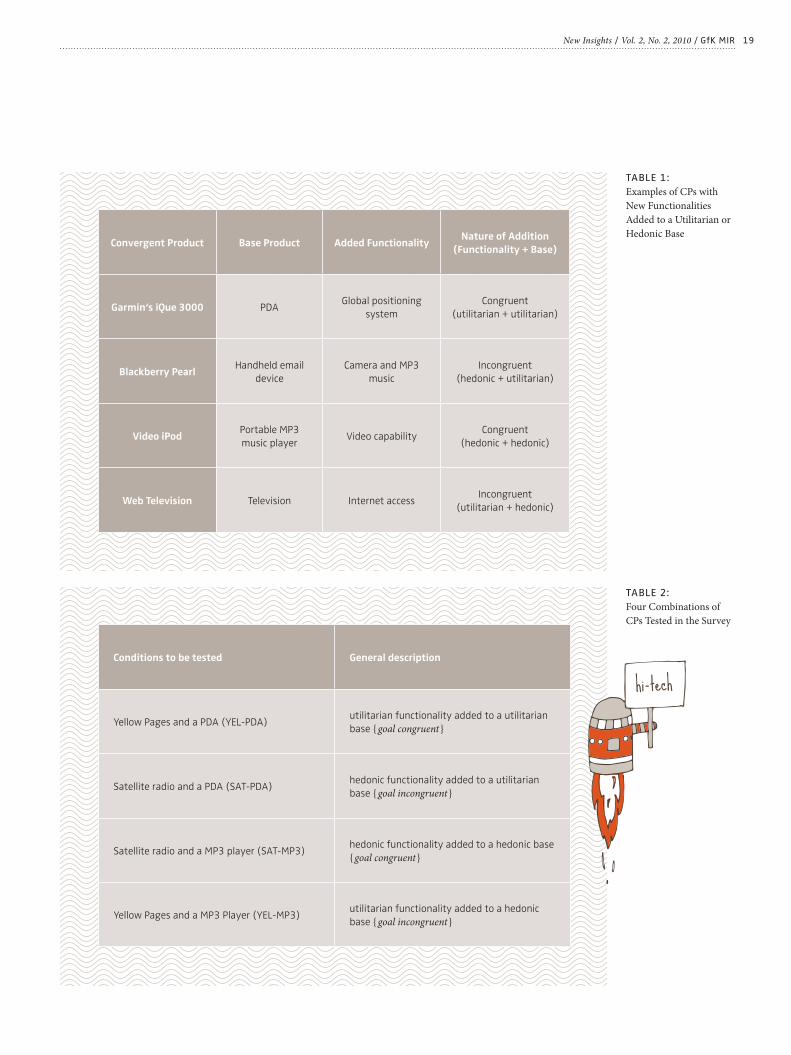
(utility) goals are possible in CPs. Table 1 shows exam-
ples for each of these four combinations. The author pro-
poses that the incremental value of an added functional-
ity differs according to the possible combinations of fun
and utility.
Understanding the Evaluation of Fun Versus Utility
Combinations
To understand how the different combinations of CPs
might be evaluated by consumers, two effects are ex-
pected to be at work.
1. Diminishing marginal utility
The principle of diminishing marginal utility suggests
that the value of adding similar features/functionalities
increases at a diminishing rate. This would apply to CPs
that add congruent functionalities to a base (i.e., the
“utilitarian + utilitarian” and “hedonic + hedonic” com-
binations).
2. Contrast effect
Prior research on innovations has shown that new prod-
ucts with contrasting features (i.e., differentiated) are
evaluated more favorably than those with features sim-
ilar to existing products. Applying this principle to the
context of CPs, incongruent combinations of CPs (i.e.,
“hedonic + utilitarian” or “utilitarian + hedonic”) should
be favored over congruent combinations (i.e., “utilitari-
an + utilitarian” or “hedonic + hedonic”).
Fun Outplays Utility: The Asymmetric Additivity
Effect
The author proposes that the above-found contrast ef-
fect is not equally applicable to CPs with a utilitarian ver-
sus a hedonic base. Specifi cally, it is proposed that add-
ing a fun-oriented functionality to a utilitarian base (i.e.,
GfK MIR / Vol. 2, No. 2, 2010 / New Insights
the “hedonic + utilitarian” CP) is evaluated positively,
whereas adding a utility-oriented functionality to a he-
donic base (i.e., the “utilitarian + hedonic” CP) is evalu-
ated negatively. This is termed as the “asymmetric ad-
ditivity effect”, and it occurs because:
> Hedonic functionalities are perceived as pleasurable/
exciting and can elicit spontaneous positive reactions.
Thus, when a hedonic functionality is added to a utili-
tarian base (e.g., the BlackBerry Pearl which added
camera and music to the e-mail base) it results in the
base being perceived as “more fun to use”.
> On the other hand, utilitarian functionalities are per-
ceived as cold, unexciting and less pleasurable. Thus,
when a utility-oriented functionality is added to a he-
donic base (e.g., adding web access to television) it
results in the base being perceived as “less fun to
use”. Note that even though utilitarian functionalities
can make a hedonic base more “useful”, the ensuing
loss in hedonic value (i.e., the perception that the
base is “less fun to use”) weighs more heavily in con-
sumers’ minds.
The above-proposed asymmetric additivity effect re-
sults in the following outcomes for CPs with a hedonic
versus a utilitarian base:
> For CPs with a utilitarian base a “contrast effect” is ex-
pected. That is, adding an incongruent fun-oriented
new functionality would be more favorable than add-
ing a congruent utility-oriented functionality (e.g., a
PDA with satellite radio will have more incremental
value than a PDA with electronic Yellow Pages).
> For CPs with a hedonic base an “image consistency ef-
fect” should occur. Specifi cally, adding an incongruent
utility-oriented new functionality should be less fa-
vorable than adding a congruent fun-oriented func-
tionality (e.g., an MP3 player with electronic Yellow
Pages will have less incremental value than an MP3
player with satellite radio).
Testing for the Asymmetric Effects in CPs
To examine the above effects, an experimental study
was conducted with a large-scale, representative sample
of the target market for CPs. The chosen base product
categories were a PDA and an MP3 player because the
former is primarily associated with utilitarian goals (i.e.,
organizing ability, contact addresses, and other informa-
tion) and the latter is associated with relatively hedonic
19New Insights / Vol. 2, No. 2, 2010 / GfK MIR
TABLE 1:
Examples of CPs with
New Functionalities
Added to a Utilitarian or
Hedonic Base
TABLE 2:
Four Combinations of
CPs Tested in the Survey
Convergent Product Base Product Added FunctionalityNature of Addition
(Functionality + Base)
Garmin‘s iQue 3000 PDAGlobal positioning
system
Congruent
(utilitarian + utilitarian)
Blackberry PearlHandheld email
device
Camera and MP3
music
Incongruent
(hedonic + utilitarian)
Video iPodPortable MP3
music playerVideo capability
Congruent
(hedonic + hedonic)
Web Television Television Internet accessIncongruent
(utilitarian + hedonic)
Conditions to be tested General description
Yellow Pages and a PDA (YEL-PDA)utilitarian functionality added to a utilitarian
base { goal congruent }
Satellite radio and a PDA (SAT-PDA)hedonic functionality added to a utilitarian
base { goal incongruent }
Satellite radio and a MP3 player (SAT-MP3)hedonic functionality added to a hedonic base
{ goal congruent }
Yellow Pages and a MP3 Player (YEL-MP3)utilitarian functionality added to a hedonic
base { goal incongruent }
20
goals (i.e., listening to music/entertainment). In a pre-
test, two functionalities to be added to the base were
selected from a set of eight, such that (1) one function-
ality was associated with utilitarian goals and the other
was associated with hedonic goals; (2) one functionality
was (goal) congruent with a PDA and incongruent with
an MP3 player, and vice versa for the other; and (3) both
functionalities were of equal perceived value. Among
the eight functionalities tested, only two met the re-
quirements for all the three criteria, namely, electronic
Yellow Pages and satellite radio. Table 2 (page 19) gives
an overview of the test conditions used in the survey.
Four separate online surveys were conducted (one for
each of the four CPs: YEL-PDA, SAT-PDA, SAT-MP3, and
YEL-MP3, all with the same questions) with a represen-
tative sample of the potential US-target market for the
two base products. It was administered until 500 com-
pleted responses were obtained for each of the four sur-
veys (overall response rate of 15 %). Respondents care-
fully read the description for one of the four CPs created
by adding one new functionality to an existing base
product (as per table 2). They then responded to several
questions pertaining to the CP, the base product and the
added functionality. The key dependent measure was
the perceived incremental value of the CP, compared
with the base product (this was measured using two
variables: overall incremental value = OIV, and incremen-
tal willingness to pay = IWTP). In addition, respondents
were asked to indicate whether they owned the base
product corresponding to the CP they evaluated (i.e.,
PDA or MP3 player).
GfK MIR / Vol. 2, No. 2, 2010 / New Insights
Results
Table 3 shows the incremental value perceived by re-
spondents for the four CPs for both the dependent mea-
sures (i.e., OIV and IWTP).
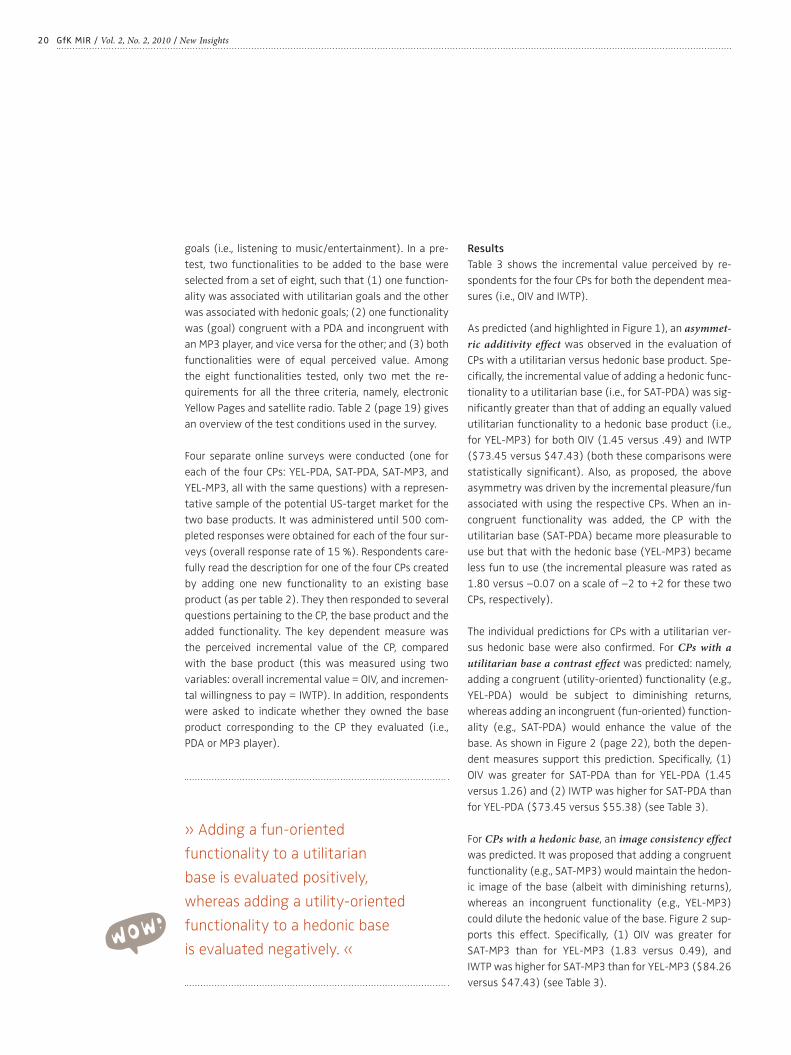
As predicted (and highlighted in Figure 1), an asymmet-
ric additivity effect was observed in the evaluation of
CPs with a utilitarian versus hedonic base product. Spe-
cifi cally, the incremental value of adding a hedonic func-
tionality to a utilitarian base (i.e., for SAT-PDA) was sig-
nifi cantly greater than that of adding an equally valued
utilitarian functionality to a hedonic base product (i.e.,
for YEL-MP3) for both OIV (1.45 versus .49) and IWTP
($73.45 versus $47.43) (both these comparisons were
statistically signifi cant). Also, as proposed, the above
asymmetry was driven by the incremental pleasure/fun
associated with using the respective CPs. When an in-
congruent functionality was added, the CP with the
utilitarian base (SAT-PDA) became more pleasurable to
use but that with the hedonic base (YEL-MP3) became
less fun to use (the incremental pleasure was rated as
1.80 versus –0.07 on a scale of –2 to +2 for these two
CPs, respectively).
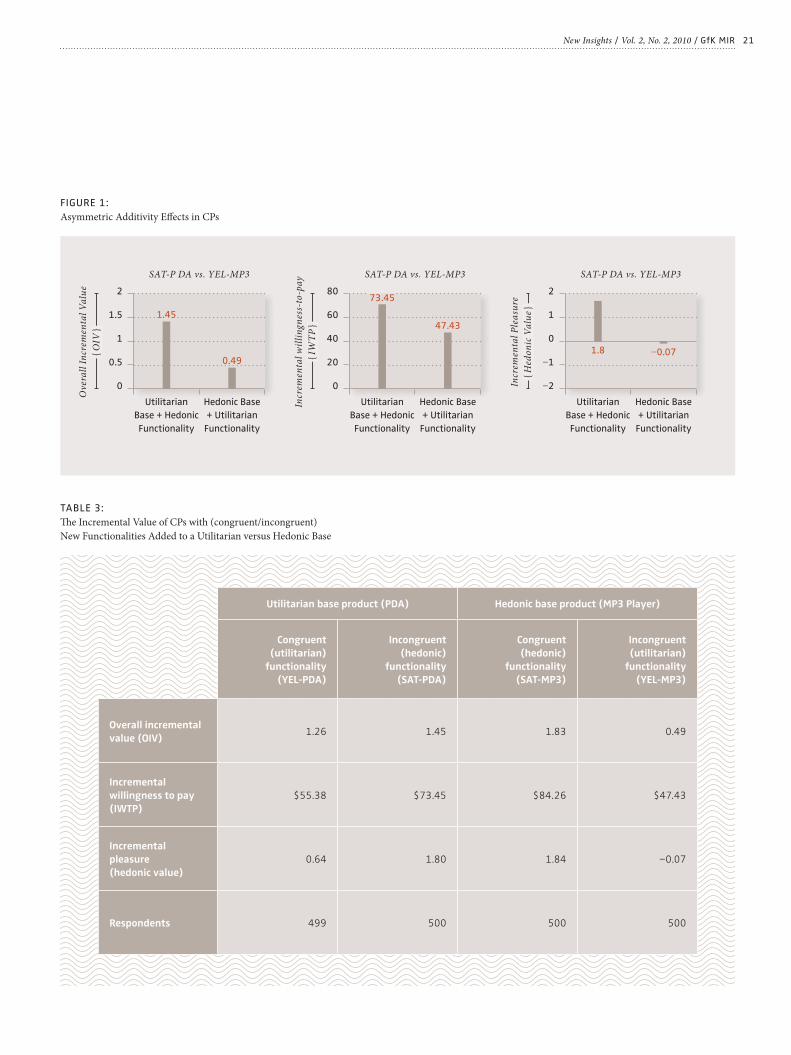
The individual predictions for CPs with a utilitarian ver-
sus hedonic base were also confi rmed. For CPs with a
utilitarian base a contrast effect was predicted: namely,
adding a congruent (utility-oriented) functionality (e.g.,
YEL-PDA) would be subject to diminishing returns,
whereas adding an incongruent (fun-oriented) function-
ality (e.g., SAT-PDA) would enhance the value of the
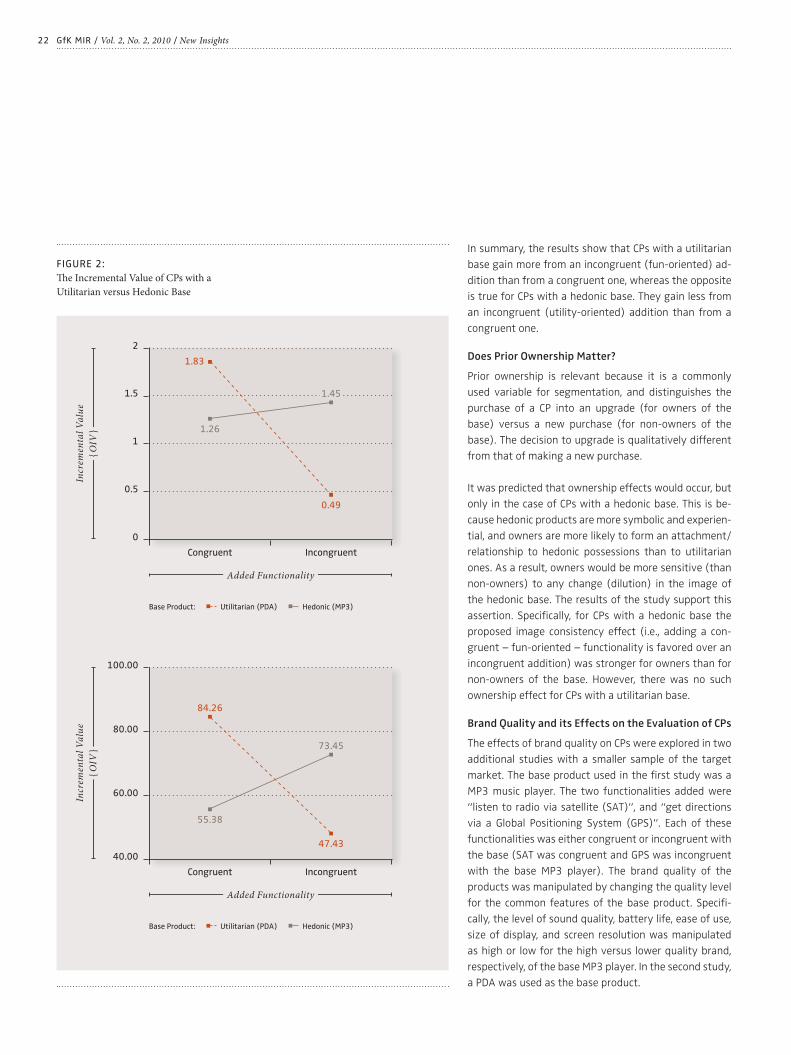
base. As shown in Figure 2 (page 22), both the depen-
dent measures support this prediction. Specifi cally, (1)
OIV was greater for SAT-PDA than for YEL-PDA (1.45
versus 1.26) and (2) IWTP was higher for SAT-PDA than
for YEL-PDA ($73.45 versus $55.38) (see Table 3).
For CPs with a hedonic base, an image consistency effect
was predicted. It was proposed that adding a congruent
functionality (e.g., SAT-MP3) would maintain the hedon-
ic image of the base (albeit with diminishing returns),
whereas an incongruent functionality (e.g., YEL-MP3)
could dilute the hedonic value of the base. Figure 2 sup-
ports this effect. Specifi cally, (1) OIV was greater for
SAT-MP3 than for YEL-MP3 (1.83 versus 0.49), and
IWTP was higher for SAT-MP3 than for YEL-MP3 ($84.26
versus $47.43) (see Table 3).
» Adding a fun-oriented
functionality to a utilitarian
base is evaluated positively,
whereas adding a utility-oriented
functionality to a hedonic base
is evaluated negatively. «
21New Insights / Vol. 2, No. 2, 2010 / GfK MIR
FIGURE 1:
Asymmetric Additivity Eff ects in CPs
TABLE 3:
Th e Incremental Value of CPs with (congruent/incongruent)
New Functionalities Added to a Utilitarian versus Hedonic Base
Utilitarian base product (PDA) Hedonic base product (MP3 Player)
Congruent
(utilitarian)
functionality
(YEL-PDA)
Incongruent
(hedonic)
functionality
(SAT-PDA)
Congruent
(hedonic)
functionality
(SAT-MP3)
Incongruent
(utilitarian)
functionality
(YEL-MP3)
Overall incremental
value (OIV)1.26 1.45 1.83 0.49
Incremental
willingness to pay
(IWTP)
$55.38 $73.45 $84.26 $47.43
Incremental
pleasure
(hedonic value)
0.64 1.80 1.84 −0.07
Respondents 499 500 500 500
SAT-P DA vs. YEL-MP3
0
2
1.5
1
0.5
Utilitarian
Base + Hedonic
Functionality
Hedonic Base
+ Utilitarian
Functionality
Ove
rall
In
crem
enta
l V
alu
e
{ O
IV }
SAT-P DA vs. YEL-MP3
0
80
60
40
20
Utilitarian
Base + Hedonic
Functionality
Hedonic Base
+ Utilitarian
Functionality
Incr
emen
tal
wil
lin
gnes
s-to
-pa
y
{ IW
TP
}
SAT-P DA vs. YEL-MP3
−2
2
1
0
−1
Utilitarian
Base + Hedonic
Functionality
Hedonic Base
+ Utilitarian
Functionality
Incr
emen
tal
Ple
asu
re
{ H
edo
nic
Va
lue
}
1.45
0.49
73.45
47.43
1.8 −0.07
22 GfK MIR / Vol. 2, No. 2, 2010 / New Insights
In summary, the results show that CPs with a utilitarian
base gain more from an incongruent (fun-oriented) ad-
dition than from a congruent one, whereas the opposite
is true for CPs with a hedonic base. They gain less from
an incongruent (utility-oriented) addition than from a
congruent one.
Does Prior Ownership Matter?
Prior ownership is relevant because it is a commonly
used variable for segmentation, and distinguishes the
purchase of a CP into an upgrade (for owners of the
base) versus a new purchase (for non-owners of the
base). The decision to upgrade is qualitatively different
from that of making a new purchase.
It was predicted that ownership effects would occur, but
only in the case of CPs with a hedonic base. This is be-
cause hedonic products are more symbolic and experien-
tial, and owners are more likely to form an attachment/
relationship to hedonic possessions than to utilitarian
ones. As a result, owners would be more sensitive (than
non-owners) to any change (dilution) in the image of
the hedonic base. The results of the study support this
assertion. Specifi cally, for CPs with a hedonic base the
proposed image consistency effect (i.e., adding a con-
gruent – fun-oriented – functionality is favored over an
incongruent addition) was stronger for owners than for
non-owners of the base. However, there was no such
ownership effect for CPs with a utilitarian base.
Brand Quality and its Effects on the Evaluation of CPs
The effects of brand quality on CPs were explored in two
additional studies with a smaller sample of the target
market. The base product used in the fi rst study was a
MP3 music player. The two functionalities added were
“listen to radio via satellite (SAT)”, and “get directions
via a Global Positioning System (GPS)”. Each of these
functionalities was either congruent or incongruent with
the base (SAT was congruent and GPS was incongruent
with the base MP3 player). The brand quality of the
products was manipulated by changing the quality level
for the common features of the base product. Specifi -
cally, the level of sound quality, battery life, ease of use,
size of display, and screen resolution was manipulated
as high or low for the high versus lower quality brand,
respectively, of the base MP3 player. In the second study,
a PDA was used as the base product.
FIGURE 2:
Th e Incremental Value of CPs with a
Utilitarian versus Hedonic Base
2
1.5
1
0.5
0
Congruent Incongruent
Incr
emen
tal
Va
lue
{ O
IV }
Added Functionality
0.49
Base Product: Utilitarian (PDA) Hedonic (MP3)
1.83
1.26
1.45
100.00
80.00
60.00
40.00
Congruent Incongruent
Incr
emen
tal
Va
lue
{ O
IV }
Added Functionality
47.43
Base Product: Utilitarian (PDA) Hedonic (MP3)
84.26
55.38
73.45
23New Insights / Vol. 2, No. 2, 2010 / GfK MIR
Prior research on new product adoption has found that
the impact of a new feature is mainly infl uenced by two
factors: (1) the value (or benefi ts) accrued by adding
new features to existing products; and (2) the perfor-
mance uncertainty associated with the added feature. It
was proposed that when a congruent functionality is
added the evaluation of high versus lower quality brands
is based more on the value added by the new feature
than on the performance uncertainty (as it is congruent
with the base). In such a case, the new feature is assimi-
lated into the overall evaluation of the product. Since a
high quality base already has a high evaluation it has less
to gain from a congruent feature addition, as compared
to a lower quality base. Therefore a high quality (base)
brand has less incremental gain than a lower quality one
from the addition of a congruent new functionality.
In contrast, when adding an incongruent new function-
ality the situation might be different. Consumers may
be uncertain about the performance of the added func-
tionality. In such cases high quality brands could serve as
a stronger signal for product performance than lower
quality ones. Thus, a high quality base brand would gain
more than a lower quality one from the addition of an
incongruent new functionality.
The results of the fi rst study supported the assumption
pertaining to a congruent addition (i.e., when SAT was
added to an MP3 player, the gain was signifi cantly high-
er for the lower quality brand as compared to the high
quality one). However, in the case of the incongruent
condition there was no signifi cant difference between
the value added to the lower and high quality brands.
The latter outcome was contrary to what was expected.
It was suspected that since the perceived value of the
base product (i.e., the MP3 player) may already be very
high, adding an incongruent new functionality may not
provide signifi cantly more value to the base (akin to a
“ceiling effect”). Therefore the same effect was tested in
a follow-up study using a base product with a relatively
modest perceived value: a PDA. A subsequent measure
confi rmed the above difference in value between the
two base products (i.e., the perceived value, in the study
sample, was indeed very high for the MP3 player and
only moderate for the PDA). The follow-up study with a
PDA solely investigated the relative gains to high versus
lower quality brands when an incongruent functionality
was added (i.e., SAT added to a PDA).
It was found that in this case participants did indeed
perceive lower performance uncertainty when the incon-
gruent functionality was added to a high quality base
brand rather than to the lower quality brand. Accord-
ingly, a marginally (but not signifi cantly) higher value
gain was observed for the high quality brand. So, when a
moderately valued base was used (i.e., PDA) the incre-
mental gain from an incongruent functionality was di-
rectionally higher for the high quality brand as com-
pared to the lower quality one.
» Convergent products with a
utilitarian base gain more from
an incongruent (fun-oriented)
addition than from a congruent
one, whereas the opposite is true
for convergent products with a
hedonic base. «
24 GfK MIR / Vol. 2, No. 2, 2010 / New Insights
GUIDELINES FOR MANAGERS
Balance capability and usability
Adding new functionalities from different categories has
become a widely used (and often fashionable) means to
innovate and launch new CPs. Prior research has shown
that adding more features may in fact increase the per-
ceived capability (i.e., the number of benefi ts provided)
of a product, but it simultaneously reduces its perceived
usability (i.e., the ease of use). This reduction in usability
could eventually have a detrimental effect on the long-
term satisfaction with the feature-loaded product (re-
ferred to as “feature fatigue”). The current research
shows that not all new functionalities will increase per-
ceived capability of the CP equally.
Feature fatigue depends on the nature
of the added functionality
The incremental value depends on the nature of the
base product and the added functionality (i.e., whether
they are hedonic or utilitarian). For utilitarian base prod-
ucts a goal incongruent hedonic (fun-oriented) addition
is valued more than a congruent one. For hedonic base
products, on the other hand, it seems more advisable to
add congruent (hedonic) new functionalities rather than
utilitarian ones, which might harm the products’ fun im-
age. Taken together, it appears that the perceived fea-
ture fatigue should be lower for hedonic than for utilitar-
ian additions in CPs.
Applying the fi ndings to products and services
Some examples highlight the applicability of these fi nd-
ings. In the context of cell phones (a relatively utilitarian
base product), the addition of cameras (a relatively
hedonic, incongruent functionality) has rapidly in-
creased in popularity (in terms of adoptio/usage) than
the addition of email/GPS systems (relatively utilitari-
an, congruent functionalities). A similar example can
be observed in the context of hedonic products: whereas
video iPods (a hedonic addition to a hedonic base prod-
uct) were an instant success, the concept of web televi-
sion (i.e., internet access on a television) — a utilitarian
addition to a hedonic base — has not been successful,
despite many attempts by a reputable manufacturer.
The current fi ndings may also be applicable in the con-
text of services. For instance, adding more utility-orient-
ed (congruent) services to a relatively utilitarian base
» Since a high quality base
already has a high evaluation it
has less to gain from a congruent
feature addition, as compared to
a lower quality base. «
25
Pine, B. Joseph, II and James H. Gilmore (1998),
“Welcome to the Experience Economy“, Harvard
Business Review, 76 (July/August), pp. 97 – 105.
Rust, Roland T., Debora Viana Thompson,
and Rebecca W. Hamilton (2006),
“Defeating Feature Fatigue“, Harvard Business Review,
84 (February), pp. 98 – 107.
Ward, Scott, Larry Light, and Jonathan Goldstine (1999),
“What High-Tech Managers Need to Know About
Brands“, Harvard Business Review, 77 (July / August),
pp. 85 – 96.
Yoffie, David A. (1997),
Competing in the Age of Digital Convergence. Boston,
MA: Harvard Business School Press.
FURTHER READING
KEYWORDS:
Product Innovations,
Convergent Products,
Product Features, Consumer
Value, Consumption Goals,
Utilitarian, Hedonic
New Insights / Vol. 2, No. 2, 2010 / GfK MIR
service (e.g., offering self-defense lessons at a fi tness
centre) may be valued less than a hedonic addition (e.g.,
offering dance lessons at a fi tness center) (assuming
they are equally-valued). On the other hand, for a rela-
tively hedonic base service, adding more hedonic ele-
ments (e.g., adding music kiosks in a movie theatre com-
plex) may be valued more than equally-valued utilitarian
additions (e.g., adding email access kiosks in a movie
theatre complex).
Prior owners are more sensitive to changes
Ownership effects found in the context of CPs have im-
plications for targeting these new products to specifi c
segments. On the basis of the fi ndings, it can be said
that for CPs with a utilitarian base, both segments (prior
owners and non-owners) value incongruent, fun-en-
hancements more than congruent, utilitarian ones. How-
ever, for CPs with a hedonic base, prior owners are more
sensitive than non-owners to the changes in the hedon-
ic image of the base. Current owners of existing hedonic
products (e.g., iPods and handheld games) may be par-
ticularly resistant to additions of utilitarian functional-
ities. Any such additions may actually harm the existing
image and dilute the value of the base products among
their prior owners.
The quality level of the brand makes a difference
Last but not least, the current research offers practical
insights for predicting the relative gain to different
brands that introduce CPs. The evaluation of such new
products is infl uenced not only by their added (techni-
cal) functionalities but also by the quality of the base
product. The studies reported here suggest that a lower
quality brand would benefi t more from adding a congru-
ent functionality, whereas a high quality brand is likely
to gain more from an incongruent addition.
These fi ndings may also apply when managers decide
what kind of functionalities should be added to different
models of the same base brand. For instance, a high-end
model may gain more from adding an incongruent func-
tionality, whereas a low-end model would gain more
from adding a congruent feature. That said, the nature
of the base brand and the added functionality (i.e., utili-
tarian vs. hedonic) should always be a consideration. •
26
/ / / ... if consumers understand and communicate their preferences
GfK MIR / Vol. 2, No. 2, 2010 / New Strategies
{ New Strategies }
27
CUSTOMIZATION: A GOLDMINE OR A WASTELAND?Nikolaus Franke, Peter Keinz and Christoph J. Steger
THE AUTHORS
Nikolaus Franke,
Full Professor
Peter Keinz,
Assistant Professor
Christoph J. Steger,
Lecturer
All authors are members of the
Institute for Entrepreneurship and
Innovation (www.e-and-i.org) at
WU Wien (Vienna University of
Economics and Business
Administration), Vienna, Austria
This article is an adapted version
of Franke, Nikolaus; Keinz, Peter
and Steger, Christoph J. (2009):
“Testing the Value of Customiza-
tion: When Customers Really
Prefer Products Tailored to Their
Preferences?”, Journal of
Marketing, 73 (5), pp. 103 – 121,
and is published with the
permission of the American
Marketing Association.
The Promise of Customization
“Giving the customers what they want” has been the
mantra of marketing professionals for many years.
However, it is not what most companies have been do-
ing in recent decades. Instead they have been dividing
the market into segments and tailoring the products to
the average preferences of one or more of those seg-
ments — which means that the individual customer
does not get exactly what he or she wants. Instead, the
benefi ts from individual offerings are balanced with the
benefi ts of large-scale production processes. This “seg-
mentation” idea was fi rst described in 1956 and quickly
became one of the most powerful marketing methods
in theory and practice. Until today, it has been consid-
ered an essential part of the body of knowledge in mar-
keting, and it is discussed in virtually every marketing
textbook and routinely applied by most companies in
most markets.
However, two major developments have increasingly
challenged segmentation in recent years. First, there is a
constantly increasing supply of technology that facili-
tates small lot sizes and customization. As a result, the
production costs for individualized offerings are declin-
ing, and the internet has brought about a dramatic re-
duction in the costs of communication with customers.
Second, customer preferences have become increasingly
heterogeneous in many markets. In turn, the customers’
demand for individualized products has clearly increased.
Thus, scholars and practitioners alike have developed
high expectations regarding the potential of customiza-
tion. It has been assumed in recent years that the age-
old practice of targeting market segments is dominated
and will be displaced by individual marketing. Practitio-
ners also praise the merits of customization, and compa-
nies such as Adidas, BMW, Puma, General Electric, Lego,
Should fi rms invest in customization strategies? Customization is a “hot” topic advocated
in many popular books and articles. On the other hand, spectacular failures in the recent
past have raised doubts. We experimentally tested the value customization generates for
customers in the diverse product categories of newspapers, fountain pens, kitchens, skis,
and cereals. The fi ndings are clear: customization by far outperforms the more traditional
strategies of segmentation and mass marketing.
New Strategies / Vol. 2, No. 2, 2010 / GfK MIR
28
Nike, Procter&Gamble, IKEA and many others have be-
gun to experiment with customization.
Opposition to Customization
However, spectacular failures in customization, such as
Levi Strauss’ “Original Spin” jeans and Mattel’s “My De-
sign Barbie”, have raised doubts as to whether the
“promise of customization” is not a false promise. In-
deed, there are arguments against customization be-
yond increased production costs. Offering customers
products tailored to their individual stated preferences
might actually be misleading.
> First, customization requires us to specify precisely
what we want — and in many situations we might
not be willing to do so. We love (pleasant) surprises.
For example, many people do not fi nd it satisfying to
get a present they have specifi ed in detail before-
hand, and we usually prefer to listen to jokes we do
not know over jokes we do know, let alone to jokes we
devised ourselves (of course, most of us will know
some painful exceptions). One could argue that these
cases are somewhat special.
> But there is a second and potentially much more im-
portant argument: customers might not be able to
specify their preferences correctly. Research on con-
sumer decision-making suggests that preference sys-
tems are often ill-defi ned, and many people have a
hard time stating what they really want. If they are
forced to do so, they are largely infl uenced by the
“framing” of the situation and the way the question
is asked. Therefore the individual preference state-
ment may contain a large error term. One can argue
that given such arbitrary preference statements, it is
questionable whether products customized on the
basis of those preferences are more benefi cial to cus-
tomers than standard products.
> In extreme cases, an adept segmentation strategy
might even yield higher benefits for customers than
customization. If the segments identifi ed capture the
(common) essence of preferences within the seg-
ment and eliminate random error through aggrega-
tion, the true component of preferences is re-
vealed — and the segment-specifi c products will lead
to a higher preference fi t than products customized
on the basis of erroneous individual preference state-
ments. Such a phenomenon is sometimes called the
“wisdom of the crowd” effect. The most famous
anecdote illustrating this point is about a county fair
at which a crowd of people were able to guess the
weight of an ox much more accurately when their in-
dividual guesses were averaged than separate esti-
mates made by cattle experts.
These arguments are not purely theoretical. Recent re-
search shows that there are consumers who do prefer
products based on the aggregated preferences of other
consumers over products based on their own individual
preferences. Such customers prefer the default confi gu-
rations provided by the producer and fail to see the op-
portunities offered.
The Experiment:
A Competition between Newspapers
In this study, therefore, we decided to carry out an ex-
periment in which we would let the two marketing prin-
ciples of customization and segmentation compete di-
rectly. We selected newspapers as the product category
for our experiment. This category allowed us to employ
concrete and relatively realistic experimental stimuli,
namely by using newspapers that were actually tailored
to the subjects’ preferences (with varying proximity). As
most consumers are at least somewhat interested in
some sort of newspaper, it was possible to draw a truly
representative sample of 1,279 Austrian citizens. The
rationale underlying this study is simple: we simulate
the strategies of customization, segmentation, and
mass marketing, and we measure the resulting benefi ts
for customers. As opposed to customization, “mass mar-
keting” means that every customer gets the same prod-
uct. This strategy is rarely employed nowadays, but it
certainly used to be the norm. Recall the famous dictum
of Henry Ford: “Any customer can have a car painted any
color that he wants so long as it is black”. We have in-
cluded mass marketing in order to provide an additional
comparison.
In the fi rst step, we captured the preferences of subjects
with regard to a collection of 90 newspaper headlines.
The headlines included two introductory lines in order to
give subjects an idea of what each article was about. We
randomly selected them from 4,964 real articles re-
leased by the Austrian News Agency (APA), and the ar-
ticles covered the topics of foreign affairs, domestic af-
fairs, current events, culture, economics, science,
education, media and sports. Subjects revealed their
preferences on fi ve-point rating scales ranging from 1
(“I would really like to read this article”) to 5 (“I would
defi nitely not read this article “). In the second step, we
performed some calculations.
GfK MIR / Vol. 2, No. 2, 2010 / New Strategies

29New Strategies / Vol. 2, No. 2, 2010 / GfK MIR
Calculating Preferences
> Group 1 was to receive a mass marketing product.
Therefore, we calculated the mean preference rating
for each of the 90 headlines and ranked them on that
basis. The ten best-rated headlines constitute our
“mass marketing newspaper”, the one standard
product that comes closest to the subjects’ prefer-
ences on average.
> Group 2 received a segment-specifi c newspaper. Using
the preference ratings as a basis, we conducted latent
class analysis, which can be considered state-of-the-
art for segmentation purposes. We calculated the op-
timum number of segments using the Bayesian Infor-
mation Criterion and found that ten segments were
best suited to our study. The ten best-rated headlines
in each segment defi ned the respective segment-
specifi c newspapers, that is, the product which is best
adapted to the average preferences of each segment.
Each subject was provided with the segment-specifi c
newspaper that came closest to personal prefer-
ences (measured using the minimum squared Eu-
clidian distance).
> Defi ning the customized newspapers for group 3 was
easy. For each subject, we ranked the 90 headlines
according to the individual’s preferences and selected
the ten highest-rated headlines. In cases where ties
precluded an exact solution (e.g., when 12 headlines
were assigned a rating of 1), we randomly selected
the headlines from those which were tied.
Calculating Value and Willingness to Pay (WTP)
In the third step, we confronted the subjects with the
experimental stimuli, namely the simulated “newspa-
pers”, each of which comprised a selection of ten head-
lines in random order. We then measured the value
these newspapers generated for the subjects. The key
measure was the participants’ willingness to pay for the
newspapers offered.
Before turning to the results, let us refl ect on the conser-
vative nature of this experiment. We fi rst have to note
that the potential effects of customization are heavily
constrained. The simulated newspapers only consisted
of ten headlines taken from a set of 90 (in order to en-
sure that the task remained manageable for subjects).
In reality, most newspapers consist of approximately
100 to 300 articles, and the pool of possible news is also
considerably larger (e.g. the Austrian Press Agency re-
leases about 600 articles, the German Press Agency
about 800, and the Associated Press releases about 20
million words of news per day). In addition, our stimuli
had no other content such as advertisements, weather
forecasts, movie schedules or other features of potential
value to some consumers. Thus, the participants in our
experiment were only able to customize their newspa-
pers to a very limited degree. The segmentation strate-
gy, by contrast, enjoyed a far better starting position
due to the considerable number of segments defi ned.
Segmentation in real life and in much larger populations
is more parsimonious. Second, we provided each indi-
vidual with their “optimum” segment, that is, the seg-
ment we knew came closest to their preferences. How-
ever, in real life companies do not enjoy the privilege of
such pervasive knowledge. In sum, the contest was de-
signed in such a way that it was quite challenging for
customization to outperform its rivals.
» Customers might not
be able to communicate their
preferences correctly.
Therefore the individual
preference statement may
contain a large error term. «
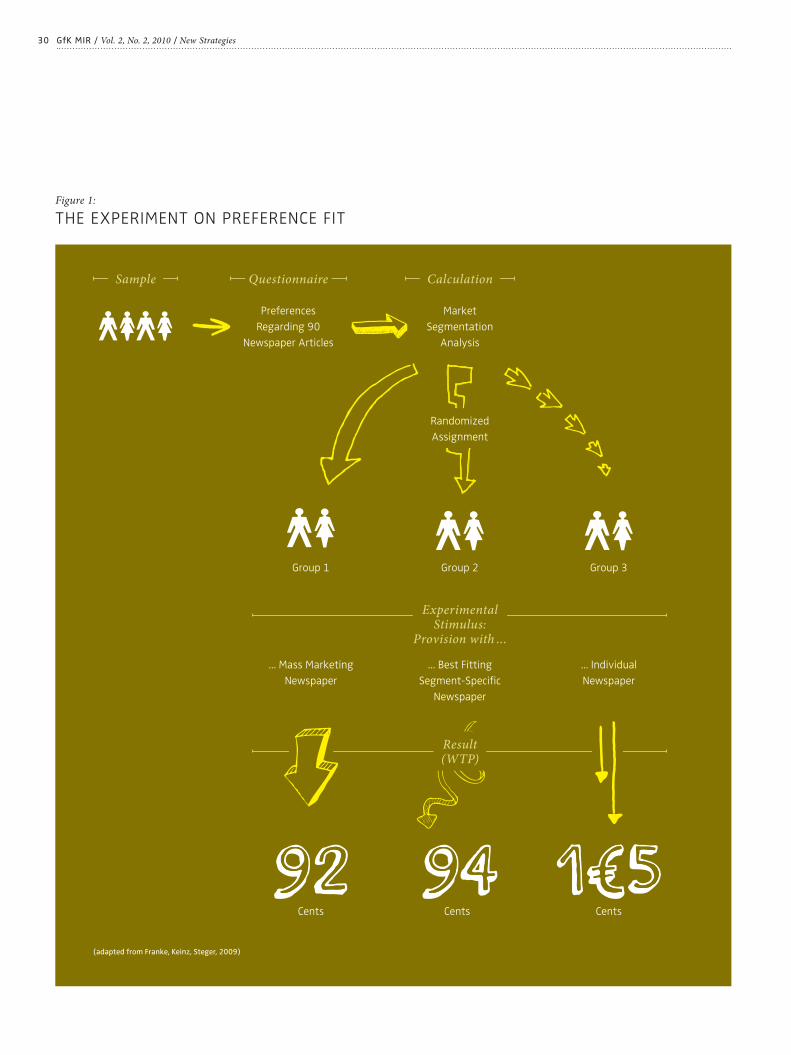
30 GfK MIR / Vol. 2, No. 2, 2010 / New Strategies
Figure 1:
THE EXPERIMENT ON PREFERENCE FIT
Sample Questionnaire Calculation
Preferences
Regarding 90
Newspaper Articles
Market
Segmentation
Analysis
Experimental Stimulus:
Provision with ...
Group 2 Group 3Group 1
... Mass Marketing
Newspaper
Cents
... Best Fitting
Segment-Specifi c
Newspaper
Cents
... Individual
Newspaper
Cents
(adapted from Franke, Keinz, Steger, 2009)
Randomized
Assignment
Result (WTP)
31
The Customized Newspaper Wins
The results were highly signifi cant. The clear fi nding is
that newspapers customized on the basis of the custom-
ers’ stated preferences won the contest. The average
willingness to pay was highest for this group at 1.05 eu-
ros on average, suggesting that the above-mentioned
arguments against customization can be refuted. Seg-
mentation came in second at 94 cents, and mass mar-
keting lost the race with 92 cents. (Figure 1)
As argued above, we could not expect huge differences
in this heavily constrained setting. Against this back-
ground, the value increment of 12 % achieved by cus-
tomization relative to segmentation is remarkable. For
comparison purposes, consider the difference between
the willingness to pay for the “so long as it is black”
mass marketing newspaper and for the segment-specif-
ic newspaper. It is only 2 %. In reality, however, we can be
reasonably sure that a single uniform newspaper would
not fi t the different preferences of the readers of USA
Today, the New York Post and the Washington Post in
the US market or the readers of Frankfurter Allgemeine
Zeitung, Bild, and Main Echo in the German market par-
ticularly well. Seen in this light, 12 % is a large differ-
ence. It means that the benefi t gain from customization
relative to segmentation is six times higher than the
gain from segmentation relative to mass market-
ing — which is already considerable.
Generalization into Other Markets
Is this fi nding — that customization outperforms seg-
mentation so clearly — specifi c to newspapers, or does
it point to a general pattern? In order to analyze this
question, we conducted another study using a separate
sample. We confronted each subject with two stimuli:
one was a standard product in the relevant product cat-
egory, while the other was a (simulated) customization
confi gurator that would allow the subject to tailor the
respective product to specifi c personal preferences. We
then measured the willingness to pay each subject as-
sociated with the two products. The study was conduct-
ed independently in the product categories of fountain
pens, kitchens, skis, and breakfast cereals. These prod-
ucts differ in terms of price level, hedonic value, and pri-
vacy of consumption. Again, we used a representative
sample with a total of 1,039 subjects answering the
questionnaire completely.
New Strategies / Vol. 2, No. 2, 2010 / GfK MIR
Our fi ndings show that customization also creates high-
er benefi ts than segmentation strategies in other mar-
kets — thus indicating that the superiority of custom-
ization over segmentation is independent of the specifi c
market. (see Figure 2 on page 32)
Is Customization the Best Strategy for any Customer?
Despite these clear differences, the “customization ef-
fect” depends on specifi c conditional variables. Custom-
ization is not the best strategy for any customer in any
situation. We subjected the fi ndings described above to
statistical moderator analyses in which we examined the
WTP of specifi c sub-groups. Based on the fi ndings
(which we do not report here), we can formulate three
conditions for the value of customization:
1. Customers must have sufficient preference insight.
The measurement of preferences (which forms the basis
for customization) can only be effective if consumers
actually have reasonably well-defi ned preferences and
are suffi ciently aware of them. If consumers do not re-
ally know what they want, they will be more inclined to
construct preferences based on situational cues when
asked to specify product requirements — which will
bring about a high error term in their preference mea-
surements. A product constructed on the basis of this
» Our findings show that
customization also creates higher
benefits than segmentation
strategies in other markets — thus
indicating that the superiority of
customization over segmentation is
independent of the specific market. «
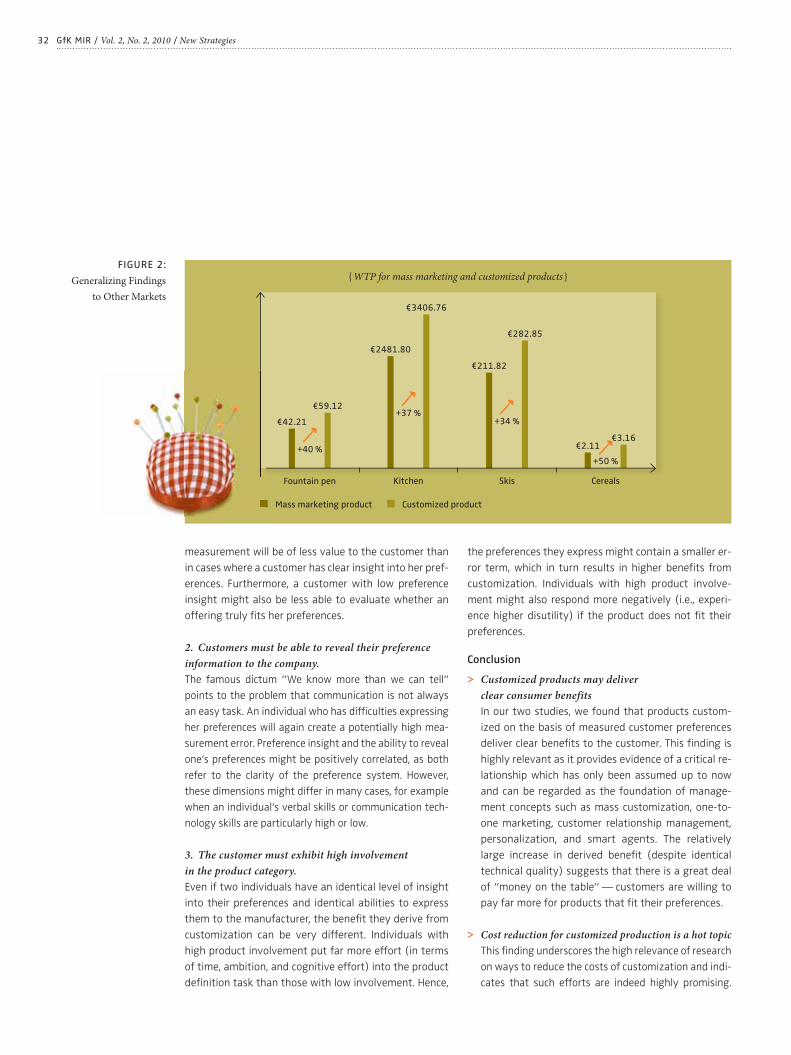
32
Fountain pen
+40 %
+37 %+34 %
+50 %
Kitchen Skis Cereals
€42.21
€59.12
€2481.80
€3406.76
€211.82
€282.85
Customized productMass marketing product
{ WTP for mass marketing and customized products }
€2.11€3.16
GfK MIR / Vol. 2, No. 2, 2010 / New Strategies
measurement will be of less value to the customer than
in cases where a customer has clear insight into her pref-
erences. Furthermore, a customer with low preference
insight might also be less able to evaluate whether an
offering truly fi ts her preferences.
2. Customers must be able to reveal their preference
information to the company.
The famous dictum “We know more than we can tell“
points to the problem that communication is not always
an easy task. An individual who has diffi culties expressing
her preferences will again create a potentially high mea-
surement error. Preference insight and the ability to reveal
one‘s preferences might be positively correlated, as both
refer to the clarity of the preference system. However,
these dimensions might differ in many cases, for example
when an individual‘s verbal skills or communication tech-
nology skills are particularly high or low.
3. The customer must exhibit high involvement
in the product category.
Even if two individuals have an identical level of insight
into their preferences and identical abilities to express
them to the manufacturer, the benefi t they derive from
customization can be very different. Individuals with
high product involvement put far more effort (in terms
of time, ambition, and cognitive effort) into the product
defi nition task than those with low involvement. Hence,
the preferences they express might contain a smaller er-
ror term, which in turn results in higher benefi ts from
customization. Individuals with high product involve-
ment might also respond more negatively (i.e., experi-
ence higher disutility) if the product does not fi t their
preferences.
Conclusion
> Customized products may deliver
clear consumer benefits
In our two studies, we found that products custom-
ized on the basis of measured customer preferences
deliver clear benefi ts to the customer. This fi nding is
highly relevant as it provides evidence of a critical re-
lationship which has only been assumed up to now
and can be regarded as the foundation of manage-
ment concepts such as mass customization, one-to-
one marketing, customer relationship management,
personalization, and smart agents. The relatively
large increase in derived benefi t (despite identical
technical quality) suggests that there is a great deal
of “money on the table“ — customers are willing to
pay far more for products that fi t their preferences.
> Cost reduction for customized production is a hot topic
This fi nding underscores the high relevance of research
on ways to reduce the costs of customization and indi-
cates that such efforts are indeed highly promising.
FIGURE 2:
Generalizing Findings
to Other Markets
33
Pine, B. Joseph (1993),
“Mass Customization: The New Frontier in Business
Competition“, Boston: Harvard Business School Press.
Eric von Hippel (2005),
“Democratizing Innovation“, Cambridge, MA: MIT Press.
Frank T. Piller (2006),
“Mass Customization: Ein wettbewerbsstrategisches
Konzept im Informationszeitalter“, Gabler; 4. Aufl age.
http://www.userinnovation.at
FURTHER READING
New Strategies / Vol. 2, No. 2, 2010 / GfK MIR
Cost reductions can come in various forms, including
further improvements in fl exible production technolo-
gies, lower process costs for customers through de-
sign toolkits which are easier to use, and through more
effective recommender systems. Given further prog-
ress, this suggests that individual marketing will in-
deed gain considerable importance relative to the tra-
ditional practices of segmentation and mass mar ket-
ing, as several scholars have predicted.
> Success depends on consumer characteristics
However, we also show that the benefi ts of custom-
ization are contingent upon characteristics of the cus-
tomer, namely the level of insight into personal pref-
erences, the ability to express those preferences, and
product involvement. This challenges the tendency in
the popular press to advocate customization as the
best possible strategy for any consumer in any situa-
tion. If customers have diffi culties conveying prefer-
ence information to the company (either because
they are unaware of what they want or because they
are not able to express their preferences properly) or
they have a low level of involvement, the benefi ts of
customization will be considerably lower.
> Facilitating preference articulation should help
Our fi nding that customization is particularly benefi -
cial to customers with clear preference systems does
not necessarily mean that customization strategies
do not make sense in the opposite case. However, it
does indicate that customization processes should be
designed differently. In our studies, we focused on a
customer-active means of preference transmission in
which customers had to actively specify what they
wanted. At the same time, there are alternatives
which require less skill and effort from the customer
than a laborious self-design process, such as smart
agents or recommender systems (which require little
or no customer effort). The extent to which these sys-
tems provide benefi ts in such situations remains a
question for future empirical research. In addition, it
is important to bear in mind that interaction with a
customization toolkit might actually help the con-
sumer understand and articulate personal preferences
better, as it involves trial-and-error learning with sim-
ulated feedback on the outcome. •
KEYWORDS:
Individualization, Mass
Customization, Segmentation,
Innovation, Design,
Customer Integration
34 GfK MIR / Vol. 2, No. 2, 2010 / New Strategies
{ New Strategies }
35
Left Behind Expectations
HOW TO PREVENT CRM IMPLEMENTATIONS FROM FAILINGJan U. Becker, Goetz Greve and Sönke Albers
THE AUTHORS
Jan U. Becker,
Assistant Professor of
Marketing and Innovation,
Kühne Logistics University,
Hamburg, Germany
Goetz Greve,
Professor of Marketing and
Sales, Hamburg School of
Business Administration,
Hamburg, Germany
Sönke Albers,
Professor of Marketing,
Kühne Logistics University,
Hamburg, Germany
The article is an adapted
version of Becker, Jan U.;
Greve, Goetz; Albers, Sönke
(2009): “The impact of
technological and organizatio-
nal implementation of CRM on
customer acquisition,
maintenance, and retention“,
International Journal of
Research in Marketing, Vol. 26,
pp. 207 – 215, and is published
with the permission of Elsevier.
Not Up to Managements’ Expectations!
Over the past two decades, customer relationship man-
agement (CRM) has become one of the most promising
yet controversial concepts in business. Considered to be
an effective means of managing and nurturing the inter-
actions of enterprises with extant and prospective cus-
tomers, companies have invested billions of dollars in
CRM implementations. For example, in 2008, the world-
wide revenues for CRM software solutions were $9.15
billion (Gartner Group, 2009). Since this fi gure does not
include investments in CRM consulting or in-house solu-
tions, one can assume that the total CRM-related invest-
ments are, in reality, much higher.
The prospects are also quite promising: CRM implemen-
tations are supposed to analyze and organize sales ac-
tivities, foster marketing automation, and facilitate cus-
tomer service and support. Consequently, CRM enables
companies to boost revenues and reduce costs of mar-
keting and client services. Lately, however, companies
have become increasingly displeased with CRM imple-
mentations, as the majority of them are falling short of
performance expectations and are therefore considered
failures. More specifi cally, studies report that only one
third of all CRM projects experience signifi cant improve-
ments in performance. That means that two thirds of
the companies that started a CRM initiative either suf-
fered losses or had no bottom-line improvement in com-
pany performance. Even worse, one in fi ve CRM initia-
tives damaged long-standing customer relationships.
Why Can CRM Implementations Fail?
How can initiatives involving so many resources with re-
gard to fi nancial and intellectual capital and offering so
much potential deviate from expectations and leave the
CRM project managers so utterly disappointed?
This article discusses performance drivers of CRM projects and is particularly relevant for
managers seeking to optimize their companies CRM efforts. Despite the billions of dol-
lars that have been spent on the implementation of customer relationship management
(CRM) systems, many of the adopting companies are unhappy with the results. This can
be due to two reasons: fi rst, either the CRM projects are poorly implemented and thus do
not perform accordingly, or, second, companies expect too much from CRM systems. This
research examines how technological and organizational implementations as well as in-
ternal support affect the objectives of CRM with regard to initiating, maintaining, and re-
taining customer relationships. The results indicate that internal support is an important
factor for the performance of CRM implementation. Further, it helps to have a clear focus
for a CRM system to specifi cally address diverse functions such as the acquisition, main-
tenance, and retention of customers and to tailor implementation effort to the needs of
the major functions.
New Strategies / Vol. 2, No. 2, 2010 / GfK MIR
36
ample, customer-facing departments might need to be
restructured to specifi cally serve certain customer seg-
ments. Such organizational changes are equally impor-
tant for the success of CRM implementations since tech-
nological systems often involve customer databases with
information that is used for different management func-
tions — e.g., marketing, sales, or service. In order to dis-
seminate customer knowledge and customer orientation
within the organization, organizational implementations
need to provide whatever changes are necessary to the
organizational structure, such as relevant training and
rewards for employees who engage in CRM-related ac-
tivities. However, in contrast to technological implemen-
tations, the return on investment in organizational chan-
ges is much harder to predict. Consequently, if companies
are too reluctant to pervade the CRM strategy and initi-
ate necessary changes, CRM projects are likely to fail.
Limited Support
The defi nition also conveys that CRM implementations
rely on compliance at both the managerial and employ-
ee levels, since CRM success does not come from the sum
of single activities, but rather from interactions between
activities. This especially applies to interactions between
support activities within the company — i.e., top man-
agement providing strategic support and employees’
actually using CRM systems.
One role of management is to support CRM implementa-
tions by creating a corporate environment that embrac-
es CRM as a vital element of business strategy and en-
gaging in activities that demonstrate their commitment
to CRM implementation. Therefore, top management
needs to effectively communicate that CRM is the com-
pany’s strategic orientation, and not merely a fad.
Knowing that top management supports the CRM strat-
egy will most likely affect employees’ behavior as well.
This is crucial as employee support is not only regarded
as a key driver of organizational success but also of CRM
technology success. Unfortunately, studies indicate that
despite the fact that CRM technology would increase in-
dividual performance, employees are often reluctant to
adopt it; especially sales persons are often sensitive in
regards to their tacit knowledge about customers and
are therefore unwilling to feed personal knowledge into
a company database. In such cases, neither top manage-
ment nor employees actively engage in the CRM strate-
gy, and CRM projects are likely to fail.
There are two possible reasons: either CRM projects are
poorly implemented, or the managers’ expectations were
too high to begin with. These possible reasons are inves-
tigated in more detail below.
Reasons behind Poor Implementation of CRM Projects
Given the common defi nition that CRM requires a cross-
functional integration of processes, people, operations,
and marketing capabilities that focuses on initiating,
maintaining, and retaining long-term customer relation-
ships and is enabled through information, technology,
and applications, there are obviously many possible rea-
sons for CRM implementation failure. Here, we present
two of the most prevalent ones:
Limited Scope
Most obvious, and for many synonymous with CRM, are
technological implementations involving IT systems and
software solutions that organize, automate, and syn-
chronize marketing processes. When set up and confi g-
ured correctly, such IT systems provide for the acquisi-
tion, storage, and accessibility of customer information,
as well as its analysis. These technologies are readily
available and easily implemented by specialized soft-
ware and consulting fi rms. However, investments in soft-
and hardware are not suffi cient since technological im-
plementations must be accompanied by changes in
organizational structures and processes as well. For ex-
GfK MIR / Vol. 2, No. 2, 2010 / New Strategies
» CRM success does not come
from the sum of single activities,
but rather from interactions
between activities. «
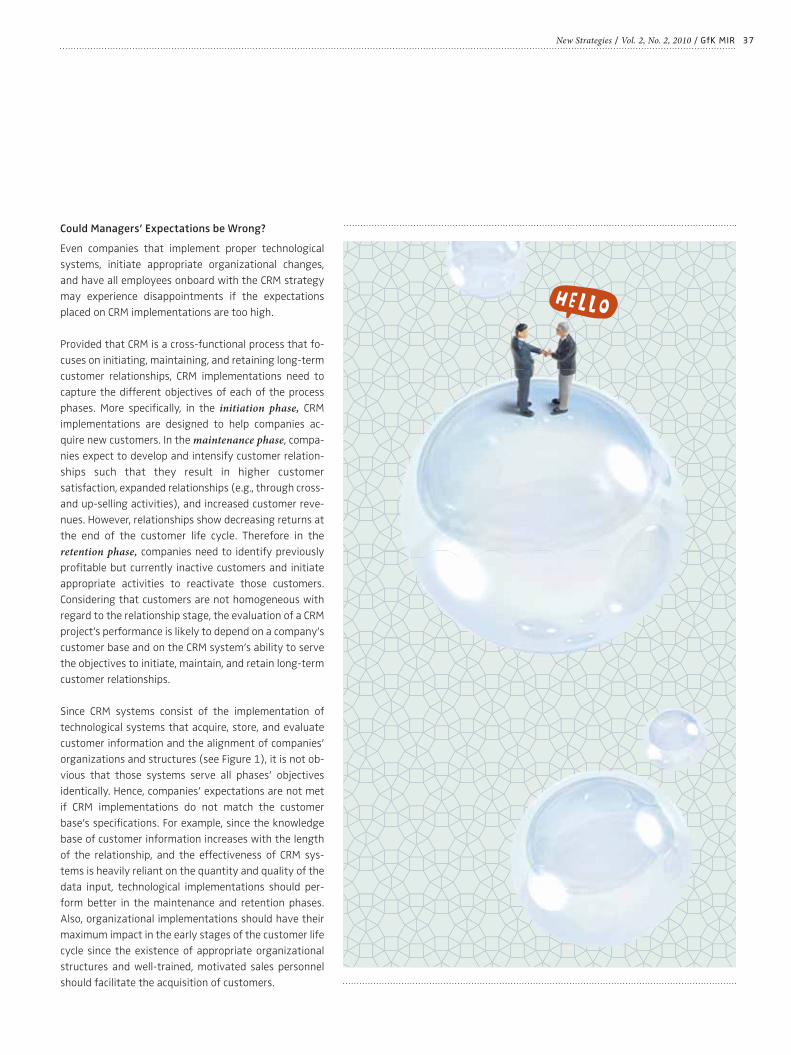
37New Strategies / Vol. 2, No. 2, 2010 / GfK MIR
Could Managers’ Expectations be Wrong?
Even companies that implement proper technological
systems, initiate appropriate organizational changes,
and have all employees onboard with the CRM strategy
may experience disappointments if the expectations
placed on CRM implementations are too high.
Provided that CRM is a cross-functional process that fo-
cuses on initiating, maintaining, and retaining long-term
customer relationships, CRM implementations need to
capture the different objectives of each of the process
phases. More specifi cally, in the initiation phase, CRM
implementations are designed to help companies ac-
quire new customers. In the maintenance phase, compa-
nies expect to develop and intensify customer relation-
ships such that they result in higher customer
satisfaction, expanded relationships (e.g., through cross-
and up-selling activities), and increased customer reve-
nues. However, relationships show decreasing returns at
the end of the customer life cycle. Therefore in the
retention phase, companies need to identify previously
profi table but currently inactive customers and initiate
appropriate activities to reactivate those customers.
Considering that customers are not homogeneous with
regard to the relationship stage, the evaluation of a CRM
project’s performance is likely to depend on a company’s
customer base and on the CRM system’s ability to serve
the objectives to initiate, maintain, and retain long-term
customer relationships.
Since CRM systems consist of the implementation of
technological systems that acquire, store, and evaluate
customer information and the alignment of companies’
organizations and structures (see Figure 1), it is not ob-
vious that those systems serve all phases’ objectives
identically. Hence, companies’ expectations are not met
if CRM implementations do not match the customer
base’s specifi cations. For example, since the knowledge
base of customer information increases with the length
of the relationship, and the effectiveness of CRM sys-
tems is heavily reliant on the quantity and quality of the
data input, technological implementations should per-
form better in the maintenance and retention phases.
Also, organizational implementations should have their
maximum impact in the early stages of the customer life
cycle since the existence of appropriate organizational
structures and well-trained, motivated sales personnel
should facilitate the acquisition of customers.
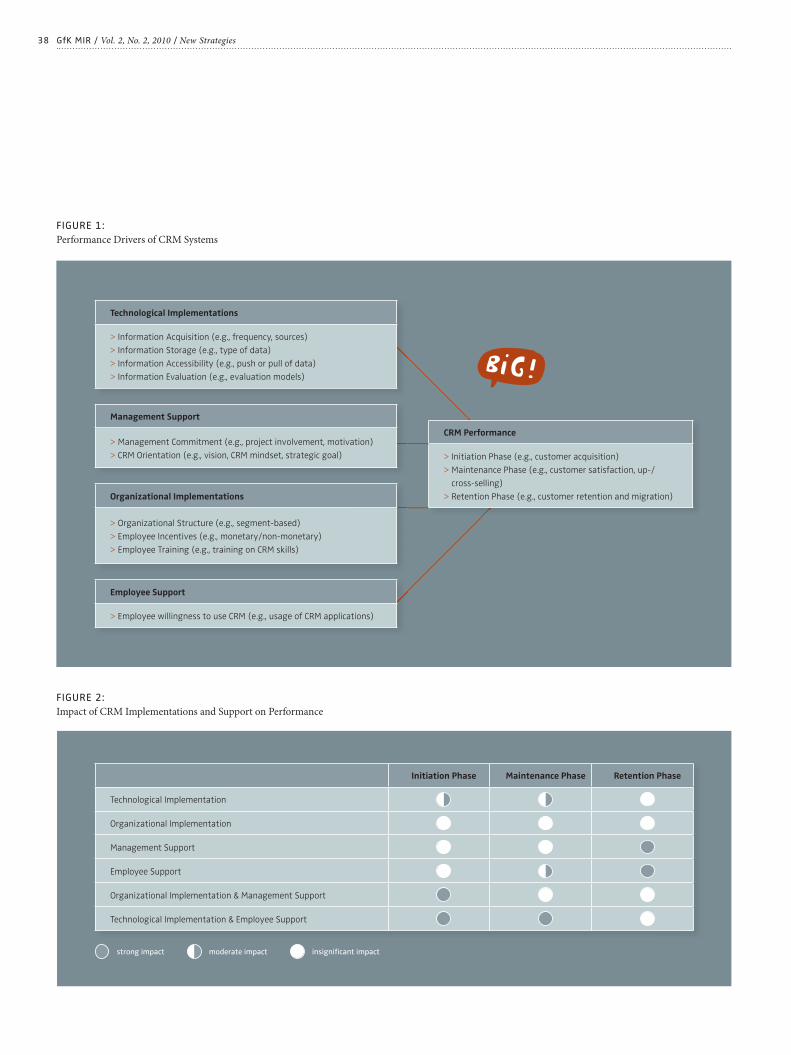
38
FIGURE 1:
Performance Drivers of CRM Systems
FIGURE 2:
Impact of CRM Implementations and Support on Performance
GfK MIR / Vol. 2, No. 2, 2010 / New Strategies
Initiation Phase Maintenance Phase Retention Phase
Technological Implementation
Organizational Implementation
Management Support
Employee Support
Organizational Implementation & Management Support
Technological Implementation & Employee Support
strong impact moderate impact insignifi cant impact
Organizational Implementations
> Organizational Structure (e.g., segment-based)
> Employee Incentives (e.g., monetary/non-monetary)
> Employee Training (e.g., training on CRM skills)
Management Support
> Management Commitment (e.g., project involvement, motivation)
> CRM Orientation (e.g., vision, CRM mindset, strategic goal)
Employee Support
> Employee willingness to use CRM (e.g., usage of CRM applications)
Technological Implementations
> Information Acquisition (e.g., frequency, sources)
> Information Storage (e.g., type of data)
> Information Accessibility (e.g., push or pull of data)
> Information Evaluation (e.g., evaluation models)
CRM Performance
> Initiation Phase (e.g., customer acquisition)
> Maintenance Phase (e.g., customer satisfaction, up-/
cross-selling)
> Retention Phase (e.g., customer retention and migration)
39
Obviously, there are many reasons why CRM implemen-
tations can fail to meet expectations. Depending on the
company’s strategic goal to acquire, maintain, or retain
customers, companies run the risk of selecting the
wrong type or degree of implementation (technological
and/or organizational), or providing insuffi cient man-
agement and employee support.
Study and Data Source
In order to understand what factors infl uence the suc-
cess of CRM implementations, we collected data with the
help of an international consulting company, whis is
well known for conducting CRM projects (including the
implementation of technological systems and executing
organizational changes) for clients. We randomly select-
ed 400 companies with substantial experience in CRM in
ten European countries from the consulting fi rm’s client
database. Addressing a questionnaire to the responsible
CRM project managers of the selected companies, we
collected a total of 90 usable responses. Altogether, the
respondents were mainly large companies with more
than 5,000 employees where either top management or
the marketing and sales division were responsible for
CRM issues. In more than 69 % of the cases, senior ex-
ecutives from top management or the marketing and
sales departments responded to the questions address-
ing which CRM systems were actually implemented, and
assessed the company’s performance development with
regard to the CRM process-related aspects.
Drivers of CRM Performance
Based on the magnitude of technological and organiza-
tional changes that the companies experienced (e.g.,
degree of applications to analyze and evaluate custom-
ers or provision of employee training) and their outcome
(e.g., degree of improvement with regard to customer
acquisition, maintenance or retention), we examined
whether CRM implementations are able to meet the
phase-specifi c objectives. Furthermore, we analyzed
what impact employee and management support have
on CRM performance. The analysis provides insights as
to what kind of implementations infl uence performance
in which phase and, therefore, what companies can real-
istically expect from CRM systems. Figure 2 shows the
results and demonstrates the impact of the key factors
on performance.
Whereas technological implementations moderately
impact initiation (i.e., customer acquisition) and main-
tenance performance (i.e., customer satisfaction, up-/
cross-selling), the components of organizational imple-
mentations do not signifi cantly infl uence performance
in any phase. However, appropriate organizational
structures, and motivated, well-trained sales personnel
do in fact affect performance if managerial support for
CRM exists. Similarly, technological implementations
unfold a much stronger impact when employees accept
and support the CRM systems. However, neither kind of
implementation shows any signifi cant impact for cus-
tomer retention.
New Strategies / Vol. 2, No. 2, 2010 / GfK MIR
» Judging from the results,
it is the combination of poorly
implemented CRM projects
and overly high expectations
that may result in (perceived)
failures of CRM systems. «

40 GfK MIR / Vol. 2, No. 2, 2010 / New Strategies
WHAT CAN MANAGERS LEARN?
CRM Systems Cannot Merely be “Bought Off the Shelf”
Judging from the results, it is the combination of poorly
implemented CRM projects and overly high expectations
that may result in (perceived) failures of CRM systems.
First, with regard to the quality of implementations, the
study shows that CRM systems cannot merely be “bought
off the shelf”. Hence, the mere implementation of CRM
activities of organizational and/or technological nature
and hoping for effects on the acquisition, maintenance, or
retention of customer relationships is insuffi cient and un-
realistic. Interactions between people and processes need
to be considered as well since they represent the degree
to which management and employees embrace CRM and
support its implementation. This fi nding helps fi rms un-
derstand that successful CRM projects depend on support
from within the companies and stresses the need to ac-
tively and intensively involve employees and manage-
ment in the implementation process.
Table 1:
PERFORMANCE OF CRM IMPLEMENTATIONS
Specify the Focus of CRM and Adapt Resources
CRM implementations are not capable of equally serving
customer initiation, maintenance, and retention goals. In
order to avoid overly high expectations and the resulting
discontent, companies should carefully consider the as-
pects for which CRM implementations may be effi cient.
For example, many companies still emphasize the acqui-
sition of new customers over developing existing cus-
tomer relationships and, therefore, align employee train-
ing and incentives accordingly. Consequently, changes in
organizational structures only affect initiation perfor-
mance and have no effect on the objectives regarding
the maintenance and retention of customer relation-
ships. The role of technological implementation across
the CRM process remains quite constant — systems and
information used to acquire new customers work as well
as those employed for the purpose of cross- and up-sell-
ing activities. Judging from the moderate impact of tech-
nological implementations alone, one apparently does
not need the most sophisticated technological systems
Please assess the success of your company in the following areas
since introducing CRM
Difference
Initiation performance
> Improvement of customer acquisition + 18.7 %
> Improvement in regaining lost customers + 12.2 %
Maintenance performance
> Improvement of customer satisfaction + 20.1 %
> Improvement in the expansion of customer relationships + 19.0 %
> Improvement of total return per customer + 11.8 %
Retention performance
> Improvement in customer retention + 24.9 %
> Reduction of customer migration + 13.9 %
>
R
>
>
>
R
>
>
41
Payne, Adrian and Penny Frow (2005),
“A Strategic Framework for Customer Relationship
Management“, Journal of Marketing, 69 (4),
pp. 167 – 176.
Reinartz, Werner J., Manfred Krafft, and Wayne D.
Hoyer (2004),
“The Customer Relationship Management Process: Its
Measurement and Impact on Performance“, Journal of
Marketing Research, 41 (3), pp. 293 – 305.
Rigby, D. K., F. F. Reichheld, and P. Schefter (2002),
“Avoid the Four Perils of CRM“, Harvard Business Review,
80 (2), pp. 101 – 109.
FURTHER READING
New Strategies / Vol. 2, No. 2, 2010 / GfK MIR
to perform successfully. Hence, the majority of respond-
ing companies operate with one-dimensional models for
customer analysis and evaluation (e.g., customer satis-
faction analyses) using only socio-demographic charac-
teristics to distinguish between their customers.
The fi nding that neither technological nor organizational
forms of implementation are able to fulfi ll all CRM pro-
cess-related objectives gives companies an indication of
what to expect from CRM projects: whereas companies
whose customer portfolio management strategy focus-
es on initiating customer relationships may well be ad-
vised to allocate their CRM investments to technological
and (especially) organizational implementations, those
investments alone would not have an effect on custom-
er retention. However as shown in Table 1, a common
strategic vision shared by management and employees
can lead to similar increases in performance levels for
customer retention. •
KEYWORDS:
Customer Relationship Management,
CRM Implementation, CRM Process,
CRM Success, Customer Life cycle

42 GfK MIR / Vol. 2, No. 2, 2010 / New Theories
{ New Theories }
43
Proving Marketing Success Pays Off!
MARKETING PERFORMANCE MEASUREMENT AND ITS EFFECTS ON MARKETING‘S STATURE AND FIRM SUCCESSDon O’Sullivan and Andrew V. Abela
THE AUTHORS
Don O’Sullivan,
Associate Professor of
Marketing, Melbourne Business
School, University of Melbourne,
Australia
Andrew V. Abela,
Assistant Professor of Marketing,
Catholic University of America;
Washington D.C., USA
Th e article is an adapted version
of O’Sullivan, Don; Abela,
Andrew V. (2007): “Marketing
Performance Measurement
Ability and Firm Performance”,
Journal of Marketing, 71 (April),
pp. 79 – 93, and is published with
permission of the American
Marketing Association.
Marketing’s Contribution to Business Performance
is Questioned by Top Management
Marketing budgets in many companies are currently un-
der threat as they look to minimize discretionary spend-
ing in response to growing economic uncertainty. Mar-
keting is seen as unaccountable and thus a discretionary
expenditure. Marketing has failed to provide CEOs, CFOs
and other senior executives with useful information on
marketing’s effectiveness, effi ciency and contribution to
the value of the company. As a consequence, top man-
agement tends to see the cost side rather than positive
outcomes of marketing activities and seems to hope
that reducing marketing spending will go unnoticed by
the market and will hardly affect business.
Marketers’ inability to account for the function’s contri-
bution to business performance is further recognized as
a key factor in marketing’s loss of status within organi-
zations. Senior management teams in most companies
spend less than 10 % of their time discussing marketing
issues and are often dissatisfi ed with marketing’s con-
tribution.
Greater marketing accountability is assumed to help in
this situation. Measuring and documenting marketing
success should clarify its impact on fi rm performance.
Underlying the demand for greater accountability is the
assumption that improvements in marketing’s ability to
document results will actually raise the company’s per-
It has been widely argued that an inability to account for marketing’s contribution has un-
dermined its standing within the company. Furthermore, the effect of marketing activities
on business success is underestimated. To respond to this pressure, marketers are investing
in the development of performance measurement abilities. In this study of senior marketing
managers in high-tech fi rms, the effect of the ability to measure marketing performance
against business performance is examined. The authors also explore the effect of the abil-
ity to measure marketing against marketing’s status within the company. Results indicate
that this ability is essential given that it has a signifi cant impact on company performance,
profi tability, stock returns, and marketing’s stature within the company. Considering these
effects, the closing managerial implications are highly relevant for marketing professionals.
New Theories / Vol. 2, No. 2, 2010 / GfK MIR
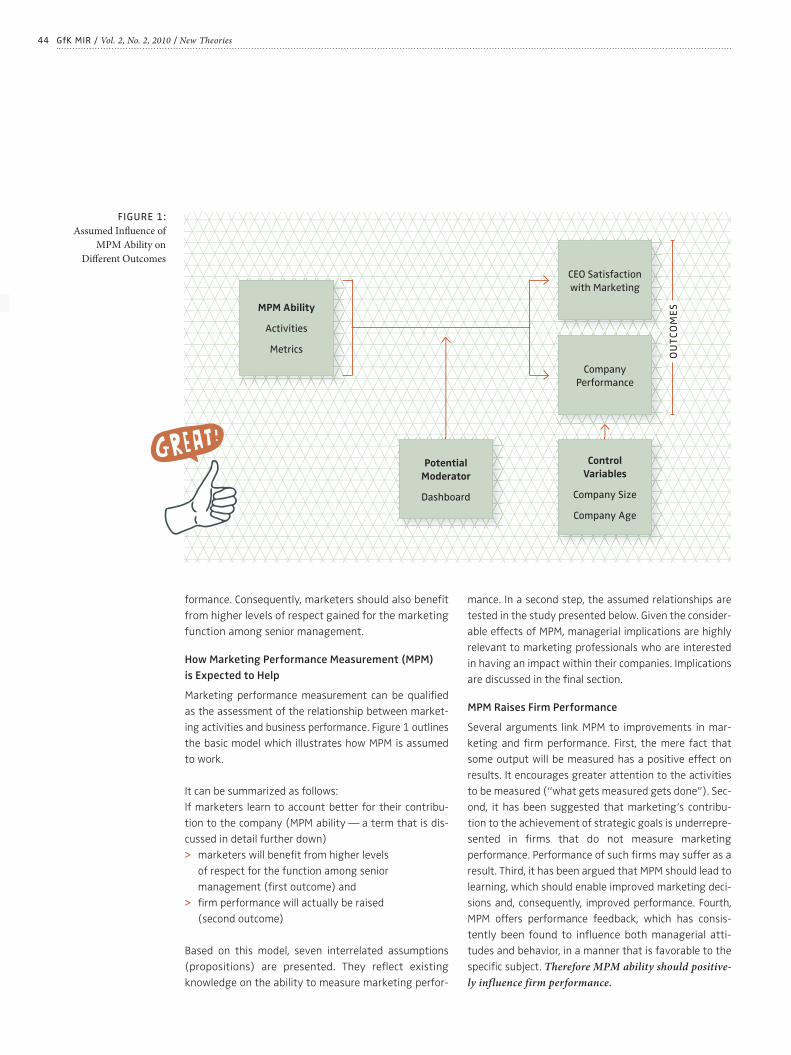
44
formance. Consequently, marketers should also benefi t
from higher levels of respect gained for the marketing
function among senior management.
How Marketing Performance Measurement (MPM)
is Expected to Help
Marketing performance measurement can be qualifi ed
as the assessment of the relationship between market-
ing activities and business performance. Figure 1 outlines
the basic model which illustrates how MPM is assumed
to work.
It can be summarized as follows:
If marketers learn to account better for their contribu-
tion to the company (MPM ability — a term that is dis-
cussed in detail further down)
> marketers will benefi t from higher levels
of respect for the function among senior
management (fi rst outcome) and
> fi rm performance will actually be raised
(second outcome)
Based on this model, seven interrelated assumptions
(propositions) are presented. They refl ect existing
knowledge on the ability to measure marketing perfor-
mance. In a second step, the assumed relationships are
tested in the study presented below. Given the consider-
able effects of MPM, managerial implications are highly
relevant to marketing professionals who are interested
in having an impact within their companies. Implications
are discussed in the fi nal section.
MPM Raises Firm Performance
Several arguments link MPM to improvements in mar-
keting and fi rm performance. First, the mere fact that
some output will be measured has a positive effect on
results. It encourages greater attention to the activities
to be measured (“what gets measured gets done”). Sec-
ond, it has been suggested that marketing’s contribu-
tion to the achievement of strategic goals is underrepre-
sented in fi rms that do not measure marketing
performance. Performance of such fi rms may suffer as a
result. Third, it has been argued that MPM should lead to
learning, which should enable improved marketing deci-
sions and, consequently, improved performance. Fourth,
MPM offers performance feedback, which has consis-
tently been found to infl uence both managerial atti-
tudes and behavior, in a manner that is favorable to the
specifi c subject. Therefore MPM ability should positive-
ly influence firm performance.
GfK MIR / Vol. 2, No. 2, 2010 / New Theories
FIGURE 1:
Assumed Infl uence of
MPM Ability on
Diff erent Outcomes
Potential
Moderator
Dashboard
MPM Ability
Activities
Metrics
Control
Variables
Company Size
Company Age
CEO Satisfaction
with Marketing
Company
Performance
OU
TC
OM
ES
45New Theories / Vol. 2, No. 2, 2010 / GfK MIR
MPM Increases Ceo Satisfaction with Marketing
It has long been recognized that the marketing function
generally plays a limited role in the process of strategy
formulation. An important reason for this is that mar-
keters struggle to measure and communicate to top
management the impact of marketing activities on fi rm
performance. Elsewhere, researchers have observed that
marketing has the greatest infl uence and stature in
companies with clear measures of marketing’s contribu-
tion. Thus, MPM ability is expected to be positively as-
sociated with CEO satisfaction with marketing.
Criteria for developing Successful Measurement
Systems (MPM ability)
An assumption underlying much of the current interest
in the accountability of marketing is that the choice of
the measures employed matters. Of course there are
many ways to document marketing performance and it
is likely that the extent and method of measurement
have an impact on the expected outcomes. Therefore
it makes sense to also apply differentiated basic appro-
a ches to performance measurement. Specifi cally the
ability to measure performance across a wide range of
marketing activities and the ability to assess marketing
performance using a comprehensive set of metrics are of
interest.
While the two aspects are clearly related, in that they
both contribute to a company’s MPM ability, they are
also distinctly different. For example, one fi rm may be
able to measure the performance of direct selling or on-
line marketing activities but advertising effects are not
documented. The next fi rm does survey the performance
of its advertising or public relations (activities) only in
terms of changes in awareness (nonfi nancial metric),
whereas yet another company may be able to measure
them in terms of revenue change (fi nancial metric) and
against specifi c goals and competitor performance
(benchmark metric).
The study investigates both aspects separately. The rel-
evance of measuring disparate marketing activities is
well documented in marketing literature. On the other
hand consultants, researchers and practicing marketers
have concluded that in their choice of metrics, fi rms
should employ both fi nancial and nonfi nancial metrics
and compare these against goals and competitors.
The following assumptions focus on the impact of the
range of activities (e.g. advertising, direct selling, PR)
that are measured: the ability to measure performance
across a wide range of marketing activities is expected to
positively influence firm performance and CEO satisfac-
tion with marketing.
The next assumptions focus on the comprehensiveness
of the metrics aspect. Companies that are able to assess
marketing performance using a broad set of metrics (fi -
nancial and nonfi nancial, in relation to goals, and in rela-
tion to competitors) should therefore outperform those
that lack this ability. More specifi cally, a comprehensive
set of measures is expected to positively influence com-
pany performance and CEO satisfaction with marketing.
What about Dashboards and their Effect
on Performance and CEO Satisfaction?
Figure 1 also shows dashboards as a variable that might
infl uence the relationship between MPM ability and its
potential fi ndings. Dashboards are a variation of a bal-
anced scorecard and are used as a means to report key
metrics to senior management. Generated by corporate
information systems, dashboards provide a refi ned set of
marketing performance data and communicate an over-
view of strategic performance. Two important elements
of dashboards are that they provide automated or (close
to) real-time reporting and that they enable users to
» If marketers learn to better account
for their contribution to the company,
they will benefit from higher levels
of respect and business performance
will be raised. «
46
“drill down” to program-level details. Dashboards are
viewed as a means by which information can be summa-
rized and readily communicated to senior decision mak-
ers. It is argued that this distilling of data increases the
perceived value and managerial use of information,
which in turn creates a closer link between marketing ac-
tivities and company goals. Therefore, the use of a mar-
keting dashboard is proposed to act as a moderator in
the relationships between ability to measure and perfor-
mance and CEO satisfaction as stated: the greater the use
of a marketing dashboard, the more positively MPM will
influence company performance and CEO satisfaction.
According to previous studies, company size and com-
pany age do have an impact on performance. Therefore
they are also included in Figure 1 and were controlled in
the study (any effect from these variables was isolated
allowing the effects identifi ed before to be observed).
INVESTIGATING MPM EFFECTS
A Study of High-Tech Companies
An online survey of senior marketers in high-tech compa-
nies in North America covering MPM ability, CEO satisfac-
tion with marketing and fi rm performance provided the
primary data for the research. High-tech companies were
considered suitable because, within this sector, marketing
has been under intense pressure to demonstrate its con-
tribution to fi rm performance. Responses from 312 se-
nior marketers (members of a U.S. based marketing or-
ganization and a Business Week research panel, response
rate of 26.4 %) were used. In addition to collecting sub-
jective measures of business performance from key infor-
mants, objective performance data on company profi t-
ability and stock returns was used to crosscheck the
results. The objective measures were ROA and size-ad-
justed stock returns. Data was available only for public
companies. Therefore the sample size for this part of the
analysis was smaller (94 for ROA and 82 for stock returns
compared with 312 for the primary analysis).
Online Questionnaire
The questionnaire was developed on the basis of a thor-
ough literature review on MPM. Additionally, preliminary
in-depth interviews with 17 chief marketing offi cers
were conducted to gain a better understanding of moti-
vations for measuring marketing performance. The fi nal
questionnaire contained 19 items covering the compa-
ny’s ability to measure MPM (range of activities and set
of metrics). Seven-point scales anchored by verbal de-
scriptions from “poor” to “excellent” were used. Out-
come measures on fi rm performance and CEO satisfac-
tion and on the potential moderator variable “dash-
boards” were collected comparably.
Data Analysis and Results
In order to test relationships, hierarchical moderated re-
gression models were calculated. Regression analysis
was used to describe relationships between dependent
(fi rm performance and CEO satisfaction in our case) and
independent variables (MPM ability). The moderated
version allowed for analyzing effects of the assumed
moderator variable “dashboard”. Hierarchical analysis
permitted the evaluation of the relative importance of
single variables. It can explain how much an additional
variable adds to the prediction of a criterion, over and
above other predictors. Here, for instance, it was applied
to isolate the effect of using either a wide range of ac-
tivities or a variety of measures in MPM as well as the
effect of the control variables (company size and age).
Table 1 gives an overview of the results of the analysis.
As proposed, MPM ability was signifi cantly and positively
associated with both fi rm performance and CEO satisfac-
tion with marketing. When looking at different forms of
MPM measurement the results were slightly mixed. The
use of a wide range of activities had a positive impact on
both fi rm performance and CEO satisfaction with market-
ing in the analysis of the primary data. The entry of met-
rics into the equation had a signifi cant impact on CEO
satisfaction with marketing but not on performance.
GfK MIR / Vol. 2, No. 2, 2010 / New Theories
» The development of MPM ability
requires marketers to divert part
of their budget and attention away
from actual marketing programs
and toward measurement efforts. «
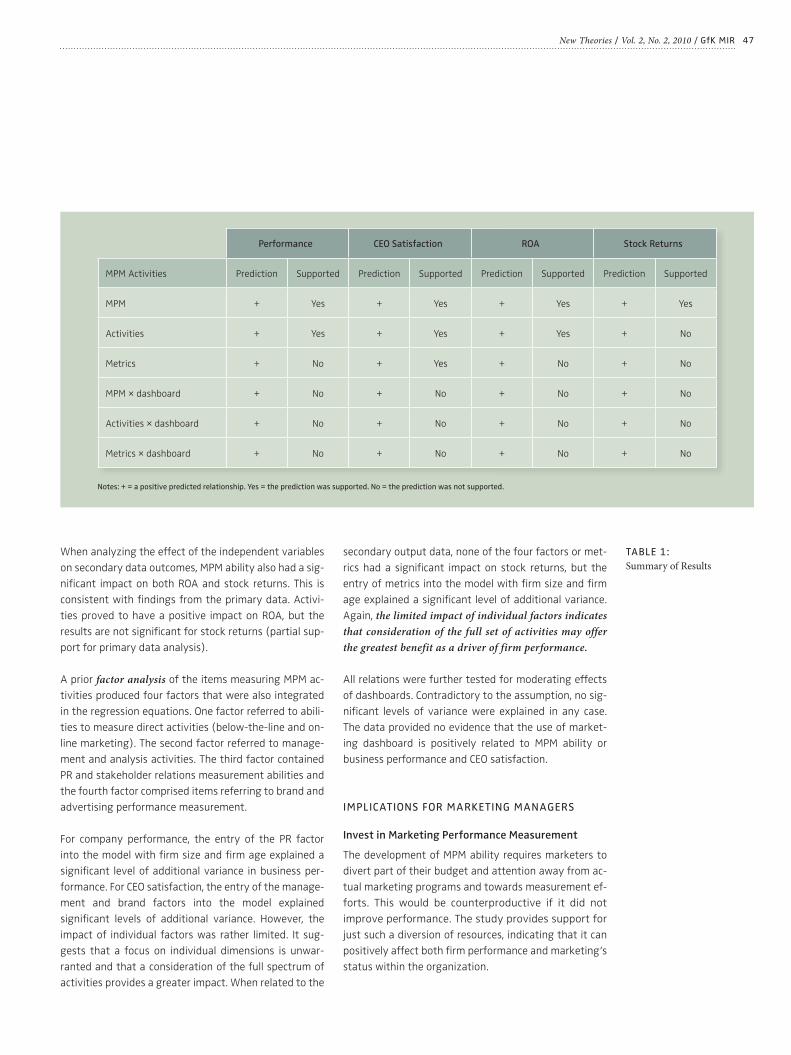
47New Theories / Vol. 2, No. 2, 2010 / GfK MIR
When analyzing the effect of the independent variables
on secondary data outcomes, MPM ability also had a sig-
nifi cant impact on both ROA and stock returns. This is
consistent with fi ndings from the primary data. Activi-
ties proved to have a positive impact on ROA, but the
results are not signifi cant for stock returns (partial sup-
port for primary data analysis).
A prior factor analysis of the items measuring MPM ac-
tivities produced four factors that were also integrated
in the regression equations. One factor referred to abili-
ties to measure direct activities (below-the-line and on-
line marketing). The second factor referred to manage-
ment and analysis activities. The third factor contained
PR and stakeholder relations measurement abilities and
the fourth factor comprised items referring to brand and
advertising performance measurement.
For company performance, the entry of the PR factor
into the model with fi rm size and fi rm age explained a
signifi cant level of additional variance in business per-
formance. For CEO satisfaction, the entry of the manage-
ment and brand factors into the model explained
signifi cant levels of additional variance. However, the
impact of individual factors was rather limited. It sug-
gests that a focus on individual dimensions is unwar-
ranted and that a consideration of the full spectrum of
activities provides a greater impact. When related to the
secondary output data, none of the four factors or met-
rics had a signifi cant impact on stock returns, but the
entry of metrics into the model with fi rm size and fi rm
age explained a signifi cant level of additional variance.
Again, the limited impact of individual factors indicates
that consideration of the full set of activities may offer
the greatest benefit as a driver of firm performance.
All relations were further tested for moderating effects
of dashboards. Contradictory to the assumption, no sig-
nifi cant levels of variance were explained in any case.
The data provided no evidence that the use of market-
ing dashboard is positively related to MPM ability or
business performance and CEO satisfaction.
IMPLICATIONS FOR MARKETING MANAGERS
Invest in Marketing Performance Measurement
The development of MPM ability requires marketers to
divert part of their budget and attention away from ac-
tual marketing programs and towards measurement ef-
forts. This would be counterproductive if it did not
improve performance. The study provides support for
just such a diversion of resources, indicating that it can
positively affect both fi rm performance and marketing’s
status within the organization.
TABLE 1:
Summary of Results
Performance CEO Satisfaction ROA Stock Returns
MPM Activities Prediction Supported Prediction Supported Prediction Supported Prediction Supported
MPM + Yes + Yes + Yes + Yes
Activities + Yes + Yes + Yes + No
Metrics + No + Yes + No + No
MPM × dashboard + No + No + No + No
Activities × dashboard + No + No + No + No
Metrics × dashboard + No + No + No + No
Notes: + = a positive predicted relationship. Yes = the prediction was supported. No = the prediction was not supported.
48 GfK MIR / Vol. 2, No. 2, 2010 / New Theories
Measure Performance across the Entire Range
of Marketing Activities
Given that MPM ability offers demonstrable benefi ts, the
question arises as to what should be measured and how.
Although this study clearly identifi es four factors that
make up the activities aspect of the ability to measure
performance (direct marketing, public relations, brand,
and management), it is noteworthy that each factor
alone has relatively weak relationships to company per-
formance and CEO satisfaction with marketing. This
implies that efforts to drive improvement in ability to
measure a single marketing activity, no matter how im-
portant the activity is to the company, are less valuable.
Instead, a comprehensive effort to develop the ability to
measure performance across the entire range of market-
ing activities should be employed. In addition, the re-
sults suggest that the ability to use a comprehensive set
of metrics is associated with higher CEO satisfaction.
Even if no separate impact on company performance at-
tributable to metrics was found it might still be helpful
in CEO relations. However, measuring a wide range of
marketing activities seems to be more crucial.
Monitor the Value of any Marketing Dashboards Used
The study questions the merit of the current high level
of practitioner enthusiasm for marketing performance
dashboards. Such dashboards have been presented as a
means to communicate performance data more effec-
tively. However, no moderating effect of dashboards on
the relationship between MPM and company perfor-
mance or CEO satisfaction with marketing could be ob-
served here. Because this is one of the fi rst studies to
explore the impact of performance dashboards in mar-
keting and, given that their adoption and functionality
continue to evolve, the fi ndings on their effects are not
defi nitive. Researchers and managers alike need to con-
tinue to explore this emerging fi eld.
Do not Lose Track Of Long-Term Marketing Objectives
While clear benefi ts are underscored to both companies
and marketers who enhance marketing performance
measurement abilities, it is appropriate to end with a
word of caution. Marketing performance measurement
requires a matching of outcomes with specifi c market-
ing input. In recent years, marketers have focused on
49
McGovern, G. J., D. Court, J. A. Quelch,
B. Crawford (2004),
“Bringing Customers into the Boardroom“,
Harvard Business Review, 82 (11), pp. 70 – 80.
Verhoef, Peter C. and Leeflang, Peter S.H. (2010),
“Getting marketing back into the boardroom: The
Infl uence of the Marketing Department in Companies
Today“, GfK Marketing Intelligence Review, Vol. 2,
No. 1, pp. 34 – 41.
Webster, F. E., Malter, A.J., Ganesan, S. (2005),
“The Decline and Dispersion of Marketing Competence“,
MIT Sloan Management Review, Vol. 46, pp. 35 – 43.
FURTHER READING
KEYWORDS:
Marketing Function, Marketing
Abilities, Marketing-Accounting,
Performance Measurement
New Theories / Vol. 2, No. 2, 2010 / GfK MIR
those activities that have the most readily identifi able
return. Ultimately, it appears to be easier to obtain fund-
ing for those activities that are most measurable. Lead
generation, direct marketing and other below-the-line
activities have benefi ted from this trend, most notice-
ably at the expense of awareness and brand building
activities. Nevertheless, it is important to develop mea-
sures for long term, strategic marketing aspects. Mar-
keting activities frequently deliver results across multi-
ple periods which constitute crucial elements of
marketing success. Therefore ways to integrate such
long term effects need to be developed. Avoiding the
fact that the easily measurable dominates the impor-
tant strategic and longer term objectives is favorable
both to marketing as a discipline and its possible scope
of impact. •
{ Box 1 }
Proving Marketing Success Pays Off
This research provides compelling evidence that where
marketing is capable of providing meaningful perfor-
mance measures, it commands signifi cantly higher
board level respect. More compelling again is the strong
impact that marketing has on the company’s fi nancial
performance in companies that are successful in captur-
ing marketing’s contribution.
Measuring marketing success ensures
marketing budgets
Faced with the demand for greater levels of accountabil-
ity, marketers can either respond by providing more
comprehensive and meaningful measures of return on
investment or wait for budgets to be cut. Further, the
success of marketers in demonstrating marketing’s con-
tribution will, in large part, determine the future infl u-
ence of marketing within organizations.
CONCLUSION
50 GfK MIR / Vol. 2, No. 2, 2010 / Flashlight
Trying Harder and Doing Worse:
HOW GROCERY SHOPPERS TRACK IN-STORE SPENDING
Shopping on a Budget
All over the world the economic crisis has raised the
number of households which are below the poverty line.
A careful tracking of expenditures has become increas-
ingly necessary to avoid fi nancial distress. Models of
spending behavior often implicitly assume that budget
shoppers know how much they spend while shopping.
As demonstrated here, this assumption is the exception
rather than the rule.
How Shoppers Actually Keep Track
of In-Store Spending
Two fi eld studies and two laboratory shopping simula-
tions offer new insights on strategies used to keep track
of spending and their consequences. The number one rea-
son for trying to keep track of the spending is clearly a
constrained budget. Most shoppers use computational
estimation strategies. Those who aim to be particularly
accurate in their estimations either use calculators or try
to calculate exact numbers. The computational strategies
include (1) rounding prices down, (2) rounding prices up,
(3) rounding prices to close denominations, (4) combin-
ing compatible prices, and (5) multiplying a central price.
In the fi eld survey, rounding prices up proved to be the
dominant strategy for estimating the total prices (the
grocery shopping baskets of the participants contained
the very common dominant price endings from $.51–
.99). In the experiments the endings were manipulated
according to four different conditions (traditional from
$.51 to $.99, price endings ranging from $.01 to $.49,
the full range of price endings from $.01 to $.99 and
compatible numbers such as $.02 and $.98). Participants
were aware of these and the majority simplifi ed their cal-
culations by choosing the most appropriate computation
strategy for the specifi c endings. However, the most com-
mon approach of rounding up produced the least accura-
cy compared to the other computational approaches.
Budget Shoppers Try Harder to be
Accurate but Do Worse
An exploratory fi eld survey compared results from two
different supermarkets in areas with differing poverty
rates and average household incomes. Shoppers in the
lower income area were more likely to keep track than
those in the higher income area. They were also more
likely to add the exact prices of all items and round prices
to close denominations, whereas they were less likely to
round prices down or up. These results suggest that shop-
pers in the lower income area try harder to be more ac-
curate. In addition, the fi eld survey indicated that respon-
dents who tried to calculate the exact total price of the
basket were unable to do so effectively and were the
least accurate. The effect of “trying harder” was analyzed
more closely in a laboratory setting. Half of the partici-
pant were given fi nancial incentives depending on the ac-
curacy of their estimation (high motivation condition).
The participants in the low motivation condition received
no cash incentive. The results confi rmed that more moti-
vated shoppers are more inclined to calculate the exact
total basket price than less motivated shoppers (48.9 %
versus 9.8 %). Again, despite their willingness to be ac-
curate, the estimation performance of more motivated
shoppers ended up being poorer. A second fi eld survey
underlined these fi ndings and also revealed that the more
shoppers underestimate their total basket price, the more
they overspend relative to their budget (see Figure 1).
When overspending happens, shoppers tend to hold the
retailer responsible and feel dissatisfi ed with the store.
On the other hand, when they pay less than expected, the
benefi t is primarily attributed to themselves and their
level of store satisfaction remains unaffected.
Helping Shoppers to be Accurate Is Favorable
for Retailers and Consumers Alike
Incorrect estimations have implications for not just con-
sumer welfare but also retail performance. Shoppers
who overestimate the total basket price are likely to
» Respondents who tried to
calculate the exact total price
of the basket were unable
to do so effectively and suffered
the worst accuracy. «
o
t
t
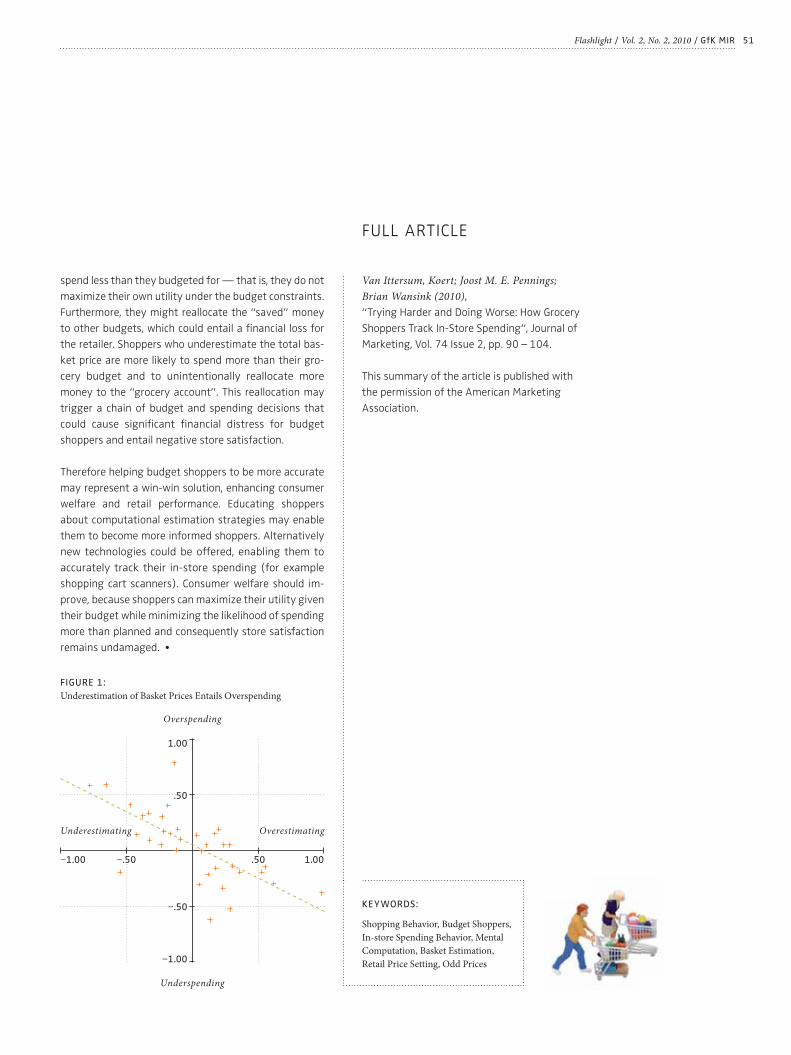
51Flashlight / Vol. 2, No. 2, 2010 / GfK MIR
Van Ittersum, Koert; Joost M. E. Pennings;
Brian Wansink (2010),
“Trying Harder and Doing Worse: How Grocery
Shoppers Track In-Store Spending“, Journal of
Marketing, Vol. 74 Issue 2, pp. 90 – 104.
This summary of the article is published with
the permission of the American Marketing
Association.
FULL ARTICLE
KEYWORDS:
Shopping Behavior, Budget Shoppers,
In-store Spending Behavior, Mental
Computation, Basket Estimation,
Retail Price Setting, Odd Prices
spend less than they budgeted for — that is, they do not
maximize their own utility under the budget constraints.
Furthermore, they might reallocate the “saved” money
to other budgets, which could entail a fi nancial loss for
the retailer. Shoppers who underestimate the total bas-
ket price are more likely to spend more than their gro-
cery budget and to unintentionally reallocate more
money to the “grocery account”. This reallocation may
trigger a chain of budget and spending decisions that
could cause signifi cant fi nancial distress for budget
shoppers and entail negative store satisfaction.
Therefore helping budget shoppers to be more accurate
may represent a win-win solution, enhancing consumer
welfare and retail performance. Educating shoppers
about computational estimation strategies may enable
them to become more informed shoppers. Alternatively
new technologies could be offered, enabling them to
accurately track their in-store spending (for example
shopping cart scanners). Consumer welfare should im-
prove, because shoppers can maximize their utility given
their budget while minimizing the likelihood of spending
more than planned and consequently store satisfaction
remains undamaged. •
FIGURE 1:
Underestimation of Basket Prices Entails Overspending
1.00
1.00
.50
.50
−.50
−.50
−1.00
−1.00
Underspending
Underestimating Overestimating
Overspending
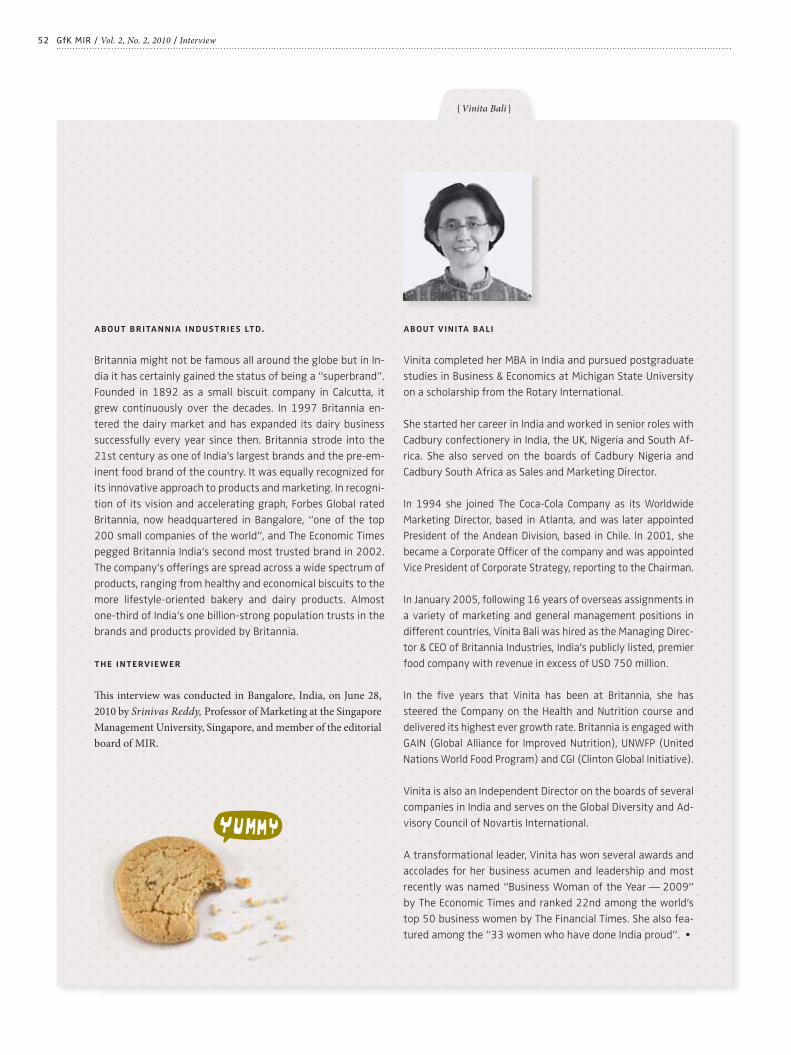
52 GfK MIR / Vol. 2, No. 2, 2010 / Interview
about vinita bali
Vinita completed her MBA in India and pursued postgraduate
studies in Business & Economics at Michigan State University
on a scholarship from the Rotary International.
She started her career in India and worked in senior roles with
Cadbury confectionery in India, the UK, Nigeria and South Af-
rica. She also served on the boards of Cadbury Nigeria and
Cadbury South Africa as Sales and Marketing Director.
In 1994 she joined The Coca-Cola Company as its Worldwide
Marketing Director, based in Atlanta, and was later appointed
President of the Andean Division, based in Chile. In 2001, she
became a Corporate Offi cer of the company and was appointed
Vice President of Corporate Strategy, reporting to the Chairman.
In January 2005, following 16 years of overseas assignments in
a variety of marketing and general management positions in
different countries, Vinita Bali was hired as the Managing Direc-
tor & CEO of Britannia Industries, India’s publicly listed, premier
food company with revenue in excess of USD 750 million.
In the fi ve years that Vinita has been at Britannia, she has
steered the Company on the Health and Nutrition course and
delivered its highest ever growth rate. Britannia is engaged with
GAIN (Global Alliance for Improved Nutrition), UNWFP (United
Nations World Food Program) and CGI (Clinton Global Initiative).
Vinita is also an Independent Director on the boards of several
companies in India and serves on the Global Diversity and Ad-
visory Council of Novartis International.
A transformational leader, Vinita has won several awards and
accolades for her business acumen and leadership and most
recently was named “Business Woman of the Year — 2009”
by The Economic Times and ranked 22nd among the world’s
top 50 business women by The Financial Times. She also fea-
tured among the “33 women who have done India proud”. •
the interviewer
Th is interview was conducted in Bangalore, India, on June 28,
2010 by Srinivas Reddy, Professor of Marketing at the Singapore
Management University, Singapore, and member of the editorial
board of MIR.
about britannia industries ltd.
Britannia might not be famous all around the globe but in In-
dia it has certainly gained the status of being a “superbrand”.
Founded in 1892 as a small biscuit company in Calcutta, it
grew continuously over the decades. In 1997 Britannia en-
tered the dairy market and has expanded its dairy business
successfully every year since then. Britannia strode into the
21st century as one of India’s largest brands and the pre-em-
inent food brand of the country. It was equally recognized for
its innovative approach to products and marketing. In recogni-
tion of its vision and accelerating graph, Forbes Global rated
Britannia, now headquartered in Bangalore, “one of the top
200 small companies of the world”, and The Economic Times
pegged Britannia India’s second most trusted brand in 2002.
The company’s offerings are spread across a wide spectrum of
products, ranging from healthy and economical biscuits to the
more lifestyle-oriented bakery and dairy products. Almost
one-third of India’s one billion-strong population trusts in the
brands and products provided by Britannia.
{ Vinita Bali }

53 Interview / Vol. 2, No. 2, 2010 / GfK MIR
MIR TALKS TO VINITA BALI, MANAGING DIRECTOR AND CEO OF BRITANNIA INDUSTRIESInterview by Srinivas K. Reddy
Today we live in a truly global economy, no matter
whether we talk about goods, services or manpower.
Whereas economic growth rates in Europe and North
America remain moderate, many Asian countries are
booming despite last year s economic downturn. This
is reason enough for MIR to take a closer look at one of
the rising stars: India. In June 2010, MIR talked to
Vinita Bali, one of the few female CEOs of leading
companies, who has worked in infl uential marketing
positions on fi ve continents. In describing how Britan-
nia, one of the most famous Indian brands, handles
everyday business and marketing challenges, she de-
livers a bright picture of the Indian economic situation.
mir: Vinita, it’s a pleasure to meet you. Let’s start off with an inevitable
question in light of recent events: how has the economic crisis affected
Britannia?
vinita bali: Let me take a slightly wider perspective because how
Britannia has been affected is really a direct result of how India has
been affected. Here, even in the worst case scenario, growth was be-
tween 6.5 % and 7.5 %. Britannia’s historical compound annual growth
rate (CAGR) in the last four years has been 21 % but in the past year
it has come down to a little over 10 %. This is partly due to the market
conditions. I think what has been happening in India really is that the
buoyancy which the country witnessed for the last seven or eight
years has declined a little. But if you ask most Indians, unless you are
in a few sectors which are largely dependent on exports, the going has
been reasonably good. If you look at corporate earnings releases,
there were one or two quarters last year where the automotive sector,
textiles sector and a few other sectors that are dependent on exports
didn’t really do well. But by and large, certainly in the FMCG sector, we
are seeing very good top line growth. I think the reason for that is also
quite peculiar to India and has to do with the diversity of packs and
price points and the sheer factor of availability at more points of pur-
chase. I’ve studied this with some interest because it’s both a chal-
lenge for us as well as something that bogs down our performance.
mir: So for Britannia it’s both a challenge and a threat?
vinita bali: Whilst I talk about 20 % plus top line growth, our profi t-
ability has been under severe pressure for two reasons. One is an ex-
ternal factor which is the runaway infl ation in commodities that we’ve
seen, not just all over the world but also in India. So even today when
you pick up the newspaper here, you will fi nd reports of food infl ation
being 16 % or 17 %.
We used to talk about the CPI (consumer price index) not exceeding
3.5 % or 4 % in our country. A majority of people’s disposable income
is spent on food and India’s shine is diminished because many people
can’t afford to buy the basics that they were used to or they should be
entitled to. So, that’s a very critical external factor.
The second reason really has to do with the nature and composition of
the particular industry that we operate in. So if I were to look at the
business of Britannia, I would broadly break it up into two areas. There
is the cereal and cereal-based business, which is the bakery busi-

54
ness — characterized by a large number of local, privately owned play-
ers. And then there is the milk and milk-based business, which is our
dairy business — dominated by cooperatives. Dairy, of course, is quite
small. Right now it’s less than 10 % but it’s actually growing rapidly. Last
year, our dairy growth was about double that of the bakery business.
mir: Why is the fact that most of your competitors in the bakery
business are privately owned such a challenge?
vinita bali: Well, one of the things that characterizes the Indian busi-
ness person is that things like operating margins are less critical than
the absolute money that the business ends up making. So, if my com-
pany is family-owned my concerns are different: if I’m making a billion
rupees this year, and it drops to 700 million next year, it’s okay. I can
take the volatility because the profi t pool is just shared amongst fi ve
of my cousins and so on.
For us, this situation poses the question: do we want to be the tallest
midget in terms of operating margins? And our answer is no. So that’s
why I sometimes wish I was competing with some of the multi-nation-
als operating in this market because I think multi-nationals do under-
stand the importance of margins.
mir: And how do you handle this situation: how are you guiding
Britannia through the crisis?
vinita bali: Britannia represents only one third of the market, so
two-thirds of the market is still dominated by a large number of truly
local players. In fact, there is only one local player that is national. If
you go to the East, which is a very competitive market, there are
about 350 manufacturers of biscuits. So our challenge really has been
to continue to drive profi table growth, which means achieving a
healthy increase in our top line, consolidated market share and gen-
erating a high operating margin. I can tell you, our operating margin
is twice that of the industry profi t pool. But to refer again to my anal-
ogy of midgets: we are the tallest midget but we don’t want to be a
midget at all.
Our focus therefore is really on two things. One is to drive innova-
tion and margin enhancement through innovative and differentiat-
ed products, and the second is to really work on becoming a lean
machine when it comes to cost. We have launched a pretty ambi-
tious initiative on cost reduction and this year we have set a target,
which is signifi cantly ahead of what we’ve delivered in the last three
to four years.
mir: How are you able to do that?
vinita bali: We are looking at our procurement and our procurement
strategy, our manufacturing footprint and how we are structured
there, and we’re also looking at our go-to-market approach, distribu-
tion, freight, logistics, warehousing… I mean the full works. Over the
last four years, we have set a cost reduction target every year which is
2 % of our NSV (net sales value). And we have more or less delivered on
that. But in future we want to reduce costs even more, which is quite a
tall order. What this means is that there are no sacred cows. We are
looking at everything that needs to be changed.
mir: So, what I am hearing is that the economic crisis has given you a
reason to look harder at your cost structure and improve on things. Is
that fair to say?
vinita bali: Yes, I would say that the crisis is one more reason to
streamline our business. It created more impetus than there would
have been otherwise.
mir: You have been able to create a very strong brand with Britannia.
I hear that Britannia is the ninth most trusted brand in India.
vinita bali: Seventh, actually! Across all brands and all categories.
We were the number one food brand in India and became the number
two food brand last year, when we were overtaken by a brand of salt,
which is classifi ed as food. In a consumer democracy we accept that
verdict!
mir: So you created one of India’s most iconic brands. What are the
challenges of holding on and maintaining the stature of the brand?
vinita bali: I’m certainly not going to take all the credit for the brand
Britannia. I think Britannia has been reasonably well-managed over the
years. It is a brand which is about 93 years old. And I think the affi lia-
tion and affi nity that people have with the brand is to a large extent
also due to the kind of products we make. We make products for the
belly of India. We are not the Dean and Deluca of India.
mir: Are you addressing specific target groups or would you describe
Britannia as a brand for all Indians alike?
vinita bali: We certainly have products that cater to the middle of
India, the uppermost, and the base of the pyramid. We also operate in
categories where consumers make decisions quite frequently so our
products have a high velocity. Take, for example, our bread business:
the reason I want this in my portfolio is because it is something that
consumers buy every day and if I make a conscious choice every morn-
ing when I wake up that I want Britannia bread rather than any other
GfK MIR / Vol. 2, No. 2, 2010 / Interview
55
bread, that’s great in terms of brand building. It’s a bit of an unconven-
tional way of thinking about brand building. It’s not about advertising
and hoardings/billboards and so on. But that is our promise to the
consumer. And we’ve kind of added to that through a string of prod-
ucts that we’ve launched not just in the bakery portfolio but also in
the dairy portfolio. The second thing that makes our brand so special
is that no matter what they are, our products are affordable, hugely
accessible, and of a consistently high quality.
mir: Could you explain why affordability and accessibility are so
important?
vinita bali: Let me take accessibility fi rst. You could buy a Britannia
product today in about three million outlets across the country, which
is a lot. I think the only other category that would have a higher distri-
bution would be loose tea and cigarettes. So that’s on the one hand.
On the other hand, we’ve got an entry price, even today, of two rupees
(fi ve cents). The price goes up to 350 rupees (USD 8) for some prod-
ucts, but at two rupees, you get four biscuits. They are hygienically
packed and can be consumed anywhere, at home or out of the house.
They can be enjoyed by themselves or with a cup of tea or even a glass
of water. Added to this, for two rupees, they are reasonably nutritious
and fortifi ed with micro-nutrients.
mir: So your brand is about being accessible and affordable and…
nutritious?
vinita bali: Well, our company credo is that we care about healthy
eating and healthy lifestyles. In Hindi, the encapsulation is really
good; it is “Swasth Khao Tan Man Jagao”, which means something
like “Eat healthily — and add life to life”. We were the fi rst company
and actually we are still the only company in India, to have removed
trans fats from all our biscuit products. There is a large part of India
that doesn’t have enough food and there is a part of India that has
enough food but it is not healthy food. Through work that we carried
out for the United Nations as part of the World Food Programme we
realized that biscuits are an excellent means of providing nutrition.
So we fortifi ed our range with micro-nutrients. And the result is that
50 % of what we sell today is fortifi ed with micro-nutrients: which is
a different way of saying that, when you buy a two-rupee biscuit,
you’re getting something which is good for you … and there aren’t
very many other products that you can buy for two rupees that taste
good and offer this nutritional value!
mir: You mentioned innovation at Britannia earlier. How important is
innovation to Britannia and what are the mechanisms that you use to
promote innovative culture at Britannia?
vinita bali: Innovation has been a huge area for us and, as I men-
tioned earlier, I look at innovation with a capital “I”: For us, innovation
is anything that is capable of producing new value. So I don’t have to
struggle with new product inventions.
Let me give you an example: we asked “how can we change biscuits
from grocery items that a mother buys to an individual consumption
item that a child, teenager or young adult would buy with their pocket
money?”. When you buy a 100 g pack with about 17 biscuits it is not
a personal consumption pack. So we had to do something with the
basic packaging. We created a format which has three or four biscuits.
The moment you put in three or four biscuits, you are completely
changing the look and feel of a biscuit. If confectionary can be pre-
sented as an impulse purchase product by putting it in jars or mer-
chandising units, so can biscuits. So we started doing that for biscuits.
Interview / Vol. 2, No. 2, 2010 / GfK MIR
» There are no sacred cows.
We are looking at everything that
needs to be changed. «
56
It’s a slightly unconventional way of thinking about innovation. But
the yardstick we use is anything that is capable of generating new
value.
mir: This is very interesting. Do you have some more examples of
innovations for the Indian market?
vinita bali: There have been two or three vectors of innovation. One
certainly is the product itself. So when I look at our health and nutri-
tion range, whether it is launching a high-fi ber digestive biscuit, or a
fi ve-grain biscuit, adding things like jeera (cumin) into our crackers, or
fortifying them with micro-nutrients: we have taken the core essence
of the brand and embellished it with something meaningful to make it
even more relevant to the consumer.
I think the second part of innovation really has to do with the func-
tionality that we’ve achieved with some of our products in the dairy
range. I’ve talked a lot about biscuits so let me give you examples from
dairy. In dairy, we were the fi rst brand to say, we’re not just selling
milk, we’re going to sell you milk which has no fat and no cholesterol.
So it is doodh (milk) but it is also low fat doodh. We’re the market
leaders in cheese, and we offer you a ‘Slimz’ cheese, which has 30 %
less fat than normal cheese. We’ve created two products that are just
being introduced to the market. One is called Actimind, which is spe-
cially formulated with ingredients that are known to increase mental
sharpness — like choline, iodine and B vitamins etc., because dairy is
also a good carrier.
Here’s another example of innovation: we’ve taken the big Tiger fran-
chise that we had in biscuits, and launched a “Tiger-Iron Zor” milk,
fortifi ed with iron and other ingredients — which is taking an estab-
lished brand in one category and extending it to a completely differ-
ent category.
Then we have done a lot of work in an area that I call “new frontiers of
technology”. We’ve looked at how we can make biscuits with less con-
sumption of heat and energy. So we’ve done a lot of work where we are
capturing the heat generated during baking and re-using it in the oven.
A big cost in a bakery is the oven, which is heated up to 350 degrees.
And if you walk through a biscuit plant, it’s like being in a sauna, be-
cause all that heat is escaping into the atmosphere.
mir: Who comes up with all these innovations? Is innovation centralized?
vinita bali: We’ve got an innovation center which is based in Chen-
nai. It has three areas: the dairy and the bakery innovation center
which are all mini plants, so we can actually do a small commercial run
for each of these products. And we’ve got a technology and design
center which explores how we can use new technologies to produce
better quality products at a lower cost. And if you look at our annual
report, you will know that the energy we use to produce a ton of bis-
cuits has actually fallen pretty signifi cantly over the years.
mir: That sounds very progressive to me. Are there any other examples
of technological innovation?
vinita bali: We’ve looked at the application of technology by asking,
“how do I increase productivity by mechanizing a lot of what we do
here?”. In India, traditionally the thinking was that labor is cheap. So if
you need to put another new pack on the market, you simply hire a
few more workers for that job. However, we have been mechanizing a
large number of manual processes.
GfK MIR / Vol. 2, No. 2, 2010 / Interview
» If I make a conscious choice every
morning when I wake up that I want Britannia
bread rather than any other bread,
that’s great in terms of brand building. «

57
We have looked at areas like bringing down the amount of time that
is required. Every biscuit has a design on it. So our technology guys
have fi gured out a way of going from artwork to a biscuit in less than
48 hours. And that’s the application of technology. We have mecha-
nized a lot of the processes like bulk handling of fl our and so on to
reduce wastage. So, there is innovation in terms of products and
packaging, innovation in technology and also some business model
innovation.
mir: In a market like India, how important do you consider market
intelligence or market research?
vinita bali: I think market intelligence, information, consumer in-
sights and interpretation of those consumer insights are very, very im-
portant, for obvious reasons, and I would just like to underscore a few.
One is that we have a very competitive market out there. The second
thing, really, is that the cost of failure, like in every other market, is
quite high. Thirdly, I think that, if companies are going to build their
future on differentiation, then driving that wedge between under-
standing what is generally acceptable and what can be differentiated
and marketed differently becomes very important. Fourthly, some un-
derstanding of a return on marketing investment also becomes very
important because media is increasingly fragmented. Communication
channels are becoming more varied. The impact therefore becomes
critical. And in competitive markets it becomes all the more important
to understand the impact of consumer promotions in the marketplace,
of a new media campaign, a new pack launch, etc.
mir: Could you tell us how Britannia uses market research to gather
information about markets, customers and so on?
vinita bali: We do a great deal of work on the basis of an innovation
funnel which we call “from concept to commercialization”. We go
through various stages with consumers to sift through a large number
of ideas and bring them down to what really matters. So there are
two or three core areas of research which range from proprietary work
on the one hand, to syndicated data on off-take etc., which is carried
out by Nielsen, on the other.
mir: This data you’re talking about… is it store off-take data?
vinita bali: It is retail off-take data. Then there is consumer house-
hold panel data on household purchases. We carry out some continu-
ous consumer tracking for our brands and conduct advertising effec-
tiveness studies to evaluate the impact of new campaigns, among
other things. So there is ongoing research and custom research and
then there are research protocols that we’ve worked on over the last
few years. These deal with questions like: how do we go from concept
to commercialization? And what kinds of information are required?
What data would support that? To get that data we use some market
simulations, such as BASES tests etc.. Personally, I think it’s too sim-
plistic to rely on this, but at least it gives some indication. I’d rather go
and pilot out a product in one market, because that produces real,
hard core data, which is empirical.
mir: Have you carried out such pilots or test markets?
vinita bali: Oh yes! Both products I mentioned before, Actimind and
Tiger Iron-Zor Milk, are in pilots. We go in and look at experience in the
market, together with what we are investing in the mix and what the
off-takes etc. are. To me it’s a much more robust measure. As a result
of that pilot, we correct what needs to be corrected — whether it is
the communication or the product or the concept or the pricing or
whatever, before we launch at national level. I also think it’s a good
way to mitigate our risk.
mir: What are some of the differences in conducting market research
in emerging markets like India?
Interview / Vol. 2, No. 2, 2010 / GfK MIR
» In India, traditionally the thinking was that
labor is cheap. So if you need to put
another new pack on the market, you simply
hire a few more workers for that job.
However, we have been mechanizing a large
number of manual processes. «
58 GfK MIR / Vol. 2, No. 2, 2010 / Interview
vinita bali: I think it’s more in the nuances and what people believe
in. For example, we carry out pre-tracking and post-tracking measure-
ment, so the concept is the same. But I have certainly found that in
India in general, not just at Britannia, there is a greater reliance on
qualitative rather than quantitative research. However, I don’t want to
portray a situation where there is no quant because we do place em-
phasis on quantifi cation. It’s also harder to conduct modeling work in
India, because there is a reliance on a large number of individual kirana
shops giving us information. It’s not like going to a Kroger or a Sains-
bury’s and looking at their database, which captures almost 80 % of
purchases. There’s nothing like that available in India; even organized
retailers are not organized enough to actually share their data. So
typically, a lot of the information that we’re getting on products, still
comes directly from consumers.
So I think the things we attempt to measure are not different, but how
we go about measuring them is different. The difference is in terms of
the structure of the market, the structure of the information and what
is available and what is not available.
mir: Can you give us some specific examples of how market research
has helped you in making some important decisions, such as launching
a product or a media campaign?
vinita bali: Oh, lots of examples … usually most of our advertising
campaigns come out of pretty good research on the brand, its posi-
tion, its imagery etc. Very often we take advertising concepts and test
them with consumers, to either eliminate or refi ne the concepts. So
there’s a lot of pre-testing of advertising and certainly there’s a huge
post-evaluation, which is qualitative as well as quantitative. Especially
if we’re launching something which is building a new category like
Actimind, there is a lot of work involved in refi ning the concept, includ-
ing the packaging and overall communication.
We consider it important to visit consumers at home and talk to them,
and this is not done by some agency. All our Brand Managers are re-
quired to spend a certain proportion of their time in the market, as
well as talking to consumers at home, or at the shopping place. We’re
doing a lot of work right now, not just in terms of understanding con-
sumer behavior, but also understanding shopper behavior.
mir: There is a lot of talk about multinational firms understanding
the needs of the bottom of the pyramid. Do you see your products as
addressing the bottom of the pyramid?
vinita bali: Obviously in a country like India, with a population of 1.1
billion, you will attract people at every price point. Now there are Indi-
ans who are buying Lamborghinis, and there are Indians who want to
buy a Tata Nano (small, inexpensive Indian car). And that’s the beauty
of operating in a market like India: irrespective of price points, there
will always be consumers. Obviously, the lower the price point, the
greater the number of consumers. And we are a country where many
people buy little and often, which actually adds up to a lot.
Our per capita consumption of everything is lower than that of every
other country in the world, including emerging economies. So we’re
lower than Sri Lanka, we’re lower than Vietnam. And that is because
affordability is really a key issue in this country. It determines fre-
quency of consumption, purchase and the velocity with which things
move. So frankly, to me, the bottom of the pyramid is a diffi cult
one … let’s be clear, if 40 % of this country is below the poverty line,
no matter what you do, they are not going to buy your sachet or
anything really. The task there is to lift them above this poverty line
but that is another issue. I think that’s something we just need to
recognize. Even if they buy, they do so infrequently and it is there-
fore not going to sustain the business anyway. But there are many
people at the base of the pyramid too and they are very much part of
our audience and user base.
» The things we attempt to measure
are not different, but how we go about
measuring them is different.
The difference is in terms of the structure
of the market, the structure of the
information and what is available and
what is not available. «
59 Interview / Vol. 2, No. 2, 2010 / GfK MIR
mir: Very rarely do we meet someone who has worked in five continents.
You started your career in India, then worked in England, Africa, the
US, and Latin America. You have spanned the globe and run businesses
in all these countries. So… how does that relate to working in an emerg-
ing market like India? Which past experiences help you on a daily basis
in terms of operating in an emerging market? What are the differences in
operating in an emerging market like India?
vinita bali: I think it’s an interesting question. I worked outside of
India over two periods, for almost 18 years in total. The second time I
left India was in 1991, and I returned in 2005. And for me, the biggest
surprise was that the India I left and the India I came back to were two
different countries in a variety of ways. Economic growth and prog-
ress have the consequence that a country becomes far more confi -
dent, optimistic and hopeful, and the people of India started to believe
that the future belongs to them. There was a great deal of overt and
palpable change, whether it was in the kinds of cars that people were
driving, the homes they were living in or the food they were eating.
When I was growing up, there were not that many brands of anything.
You look at the plethora of choices that are available to people in India
today. Not just in urban but also in rural India. I think India represents
a microcosm of the world.
mir: What do you mean by that?
vinita bali: On the one hand, we are moving towards what is typi-
cally referred to as organized retail: large format stores where consum-
ers walk through the aisles picking up what they need, which is not the
India I grew up in, certainly. At that time there was the kirana (small
retail store) next door, where you called up and placed an order. There
weren’t that many brands of toothpaste or whatever you had to buy
and things were delivered to the house. That still happens by the way,
because in a country like India, multiple centuries exist simultaneously.
You go to some of the remote villages in India and it seems as though
nothing has changed. The bullock cart is still the major form of trans-
portation although some of the owners are now talking on cell phones.
Then there is the “other” India, where people are driving BMWs, and
statistics claim that Ludhiana (district capital in the Indian state of
Punjab) has the highest per capita ownership of Mercedes for instance.
And there’s something quite exciting about this picture. Right now, In-
dia is chaotic, full of opportunities and full of challenges. I draw on ev-
erything that I’ve seen and learnt across continents and businesses,
maybe not in a very organized and overt way, but I certainly do. So if
we look at organized retail, we’re one of the fi rst few companies to look

60 GfK MIR / Vol. 2, No. 2, 2010 / Interview
at concepts like category management, negotiating terms of trade
with large format stores, and understanding shopper behavior.
mir: Can you think of other experiences that have helped?
vinita bali: The shelf profi tability which I was exposed to when I
worked in the UK and in North America for example, but I was also
confronted with chaos in various markets — the most chaotic market
I’ve ever worked in was Nigeria. And I think some of the categories I’ve
worked in have also helped. For instance, the example that I gave you,
of taking our existing biscuits, putting three biscuits in a pack, and
creating the context of impulse purchase… To my mind this is an
adapted innovation.
mir: Obviously “thinking differently than before” is very important.
How did you implement this new marketing approach that you learnt
in your previous assignments?
vinita bali: I think that during the last four years we’ve brought
more processes and systems into this company than ever existed be-
fore. And that entire process orientation was something I learnt in the
USA. A company like Coca-Cola is successful because they’ve got this
way of operating in 200 plus countries around the world. So, what is
common that can be adapted across markets, what needs to be mar-
ket-specifi c? I think, it’s almost like — what should I say — …osmosis.
You’ve experienced things, you know intuitively what might work.
I haven’t really sat down and said okay, what did I learn in Nigeria? But
I know these examples and these stories keep coming back.
Another thing which I think the US does very well is differentiation in
terms of people, the contribution they make and the rewards they
get. So for the fi rst time, we said: okay, if you are a super-duper per-
former in Britannia, you will get an increment which is three times
higher than the average.
mir: One final question, Vinita. You have been named The Economic
Times’s 2009 Business Woman of the Year. You’ve become a part of the
breed of women leading great enterprises around the world. What advice
would you give to young women aspiring to get into management?
vinita bali: The advice I would give to women and men is not very
different. I think my own personal experience suggests that at times,
we attach too much importance to things like gender inequality. I
want to be very clear — I’m not saying it doesn’t exist. I’ve experi-
enced it myself directly and indirectly. The way to deal with it is to say,
okay, this is what it is, and to go after the things that you can infl uence
and change and not sit on the periphery.
So, I think the whole debate on gender has to give way to a debate on
competencies. And this will happen in two ways. Firstly both genders
have to change. I think as far as women are concerned, we have to
come in there saying, it’s going to be an equal playing fi eld. And I am
going to demonstrate, through my effectiveness and my competen-
cies, that I am the best person for the job, and my gender is less impor-
tant than what I’m able to do.
Secondly, I also think we have to have what I would call some “renais-
sance men” in senior positions in management who will make the
same call, and say that skilled people have to be given equal opportu-
nities. Women should not get more opportunities because they are
women and equally, your caste, class or color should not affect the op-
portunities you are offered. I think, once you equalize opportunities
everything else is a matter of competence … in other words: don’t let
gender or any other difference get in the way.
I think companies and managers must make those decisions. They
have to take an attitude which says: I don’t care where that person
comes from, what their accent is, what their gender is, what their x y z
is. I am looking at a certain set of competencies, both individual com-
petencies, leadership behavior etc. and if anybody of any caste, creed,
color, nationality or accent has those competencies, then there has to
be equality of opportunity. Then, let meritocracy take over.
mir: Thank you Vinita for taking the time to share your thoughts and
experiences. We wish you the best in taking Britannia to new heights. •
61Neue Insights zum Konsumentenverhalten / Vol. 2, No. 2, 2010 / GfK MIR
In den vergangenen Jahren wurden Bedenken laut, ob es
für Neuprodukte mit einer höheren Qualität als jener des
bisherigen Marktführers möglich ist, Angebote, die sich
mehr oder minder als Marktstandard etabliert haben, zu
verdrängen. Die Tatsache, dass der Großteil der Nutzer
ein bestimmtes Produkt verwendet, könnte nämlich
dazu führen, dass auch neue Nutzer trotz qualitativ bes-
serer Alternativen wegen eines Netzwerkeffektes nur
dieses eine Produkt in Erwägung ziehen und damit der
Markt quasi blockiert ist. Netzwerkeffekte entstehen,
wenn die Größe des Nutzerkreises eines Produktes selbst
zum Nutzenfaktor wird. Man befürchtet, dass dies ohne
entsprechende staatliche Regulierung zu ineffi zienten
Märkten und Nachteilen für die Konsumenten führt.
Die Überprüfung dieser für den Wettbewerb und die Ver-
marktung neuer Produkte extrem wichtigen Frage er-
folgte mithilfe einer Langzeitstudie. Sie untersuchte die
Marktentwicklung von 19 Produkten in der Software-
branche (z. B. Programme zur Textverarbeitung oder
Tabellenkalkulation) während der 80er- und 90er-Jahre.
In dieser Branche waren schon immer starke Netzwerk-
effekte zu beobachten. Ziel der Studie war es, zu erhe-
ben, ob und wie schnell es neuen, besseren Technologien
gelingt, die Markführerschaft von etablierten Produkten
zu brechen.
Die Ergebnisse zeigen entgegen der These vom langfris-
tigen Pioniereffekt und trotz der starken Netzwerkef-
fekte durchwegs effi ziente Marktmechanismen. Die
Markführerschaft in den einzelnen Produktmärkten dau-
erte durchschnittlich nur 3,8 Jahre und wechselte häufi g.
88 % der beobachteten Wechsel erfolgten, weil die Qua-
lität einer neuen Marke jene des etablierten Produktes
übertraf. Höhere Qualität setzte sich letztendlich immer
durch. Wenn sich ein Segment gut informierter und qua-
litätsbewusster Konsumenten bildete, förderte dieses
sogar die Markteffi zienz und führte zu einer rascheren
Adoption des besseren Produktes.
Sind etablierte Marktführer mit besserer Qualität zu schlagen?
EINE STUDIE IN HIGHTECH-MÄRKTENGerard J. Tellis, Eden Yin und Rakesh Niraj
{Deutsche Zusammenfassung }
Die wichtigsten Erkenntnisse im Überblick
> Qualität setzt sich durch
Um in Hightech-Märkten erfolgreich zu sein, ist es
nicht unbedingt notwendig, möglichst frühzeitig in
einen Markt einzusteigen. Ein gut ausgereiftes, hoch-
qualitatives Produkt kann auch zu einem späteren
Zeitpunkt noch den Durchbruch schaffen.
> Netzwerke stellen keine nachhaltige Eintrittsbarriere
für gute Produkte dar
Marktführer können sich nicht auf Netzwerkeffekte
verlassen, sondern sind durch qualitativ bessere Pro-
dukte angreifbar. Nur indem sie selbst permanent die
Qualität ihrer Produkte weiterentwickeln und Quali-
tätsführer bleiben, können sie sich gegen neue Ein-
steiger verteidigen.
> Marktmechanismen funktionieren auch ohne
Interventionen
Hightech-Märkte scheinen gut zu funktionieren.
Interventionen durch Regierungen zum Schutz der
Konsumenten wären in diesem Bereich demnach
überfl üssig. •
… 8.
Schlüsselbegriffe:
Wettbewerb, Produktqualität, Netzwerkeffekt,
Marktentwicklung, Markteffizienz, Marktführerschaft,
Computerindustrie
Den ausführlichen Artikel in englischer Sprache finden
Sie auf Seite …
62 GfK MIR / Vol. 2, No. 2, 2010 / Neue Insights zum Konsumentenverhalten
In einigen Industrien ist es übliche Praxis, die bestehen-
den Basisprodukte mit einer Vielzahl von Zusatzfunktio-
nen auszustatten (Mobiltelefone sind z. B. gleichzeitig
Kameras, dienen als MP3-Player oder ermöglichen einen
direkten Internetzugang). Unterschiedliche Basisproduk-
te, vor allem im Hightech-Bereich, werden deshalb in Be-
zug auf ihre Anwendungsmöglichkeiten immer ähnlicher
(= convergent products). Konsumenten sind mit einer
Vielzahl an möglichen Funktionen konfrontiert. Inwieweit
bzw. welche Anwendungsmöglichkeiten den Konsumen-
ten aber tatsächlich einen Mehrwert liefern, ist häufi g
nicht bekannt. Zu viele Funktionen können sogar kontra-
produktiv sein, weil sie den Konsumenten überfordern.
Der vorliegende Forschungsbeitrag beschäftigt sich mit
genau diesem Thema. Der Autor untersucht dabei den
Einfl uss von unterschiedlichen Faktoren auf den wahr-
genommenen Mehrwert einzelner Zusatzfunktionen.
Zunächst prüft er, ob es je nach ursprünglichem Nutzen-
profi l von Basisprodukt und Zusatzfunktion (Vergnügen
oder Nützlichkeit) Unterschiede in der Bewertung von
Erweiterungen gibt. Während z. B. bei einem elektroni-
schen Organizer (PDA) eher der Nutzenaspekt im Vor-
dergrund steht, wird ein MP3-Player eher mit Spaß und
Vergnügen assoziiert. Auch Zusatzfunktionen von Pro-
dukten können entweder mehr auf Nützlichkeit (Erwei-
terung eines PDA um ein GPS) oder Spaß (die Möglich-
keit, am Gerät Videos zu konsumieren) ausgerichtet
sein. Die unterschiedlichen Ergebnisse der verschiede-
nen Kombinationen von Gebrauchsnutzen versus Ver-
gnügen helfen Produzenten, auf die richtigen Zusatz-
funktionen zu setzen und einen echten Mehrwert für
Konsumenten zu schaffen.
„Telefonieren. Mailen. Fotografi eren. Hören. Spielen“
WELCHE ZUSATZFUNKTIONEN VON IMMER ÄHNLICHER WERDENDEN GRUNDPRODUKTEN LIEFERN TATSÄCHLICH EINEN MEHRWERT?Tripat Gill
{Deutsche Zusammenfassung }
Die wichtigsten Erkenntnisse im Überblick
> Vorsicht vor zu vielen Zusatzfunktionen
Nicht alle liefern den Kunden tatsächlich einen Mehr-
wert!
> Vergnügen schlägt die Nützlichkeit
Erweiterungen, die primär dem Vergnügen dienen, lie-
fern mehr Wert. Das gilt sowohl für Basisprodukte, bei
denen das Vergnügen im Vordergrund steht, als auch
bei „nützlichen“ Basisprodukten.
> Bestehende Nutzer reagieren empfindlicher
Das gilt vor allem, wenn man spaßorientierte Produk-
te mit nützlichen Zusatzfunktionen erweitert. Solche
Erweiterungen können sogar zu einer wahrgenom-
menen Wertminderung führen.
> Auch das Qualitätsniveau des Basisproduktes
beeinflusst die subjektive Wahrnehmung
der Erweiterungen
Marken, die für eine hohe Qualität stehen, profi tieren
stärker von inkongruenten Zusatzfunktionalitäten,
während für Marken mit einem geringeren Qualitäts-
niveau eher Erweiterungen, die den ursprünglichen
Nutzen verstärken, infrage kommen. •
Den ausführlichen Artikel in englischer Sprache finden
Sie auf Seite …
… 16.
Schlüsselbegriffe:
Neuprodukt-Politik, Produktkonvergenz,
Produktgestaltung, Highech-Marketing

63Neue Marketingstrategien / Vol. 2, No. 2, 2010 / GfK MIR
CUSTOMIZATION: GOLDMINE ODER MINENFELD?Nikolaus Franke, Peter Keinz und Christoph J. Steger
{Deutsche Zusammenfassung }
Den ausführlichen Artikel in englischer Sprache finden
Sie auf Seite …
… 26.
Schlüsselbegriffe:
Mass Customization, Segmentierung, Innovation,
Design, User-Integration
Customization ist die logische Fortsetzung einer immer
feiner werdenden Segmentierung. Der Kunde bekommt
nicht nur ein Produkt, das die durchschnittlichen Präfe-
renzen eines Marktsegments widerspiegelt, sondern er
erhält eine für ihn individuell maßgeschneiderte Leis-
tung. Neue Technologien und Management-Systeme ha-
ben diesen Trend ermöglicht und einige Unternehmen
(z. B. Dell) haben mit der konsequenten Anwendung von
Customization große Erfolge erzielt. Auf der anderen
Seite gibt es aber auch Unternehmen, die beim Versuch,
maßgeschneiderte Produkte zu vermarkten, gescheitert
und wieder zu traditionellen Segmentierungsstrategien
zurückgekehrt sind (z. B. Levi’s oder Mattel mit „My De-
sign Barbie”).
Um die Überprüfung von Customization statt in einzel-
nen Fallbeispielen im direkten Vergleich zu ermöglichen,
haben die Autoren ein Testszenario entwickelt, bei dem
Zeitungen und andere Produkte nach dem Muster der
Segmentierung, der Customization und des Massenmar-
ketings im Wettbewerb gegeneinander antreten. Für
jede Alternative erhoben sie im Wege der Befragung
Präferenzwerte und Zahlungsbereitschaften.
Die maßgeschneiderte Lösung hat dabei eindeutig ge-
wonnen. Die durchschnittliche Zahlungsbereitschaft für
das individualisierte Produkt lag bei 1,05 € gegenüber
einer Zahlungsbereitschaft von 94 c für die segment-
spezifi sche Lösung und 92 c für das Einheitsblatt. In ei-
ner weiteren Studie in anderen Produktkategorien wur-
den diese Ergebnisse bestätigt.
Obwohl die Resultate eine eindeutige Sprache sprechen,
ist Customization nicht in jeder Situation und für alle
Kunden die beste Strategie. Gewisse Voraussetzungen
sollten für eine erfolgreiche Umsetzung gegeben sein.
Die wichtigsten Erkenntnisse im Überblick
> Kunden präferieren maßgeschneiderte Lösungen
Sie sind auch bereit, dafür mehr zu bezahlen. Das
Marktpotenzial für diese Form der Vermarktung
scheint bei Weitem noch nicht ausgeschöpft.
> Die Kunden sollten wissen, was sie wollen
Wenn Kunden selbst nicht so genau wissen, was sie
eigentlich wollen, macht es keinen Sinn, das Produkt
maßzuschneidern. Der Mehrwert gegenüber einem
weniger individualisierten Angebot ist fraglich.
> Die Kundenpräferenzen sollten kommunizierbar sein
Es kann vorkommen, dass Kunden zwar wissen, was
sie wollen, aber nicht in der Lage sind, diese Präferen-
zen auch auszudrücken. Nur wenn sichergestellt ist,
dass die Kunden die notwendigen technologischen und
kommunikativen Fähigkeiten haben, ihre spezifi schen
Wünsche zu artikulieren, können Produkte entstehen,
die den tatsächlichen Präferenzen entsprechen.
> Hohes Involvement führt zu passenderen Produkten
Konsumenten mit hohem Produktinvolvement setzen
sich intensiver mit der Aufgabe einer klaren Pro-
duktdefi nition auseinander. Die Gefahr von Fehlinter-
pretationen in der Umsetzung des individualisierten
Produktes ist deshalb geringer und das Produkt sollte
den tatsächlichen Präferenzen besser entsprechen. •

64 GfK MIR / Vol. 2, No. 2, 2010 / Neue Marketingstrategien
Customer-Relationship-Management-(CRM-)Systeme
werden in einer Vielzahl von Unternehmen eingesetzt,
um die Kundenbetreuung zu optimieren. CRM-Anwen-
dungen sollen helfen, Verkaufsaktivitäten zu analysie-
ren und zu organisieren und durch die Standardisierung
und Automatisierung von Abläufen den Kundenservice
zu verbessern. Dadurch lassen sich Kostenreduktionen
und Ertragssteigerungen erreichen. Allerdings haben die
letzten Jahren gezeigt, dass sich diese Erwartungen oft
nur mangelhaft erfüllen und CRM-Systeme sich deshalb
als Fehlinvestitionen herausstellen. Studien berichten,
dass nur ca. ein Drittel aller CRM-Projekte zu signifi kan-
ten Ergebnissteigerungen geführt haben und ein Fünftel
sogar den langjährigen Kundenbeziehungen schadeten.
Waren nun die Erwartungen an CRM-Lösungen schlicht-
weg falsch oder wurden die Systeme einfach schlecht
implementiert? Diese Frage stellt den Kern des vorlie-
genden Artikels dar. Die Autoren vermuten, dass das
Ausmaß der notwendigen Veränderungen im Rahmen
einer CRM-Implementierung häufi g unterschätzt wird
und viele CRM-Einführungen zu wenig Unterstützung
durch das Top-Management erhalten. In einer Studie un-
tersuchen sie, welche Einfl ussfaktoren für eine erfolgrei-
che Implementierung von besonderer Bedeutung sind.
Die Ergebnisse zeigen, dass sich die notwendigen Res-
sourcen und Implementierungsschritte je nach primä-
rem Ziel des Kundenbindungsprogramms unterscheiden
(vgl. Abb. 2, S. 38).
WIE MAN DAS SCHEITERN VON CRM-SYSTEMEN VERHINDERN KANNJan U. Becker, Goetz Greve und Sönke Albers
{Deutsche Zusammenfassung }
Die wichtigsten Erkenntnisse im Überblick
> Schnelle Erfolge ohne gesamtorganisatorische
Anpassungen sind unrealistisch
Derartige Erwartungen an eine CRM-Lösung sind nicht
erfüllbar. Es ist nicht ausreichend, eine Standardsoft-
ware zu kaufen und ohne Begleitmaßnahmen zu
installieren.
> Die Implementierung eines CRM-Systems
ist ein komplexer Prozess
Die technologische Implementierung alleine ist nicht
ausreichend. Alle Prozesse, die mit der CRM-Lösung
zusammenhängen, müssen analysiert und teilweise
verändert werden.
> Unterstützung durch das Top-Management hilft
Viele Bereiche des Unternehmens sind von einer CRM-
Implementierung betroffen. Die Unternehmensfüh-
rung sollte helfen, die Mitarbeiter auf breiter Front zu
involvieren und zu motivieren.
> Ziele sollten vorab klar definiert werden
Je nach Unternehmen und den jeweils spezifi schen
Kundenstämmen können primär Kundenakquisition,
Ausbau oder Festigung der Kundenbeziehungen im
Vordergrund stehen. Die primären Ziele sollten vorab
defi niert und die Systeme sowie die gesamtorganisa-
torischen Implementierungsschritte und Ressourcen
darauf abgestimmt werden. •
Schlüsselbegriffe:
Customer Relationship Management, Kundenbindung,
CRM-Einführung, CRM-Prozess, CRM-Erfolg
Den ausführlichen Artikel in englischer Sprache finden
Sie auf Seite …
… 34.
65Neue Marketingtheorien / Vol. 2, No. 2, 2010 / GfK MIR
Es macht sich bezahlt, Marketingerfolge nachzuweisen!
AUSWIRKUNGEN DER MARKETINGBILANZIERUNG AUF DEN STATUS DES MARKETINGS UND DEN UNTERNEHMENSERFOLGDon O’Sullivan und Andrew V. Abela
{Deutsche Zusammenfassung }
In vielen Unternehmen sind die Marketingbudgets unter
Druck. Die Wirtschaftskrise hat dazu geführt, dass alle
Ausgaben, die nicht unumgänglich erscheinen, mini-
miert werden. Davon ist auch der Marketingbereich be-
troffen, da häufi g kein Nachweis für die Wirksamkeit
von Maßnahmen erbracht wird. Marketingmanager ha-
ben es vielfach versäumt, die Unternehmensleitung mit
brauchbaren Belegen über Wirkung und Effi zienz von
Aktivitäten und den Beitrag des Marketings zum Unter-
nehmenswert zu versorgen. Marketing wird deshalb oft
als reiner Kostenfaktor betrachtet und sein Einfl uss in
Unternehmen ist gefährdet.
Die Autoren gehen davon aus, dass gute und nachweis-
bare Marketingergebnisse die Unternehmensergebnisse
positiv beeinfl ussen und dadurch auch ein entsprechen-
der Status der Marketingmanager in Unternehmen gesi-
chert werden kann. In einer Studie überprüfen sie die
angenommenen Zusammenhänge und können diese
weitgehend bestätigen.
Die wichtigsten Erkenntnisse im Überblick
> Investitionen in die eigenen Fähigkeiten, Marketing-
erfolge zu messen, machen sich bezahlt
Teile der vorhandenen Budgets sollten für die Mes-
sung aufgewendet werden. Die Fähigkeit, Marketing-
leistungen zu dokumentieren, hat positive Auswir-
kungen auf die Unternehmensergebnisse, auf die
Zufriedenheit der Geschäftsleitung mit dem Marke-
tingbereich und auf die Höhe der Marketingbudgets.
> Die ganze Bandbreite der Marketingaktivitäten
sollte abgedeckt werden
Auch wenn einzelne Aktivitäten besonders wichtig
sind, zeigt sich ein positiver Einfl uss auf das Unter-
nehmensergebnis nur dann, wenn alle Aktivitäten
gemessen werden. Sowohl quantitative als auch qua-
litative Messgrößen sollten verwendet werden.
> Auch für strategische Marketingziele
sind Kennzahlen wichtig
Obwohl taktische Ziele leichter messbar sind, sollten
längerfristige und strategische Aspekte nicht ausge-
klammert werden. Kennzahlen sollten auch für weni-
ger leicht fassbare, für einen nachhaltigen Erfolg des
Marketings aber wesentliche Aktivitäten entwickelt
und dokumentiert werden. •
Schlüsselbegriffe:
Marketingfunktion, Marketingfähigkeit, Marketingkenn-
zahlen, Marketingbilanzierung, Marketingdokumentation,
Unternehmenserfolg
Den ausführlichen Artikel in englischer Sprache finden
Sie auf Seite …
… 42.
66
NEXT ISSUE PREVIEW
THEMES
Preference Measurement with Conjoint Analysis
Felix Eggers and Henrik Sattler
/ / /
The Psychology of Product Assortments:
When Variety Leads to Choice Overload
Alexander Chernev and Ryan Hamilton
/ / /
How Social Networks and Opinion Leaders
Affect the Adoption of a New Product
Raghuram Iyengar, Christophe Van den Bulte,
John Eichert, Bruce West and Thomas W. Valente
/ / /
The Impact of Brand Delisting on Store
Switching and Brand Switching Intentions
Laurens N. Sloot and Peter C. Verhoef
/ / /
When Your Best Customers Become Your Worst
Enemies: Does Time Really Heal all Wounds?
Yany Grégoire, Thomas M. Tripp and Renaud Legoux
/ / /
GfK MIR / Vol. 2, No. 2, 2010 / Next Issue Preview

67 Imprint / Vol. 2, No. 2, 2010 / GfK MIR
ACKNOWLEDGEMENTS
> Werner Reinartz of Cologne University, Germany
> Hans-Willi Schroiff of Henkel KG & Co. KGaA, Germany
> Bernd Skiera of Frankfurt / Main University, Germany
> Dr. Hans Stamer, Wrigley GmbH, Germany
> Markus Voeth of Stuttgart-Hohenheim University,
Germany
Design & Art Direction
Scheufele Hesse Eigler Kommunikationsagentur GmbH
/ / /
Druckerei Eugen Seubert GmbH, Nuremberg
/ / /
Lithography
607er Druckvorlagen, Darmstadt
/ / /
Subscriptions
75 € per annum
/ / /
ISSN 1865-5866
/ / /
Whilst every effort is made to ensure that the information
in this magazine is correct, GfK e.V. does not accept
liability for any inaccuracies that GfK Marketing Intelli-
gence Review might contain. The views expressed in
this publication are not necessarily those of GfK e.V.
/ / /
Copyright
© GfK e.V. 2010. All rights reserved. No part of this pub-
lication may be reproduced in any form or by any means
without prior permission in writing from the publisher
GfK Marketing Intelligence Review© is published biannu-
ally and replaces the “GfK Jahrbuch der Absatz- und Ver-
brauchsforschung” / “Yearbook of Marketing and Con-
sumer Research”, which has been published since 1954.
It focuses on topics from Marketing Intelligence and
presents rewritten versions of already published scientifi c
articles from leading marketing journals by authors with
the highest reputation in a readable form for practitioners.
/ / /
Publisher
GfK-Nürnberg e.V. (the GfK Association)
/ / /
Editor-in-Chief
Hermann Diller
/ / /
Operating Editor
Christine Kittinger-Rosanelli
/ / /
Editor
GfK-Nürnberg e.V.
Nordwestring 101
D-90419 Nuremberg
Germany
Tel +49 911 395 22 31
Fax +49 911 395 27 15
Email: [email protected]
www.gfk-association.org
www.gfkmir.com
www.gfk.com
/ / /
Editorial Board
> Manfred Bruhn of Basel University, Switzerland
> Sunil Gupta of Harvard Business School, USA
> Alain Jolibert of Grenoble University, France
> Nicole Koschate of Erlangen-Nuremberg University,
Germany
> Srinivas Reddy of Singapore Management University,
Singapore
02
/2
01
0G
fKA
sso
cia
tio
nG
fKM
ark
etin
gIn
tell
igen
ceR
evie
w
Recommended