Theme: Building Capacity and Connectivity for the New Economy
1 Rebalancing and Resilience after the Asian Financial Crisis: Poised for Take-off
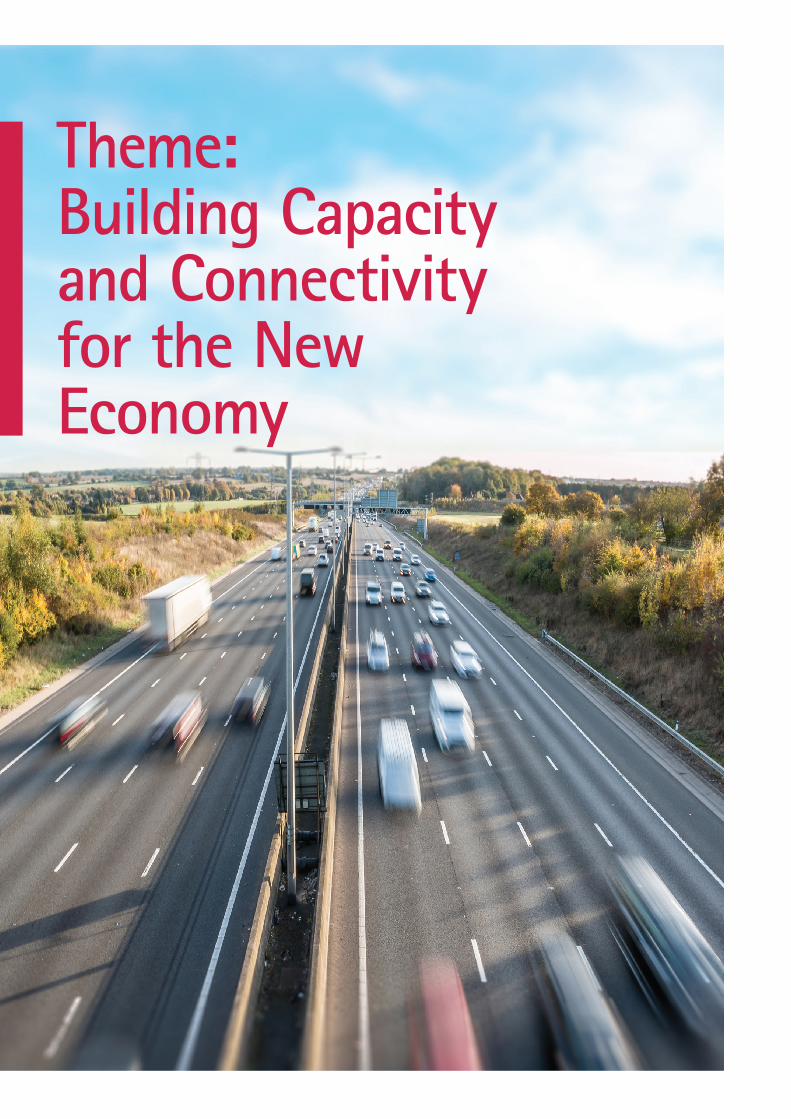
ASEAN+3 economies have come a long way since the tumultuous events of 1997. The region's combined GDP has grown from USD 6 trillion (19.4 percent of world GDP) just after the Asian Financial Crisis (AFC), to USD 23 trillion in 2018 (27.4 percent), and is projected to reach USD 48 trillion (34.8 percent) by 2035 (Figure 2.1). This chapter builds on the AREO 2017 (AMRO 2017) narrative of economic consolidation and rebalancing in the region after the AFC, and the AREO 2018 (AMRO 2018a) message of resilience and growth. The focus is on enhancing capacity and connectivity as ASEAN+3 countries embrace the “New Economy” and embark on their next growth phase.
Building capacity and connectivity will be a priority for the next phase of the region's growth trajectory. The
1 Notably, while it took centuries for the world’s economies to shift from agriculture to manufacturing, the rise of the services sector is occurring more quickly—especially in low- and middle-income countries (Buckley and Majumdar 2018).
The key to transforming the ASEAN+3 region into the “New Economy” is to enhance its capacity and connec-tivity. Three key drivers will shape capacity and connectivity priorities in the region over the short- to medi-um term, namely, the technological or Fourth Industrial Revolution (4IR), maturing populations and a rapidly growing middle class, and western protectionism, coupled with growing regional affluence and final demand. However, the region is still facing three key gaps hindering its connectivity and development: funding, foreign exchange and factors gaps. To address these gaps, the region needs to leverage on intra-ASEAN+3 investment and tap on the regional financial safety net (RFSN), while developing ASEAN+3 professional expertise, tech-nology and institutions and accelerating initiatives on regional integration and connectivity.
region as a whole has prospered in the past two decades, with the “manufacturing for exports” strategy as the main pillar in most countries. While the move up the technological frontier has been and will continue to be uneven, the transformation to services is inevitable,1 and will require a rethink of what capacity means and what connectivity is needed. One key theme that is emerging is that underinvestment—if not addressed—will impinge on growth. The investments needed to generate and sustain growth will include: new hardware and software to optimize production and distribution efficiency, a higher bar for human capital and skill sets to work with digital technology and demand for customized services, and network and connectivity for new value chains that are becoming more complex and cross-border.
Figure 2.1. Relative Importance of Region: Nominal GDP in 1998, 2018, 2035
Sources: National authorities; the World Bank; and AMRO staff calculations and projections.
1998
2018
2035ASEAN’s GDP - Value: USD 475 billion- Share of world’s GDP: 1.5%
Plus 3’s GDP- Value: USD 5,605 billion- Share of world’s GDP: 17.9%
ASEAN’s GDP - Value: USD 2,970 billion- Share of world’s GDP: 3.6%
Plus 3’s GDP - Value: USD 19,797 billion- Share of world’s GDP: 23.8%
ASEAN’s GDP - Value: USD 7,827 billion- Share of world’s GDP: 5.7%
Plus 3’s GDP- Value: USD 40,038 billion- Share of world’s GDP: 29.1%
36
ASEAN+3 Regional Economic Outlook 2019

The chapter is organized as follows. Section 2 reviews three key developments driving capacity and development priorities in the region: the technological revolution leading to deindustrialization and the intensification of services in the new economy; maturing demographics and a rapidly growing middle class; and the expanding and deepening regional integration amid rising global protectionism. Section 3 identifies and assesses the three major challenges in achieving a more integrated and connected ASEAN+3: the funding, foreign exchange, and factors gaps. Section 4 examines the scope for region-wide initiatives to address some of these constraints. Section 5 concludes with some policy recommendations. Throughout the chapter, the countries are broadly categorized into:
• High-income ASEAN+3 (“HI-A”) economies that are least constrained by the three gaps: China, Japan, Korea, Brunei, Hong Kong and Singapore. For the mature HI-A economies, the three gaps provide opportunities to leverage on the region for growth as they adapt to and embrace the new economy. China is a high middle-income economy, but the world’s largest economy in purchasing power parity terms, has a high saving rate and is technologically advanced,
Three key drivers will shape capacity and connectivity priorities in the region over the short- to medium-term. First, the technological or Fourth Industrial Revolution (4IR) has led to automation, lower capital intensity of industrial production and the rise of the services sector. The restructuring of global value chains (GVCs) under the “new economy” will redefine the infrastructure needs, within- and across national boundaries, that are critical for future growth. Second, maturing populations and a rapidly growing middle class will underline the shift to a more labor-saving, skills- and knowledge-based productive capacity, and spur intraregional demand for consumer goods and services, including enhanced living spaces and new or reconfigured services, and the need for better connectivity. Third, western protectionism, coupled with growing regional affluence and final demand, will exert both push and pull on regional integration. Over time, the pull from the region’s own demand will outweigh the push from protectionist pressure to drive the need for greater intra-regional connectivity.
and thus is in an extraordinary position to help other developing economies deal with the three gaps even as it addresses its own development challenges.
• Middle-income ASEAN (“ASEAN-4”) economies that have overcome financial and non-financial constraints to arrive at where they are today, but the three gaps remain binding (to varying extents) on economic growth: Indonesia, Malaysia, the Philippines, and Thailand. Their graduation from low-income economies and mixed experience with the vagaries of financial globalization have created a policy bias that, rightly or wrongly, makes the gaps more biting than they should be.
• Lower-income ASEAN (“CLMV”) economies with the
traditional developing country problems: investment needs exceeding what they can save for, and limitations in productive capacity (including labor, technology, institutions). Unlike earlier emerging economies, Cambodia, Laos, Myanmar, and Vietnam confront these development constraints at a time when globalization and access to foreign capital can help close the gaps, or wreak economic damage if financing is excessive.
Steering the Course on Capacity and Connectivity: Headwinds and Tailwinds
ASEAN+3 economies will need to expand both their “hard” and “soft” infrastructure. These include: physical structures to enhance transportation, telecommunication and the provision of public utilities; a sound and transparent legal and regulatory framework; IT infrastructure; and a stable financial system (Figure 2.2 and Table 2.1). Social institutions—education, healthcare and public housing services—round up a country's overall infrastructure. Regional connectivity encompasses both hard infrastructure for more efficient movements of goods and people, as well as soft infrastructure to facilitate the transmission or sharing of knowledge, services and other "intangibles" within and across countries. Regional connectivity includes institutions such as the ASEAN Economic Community (AEC), free trade agreements between ASEAN and China and with other major trading partners; ASEAN+3 Macroeconomic Research Office (AMRO), and the Chiang Mai Initiative Multilateralization (CMIM), that provide a framework for governments to collaborate on and enhance regional integration.
37
ASEAN+3 Regional Economic Outlook 2019

Figure 2.2. Hard and Soft Infrastructure and Regional Connectivity
Table 2.1. Required Infrastructure by Economic Sectors
Source: AMRO staff.
Source: AMRO staff.
Regional Connectivity
Hard Infrastructure
Roads, airports, energy, telecommunication…
Soft Infrastructure
Social (education, health) & �n/IT infrastructure, public services
Legal/regulatory framework
Sector / Economic Activity and Key Features Infrastructure Required
Advanced manufacturing: automation, dematerialization Production plants, industrial parks, power generators; frameworks for skills learning and IPR
Modern logistics and distribution: disaggregation Space for automated sorting, packing & delivery; connectivity between logistics firms, manufacturers, sales platforms and payment system operators
Flexible timely transport services: digitalization Office space, back-up sites for digital operations; sound regulatory framework, strong AI capacity
E-commerce and other online services using Big Data: disintermediation, digitalization
Office space with digital systems & cooling set-ups; logistic services
Tourism and hospitality: customized experiences Airports, ports, roads, railways, hotels, restaurants, eateries, entertainment facilities
BPO/KPO: use of AI, key nodes in different countries Office space with digital systems; language learning centers; subject content learning centers; telecommunication facilities
Urbanization + demographic shifts + rising affluence “Smart city” ecosystem for professionals and expanding middle-class population, to “work and play seamlessly”; spaces for experiencing services rather than buying goods; physical facilities and professional knowhow to provide healthcare for the aged and lifecycle wellness therapy for the affluent; luxury apartments
38
ASEAN+3 Regional Economic Outlook 2019
Embracing the New Economy and Services
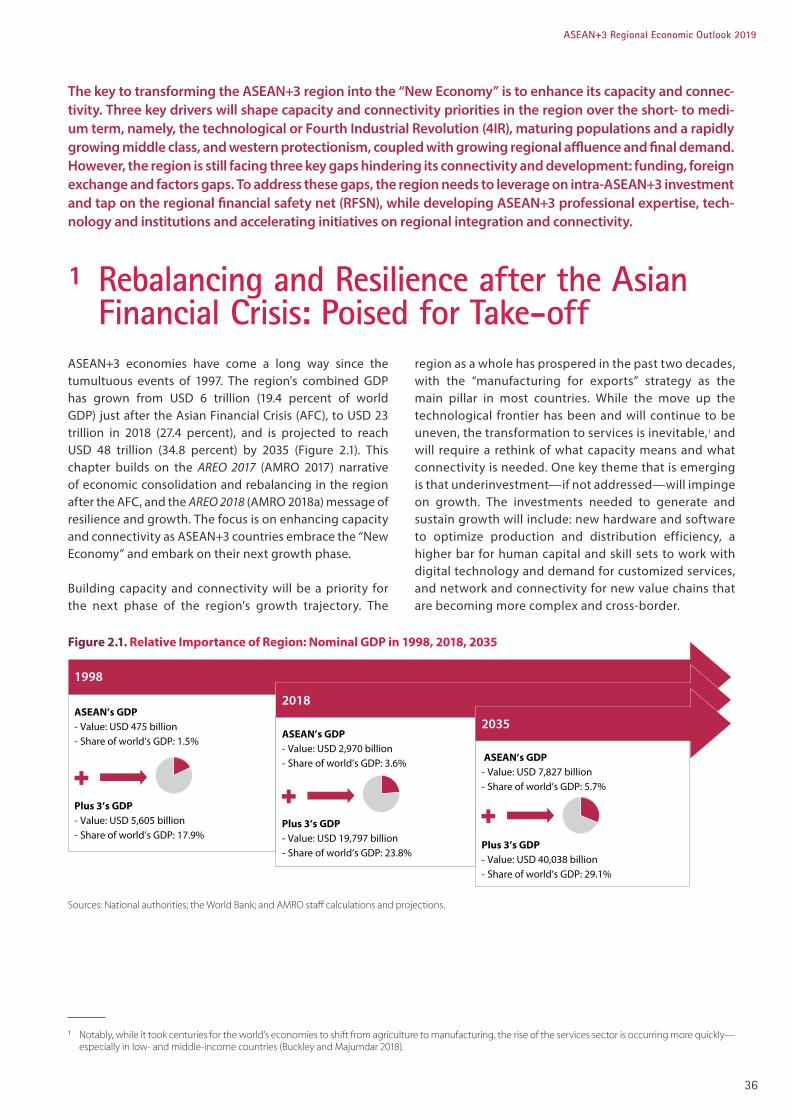
Improvements in capacity and connectivity will be a key determinant of future growth as countries move beyond the manufacturing-for-exports growth strategy and transition to the “new economy.” As supply chains evolve, digital tools and tech-savvy human capital will be needed for the production of new goods and services, and the delivery of these goods and services to consumers and businesses (Figures 2.3 and 2.4).
Services will feature prominently in the new economy as they become more sophisticated and tradable, and the lines between goods and services blur. Trade in services will require connectivity beyond physical modes of transport, as services exports – the supply and delivery of services to non-residents – an take place without the supplier leaving the country. The WTO defines four modes of services trade (WTO 2015): cross-border trade (e.g. foreign consultancy services); consumption abroad (e.g. tourism and travel, students studying in overseas universities); commercial presence (e.g. the establishment of a foreign bank branch on local premises to provide financial services to residents); and movement of natural persons (e.g. foreign professionals travelling to provide services to residents). Value chains will evolve as products become indistinguishable from or are bundled with services, for example: computers and the software needed to run them; food and dining services; payment services that accompany both goods and services. Services already account for more than half of both GDP and employment in some countries in the region and are rapidly catching up in the rest, the plus-3 countries, Hong Kong, Malaysia, the Philippines, and Singapore (Figure 2.5 and 2.6).2
Many sub-sectors within new services require higher-order skills to sustain innovation and remain competitive, so it is not surprising that economies with stronger human capital development have a larger services sector (Figure 2.7).
New economy services will require higher-order soft infrastructure and cross-country connectivity. A sound legal and regulatory framework, and efficient and secure payment systems – both within countries and across jurisdictions – are essential. There will be greater scrutiny of intellectual property rights (IPR), legal protection of business owners’ and investors’ rights, professional service standards, payment protocols, and cyber-security. Free trade agreements, investment treaties, and mutual recognition arrangements (MRAs) will have to be ironed out to expand cross-border value-chains and facilitate freer flow of quality FDIs, skilled labor and managerial professionals. For example, a sound IPR framework is vital for copyright-based industries (WIPO 2014).3 According to WIPO (2014), these new services accounted for 9.9 percent of GDP and 6.2 percent of employment in Korea, followed by China (6.4 percent of GDP and 6.5 percent of employment), Singapore (6.2 percent of GDP and 6.2 percent of employment), and an average of 4.1 percent of GDP and 5.7 percent of employment in Brunei, Indonesia, Malaysia, Philippines and Thailand.
Services in the new economy include both traditional and new revenue generators. Examples include tourism (which is undergoing major changes), as well as new services that have been made viable and thrived under the digital economy, such as e-commerce and business process outsourcing (BPO).
Figure 2.3. Schematic Illustration of “New Economy”: Producing and Delivering Goods and Services More Effectively
Source: AMRO staff.
Capital
Lighter machinery
Less raw materials
Higher - technology production plants
Disintermediation
Disaggregation
Dematerialization
Labor
Less need for “conveyor belt” workers
Higher demand for specialist skills
Emphasis on commercial value of output
Fresh consumer experiences:
New, even customized products and services
Quick, traceable and hassle-free delivery
Easy payment
2 The share of services in the new economy may also increase as statistical methodologies and measurements of GDP and trade—best suited to accounting for goods produced and transported—are updated to reflect value add under the new economy.
3 According to WIPO, copyright-based industries include software and database, press and literature, music, theatrical productions, operas, motion picture, radio and television, photography, visual and graphic arts, advertising services, and copyright collecting societies.
39
ASEAN+3 Regional Economic Outlook 2019

Figure 2.4. Services Value Chain
Figure 2.7. Relationship between Human Capital and Services Sector Development, 2017
Figure 2.5. Services’ Share of GDP Figure 2.6. Employment in Services Sector
Source: AMRO staff.
Source: World Economic Forum (2017).
Sources: National authorities; and the World Bank.Note: Japan data are as of 2016.
Sources: National authorities; and the World Bank.Note: Employment data starts from 1991. Japan data are as of 2016.
Hard infrastructure: Buildings, Equipment/machineryLogistics
Soft infrastructure: Internal knowledge and knowhowExternal outsourcing, e.g BPOInnovation and technological development
IPR protection, Regulatory frameworkService products:
E-commerceTravel & tourismEntertainment…
ID
JPSG
US
30
40
50
60
70
80
90
% of GDP
Shar
e of
Ser
vice
s Se
ctor
Human Capital Index Rank
Low
High
CN
KR
PH
VN
TH
KH
MY
MMLA BN
020406080100
0
10
20
30
40
50
60
70
80
90
100
KH MM VN LA ID MY TH PH
% of GDP
BN CN KR SG JP HK
1990 2010 2017
CLMV ASEAN-4 High Income
0
10
20
30
40
50
60
70
80
90
100
LA MM VN KH TH ID PH MY
% of Total Employment
1991 2010 2017
CLMV ASEAN-4CN KR JP BN SG HK
High Income
40
ASEAN+3 Regional Economic Outlook 2019
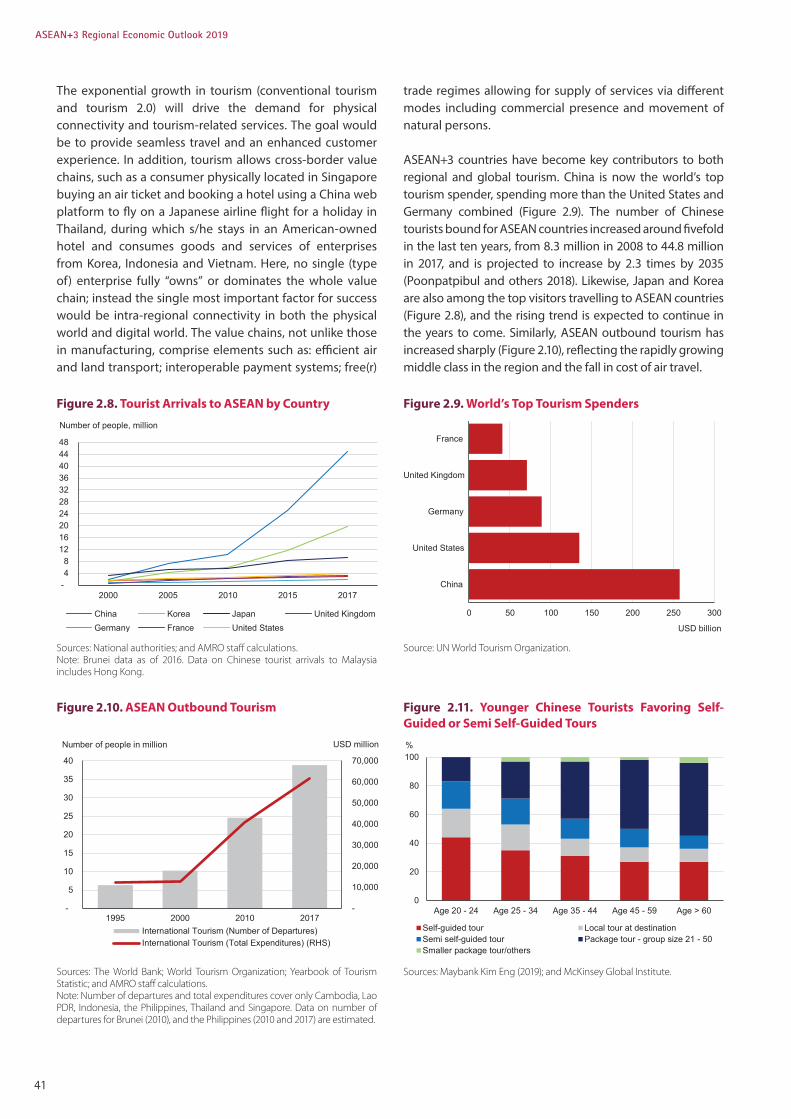
The exponential growth in tourism (conventional tourism and tourism 2.0) will drive the demand for physical connectivity and tourism-related services. The goal would be to provide seamless travel and an enhanced customer experience. In addition, tourism allows cross-border value chains, such as a consumer physically located in Singapore buying an air ticket and booking a hotel using a China web platform to fly on a Japanese airline flight for a holiday in Thailand, during which s/he stays in an American-owned hotel and consumes goods and services of enterprises from Korea, Indonesia and Vietnam. Here, no single (type of) enterprise fully “owns” or dominates the whole value chain; instead the single most important factor for success would be intra-regional connectivity in both the physical world and digital world. The value chains, not unlike those in manufacturing, comprise elements such as: efficient air and land transport; interoperable payment systems; free(r)
trade regimes allowing for supply of services via different modes including commercial presence and movement of natural persons.
ASEAN+3 countries have become key contributors to both regional and global tourism. China is now the world’s top tourism spender, spending more than the United States and Germany combined (Figure 2.9). The number of Chinese tourists bound for ASEAN countries increased around fivefold in the last ten years, from 8.3 million in 2008 to 44.8 million in 2017, and is projected to increase by 2.3 times by 2035 (Poonpatpibul and others 2018). Likewise, Japan and Korea are also among the top visitors travelling to ASEAN countries (Figure 2.8), and the rising trend is expected to continue in the years to come. Similarly, ASEAN outbound tourism has increased sharply (Figure 2.10), reflecting the rapidly growing middle class in the region and the fall in cost of air travel.
Figure 2.8. Tourist Arrivals to ASEAN by Country
Figure 2.10. ASEAN Outbound Tourism
Figure 2.9. World’s Top Tourism Spenders
Sources: National authorities; and AMRO staff calculations.Note: Brunei data as of 2016. Data on Chinese tourist arrivals to Malaysia includes Hong Kong.
Sources: The World Bank; World Tourism Organization; Yearbook of Tourism Statistic; and AMRO staff calculations.Note: Number of departures and total expenditures cover only Cambodia, Lao PDR, Indonesia, the Philippines, Thailand and Singapore. Data on number of departures for Brunei (2010), and the Philippines (2010 and 2017) are estimated.
Source: UN World Tourism Organization.
-
10,000
20,000
30,000
40,000
50,000
60,000
70,000
-
5
40
35
30
25
20
15
10
1995
USD million
2000 2010 2017International Tourism (Number of Departures)International Tourism (Total Expenditures) (RHS)
Number of people in million
Figure 2.11. Younger Chinese Tourists Favoring Self-Guided or Semi Self-Guided Tours
Sources: Maybank Kim Eng (2019); and McKinsey Global Institute.
- 4 8
12 16 20 24 28 32 36 40 44 48
2000 2005 2010 2015 2017
China
Number of people, million
Korea Japan United KingdomGermany France United States
0 50 100 150 200 250 300
China
United States
Germany
United Kingdom
France
USD billion
0
20
40
60
80
100
Age 20 - 24 Age 25 - 34 Age 35 - 44 Age 45 - 59 Age > 60
%
Local tour at destinationPackage tour - group size 21 - 50
Self-guided tourSemi self-guided tourSmaller package tour/others
41
ASEAN+3 Regional Economic Outlook 2019
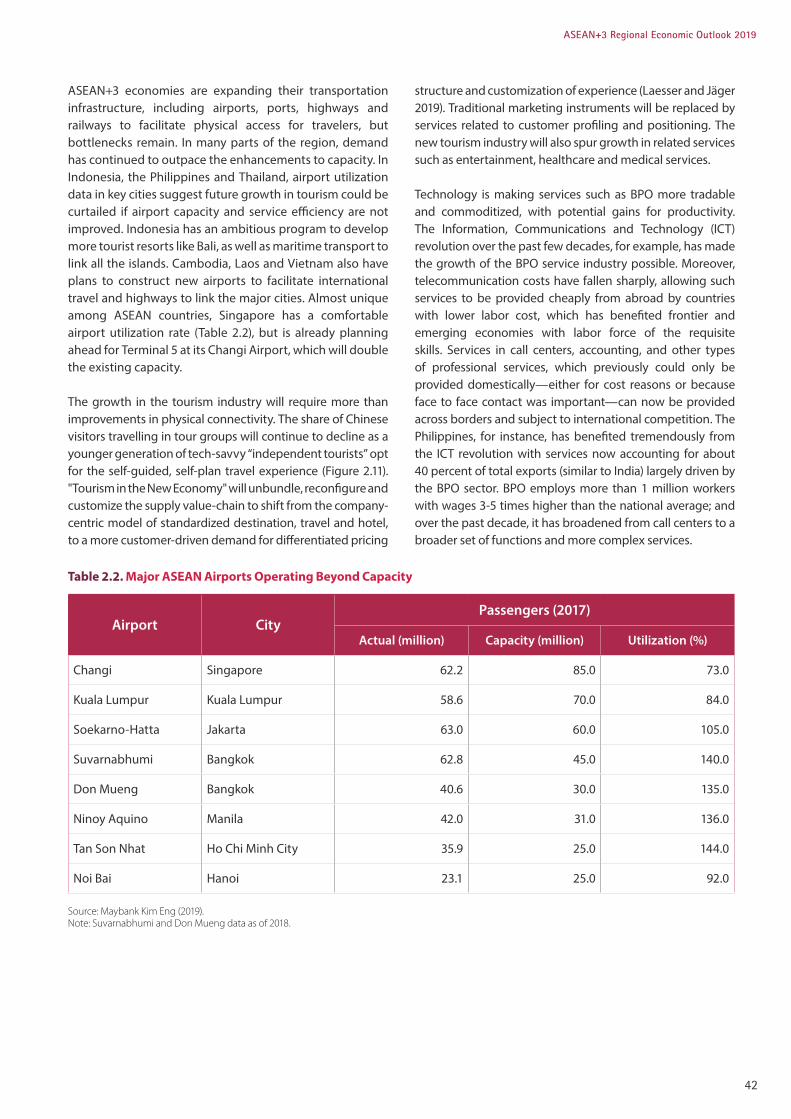
ASEAN+3 economies are expanding their transportation infrastructure, including airports, ports, highways and railways to facilitate physical access for travelers, but bottlenecks remain. In many parts of the region, demand has continued to outpace the enhancements to capacity. In Indonesia, the Philippines and Thailand, airport utilization data in key cities suggest future growth in tourism could be curtailed if airport capacity and service efficiency are not improved. Indonesia has an ambitious program to develop more tourist resorts like Bali, as well as maritime transport to link all the islands. Cambodia, Laos and Vietnam also have plans to construct new airports to facilitate international travel and highways to link the major cities. Almost unique among ASEAN countries, Singapore has a comfortable airport utilization rate (Table 2.2), but is already planning ahead for Terminal 5 at its Changi Airport, which will double the existing capacity.
The growth in the tourism industry will require more than improvements in physical connectivity. The share of Chinese visitors travelling in tour groups will continue to decline as a younger generation of tech-savvy “independent tourists” opt for the self-guided, self-plan travel experience (Figure 2.11). "Tourism in the New Economy" will unbundle, reconfigure and customize the supply value-chain to shift from the company-centric model of standardized destination, travel and hotel, to a more customer-driven demand for differentiated pricing
Table 2.2. Major ASEAN Airports Operating Beyond Capacity
Source: Maybank Kim Eng (2019).Note: Suvarnabhumi and Don Mueng data as of 2018.
structure and customization of experience (Laesser and Jäger 2019). Traditional marketing instruments will be replaced by services related to customer profiling and positioning. The new tourism industry will also spur growth in related services such as entertainment, healthcare and medical services.
Technology is making services such as BPO more tradable and commoditized, with potential gains for productivity. The Information, Communications and Technology (ICT) revolution over the past few decades, for example, has made the growth of the BPO service industry possible. Moreover, telecommunication costs have fallen sharply, allowing such services to be provided cheaply from abroad by countries with lower labor cost, which has benefited frontier and emerging economies with labor force of the requisite skills. Services in call centers, accounting, and other types of professional services, which previously could only be provided domestically—either for cost reasons or because face to face contact was important—can now be provided across borders and subject to international competition. The Philippines, for instance, has benefited tremendously from the ICT revolution with services now accounting for about 40 percent of total exports (similar to India) largely driven by the BPO sector. BPO employs more than 1 million workers with wages 3-5 times higher than the national average; and over the past decade, it has broadened from call centers to a broader set of functions and more complex services.
Airport CityPassengers (2017)
Actual (million) Capacity (million) Utilization (%)
Changi Singapore 62.2 85.0 73.0
Kuala Lumpur Kuala Lumpur 58.6 70.0 84.0
Soekarno-Hatta Jakarta 63.0 60.0 105.0
Suvarnabhumi Bangkok 62.8 45.0 140.0
Don Mueng Bangkok 40.6 30.0 135.0
Ninoy Aquino Manila 42.0 31.0 136.0
Tan Son Nhat Ho Chi Minh City 35.9 25.0 144.0
Noi Bai Hanoi 23.1 25.0 92.0
42
ASEAN+3 Regional Economic Outlook 2019

Business services like BPO are exposed to technological disruption, which can also give rise to opportunities, although new skills will be needed to provide higher VA services. While the BPO sector is still growing quite well in the Philippines, there are challenges on the horizon, with technology eroding aspects of the current value proposition. Outsourcing service providers are expected to use new technological innovations to efficiently address market demand and challenges, enhance product and service and manage talent turnover while managing the operational costs with emphasis on process automation and social management tools. New technologies are poised to eliminate many call-center jobs and transform others. Artificial intelligence (AI)-enabled software or robots can perform tasks more quickly, work around the clock, and produce high-quality output. This technology can enable and incentivize firms to move away from an outsourcing model, and cost-effectively bring these functions back inside the firms. Nevertheless, there are still new opportunities arising from the rapid technological developments. For example, the emergence of cloud technologies which support Business Process as a Service (BPaaS) is a growth opportunity, opening up the small- and medium-sized enterprise market (as it can take a more tailored approach to purchasing BPO services, with reduced fixed costs). In addition, technology also allows BPO providers to offer new services to guard against the erosion of their existing business.
E-commerce is another example of specialization in services leading to higher VA “products”. The value chain central to e-commerce can be conceptualized as the platform provider interfacing with multiple value chains: suppliers, manufacturers, distributors, transporters, retailers, and “end demand” customers. The success of an e-commerce platform depends on it having an efficient (ideally seamless) touchpoint with each group of stakeholders, so that they can in turn lower their business costs and sell their products at lower prices to a bigger market. For example, e-commerce could link suppliers more directly to manufacturers; allow retailers to display products without the need for physical
shop space, and adjust prices dynamically; and provide for consumers a widened scope of search for their ideal product or service, at prices they are comfortable with. The key components of a successful e-commerce value chain must almost certainly include artificial intelligence and digital systems which are quick, reliable, and user-intuitive; data analytics to process and disseminate a vast amount of information; fraud detection and a robust framework for IPR and consumer protection; and highly-specialized personnel to stay on top of technological requirements.
Global e-commerce has grown markedly over the last decade. It has expanded from USD 495 billion in 2005 to USD 1,915 billion in 2016, according to estimates by the McKinsey Global Institute (MGI 2017). Within the ASEAN+3 region, e-commerce has expanded rapidly as a shopping norm. China has leapfrogged other economies to become the world’s leader in e-commerce and mobile payment, accounting for 42.4 percent of global e-commerce in 2016, from just 0.6 percent in 2005. The value of its mobile payments, at USD 790 billion in 2016, is 11 times higher than that of the United States (MGI 2017). Singapore earned USD 4.1 billion in revenue from e-commerce in 2018, up from USD 3.0 billion a year earlier, and the figure is projected to double to USD 8.5 billion by 2023.4
Tourism, BPO, e-commerce and other new or restructured services will set new norms for the level of capacity in human capital and "virtual" connectivity. Countries must upgrade to these new thresholds, or exceed them, if they are to seize the opportunity for higher services-led growth. As the Philippine experience with BPO shows, technology can erode a country's existing value proposition, but it can also offer new avenues for higher VA services—with the appropriate infrastructure and upskilling of human capital (AMRO 2018a). BPO services in the Philippines are highly diverse and they have evolved from the simple call service centers to provision of analytical services for radiology and accountancy, production of videos and other multimedia services, and online gaming and its supporting services.
4 Source from Statista (https://www.statista.com/outlook/243/124/ecommerce/singapore).
43
ASEAN+3 Regional Economic Outlook 2019

Urbanization and shifting demographic trends and social aspirations will drive the demand for a widening range of increasingly sophisticated services, and higher-end real estate. An estimated 69 percent of population in the ASEAN+3 region will live in cities by 2035, up from 60.4 percent in 2015 (Figure 2.13); China’s urban population alone will account for 63.9 percent of the region total by 2035 (Figure 2.12).
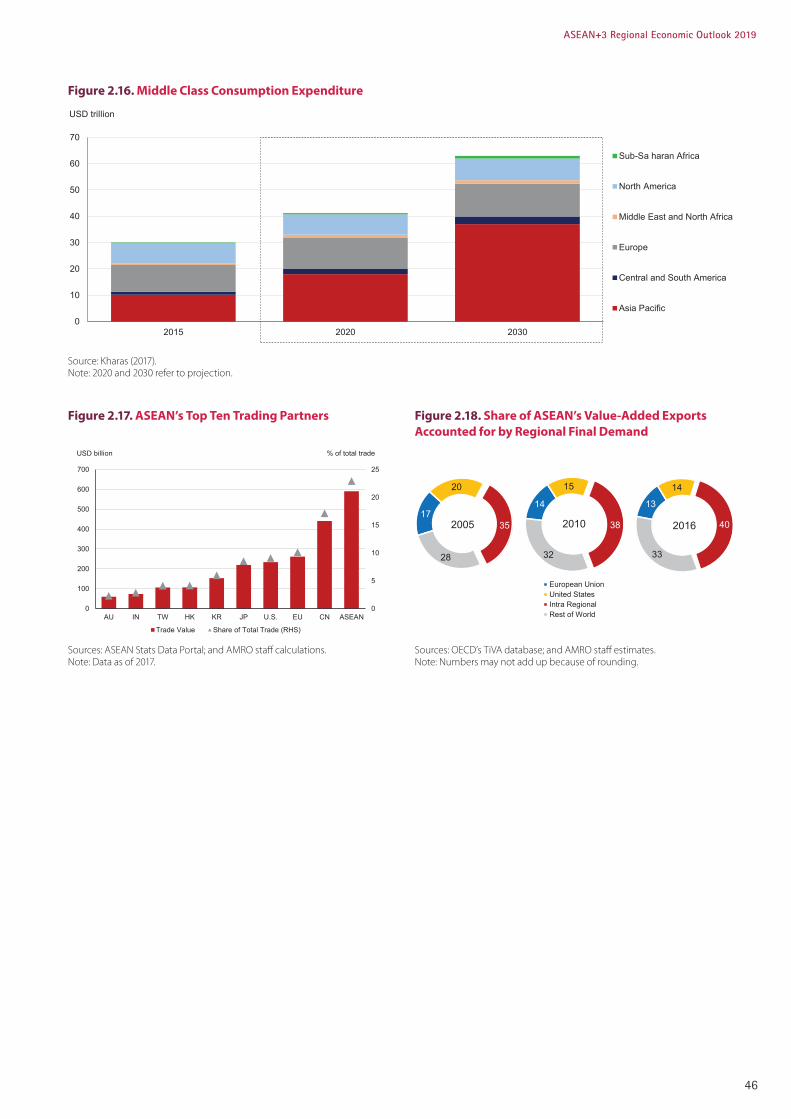
Urbanization implies the continuing need for massive investment in basic infrastructure. Examples include housing, sewerage, drainage, power generation, mass rail transit, highways, among others. However, in Asia, urbanization will also be accompanied by an expanding middle class and growing affluence. Projected spending by the middle class in the Asia Pacific will greatly exceed that of North America and Europe combined, by 2030 (Figure 2.14). Already, East Asia is the world’s largest market for automobiles, mobiles phones and other consumer durables, luxury products, and expensive wine and liquor. Consumers will be more discerning and tech savvy, and demand for goods and services will evolve: from food to dining experiences, from essential medical care to wellness therapy, and from picking basic consumer goods off the shelf to buying luxury toys on e-commerce platforms. They will seek out brand name education experiences, from the region or elsewhere, and tap into customized banking and financial advisory services wherever these may be.
Growing Cities, Maturing Populations
Figure 2.12. ASEAN+3: Urban Population
Figure 2.13. Rate of Urbanization – Percentage of Population Residing in Urban Areas
Source: World Urbanization Prospects.Note: 2035 refers to projection.
Source: World Urbanization Prospects.Note: 2035 refers to projection.
Figure 2.14. Global Middle Class Population
Source: Kharas (2017).Note: 2030 refers to projection.
0
200
400
600
800
1,000
1,200
1,400
1,600
1,800
2000 2015 2035
CN HK
Population, million
JP KR SG ID MYPH TH VN BN KH LA MM
90
80
70
60
50
40
30
20
10
0
% of total population
100
EU U.S.KH MM LA VN PH TH ID CN BN KR MY JP HK SG
2000 2015 2035
0
1
2
3
4
5
6
2000 2015 2030
Number of people, billion
Asia PacificEuropeNorth America
Central and South AmericaMiddle East and North AfricaSub-Saharan Africa
44
ASEAN+3 Regional Economic Outlook 2019

The physical and social infrastructure in the ASEAN+3 region will reflect the new demographics and changing aspirations, an example being real estate (Box 2.1). The typology of real estate needs will shift from the utilitarian (basic housing, standard public utilities, health
Protectionist trade policies spiked in the immediate aftermath of the Global Financial Crisis (GFC), and have ratcheted up in the last two years reflecting a backlash against globalization and free trade in the United States and Europe. Rising protectionist tendencies may push the ASEAN+3 economies to reconfigure GVCs and redirect demand to the region. According to AMRO staff estimates, further escalation of tariffs by the United States could shave up to one percentage point off ASEAN+3 GDP growth over the next two years.5 Economies most integrated with the global economy—Singapore, Hong Kong, Korea—will bear the brunt, but the impact on China and others will not be insignificant. However, the short term impact will fade over time as economies in the region restructure their production and trade to the more protectionist environment. Manufacturing firms in China will optimize by moving their production to countries that are not affected by the tariffs and the regional supply chains will be reconfigured. Countries will also diversify their markets and in the medium- to long-term, the region will become more integrated and less dependent on extra-regional demand.
At the same time, rapid growth in final demand by ASEAN+3 economies will exert an increasingly strong pull for production and services to reside within the region. Already, in value-added terms, exports destined for final demand in the region have grown to nearly half of total regional exports (Figure
and education) to high-end designer condominium complexes (green spaces, elderly-friendly, tech-ready, and globally connected), and from cookie-cutter housing units to customized properties with unique architecture and engineering (Figure 2.15).
Figure 2.15. Rising Middle-class and Affluence: Typology of Real Estate Needs
Sources: PwC (2013); and AMRO staff.
Survival Basic Advanced Quality of Life
Water suppliesBasic buildingsMarket stallsElectronic power
HealthcareEducationTransportationReliable electronic powerWaste management
Mass transit systemsCommercial propertyTechnologyGlobal connectivityAdvanced universities and researchDisaster risk management
Green spaceEco -livingElderly careEntertainmentLeisure and cultureAdvanced digital technologies
Growing Regional Integration amid Rising Global Protectionism
2.18). The center of gravity for globalization will continue to shift to Asia Pacific economies, as their productive capacity and consumption demand outpaces that of other regions (Figure 2.16). Projected spending attributed to the middle class in the Asia Pacific will exceed that of North America and Europe combined, by 2030.
China is already the biggest trading partner of ASEAN (after intra-ASEAN trade), with the EU and the United States a distant second and third respectively (Figure 2.17). In other words, China has anchored itself at the center of regional production networks as a result of its rapid growth, and ASEAN economies are feeding into these networks as they specialize in particular segments of the global value chains and develop their productive capacity. However, with growing affluence and the rise of the middle class, regional exports to China is increasingly driven by China’s final demand for consumption and investment and less by re-exports to the United States, Europe and other countries. Similarly, intra-regional demand within ASEAN will make an increasing contribution to exports and growth over time and lead to greater economic integration. This combination of both push and pull factors towards ASEAN+3 integration will drive the need for greater regional capacity and intra-regional connectivity. Over time, the pull from the region’s own final demand will predominate as those of the United States and Europe become smaller in relative terms.
5 Based on the Oxford Economics model.
45
ASEAN+3 Regional Economic Outlook 2019
0
5
10
15
20
25
0
100
200
300
400
500
600
700
AU IN TW HK CN ASEAN
% of total trade
Trade Value
KR JP U.S. EU
Share of Total Trade (RHS)
USD billion
17
20
35
28
2005
European UnionUnited StatesIntra RegionalRest of World
14
15
38
32
2010
13
14
40
33
2016
0
10
20
30
40
50
60
70
2015 2020 2030
USD trillion
Sub-Sa haran Africa
North America
Middle East and North Africa
Europe
Central and South America
Asia Pacific
Figure 2.16. Middle Class Consumption Expenditure
Source: Kharas (2017).Note: 2020 and 2030 refer to projection.
Figure 2.17. ASEAN’s Top Ten Trading Partners Figure 2.18. Share of ASEAN’s Value-Added Exports Accounted for by Regional Final Demand
Sources: ASEAN Stats Data Portal; and AMRO staff calculations. Note: Data as of 2017.
Sources: OECD’s TiVA database; and AMRO staff estimates.Note: Numbers may not add up because of rounding.
46
ASEAN+3 Regional Economic Outlook 2019

Meeting the Needs of the New Economy, New Demographics and Services Sector
Box 2.1.
Real estate investment is an interesting and important area which has arguably received scant attention from investors and policymakers. The common narrative is overly simplistic and negative, that affluent expatriates and the higher-income segments of local professionals bid up prices and rentals of residential and commercial properties; and that governments’ building of “green spaces” aims to enhance the attractiveness of countries as hubs to attract these talents.
In fact, “new economy” and “new demographics” needs and the rising services industries are dictating the changing nature of real estate investments in the region. They have become more focused on productive usage, more diversified in terms of design and purpose, and reflect an increasingly bottom-up approach to complement the traditional top-down macro driven approach. For example, the PwC (2019) survey findings suggest that although the broad sectors in which real estate investors are active or plan to be active in 2019 appear quite “plain vanilla” (Figure 2.1.1), efforts to meet highly-specialized needs which are rapidly emerging in the “new economy” and services industries are now driving investment decisions. These needs range from office and storage space for BPO services and e-commerce, housing facilities for the elderly and for student populations, to data centers for higher-technology economic activities and new holiday resorts for the booming travel and tourism sector (Figure 2.1.2).
There are multiple sources of value-add to be found in the coming years, including in the increasingly tradable and higher-technology services sector. Besides meeting the specialized needs of the economy and the people, there will likely be much greater emphasis on ensuring better “fit” with countries’ broader urbanization efforts and urban renewal drive than in the past. Put simply, real estate investment and building will be more customized than before:
• “Smart City” development plans are a prime example. Well thought through “smart city” initiatives—such as Singapore’s—aim to bring about coherence between multiple objectives which ought to be complementary rather than frictional. For example: (i) creating and deploying technologies, which are more advanced but also fairly easy to use, so that work productivity can increase and work-life balance can improve at the same time; (ii) investing more in building hard infrastructure (such as advanced fiber optics networks) in order to improve the quality of soft infrastructure (such as new possibilities for e-learning and more efficient seamless business operating processes for enterprises); and
(iii) enhancing socio-economic inclusiveness through targeted measures (for example, digital solutions for monitoring the health of elderly persons staying in their own homes). Notably, “smart city” pilot projects are proliferating across developing and emerging ASEAN+3 economies. The 26 pilot cities of the ASEAN Smart Cities Network (Table 2.1.1) aim to deliver a high quality of life to its 90 million citizens by 2030, and one of its focus areas is to build higher-technology, productivity-enhancing infrastructures (ASEAN 2018).
• Likewise sector-specific initiatives. For example, countries which aim to play big(ger) roles in either manufacturing or e-commerce are paying more attention to developing solutions for warehousing and logistics and “last mile” distribution facilities. The former involves substantial investment in building more high-technology infrastructures, which enable “just in time” linkages between production, storage, and transport. The latter entails investors exploring possibilities for acquiring real estate spaces which are at fairly good locations near to large concentrations of people but also underused and/or low-priced, and then converting them into nodes for delivering goods. Indeed, in the past five years, the number of such stations in the region has increased sharply, most notably—and unsurprisingly—in China (Figure 2.1.3). Alongside that, there is now increasing recognition that efforts are also needed to devise transportation solutions which maximize efficiency gains from the use of such delivery nodes. Yet another example is the Philippines’ booming BPO sector, and how that has shaped investment in real estate in the country. Sources suggest that in Metro Manila, the BPO sector took up 42 percent of office space in the first three quarters of 2018, while the Philippine Offshore Gaming Operators (POGO) took up another 25 percent. And for residential real estate, anecdotal accounts suggest that 20–40 percent of condominium units are now sold to foreigners who are now coming to the Philippines in larger numbers to live, work and play.
Sources of investment are showing signs of becoming more diversified even as cross-border flows increase rapidly. Between 2013 and 2018, FDI flows into the region’s real estate sector tripled. However, even so, cross-border investments currently constitute only about 1/5 of total investments in real estate across major hubs in ASEAN+3 region. Within cross-border investments, intra-regional investments constitute the major share although the United States and Europe are also important, especially for Korea and Japan (Figures 2.1.4–2.1.6).
47
ASEAN+3 Regional Economic Outlook 2019

Table 2.1.1. Pilot Smart Cities of the ASEAN Smart Cities Network
Source: ASEAN Secretariat.
Countries CitiesBrunei Bandar Seri Begawan
Singapore Singapore
Lao PDR Luang Prabang Vientiane
Cambodia Battambang Phnom Penh Siem Reap
Indonesia Banyuwangi DKI Jakarta Makassar
Myanmar Mandalay Nay Pyi Taw Yangon
Philippines Cebu Davao Manila
Thailand Bangkok Phuket Chonburi
Vietnam Danang Hanoi Ho Chi Minh
Malaysia Johor Bahru Kota Kinabalu Kuala Lumpur Kuching
Figure 2.1.1. Broad Sectors in which Real Estate Investors are or Plan to be Active in 2019 (Percent)
Figure 2.1.2. Niche Sectors in which Real Estate Investors are or Plan to be Active in 2019 (Percent)
Source: PwC (2019). Source: PwC (2019).
Figure 2.1.3. “Last Mile” Parcel Pick-up Stations in China
Sources: China Post; and iResearch (2018).
Home building for sales
Hotels
Multifamily/rented residential
O�ce
Retail
Industrial/distribution
Resorts
Self-storage
Senior housing
A�ordable housing
Business parks
Shared/serviced o�ces
Data centers
Student housing
0
50
100
150
200
250
300
350
0
100
200
300
400
500
600
700
800
900
2014 2015 2016 2017 2018 2019 2020
Number in thousand
Number of Parcel Pick-up Stations Growth Rate (RHS)
% yoy
48
ASEAN+3 Regional Economic Outlook 2019

1
2
3
4
5
6
7
8
9
10
USEU
ChinaHong Kong
JapanKorea
ASEAN
Figure 2.1.4. FDI into the Region’s Real Estate Sector
Figure 2.1.5. Transaction Volume by Buyer Profile Figure 2.1.6. Cross-border Capital to Selected ASEAN+3 Economies
Sources: Orbis Crossborder Investment; and AMRO staff calculations.Note: Data are based on deals with disclosed amounts, and only the ten largest inter/intra-regional flows in 2018 are reflected.
Sources: PwC (2019); and Real Capital Analytics.Note: Average of 2012 to H1 2018.
Sources: PwC (2019); and Real Capital Analytics.Note: Average of 2012 to H1 2018.
Rank Route Volume (USD Million)
1 United States to ASEAN 5,5552 EU to ASEAN 2,330
3 United States to China 2,165
4 EU to China 1,6215 Hong Kong to China 1,5506 Japan to ASEAN 1,4787 United States to Korea 1,3708 ASEAN to ASEAN 1,2329 United States to Japan 949
10 China to ASEAN 910
1/ Singapore, Japan, Hong Kong and China have led the region’s efforts in attracting foreign capital for building data centers, owing to the quality of their infrastructure (including important factors such as access to fiber optics and reliability of power supply). Meanwhile, “second wave” and “third wave” economies such as Malaysia, Indonesia and Cambodia are following suit by offering investors cheaper locations.
0
10
20
30
40
50
60
70
80
90
100
SG KR
%
HK CN
Domestic Transactions
JP
Cross-border Transactions
0
10
20
30
40
50
60
70
80
90
100
SG JP KR
%
HK CNAsia Pacific (excl. China) China Americas Europe Others
49
ASEAN+3 Regional Economic Outlook 2019
Developing economies, especially EMEs, face complex challenges in investing for the long-term. They relate to public infrastructure, human capital, and other intangibles that boost national productivity but are not themselves self-financing.
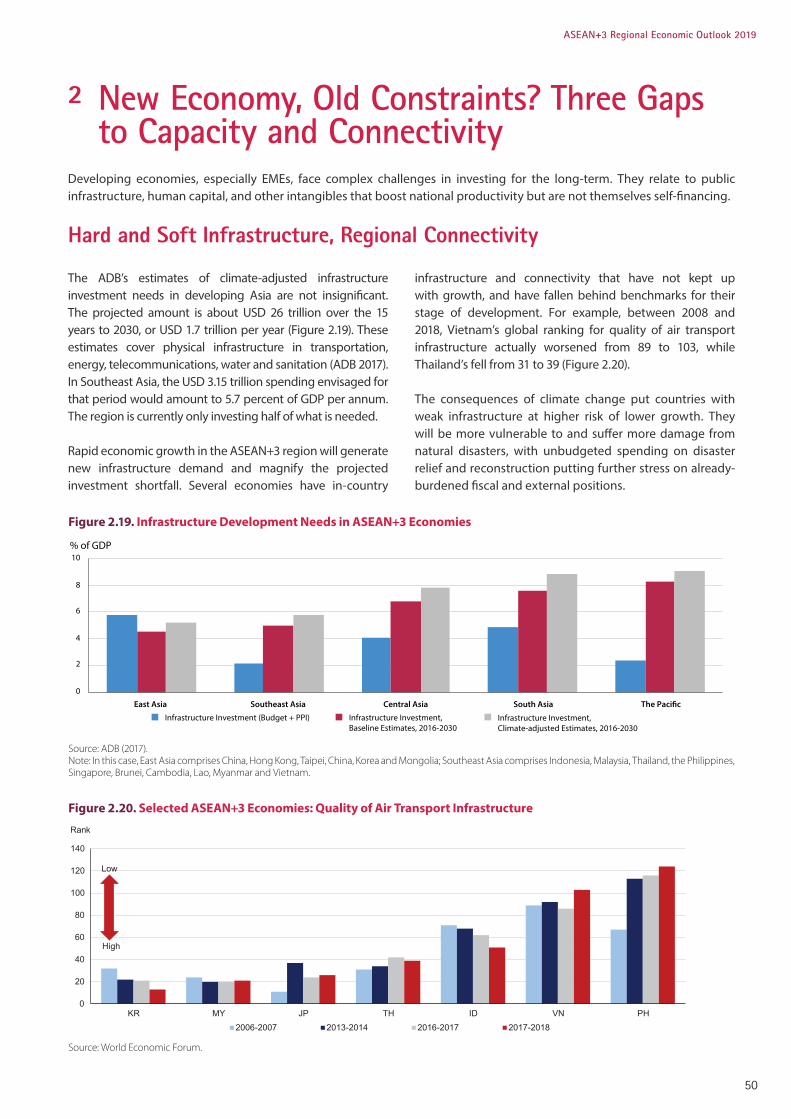
The ADB’s estimates of climate-adjusted infrastructure investment needs in developing Asia are not insignificant. The projected amount is about USD 26 trillion over the 15 years to 2030, or USD 1.7 trillion per year (Figure 2.19). These estimates cover physical infrastructure in transportation, energy, telecommunications, water and sanitation (ADB 2017). In Southeast Asia, the USD 3.15 trillion spending envisaged for that period would amount to 5.7 percent of GDP per annum. The region is currently only investing half of what is needed.
Rapid economic growth in the ASEAN+3 region will generate new infrastructure demand and magnify the projected investment shortfall. Several economies have in-country
2 New Economy, Old Constraints? Three Gaps to Capacity and Connectivity
Hard and Soft Infrastructure, Regional Connectivity
infrastructure and connectivity that have not kept up with growth, and have fallen behind benchmarks for their stage of development. For example, between 2008 and 2018, Vietnam’s global ranking for quality of air transport infrastructure actually worsened from 89 to 103, while Thailand’s fell from 31 to 39 (Figure 2.20).
The consequences of climate change put countries with weak infrastructure at higher risk of lower growth. They will be more vulnerable to and suffer more damage from natural disasters, with unbudgeted spending on disaster relief and reconstruction putting further stress on already-burdened fiscal and external positions.
Figure 2.19. Infrastructure Development Needs in ASEAN+3 Economies
Figure 2.20. Selected ASEAN+3 Economies: Quality of Air Transport Infrastructure
Source: ADB (2017).Note: In this case, East Asia comprises China, Hong Kong, Taipei, China, Korea and Mongolia; Southeast Asia comprises Indonesia, Malaysia, Thailand, the Philippines, Singapore, Brunei, Cambodia, Lao, Myanmar and Vietnam.
Source: World Economic Forum.
0
2
4
6
8
10
East Asia Southeast Asia Central Asia South Asia The Paci�c
% of GDP
Infrastructure Investment (Budget + PPI) Infrastructure Investment, Baseline Estimates, 2016-2030
Infrastructure Investment, Climate-adjusted Estimates, 2016-2030
0
20
40
60
80
100
120
140
KR MY JP TH ID VN PH
Rank
2006-2007 2013-2014 2016-2017 2017-2018
Low
High
50
ASEAN+3 Regional Economic Outlook 2019

There are three “gaps” that affect progress in infrastructure development. The most oft-cited difficulty in ensuring sufficient infrastructure investment is the financing constraint—represented by the traditional funding gap, and also what this chapter will refer to as the foreign exchange gap. The factors gap captures the non-financial constraints—the ability to carry out infrastructure projects (when financing has been secured) hinges on effective project management, availability of the requisite manpower, and the expertise and technology employed. Soft infrastructure is inextricably linked with human capital development, and impacts the country's ability to tap on the enhanced capacity for economic growth. The funding, foreign exchange, and factors gaps have affected ASEAN+3 economies differently, as a result of their different starting points and uneven progress in addressing the gaps (Khor, Poonpatpibul and Foo forthcoming).
Soft infrastructure investment is equally important for unleashing the region’s economic potential. Measurements of soft infrastructure, and investment spending needed to lift the quality of these intangibles, are harder to come by. The impact of soft infrastructure is probably most evident when it is lacking. Elements of soft infrastructure are closely connected, and intertwined with the effectiveness of hard infrastructure and productive capacity: for example, financial connectivity requires facilitative legal/regulatory framework for cross-border payments, and schools and hospitals go hand-in-hand with the education and healthcare systems respectively.
The regional public good (RPG) nature of transnational infrastructure—both hard and soft—exacerbates its underinvestment. The ADB has highlighted that cross-border (hard) infrastructure creates spillovers and externalities, and benefits that are difficult to attribute to specific countries and allocate costs to (ADB 2018a). Without collective action by countries, narrowly conceived national interests or the high costs involved will result in an undersupply of RPGs. In the area of soft infrastructure, government-level commitment to resolve cross-border issues—to facilitate services connectivity and value chains—is even more critical.
The CLMV countries, starting from a low base, have done very well in developing their economies based on the
Three Gaps, Three ASEAN+3 Clusters
traditional manufacturing-for-exports growth strategy but moving up the manufacturing value chain will be a challenge. The 4IR has pushed them further away from the technological frontier. In many sub-sectors of manufacturing, workers have difficulty upgrading to more technologically advanced methods. According to World Bank data, Cambodia’s and Myanmar’s experience with the textiles, clothing and footwear (TCF) sector is one example where high-skilled and technology-intensive manufactured goods account for very small shares of their manufactured exports (0.4 percent for Cambodia in 2016 and 6.1 percent for Myanmar in 2017).
Underinvestment in infrastructure has also started to impinge on growth in other ASEAN economies. In the Philippines, it has prompted the formulation and execution of the “Build Build Build” program, an ambitious undertaking to raise infrastructure investment by about 2 percentage points of GDP per annum between 2017 and 2022. Indonesia has been implementing an ambitious infrastructure-building program (222 National Strategic Projects and 3 programs) at an estimated cost of USD 303.1 billion or 29.1 percent of GDP over 2015–2019, although implementation could extend past 2020 (AMRO 2018b). Indeed, implementation has been constrained by macroeconomic stability considerations and has compelled the government to mobilize more fiscal revenue in order to fund the infrastructure investment program.
The Funding Gap
The funding gap is simply the shortfall between what is required for domestic investment (including public infrastructure), and what is available from domestic
savings. A funding gap can be bridged by capital inflows—in the form of foreign investment, or loans from abroad (at concessional or commercial terms). Its significance varies across the different groups of countries in the region.
The funding gap is less relevant in the HI-A economies as they have invested heavily in the past—both public and private spending—to build productive capacity. These economies have achieved levels of human capital and social development commensurate with their income status. They ran current account deficits in the early years of their development (1960s to 1980s, and up to 1990s in the case of Korea), but their national savings are now more than sufficient to fund domestic investment needs. However, there is an urgent need, even in these economies, to continue to invest in the new digital economy and adapt to an ageing population. Policymakers in these countries also grapple with the implications of technology and new value-chains for employment norms and social equity issues, and how to reconfigure public infrastructure and services for an ageing population.
51
ASEAN+3 Regional Economic Outlook 2019

0
10
20
30
40
50
60
70
80
'87
- '90
'01
- '10
'11
- '18
'19
- '23
'01
- '10
'11
- '18
'19
- '23
'84
- '88
'01
- '10
'11
- '17
'80
- '90
'01
- '10
'11
- '18
'19
- '23
'80
- '90
'01
- '10
'11
- '18
'19
- '23
'80
- '90
'01
- '10
'11
- '18
'19
- '23
'80
- '90
'01
- '10
'11
- '18
'19
- '23
'80
- '90
'01
- '10
'11
- '18
'19
- '23
'80
- '90
'01
- '10
'11
- '18
'19
- '23
'80
- '90
'01
- '10
'11
- '18
'19
- '23
'80
- '90
'01
- '10
'11
- '18
'19
- '23
'80
- '90
'01
- '10
'11
- '18
'19
- '23
'01
- '10
'11
- '18
'19
- '23
'80
- '90
'01
- '10
'11
- '18
'19
- '23
% of GDP
Gross National Savings Total Investment
KH MM
CLMV ASEAN-4 High Income
MY TH PH IDVN HK SGJP BN CNLA KR
In the CLMV economies, low domestic saving rates impose a real funding constraint on infrastructure investment (Figure 2.21 and Box 2.2). These countries run relatively large current account deficits, reflecting their dependence on funding from abroad. As projects that cannot be financed will be deferred or shelved, the actual or ex ante impact of the funding gap on capacity building in the CLMV economies could be larger than is indicated by the observed or ex post savings-investment gap.
Aid financing that CLMV economies stand to receive from MDBs (World Bank, ADB) would address only a small fraction of their respective funding gaps. The financial resources of MDBs are grossly insufficient to meet the bulk of infrastructure building needs of developing economies, and many countries are wary of contributing more of their own finances to multilateral institutions despite recognizing that infrastructure generates shared benefits. For example, the ASEAN Infrastructure Fund (AIF), established by the ADB
and ASEAN members in 2011 to provide USD 300 million a year in loans for infrastructure projects, would barely make a dent in the estimated USD 600 billion funding gap for physical connectivity up to 2030.
The nature of public infrastructure projects—its long gestation period, and uncertainty over future cash flows—makes private financing particularly challenging for developing economies. The technical considerations of infrastructure projects add to the difficulty in securing financing through the planning, building, and operational phases, given that equity investors would typically require more information and expertise (Ehlers 2014) (Table 2.3). Not surprisingly, debt rather than equity is the predominant mode for infrastructure financing; equity participation rates in public-private partnership projects have typically ranged from 25 percent to 35 percent (ADB 2017; Ehlers 2014). Banks considering loans normally ask for government guarantees even for World Bank- or ADB-led projects.
Figure 2.21. ASEAN Economies: Savings and Investment
Table 2.3. Financing and Technical Considerations: Different Phases of Infrastructure Projects
Sources: IMF; and AMRO staff calculations.Note: Brunei’s investment data are available from 1995. Cambodia’s and Myanmar’s savings and investment data are available from 1986 and 1998 respectively. Lao’s data are obtained from the World Bank (without projection).
Sources: Ehlers (2014); and AMRO staff.
Phase Economic and Contractual Issues Financial Characteristics Potential Investors
Planning
• Tight written contracts• Planning 10-30 months• Credit ratings and guarantees are
needed.
• Need to find equity investors & debt investors
• Debt investors who commit early demand high price.
• Equity sponsors need to have high level of expertise – often constructors or governments.
• Debt investors tend to be banks.
Construction• Close monitoring is required.• Effective dispute resolution
mechanism is needed.
• High-risk phase: risk of default and other adverse events
• Hard to get refinancing or additional financing if gaps are found.
Operational• Ownership structure must be clear.• Cash flow management is
important.
• Cash flows need to more than cover debt repayment.
• Bonds are natural choice for refinancing needs.
52
ASEAN+3 Regional Economic Outlook 2019

The hurdle rates (typically upward of 18 percent per annum) for equity participation by private investors would render most infrastructure projects commercially unviable. The CLMV economies have been able to access long-term financing at concessional (or partially concessional) terms from MDBs and donor countries, especially China and Japan—including under China's Belt and Road Initiative (BRI) and Japan's Partnership for Quality Infrastructure (PQI). However, while MDB and donor financing usually comes with below-market interest rates—including the 3–6 percent associated with the BRI projects, or Japanese aid financing at 0–3 percent—there is no certainty that the debt repayments can be recovered from actual revenue streams, even if the projected economic returns justify the investment.
Some CLMV governments have been conservative in taking on additional foreign debt to finance infrastructure projects. They are mindful of the risks, and aware of the limitations imposed by their own economies' absorptive capacity (elaborated later in the "factors" gap) (Figures 2.22 and 2.23):
• Cambodia: Gross long-term external debt at 45.3 percent of GDP in 2017 (of which external public debt accounted for 28.9 percent);6 currently the "poster country" of foreign infrastructure financing.
• Lao PDR: Gross external debt at 84.9 percent of GDP (of which external public debt accounted for 49.5 percent), and some of this debt are bonds issued in the Thai capital market; much of the funding went into hydro dam projects with long (10–20 years) back-loaded revenue stream.
• Myanmar: External public debt accounted for 15.5 percent of GDP in 2017.
• Vietnam: Public debt close to ceiling of 65 percent of GDP and gross external debt at 46.6 percent of GDP (of which external public debt accounted for 20.7 percent); graduated to middle income status and losing access to concessional loans.
The ASEAN-4 economies generally save more than they invest and, prima facie, do not have a funding gap. Current account balances over the last 20 years in these countries showed an overall surplus, averaging 3.4 percent of GDP. The nature of the financing constraint faced by this group of countries is referred to in this chapter as the “foreign exchange gap.”
Figure 2.22. Gross External Debt in CLMV Figure 2.23. Total Government Debt in CLMV
Sources: National authorities; the World Bank; ARTEMIS; and AMRO staff calculations.Note: Cambodia’s external debt in this chart refers to long-term external debt only, as total external debt does not have detailed breakdown. Each country’s period inconsistency is due to data constraint.
Sources: National authorities; the World Bank; ARTEMIS; and AMRO staff calculations.Note: Cambodia’s external debt in this chart refers to total external debt. Each country’s period inconsistency is due to data constraint.
6 Given data constraints (lack of detailed breakdown of total external debt), data from the World Bank’s International Debt Statistics are used in Figure 2.22. However, according to the authorities' data, external public debt was 30.2 percent of GDP in nominal terms or 21.4 percent of GDP in present value terms in 2017".
0
20
40
60
80
100
'15 '16 '17 '10 '15 '17 '08 '10 '15 '17 '09 '10 '15 '17
% of GDP
Gross External Public Debt Gross External Private Debt
KHVNMM LA
0
20
40
60
80
100
'15 '16 '17 '10 '15 '17 '08 '10 '15 '17
% of GDP
External Debt
'09 '10 '15 '17
Domestic Debt
VN KH LAMM
53
ASEAN+3 Regional Economic Outlook 2019
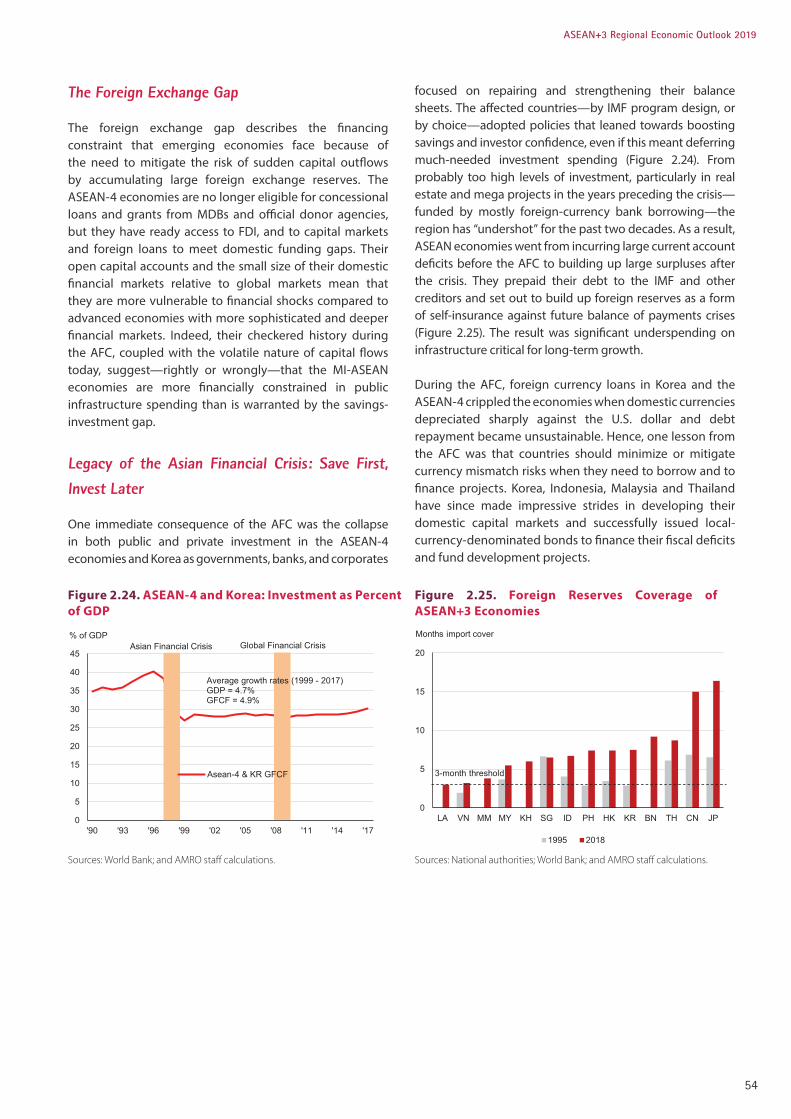
Figure 2.24. ASEAN-4 and Korea: Investment as Percent of GDP
Figure 2.25. Foreign Reserves Coverage of ASEAN+3 Economies
Sources: World Bank; and AMRO staff calculations. Sources: National authorities; World Bank; and AMRO staff calculations.
The Foreign Exchange Gap
The foreign exchange gap describes the financing constraint that emerging economies face because of the need to mitigate the risk of sudden capital outflows by accumulating large foreign exchange reserves. The ASEAN-4 economies are no longer eligible for concessional loans and grants from MDBs and official donor agencies, but they have ready access to FDI, and to capital markets and foreign loans to meet domestic funding gaps. Their open capital accounts and the small size of their domestic financial markets relative to global markets mean that they are more vulnerable to financial shocks compared to advanced economies with more sophisticated and deeper financial markets. Indeed, their checkered history during the AFC, coupled with the volatile nature of capital flows today, suggest—rightly or wrongly—that the MI-ASEAN economies are more financially constrained in public infrastructure spending than is warranted by the savings-investment gap.
Legacy of the Asian Financial Crisis: Save First,
Invest Later
One immediate consequence of the AFC was the collapse in both public and private investment in the ASEAN-4 economies and Korea as governments, banks, and corporates
focused on repairing and strengthening their balance sheets. The affected countries—by IMF program design, or by choice—adopted policies that leaned towards boosting savings and investor confidence, even if this meant deferring much-needed investment spending (Figure 2.24). From probably too high levels of investment, particularly in real estate and mega projects in the years preceding the crisis—funded by mostly foreign-currency bank borrowing—the region has “undershot” for the past two decades. As a result, ASEAN economies went from incurring large current account deficits before the AFC to building up large surpluses after the crisis. They prepaid their debt to the IMF and other creditors and set out to build up foreign reserves as a form of self-insurance against future balance of payments crises (Figure 2.25). The result was significant underspending on infrastructure critical for long-term growth.
During the AFC, foreign currency loans in Korea and the ASEAN-4 crippled the economies when domestic currencies depreciated sharply against the U.S. dollar and debt repayment became unsustainable. Hence, one lesson from the AFC was that countries should minimize or mitigate currency mismatch risks when they need to borrow and to finance projects. Korea, Indonesia, Malaysia and Thailand have since made impressive strides in developing their domestic capital markets and successfully issued local-currency-denominated bonds to finance their fiscal deficits and fund development projects.
0
5
10
15
20
25
30
35
40
45
'90 '93 '96 '99 '02 '05 '08 '11 '14 '17
% of GDPAsian Financial Crisis Global Financial Crisis
GDP = 4.7%Average growth rates (1999 - 2017)
GFCF = 4.9%
Asean-4 & KR GFCF
0
5
10
15
20
Months import cover
LA VN MM MY KH SG ID PH HK KR BN TH CN JP
1995 2018
3-month threshold
54
ASEAN+3 Regional Economic Outlook 2019

-20
-15
-10
-5
0
5
10
15
20
25
'95 '96 '97 '98 '99 '00 '01 '02 '03 '04 '05 '06 '07 '08 09 10 '11 '12 '13 '14 '15 '16 '17 '18 '19
Equities Bonds
USD billion
Taper Tantrum(May 2013)
Global Financial Crisis(Aug 2007-Sep 2008)
U.S. Presidential Election(Nov 2016)
Asian Financial Crisis(Jul 1997-Dec 1998)
Figure 2.26. Capital Flows to ASEAN-5 and Korea
Sources: National authorities; and AMRO staff calculations.
External Risks
However, the liquidity, maturity mismatch, and rollover risks inherent in project financing cannot be fully resolved. The risks are inherent as long as creditors and investors have the option to redeem or not roll-over the principal before the project becomes financially viable and able to service the debt. While these risks are present in any credit intermediation, including domestic bank lending, they are accentuated if the bonds are held by foreign portfolio investors who are out to maximize risk-adjusted returns. Not surprisingly, ASEAN-4 economies have focused on building up foreign reserves, beyond what is required for import cover. The question remains: how much is enough? Until countries can resolve financial stability concerns associated with foreign capital inflows, the answer may be that it is never enough.
The foreign exchange gap captures the tension between growth and stability that has persisted in the ASEAN-4 economies for the last 20 years, after the AFC. In other words, these countries saved—and continue to save—and run stronger current account balances than might be optimal from an investment and growth perspective. Commenting on the policy bias that equates economic stability with savings and current account surpluses, and war chests of foreign reserves, some ASEAN authorities have expressed exasperation at the “unfairness” of the market in demanding such a high standard of financial prudence. Others, who recall the painful post-AFC years of rebuilding confidence through fiscal prudence and shoring up foreign reserves, have echoed similar sentiments.
More broadly, the global financial environment in the past two decades has been unfavorable for long-term investments. The rapid growth of the asset management industry, and greater
volatility in investor sentiment and global capital flows, mean that emerging market and small open economies are highly vulnerable to the risk-on/risk-off behavior of portfolio investors who herd in and out of financial markets. Global financial markets have been quick to punish individual countries or entire (sub-) regions for not adhering to strict macroeconomic and financial policies by halting or reversing capital flows. Even a heightening in general risk aversion globally is often enough to trigger “sudden stops” in capital flows to emerging market economies, including those in the ASEAN region. The Taper Tantrum of 2013, the U.S. presidential election of 2016, and the global market sell-off of 2018 are cases in point. Each time, emerging market regions, including ASEAN, have experienced substantial shifts in capital flows (Figure 2.26).
In the CLMV economies, access to long-term project financing earmarked for infrastructure projects mitigates, for now, the foreign exchange gap. However, as they graduate from low-income to middle-income status, the lessons learned the hard way by their ASEAN-4 neighbors will not go unheeded, and may explain why the CLMV are even now taking a cautious approach to assuming additional debt.
The 2018 Report of the G20 Eminent Persons Group (EPG) recognizes that excessive volatility in financial markets “can lead to responses that hurt growth, both nationally and regionally” (Global Financial Governance 2018). Urgent reforms of the global financial architecture are needed for the developing world to fully utilize domestic financial markets and international capital flows to finance investments and growth. Until and unless an effective global financial safety net is in place, the incentive remains for countries to avoid or reduce current account deficits even when they are needed for investment and growth, and to "self-insure" by accumulating ever more reserves.
55
ASEAN+3 Regional Economic Outlook 2019
The Factors Gap
Financing is not the only constraint to building capacity and connectivity. The “factors gap” in the CLMV economies, and the ASEAN-4 economies to varying extent, discourages infrastructure investments in general, and impede the effective and timely implementation of infrastructure projects.
The G20 EPG Report has identified governance capacity and human capital as key constraints that must be addressed for a stronger investment climate. Leakages through waste and corruption undermine domestic resources and foreign funding that can be channeled to infrastructure projects. Project management without due regard to labor and skills requirements will run into difficulties. A factors gap could exacerbate the funding and foreign exchange gaps that host governments already face, if unbudgeted spending needs to be set aside to import workers and professionals, or to pay for foreign technology and equipment.
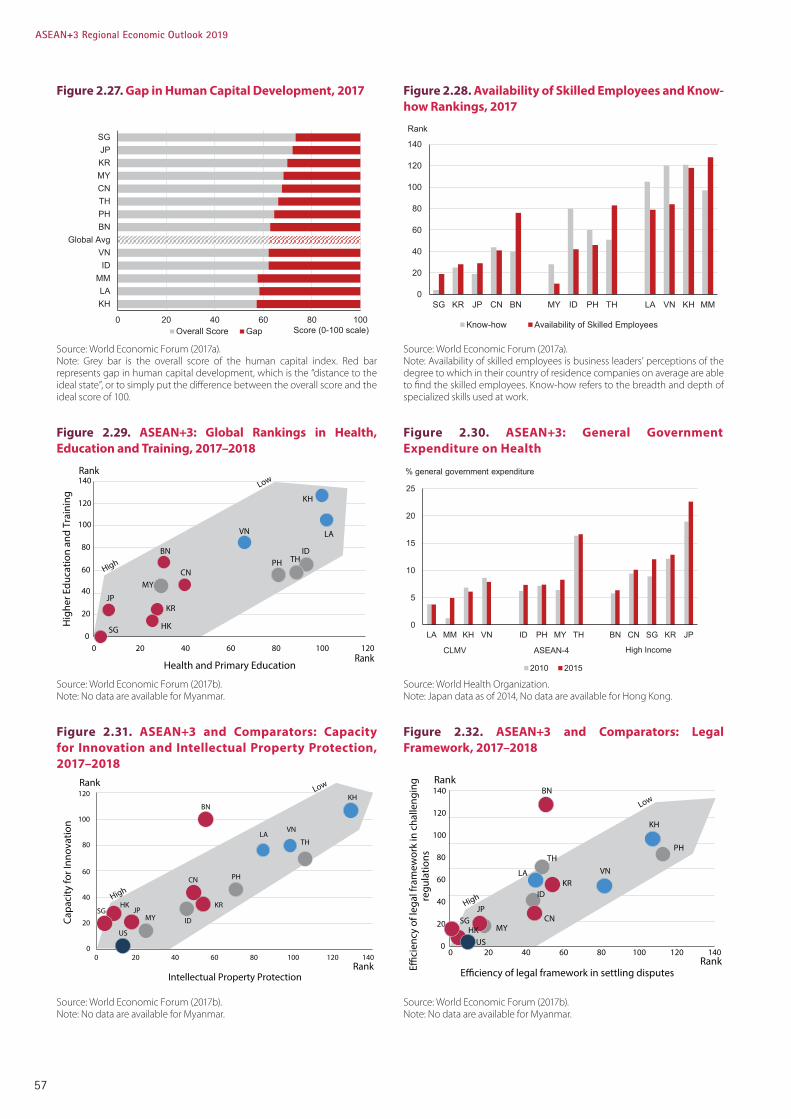
The gap in skilled labor is especially stark in the CLMV economies, which rank below the global-average in the World Economic Forum’s human capital development index (Figure 2.27). Particularly in Cambodia, Laos and Myanmar, low healthcare spending and chronic underinvestment in education, and the limited availability of skilled labor (Figures 2.28–2.30), are now impinging on these countries’ capacity for further growth catch-up and development. In response, efforts are now underway to ramp up investment in these areas significantly. In Cambodia for example, total expenditure on the social sector reached around 7.0 percent of GDP in 2018, up from 4.6 percent in 2013. Current expenditure on education increased from 1.6 percent of GDP in 2013 to 2.7 percent of GDP in 2017, and if capital expenditure is included, public spending
on education sector increased to 3.1 percent of GDP.7 In contrast, Hong Kong, Korea, Japan, and Singapore have systematically upgraded and raised the quality of education throughout the past few decades.
The overall regulatory framework, and the legal protection of IPR and owners' and investors' rights need to be strengthened for private debt or equity financing to take hold (Figure 2.31 and 2.32). This is the case not only in the CLMV, but also in ASEAN-4 economies that must look to private sector participation or partnership to meet funding and foreign exchange gaps. Recognizing the importance of IPR, ASEAN member states have adopted the ASEAN IPR Action Plan 2016-2025. It builds on the previous IPR action plans (2004 – 2010 and 2011 – 20158), and has four strategic goals: (1) strengthening IPR Offices and building IPR infrastructures in the region; (2) developing regional IPR platforms and infrastructures; (3) developing an expanded and inclusive ASEAN IPR Ecosystem; and (4) enhancing regional mechanisms to promote asset creation and commercialization, particularly geographical indications and traditional knowledge.
Even after projects are completed, realizing the growth dividends from new infrastructure will not be straightforward if the factors gap remains unresolved. Labor, capital and expertise are required to maintain and run the facilities, and regional agreements and regulatory frameworks are needed for new services such as fin-tech and e-commerce to operate smoothly and expand, especially across borders. The ultimate success of infrastructure spending depends on the demand for the enhanced capacity, and the robustness of the project feasibility study, i.e. whether the cost estimates were adhered to and the revenue projections realistic.
7 Cambodia has also launched the third health strategic plan 2016-2020 to provide quality, effective and equitable health services, and piloted the Skill Development Fund to improve the quality of skill training.
8 According to a speech delivered by the Chief Executive of the Intellectual Property Office of Singapore as of March 21, 2016, more than 80 percent of the 108 deliverables (or 28 initiatives) in the ASEAN IPR Action Plan 2011-2015 have been completed. Additional updates from the Seminar on Trademarks and Madrid Protocol held in May 2015 indicated that Cambodia and the Philippines have become members of the Madrid Protocol, following Singapore and Vietnam – the only ASEAN countries which were members of the Protocol before 2011. Accession to the Madrid Protocol is one of the initiatives under the ASEAN IPR Action Plan 2011 – 2015.
56
ASEAN+3 Regional Economic Outlook 2019
0
20
40
60
80
100
120
140
SG KR JP CN BN MY ID PH TH LA VN KH MM
Rank
Know-how Availability of Skilled Employees
Figure 2.27. Gap in Human Capital Development, 2017
Figure 2.29. ASEAN+3: Global Rankings in Health, Education and Training, 2017–2018
Figure 2.31. ASEAN+3 and Comparators: Capacity for Innovation and Intellectual Property Protection, 2017–2018
Figure 2.28. Availability of Skilled Employees and Know-how Rankings, 2017
Figure 2.30. ASEAN+3: General Government Expenditure on Health
Figure 2.32. ASEAN+3 and Comparators: Legal Framework, 2017–2018
Source: World Economic Forum (2017a).Note: Grey bar is the overall score of the human capital index. Red bar represents gap in human capital development, which is the “distance to the ideal state”, or to simply put the difference between the overall score and the ideal score of 100.
Source: World Economic Forum (2017b).Note: No data are available for Myanmar.
Source: World Economic Forum (2017b).Note: No data are available for Myanmar.
Source: World Economic Forum (2017a).Note: Availability of skilled employees is business leaders’ perceptions of the degree to which in their country of residence companies on average are able to find the skilled employees. Know-how refers to the breadth and depth of specialized skills used at work.
Source: World Health Organization.Note: Japan data as of 2014, No data are available for Hong Kong.
Source: World Economic Forum (2017b).Note: No data are available for Myanmar.
0 20 40 60 80 100
KHLA
MMID
VNGlobal Avg
BNPHTHCNMYKRJPSG
Score (0-100 scale)Overall Score Gap
JP
ID
VN
KR
PHBN
Low
High
KH
CNMY
HKSG
LA
TH
0
20
40
60
80
100
120
140
0 20 40 60 80 100 120
Hig
her E
duca
tion
and
Trai
ning
Health and Primary Education
Rank
Rank
BNKH
CN
ID
HKJP
KR
LA
MY
PH
SG
TH
VN
US
0
20
40
60
80
100
120
0 20 40 60 80 100 120 140
Capa
city
for I
nnov
atio
n
Intellectual Property Protection
Rank
Rank
Low
High
JP
ID
VNKR
PH
BN
KH
CNMY
US
SG
LA
TH
0
20
40
60
80
100
120
140
0 20 40 60 80 100 120 140
E�ci
ency
of l
egal
fram
ewor
k in
cha
lleng
ing
regu
latio
ns
E�ciency of legal framework in settling disputes
Rank
Rank
HK
Low
High
0
5
% general government expenditure
25
20
15
10
LA MM KH VN ID PH MY TH BN CN SG KR JP
2010 2015
CLMV ASEAN-4 High Income
57
ASEAN+3 Regional Economic Outlook 2019

Infrastructure Investments and Implications for Growth in the RegionBox 2.2.
Infrastructure investments have played a critical role in enabling countries in the region to achieve high levels of growth over the past several decades. Increases in hard infrastructure investments, such as roads, railways and utilities, which entail additional government spending, directly improve GDP growth in the near-term. Over the longer-term, the infrastructure projects would also indirectly boost productivity by reducing commuting and transaction costs while enhancing the growth potential of the overall economy. In ASEAN, large infrastructure investments in the 1970s and 1980s—in tandem with sustained FDI inflows from Japanese firms and multinational corporations from the United States and Europe—helped catalyze their manufacturing-for-exports strategy, which has underpinned growth and development (AMRO 2019). The resulting knowledge spillovers and productivity-enhancing attributes of FDI would have also expanded the capabilities of the workforce and indigenous firms, further increasing the growth potential of these countries.
However, significant gaps in infrastructure spending remain, particularly among the developing economies. As a result of foreign reserves accumulation in the aftermath of the AFC, investment in infrastructure was cut and the resulting underinvestment has likely constrained the region’s growth potential (AMRO 2019). A recent study by Oxford Economics (2017) into 7 sectors spanning 50 countries out to 2040 shows that the infrastructure spending needs in the region are significant but vary
across countries. The infrastructure spending gap per year over the next two decades is large for the developing countries such as Cambodia and Vietnam, but is relatively small for high-income countries, such as Korea, Japan and Singapore, which have benefited from sustained and ongoing high-quality spending (Figure 2.2.1). Meanwhile, the infrastructure needs for countries such as China and the ASEAN-4, which average 2 percent of GDP per year, mostly reflect the required spending on new railway and highway networks connecting urban centers both within and across border (AMRO 2019).
Over the longer-term, AMRO staff simulations show that regional countries’ GDP would increase if countries’ infrastructure spending gaps were addressed. Using the Global Trade Analysis Project model, AMRO staff simulations show that the total direct and indirect contributions from additional infrastructure investments to GDP would be significant assuming countries’ infrastructure spending gaps were to be fully met. For example, the boost to GDP for Cambodia and Vietnam would be the largest among countries in the region, increasing by 5.0 and 2.1 above the current GDP baseline, respectively, over the longer-term. Meanwhile, the additional boost to growth for China and the ASEAN-4 would be smaller, ranging from 0.9–1.4 percent. Hence, concerted effort is needed to address these existing infrastructure gaps, including by leveraging on the financing options and expertise available in the region.
Figure 2.2.1. Infrastructure Spending in 2015 and Gap per Year
Figure 2.2.2. Simulated Increase in GDP above the Baseline
Sources: Oxford Economics; Global Trade Analysis Project; and AMRO staff estimates.
0
5
10
15
20
25
MYKH VN CN PH
Infrastructure Spending, 2015
% of GDP
ID TH KR JP SG
Infrastructure Spending Gap per Year
0
1
2
3
4
5
KH JPVN CN PH MY ID TH KR SG
Estimated GDP Increase from Infrastructure Spending
% yoy
58
ASEAN+3 Regional Economic Outlook 2019

The G20 EPG Report puts forward two key strategies to address the funding gaps for infrastructure investments in emerging economies. First, domestic savings provide the basis for long-term investments and financial resilience, and countries can improve domestic resource mobilization by strengthening public finance and tax collection. Second, private investment on a much larger scale is needed for infrastructure development. Given concerns about debt sustainability, greater emphasis should be given to risk mitigation and drawing on equity financing.
3 Bridging the Gaps: ASEAN+3 for ASEAN+3While there is some room at the margin to improve tax efficiency and increase domestic savings in the ASEAN+3, the greater challenge is how to effectively channel more funding into infrastructure projects. In the CLMV economies, the factors gap puts a constraint on their ability to translate concessional funding—when made available—to viable capacity-enhancing infrastructure projects. The ASEAN-4 economies have no funding gap per se, as they either have surplus savings or are able to borrow the requisite funds. However, they are constrained from directing more savings to long-term investments owing to very real concerns about the financial stability risks posed by potentially flighty capital inflows.
There is scope for more long-term investments from ASEAN+3 economies to enhance capacity and connectivity across the region. While there are pockets of funding gaps in the region, ASEAN+3 economies as a group ran a current account surplus averaging 2.3 percent of GDP over the 2011–2018 period. In the past, the region had been criticized for investing its surplus savings, in the form of reserves, in low-yielding financial assets in the United States and Europe, which are then channeled back to Asia by portfolio managers or investors in search of higher yields. Indeed, the HI-A economies place a substantial portion of their excess savings in portfolio investment in advanced economies, but they have also been investing in the region. China's BRI (Box 2.3), and Japan's PQI have helped to mobilize public and private resources for infrastructure projects in the region. Japanese development institutions, in particular, have provided funding for infrastructure investments in the regional countries for years, especially in Vietnam, and Myanmar is a major recipient of Japanese Official Development Assistance (ODA) (Figure 2.33). China has traditionally invested in natural resource and energy industries but more recently, has been investing in manufacturing and infrastructure projects (Figure 2.35).
The ASEAN+3 emerging market economies should continue to embrace the advanced countries which have remained the main drivers of investment in technology transfers and transition to the “new economy” for the region, especially the ASEAN-8 economies. It would be unwise
Leveraging on Intra-ASEAN+3 Investment to Meet Funding Gaps
for the ASEAN+3 region to respond to trade and technology protectionism by enacting its own barriers to cross-border flows of economic and financial activity. Over the past five years, during which the 4IR has gathered momentum globally and the ASEAN+3 region had made significant progress in technological advancements, the United States and Europe have accounted for large shares of FDI into “new economy” sectors in the ASEAN-8 economies (Figure 2.36). In fact, the United States has substantially increased its overall FDI in ASEAN over the past decade (Figure 2.37). Within the region, Japan and Korea have been anchoring the bulk of FDI into these sectors, whereas China’s outward direct investment to ASEAN has gone primarily to traditional “old economy” sectors and to infrastructure in CLMV economies (notably Cambodia and Lao PDR) (Figure 2.38). Much of Korea’s substantial greenfield investments in the ASEAN-8 economies (Figure 2.39) have flowed to advanced manufacturing in Vietnam, while the United States accounted for half of all FDI in modern services in ASEAN in 2018 (Figure 2.36), with much of it going to Singapore, whereas its interest in traditional services in ASEAN is much more modest (Figure 2.40).
In addition to welcoming FDI from the United States and Europe and finding ways to keep flows coming from Japan and Korea, ASEAN economies should leverage more on the intermediation role played by regional hubs such as Singapore. On a direct basis, about 20 percent of the FDI to ASEAN economies has been from Singapore. It reflects, to a large extent, the preference of American and European firms to channel their investments via Singapore to ASEAN.
59
ASEAN+3 Regional Economic Outlook 2019

Figure 2.33. Japanese Official Development Assistance
Figure 2.34. China’s Infrastructure Investment by Region
Figure 2.36. Greenfield FDI into “New Economy” Sectors in ASEAN-8 Economies, by Source Country and Region
Figure 2.35. China’s Infrastructure Investment in ASEAN by Sector
Sources: National authorities; and AMRO staff calculations. Note: ODA includes loan aid, grant aid and technical cooperation. Thailand data are as of 2015 and 2016; Lao data are as of 2013 and 2015.
Advanced Manufacturing Modern Services
Sources: American Heritage Foundation; and AMRO staff calculations.Note: Immediate counterparty. Data for cumulative flows.
Sources: Orbis Crossborder Investment; and AMRO staff calculations.
Sources: American Heritage Foundation; and AMRO staff calculations. Note: Immediate counterparty. Data for cumulative flows from 2011 to H1 2018.
Sources: Orbis Crossborder Investment; and AMRO staff calculations.
-
1,000
2,000
3,000
4,000
5,000
6,000
2013 2016
USD million
TH MM VN ID PH KH LA
0
2
4
6
8
10
12
0
5
10
15
20
25
2011 2012 2013 2014 2015 2016 2017
Sub-Saharan AfricaEuropeOther
ASEANWest AsiaSouth AmericaShare of ASEAN (RHS)
%USD billion
0 10 20 30 40 50
VN
KH
SG
TH
ID
MY
LA
Construction Hydro Rail Telecom Utilities
USD Billion
-
10
20
30
40
50
60
70
80
0
5
10
15
20
25
30
35
40
2013 2014 2015 2016 2017 2018
CNASEAN HK JP KR U.S. EU Others
%USD billion
Share of ASEAN+3 in Total Investment (RHS)
-
10
20
30
40
50
60
70
80
0
1
2
3
4
5
6
2013 2014 2015 2016 2017 2018
CNASEAN HK JP KR U.S. EU Others
%USD billion
Share of ASEAN+3 in Total Investment (RHS)
60
ASEAN+3 Regional Economic Outlook 2019
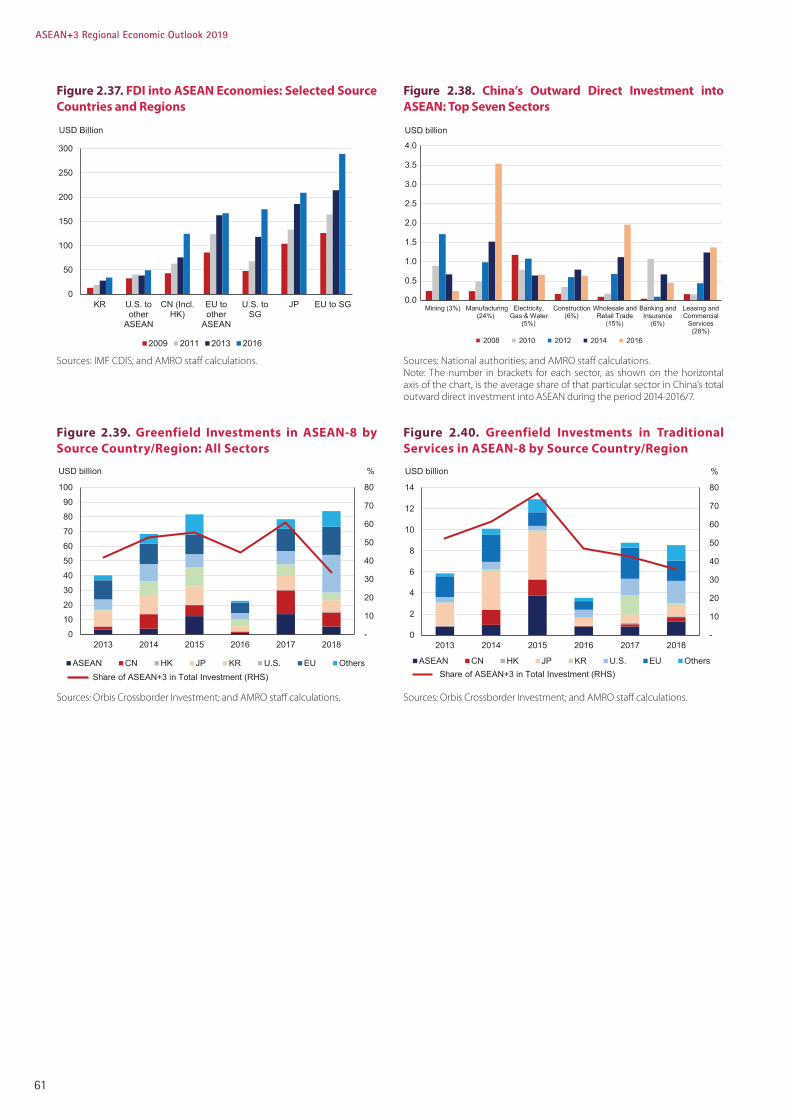
Figure 2.37. FDI into ASEAN Economies: Selected Source Countries and Regions
Figure 2.39. Greenfield Investments in ASEAN-8 by Source Country/Region: All Sectors
Figure 2.40. Greenfield Investments in Traditional Services in ASEAN-8 by Source Country/Region
Figure 2.38. China’s Outward Direct Investment into ASEAN: Top Seven Sectors
Sources: IMF CDIS; and AMRO staff calculations.
Sources: Orbis Crossborder Investment; and AMRO staff calculations.
Sources: National authorities; and AMRO staff calculations.Note: The number in brackets for each sector, as shown on the horizontal axis of the chart, is the average share of that particular sector in China’s total outward direct investment into ASEAN during the period 2014-2016/7.
Sources: Orbis Crossborder Investment; and AMRO staff calculations.
0
50
100
150
200
250
300
KR U.S. toother
ASEAN
CN (Incl.HK)
EU toother
ASEAN
U.S. toSG
JP EU to SG
2009 2011 2013 2016
USD Billion
0.0
0.5
1.0
1.5
2.0
2.5
3.0
3.5
4.0
(24%)Mining (3%) Manufacturing Electricity,
(5%)Gas & Water (6%)
Construction Wholesale and
(15%)Retail Trade
Banking andInsurance
(6%)
Leasing andCommercial
Services(28%)
USD billion
2008 2010 2012 2014 2016
-
10
20
30
40
50
60
70
80
0
10
20
30
40
50
60
70
80
90
100
2013 2014 2015 2016 2017 2018
ASEAN CN HK JP KR U.S. EU Others
%USD billion
Share of ASEAN+3 in Total Investment (RHS)
-
10
20
30
40
50
60
70
80
0
2
4
6
8
10
12
14
2013 2014 2015 2016 2017 2018
CNASEAN HK JP KR U.S. EU Others
%USD billion
Share of ASEAN+3 in Total Investment (RHS)
61
ASEAN+3 Regional Economic Outlook 2019
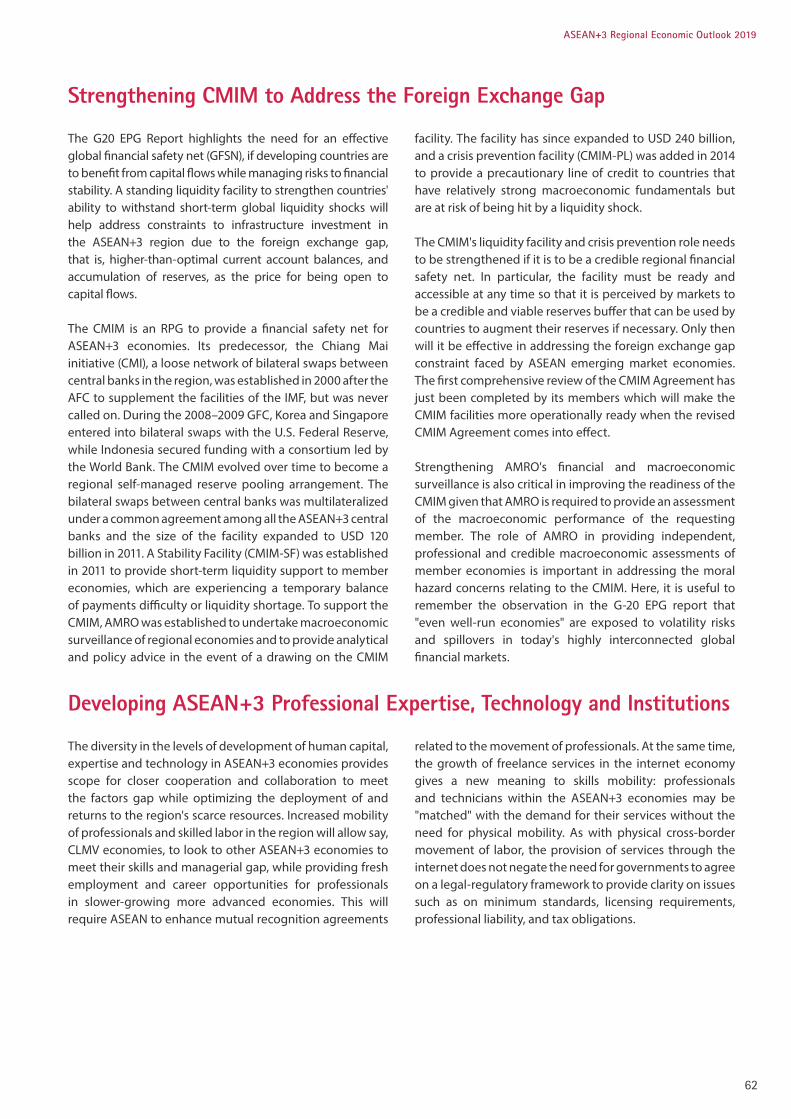
The G20 EPG Report highlights the need for an effective global financial safety net (GFSN), if developing countries are to benefit from capital flows while managing risks to financial stability. A standing liquidity facility to strengthen countries' ability to withstand short-term global liquidity shocks will help address constraints to infrastructure investment in the ASEAN+3 region due to the foreign exchange gap, that is, higher-than-optimal current account balances, and accumulation of reserves, as the price for being open to capital flows.
The CMIM is an RPG to provide a financial safety net for ASEAN+3 economies. Its predecessor, the Chiang Mai initiative (CMI), a loose network of bilateral swaps between central banks in the region, was established in 2000 after the AFC to supplement the facilities of the IMF, but was never called on. During the 2008–2009 GFC, Korea and Singapore entered into bilateral swaps with the U.S. Federal Reserve, while Indonesia secured funding with a consortium led by the World Bank. The CMIM evolved over time to become a regional self-managed reserve pooling arrangement. The bilateral swaps between central banks was multilateralized under a common agreement among all the ASEAN+3 central banks and the size of the facility expanded to USD 120 billion in 2011. A Stability Facility (CMIM-SF) was established in 2011 to provide short-term liquidity support to member economies, which are experiencing a temporary balance of payments difficulty or liquidity shortage. To support the CMIM, AMRO was established to undertake macroeconomic surveillance of regional economies and to provide analytical and policy advice in the event of a drawing on the CMIM
The diversity in the levels of development of human capital, expertise and technology in ASEAN+3 economies provides scope for closer cooperation and collaboration to meet the factors gap while optimizing the deployment of and returns to the region's scarce resources. Increased mobility of professionals and skilled labor in the region will allow say, CLMV economies, to look to other ASEAN+3 economies to meet their skills and managerial gap, while providing fresh employment and career opportunities for professionals in slower-growing more advanced economies. This will require ASEAN to enhance mutual recognition agreements
Strengthening CMIM to Address the Foreign Exchange Gap
Developing ASEAN+3 Professional Expertise, Technology and Institutions
facility. The facility has since expanded to USD 240 billion, and a crisis prevention facility (CMIM-PL) was added in 2014 to provide a precautionary line of credit to countries that have relatively strong macroeconomic fundamentals but are at risk of being hit by a liquidity shock.
The CMIM's liquidity facility and crisis prevention role needs to be strengthened if it is to be a credible regional financial safety net. In particular, the facility must be ready and accessible at any time so that it is perceived by markets to be a credible and viable reserves buffer that can be used by countries to augment their reserves if necessary. Only then will it be effective in addressing the foreign exchange gap constraint faced by ASEAN emerging market economies. The first comprehensive review of the CMIM Agreement has just been completed by its members which will make the CMIM facilities more operationally ready when the revised CMIM Agreement comes into effect.
Strengthening AMRO's financial and macroeconomic surveillance is also critical in improving the readiness of the CMIM given that AMRO is required to provide an assessment of the macroeconomic performance of the requesting member. The role of AMRO in providing independent, professional and credible macroeconomic assessments of member economies is important in addressing the moral hazard concerns relating to the CMIM. Here, it is useful to remember the observation in the G-20 EPG report that "even well-run economies" are exposed to volatility risks and spillovers in today's highly interconnected global financial markets.
related to the movement of professionals. At the same time, the growth of freelance services in the internet economy gives a new meaning to skills mobility: professionals and technicians within the ASEAN+3 economies may be "matched" with the demand for their services without the need for physical mobility. As with physical cross-border movement of labor, the provision of services through the internet does not negate the need for governments to agree on a legal-regulatory framework to provide clarity on issues such as on minimum standards, licensing requirements, professional liability, and tax obligations.
62
ASEAN+3 Regional Economic Outlook 2019
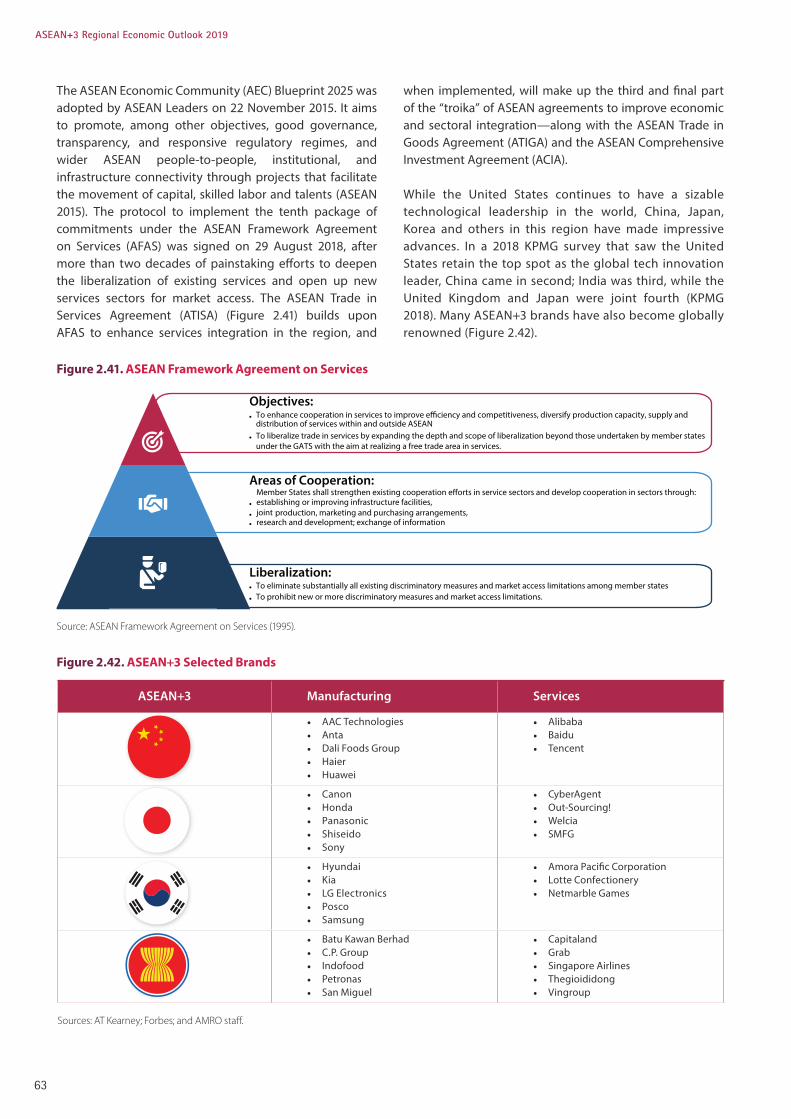
The ASEAN Economic Community (AEC) Blueprint 2025 was adopted by ASEAN Leaders on 22 November 2015. It aims to promote, among other objectives, good governance, transparency, and responsive regulatory regimes, and wider ASEAN people-to-people, institutional, and infrastructure connectivity through projects that facilitate the movement of capital, skilled labor and talents (ASEAN 2015). The protocol to implement the tenth package of commitments under the ASEAN Framework Agreement on Services (AFAS) was signed on 29 August 2018, after more than two decades of painstaking efforts to deepen the liberalization of existing services and open up new services sectors for market access. The ASEAN Trade in Services Agreement (ATISA) (Figure 2.41) builds upon AFAS to enhance services integration in the region, and
when implemented, will make up the third and final part of the “troika” of ASEAN agreements to improve economic and sectoral integration—along with the ASEAN Trade in Goods Agreement (ATIGA) and the ASEAN Comprehensive Investment Agreement (ACIA).
While the United States continues to have a sizable technological leadership in the world, China, Japan, Korea and others in this region have made impressive advances. In a 2018 KPMG survey that saw the United States retain the top spot as the global tech innovation leader, China came in second; India was third, while the United Kingdom and Japan were joint fourth (KPMG 2018). Many ASEAN+3 brands have also become globally renowned (Figure 2.42).
Figure 2.41. ASEAN Framework Agreement on Services
Figure 2.42. ASEAN+3 Selected Brands
Source: ASEAN Framework Agreement on Services (1995).
Sources: AT Kearney; Forbes; and AMRO staff.
ASEAN+3 Manufacturing Services
• AAC Technologies• Anta• Dali Foods Group• Haier• Huawei
• Alibaba• Baidu• Tencent
• Canon• Honda• Panasonic• Shiseido• Sony
• CyberAgent• Out-Sourcing!• Welcia• SMFG
• Hyundai• Kia• LG Electronics• Posco• Samsung
• Amora Pacific Corporation• Lotte Confectionery• Netmarble Games
• Batu Kawan Berhad• C.P. Group• Indofood• Petronas• San Miguel
• Capitaland• Grab• Singapore Airlines• Thegioididong• Vingroup
Liberalization:To eliminate substantially all existing discriminatory measures and market access limitations among member states To prohibit new or more discriminatory measures and market access limitations.
Areas of Cooperation:Member States shall strengthen existing cooperation e�orts in service sectors and develop cooperation in sectors through: establishing or improving infrastructure facilities, joint production, marketing and purchasing arrangements, research and development; exchange of information
Objectives:To enhance cooperation in services to improve e�ciency and competitiveness, diversify production capacity, supply and To liberalize trade in services by expanding the depth and scope of liberalization beyond those undertaken by member states under the GATS with the aim at realizing a free trade area in services.
distribution of services within and outside ASEAN
63
ASEAN+3 Regional Economic Outlook 2019
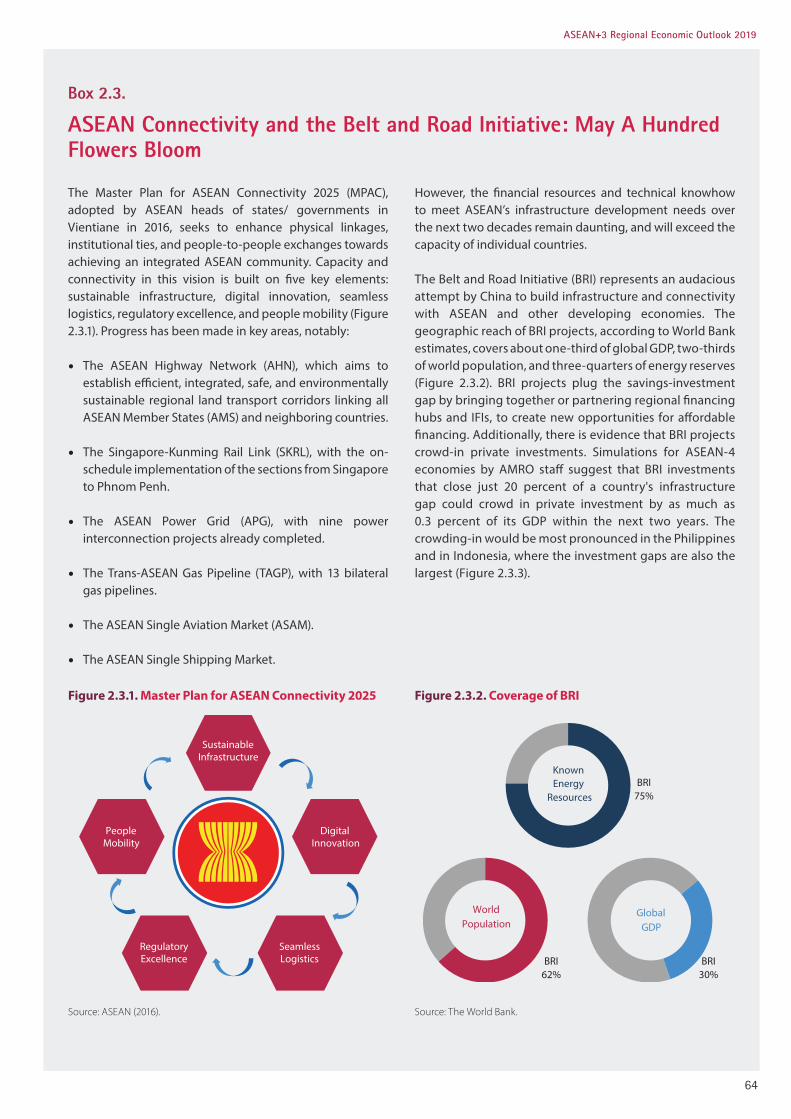
ASEAN Connectivity and the Belt and Road Initiative: May A Hundred Flowers Bloom
Box 2.3.
The Master Plan for ASEAN Connectivity 2025 (MPAC), adopted by ASEAN heads of states/ governments in Vientiane in 2016, seeks to enhance physical linkages, institutional ties, and people-to-people exchanges towards achieving an integrated ASEAN community. Capacity and connectivity in this vision is built on five key elements: sustainable infrastructure, digital innovation, seamless logistics, regulatory excellence, and people mobility (Figure 2.3.1). Progress has been made in key areas, notably:
• The ASEAN Highway Network (AHN), which aims to establish efficient, integrated, safe, and environmentally sustainable regional land transport corridors linking all ASEAN Member States (AMS) and neighboring countries.
• The Singapore-Kunming Rail Link (SKRL), with the on-schedule implementation of the sections from Singapore to Phnom Penh.
• The ASEAN Power Grid (APG), with nine power interconnection projects already completed.
• The Trans-ASEAN Gas Pipeline (TAGP), with 13 bilateral gas pipelines.
• The ASEAN Single Aviation Market (ASAM).
• The ASEAN Single Shipping Market.
Figure 2.3.1. Master Plan for ASEAN Connectivity 2025 Figure 2.3.2. Coverage of BRI
Source: ASEAN (2016). Source: The World Bank.
Seamless Logistics
Digital Innovation
SustainableInfrastructure
Regulatory Excellence
People Mobility
Known Energy
Resources
WorldPopulation
GlobalGDP
BRI75%
BRI62%
BRI30%
However, the financial resources and technical knowhow to meet ASEAN’s infrastructure development needs over the next two decades remain daunting, and will exceed the capacity of individual countries.
The Belt and Road Initiative (BRI) represents an audacious attempt by China to build infrastructure and connectivity with ASEAN and other developing economies. The geographic reach of BRI projects, according to World Bank estimates, covers about one-third of global GDP, two-thirds of world population, and three-quarters of energy reserves (Figure 2.3.2). BRI projects plug the savings-investment gap by bringing together or partnering regional financing hubs and IFIs, to create new opportunities for affordable financing. Additionally, there is evidence that BRI projects crowd-in private investments. Simulations for ASEAN-4 economies by AMRO staff suggest that BRI investments that close just 20 percent of a country's infrastructure gap could crowd in private investment by as much as 0.3 percent of its GDP within the next two years. The crowding-in would be most pronounced in the Philippines and in Indonesia, where the investment gaps are also the largest (Figure 2.3.3).
64
ASEAN+3 Regional Economic Outlook 2019
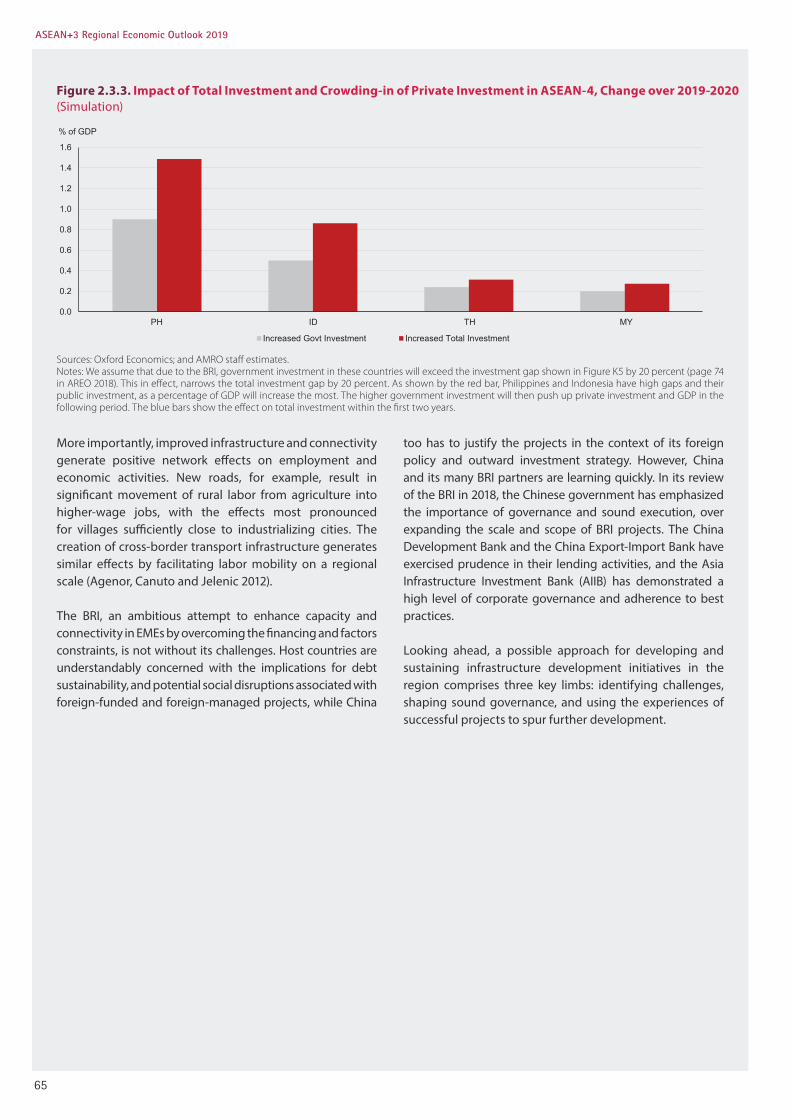
More importantly, improved infrastructure and connectivity generate positive network effects on employment and economic activities. New roads, for example, result in significant movement of rural labor from agriculture into higher-wage jobs, with the effects most pronounced for villages sufficiently close to industrializing cities. The creation of cross-border transport infrastructure generates similar effects by facilitating labor mobility on a regional scale (Agenor, Canuto and Jelenic 2012).
The BRI, an ambitious attempt to enhance capacity and connectivity in EMEs by overcoming the financing and factors constraints, is not without its challenges. Host countries are understandably concerned with the implications for debt sustainability, and potential social disruptions associated with foreign-funded and foreign-managed projects, while China
Figure 2.3.3. Impact of Total Investment and Crowding-in of Private Investment in ASEAN-4, Change over 2019-2020 (Simulation)
Sources: Oxford Economics; and AMRO staff estimates.Notes: We assume that due to the BRI, government investment in these countries will exceed the investment gap shown in Figure K5 by 20 percent (page 74 in AREO 2018). This in effect, narrows the total investment gap by 20 percent. As shown by the red bar, Philippines and Indonesia have high gaps and their public investment, as a percentage of GDP will increase the most. The higher government investment will then push up private investment and GDP in the following period. The blue bars show the effect on total investment within the first two years.
too has to justify the projects in the context of its foreign policy and outward investment strategy. However, China and its many BRI partners are learning quickly. In its review of the BRI in 2018, the Chinese government has emphasized the importance of governance and sound execution, over expanding the scale and scope of BRI projects. The China Development Bank and the China Export-Import Bank have exercised prudence in their lending activities, and the Asia Infrastructure Investment Bank (AIIB) has demonstrated a high level of corporate governance and adherence to best practices.
Looking ahead, a possible approach for developing and sustaining infrastructure development initiatives in the region comprises three key limbs: identifying challenges, shaping sound governance, and using the experiences of successful projects to spur further development.
0.0
0.2
0.4
0.6
0.8
1.0
1.2
1.4
1.6
PH MYID
Increased Govt Investment
TH
Increased Total Investment
% of GDP
65
ASEAN+3 Regional Economic Outlook 2019
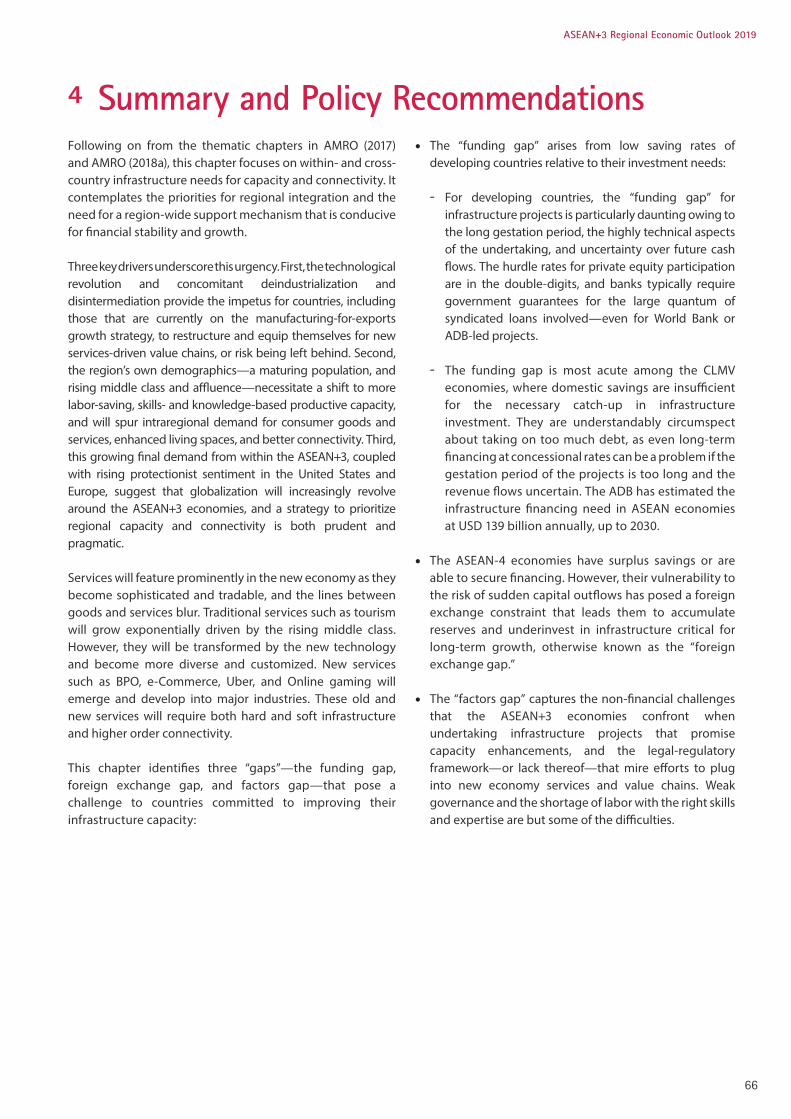
4 Summary and Policy RecommendationsFollowing on from the thematic chapters in AMRO (2017) and AMRO (2018a), this chapter focuses on within- and cross-country infrastructure needs for capacity and connectivity. It contemplates the priorities for regional integration and the need for a region-wide support mechanism that is conducive for financial stability and growth.
Three key drivers underscore this urgency. First, the technological revolution and concomitant deindustrialization and disintermediation provide the impetus for countries, including those that are currently on the manufacturing-for-exports growth strategy, to restructure and equip themselves for new services-driven value chains, or risk being left behind. Second, the region’s own demographics—a maturing population, and rising middle class and affluence—necessitate a shift to more labor-saving, skills- and knowledge-based productive capacity, and will spur intraregional demand for consumer goods and services, enhanced living spaces, and better connectivity. Third, this growing final demand from within the ASEAN+3, coupled with rising protectionist sentiment in the United States and Europe, suggest that globalization will increasingly revolve around the ASEAN+3 economies, and a strategy to prioritize regional capacity and connectivity is both prudent and pragmatic.
Services will feature prominently in the new economy as they become sophisticated and tradable, and the lines between goods and services blur. Traditional services such as tourism will grow exponentially driven by the rising middle class. However, they will be transformed by the new technology and become more diverse and customized. New services such as BPO, e-Commerce, Uber, and Online gaming will emerge and develop into major industries. These old and new services will require both hard and soft infrastructure and higher order connectivity.
This chapter identifies three “gaps”—the funding gap, foreign exchange gap, and factors gap—that pose a challenge to countries committed to improving their infrastructure capacity:
• The “funding gap” arises from low saving rates of developing countries relative to their investment needs:
- For developing countries, the “funding gap” for infrastructure projects is particularly daunting owing to the long gestation period, the highly technical aspects of the undertaking, and uncertainty over future cash flows. The hurdle rates for private equity participation are in the double-digits, and banks typically require government guarantees for the large quantum of syndicated loans involved—even for World Bank or ADB-led projects.
- The funding gap is most acute among the CLMV economies, where domestic savings are insufficient for the necessary catch-up in infrastructure investment. They are understandably circumspect about taking on too much debt, as even long-term financing at concessional rates can be a problem if the gestation period of the projects is too long and the revenue flows uncertain. The ADB has estimated the infrastructure financing need in ASEAN economies at USD 139 billion annually, up to 2030.
• The ASEAN-4 economies have surplus savings or are able to secure financing. However, their vulnerability to the risk of sudden capital outflows has posed a foreign exchange constraint that leads them to accumulate reserves and underinvest in infrastructure critical for long-term growth, otherwise known as the “foreign exchange gap.”
• The “factors gap” captures the non-financial challenges that the ASEAN+3 economies confront when undertaking infrastructure projects that promise capacity enhancements, and the legal-regulatory framework—or lack thereof—that mire efforts to plug into new economy services and value chains. Weak governance and the shortage of labor with the right skills and expertise are but some of the difficulties.
66
ASEAN+3 Regional Economic Outlook 2019

ASEAN+3 economies can leverage more on their own resources to bridge the three gaps underlying under-investment in capacity and connectivity in the region. The region should remain open, and not respond to protectionism elsewhere by enacting its own barriers to cross-border economic flows and financial activity.
ASEAN+3 economies as a group run a current account surplus that is more than enough to close the pockets of funding gaps in the region. Japan and China have provided project financing at concessional rates through the ODA and BRI respectively, but there is scope to mobilize more private resources—especially equity financing—for infrastructure projects. Specifically, more surplus savings from the region could be channeled as direct investment to meet development needs within the region. This strategy would have the added benefit of mitigating the financial stability risks that portfolio investment would pose to regional economies if the surplus savings of the region are instead invested in low-yielding assets in the United States and Europe and then reallocated back to the region by portfolio managers.
The ASEAN+3 economies need to identify and address shortages in other critical factors that would set back capacity building efforts even if financing is forthcoming. The level of human capital, preconditions in soft infrastructure—a facilitative legal-regulatory framework, ease of payments and IT connectivity—and requirements of good governance, are even higher when globalization, and gains from globalization, are increasingly dominated by services. There is room to tap into professional and managerial expertise from within the ASEAN+3 economies to meet the skills gap in some parts of the region, and to enable or broaden the scope for technology sharing or transfer within the region. The AEC Blueprint provides a framework for inter-government collaboration to facilitate the seamless movement of goods, services, investment, capital and skilled labor within ASEAN.
The ASEAN+3 economies need to continue strengthening CMIM and bolster AMRO’s surveillance capacity, to provide an effective and credible regional financial safety net and address the foreign exchange gap issue. Both AMRO and the CMIM, alongside the AEC and other institutions or frameworks to promote regional cooperation and collaboration are part of the “soft infrastructure” and regional public goods needed to catalyze economic transformation and growth in ASEAN+3 economies.
67
ASEAN+3 Regional Economic Outlook 2019
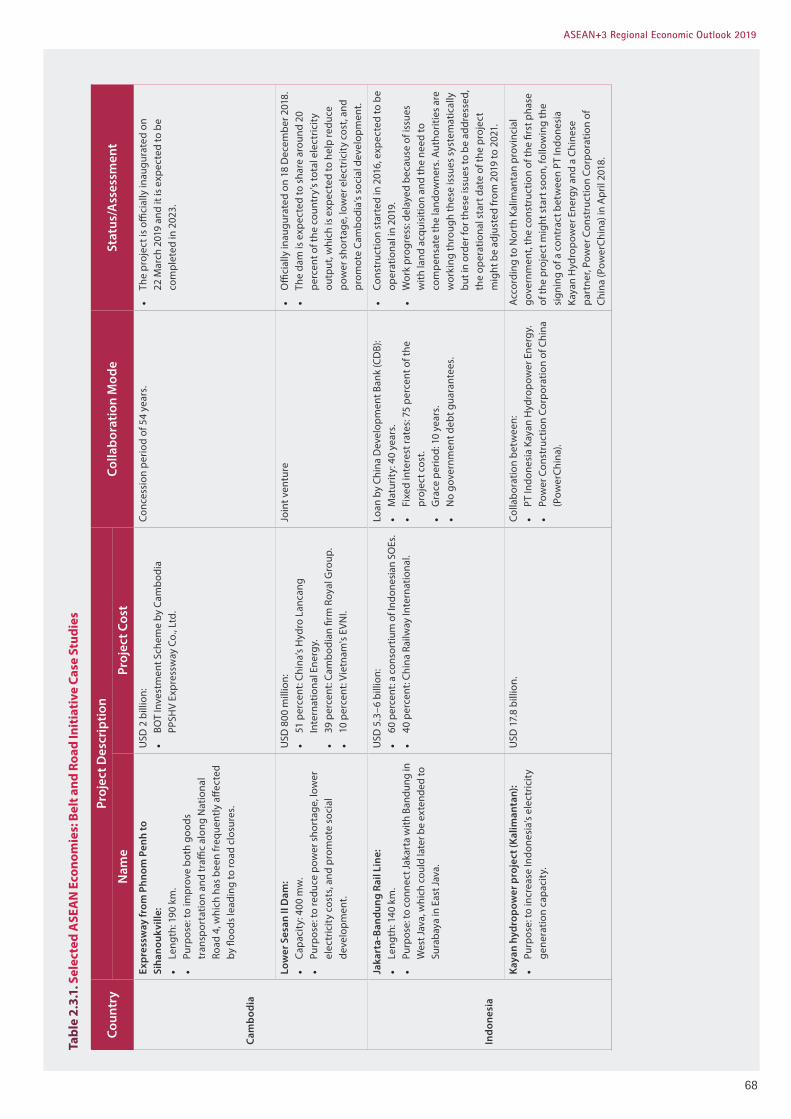
Tabl
e 2.
3.1.
Sel
ecte
d A
SEA
N E
cono
mie
s: B
elt a
nd R
oad
Init
iati
ve C
ase
Stud
ies
Coun
try
Proj
ect D
escr
iptio
nCo
llabo
ratio
n M
ode
Stat
us/A
sses
smen
tN
ame
Proj
ect C
ost
Cam
bodi
a
Expr
essw
ay fr
om P
hnom
Pen
h to
Si
hano
ukvi
lle:
• Le
ngth
: 190
km
.•
Purp
ose:
to im
prov
e bo
th g
oods
tr
ansp
orta
tion
and
traffi
c al
ong
Nat
iona
l Ro
ad 4
, whi
ch h
as b
een
freq
uent
ly a
ffect
ed
by fl
oods
lead
ing
to ro
ad c
losu
res.
USD
2 b
illio
n:•
BOT
Inve
stm
ent S
chem
e by
Cam
bodi
a PP
SHV
Expr
essw
ay C
o., L
td.
Conc
essi
on p
erio
d of
54
year
s.•
The
proj
ect i
s offi
cial
ly in
augu
rate
d on
22
Mar
ch 2
019
and
it is
exp
ecte
d to
be
com
plet
ed in
202
3.
Low
er S
esan
II D
am:
• Ca
paci
ty: 4
00 m
w.
• Pu
rpos
e: to
redu
ce p
ower
sho
rtag
e, lo
wer
el
ectr
icit
y co
sts,
and
pro
mot
e so
cial
de
velo
pmen
t.
USD
800
mill
ion:
• 51
per
cent
: Chi
na’s
Hyd
ro L
anca
ng
Inte
rnat
iona
l Ene
rgy.
• 39
per
cent
: Cam
bodi
an fi
rm R
oyal
Gro
up.
• 10
per
cent
: Vie
tnam
's EV
NI.
Join
t ven
ture
• O
ffici
ally
inau
gura
ted
on 1
8 D
ecem
ber 2
018.
• Th
e da
m is
exp
ecte
d to
sha
re a
roun
d 20
pe
rcen
t of t
he c
ount
ry’s
tota
l ele
ctric
ity
outp
ut, w
hich
is e
xpec
ted
to h
elp
redu
ce
pow
er s
hort
age,
low
er e
lect
ricit
y co
st, a
nd
prom
ote
Cam
bodi
a’s
soci
al d
evel
opm
ent.
Indo
nesi
a
Jaka
rta-
Band
ung
Rail
Line
: •
Leng
th: 1
40 k
m.
• Pu
rpos
e: to
con
nect
Jaka
rta
with
Ban
dung
in
Wes
t Jav
a, w
hich
cou
ld la
ter b
e ex
tend
ed to
Su
raba
ya in
Eas
t Jav
a.
USD
5.3
–6 b
illio
n:•
60 p
erce
nt: a
con
sort
ium
of I
ndon
esia
n SO
Es.
• 40
per
cent
: Chi
na R
ailw
ay In
tern
atio
nal.
Loan
by
Chin
a D
evel
opm
ent B
ank
(CD
B):
• M
atur
ity:
40
year
s.•
Fixe
d in
tere
st ra
tes:
75
perc
ent o
f the
pr
ojec
t cos
t.•
Gra
ce p
erio
d: 1
0 ye
ars.
• N
o go
vern
men
t deb
t gua
rant
ees.
• Co
nstr
uctio
n st
arte
d in
201
6, e
xpec
ted
to b
e op
erat
iona
l in
2019
.•
Wor
k pr
ogre
ss: d
elay
ed b
ecau
se o
f iss
ues
with
land
acq
uisi
tion
and
the
need
to
com
pens
ate
the
land
owne
rs. A
utho
ritie
s ar
e w
orki
ng th
roug
h th
ese
issu
es s
yste
mat
ical
ly
but i
n or
der f
or th
ese
issu
es to
be
addr
esse
d,
the
oper
atio
nal s
tart
dat
e of
the
proj
ect
mig
ht b
e ad
just
ed fr
om 2
019
to 2
021.
Kaya
n hy
drop
ower
pro
ject
(Kal
iman
tan)
:•
Purp
ose:
to in
crea
se In
done
sia’
s el
ectr
icit
y ge
nera
tion
capa
city
.
USD
17.
8 bi
llion
.Co
llabo
ratio
n be
twee
n:•
PT In
done
sia
Kaya
n H
ydro
pow
er E
nerg
y.•
Pow
er C
onst
ruct
ion
Corp
orat
ion
of C
hina
(P
ower
Chin
a).
Acc
ordi
ng to
Nor
th K
alim
anta
n pr
ovin
cial
go
vern
men
t, th
e co
nstr
uctio
n of
the
first
pha
se
of th
e pr
ojec
t mig
ht s
tart
soo
n, fo
llow
ing
the
sign
ing
of a
con
trac
t bet
wee
n PT
Indo
nesi
a Ka
yan
Hyd
ropo
wer
Ene
rgy
and
a Ch
ines
e pa
rtne
r, Po
wer
Con
stru
ctio
n Co
rpor
atio
n of
Ch
ina
(Pow
erCh
ina)
in A
pril
2018
.
68
ASEAN+3 Regional Economic Outlook 2019

Coun
try
Proj
ect D
escr
iptio
nCo
llabo
ratio
n M
ode
Stat
us/A
sses
smen
tN
ame
Proj
ect C
ost
Lao
PDR
Laos
-Chi
na R
ailw
ay:
• Le
ngth
: 414
km
.•
Purp
ose:
to c
onne
ct C
hina
with
ASE
AN
, with
th
e La
o se
ctio
n of
the
railw
ay c
omm
enci
ng
in K
unm
ing
and
goin
g th
roug
h m
ajor
citi
es
in L
ao P
DR
with
a to
tal o
f 32
stat
ions
.
USD
6 b
illio
n, o
f whi
ch:
• 60
per
cent
(USD
3.6
bill
ion)
: deb
t via
loan
s fr
om C
hine
se b
anks
to th
e jo
int v
entu
re
com
pany
est
ablis
hed
by th
e Ch
ines
e an
d La
o go
vern
men
ts.
• 40
per
cent
(USD
2.4
bill
ion)
: equ
ity, o
f whi
ch:
-70
per
cent
(USD
1.6
8 bi
llion
) con
trib
uted
by
equ
ity
from
Chi
nese
sha
reho
lder
s.
-30
per
cent
(USD
0.7
2 bi
llion
) by
Lao
gove
rnm
ent,
of w
hich
: 65
perc
ent (
USD
0.
47 b
illio
n) lo
an fr
om C
hina
EXI
M B
ank
and
35 p
erce
nt (U
SD 0
.25
billi
on) b
y th
e go
vern
men
t bud
get (
USD
0.0
5 bi
llion
per
ye
ar d
urin
g 20
17–2
021)
.
A jo
int v
entu
re c
ompa
ny e
stab
lishe
d by
Chi
na a
nd L
aos
gove
rnm
ents
(with
no
gua
rant
ee o
f the
deb
t by
the
Lao
gove
rnm
ent)
.
• Co
nstr
uctio
n: 2
0 pe
rcen
t com
plet
e,
sche
dule
d la
unch
in D
ecem
ber 2
021.
• Th
e pr
ojec
t is
expe
cted
to b
reak
eve
n on
ly
afte
r abo
ut 2
0 ye
ars,
thus
, the
dire
ct fi
scal
im
pact
and
con
tinge
nt li
abili
ties
need
to b
e ca
refu
lly m
anag
ed w
ith a
long
-ter
m v
iew
.
Vie
ntia
ne-V
ang
Vie
ng E
xpre
ssw
ay:
• Le
ngth
: 113
.5 k
m.
• Pu
rpos
e: to
sig
nific
antly
cut
dow
n th
e tr
avel
tim
e fr
om th
e ca
pita
l Vie
ntia
ne to
maj
or
tour
ist d
estin
atio
ns in
Van
Vie
ng, a
nd s
o tie
s in
wel
l with
Lao
PD
R’s
push
to d
evel
op th
e co
untr
y fu
rthe
r as
a ke
y to
uris
t des
tinat
ion
in th
e A
SEA
N re
gion
.
USD
1.3
bill
ion:
• 95
per
cent
: Chi
na.
• 5
perc
ent:
Lao
gove
rnm
ent.
A jo
int v
entu
re c
ompa
ny c
alle
d La
os-C
hina
Jo
int E
xpre
ssw
ay D
evel
opm
ent C
ompa
ny
Lim
ited.
• Co
nstr
uctio
n of
the
Expr
essw
ay
com
men
ced
durin
g th
e se
cond
hal
f of
2018
, and
is e
xpec
ted
to b
e co
mpl
eted
in
thre
e ye
ars.
• A
toll
char
ge o
f bet
wee
n 45
,000
to 5
6,00
0 ki
p (U
SD 5
.25–
6.50
) is
bein
g pr
opos
ed fo
r tr
avel
ing
on th
e Ex
pres
sway
.
Mal
aysi
a
Seco
nd P
enan
g Br
idge
: •
Leng
th: 2
4 km
(one
of t
he lo
nges
t brid
ges i
n M
alay
sia
and
Sout
heas
t Asi
a).
• Pu
rpos
e: b
uilt
acro
ss S
outh
Cha
nnel
of
Pena
ng, l
inki
ng B
atu
Mau
ng o
n Pe
nang
Is
land
with
Bat
u Ka
wan
on
the
mai
nlan
d.
USD
1.3
7 bi
llion
:•
60 p
erce
nt: l
oans
from
Chi
na E
XIM
Ban
k: -
Mat
urit
y: 2
0 ye
ars.
-In
tere
st ra
te: 3
% p
er a
nnum
.•
40 p
erce
nt: M
alay
sian
gov
ernm
ent.
Han
dled
by
Chin
a H
ighw
ay P
lann
ing
and
Des
ign
Inst
itute
(HPD
I), A
ECO
M (c
onsu
ltant
of
Chin
a H
arbo
ur E
ngin
eerin
g Co
mpa
ny (C
HEC
).
• In
ope
ratio
n: M
arch
4, 2
014.
• Ec
onom
ic b
enefi
ts: a
reas
, whi
ch w
ere
prim
arily
pl
anta
tions
, bec
ame
mor
e de
velo
ped
and
dive
rsifi
ed to
wns
hips
and
mor
e co
nnec
ted
to
othe
r par
ts o
f the
cou
ntry
. The
upf
ront
and
lo
ng-t
erm
cos
ts w
ere
wel
l with
in M
alay
sia’s
fisca
l cap
acity
.
ECRL
:•
Lent
h: 6
88 k
m.
• Pu
rpos
e: to
con
nect
Sou
th C
hina
Sea
in th
e ea
st c
oast
of P
enin
sula
r Mal
aysia
with
stra
tegi
c sh
ippi
ng ro
utes
to th
e w
est.
USD
13.
1–20
bill
ion
(re-e
stim
ated
).O
wne
d an
d op
erat
ed b
y M
alay
sia
Rail
Link
Sd
n Bh
d (M
RL),
a sp
ecia
l pur
pose
veh
icle
(S
PV) w
holly
ow
ned
by M
MO
F.
• Co
nstr
uctio
n st
arte
d in
Aug
ust 2
017,
but
su
spen
ded
in 2
018
whe
n a
new
gov
ernm
ent
cam
e in
to p
ower
and
did
a c
ritic
al
reas
sess
men
t of t
he li
kely
cos
t of t
he p
roje
ct
– as
par
t of a
com
preh
ensi
ve n
atio
nal fi
scal
an
alys
is.
• Pr
ojec
t cur
rent
ly u
nder
revi
ew b
y th
e tw
o go
vern
men
ts.
Tabl
e 2.
3.1.
Sel
ecte
d A
SEA
N E
cono
mie
s: B
elt a
nd R
oad
Init
iati
ve C
ase
Stud
ies
69
ASEAN+3 Regional Economic Outlook 2019

Sour
ces:
Med
ia re
por
ts; n
atio
nal a
utho
ritie
s; an
d A
MRO
sta
ff.
Coun
try
Proj
ect D
escr
iptio
nCo
llabo
ratio
n M
ode
Stat
us/A
sses
smen
tN
ame
Proj
ect C
ost
Mya
nmar
Gon
g H
ai h
ydro
pow
er s
tati
on (l
ocat
ed o
n th
e Pa
ng R
iver
): •
Capa
city
: 25
MW
.•
Purp
ose:
to in
crea
se h
ydro
elec
tric
pow
er
gene
ratio
n to
mee
t the
muc
h-ne
eded
pow
er
dem
and
(the
gove
rnm
ent a
ims t
o pr
ovid
e el
ectr
icity
to th
e w
hole
cou
ntry
by
2030
).
Not
yet
kno
wn.
To b
e ha
ndle
d by
Sha
ndon
g W
ater
Co
nser
vanc
y Co
nstr
uctio
n G
roup
.•
Cons
truc
tion
date
: not
yet
kno
wn.
• In
July
201
8, S
hand
ong
Wat
er C
onse
rvan
cy
Cons
truc
tion
Gro
up C
o., L
td. w
as n
otifi
ed o
f w
inni
ng th
e bi
d fo
r the
EPC
pro
ject
of G
ong
Hai
hyd
ropo
wer
sta
tion
in M
yanm
ar.
• Th
e ec
onom
ic a
nd so
cial
ben
efits
for
Mya
nmar
cou
ld b
e ve
ry la
rge,
as t
he c
ount
ry
has a
n el
ectr
ifica
tion
rate
of o
nly
31 p
erce
nt
and
an a
nnua
l dem
and
grow
th o
f 15
perc
ent.
Kyau
kpyu
Por
t: •
Purp
ose:
Con
nect
ing
coun
trie
s al
ong
the
sea
rout
e, in
clud
ing
Chin
a an
d In
dian
oce
an.
USD
9–1
0 bi
llion
(50-
year
term
of t
he p
roje
ct)
• 70
per
cent
: Chi
na.
• 30
per
cent
: Mya
nmar
.
Colla
bora
tion
betw
een
Chin
a In
tern
atio
nal
Trus
t and
Inve
stm
ent C
orpo
ratio
n (C
ITIC
) and
M
yanm
ar’s
Kyau
kpyu
Spe
cial
Eco
nom
ic Z
one
man
agem
ent c
omm
itte
e (S
EZ).
• Co
nstr
uctio
n da
te: n
ot y
et k
now
n.•
CITI
C an
d SE
Z si
gned
an
agre
emen
t on
18
Nov
embe
r 201
8.
• Th
e pr
ojec
t is
expe
cted
to b
ring
100,
000
jobs
to th
e lo
cal c
omm
unit
y an
d ge
nera
te
subs
tain
tial r
even
ue.
Thai
land
Chin
a-Th
aila
nd R
ailw
ay:
• Le
ngth
: 873
km
.•
Purp
ose:
to c
onne
ct T
haila
nd, L
ao P
DR
and
the
Chin
ese
prov
ince
of Y
unna
n, to
pro
vide
th
e m
issi
ng li
nk in
the
railw
ay c
onne
ctiv
ity
from
Sin
gapo
re to
Chi
na, a
nd to
sho
rten
th
e tr
avel
tim
e be
twee
n Ba
ngko
k an
d N
ong
Khai
on
the
Thai
-Lao
bor
der f
rom
14
hour
s to
just
four
hou
rs, a
nd fu
rthe
r, to
con
nect
to
Kunm
ing
in Y
unna
n.
USD
12
billi
on.
Chin
ese
stat
e en
terp
rises
resp
onsi
ble
for t
he
engi
neer
ing
desi
gn o
f the
pro
ject
and
the
hirin
g of
Chi
nese
tech
nica
l adv
iser
s.
• Co
nstr
uctio
n: a
fter
som
e de
lays
, sta
rted
in
Dec
embe
r 201
7, w
ith th
e fir
st p
hase
of t
he
proj
ect e
xpec
ted
to b
e op
erat
iona
l in
2021
.•
This
proj
ect fi
ts w
ell w
ith T
haila
nd’s
over
all
econ
omic
dev
elop
men
t, a
sign
ifica
nt p
art
of w
hich
invo
lves
dee
peni
ng su
b-re
gion
al
inte
grat
ion
with
in th
e La
ncan
g-M
ekon
g ar
ea.
In a
dditi
on, T
haila
nd’s
dom
estic
stak
ehol
ders
be
nefit
subs
tant
ially
.
Tabl
e 2.
3.1.
Sel
ecte
d A
SEA
N E
cono
mie
s: B
elt a
nd R
oad
Init
iati
ve C
ase
Stud
ies
70
ASEAN+3 Regional Economic Outlook 2019
Recommended