www.hifreqecon.com/TELUSPC
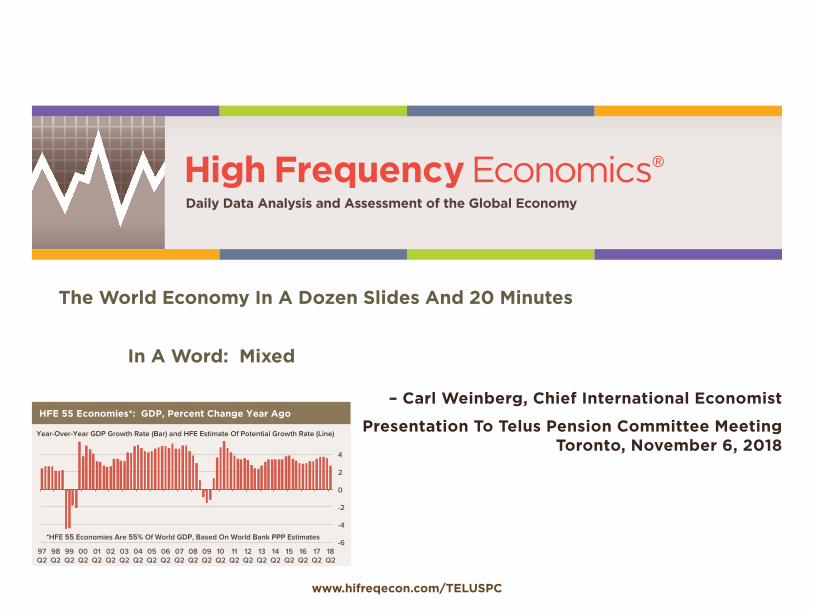
The World Economy In A Dozen Slides And 20 Minutes
In A Word: Mixed
– Carl Weinberg, Chief International Economist
Presentation To Telus Pension Committee MeetingToronto, November 6, 2018
-6
-4
-2
0
2
4
97 Q2
98 Q2
99 Q2
00 Q2
01 Q2
02 Q2
03 Q2
04 Q2
05 Q2
06 Q2
07 Q2
08 Q2
09 Q2
10 Q2
11 Q2
12 Q2
13 Q2
14 Q2
15 Q2
16 Q2
17 Q2
18 Q2
*HFE 55 Economies Are 55% Of World GDP, Based On World Bank PPP Estimates
HFE 55 Economies*: GDP, Percent Change Year Ago
Year-Over-Year GDP Growth Rate (Bar) and HFE Estimate Of Potential Growth Rate (Line)

Carl B. Weinberg, Chief International EconomistPresentation Charts For Telus Pension Committee, November 6, 2018
www.hifreqecon.com/TELUSPC Page 2
WORLD
China United States
Canada
United Kingdom
Carl B. Weinberg, Chief International EconomistPresentation Charts For Telus Pension Committee, November 6, 2018
www.hifreqecon.com/TELUSPC Page 3
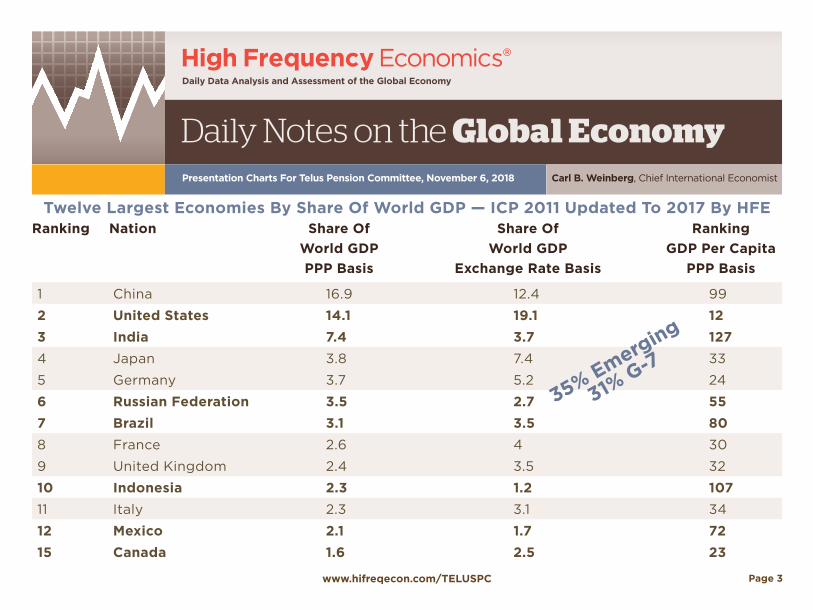
Twelve Largest Economies By Share Of World GDP — ICP 2011 Updated To 2017 By HFERanking Nation Share Of Share Of Ranking World GDP World GDP GDP Per Capita PPP Basis Exchange Rate Basis PPP Basis
1 China 16.9 12.4 99
2 United States 14.1 19.1 123 India 7.4 3.7 1274 Japan 3.8 7.4 33
5 Germany 3.7 5.2 24
6 Russian Federation 3.5 2.7 557 Brazil 3.1 3.5 808 France 2.6 4 30
9 United Kingdom 2.4 3.5 32
10 Indonesia 2.3 1.2 10711 Italy 2.3 3.1 34
12 Mexico 2.1 1.7 7215 Canada 1.6 2.5 23
35% Emerging
31% G-7

Carl B. Weinberg, Chief International EconomistPresentation Charts For Telus Pension Committee, November 6, 2018
www.hifreqecon.com/TELUSPC Page 4 0
1
2
3
4
5
6
7
8
9
Oct 04
Oct 05
Oct 06
Oct 07
Oct 08
Oct 09
Oct 10
Oct 11
Oct 12
Oct 13
Oct 14
Oct 15
Oct 16
Oct 17
Oct 18
Canada: Unemployment Rate, Percent
-30 -25 -20 -15 -10 -5 0 5
10 15 20
-5 -4 -3 -2 -1 0 1 2 3 4 5
Aug 05
Aug 06
Aug 07
Aug 08
Aug 09
Aug 10
Aug 11
Aug 12
Aug 13
Aug 14
Aug 15
Aug 16
Aug 17
Aug 18
Canada: Monthly Domestic Product & Manufacturing Output
Green Line Is Mfg Production, %chya, Left Axis Columns Are Monthly GDP, %chya, Right Axis
-1
0
1
2
3
4
Sep 05
Sep 06
Sep 07
Sep 08
Sep 09
Sep 10
Sep 11
Sep 12
Sep 13
Sep 14
Sep 15
Sep 16
Sep 17
Sep 18
Sep 19f
HFE Projection
Canada: CPI, Percent Change Year Ago
Yellow Line Shows CPI Ex-Energy, Oct 18 Onward Is HFE Forecast Black Line Is CPI-TRIM, No Forecast
-5
-4
-3
-2
-1
0
1
2
3
Aug 99
Aug 00
Aug 01
Aug 02
Aug 03
Aug 04
Aug 05
Aug 06
Aug 07
Aug 08
Aug 09
Aug 10
Aug 11
Aug 12
Aug 13
Aug 14
Aug 15
Aug 16
Aug 17
Aug 18
Canada: Real Weekly Earnings, Percent Change Year Ago
Black Line Shows 12-Month Moving Average
-10 -8 -6 -4 -2 0 2 4 6 8
97 Q2
98 Q2
99 Q2
00 Q2
01 Q2
02 Q2
03 Q2
04 Q2
05 Q2
06 Q2
07 Q2
08 Q2
09 Q2
10 Q2
11 Q2
12 Q2
13 Q2
14 Q2
15 Q2
16 Q2
17 Q2
18 Q2
Canada: GDP
Seasonally Adjusted Annual Rate (Bar) and Percent Change Year Ago (Line) Calculated From Seasonally Adjusted Data Through 2018 Q2
1500
1550
1600
1650
1700
1750
1800
1850
1900
1950
Q4 08
Q2 09
Q4 09
Q2 10
Q4 10
Q2 11
Q4 11
Q2 12
Q4 12
Q2 13
Q4 13
Q2 14
Q4 14
Q2 15
Q4 15
Q2 16
Q4 16
Q2 17
Q4 17
Q2 18
Canada: Actual GDP Vs HFE Full Capacity GDP Billions Of Constant C$, Quarterly Data
Black Line Is HFE Peak-To-Peak Capacity GDP Blue Line Is Actual GDP
-3.0 -2.5 -2.0 -1.5 -1.0 -0.5 0.0 0.5 1.0 1.5 2.0 2.5 3.0
Oct 04
Oct 05
Oct 06
Oct 07
Oct 08
Oct 09
Oct 10
Oct 11
Oct 12
Oct 13
Oct 14
Oct 15
Oct 16
Oct 17
Oct 18
Canada: Employment, Percent Change Year Ago
Line Shows Private Sector Employment
Canada’s Economy Is Chugging AlongGrowth is, however, slowing. Just the same, it is still growing at the top of the BoC’s estimates of its potential rate. With a 44-year low unemployment rate and full capacity use the BoC cannot simply sit tight and hope that the economy continues to slow. A move back to neutral, at least, has been promised. That means a 2.5% policy rate at a min-ium, or three hikes in the next nine months (One 25bps every other rate setting.) That is about the same pace we expect the Fed will raise rates.
-25
-20
-15
-10
-5
0
5
Q2 09
Q4 09
Q2 10
Q4 10
Q2 11
Q4 11
Q2 12
Q4 12
Q2 13
Q4 13
Q2 14
Q4 14
Q2 15
Q4 15
Q2 16
Q4 16
Q2 17
Q4 17
Q2 18
Canada: Current Account Balance, C$ Billions
Quarterly Rate, Line Shows Four Quarter Moving Average
Record
1.20
1.25
1.30
1.35
1.40
1.45
1.50
1.55
1.60
1.65
Aug 03
Aug 04
Aug 05
Aug 06
Aug 07
Aug 08
Aug 09
Aug 10
Aug 11
Aug 12
Aug 13
Aug 14
Aug 15
Aug 16
Aug 17
Aug 18
12-Month Trend Line shown
Canada: Manufacturing Inventories-To-Sales Ratio

Carl B. Weinberg, Chief International EconomistPresentation Charts For Telus Pension Committee, November 6, 2018
www.hifreqecon.com/TELUSPC Page 5
High Frequency Economics® — Fiscal Easing + Fed Tightening + “Art of the Deal” Trade Policy = ? September 26, 2018 Page 12
© 2018 High Frequency Economics, Ltd. 445 Hamilton Avenue, White Plains, NY 10601. All rights reserved. No secondary distribution without express permission. www.hifreqecon.com
Inverted Yield Curves Signal Recessions, But Not Always
The yield curve is probaby the most consistent and reliable component of the index of leading indicators for signaling recessions, but there have been false signals, most notably in 1966 and 1998. Not surprisingly, inversions have coincided with Fed tightening cycles; similarly, most, but not all, Fed tightening cycles in recent decades have culminated in recessions: A notable exception was the 1994 tightening cycle, when the curve flattened significantly but not did not invert.
-12
-9
-6
-3
0
3
6
9
-8
-6
-4
-2
0
2
4
6
60 65 70 75 80 85 90 95 00 05 10 15
Yield Curve: 10-Year Minus 2-Year Treasury Yield, Percentage Points (Left) Yield Curve: 10-Year Minus Federal Funds Rate, Percentage Points (Left) Real GDP, %chya (Right)
Shaded Bars Denote Recession Periods
1966 1998
Recesions Have Been Preceded By Inverted Curves, But Some False Signals
-4
0
4
8
12
16
20
24
77 83 89 95 01 07 13
Real Fed Funds Rate, Deflated With %Y/Y In Core PCE Prices, % Nominal Fed Funds Rate, %
Shaded Bars Denote Recession Periods
...Similarly, Fed Tightening Cycles Have Tended To Be Followed By Recessions
-1 0 1 2 3 4 5 6 7 8 9
90 95 00 05 10 15
10-Year Term Premium*, % Nominal 10-Year Treasury Yield, % 10-Year Risk-Neutral Yield*, %
*NY Fed data; methodology developed by Tobias Adrian, Richard Crump & Emanuel Moench.
“Bond Market Conundrum”
Shaded Bars Mark Fed Tightening Periods
Is This Time Different? Bond Market Term Premiums Are Historically Low
Is this time different? Term premiums in the bond market are historically low, likely due in large part to central bank bond purchases—QE.
0.0
0.2
0.4
0.6
0.8
1.0
72 77 82 87 92 97 02 07 12 17
Long-Term Spread Model Near-Term Spread Model Shaded Bars Denote Recession Periods
Note: Chart replicated from "(Don't Fear) The Yield Curve," a paper written by Fed economists Eric Engstrom and Steve Sharpe; most recent readings estimated by HFE.
Estimated Probability Of Recession Within One Year
Yield Curve Models Still Signaling Low Recession Probability
High Frequency Economics® — Fiscal Easing + Fed Tightening + “Art of the Deal” Trade Policy = ? September 26, 2018 Page 3
© 2018 High Frequency Economics, Ltd. 445 Hamilton Avenue, White Plains, NY 10601. All rights reserved. No secondary distribution without express permission. www.hifreqecon.com
Weak Recovery Has Been Strong Enough To Reduce Unemployment Rate
Real GDP growth has been exceptionally weak by past expansion standards—2.3% at an annual rate on average during the nine years of expansion—but potential growth has also been lower than in past cycles and the unemployment rate has trended down. We estimate an unemployment-rate-neu-tral, or “potential” growth rate of just 1.4%, on average, for the past decade, down from 3.0% in the previous two decades.
The Fed’s mandate relates to the labor market and inflation, not GDP and inflation. Inflation remains low, but the unemployment rate is already be-low the median Fed official estimate of the full-employment level, and it is still trending down.
100
110
120
130
140
150
160
0 4 8 12 16 20 24 28 32 36
1961-69 1970-73 1975-80 1980-81 1982-90 1991-2001 2001-07 2009- Real GDP During Recoveries, Trough=100
Quarters After Trough
Current Cycle
GDP Growth Has Been Weak By Past Standards
-7
-6
-5
-4
-3
-2
-1
0
0 4 8 12 16 20 24 28 32 36
1961-69 1970-73 1975-80 1980-81 1982-90 1991-2001 2001-07 2009- Change In Unemployment Rate From Peak During Recoveries, Percentage Points
Quarters After Peak
Current Cycle
...Yet Unemployment Rate Has Been Falling Rapidly
-6
-3
0
3
6
9 -3.0
-1.5
0.0
1.5
3.0
4.5 60 65 70 75 80 85 90 95 00 05 10 15
Unemployment Rate, Change From Year Ago, Pct Pts (Left, Scale Inverted) Real GDP, %chya (Right, Scale)
Shaded Bars Denote Recession Periods
Potential Growth Rate Has Been Below 2% In Recent Years
-1
0
1
2
3
4
5
60 65 70 75 80 85 90 95 00 05 10 15 20 25
CBO Estimate Of Potential Labor Force Growth, Annual % Change CBO Estimate Of Potential Productivity Growth, Annual % Change CBO Estimate Of Potential Real GDP Growth, Annual % Change
Historical Projected
Both Productivity And Labor Force Growth Have Slowed

Carl B. Weinberg, Chief International EconomistPresentation Charts For Telus Pension Committee, November 6, 2018
www.hifreqecon.com/TELUSPC Page 6
High Frequency Economics® — Fiscal Easing + Fed Tightening + “Art of the Deal” Trade Policy = ? September 26, 2018 Page 4
© 2018 High Frequency Economics, Ltd. 445 Hamilton Avenue, White Plains, NY 10601. All rights reserved. No secondary distribution without express permission. www.hifreqecon.com
Tight Labor Market Just Starting To Put Upward Pressure On Wages; Core PCE Inflation Up To 2% The unemployment rate has continued to decline and wage gains have started to edge up. The average hourly earnings series was up 2.9% y/y in August, up from 2.5% y/y last year. The private wage series in the ECI was up 2.9% y/y in Q2, versus 2.6% y/y in all of 2017 and 2.3% y/y in 2016. Moreover, wage gains and inflation are not supposed to accelerate significantly until the unemployment rate drops below the estimated NAIRU level, and that just happened during 2017. Upward pressure on wages is likely to intensify as the unemployment rate falls some more.
Core inflation has moved up recently as well, although the extent to which the rise is slack-related, or due to other factors, is still unclear. The 12-month change in the core PCE index is 2.0%, in line with the Fed’s goal for the overall PCE index over time.
-1.5
0.0
1.5
3.0
4.5
07 09 11 13 15 17
Core PCE Price Index, %chya Total PCE Price Index, %chya
Fed's 2% Goal For PCE Prices
Mission Accomplished For Fed? Core PCE Inflation At 2.0%
0.5
1.0
1.5
2.0
2.5
3.0
3.5
-30
-20
-10
0
10
20
30
40
03 05 07 09 11 13 15 17
NFIB: Net Percentage Raising Average Selling Prices (Left) Core CPI, %chya (Right) Core PCE Price Index, %chya (Right)
...NFIB Selling Price Series Is Showing Net Strengthening
1.2
2.0
2.8
3.6
07 09 11 13 15 17
ECI: Private Sector Wages & Salaries, %chya Employment Report: Average Hourly Earnings, %chya
Wage Gains Have Been Accelerating, Most Clearly In The ECI
-2.4
-1.2
0.0
1.2
-5.0
-2.5
0.0
2.5
83 87 91 95 99 03 07 11 15
CBO Estimate Of Unemployment Gap* (Left) Acceleration/Deceleration In Private Wage Component Of ECI† (Right)
*Reported unemployment rate minus CBO estimate of NAIRU. †%chya minus %chya one year earlier, four-quarter average.
...Consistent With The NAIRU Framework
The unemployment rate has continued to decline and wage gains have started to edge up. The average hourly earnings series was up 3.1% y/y in October, up from 2.5% y/y last year. The private wage series in the ECI was up 3.1% y/y in Q3, versus 2.9% y/y in all of 2017 and 2.3% y/y in 2016. Moreover, wage gains and inflation are not supposed to accelerate significantly until the unemployment rate drops below the estimated NAIRU level, and that just happened during 2017. Upward pressure on wages is likely to intensify as the unemployment rate falls some more.
Core inflation has moved up recently as well, although the extent to which the rise is slack-related, or due to other factors, is still unclear. The 12-month change in the core PCE index is 2.0%, in line with the Fed’s goal for the overall PCE index over time.

Carl B. Weinberg, Chief International EconomistPresentation Charts For Telus Pension Committee, November 6, 2018
www.hifreqecon.com/TELUSPC Page 7
High Frequency Economics® — Fiscal Easing + Fed Tightening + “Art of the Deal” Trade Policy = ? September 26, 2018 Page 11
© 2018 High Frequency Economics, Ltd. 445 Hamilton Avenue, White Plains, NY 10601. All rights reserved. No secondary distribution without express permission. www.hifreqecon.com
Fed Likely To Keep Tightening As Unemployment Keeps FallingThe Fed has raised the funds rate by 175 basis points thus far. Markets are pricing in about another 90 basis points by the end of 2019, below the 125 basis points implied by the dot plot. We think Fed officials will have to tighten by more than they expect as the unemployment rate keeps falling.
The funds rate is roughly zero in real terms. The neutral real level may well be lower now than in the past, but the current level is almost 300 basis points below the level at the end of the last tightening cycle. Moreover, the expanded balance sheet is also still providing stimulus.
2.1
2.3
2.5
2.7
2.9
3.1
3.3
3.5
0
2
4
6
8
10
12
14
83 87 91 95 99 03 07 11 15
10-Year Treasury Yield, % (Left) S&P 500, Log Scale (Right) Bars Denote Fed Tightening Periods
Markets Have Varied During Fed Tightening Cycles
Fed Officials’ Estimates For Appropriate Fed Funds Rate
% At Year-End, as of June 2018 FOMC Meeting
2018 2019 2020Longer
RunMedian Estimate 2.375 3.125 3.375 2.875Mean Estimate 2.242 2.958 3.308 2.825
Fed Officials’ Economic Projections
Median, %ch Q4/Q4, Unless Noted, as of June 2018 FOMC Meeting
2018 2019 2020Longer
RunReal GDP 2.8 2.4 2.0 1.8Unemployment Rate* 3.6 3.5 3.5 4.5PCE Prices 2.1 2.1 2.1 2.0Core PCE Prices 2.0 2.1 2.1*Q4 level
Nominal Funds Rate Target (%)
Real Funds Rate (%)*
Start End Start End Start EndMar 83 Aug 84 8.50 11.50 2.6 7.5Apr 87 Feb 89 6.00 9.75 3.2 5.1Feb 94 Feb 95 3.00 6.00 0.8 3.7Jun 99 May 00 4.75 6.50 3.5 4.8Jun 04 Jun 06 1.00 5.25 -0.9 2.9Dec 15 0.13 -1.3*Deflated with %chya in core PCE prices.
Fed Tightening Cycles
3.5
4.5
5.5
6.5
7.5
8.5
9.5
11 12 13 14 15 16 17 18 19 20
Actual Reported Rate Mid-Point Of Fed Projections, As Of Nov 2011 Mid-Point Of Fed Projections, As Of Jun 2014 Mid-Point Of Fed Projections, As Of Jun 2015 Median Of Fed Projections, As Of Jun 2016 Median Of Fed Projections, As Of Jun 2017 Median Of Fed Projections, As Of Jun 2018
Unemployment Rate, %
Median Fed Estimate For Longer-Run Normal Unemployment Rate: 4.5%
Unemployment Keeps Falling Faster Than Expected By The Fed
The Fed has raised the funds rate by 200 basis points thus far. Markets are pricing in about another 90 basis points by the end of 2019, below the 100 basis points implied by the dot plot. We think Fed officials will have to tighten by more than they expect as the unemployment rate keeps falling.
The funds rate is roughly zero in real terms. The neutral real level may well be lower now than in the past, but the current level is 300 basis points below the level at the end of the last tighten-ing cycle. Moreover, the expanded balance sheet is also still providing stimulus. We don’t expect any new signal on policy from Fed officials this week, consistent with no backing away from the gradual tightening path signaled by the dot plot at the last meeting. We suspect the weakening in equities is being viewed as no more than minor volatility at this point
Fed Officials’ Economic Projections
Median, %ch Q4/Q4, Unless Noted
2018 2019 2020 2021Longer
RunReal GDP
June 2018 2.8 2.4 2.0 1.8September 2018 3.1 2.5 2.0 1.8 1.8
Unemployment Rate*June 2018 3.6 3.5 3.5 4.5September 2018 3.7 3.5 3.5 3.7 4.5
PCE InflationJune 2018 2.1 2.1 2.1 2.0September 2018 2.1 2.0 2.1 2.1 2.0
Core PCE PricesJune 2018 2.0 2.1 2.1September 2018 2.0 2.1 2.1 2.1
*Q4 Level, %
Fed Officials’ Estimates For Appropriate Fed Funds Rate
% At Year-End
2018 2019 2020 2021Longer
RunMedian Estimate
June 2018 2.375 3.125 3.375 2.875September 2018 2.375 3.125 3.375 3.375 3.0
Mean Estimate
June 2018 2.242 2.958 3.308 2.825September 2018 2.313 3.016 3.281 3.234 2.883

Carl B. Weinberg, Chief International EconomistPresentation Charts For Telus Pension Committee, November 6, 2018
www.hifreqecon.com/TELUSPC Page 8
-12
-10
-8
-6
-4
-2
0
2
4
00 Q3
01 Q3
02 Q3
03 Q3
04 Q3
05 Q3
06 Q3
07 Q3
08 Q3
09 Q3
10 Q3
11 Q3
12 Q3
13 Q3
14 Q3
15 Q3
16 Q3
17 Q3
18 Q3p
Euro Zone: GDP Growth
Line Shows Percent Change Year Ago, Bars Show Quarterly Annualized Rate
-8
-6
-4
-2
0
2
4
6
Sep 03
Sep 04
Sep 05
Sep 06
Sep 07
Sep 08
Sep 09
Sep 10
Sep 11
Sep 12
Sep 13
Sep 14
Sep 15
Sep 16
Sep 17
Sep 18f
Euro Zone: Retail Sales Volume, Percent Change Year Ago
Green Line Shows Annualized Change Of 3-Month Moving Average
-1.0 -0.5 0.0 0.5 1.0 1.5 2.0 2.5 3.0 3.5
Oct 09
Apr 10
Oct 10
Apr 11
Oct 11
Apr 12
Oct 12
Apr 13
Oct 13
Apr 14
Oct 14
Apr 15
Oct 15
Apr 16
Oct 16
Apr 17
Oct 17
Apr 18
Oct 18f
Apr 19f
Oct 19f
Euro Zone: CPI, Percent Change Year Ago
Blue Bars Are CPI, Green Line Is Core CPI, Black Line Is ECB Inflation Target Oct 18 Onward Is HFE Forecast
-35 -30 -25 -20 -15 -10 -5 0 5 10
Aug 03
Aug 04
Aug 05
Aug 06
Aug 07
Aug 08
Aug 09
Aug 10
Aug 11
Aug 12
Aug 13
Aug 14
Aug 15
Aug 16
Aug 17
Aug 18
Euro Zone: Industrial Production, Percent Change Year Ago Black Line Shows Annualized Percentage Change In Three-Month Moving Average Blue Line Shows Percent Change Since April 2008 Peak

Carl B. Weinberg, Chief International EconomistPresentation Charts For Telus Pension Committee, November 6, 2018
www.hifreqecon.com/TELUSPC Page 9
0
0.5
1
1.5
2
2.5
3
3.5
Q2 09
Q4 09
Q2 10
Q4 10
Q2 11
Q4 11
Q2 12
Q4 12
Q2 13
Q4 13
Q2 14
Q4 14
Q2 15
Q4 15
Q2 16
Q4 16
Q2 17
Q4 17
Q2 18
Euro Zone: Total Labor Costs Vs Wage Costs
Percent Change Year Ago, Bars Show Total Labor Costs, Line Shows Wage Costs Only
0
2
4
6
8
10
12
14
Sep 04
Sep 05
Sep 06
Sep 07
Sep 08
Sep 09
Sep 10
Sep 11
Sep 12
Sep 13
Sep 14
Sep 15
Sep 16
Sep 17
Sep 18
Euro Zone Ex-Germany: Unemployment Rate, Percent
Monthly Data, Calculations By HFE, Yellow Bars Show Eurozone Ex-Germany Red Bars Are Total Euro Zone
-6
-3
0
3
6
9
12
15
Sep 00
Sep 01
Sep 02
Sep 03
Sep 04
Sep 05
Sep 06
Sep 07
Sep 08
Sep 09
Sep 10
Sep 11
Sep 12
Sep 13
Sep 14
Sep 15
Sep 16
Sep 17
Sep 18
Total MFI Lending Lending To SMEs Ex-Mortgages Mortgages
Euro Zone: Bank Lending, Percent Change Year Ago
-3.5 -3.0 -2.5 -2.0 -1.5 -1.0 -0.5 0.0 0.5 1.0 1.5 2.0 2.5 3.0
Jul 08
Mar 09
Nov 09
Jul 10
Mar 11
Nov 11
Jul 12
Mar 13
Nov 13
Jul 14
Mar 15
Nov 15
Jul 16
Mar 17
Nov 17
Jul 18
Euro Zone: Employment, Percent Change Year Ago
Line Is Three-Month Moving Average
Carl B. Weinberg, Chief International EconomistPresentation Charts For Telus Pension Committee, November 6, 2018
www.hifreqecon.com/TELUSPC Page 10
-15
-10
-5
0
5
10
15
20
25
0
2
4
6
8
10
12
10 Q3
11 Q1
11 Q3
12 Q1
12 Q3
13 Q1
13 Q3
14 Q1
14 Q3
15 Q1
15 Q3
16 Q1
16 Q3
17 Q1
17 Q3
18 Q1
18 Q3
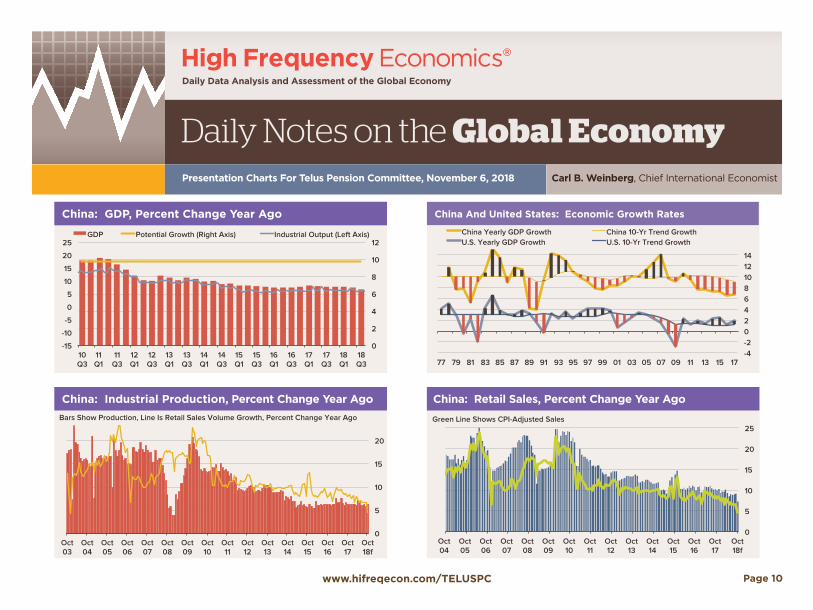
GDP Potential Growth (Right Axis) Industrial Output (Left Axis)
China: GDP Vs Industrial Output, Percent Change Year Ago China: GDP, Percent Change Year Ago
0
5
10
15
20
25
Oct 04
Oct 05
Oct 06
Oct 07
Oct 08
Oct 09
Oct 10
Oct 11
Oct 12
Oct 13
Oct 14
Oct 15
Oct 16
Oct 17
Oct 18f
China: Retail Sales, Percent Change Year Ago
Green Line Shows CPI-Adjusted Sales
China: Retail Sales, Percent Change Year Ago
-4 -2 0 2 4 6 8 10 12 14
77 79 81 83 85 87 89 91 93 95 97 99 01 03 05 07 09 11 13 15 17
China Yearly GDP Growth China 10-Yr Trend Growth U.S. Yearly GDP Growth U.S. 10-Yr Trend Growth
China And United States: Economic Growth Rates
0
5
10
15
20
Oct 03
Oct 04
Oct 05
Oct 06
Oct 07
Oct 08
Oct 09
Oct 10
Oct 11
Oct 12
Oct 13
Oct 14
Oct 15
Oct 16
Oct 17
Oct 18f
China: Industrial Production Vs Retail Sales Volumes
Bars Show Production, Line Is Retail Sales Volume Growth, Percent Change Year Ago
China: Industrial Production, Percent Change Year Ago

Carl B. Weinberg, Chief International EconomistPresentation Charts For Telus Pension Committee, November 6, 2018
www.hifreqecon.com/TELUSPC Page 11
The Silk Road Is The Future: Embrace It

Carl B. Weinberg, Chief International EconomistPresentation Charts For Telus Pension Committee, November 6, 2018
www.hifreqecon.com/TELUSPC Page 12
The Silk Roads And OBORTrade
Links 60% Of The World’s Population Europe Is 340 million China Is 1.4 billion Others Are 2.7 billion
Who Jointly Produce 40% Of The World’s GDP. Europe Is 12%, China Is 17%, Others Are 11%
Containers Do Not Have To Go Back Toward China EmptyFor EU Exporters, A Ten-Fold Increase In The Number Of Consumers They Can Reach!

Carl B. Weinberg, Chief International EconomistPresentation Charts For Telus Pension Committee, November 6, 2018
www.hifreqecon.com/TELUSPC Page 13
The Prize: Made In China 2025• Research and development: Establish 15 national “innovation centers” by
2020 and 40 by 2025, to develop technologies.
• Manufacture smarter: Lower operating costs, shorten production times and slash defect rates, each by 30% by 2020 and 50% by 2025.
• Industrial self sufficiency: Produce 40% of core components in all manu-facturing by 2020, 70% by 2025.
• Environmental responsibility: In all sectors, reduce emissions per unit pro-duced by 20%, lower energy use per unit of output below world average by 2025 and build 1,000 green factories by 2025.
• Build significant shares of global manufacturing of ten sectors : Aerospace, rail, high-tech autos, hi-tech marine, power grids, machine tools, nuclear plants and equipment, medical equipment.

Carl B. Weinberg, Chief International EconomistPresentation Charts For Telus Pension Committee, November 6, 2018
www.hifreqecon.com/TELUSPC Page 14
Recommended