The Venture Capital Opportunity in South East Asia
Affin Hwang Capital Conference Series 2015 Navigating Through Turbulent Times

Hi! I’m Alexander Jarvis
• Partner at Jungle responsible for SEA investments
• Helped build some $1bn+ companies
• Financial Institutions M&A (London)
Some of my Previous Experience
There’s a lot of money to be made in Venture Capital
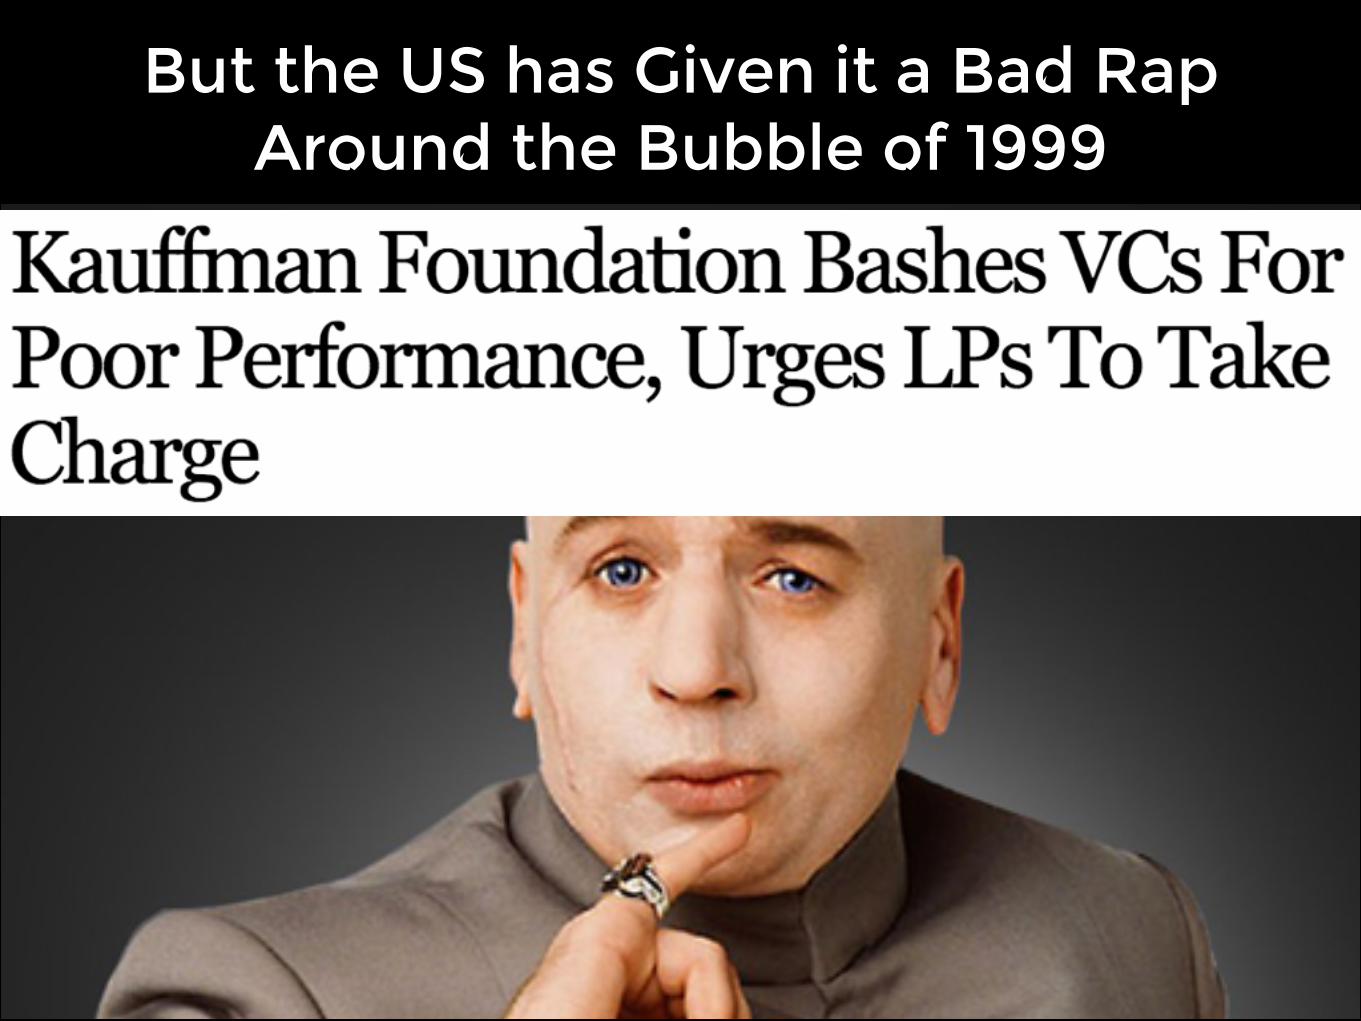
But the US has Given it a Bad Rap Around the Bubble of 1999
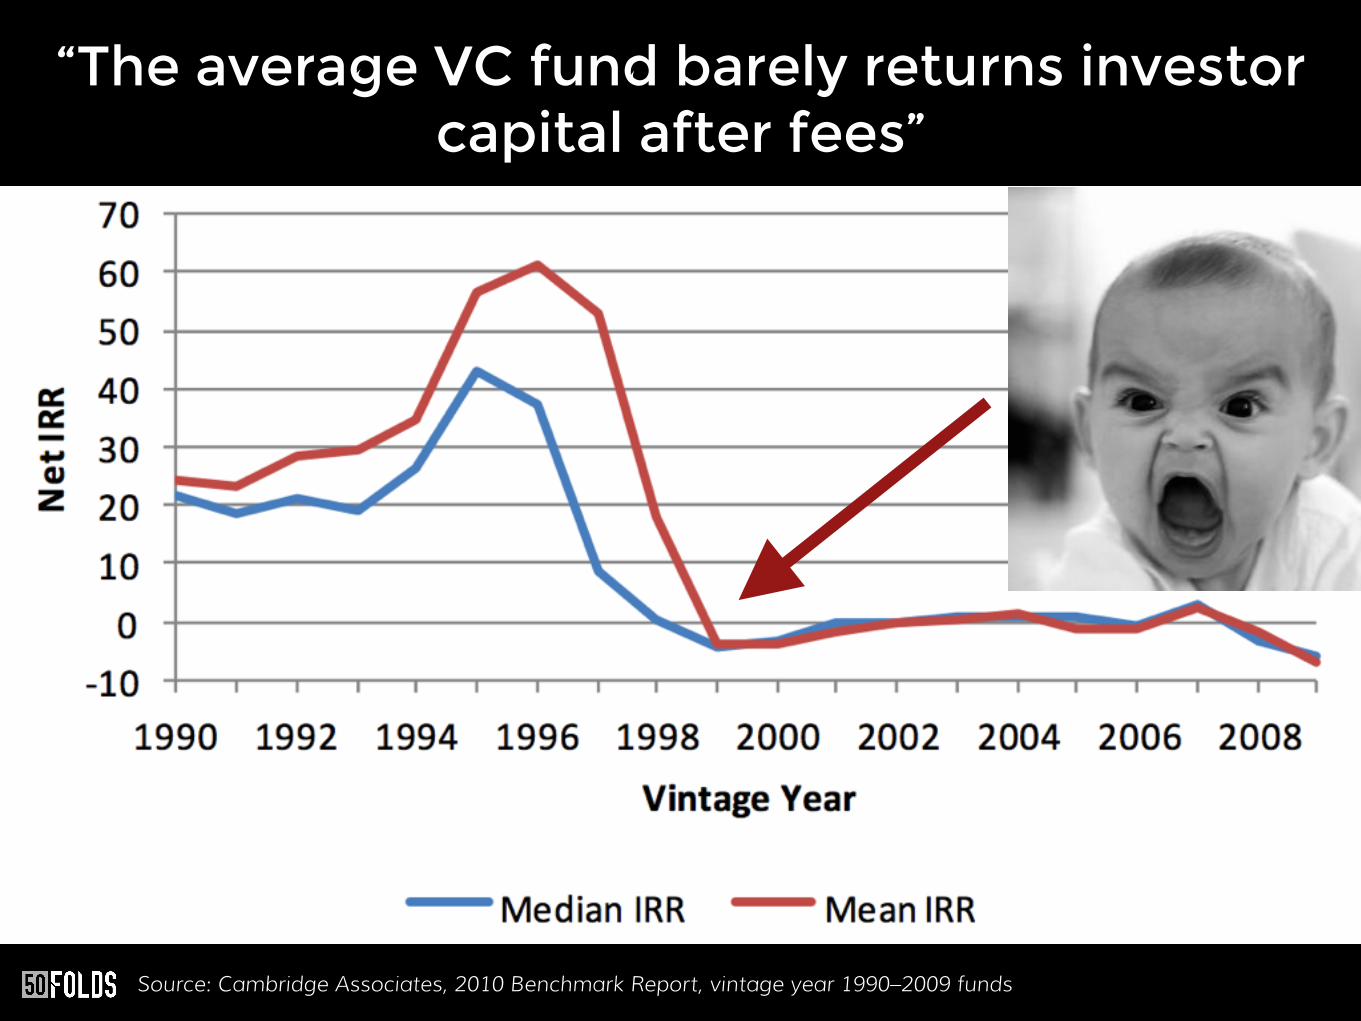
“The average VC fund barely returns investor capital after fees”
Source: Cambridge Associates, 2010 Benchmark Report, vintage year 1990–2009 funds
All attributed to US investor Mark Suster from Upfront Ventures presentation “It’s morning in VC.” Read it!
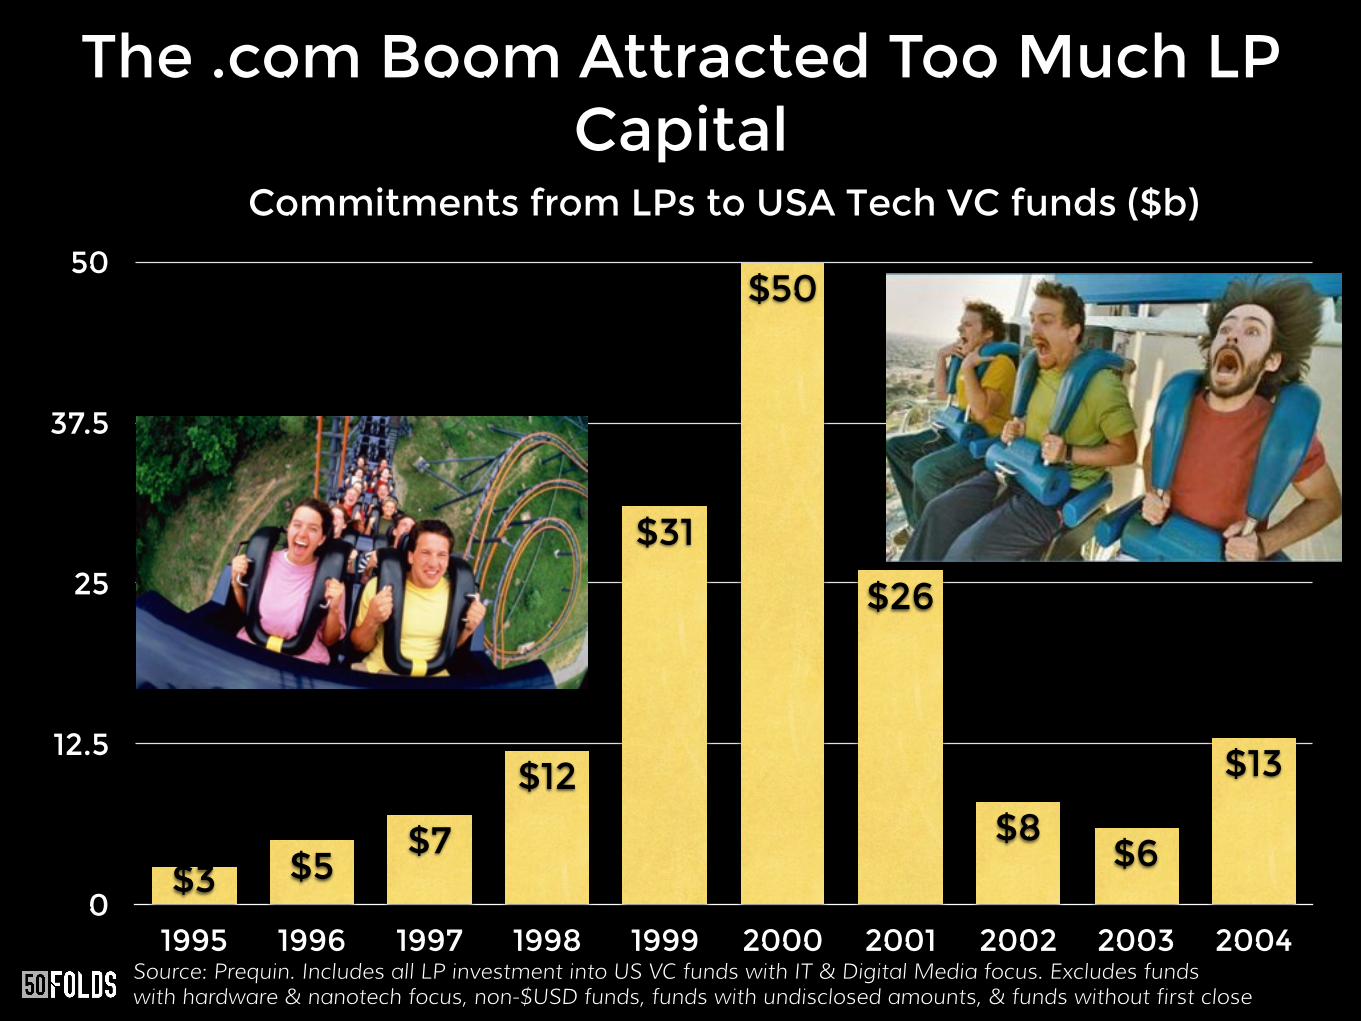
The .com Boom Attracted Too Much LP Capital
Commitments from LPs to USA Tech VC funds ($b)
0
12.5
25
37.5
50
1995 1996 1997 1998 1999 2000 2001 2002 2003 2004
$13
$6$8
$26
$50
$31
$12
$7$5$3
Source: Prequin. Includes all LP investment into US VC funds with IT & Digital Media focus. Excludes funds with hardware & nanotech focus, non-$USD funds, funds with undisclosed amounts, & funds without first close
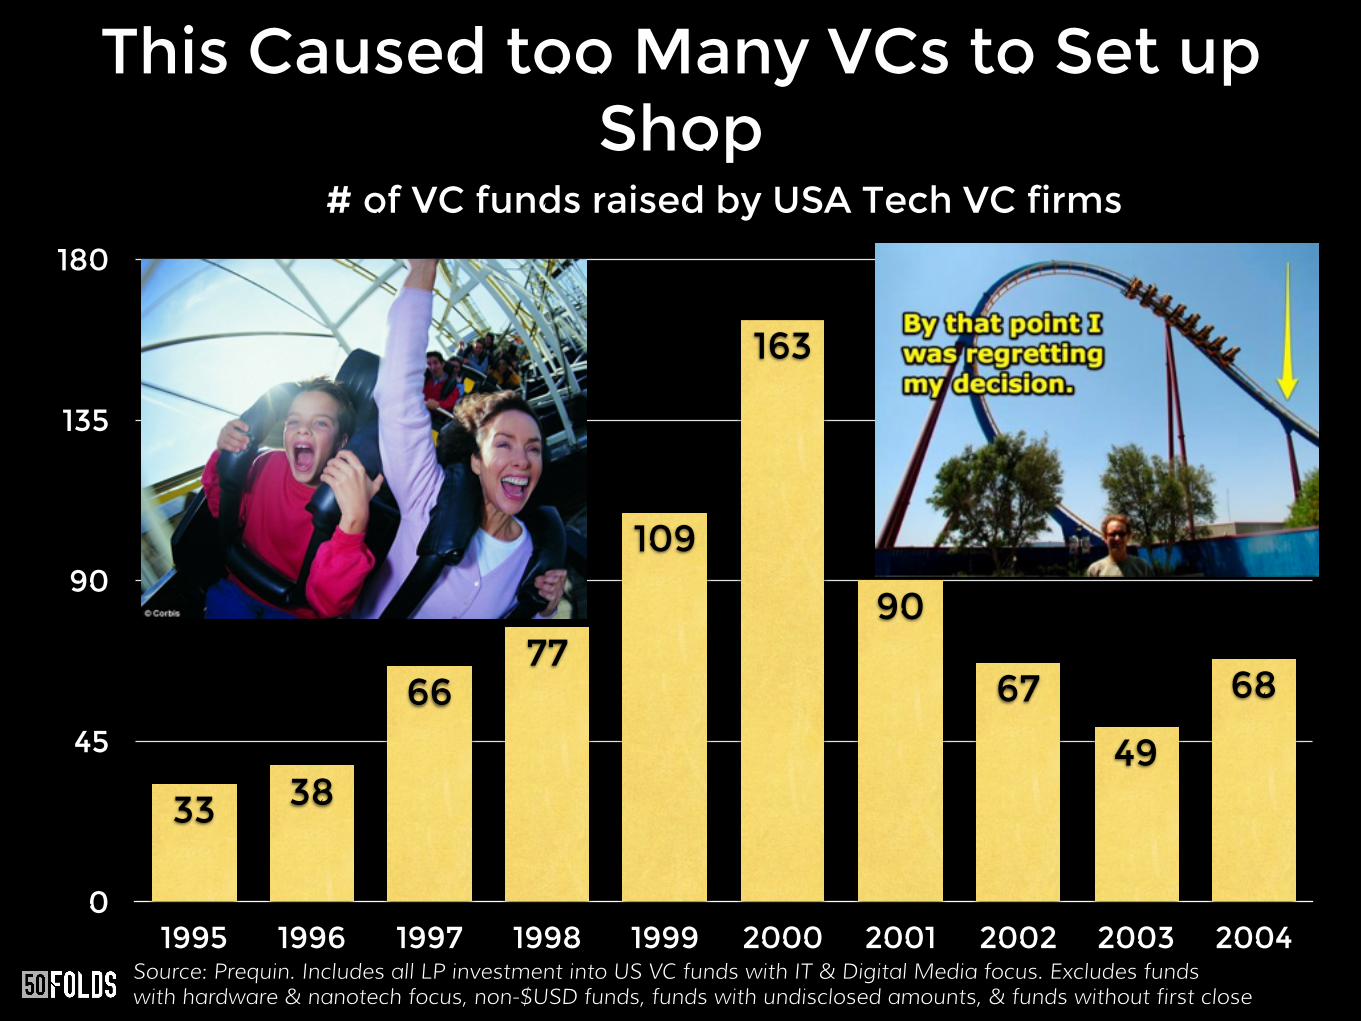
This Caused too Many VCs to Set up Shop
# of VC funds raised by USA Tech VC firms
0
45
90
135
180
1995 1996 1997 1998 1999 2000 2001 2002 2003 2004
68
49
67
90
163
109
7766
3833
Source: Prequin. Includes all LP investment into US VC funds with IT & Digital Media focus. Excludes funds with hardware & nanotech focus, non-$USD funds, funds with undisclosed amounts, & funds without first close
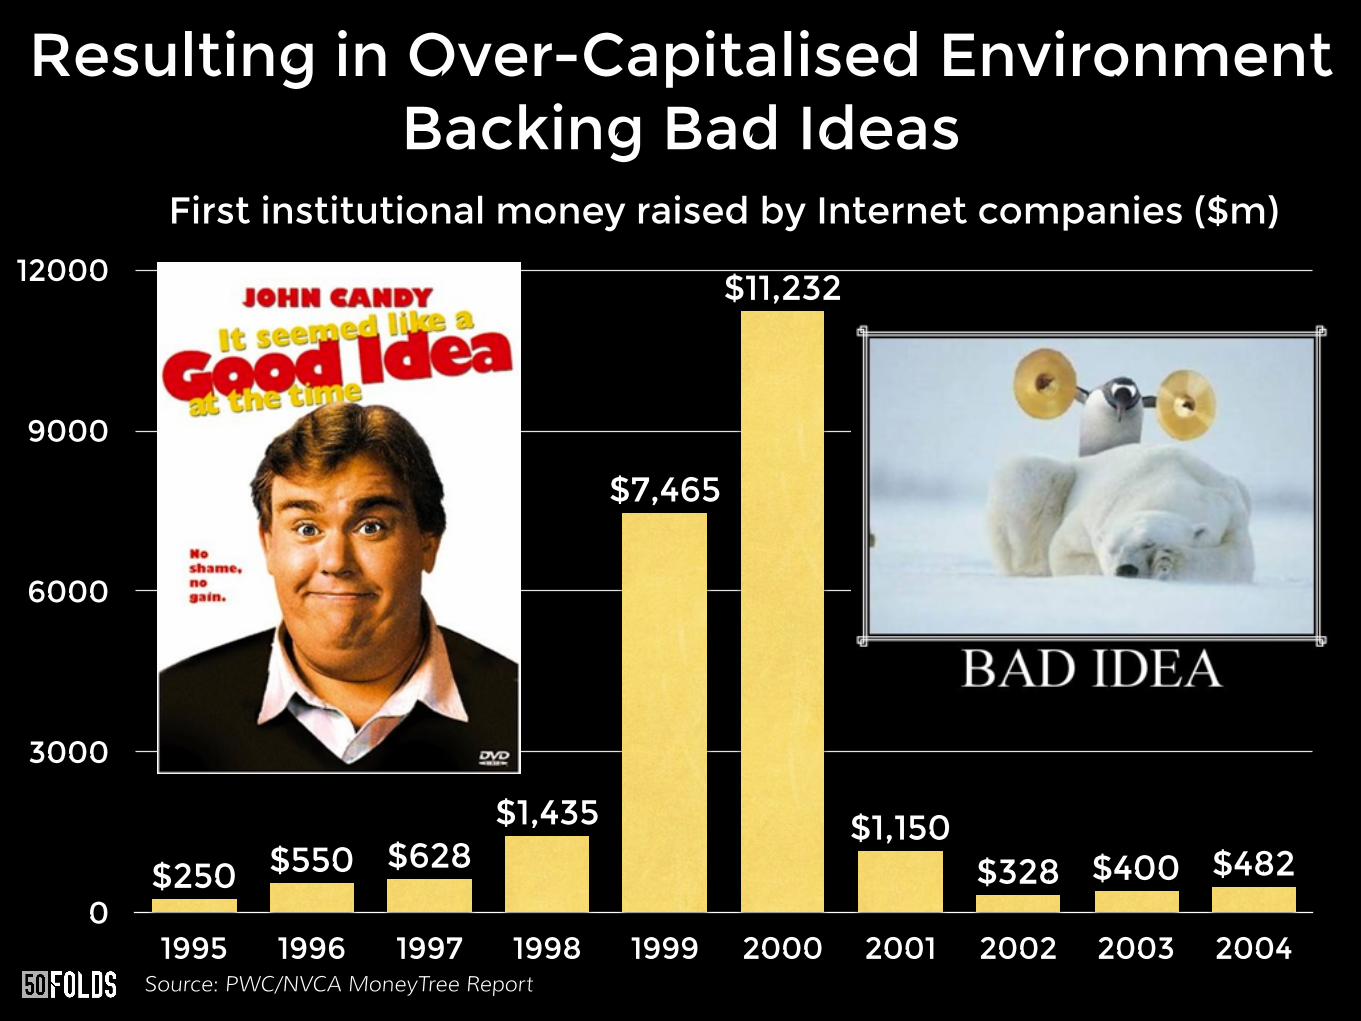
Resulting in Over-Capitalised Environment Backing Bad Ideas
First institutional money raised by Internet companies ($m)
0
3000
6000
9000
12000
1995 1996 1997 1998 1999 2000 2001 2002 2003 2004
$482$400$328$1,150
$11,232
$7,465
$1,435$628$550$250
Source: PWC/NVCA MoneyTree Report
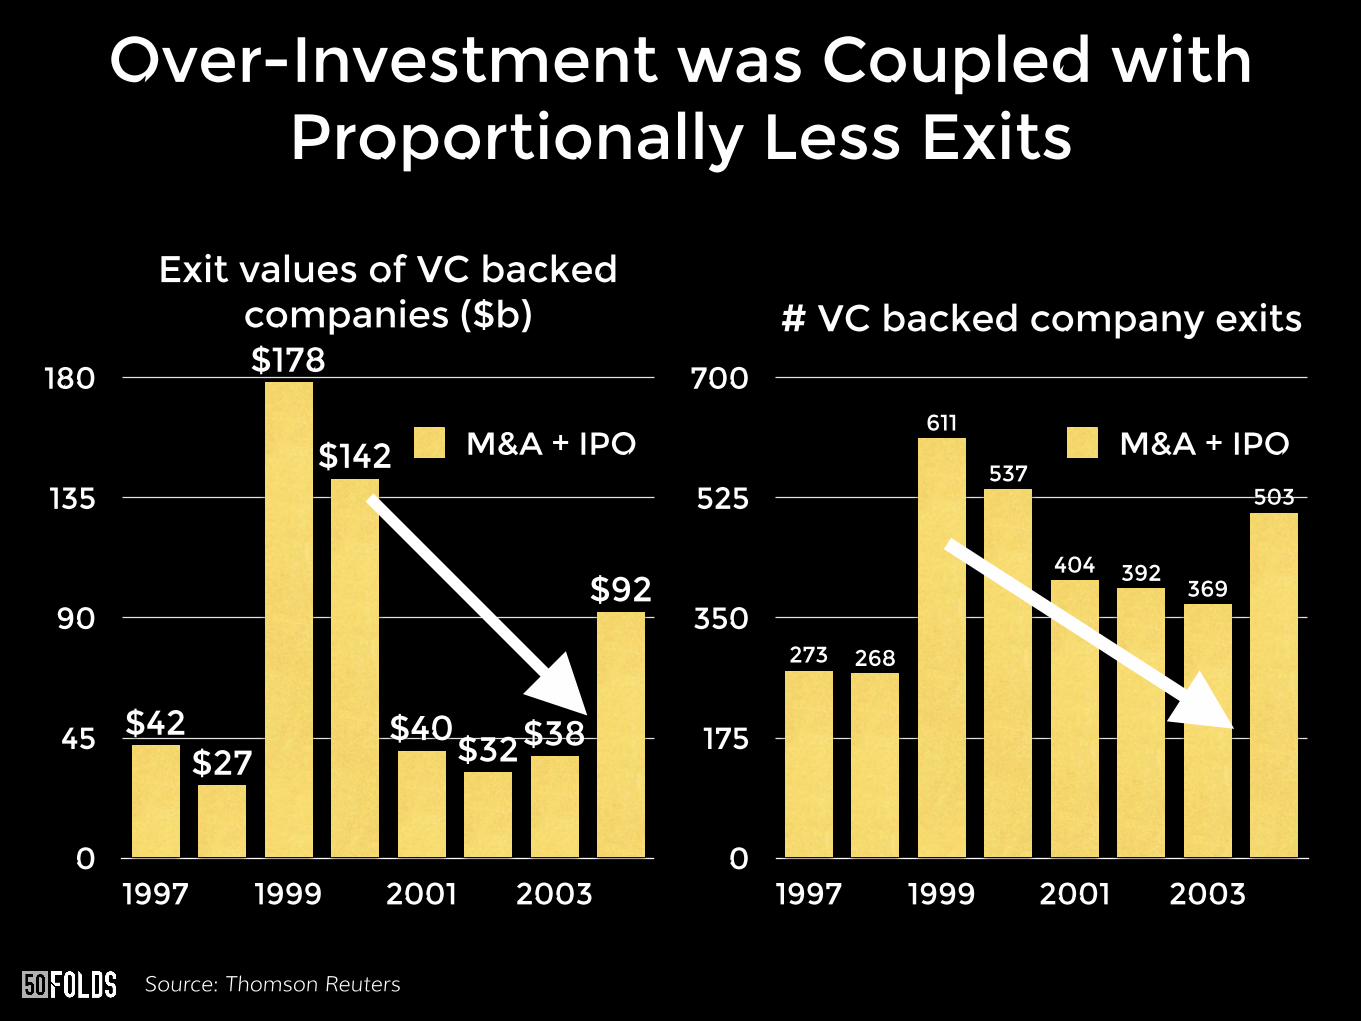
Over-Investment was Coupled with Proportionally Less Exits
Exit values of VC backed companies ($b)
0
45
90
135
180
1997 1999 2001 2003
$92
$38$32$40
$142
$178
$27$42
M&A + IPO
# VC backed company exits
0
175
350
525
700
1997 1999 2001 2003
503
369392404
537
611
268273
M&A + IPO
Source: Thomson Reuters
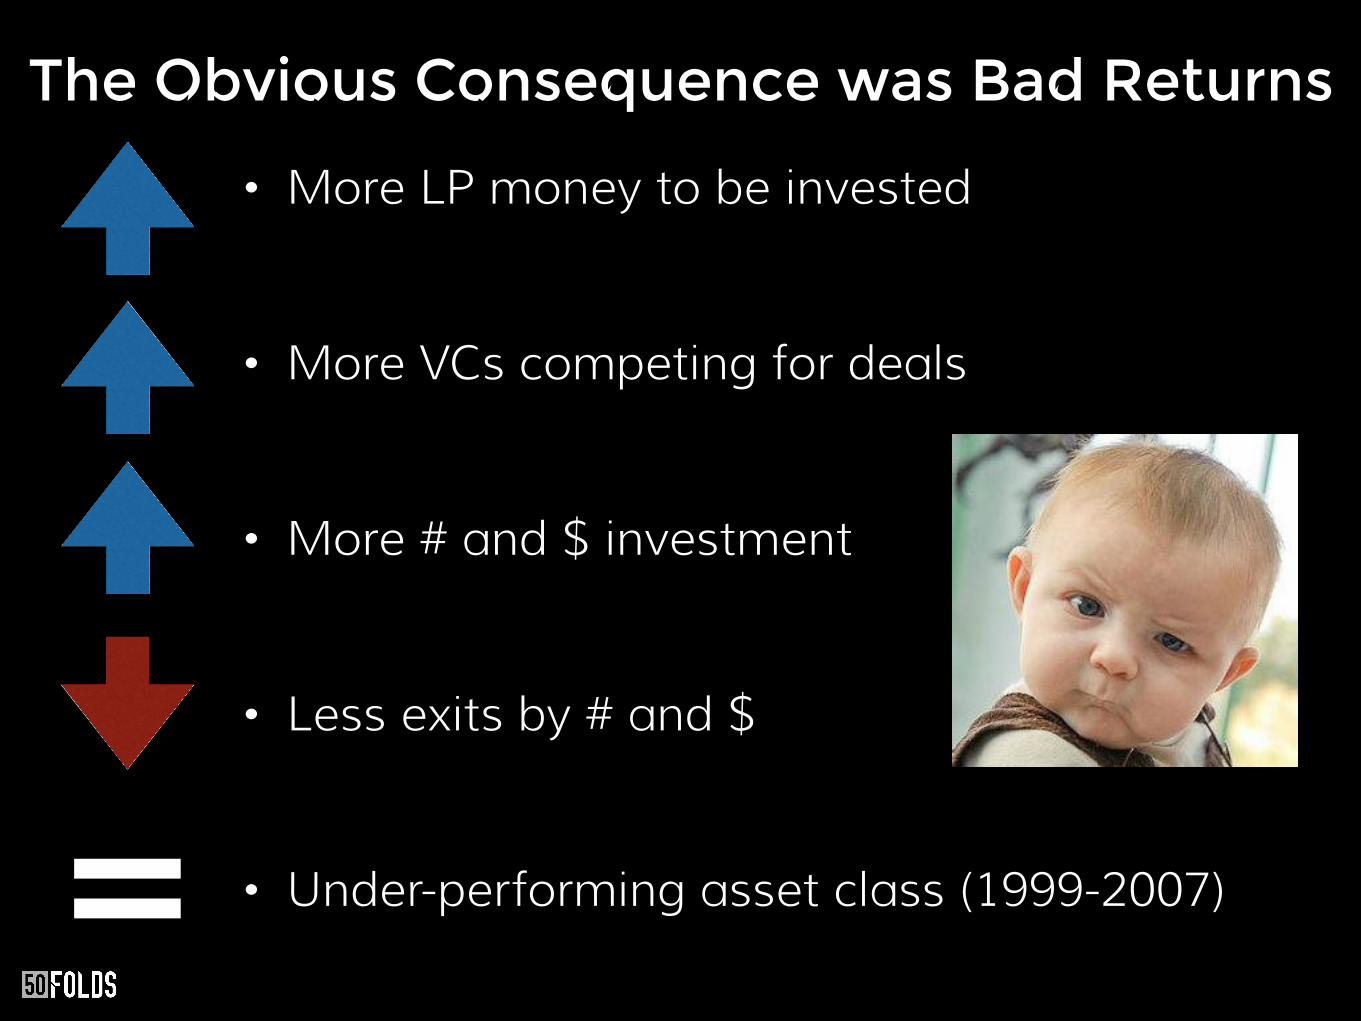
• More LP money to be invested
• More VCs competing for deals
• More # and $ investment
• Less exits by # and $
• Under-performing asset class (1999-2007)
The Obvious Consequence was Bad Returns
=

LPs
?

Not Exactly… So What Changed?
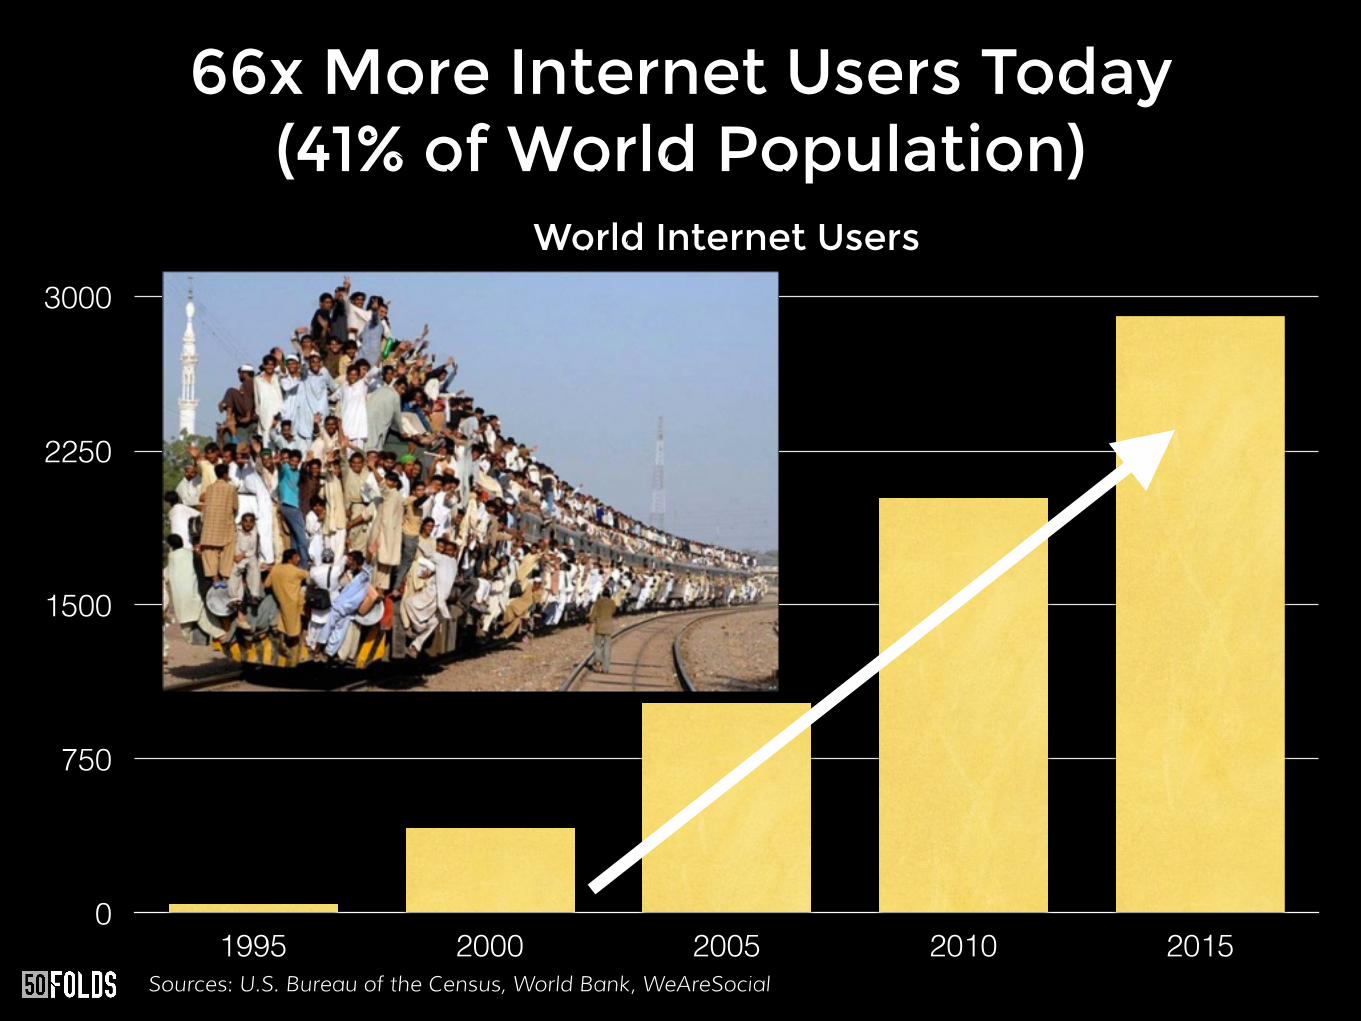
66x More Internet Users Today (41% of World Population)
2,908
2015
41%
66x
World Internet Users
0
750
1500
2250
3000
1995 2000 2005 2010 2015Sources: U.S. Bureau of the Census, World Bank, WeAreSocial
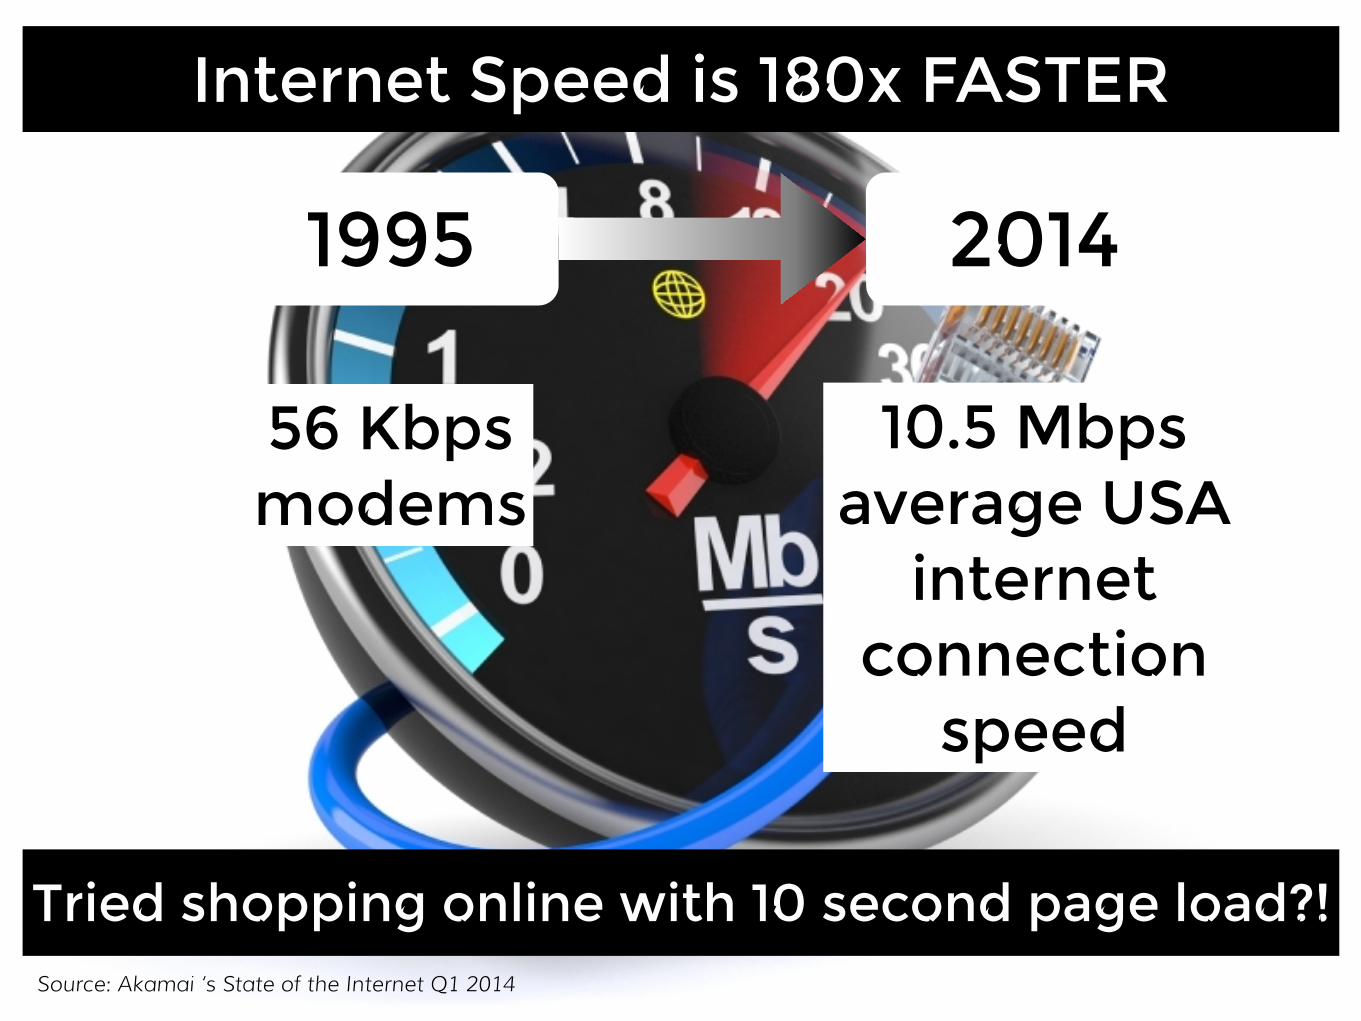
Internet Speed is 180x FASTER
1995 2014
56 Kbps modems
10.5 Mbps average USA
internet connection
speed
Source: Akamai ‘s State of the Internet Q1 2014
Tried shopping online with 10 second page load?!
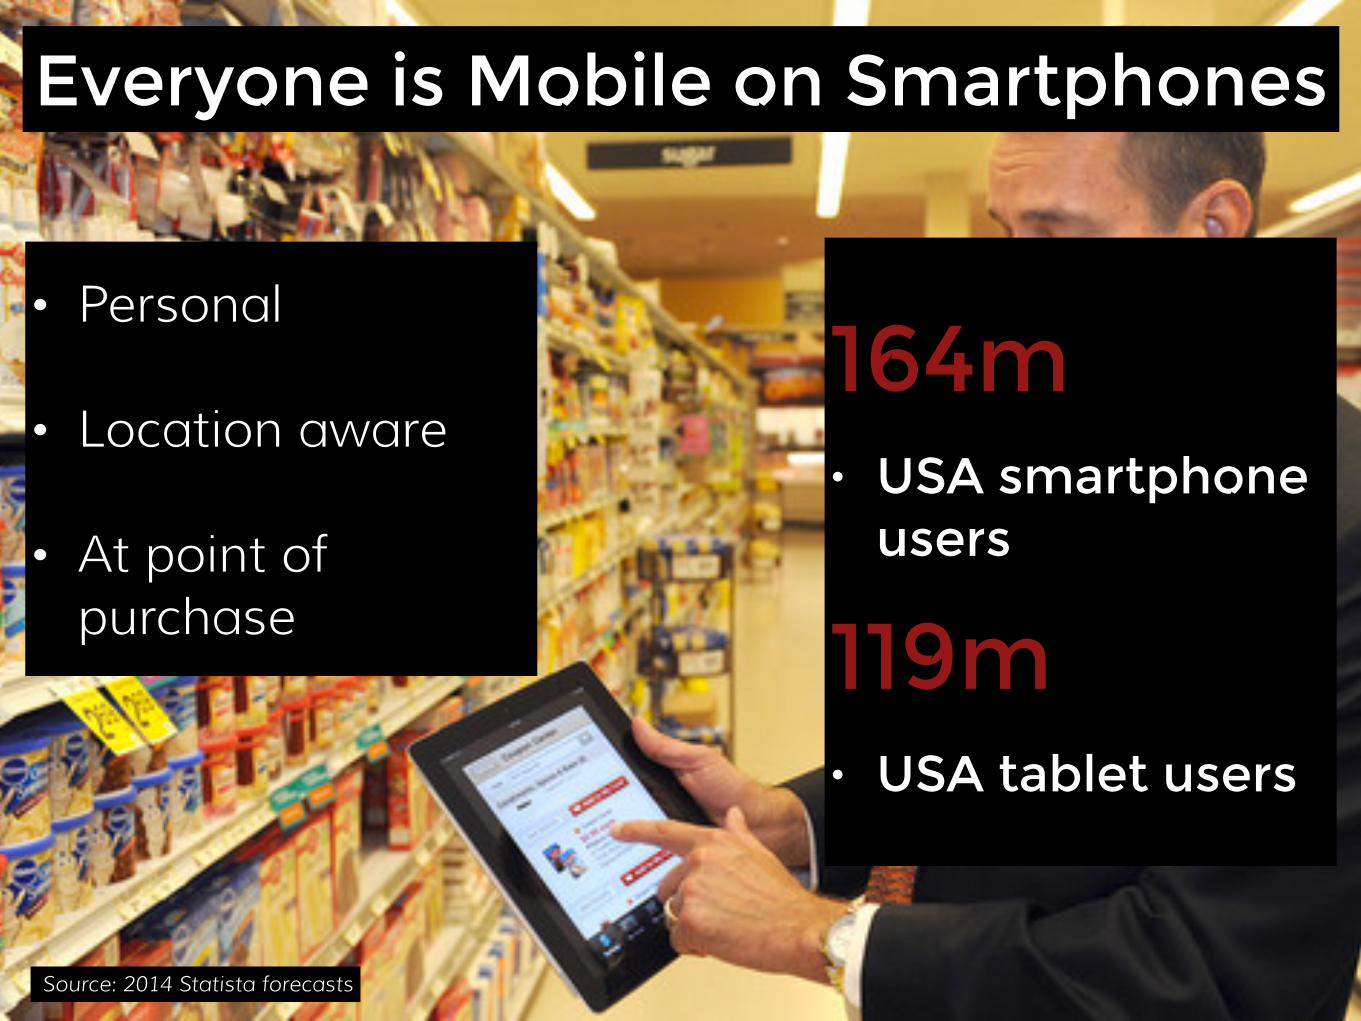
Everyone is Mobile on Smartphones
• Personal
• Location aware
• At point of purchase
164m • USA smartphone
users
119m • USA tablet users
Source: 2014 Statista forecasts
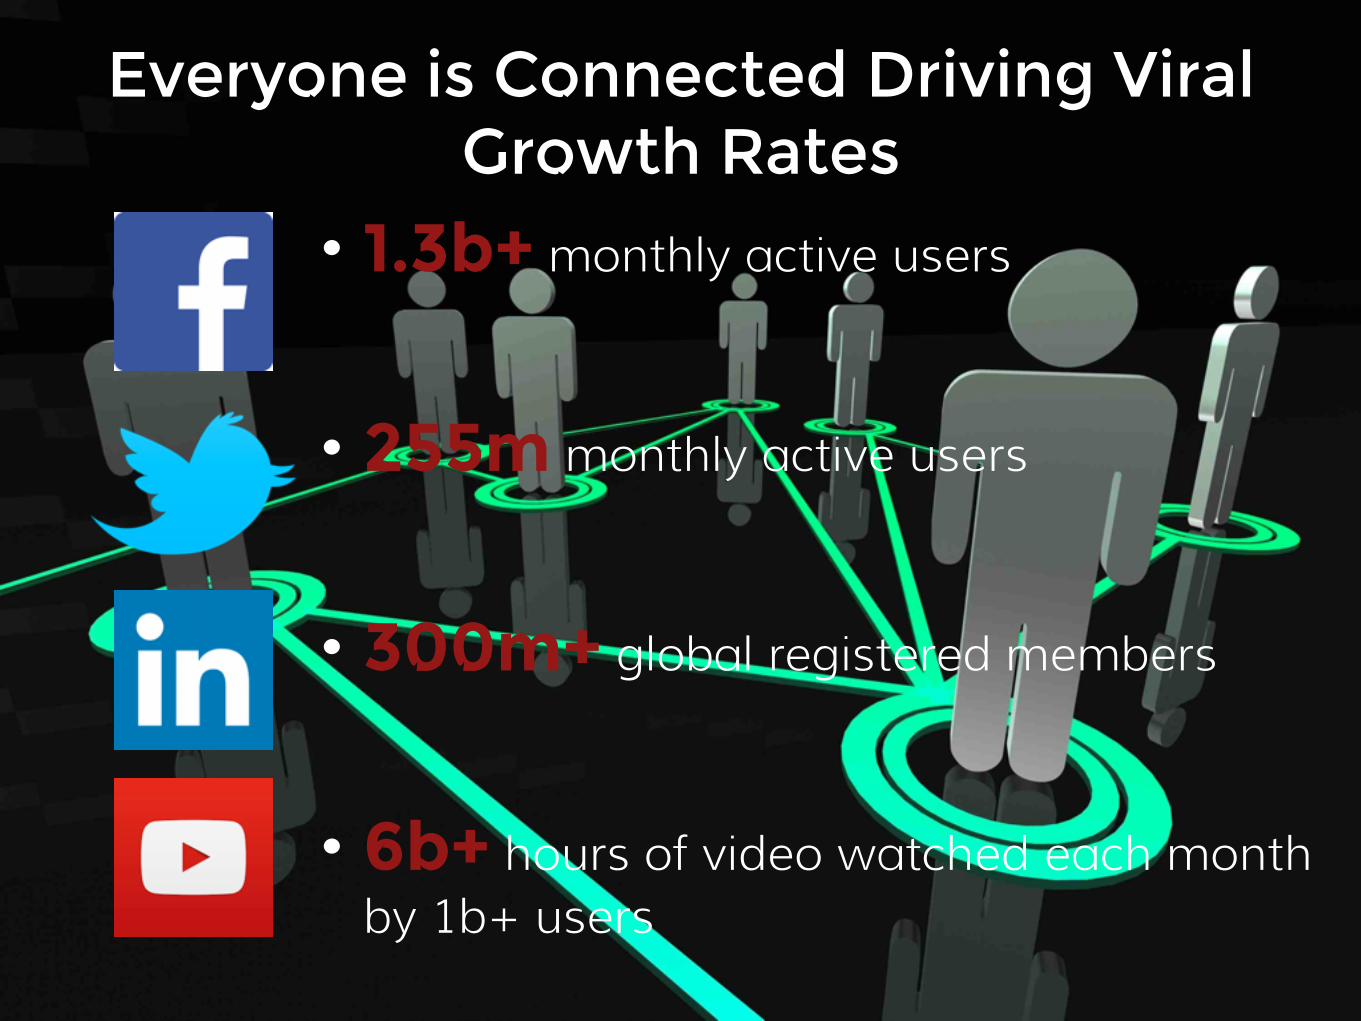
Everyone is Connected Driving Viral Growth Rates
• 1.3b+ monthly active users
• 255m monthly active users
• 300m+ global registered members
• 6b+ hours of video watched each month by 1b+ users
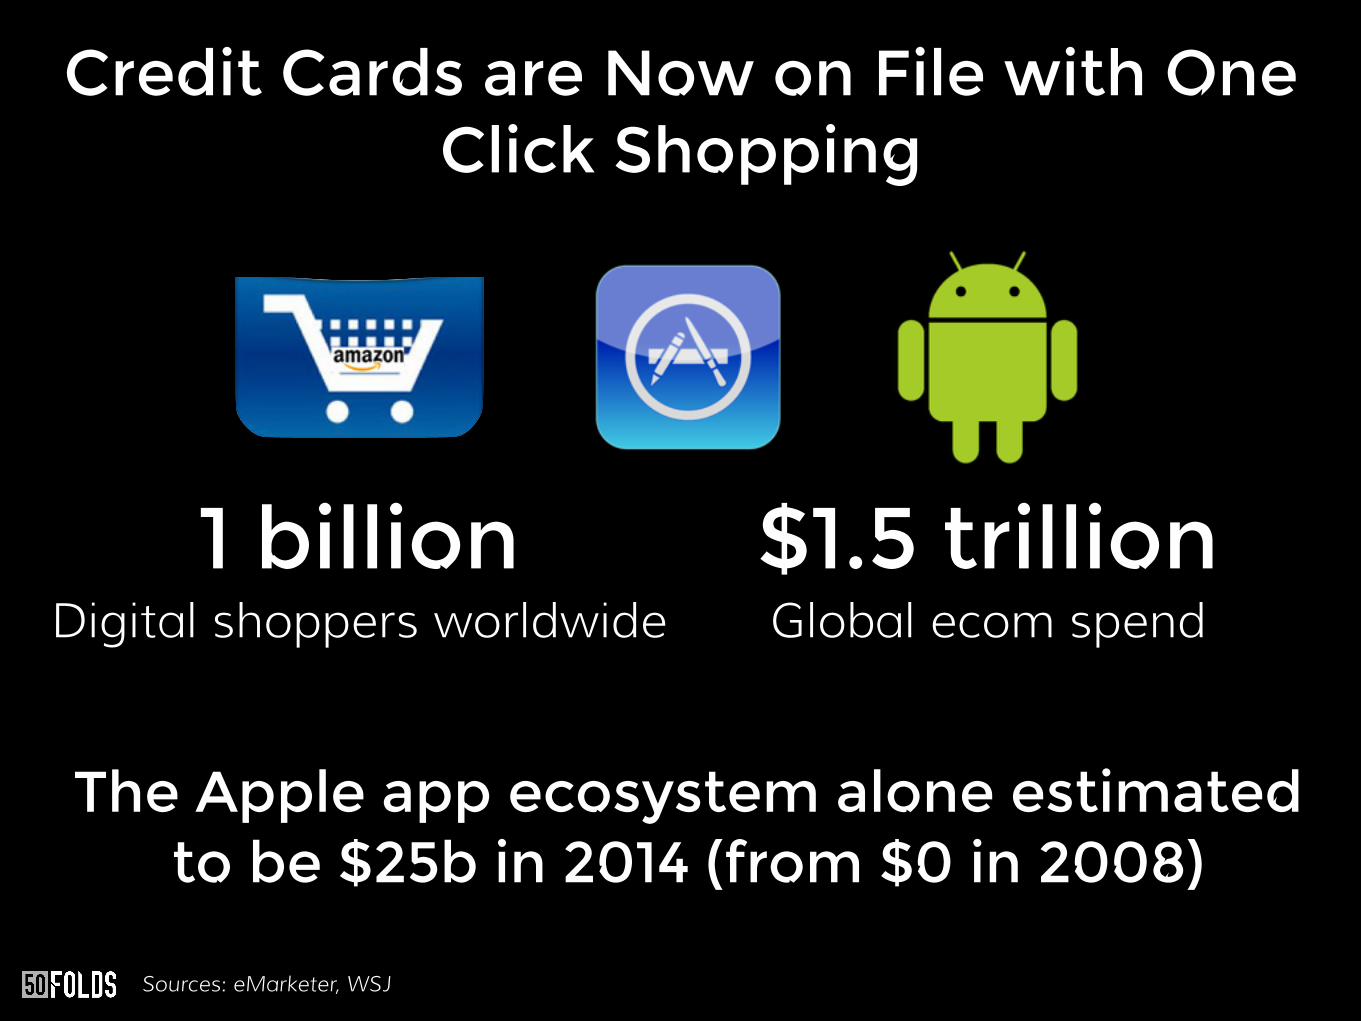
Credit Cards are Now on File with One Click Shopping
1 billion Digital shoppers worldwide
$1.5 trillion Global ecom spend
The Apple app ecosystem alone estimated to be $25b in 2014 (from $0 in 2008)
Sources: eMarketer, WSJ
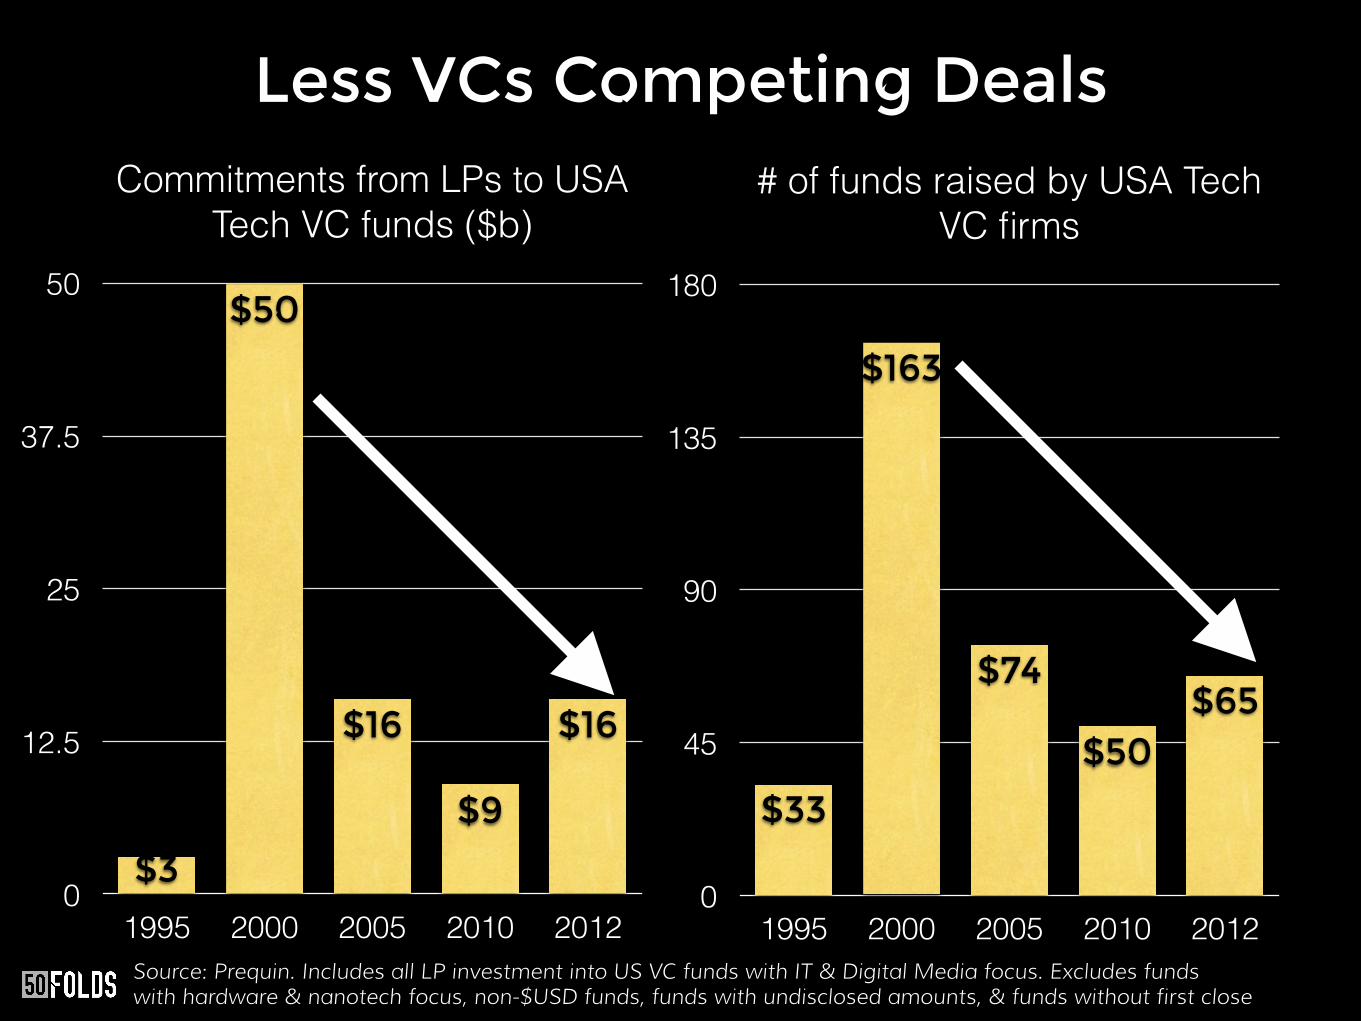
Less VCs Competing DealsCommitments from LPs to USA
Tech VC funds ($b)
0
12.5
25
37.5
50
1995 2000 2005 2010 2012
$16
$9
$16
$50
$3
# of funds raised by USA Tech VC firms
0
45
90
135
180
1995 2000 2005 2010 2012
$65$50
$74
$163
$33
Source: Prequin. Includes all LP investment into US VC funds with IT & Digital Media focus. Excludes funds with hardware & nanotech focus, non-$USD funds, funds with undisclosed amounts, & funds without first close
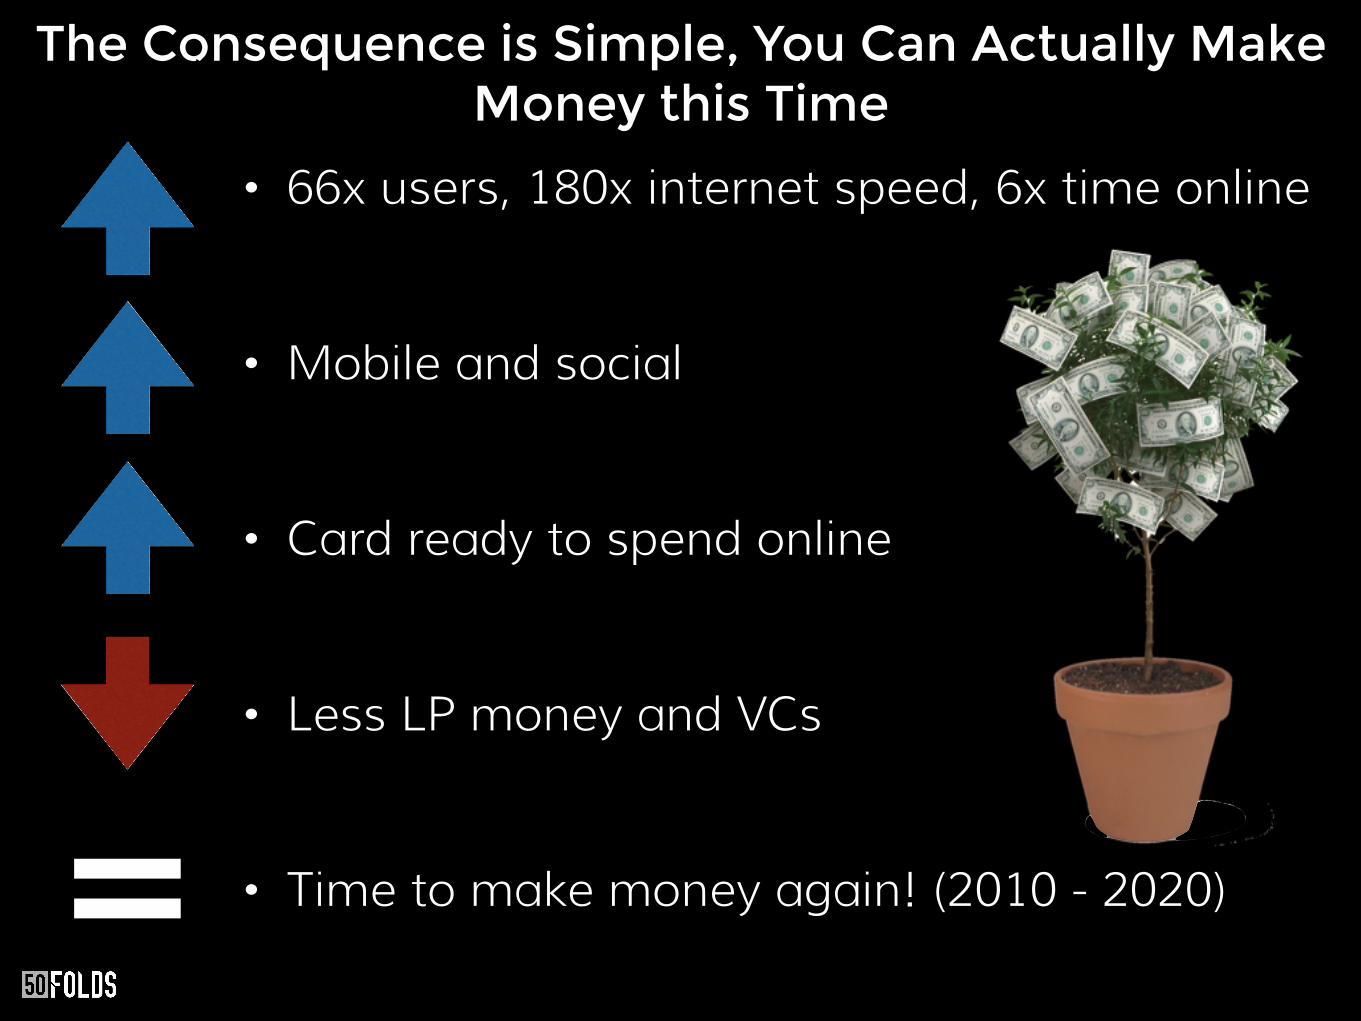
• 66x users, 180x internet speed, 6x time online
• Mobile and social
• Card ready to spend online
• Less LP money and VCs
• Time to make money again! (2010 - 2020)
The Consequence is Simple, You Can Actually Make Money this Time
=

That’s America, but what About Here?
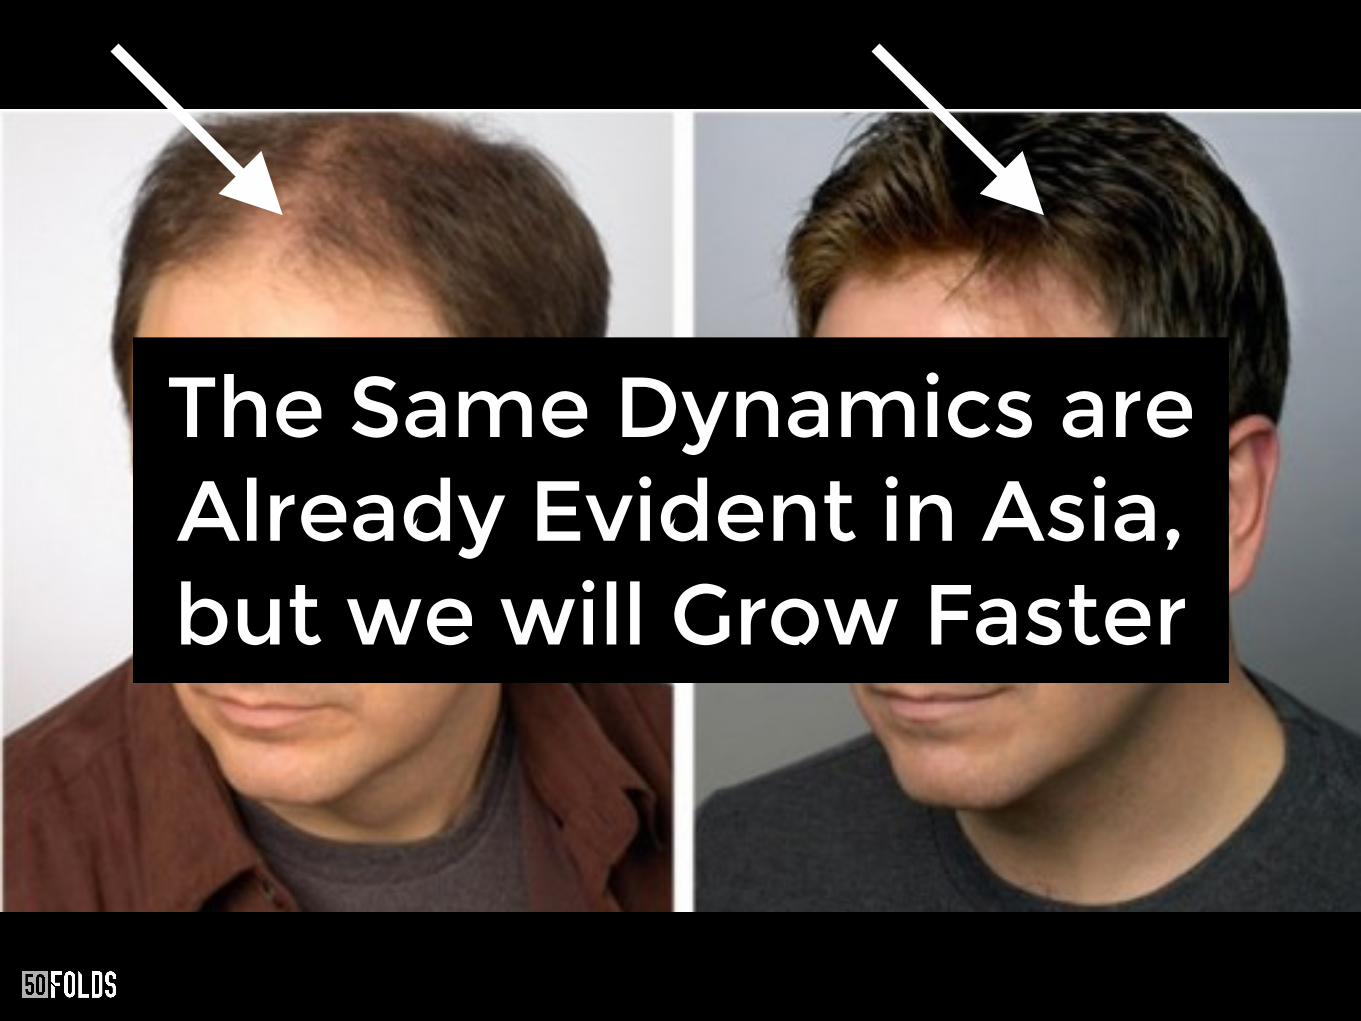
The Same Dynamics are Already Evident in Asia, but we will Grow Faster
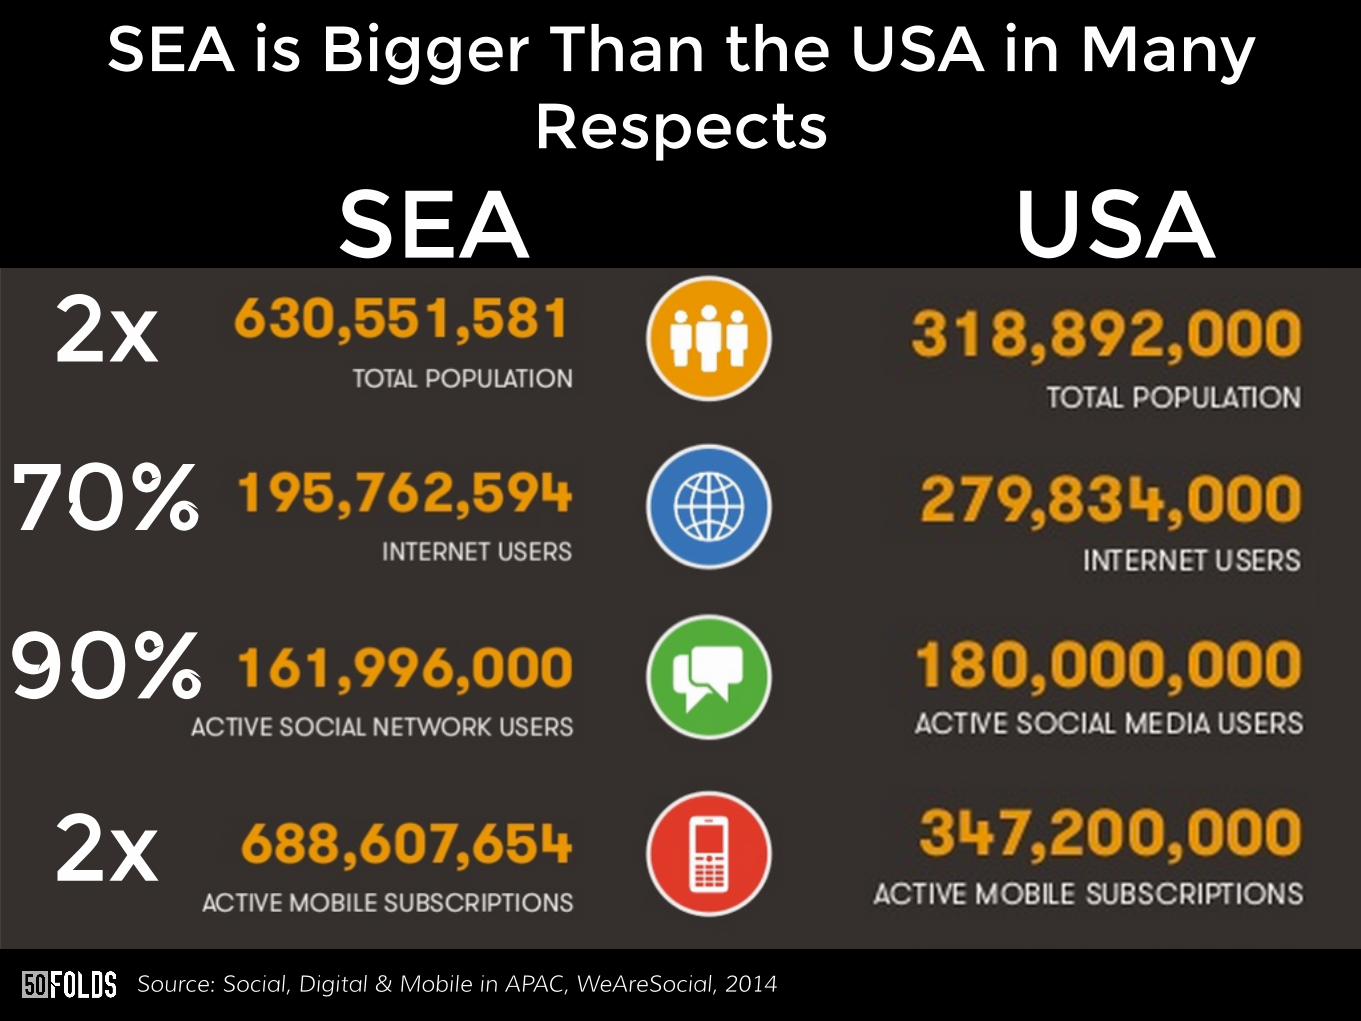
SEA is Bigger Than the USA in Many Respects
Source: Social, Digital & Mobile in APAC, WeAreSocial, 2014
SEA USA2x
70%
90%
2x
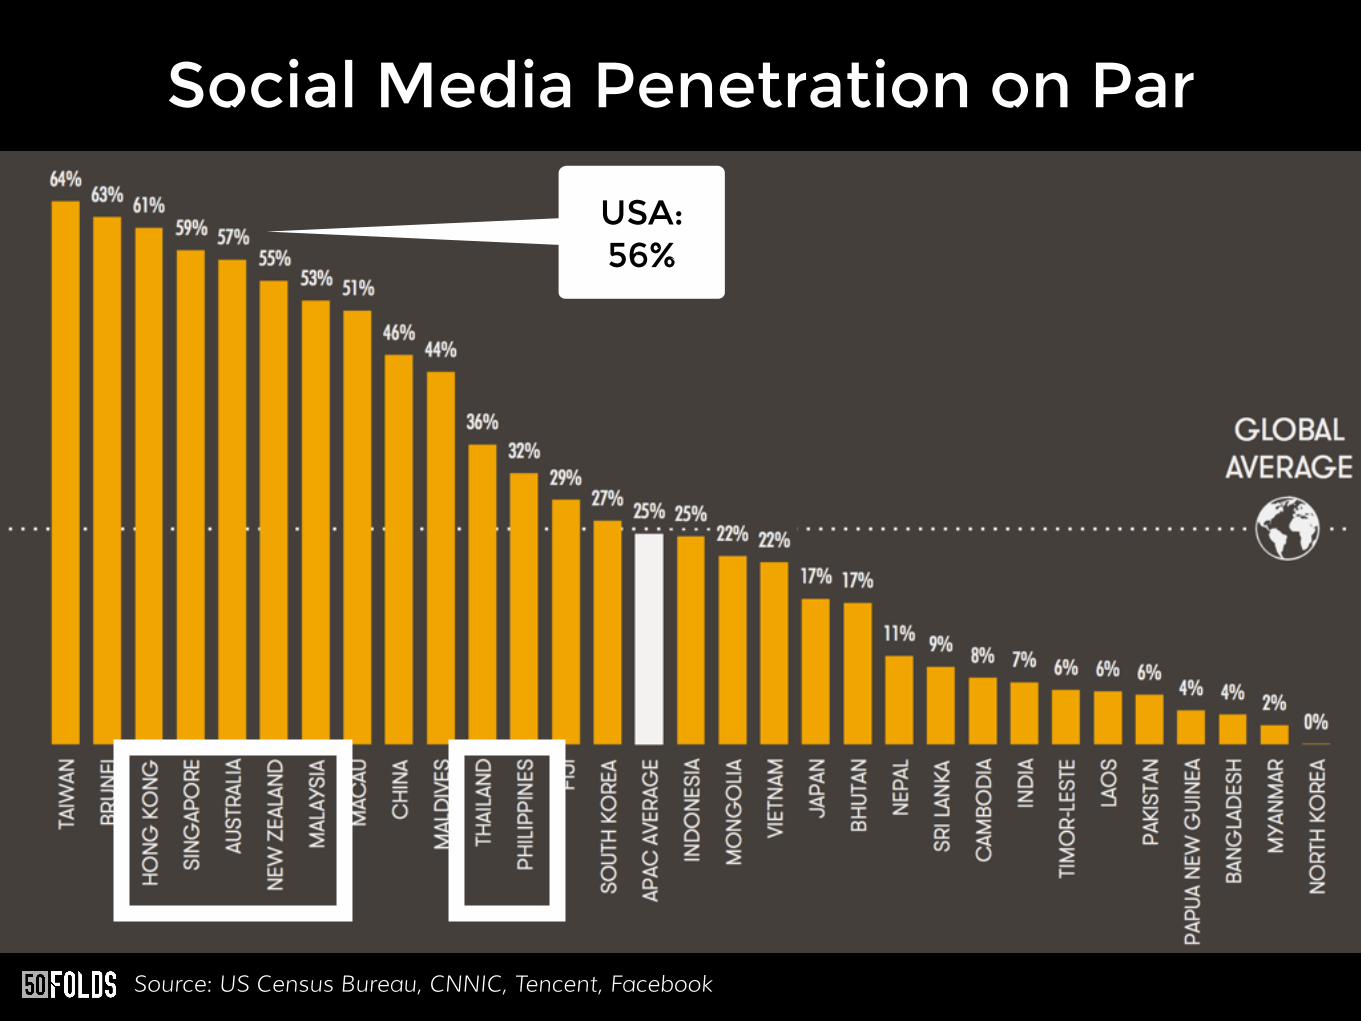
Social Media Penetration on Par
Source: US Census Bureau, CNNIC, Tencent, Facebook
USA: 56%
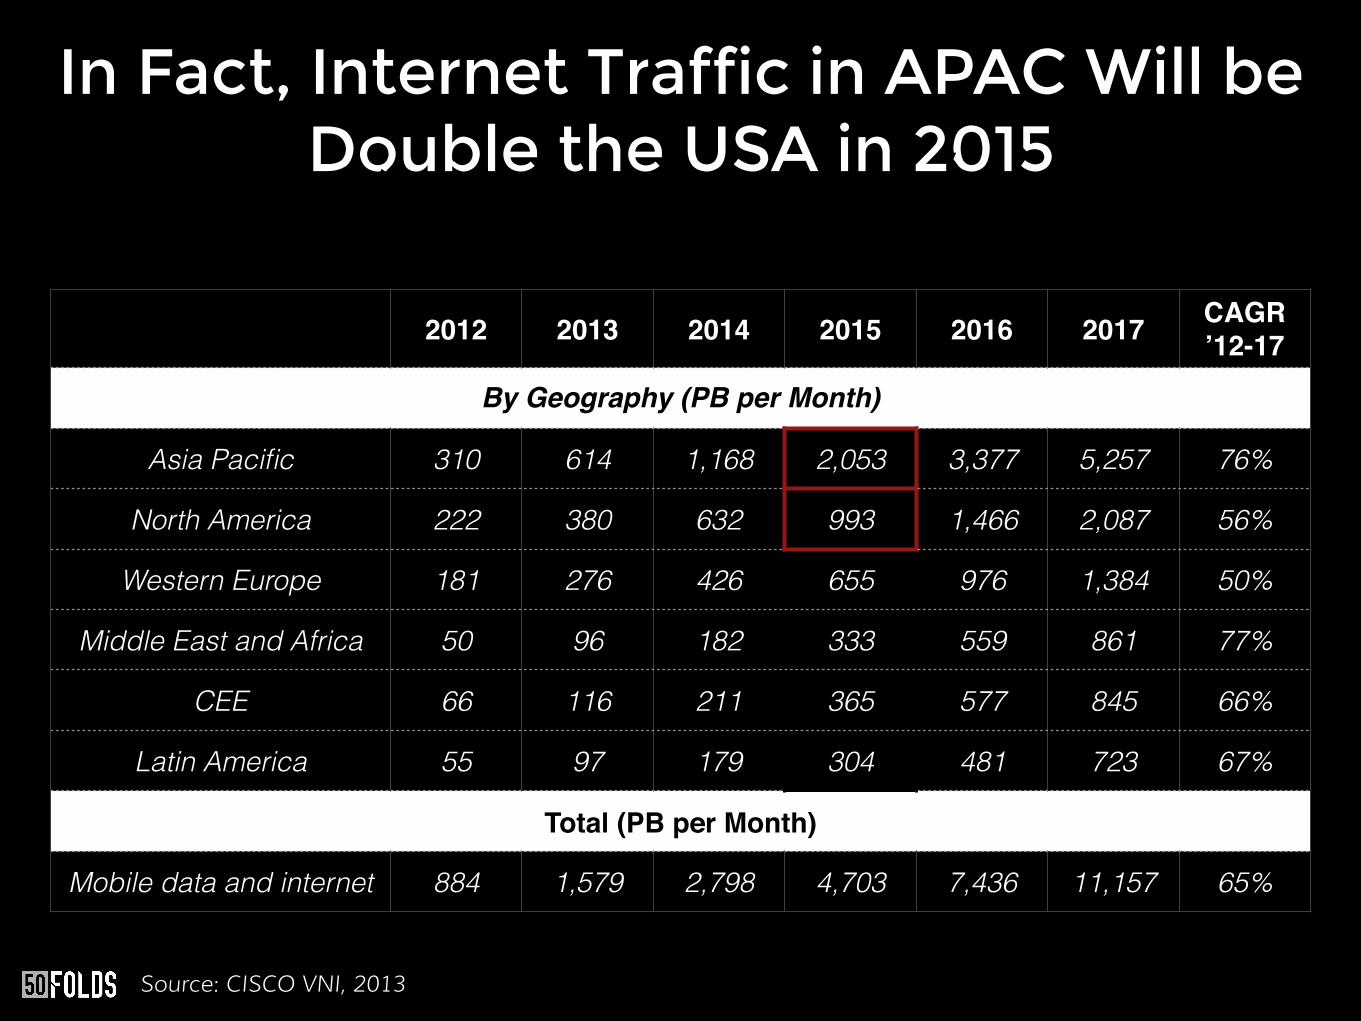
In Fact, Internet Traffic in APAC Will be Double the USA in 2015
2012 2013 2014 2015 2016 2017 CAGR ’12-17
By Geography (PB per Month)
Asia Pacific 310 614 1,168 2,053 3,377 5,257 76%
North America 222 380 632 993 1,466 2,087 56%
Western Europe 181 276 426 655 976 1,384 50%
Middle East and Africa 50 96 182 333 559 861 77%
CEE 66 116 211 365 577 845 66%
Latin America 55 97 179 304 481 723 67%
Total (PB per Month)
Mobile data and internet 884 1,579 2,798 4,703 7,436 11,157 65%
Source: CISCO VNI, 2013
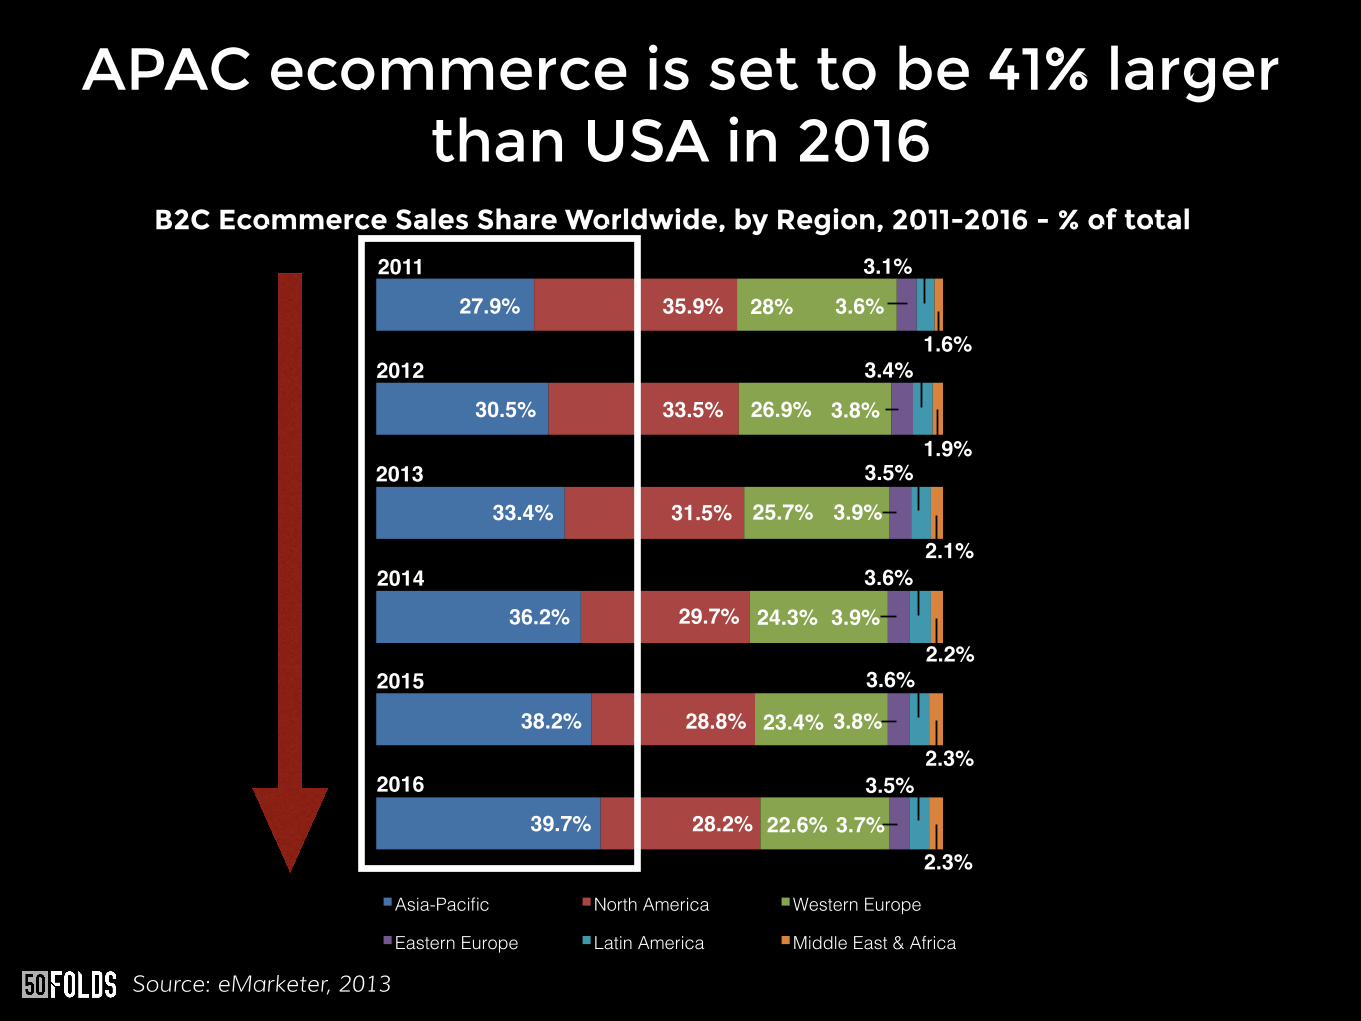
APAC ecommerce is set to be 41% larger than USA in 2016
2.2%!
Asia-Pacific! North America! Western Europe !
Eastern Europe! Latin America! Middle East & Africa!
2.1%!
27.9%! 35.9%! 28%! 3.6%!
3.1%!
1.6%!
2011!
30.5%! 33.5%! 26.9%! 3.8%!
3.4%!
1.9%!
2012!
33.4%! 31.5%! 25.7%! 3.9%!
3.5%!2013!
36.2%! 29.7%! 24.3%! 3.9%!
3.6%!2014!
2015!
2016!2.3%!
38.2%! 28.8%! 23.4%!3.8%!
3.6%!
2.3%!
39.7%! 28.2%! 22.6%!3.7%!
3.5%!
Source: eMarketer, 2013
B2C Ecommerce Sales Share Worldwide, by Region, 2011-2016 - % of total
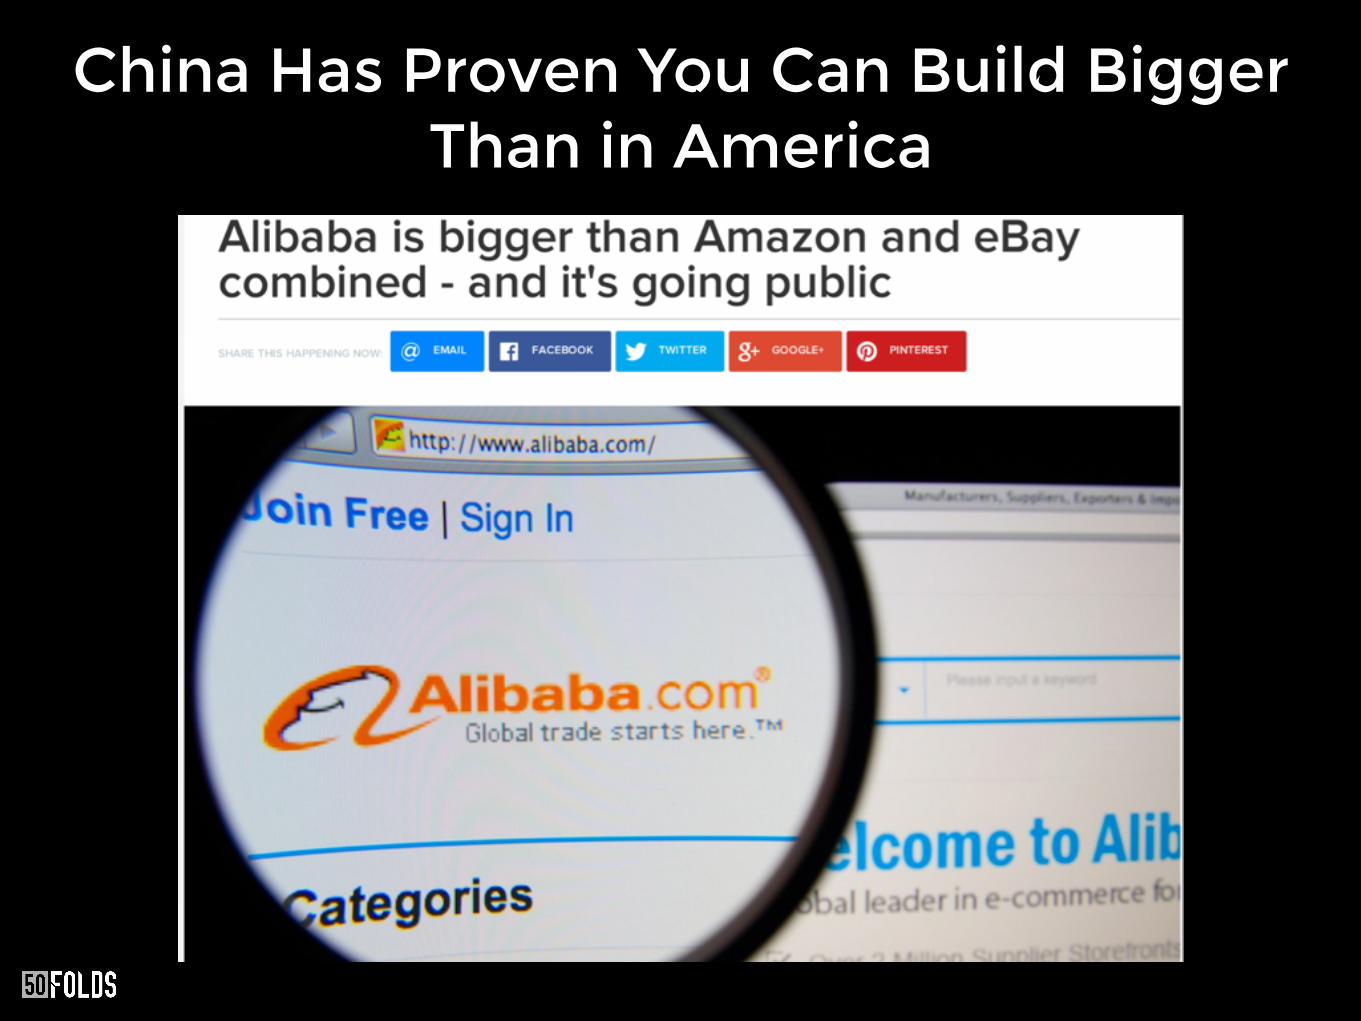
China Has Proven You Can Build Bigger Than in America
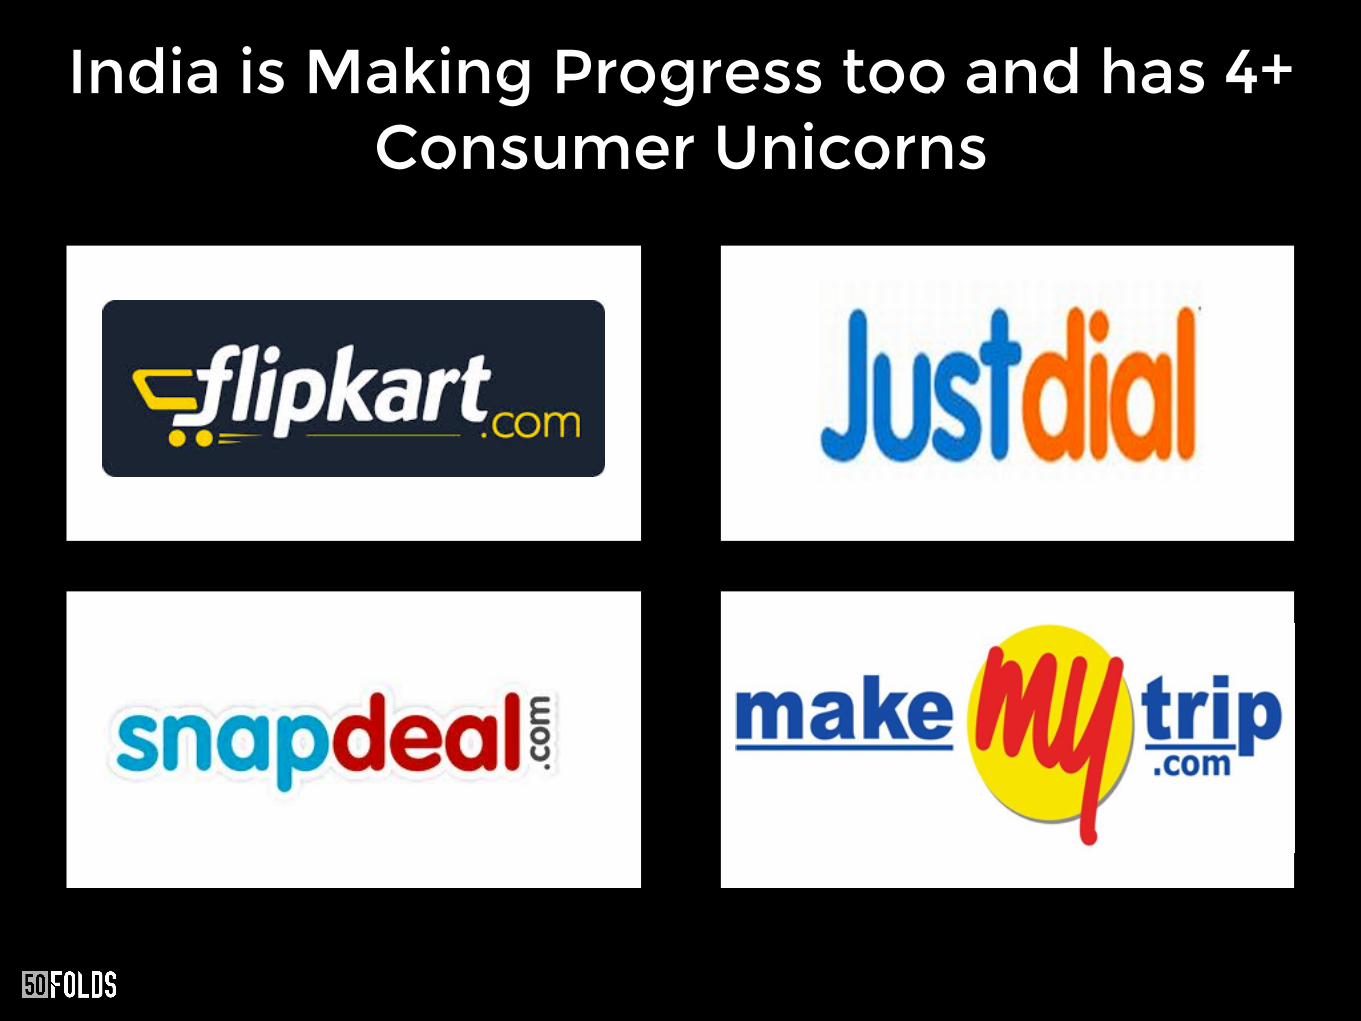
India is Making Progress too and has 4+ Consumer Unicorns

So What Does SEA Have Going for it?

The Early Signs are Encouraging
There has Been a lot of Seed Stage Activity
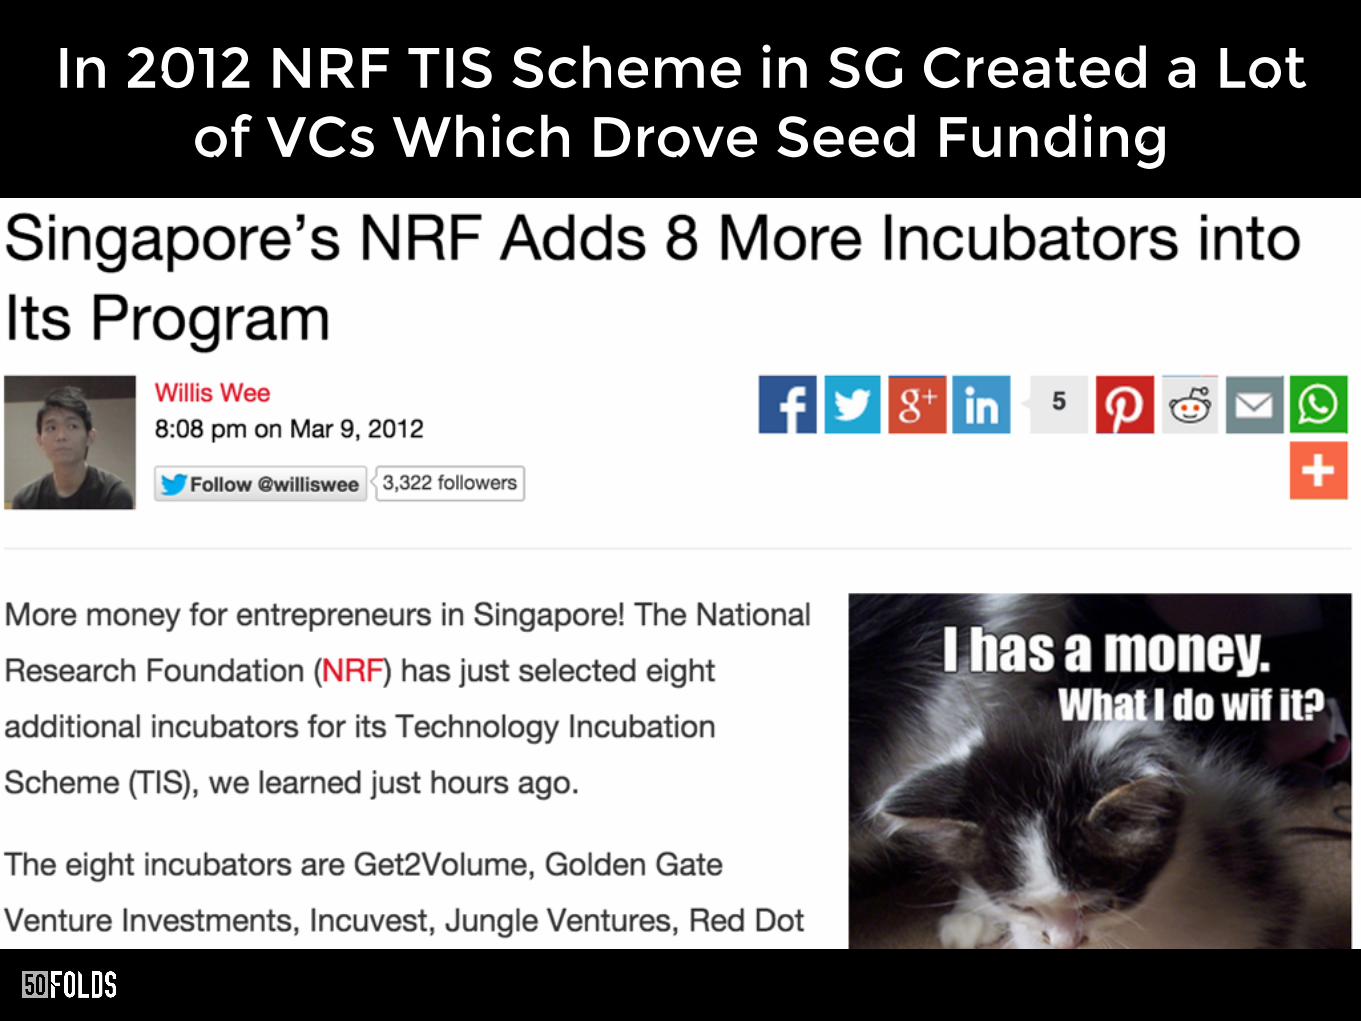
In 2012 NRF TIS Scheme in SG Created a Lot of VCs Which Drove Seed Funding
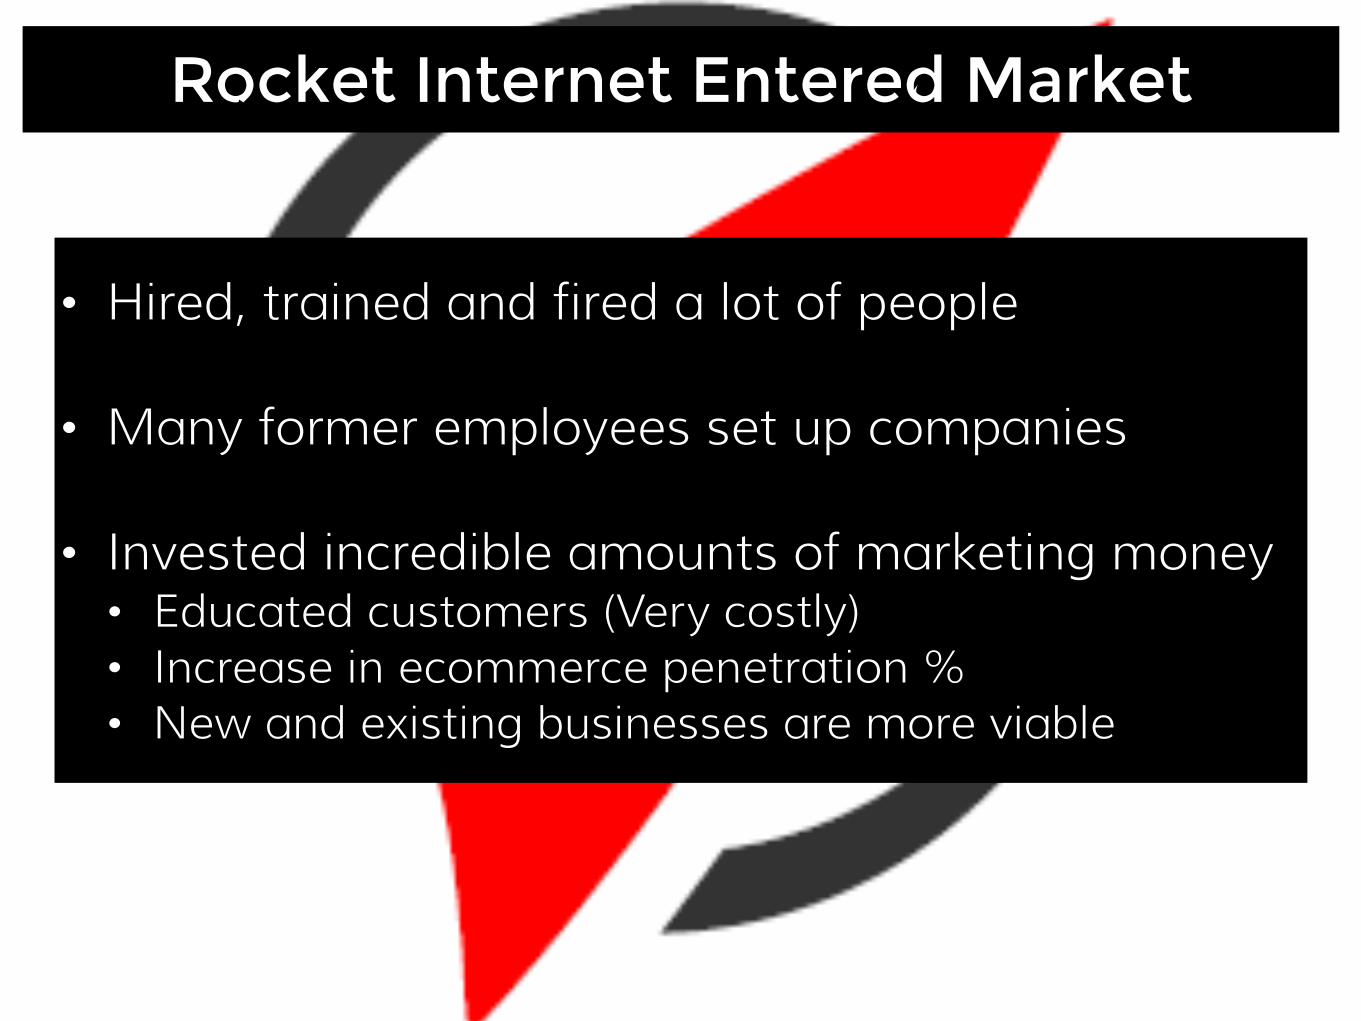
• Hired, trained and fired a lot of people
• Many former employees set up companies
• Invested incredible amounts of marketing money • Educated customers (Very costly) • Increase in ecommerce penetration % • New and existing businesses are more viable
Rocket Internet Entered Market
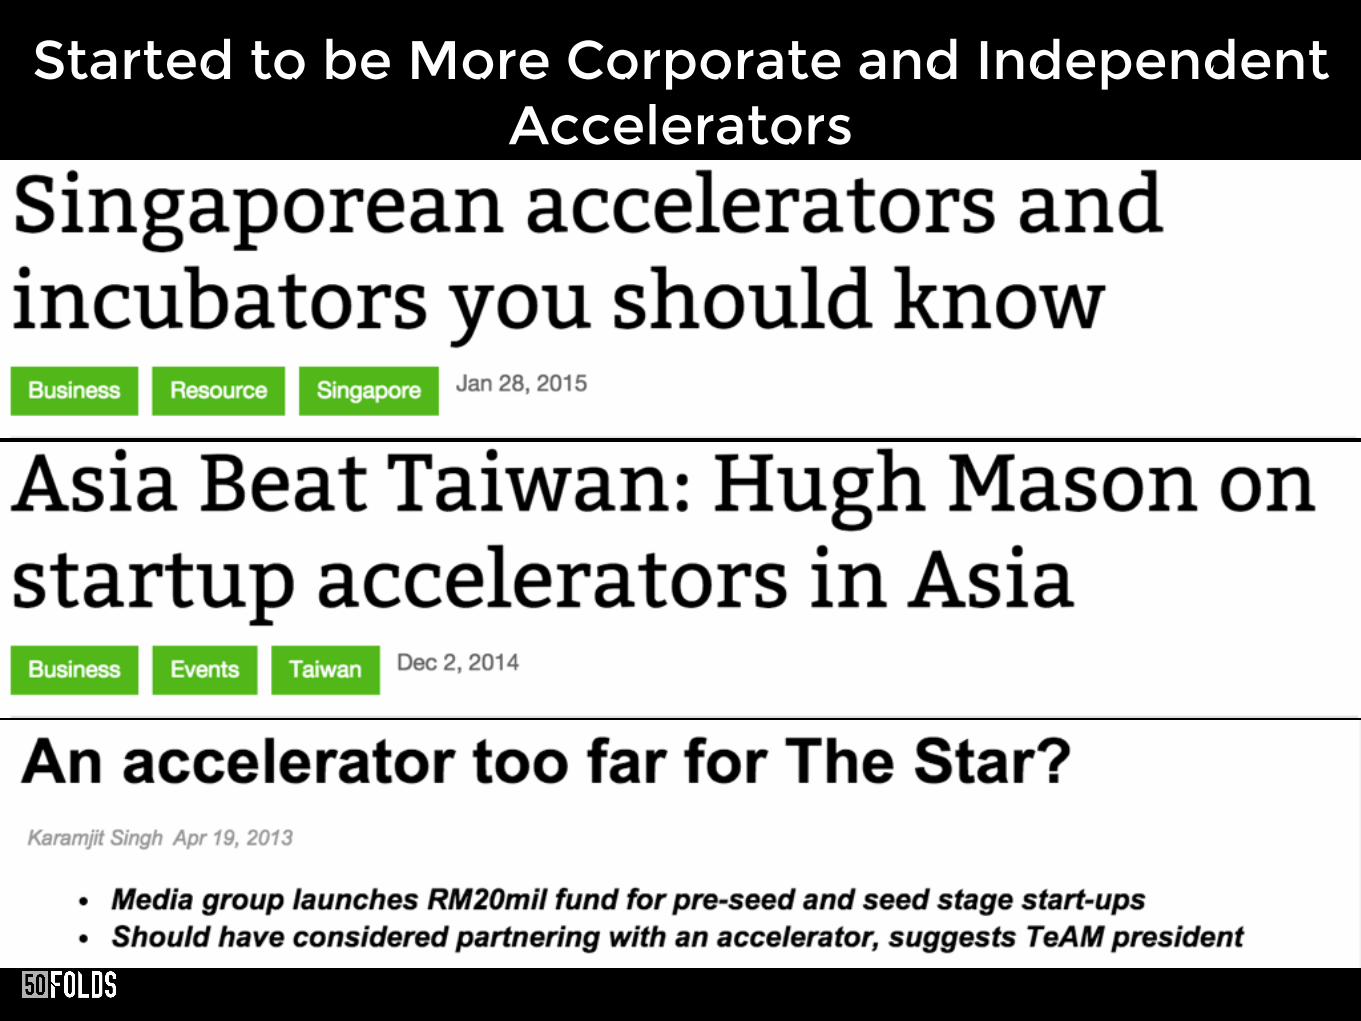
Started to be More Corporate and Independent Accelerators
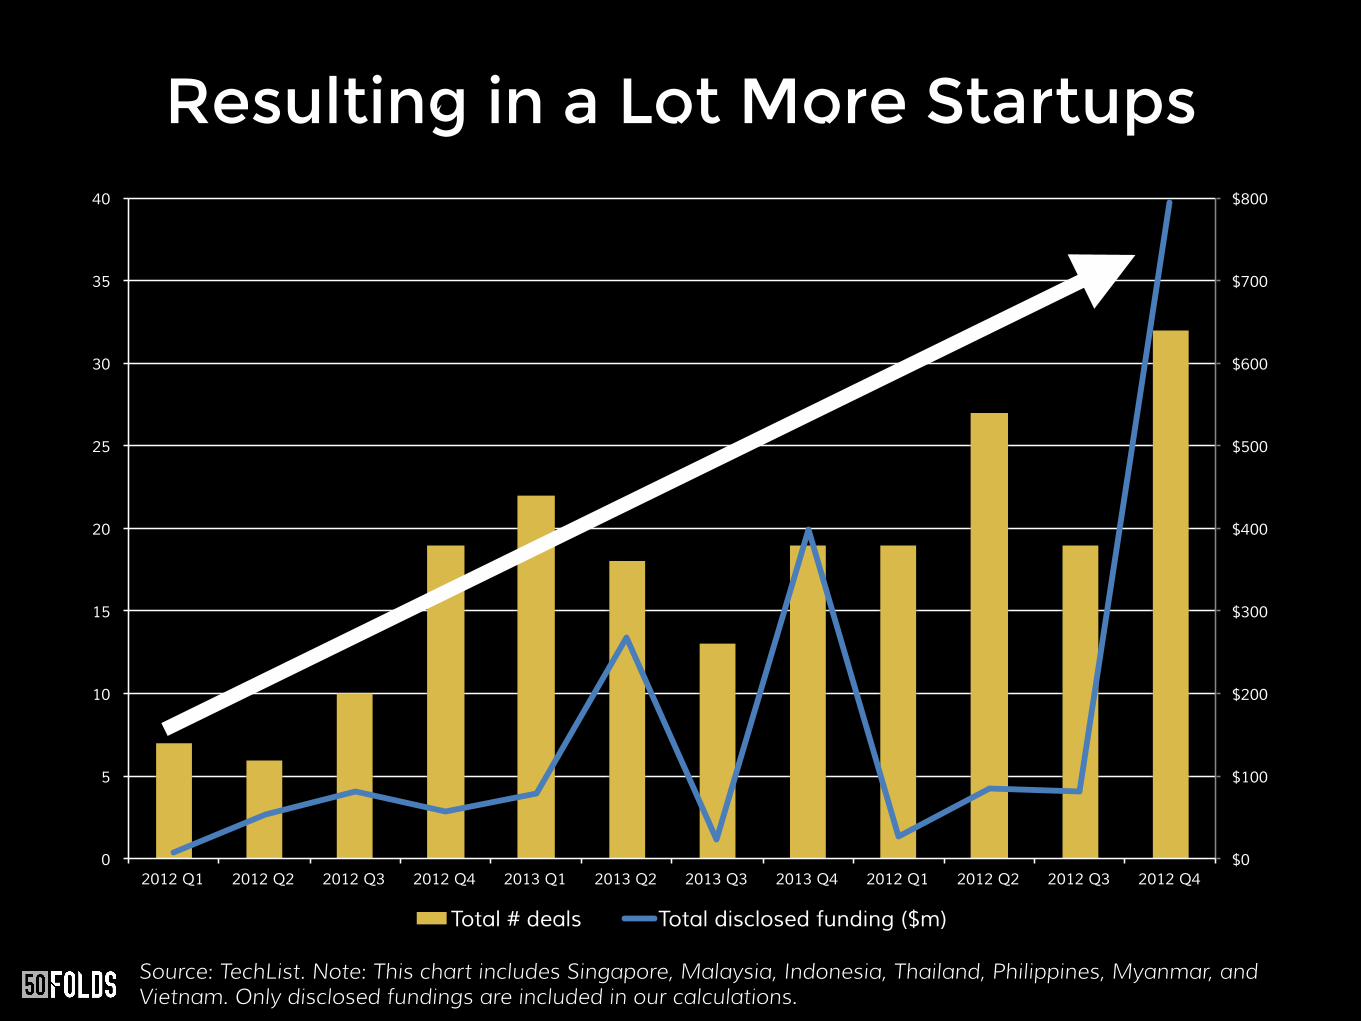
Resulting in a Lot More Startups
Source: TechList. Note: This chart includes Singapore, Malaysia, Indonesia, Thailand, Philippines, Myanmar, and Vietnam. Only disclosed fundings are included in our calculations.
$0
$100
$200
$300
$400
$500
$600
$700
$800
0
5
10
15
20
25
30
35
40
2012 Q1 2012 Q2 2012 Q3 2012 Q4 2013 Q1 2013 Q2 2013 Q3 2013 Q4 2012 Q1 2012 Q2 2012 Q3 2012 Q4
Total # deals Total disclosed funding ($m)

Hard Slog to Date has Rewarded the Diligent (But it took a long time
to get big)
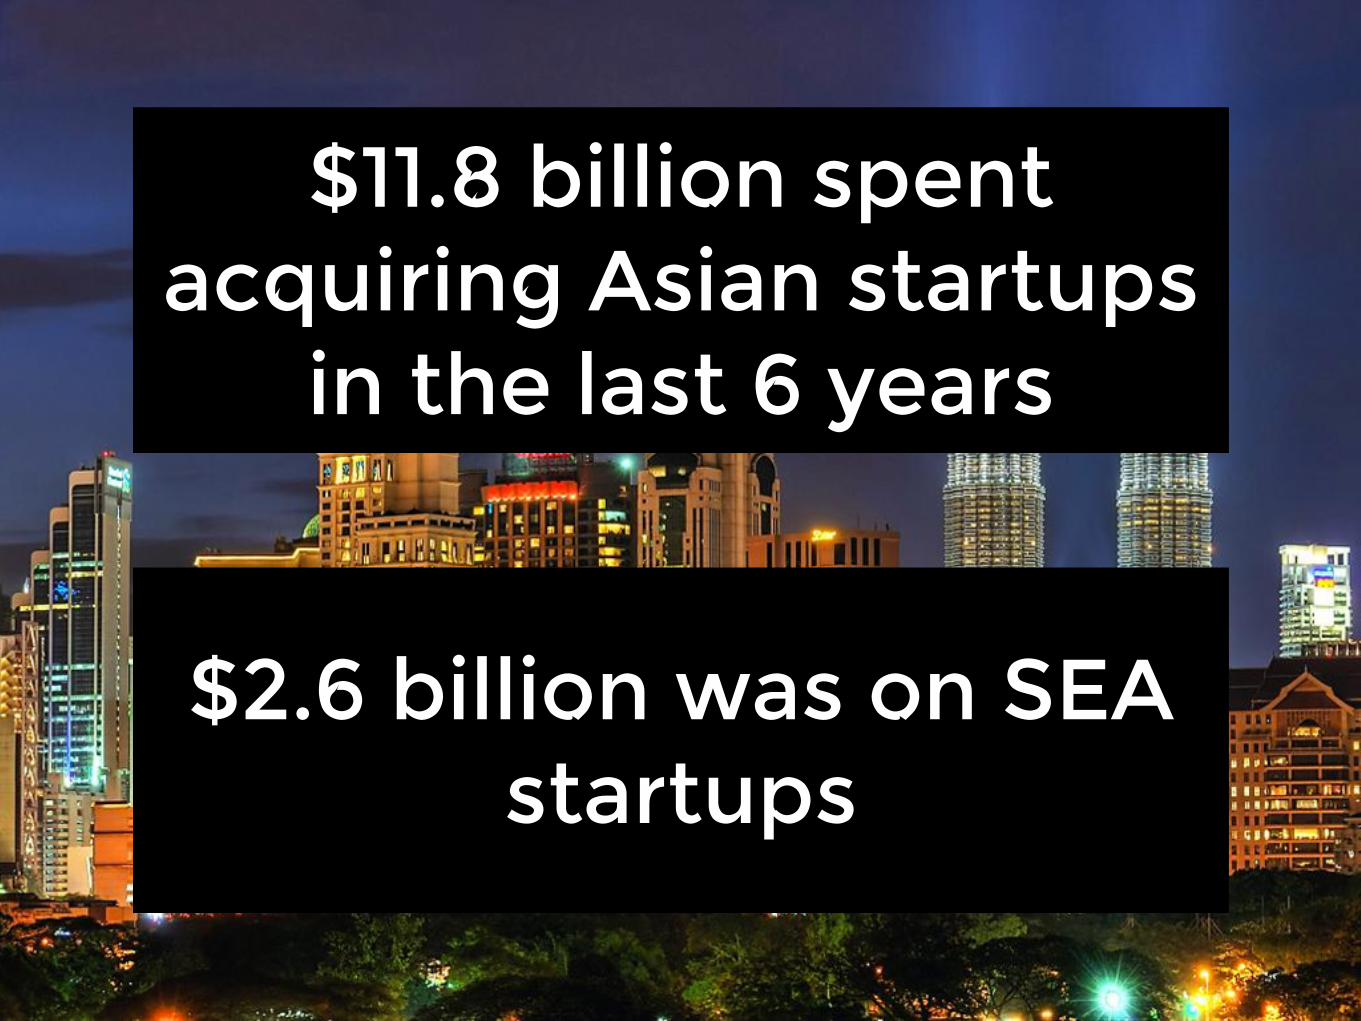
$11.8 billion spent acquiring Asian startups
in the last 6 years
$2.6 billion was on SEA startups
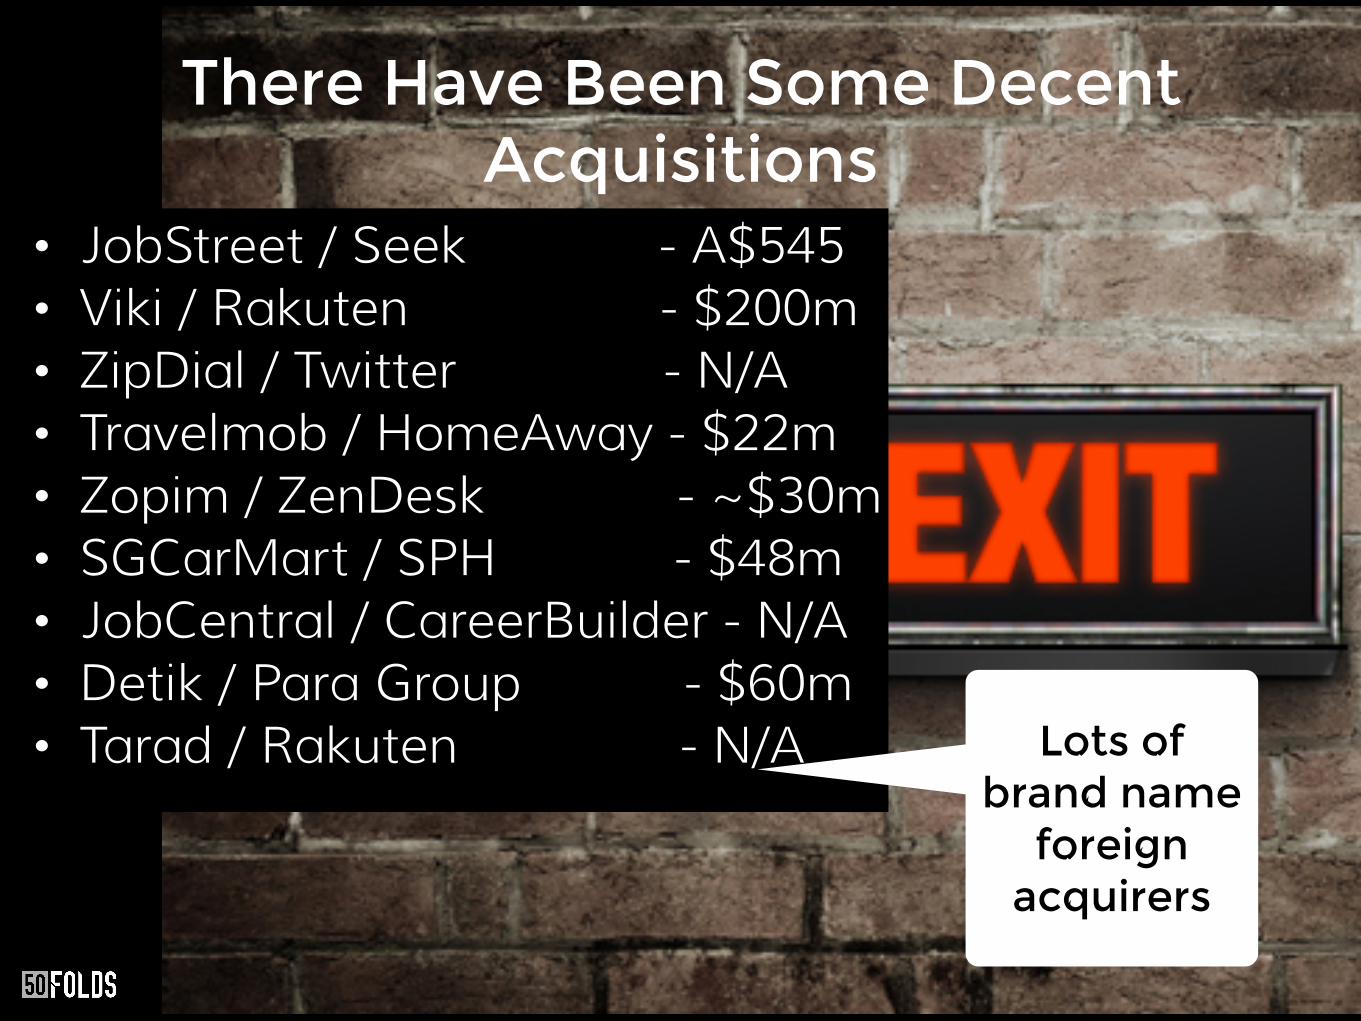
• JobStreet / Seek - A$545 • Viki / Rakuten - $200m • ZipDial / Twitter - N/A • Travelmob / HomeAway - $22m • Zopim / ZenDesk - ~$30m • SGCarMart / SPH - $48m • JobCentral / CareerBuilder - N/A • Detik / Para Group - $60m • Tarad / Rakuten - N/A
There Have Been Some Decent Acquisitions
Lots of brand name
foreign acquirers
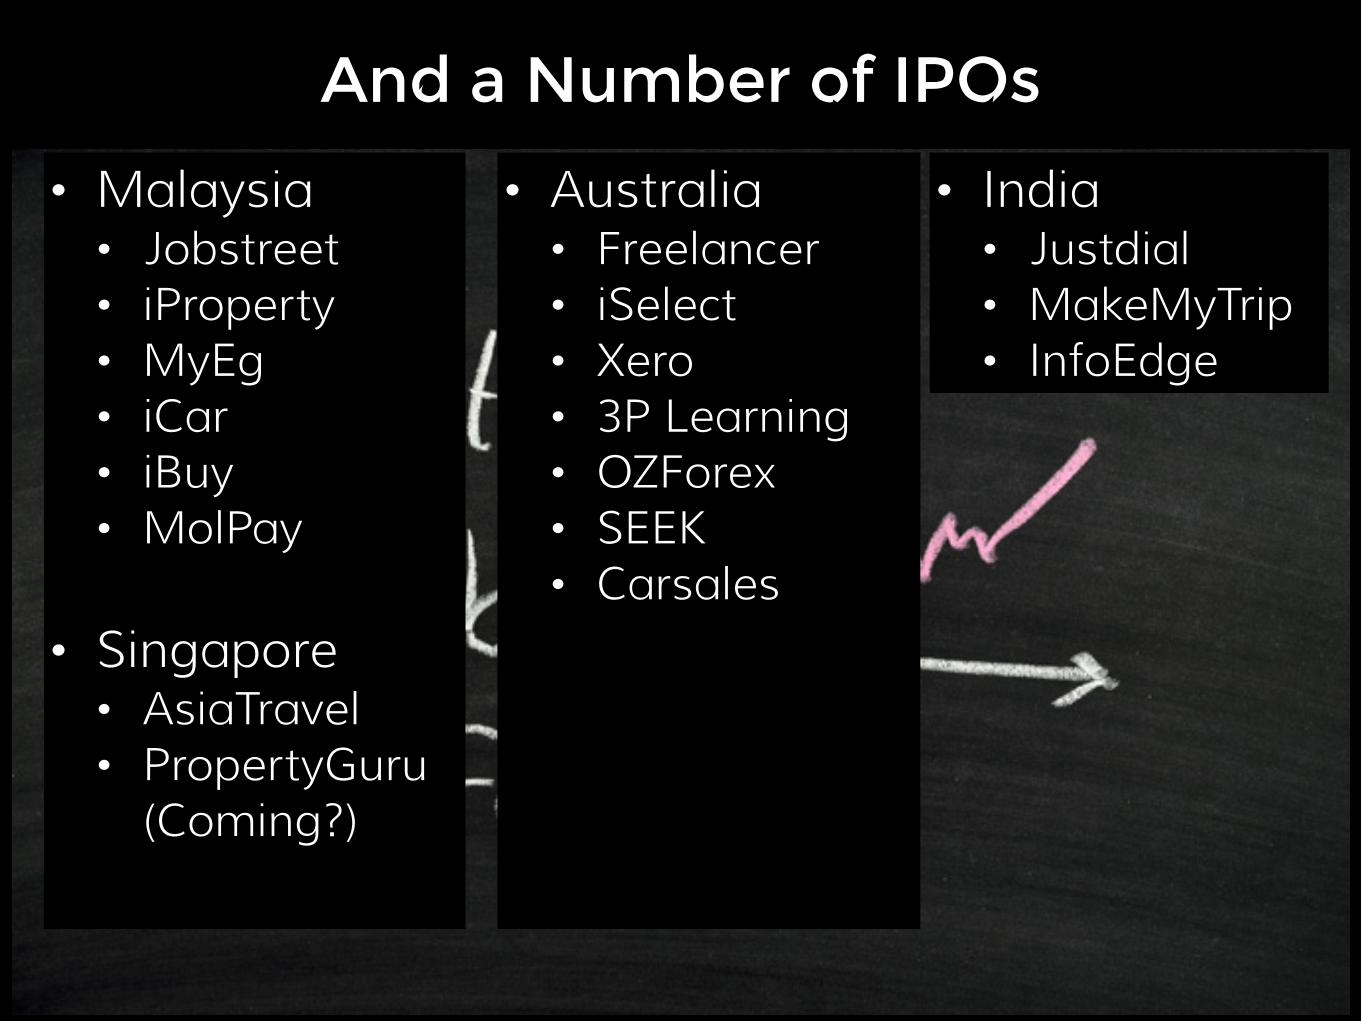
• Australia • Freelancer • iSelect • Xero • 3P Learning • OZForex • SEEK • Carsales
And a Number of IPOs
• Malaysia • Jobstreet • iProperty • MyEg • iCar • iBuy • MolPay
• Singapore • AsiaTravel • PropertyGuru
(Coming?)
• India • Justdial • MakeMyTrip • InfoEdge

That was before, things have changed in past 2
years
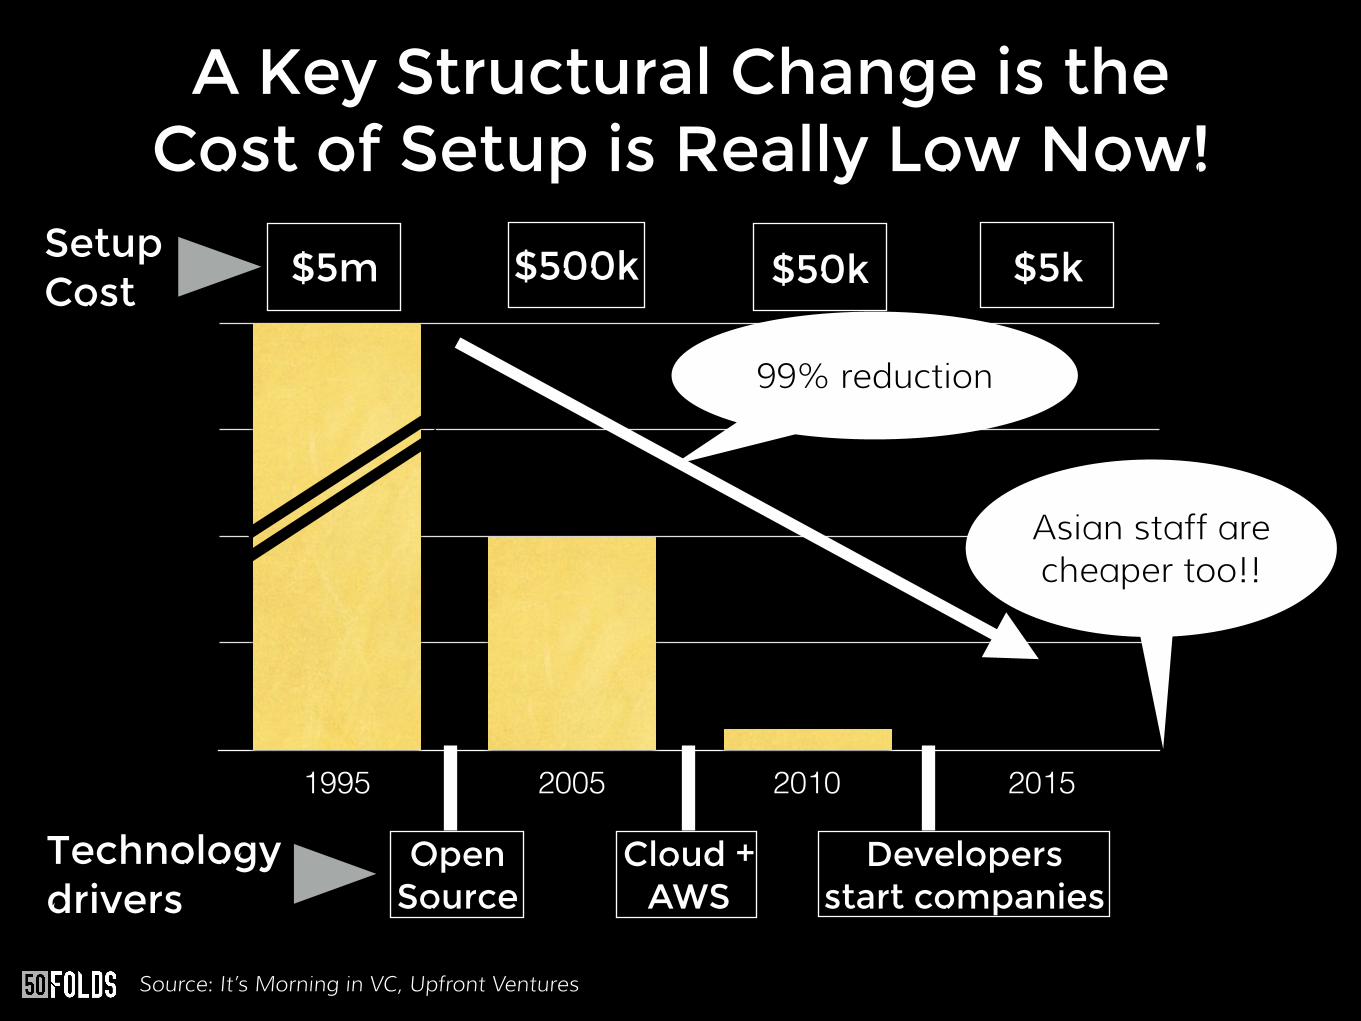
A Key Structural Change is the Cost of Setup is Really Low Now!
1995 2005 2010 2015
$5m $500k $50k $5k
Technology drivers
Open Source
Cloud + AWS
Developers start companies
99% reduction
Source: It’s Morning in VC, Upfront Ventures
Asian staff are cheaper too!!
Setup Cost
Startups are raising more money and getting
bigger faster
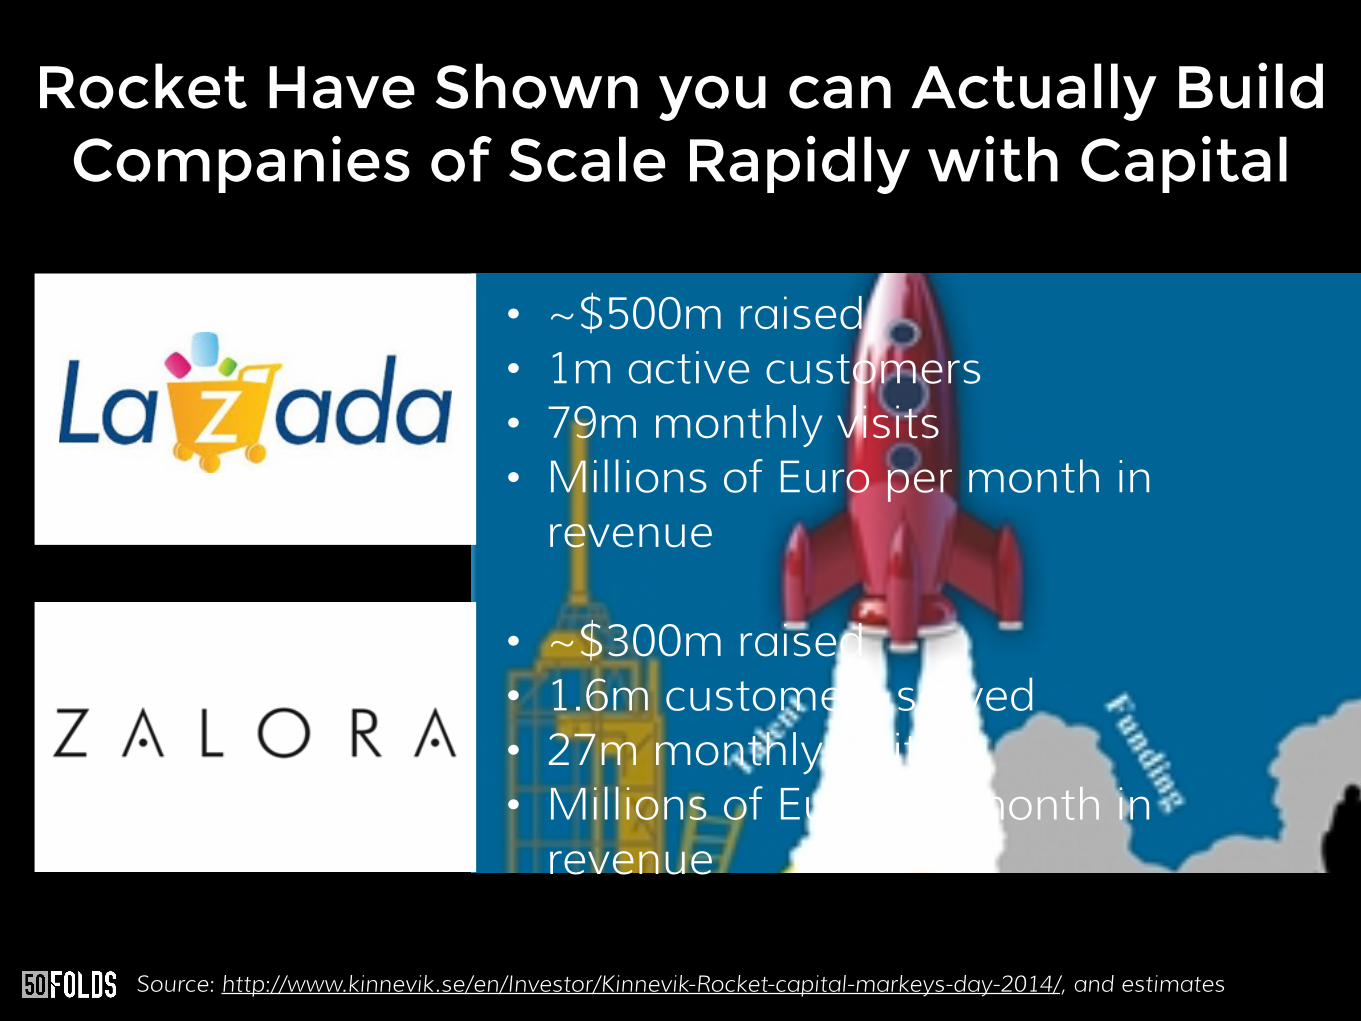
• ~$500m raised • 1m active customers • 79m monthly visits • Millions of Euro per month in
revenue
• ~$300m raised • 1.6m customers served • 27m monthly visits • Millions of Euro per month in
revenue
Rocket Have Shown you can Actually Build Companies of Scale Rapidly with Capital
Source: http://www.kinnevik.se/en/Investor/Kinnevik-Rocket-capital-markeys-day-2014/, and estimates
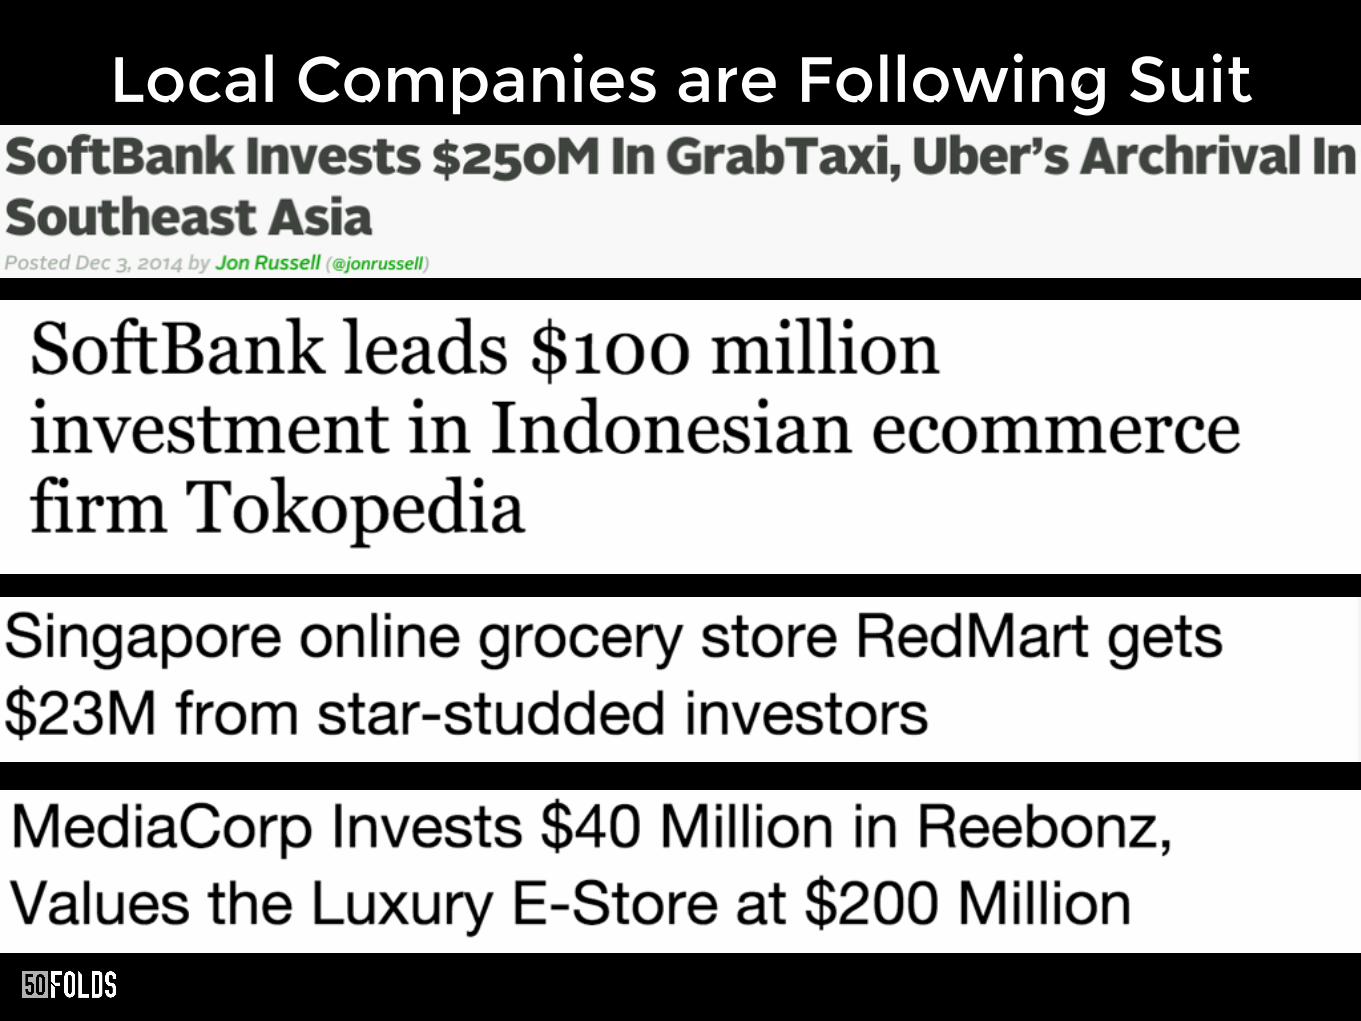
Local Companies are Following Suit
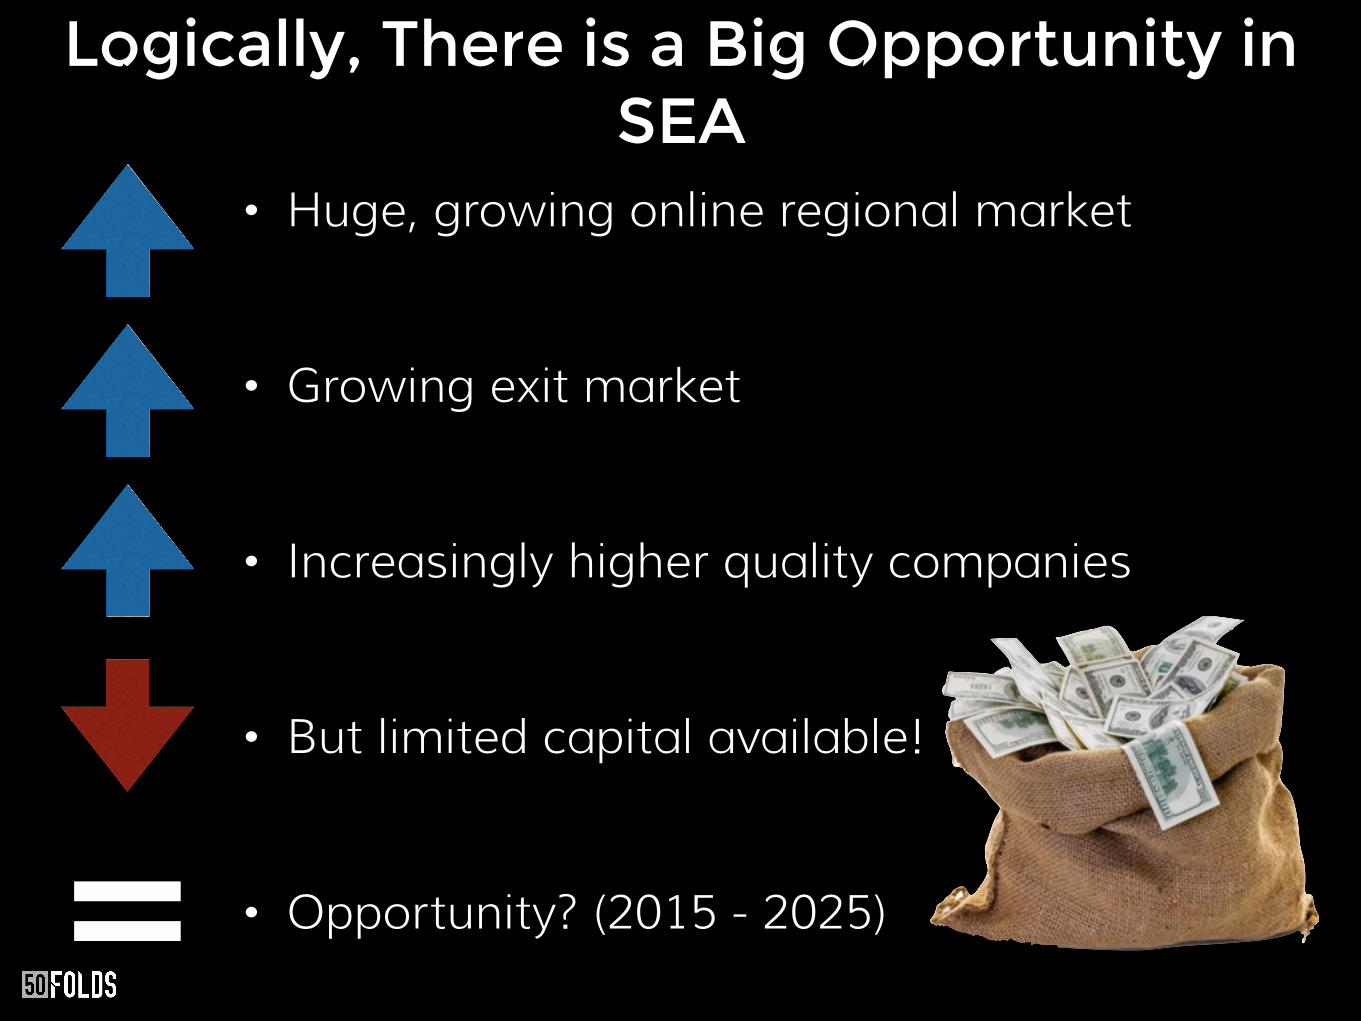
• Huge, growing online regional market
• Growing exit market
• Increasingly higher quality companies
• But limited capital available!
• Opportunity? (2015 - 2025)
Logically, There is a Big Opportunity in SEA
=

So What Does the Future Hold?


Investments
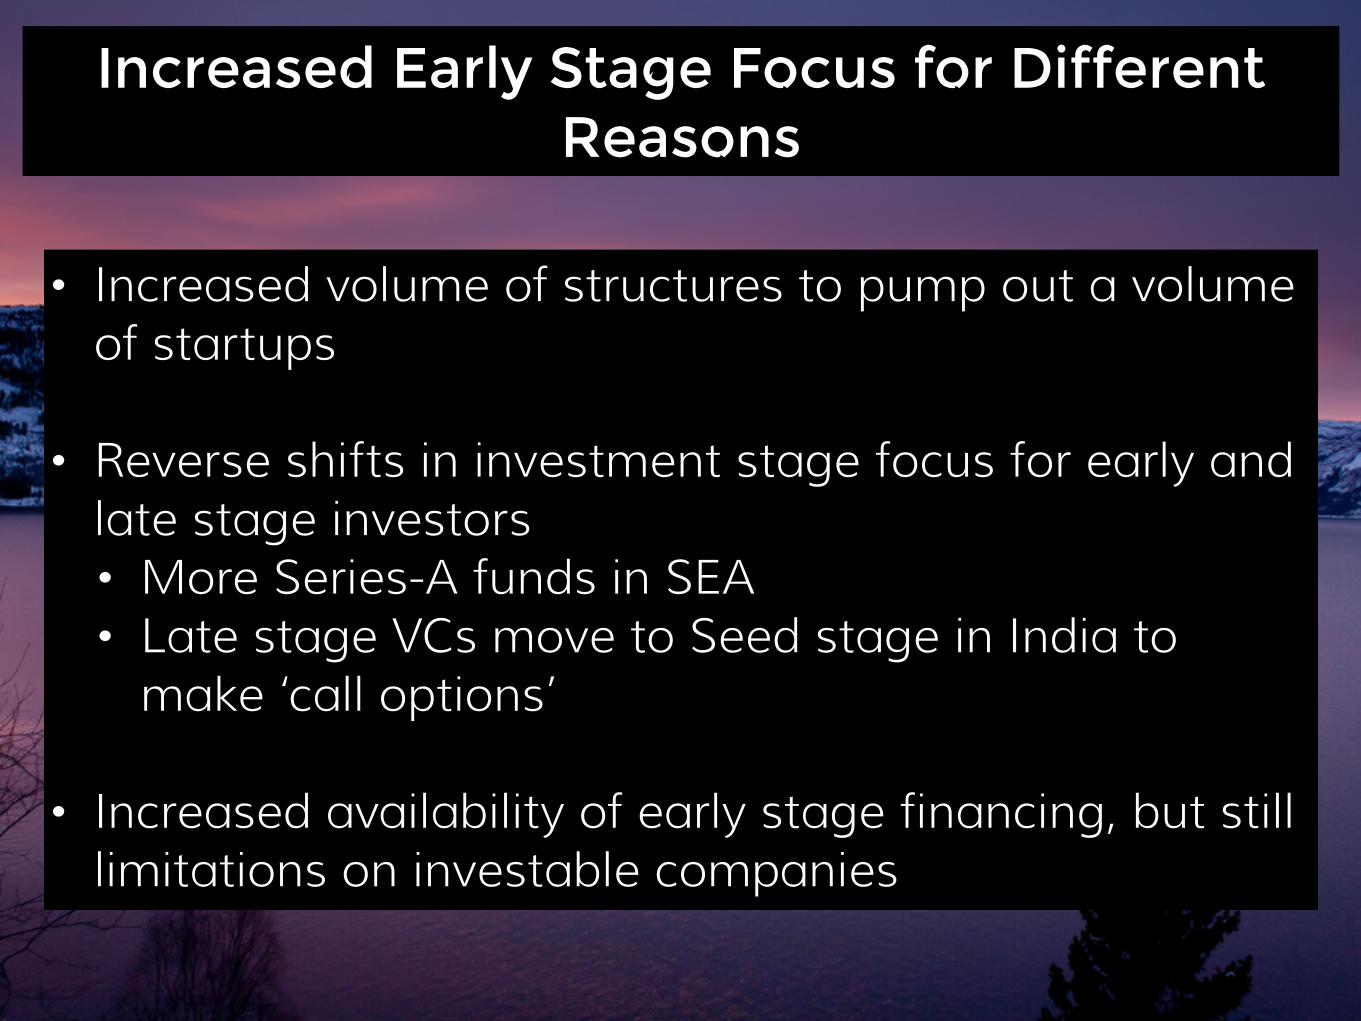
• Increased volume of structures to pump out a volume of startups
• Reverse shifts in investment stage focus for early and late stage investors • More Series-A funds in SEA • Late stage VCs move to Seed stage in India to
make ‘call options’
• Increased availability of early stage financing, but still limitations on investable companies
Increased Early Stage Focus for Different Reasons
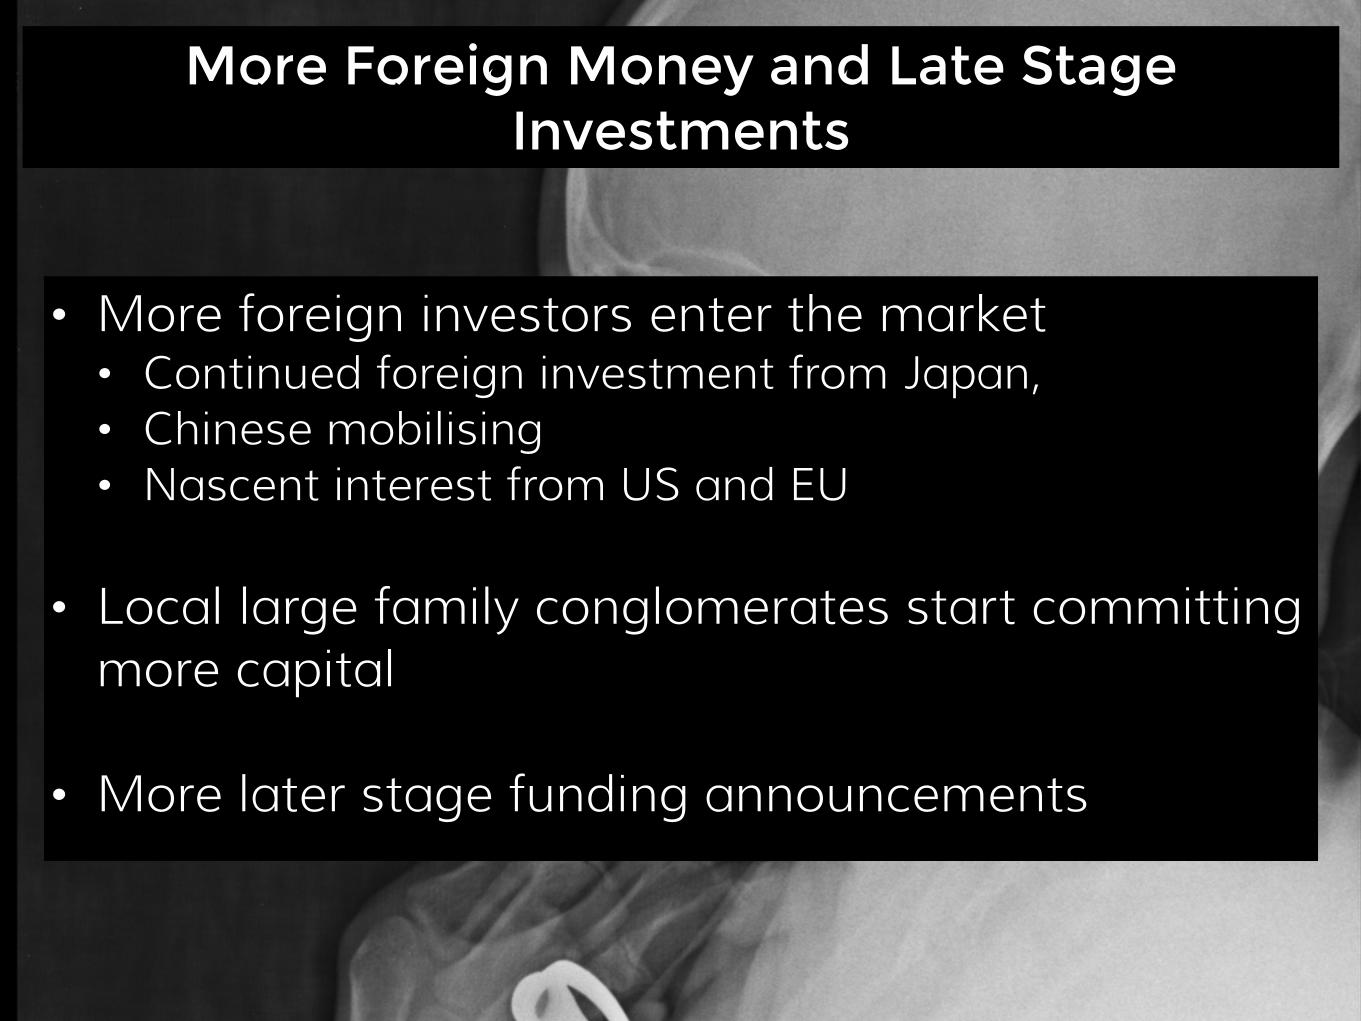
• More foreign investors enter the market • Continued foreign investment from Japan, • Chinese mobilising • Nascent interest from US and EU
• Local large family conglomerates start committing more capital
• More later stage funding announcements
More Foreign Money and Late Stage Investments

Valuations and Exits
• Seed valuations for great companies will increase as will the investment sizes
• Continue to be small exits
• Messaging companies may make purchases to ‘fill in’ their ecosystems, global brands make niche acquisitions
Valuations Increase Across the Board and More Small Exits

Operating Environment
• Introduction of ASEAN but no obvious benefit
• Potential for more questionable regulation, particularly in ecommerce • Thailand and Indonesia?
• Continued HR challenges resulting in wage inflation and importation of specialty talent
Governments Get in the Way and Costs of Staff Rise
Startups
• Increased regionalization of local companies and category leader dominance
• Start to see more overseas expansion of well funded EU/US companies
Bigger Regional Companies and Foreign Invasion
• More startups in ‘hot’ verticals
• Foreign entrepreneurs and Rocket grads will drive a lot of new startups
• Struggling startups will complain there is a Series-A crunch
More of Everything- More Startups and More Failures
Honestly…
You Missed China
You Sort of Missed India.
Now is a Great Time to Access South East Asia
Want to know
Leverage the Venture Capital Opportunity?

Let’s Have a Chat
• www.AlexanderJarvis.com
• @ADJBlog
• sg.linkedin.com/in/alexanderdjarvis/
Recommended