The summertime ‘‘heat’’ low over Pakistan/northwestern India:evolution and origin
Massimo Bollasina • Sumant Nigam
Received: 17 February 2010 / Accepted: 5 July 2010 / Published online: 15 July 2010
� Springer-Verlag 2010
Abstract A deep low in sea-level pressure is present
from May to September over Pakistan and northwestern
India (hereafter, the Pak–India low). It is often referred as
the ‘‘heat’’ low to convey the significance of surface ther-
mal effects reckoned to be important for its origin. The
present analysis, rooted in observations and diagnostic
modeling, suggests that the Pak–India low is influenced
both by regional and remote forcing. Regionally, the
influence of Hindu Kush mountains is found to be stronger
than the impact of land-surface heating and attendant
sensible heating of the planetary boundary layer, ques-
tioning the suitability of the ‘‘heat’’ label in canonical
references to this circulation feature. Observational analy-
sis indicates that the notable May-to-June deepening of the
Pak–India low and its further deepening in July, however,
arises from remote forcing—the development of monsoon
deep-convection over the Bay of Bengal and eastern India
in June and July. It is hypothesized that the associated
upstream descent over Iran–Turkmenistan–Afghanistan
(i.e. east of the Caspian Sea) and related low-level north-
erlies over the Elburz–Zagros–Hindu Kush mountains
contribute to the strengthening of the Pak–India low in
June (and July) from interaction with regional orography.
Keywords Heat low � Desert heating �Orographic forcing � South Asian monsoon
1 Introduction
‘‘Heat lows’’ (also referred as ‘‘thermal lows’’) are char-
acterized by low surface pressure (3–10 hPa lower than
surrounding regions) and purportedly caused by intense
heating of the land-surface (and overlying atmosphere)
from solar radiation. Heat lows are found over the tropical–
subtropical continents in summer when insolation is at its
maximum. In particular, deep heat lows, favored by clear
skies, lack of vegetation, and small evaporation, are ubiq-
uitous features over the deserts, and as such, are found in
northern and southwestern Africa, southwestern North
America, central Spain, northwestern and northeastern
Australia, the Tibetan Plateau, Saudi Arabia, southern
Pakistan, and the Thar desert of India (e.g. Warner 2004).
Key features of the heat lows are summarized in a recent
review (Johnson 2003). The dynamical aspects of the lows
have been investigated using realistic (e.g. Portela
and Castro 1996) and idealized numerical experiments
(e.g. Racz and Smith 1999; Spengler and Smith 2008).
The low over Pakistan and northwestern India (hereafter
the Pak–India low; e.g. Ramage 1966; Chang 1972; Joshi
and Desai 1985; Sikka 1997) stands out as the deepest low
in the global tropics during spring and summer, and is a
key element of the South Asian summer monsoon. It
develops in April–May along with the low-level south-
westerly wind regime over the Arabian Sea, a month before
monsoon rains commence over western India (e.g. Ramage
1966). Monsoon depressions, the majority of which forms
at the head of the Bay of Bengal move westward across the
Indian Subcontinent, eventually merging and dissipating in
the Pak–India low (e.g. Keshavamurty and Awade 1970).
Springtime fluctuations of this low have been linked to
subsequent variations of the All-India monsoon rainfall
(e.g. Parthasarathy et al. 1992). Mean sea-level pressure
M. Bollasina � S. Nigam (&)
Department of Atmospheric and Oceanic Science,
University of Maryland, 3419 Computer and Space Science
Building, College Park, MD 20742-2425, USA
e-mail: [email protected]
123
Clim Dyn (2011) 37:957–970
DOI 10.1007/s00382-010-0879-y

over the low region in May is, in fact, an important
parameter in the multivariate regression models of Indian
summer monsoon rainfall (e.g. Singh et al. 1995). Despite
the importance of the Pak–India low in the South Asian
summer monsoon evolution and variability, its salient
features remain to be fully characterized. Most descriptions
offer a local, one-dimensional perspective, and often, in
reference to the nearby Persian trough (Bitan and Sa’aroni
1992) and Saudi Arabian low (e.g. Ramage 1966; Blake
et al. 1983).1 The spatiotemporal sparseness of in situ
observations in desert regions undoubtedly hampers the
characterization efforts.
The primary motivation for this study was the obser-
vation that the Pak–India low is deepest in July—not in
May when the land-surface is warmer and the sensible
heating stronger—questioning the prevailing view on its
origin that is manifest in the commonly used ‘‘heat’’ label.
The low is moreover, nestled in the vegetated Indus River
plain—not desert terrain—and just eastward of the Hindu
Kush mountains (Fig. 1), raising further the possibility of
orographic influence, which, if pertinent, finds no reference
in the ‘‘heat’’ label. The recent availability of the European
Centre for Medium-Range Weather Forecasts (ECMWF)
40-year global reanalysis data (ERA-40; Uppala et al.
2005) provided additional incentive to examine the 3D
structure and evolution of this low, using dynamically/
thermodynamically consistent fields rooted in both local
and neighboring observations (in situ and remotely sensed).
Clarification of the mechanisms generating the
Pak–India low warrants a large-scale perspective on the
dynamical and thermodynamical conditions as subsidence
can be forced from remote regions as well (e.g. Yanai
et al. 1992; Rodwell and Hoskins 1996). Subsidence over
northwestern India and the Thar desert in summer has
been linked to the monsoon build-up over Bay of Bengal
(Das 1962). The entire Middle East, in fact, is under the
influence of large-scale descent during much of the year:
the Hadley cell descent is not the only contributor given
the intensification and northward movement of subsi-
dence in summer. In a seminal study, Rodwell and
Hoskins (1996) showed descending motions over the
Eastern Mediterranean and Middle East to be linked with
the South Asian summer monsoon (the monsoon–desert
link). In their modeling analysis, the Zagros mountain
chain was important for the localization and intensifica-
tion of the descent, through generation of regional anti-
cyclonic low-level flow and southward advection of cold
air, both leading to descending motions from Sverdrup
vorticity-balance and adiabatic thermodynamic consider-
ations, respectively.
Is the Rodwell-Hoskins’ monsoon–desert mechanism of
relevance in the deepening of the Pak–India low in July?
Although monsoon-induced subsidence to the immediate
northwest is not collocated with this low, the related
low-level circulation could contribute to the low’s inten-
sification through orographic interaction, a hypothesis
investigated, observationally, in the present study. The role
of regional orography in generating the Pak–India low
from interaction with the zonal-mean flow is, however,
Fig. 1 From top to bottom: ETOPO1 1-min topography (m; colors)
and May–July average sea-level pressure (hPa, white contours); UMD
AVHRR 1-km land-cover classification and May–July average sea-
level pressure (hPa; black contours, only values below 1,000 hPa are
shown); July mean MODIS NDVI and July average sea-level pressure
(hPa; white contours, only values below 1,000 hPa are shown). Land
cover classes are: 1 water, 2 evergreen needleleaf forest, 3 evergreen
broadleaf forest, 4 deciduous needleleaf forest, 5 deciduous broadleaf
forest, 6 mixed forest, 7 woodland, 8 wooded grassland, 9 closed
shrubland, 10 open shrubland, 11 grassland, 12 cropland, 13 bare
ground, 14 urban and built. The color lines in the top panel delineate
the areas where orography (red Taurus, Zagros and Elburz; orangeHindu Kush) is removed in the model experiments. The red area
actually extends to 28�E (the area is restricted in the picture to focus
on regional details)
1 Blake et al. (1983) and Smith (1986) used intensive observations of
the 1979 summer and the international Summer Monsoon Experiment
to analyze the radiative and thermodynamical aspects of the heat low
over the Rub’al Kahli Desert.
958 M. Bollasina, S. Nigam: Evolution and origin of summertime heat
123

investigated from numerical experiments with a steady
linear primitive equation model. A significant role is
indeed suggested in both nascent (May) and mature (July)
phases of the low.
The paper is organized as follows: data and model are
briefly described in Sect. 2. Section 3 describes the regio-
nal landscape and the seasonal, pentad, and diurnal varia-
tions of relevant dynamic and thermodynamic variables in
the Pak–India low region, building a case for the role of
non-thermal forcing (of the low) as well. Links with the
large-scale atmospheric circulation, including its divergent
component, strengthen the case. Diagnostic modeling of
the low, in particular the orographic contribution is pre-
sented in Sect. 4. Discussion and concluding remarks
follow in Sect. 5.
2 Datasets and the diagnostic model
The main dataset used in this study consists of atmospheric
and surface variables from the ERA-40 atmospheric
reanalysis. Reanalysis data is available 6-hourly on a
320 9 160 gaussian grid (horizontal resolution of about
1.125�) and at 23 isobaric levels. The 1979–2001 period
data was obtained from the National Center for Atmo-
spheric Research archives. In the following analysis, data
was averaged to produce daily and pentad climatologies, in
addition to monthly ones.
Monthly surface air temperatures were obtained from the
Climate Research Unit (CRU) TS 2.1 dataset (Mitchell and
Jones 2005) at 0.5� resolution. The study region’s land-
surface is described (Fig. 1) using the following data sets:
land topography from the National Oceanic and Atmo-
spheric Administration/National Geophysical Data Center
(NOAA/NGDC) ETOPO1 1-arc minute global relief model
(Amante and Eakins 1998); land cover from the University
of Maryland/Department of Geography 1 km global classi-
fication dataset (http://glcf.umiacs.umd.edu/data/landcover/),
based on 14 years (1981–1994) of imagery from the advance
very-high resolution radiometer (AVHRR) which distin-
guishes 14 land cover classes; land vegetation development
from version-5 of the TERRA/moderate resolution imag-
ing spectroradiometer (MODIS) normalized difference
vegetation index (NDVI) monthly data at 0.05� horizontal
resolution (MOD13C2.005) for the period 2000–2008
(https://lpdaac.usgs.gov/lpdaac/products/modis_products_
table/vegetation_indices/monthly_l3_global_0_05deg_cmg/
v5/terra).
2.1 Diagnostic model
The steady linear primitive equation model is described in
Nigam and Chan (2009) and in the references therein; only
salient features are mentioned below. The model solves the
eddy component (i.e. departure from the zonal average) of
the linearized sigma-p coordinate (r = p/ps, where p and
ps are pressure and surface pressure, respectively) equa-
tions, given the zonally-symmetric basic state (tempera-
ture, zonal and meridional winds, and surface pressure).
The ERA-40 orography, diagnosed 3D diabatic heating
(Chan and Nigam 2009), sub-monthly transient heat and
momentum fluxes, and the surface temperature constitute
the model forcing. The basic state and model forcing are all
computed from the 1979–2001 period ERA-40 reanalysis
(2.5� horizontal resolution, 23 isobaric levels). The diag-
nostic model is solved numerically, using the semi-spectral
representation for the horizontal structure: 73 grid points
between the two poles (i.e. Dh = 2.5�) and zonal Fourier
truncation at wave number 60. The vertical structure is
discretized using 18 full-sigma levels. Momentum dissi-
pation is exactly as in Nigam and Chan (2009) but the
thermal dissipation is slightly modified to reflect the
increased sensible heating in summer, through deeper
thermal diffusion in the planetary boundary layer, larger
drag coefficient in the related lower boundary condition,
and from reduced Newtonian damping of temperature in
the lower troposphere.2 Model output is transformed from
sigma to pressure levels using linear interpolation in ln(r),
and sea-level pressure obtained from surface pressure using
the hydrostatic equation and a fixed lapse rate.3
3 Climatological features of the Pak–India low
3.1 The landscape
The physical landscape and summertime land-cover/
vegetation in the Middle East and southwest Asia are shown
in Fig. 1. Sea-level pressure is also shown using contours.
The region is characterized by complex orography, with
elevated mountain chains (e.g. peaks above 3,000 m): the
Taurus in Turkey, the Zagros to the south and the Elburz to
the north in Iran, and the Hindu Kush in Afghanistan and
northwestern Pakistan. The land surface is prevalently arid
or semi-arid (bare ground is peach, #13, in Fig. 1 middle)
with numerous deserts (e.g. Iranian, Karakumy, and Thar)
and some cultivated areas (principally, the Indus River
2 The thermal diffusion coefficient is 30 [1 ? tanh{10p (r - 0.70)}]
instead of 30 [1 ? tanh{10p(r - 0.85)}]; the drag coefficient is
3.0 9 10-3 as opposed to 1.0 9 10-3 earlier; the Newtonian damping
coefficient is now (25 days)-1 at all vertical levels.3 First, surface temperature is computed by interpolating the lowest
sigma-level temperature to the surface using a 6.5 K Km-1 lapse rate.
Linear interpolation is then used to take ln(pS) to ln(pSL) (being pS
surface pressure and pSL sea-level pressure) using the p-coordinate
hydrostatic equation and the above-obtained surface temperature.
M. Bollasina, S. Nigam: Evolution and origin of summertime heat 959
123

plain). During July, vegetation is fully developed in the
Indus River plain and western India (except over the Thar
desert; see Fig. 1, bottom).
A wide area of low-pressure (\1,002 hPa, for instance)
extends from Arabia to India during May–July, with the
core of the Pak–India low defined by the lowest pressure
closed contour (998 hPa). The low is located over the Indus
River plain, with its western flank skirting the Hindu Kush
mountain range (Fig. 1, top). The northern portion of the
low is more dark pink than peach in Fig. 1 (middle),
indicating a shrubland–cropland type land cover which is
green during the period under consideration. Only the
south–central sector is classified as bare ground. In par-
ticular, the core of the Pak–India low in July (when it is
deepest, *996 hPa) is centered over a vegetated land
surface (Fig. 1, bottom)—calling into question its wide
reference as a ‘‘heat’’ low.
3.2 Seasonal evolution
The summertime evolution of the Pak–India low is shown
in Fig. 2, along with surface air temperature (SAT). An
expansive low, without a defined core, is present over
Pakistan and northern India in May, with SAT exceeding
33�C over a wide swath of the Indian subcontinent and
even 34�C over southern Pakistan. The low deepens sub-
stantially in June with the closed 996 hPa contour defining
its core, and is broadly coincident with the warmest SAT
region ([35�C). These distributions indicate the signifi-
cance of surface thermal forcing in the deepening of the
low, but not to an exclusive role. The low deepens a bit
more in July, especially over southern Pakistan but, inter-
estingly, without any further increase in SAT. The SAT, in
fact, decreases in July by 1–2�C over the core of the low,
and by several more degrees over western India and the
northern Gangetic Plain, the latter due to the arrival of
monsoon clouds and rain (see the following Fig. 3). The
June-to-July evolution of sea-level pressure and SAT also
suggests that the Pak–India low is maintained not only by
surface thermal effects.
The thermal forcing of the low is investigated in Fig. 3,
which shows the monthly ERA-40 sensible heat flux4 at
12Z (5 p.m. in Pakistan and India). The flux should capture
the peak heating of the atmosphere from the underlying
land-surface. Sensible heating over the Pak–India low
region is evidently large in May and June but focused over
southeastern Pakistan and western India, i.e. south of the
core of the low (compare to Fig. 2). The northern lobe of
the low, interestingly, is not a notable sensible heating zone
(flux is 50% smaller than to the south) as it receives more
precipitation than the southern sector. The heating, like
SAT, is moreover diminished in July when the low is the
deepest, coincident with the substantial increase of pre-
cipitation over the region.5 The lack of co-location and
different peak timings of sea-level pressure and surface
thermal variables suggest that non-thermal processes may
also be important in the evolution of the Pak–India low.
Potential temperature and vertical motion across the low
are shown in a latitude-height cross-section in Fig. 4
(average between 70�E and 74�E) for May (left) and July
(right). The dip in potential temperature contours, as evi-
dent between 25�N and 30�N in May, denotes heating of
the atmosphere, which extends up to *700 hPa. The
pressure vertical velocity is negative (rising motion)
Fig. 2 ERA-40 sea-level pressure (hPa, contours) and CRU surface
air temperature (�C, shaded) for (top to bottom) May, June and July
4 The unassimilated reanalysis variables, such as sensible heat flux,
are impacted by the biases of the assimilating model, including
physical parameterizations. The ERA-40 sensible heat flux is,
nonetheless, analyzed here as long-term observations of this quantity
are non-existent, and because of our focus on the large-scale features,
especially in context of monthly evolution, i.e. relative variations.
5 The extent to which increased precipitation in July contributes to
the intensification of the low will be analyzed using WRF-based
experiments in the future.
960 M. Bollasina, S. Nigam: Evolution and origin of summertime heat
123

beneath this level and positive (sinking motion) above it,
which must generate horizontal divergence near 700 hPa.
The heating of the atmosphere is evidently not as deep in
July (only up to *800 hPa) and the sinking motions in the
mid-to-upper troposphere are, notably, absent in this
month, both reflecting the advance of the monsoon (see
also Fig. 3). Large upward velocity along the southern
slopes of the Himalayas, associated with stable air, denotes
strong orographic uplift.
3.3 Pentad evolution
The evolution of vertical motion and horizontal divergence
above the core of the Pak–India low is examined at pentad
resolution in Fig. 5 to shed light on the steep drop in sea-
level pressure between May and June (Fig. 2). Upward
motion develops near the surface in March–April, and
intensifies and extends up to 775 hPa by May. Subsidence
builds up in the mid-to-upper troposphere, with a
2–3 pentad duration spike in the latter part of May. This
spike is reflected in weaker upward motions near the sur-
face (and the weakening of the low). The abatement of
upper-level subsidence, interestingly, leads (by a few
pentads) the intensification of near-surface upward motions
(and the deepening of the low) in late June. Arrival of
monsoon rains and related deep convection in the second
half of July drastically alter vertical motions in the mid-to-
upper troposphere, from sinking to rising. The changes are
more muted near the surface. The structure of horizontal
divergence—an affirmation of the continuity equation—
reveals the presence of a shallow (\100 hPa thick) con-
vergent layer near the ground that is topped by a deep
(several 100 hPa thick) divergent layer. Sea-level pressure
development (not displayed) shows the Pak–India low to be
deepest at the end of June. The deepening, as noted above,
is preceded by rapid reduction in upper-level subsidence,
suggesting that the Pak–India low, while originating from
surface heating, is influenced by larger-scale regional cir-
culations, including regional orographic effects (e.g. Wu
et al. 2009) and the monsoon (as shown later).
The presence of multiple influences is also indicated by
analysis of the position of the core of the Pak–India low.
Heat lows, owing their existence principally to surface
thermal forcing, are essentially stationary features.
Broadly, this is the case for the Pak–India low, as well.
Tracking the core’s position at pentad resolution using
23 years of ERA-40 reanalysis, however, shows the core,
located over southeastern Pakistan in late April, to migrate
northeastward while intensifying.6 The core’s position,
however, does not track the warmest SAT region.
3.4 Diurnal cycle
The diurnal variation of potential temperature and vertical
motion over the northern and southern sector of the Pak–
India low are examined in Fig. 6 in May and June when the
low develops and deepens. Variations are analyzed sepa-
rately in the sectors in view of differences in the underlying
land-surfaces: the northern sector is classified as croplands
while the southern one is more arid (cf. Fig. 1 middle and
bottom). Nighttime and daytime conditions are represented
by the 00Z and 12Z (5 a.m. and 5 p.m. local time,
respectively) profiles (blue and red, respectively). Only the
daytime minus nighttime difference is shown in case of
potential temperature.
Fig. 3 Sensible heat flux at 12Z (W m-2, shaded) and CRU
precipitation (mm day-1, contours) for (top to bottom) May, June
and July
6 The core location is identified by successive searches of the point
where sea-level pressure is lower than its eight surrounding points.
Examination of 23 maps for each pentad shows the core to be located
in the following area (68.625�E–70.875�E, 27�N–28.125�N; south-
eastern Pakistan) in 15 of the 23 cases during 11–15 April. About a
month later (16–20 May), 17 of the 23 centers are found in the area
(72�E–74.25�E, 29.25�N–31.5�N; northeastern Pakistan).
M. Bollasina, S. Nigam: Evolution and origin of summertime heat 961
123

In the southern sector, diurnal variability is robust,
penetrating into the mid-troposphere. Daytime ascending
motions in the 1,000–800 hPa layer are replaced by strong
subsidence at night; the ascent is more vigorous and deeper
in June, when the land-surface is warmer (cf. Fig. 2). These
variations are typical of those encountered in desert regions
(e.g. Sikka 1997; Blake et al. 1983; Smith 1986). The large
near-surface diurnal range in potential temperature, in
June, especially, reflects the super-adiabatic lapse rate
conditions in the afternoon and a stable near-surface layer
(if not an inversion during May) during nighttime.
The northern sector of the low, however, exhibits very
different vertical velocity profiles: both daytime and
nighttime motions penetrate into the mid-troposphere,
attaining maximum amplitudes much above the surface.
More noteworthy is the occurrence of daytime (nighttime)
descent (ascent), which is not typical even of the circu-
lations developing over flat vegetated surfaces. The
diurnal temperature range is also smaller than in the
southern sector. Such diurnal variability, including deep
ascent/descent, likely reflects the presence of regional-
scale circulations, possibly influenced by orographic
effects.
The structure of diurnal variability in the southern and
northern sectors of the Pak–India low is thus quite differ-
ent, with the former exhibiting desert-like structure. The
distinction supports the notion that mechanisms other than
surface thermal effects also contribute to the development
of the Pak–India low.
Fig. 4 Latitude-vertical cross-
section of pressure-vertical
velocity (hPa day-1, shaded),
and potential temperature
(�C, green contours)
longitudinally averaged
between 70�E and 74�E for May
(left) and July (right). Vertical
velocity in z-coordinates has
opposite sign to the velocity
displayed here
Fig. 5 Pentad evolution of the vertical profiles of pressure-vertical
velocity (hPa day-1, shaded) and horizontal divergence (910-6 s-1,
contours) averaged over the area (70�E–74�E, 27�N–32�N)
962 M. Bollasina, S. Nigam: Evolution and origin of summertime heat
123

3.5 The large-scale circulation context
The evolution of the Pak–India low is examined in the
context of the developing large-scale circulation in Fig. 7.
Full fields are shown in April and the monthly increments
thereafter.7 Sea-level pressure is lowest (*1,006 hPa)
along the Pakistan–India border (and in the eastern
Gangetic Plain) even in April. The low-level westerlies
confined to the south of the Zagros mountain range become
diffluent upon entering the Indian subcontinent, with the
northern stream skirting the nascent Pak–India low.
Sea-evel pressure drops precipitously in the subtropics in
subsequent months, with the Pak–India low region as one
of the foci; a 5–6 hPa decline occurs each month.8
Following Rodwell and Hoskins’ (1996) monsoon–desert
hypothesis linking the aridity of remote northwestern
regions to monsoon convection over South Asia, the impact
of eastern Indian Ocean and the Bay of Bengal convection
(key monsoon convection zones) on the Pak–India low
region is assessed from the structure of upper-level diver-
gent circulations (Fig. 8). The 200-hPa divergent outflow is
notably strong over Southeast Asia in May with divergent
winds directed toward a broad area from western India
to eastern Iran, and primary convergence over western
Pakistan and southern Afghanistan. This upper-level con-
vergence switches to divergence at lower levels, with a node
at 400–500 hPa (not shown). The 700-hPa divergence (also
not shown) is a mirror image of the upper-level pattern at
large scales, modulated by surface effects, including orogra-
phy. Deep convection and related upper-level outflow inten-
sifies and moves northward to the Bay of Bengal in July in
conjunction with monsoon onset over eastern India. Upper-
level divergent flow to the northwest is now principally
focused over the eastern Mediterranean (Rodwell and
Hoskins 1996), but with a secondary convergence center over
Iran–Turkmenistan–Afghanistan (i.e. east of the Caspian
Sea). Can the low-level divergent flow induced by upper-level
Fig. 6 Diurnal variation of the vertical profiles of pressure vertical
velocity (hPa day-1) and daily range of potential temperature
(�C, black) averaged over (left) the southern sector of the low
(66�E–71�E, 24�N–28�N) and (right) its northern sector (71�E–74�E,
28�N–31�N). For vertical velocity, the 00Z and 12Z profiles are
displayed (blue and red, respectively). The temperature range is
defined by the difference 12Z minus 00Z, and it has been multiplied
by 20 in order to fit to the same scale. Local time is UTC ? 5
7 The sea-level pressure change is preferred to the full field in
complex orography regions as the former underemphasizes the biases
introduced by the below-ground interpolation/extrapolation schemes
in computation of sea-level pressure.8 The pattern of the low-level horizontal circulation in the region of
the low (i.e. westerly flow; see the following Fig. 8) suggests that
thermal advection from the heating area may contribute to down-
stream warming (and related low sea-level pressure development)
over the Gangetic Plain (cf. Fig. 2).
M. Bollasina, S. Nigam: Evolution and origin of summertime heat 963
123

convergence (and subsidence) in these regions (but ulti-
mately by monsoon deep-convection much farther to the
east) be consequential for local sea-level pressure and cir-
culation development (e.g. the Pak–India low evolution)?
The monsoon–desert hypothesis of Rodwell and Hoskins
(1996) encourages pursuit of the idea that the Pak–India low
may be forced, in part, by the low-level divergent (and
rotational) flow. This forcing would manifest not directly,
but from its interaction with regional orography.
The idea is difficult to pursue, observationally, given the
challenge of attributing divergent flow to various processes,
especially in complex terrain regions. The 775-hPa stream-
lines are nonetheless superposed on regional orography in
Fig. 8 to broadly note the salient features: a weak anticyclonic
center is present over the Karakum desert in May; in July it
intensifies into a prominent ridge positioned northwestward
over the Caspian Sea (with strong northerly flow over western
Afghanistan), broadly tracking the movement of the upper-
level convergence (low-level divergence) zone.9 The ridge
will, of course, not be collocated with the divergence zone.
Even if this remotely induced divergence were its principal
forcing—unclear given the complex regional orography—the
ridge placement will be determined by the nature of the
vorticity balance: the large-scale (Sverdrup) balance would,
for example, result in the ridge being to the west. Regardless
of how this ridge is forced, it generates northerly flow over the
mountains: over the western Hindu Kush in May, and more
extensively, over the eastern Zagros, Elburz, and Hindu Kush
ranges in July. The mountain ranges, in particular the Hindu
Kush, deflect the flow, and while it is crossing the southern
slopes, if potential vorticity [:(f ? f)/H; with f the Coriolis
parameter, f the relative vorticity, and H the fluid column
height] is conserved, f will become more cyclonic
(i.e. positive) for f decreasing and H increasing, not incon-
sistent with the observed flow structure. Such mechanisms are
best investigated by a modeling analysis where the divergent
flow can be attributed to various processes.
4 Role of orography and land-surface in development
of the Pak–India low: a diagnostic modeling analysis
The steady, linear primitive-equation model used here
cannot capture the interaction of the remotely-induced
divergent (and rotational) flow with regional orography—
of the kind posited above for deepening of the Pak–India
low from intensifying Bay of Bengal convection in June
and July. It can, however, provide an estimate of the role of
regional orographic features in the generation of the low.10
Fig. 7 Sea-level pressure (hPa, shaded), and 775-hPa winds (m s-1)
for April (top), and differences (top to bottom) May–April, June–May,
July–June
9 Liu et al. (2007) have argued that the anticyclone is generated by the
blocking and deflection of westerly flow by the Himalayan–Tibetan
orography. The blocking and splitting of the westerly flow is well-
documented in winter and spring (e.g. Murakami 1987), but not for the
peak summer monsoon season. However, as the westerly flow in July is
present at higher latitudes, the upstream ridge observed in this period
likely originates from the monsoon-induced descent over this region.10 Estimating this role is challenging, especially from diagnostic
modeling where diabatic heating modifications in response to altered
orography are not computed, and thus not considered. Fortunately,
orography is being modified in a very arid region here, limiting
heating changes and their impact. Regardless, linear diagnostic
evaluations must be considered preliminary, as in this case. WRF-
based modeling—underway—should yield a more definitive assess-
ment of both dynamical and thermodynamical effects engendered by
changes in regional orography, assuming that the model simulation
with full forcing is realistic.
964 M. Bollasina, S. Nigam: Evolution and origin of summertime heat
123

Three model solutions are discussed, including the control
case (CTL) which is a simulation of summer stationary
waves using all forcing (cf. section 2). The realism of this
simulation will be an indicator of the suitability of this
model. The other two solutions are the ‘‘no-mountain’’
simulations, both generated with forcing as in CTL but
after removal of regional orographic features (as marked in
Fig. 1, top): the Taurus–Elburz–Zagros mountains
extending across Turkey and Iran are removed in the first
simulation (referred as ‘No-Zagros Taurus’) while the
Hindu Kush range in Afghanistan and Pakistan is zeroed
out in the second one (the ‘No-Hindu Kush’). The impact
of surface thermal forcing in the Pak–India low region is
also simulated in another sensitivity experiment.
4.1 Control simulation
The May and July sea level pressure in the CTL simulation
(Fig. 9, top panels) should be compared with their observed
counterparts (Fig. 2). The Pak–India low is evident in May
along with its deepening in July, with core values generally
consistent with ERA-40. The model, however, tends to
extend the low-pressure region too far westward (toward
Iran), perhaps because it cannot represent the non-linear
aspects of the flow’s interaction with orography. The
model’s performance is further assessed by examining the
850-hPa streamfunction and 600-hPa vertical velocity
(Fig. 10). As with sea-level pressure, the streamfunction
trough is placed more westward (over the Iran–Pakistan
border) in May, and more eastward (over the western
Himalayas) in July. The mid-tropospheric vertical velocity
is simulated more closely in the region except for the
stronger and somewhat shifted subsidence in the western
Himalayan sector. This shift is related to the eastward
placement of the monsoon trough (and related upper-level
Tibetan anticyclone) in the simulation.
4.2 Impact of regional orographic features
The Taurus–Elburz–Zagros Mountains lead to lower sea-
level pressure over the Middle East in both May and
July (Fig. 9, middle panels, obtained as CTL minus
‘No-Zagros Taurus’ simulation): a 6–8 hPa pressure drop
centered over Iran in this linear diagnosis. The effect is
evident at upper levels as well, as seen in the 850
streamfunction (Fig. 10) which also shows a modest fea-
ture over the Pak–India low region. The mountains thus
generate a cyclonic near-surface circulation with descent
over the southern slopes of the Zagros Mountain and the
Persian Gulf. Note, vertical motions arise from kinematic
interaction with orography, and to offset thermal advec-
tion by orographically forced circulation and/or diabatic
Fig. 8 Left Divergent wind (m s-1, arrows) and its divergence (910-6 s-1, shaded) at 200 hPa for May (top) and July (bottom). Right 775-hPa
streamlines on ERA-40 orography (m, brown shades with white contours every 300 m) for May (top) and July (bottom)
M. Bollasina, S. Nigam: Evolution and origin of summertime heat 965
123

heating. The presence of descent (ascent) in northerly
(southerly) regions in Fig. 10 (third panels from the top)
reflects some contribution from the offsetting of cold
(warm) advection under adiabatic conditions, applicable to
the regional mountain experiments.
The Hindu Kush mountains of Afghanistan and Pakistan
also generate low sea-level pressure (Fig. 9, bottom pan-
els). While their contribution is comparatively modest
(*3 hPa), it is in the core region of the Pak–India low,
attesting to the relevance of non-thermal forcing mecha-
nisms as well. The Hindu Kush impact on sea-level
pressure is focused in northern Pakistan in May and over
Afghanistan in July. In both months, these mountains
generate descent over southern Pakistan and eastern
Afghanistan, leading to severe aridity and lack of
vegetation in these regions (cf. Fig. 1), which must feed-
back on the low’s intensity.
4.3 Influence of the warm land-surface
As noted earlier, the Pak–India low is often refereed as the
‘‘heat’’ low, reflecting the view that its origin is rooted in
the heating of the underlying land-surface and attendant
sensible heating of the planetary boundary layer (together,
surface thermal forcing), a view contested in this paper.
The influence of surface thermal forcing in the Pak–India
low region is computed from the difference of two model
solutions: the control simulation and another in which
surface air temperature in the Pak–India low region
(62.5�E–75�E, 22.5�N–32.5�N) is capped at 30�C and
Fig. 9 May (left) and July (right) sea-level pressure (hPa) from the
linear primitive equation model control run (CTL, top; values below
1,000 hPa are shaded) and (middle and bottom) differences between
CTL and the two no-mountain sensitivity runs (No Zagros–Taurus
and No Hindu Kush, respectively; differences greater than 1 hPa are
shaded). The effect of the mountains (Zagros–Taurus and Hindu
Kush, respectively) is therefore represented
966 M. Bollasina, S. Nigam: Evolution and origin of summertime heat
123

diabatic heating (and transients) switched off in the plan-
etary boundary layer (r C 0.85).11 The surface temperature
forcing in May and July (Fig. 11, top panels) fully covers
the area of interest and is *5 K in the core region of the
low. The response to surface thermal forcing (Fig. 11,
bottom panels), consisting of a 1–2 hPa signal over
southwestern Pakistan, shows it to be consequential but
only modestly compared to the Hindu Kush mountains,
which generate a stronger signal (up to 3–4 hPa) over this
Fig. 10 May (left) and July (right) 850-hPa streamfunction
(910-6 m2 s-1, contours) and 600-hPa vertical velocity (Pa s-1,
shaded with the zero-contour line in grey) for (top to bottom) ERA40,
CTL, and differences between CTL and the two no-mountain
sensitivity runs (No Zagros–Taurus and No Hindu Kush, respec-
tively). The stream function is displayed as deviation from the global
average, which corrects for model global biases
11 Ideally, the planetary boundary layer heating should be set to the
surrounding region value, just as with surface air temperature. It was
removed all together, however, to provide an upper estimate of the
surface thermal impact.
M. Bollasina, S. Nigam: Evolution and origin of summertime heat 967
123
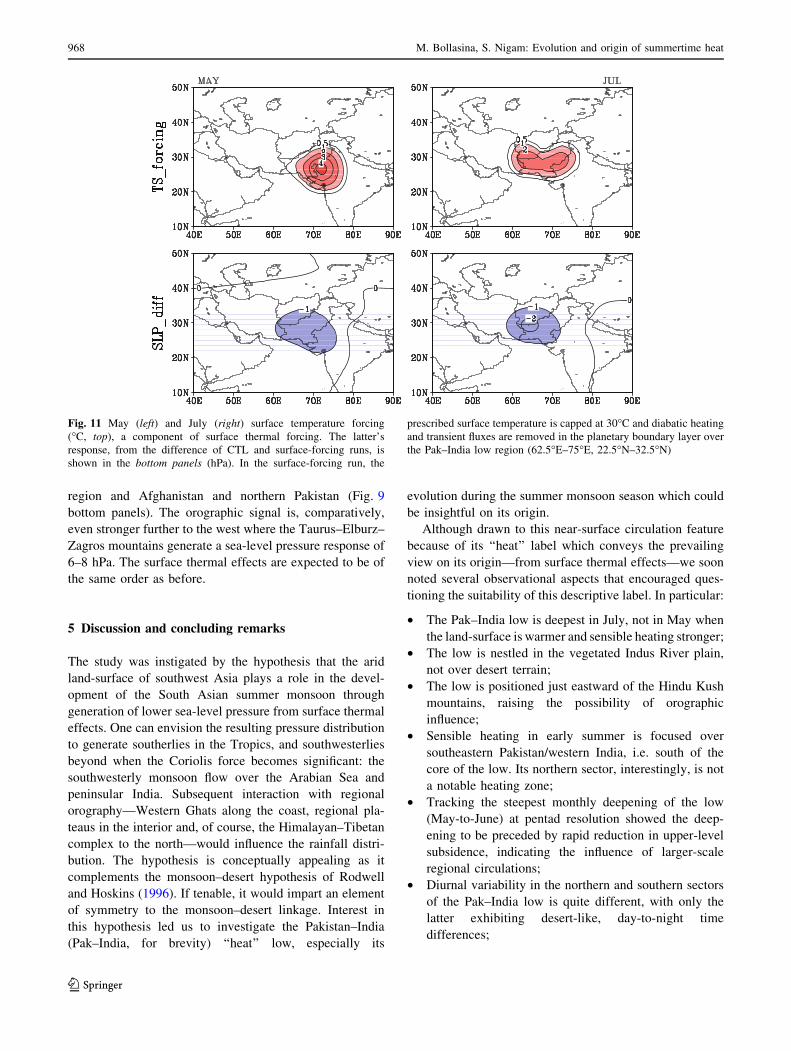
region and Afghanistan and northern Pakistan (Fig. 9
bottom panels). The orographic signal is, comparatively,
even stronger further to the west where the Taurus–Elburz–
Zagros mountains generate a sea-level pressure response of
6–8 hPa. The surface thermal effects are expected to be of
the same order as before.
5 Discussion and concluding remarks
The study was instigated by the hypothesis that the arid
land-surface of southwest Asia plays a role in the devel-
opment of the South Asian summer monsoon through
generation of lower sea-level pressure from surface thermal
effects. One can envision the resulting pressure distribution
to generate southerlies in the Tropics, and southwesterlies
beyond when the Coriolis force becomes significant: the
southwesterly monsoon flow over the Arabian Sea and
peninsular India. Subsequent interaction with regional
orography—Western Ghats along the coast, regional pla-
teaus in the interior and, of course, the Himalayan–Tibetan
complex to the north—would influence the rainfall distri-
bution. The hypothesis is conceptually appealing as it
complements the monsoon–desert hypothesis of Rodwell
and Hoskins (1996). If tenable, it would impart an element
of symmetry to the monsoon–desert linkage. Interest in
this hypothesis led us to investigate the Pakistan–India
(Pak–India, for brevity) ‘‘heat’’ low, especially its
evolution during the summer monsoon season which could
be insightful on its origin.
Although drawn to this near-surface circulation feature
because of its ‘‘heat’’ label which conveys the prevailing
view on its origin—from surface thermal effects—we soon
noted several observational aspects that encouraged ques-
tioning the suitability of this descriptive label. In particular:
• The Pak–India low is deepest in July, not in May when
the land-surface is warmer and sensible heating stronger;
• The low is nestled in the vegetated Indus River plain,
not over desert terrain;
• The low is positioned just eastward of the Hindu Kush
mountains, raising the possibility of orographic
influence;
• Sensible heating in early summer is focused over
southeastern Pakistan/western India, i.e. south of the
core of the low. Its northern sector, interestingly, is not
a notable heating zone;
• Tracking the steepest monthly deepening of the low
(May-to-June) at pentad resolution showed the deep-
ening to be preceded by rapid reduction in upper-level
subsidence, indicating the influence of larger-scale
regional circulations;
• Diurnal variability in the northern and southern sectors
of the Pak–India low is quite different, with only the
latter exhibiting desert-like, day-to-night time
differences;
Fig. 11 May (left) and July (right) surface temperature forcing
(�C, top), a component of surface thermal forcing. The latter’s
response, from the difference of CTL and surface-forcing runs, is
shown in the bottom panels (hPa). In the surface-forcing run, the
prescribed surface temperature is capped at 30�C and diabatic heating
and transient fluxes are removed in the planetary boundary layer over
the Pak–India low region (62.5�E–75�E, 22.5�N–32.5�N)
968 M. Bollasina, S. Nigam: Evolution and origin of summertime heat
123
• The upper-level divergent flow to the northwest of deep
monsoon convection over Bay of Bengal/eastern India
is focused over eastern Mediterranean and also Iran–
Turkmenistan–Afghanistan (Rodwell and Hoskins
1996). The remotely forced descent over the latter
region (and related rotational response) is not factored
in current explanations of the Pak–India low, especially
its summer evolution.
Our analysis, rooted in observations (principally
ERA-40 reanalysis) and diagnostic modeling, suggests
that the Pak–India low is forced both by regional and
remote forcing. Regionally, the influence of Hindu Kush
mountains is found to be stronger than the impact of
land-surface heating and attendant sensible heating of the
planetary boundary layer (referred, together, as surface
thermal forcing) by a factor of 1.5–2.0, questioning the
suitability of the ‘‘heat’’ label in canonical references to
this circulation feature.
Our observational analysis indicates that the notable
May-to-June deepening of the Pak–India low and its further
deepening in July, however, arises from remote forcing—
development of monsoon deep-convection over the Bay of
Bengal and eastern India in June and July. The importance
of monsoon convection for the upstream (northwest) region
aridity was noted in the seminal analysis of Rodwell and
Hoskins (1996). Here, we hypothesize that the upstream
descent over Iran-Turkmenistan-Afghanistan (i.e. east of
the Caspian Sea; noted in Rodwell and Hoskins’ paper as
well) and related low-level northerlies over the Elburz–
Zagros–Hindu Kush mountains also contribute to the
strengthening of the Pak–India low in June (and July)—not
directly, but from interaction with regional orography.
Modeling experiments with the weather research and
forecasting (WRF) model are underway to test this
hypothesis.
In summary, we find surface thermal forcing to have a
limited role in the development of the Pak–India low; the
forcing is somewhat influential in the low’s southeastern
sector (which has desert-like characteristics), principally,
in its nascent phase. The study argues for a reconsideration
of the physical processes important for the development of
the Pak–India low. Advancing understanding of the
development mechanisms of this summertime circulation
feature is essential given its strong precursor links to the
summer monsoon rainfall, a link captured in statistical
prediction models, as noted in the Introduction.
Acknowledgments The MODIS data were provided by the NASA’s
Land Processes Distributed Active Archive Center (LP DAAC). The
ERA-40 T106 data were provided by Dr D. Stepaniak at the NCAR’s
Computational and Information Systems Laboratory/Research Data
Archive (CISL/RDA). The authors acknowledge support of NSF and
DOE grants, ATM-0649666 and DEFG0208ER64548, respectively.
Massimo Bollasina was also supported by the Ann G. Wylie
Dissertation Fellowship from the University of Maryland Graduate
School, and by the Green Fund Foundation Award. This work con-
stitutes part of the doctoral thesis of the first Author. The authors
thank Dr. Thomas Spengler and an anonymous reviewer for their
constructive remarks.
References
Amante C, Eakins BW (1998) ETOPO1 1 arc-minute global relief
model: procedures, data sources and analysis. National
Geophysical Data Center, NESDIS, NOAA, US Department of
Commerce, Boulder, CO
Bitan A, Sa’aroni H (1992) The horizontal and vertical extension of
the Persian Gulf pressure trough. Int J Climatol 12:733–747
Blake DW, Krishnamurti TN, Low-Nam SV, Fein JS (1983) Heat low
over the Saudi Arabian desert during May 1979 (Summer
MONEX). Mon Weather Rev 111:1759–1775
Chan SC, Nigam S (2009) Residual diagnosis of diabatic heat from
ERA-40 and NCEP reanalyses: intercomparison with TRMM.
J Clim 22:414–428
Chang J-H (1972) Atmospheric circulation systems and climates.
Oriental Publish Co., Hawaii, p 328
Das PK (1962) Mean vertical motion and non-adiabatic heat sources
over India during the monsoon. Tellus 14:212–220
Johnson RH (2003) Thermal low. In: Holton J, Pyle J, Curry JA (eds)
Encyclopedia of atmospheric science, Academic Press, London,
United Kingdom, pp 2269–2273
Joshi PC, Desai PS (1985) The satellite-determined thermal structure
of heat low during Indian south-west monsoon season. Adv
Space Res 5:57–60
Keshavamurty RN, Awade ST (1970) On the maintenance of the
mean monsoon trough over North India. Mon Weather Rev
98:315–320
Liu Y, Hoskins B, Blackburn M (2007) Impact of Tibetan orography
and heating on the summer flow over Asia. J Meteor Soc Japan
85B:1–19
Mitchell TD, Jones PD (2005) An improved method of constructing a
database of monthly climate observations and associated high-
resolution grids. Int J Climatol 25:693–712
Murakami T (1987) Orography and monsoons. In: Fein JS, Stephens
PL (eds) Monsoons, Wiley, New York, pp 331–364
Nigam S, Chan SC (2009) On the summertime strengthening of the
Northern Hemisphere Pacific sea level pressure anticyclone.
J Clim 22:1174–1192
Parthasarathy B, Rupa Kumar K, Munot AA (1992) Surface pressure
and summer monsoon rainfall over India. Adv Atmos Sci
9:359–366
Portela A, Castro M (1996) Summer thermal lows in the Iberian
peninsula: a three-dimensional simulation. Q J R Meteorol Soc
122:1–22
Racz Z, Smith RK (1999) The dynamics of heat lows. Q J R Meteorol
Soc 125:225–252
Ramage CS (1966) The summer atmospheric circulation over the
Arabian Sea. J Atmos Sci 23:144–150
Rodwell MJ, Hoskins BJ (1996) Monsoons and the dynamics of
deserts. Q J R Meteorol Soc 122:1385–1404
Sikka DR (1997) Desert climate and its dynamics. Curr Sci 72:35–46
Singh D, Bhadram CVV, Mandal GS (1995) New regression model
for Indian summer monsoon rainfall. Meteorol Atmos Phys
55:77–86
Smith EA (1986) The structure of the Arabian heat low. Part II: bulk
tropospheric heat budget and implications. Mon Weather Rev
114:1084–1102
M. Bollasina, S. Nigam: Evolution and origin of summertime heat 969
123

Spengler T, Smith RK (2008) The dynamics of heat lows over flat
terrain. Q J R Meteorol Soc 134:2157–2172
Uppala SM et al (2005) The ERA40 reanalysis. Q J R Meteorol Soc
131:2961–3012
Warner TT (2004) Desert meteorology. Cambridge University Press,
London, p 612
Wu GX, Liu Y, Zhu X, Li W, Ren R, Duan A, Liang X (2009) Multi-
scale forcing and the formation of subtropical desert and
monsoon. Ann Geophys 27:3631–3644
Yanai M, Li C, Song Z (1992) Seasonal heating of the Tibetan Plateau
and its effects on the evolution of the Asian summer monsoon.
J Meteor Soc Jpn 70:319–351
970 M. Bollasina, S. Nigam: Evolution and origin of summertime heat
123
Recommended