The State of Customer Experience 2017
Tech
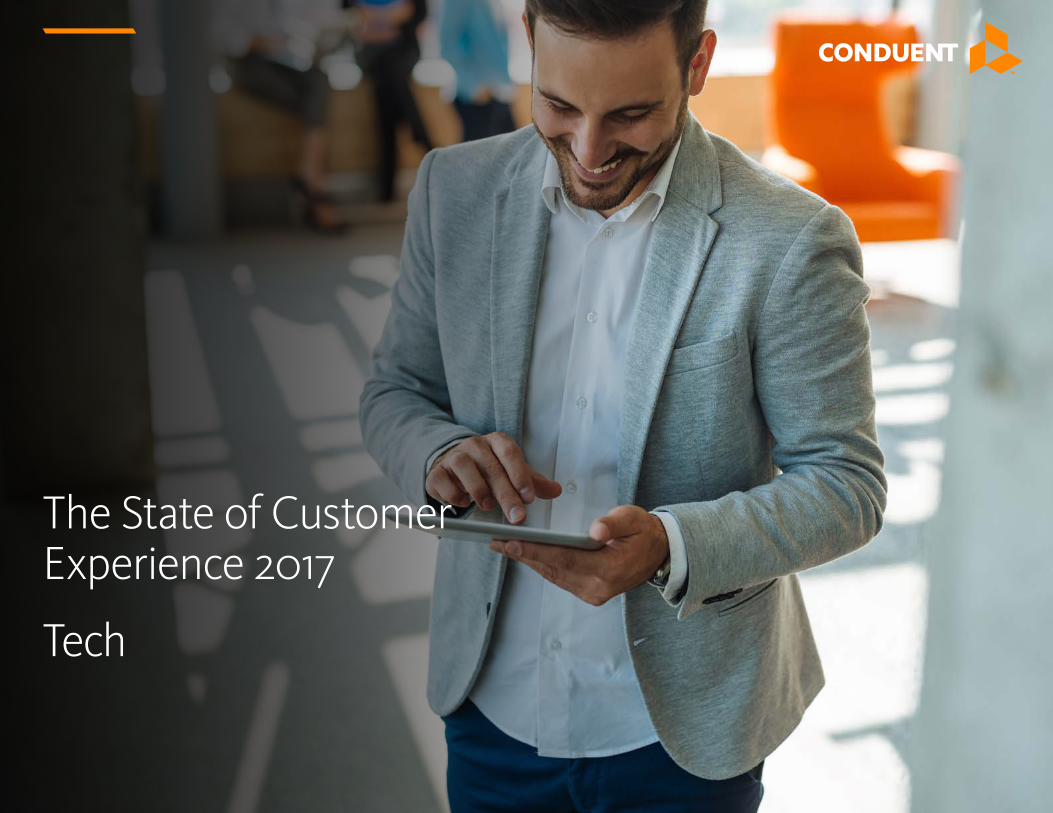
45% of tech customers will move suppliers given the right incentive.
65% increase in consumer use of digital channels to communicate with brands between 2015 and 2017.
75% of customers are being failed by tech brands not providing the right support to encourage successful self-help.
10% is the dropped satisfaction rate of customer services between 2015 and 2017.
Overview of the survey
Welcome backJohn
3The State of Customer Experience 2017
Overview of the survey 2
Executive Summary 4
Introduction 5
1. Your customers 7Your customers 8
Tech customers are loyal 9
How do your customers communicate? 10
Who are your customers? 11
2. Engaging over multiple channels 12Digital edges traditional channels 13
Preferred channel 14
Actual usage 16
Why didn’t you use your preferred channel? 17
Contents
3. Data, trust and personalization 18Trust 19
Trust and data 20
Data and privacy 21
4. The customer journey 23The customer journey 24
The rise of self-help 25
Self-help: Virtual assistants 26
Brands failing self-help customers 27
Call center 28
The path to resolution 29
The risky second step 30
The university of communication 31
Mood 32
Leave them wanting more 33
5. Driving effective engagement 34Recommended channels 35
Gone in 600 seconds 36
I can’t get no satisfaction 37
I can’t get no digital satisfaction 38
Omnichannel wannabes 39
Customer experience nirvana 40
2027 41
4State of Customer Experience 2017
Regardless, as part of the digital evolution, customers are increasingly turning to self-help. More than half of respondents (54%) have used self-help, but there is a split between those that use self-help effectively (DIY Heroes), and those that are ineffective (Digital Conversationalists).
Presently, 76% of customers are providing personal data to their technology supplier, but a lowly 41% of customers feel these brands know them, which is a decline of 8 percentage points since 2015.
By sharing their data, customers are looking for a value exchange from their tech supplier based on a cost saving (59%) and time savings (41.7%).
Brands unable to utilise customer data for the benefit of the customer, either through aftercare support or value, will risk alienating that customer and damaging the brand-customer relationship.
Brands now have to appeal to three types of customers:
• Do-It-Yourself Heroes (24% of respondents) are digitally immersed and will look to self-help (website self-help, on-device help app, and virtual assistant), to avoid person-to-person interaction.
• Digital Conversationalists (27% of respondents) like to engage with people digitally (email, website web chat, social media), and have an inclination to self-solve.
• Conversationalists (49% of respondents) seek human interaction through face-to-face or phone communication.
Tech brands have 10 minutes or less across the majority of channels to resolve a customer’s question if they are to dramatically improve customer satisfaction levels. But brands are failing 80% of customers by not achieving first step resolution, and a similar number (75%) by not providing support to encourage successful self-help.
The digital divide between tech suppliers and their customers is growing: Tech brands continue to offer a disjointed, fragmented and siloed, omnichannel-esque customer support leaving 47% of consumers dissatisfied. Between 2015 and 2017, customer satisfaction has dropped 10%.
Digital channels (51%) are now the most popular routes for interaction between a customer and their tech supplier.
Digital channel usage (email, website, website webchat, social media) has increased 65% between 2015 and 2017, with on-device help, social media and virtual assistant the three channels experiencing the largest usage increase.
However, digital has the lowest satisfaction levels across all customer support channels, as tech brands fail to create a consistent experience across their omnichannel platform.
Executive Summary
5The State of Customer Experience 2017
As we take you through your customer’s journey, you will meet three personas that we believe will help you shape your customer service strategy of the future.
Our focus in this edition is Tech. You can find our Media Edition and Communications Edition at www.conduent.com/insights/customer-care/state-customer-experience-2017/
Two years is a long time in the world of customer experience and the period between 2015 and now is no different with some major developments taking place.
Once again we’ve surveyed consumers from the US, UK, Germany and the Netherlands, and quizzed them on how they communicate with tech brands, which brands they love, how they feel about sharing their personal data, their levels of trust and satisfaction, and their expectations of customer service.
What we’ve uncovered is that customers are contacting their suppliers with a growing frequency and their expectations are getting higher and higher. Brands are not rising to this challenge and the satisfaction gap between customers and suppliers is expanding. Tech customers are loyal but for how long?
The State of Customer Experience 2017 returns after its 2016 hiatus and from what we can gather it’s just in the nick of time.
Introduction
6State of Customer Experience 2017
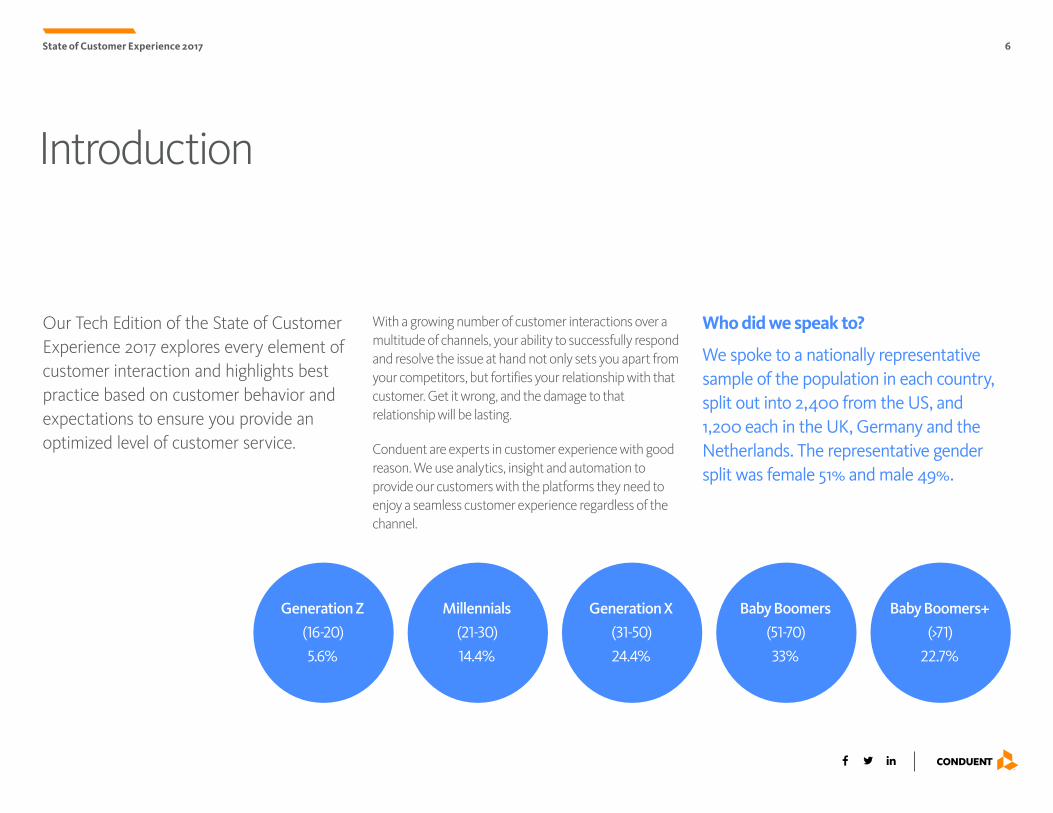
Who did we speak to?
We spoke to a nationally representative sample of the population in each country, split out into 2,400 from the US, and 1,200 each in the UK, Germany and the Netherlands. The representative gender split was female 51% and male 49%.
With a growing number of customer interactions over a multitude of channels, your ability to successfully respond and resolve the issue at hand not only sets you apart from your competitors, but fortifies your relationship with that customer. Get it wrong, and the damage to that relationship will be lasting.
Conduent are experts in customer experience with good reason. We use analytics, insight and automation to provide our customers with the platforms they need to enjoy a seamless customer experience regardless of the channel.
Our Tech Edition of the State of Customer Experience 2017 explores every element of customer interaction and highlights best practice based on customer behavior and expectations to ensure you provide an optimized level of customer service.
Introduction
Millennials
(21-30)
14.4%
Generation Z
(16-20)
5.6%
Generation X
(31-50)
24.4%
Baby Boomers
(51-70)
33%
Baby Boomers+
(>71)
22.7%
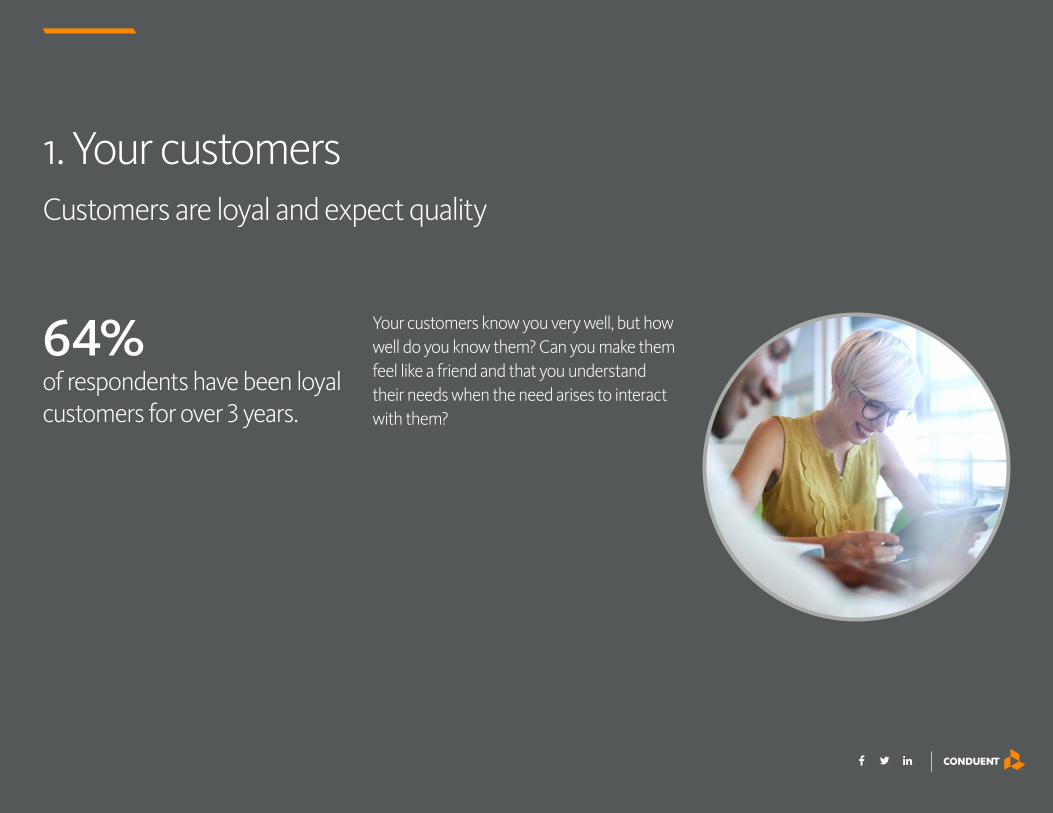
1. Your customersCustomers are loyal and expect quality
Your customers know you very well, but how well do you know them? Can you make them feel like a friend and that you understand their needs when the need arises to interact with them?
64% of respondents have been loyal customers for over 3 years.
8Your customers
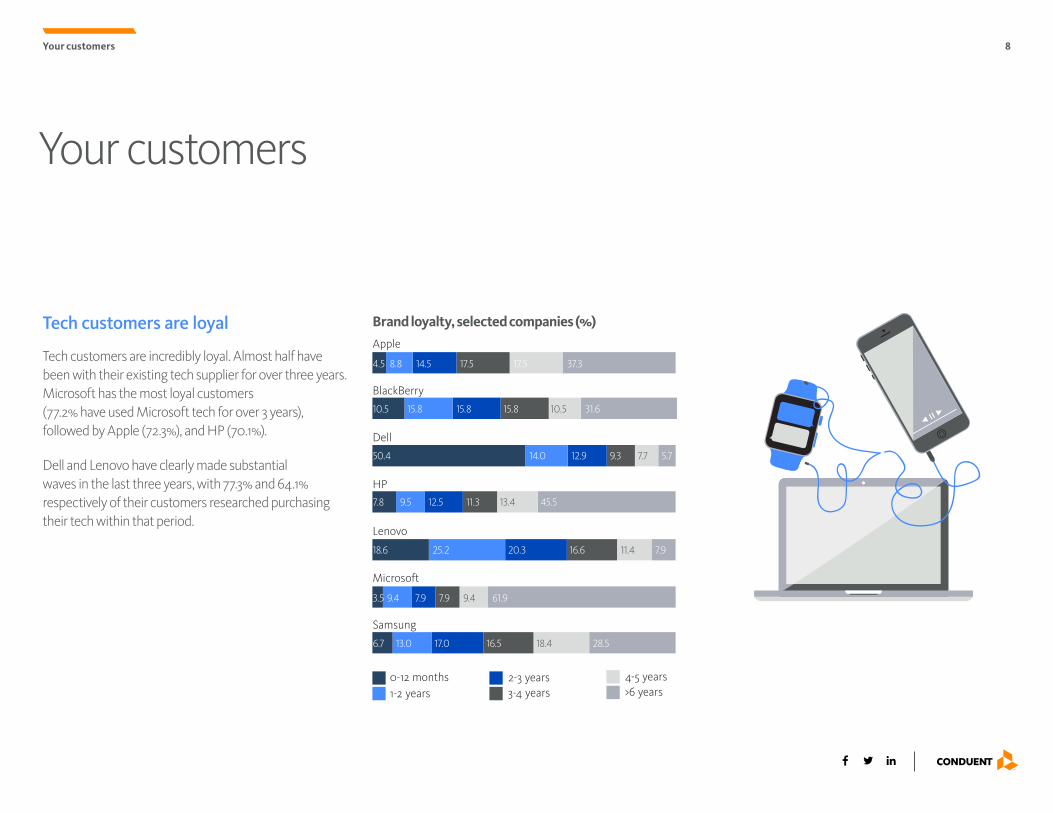
Tech customers are loyal
Tech customers are incredibly loyal. Almost half have been with their existing tech supplier for over three years. Microsoft has the most loyal customers (77.2% have used Microsoft tech for over 3 years), followed by Apple (72.3%), and HP (70.1%).
Dell and Lenovo have clearly made substantial waves in the last three years, with 77.3% and 64.1% respectively of their customers researched purchasing their tech within that period.
Your customers
>6 years4-5 years
3-4 years2-3 years
1-2 years0-12 months
4.5
10.5
50.4
7.8 9.5 12.5 11.3 13.4 45.5
18.6 25.2 20.3 16.6 11.4 7.9
3.5 9.4 9.4 61.97.9 7.9
6.7 13.0 17.0 16.5 18.4 28.5
14.0 12.9 9.3 7.7 5.7
15.8 15.8 15.8 10.5 31.6
8.8 14.5 17.5 17.5 37.3
Samsung
Microsoft
Lenovo
HP
Dell
BlackBerry
Apple
Brand loyalty, selected companies (%)
9
Tech customers are loyal
0%
10%
20%
30%
40%
50%
60%
70%
Satis�edHappily satis�edVery satis�ed
Ace
r
Am
azon
App
le
Asu
s
Blac
kber
ry
Del
l
Fujit
su
Goo
gle
HP
HTC
Hua
wei
Leno
vo
Mic
roso
ft
Mot
orol
a
Nok
ia
Sam
sung
Sony
Tosh
iba
LG
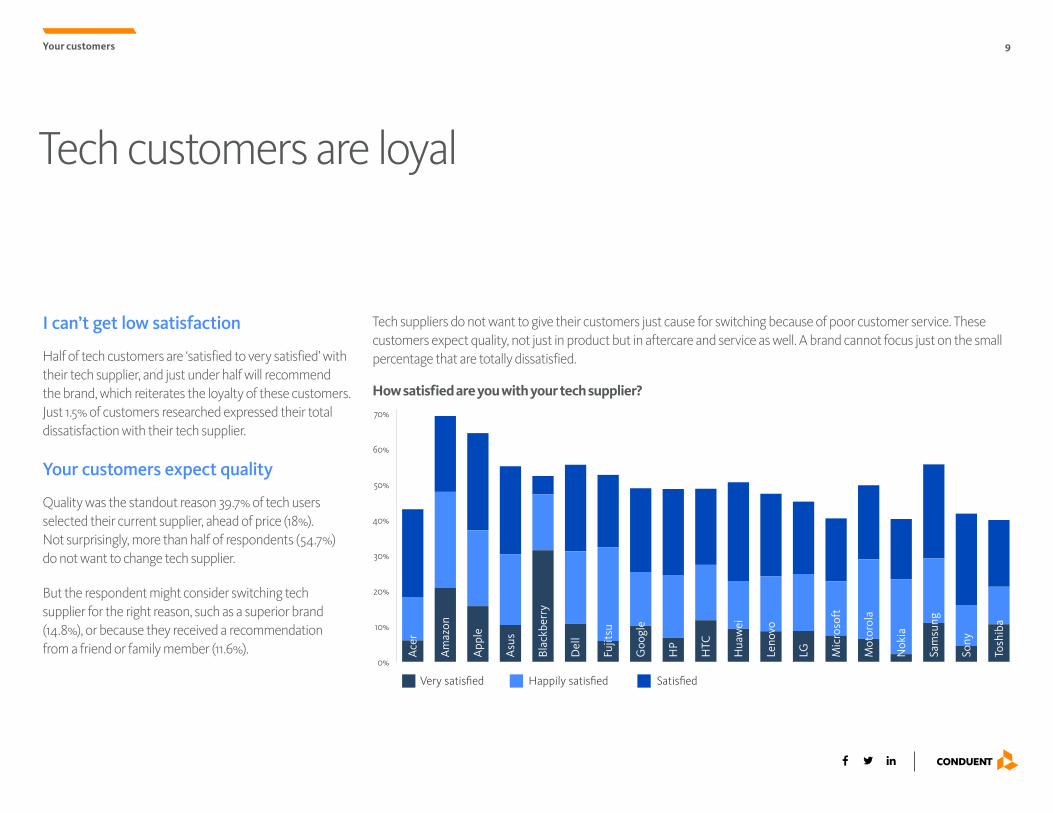
How satisfied are you with your tech supplier?
Your customers
I can’t get low satisfaction
Half of tech customers are ‘satisfied to very satisfied’ with their tech supplier, and just under half will recommend the brand, which reiterates the loyalty of these customers. Just 1.5% of customers researched expressed their total dissatisfaction with their tech supplier.
Your customers expect quality
Quality was the standout reason 39.7% of tech users selected their current supplier, ahead of price (18%). Not surprisingly, more than half of respondents (54.7%) do not want to change tech supplier.
But the respondent might consider switching tech supplier for the right reason, such as a superior brand (14.8%), or because they received a recommendation from a friend or family member (11.6%).
Tech suppliers do not want to give their customers just cause for switching because of poor customer service. These customers expect quality, not just in product but in aftercare and service as well. A brand cannot focus just on the small percentage that are totally dissatisfied.
10
The rise of the omnichannellers
With smartphone penetration extremely high among consumers throughout the developed world, communication has fundamentally changed as mobile has become the centralized communications hub for consumers. It’s as easy to email as it is to text regardless of time or location, and on top of everything else, social media has gotten in on the act as well.
The research revealed that the average consumer uses predominantly five channels to communicate with family and friends, but only two channels when it comes to interacting with brands – which two is left up to the behest of the customer based a number of variables, from the type of issue, the time, day, device availability, and their frame of mind.
As a tech brand you must not be fooled into believing you simply need to offer a phone and email service. Your customers are spearheading omnichannel communications, and you need to ensure you are ready to receive their communication over their desired channel at the time of their choosing.
Your customers will have a primary and secondary channel for communicating with you, but they are accustomed to communicating over five channels. Your omnichannel strategy must incorporate every possible eventuality to ensure your engagement gets off on a positive note. After all, 45% of your customers will move tech provider given sufficient incentive.
But the need to deliver an omnichannel experience runs deeper still. Your inability to accommodate the customer’s desired channel will impact their mood, which could potentially influence the outcome of your engagement, and could damage the longevity of your relationship with that customer, and their likelihood to recommend you.
How do your customers communicate?
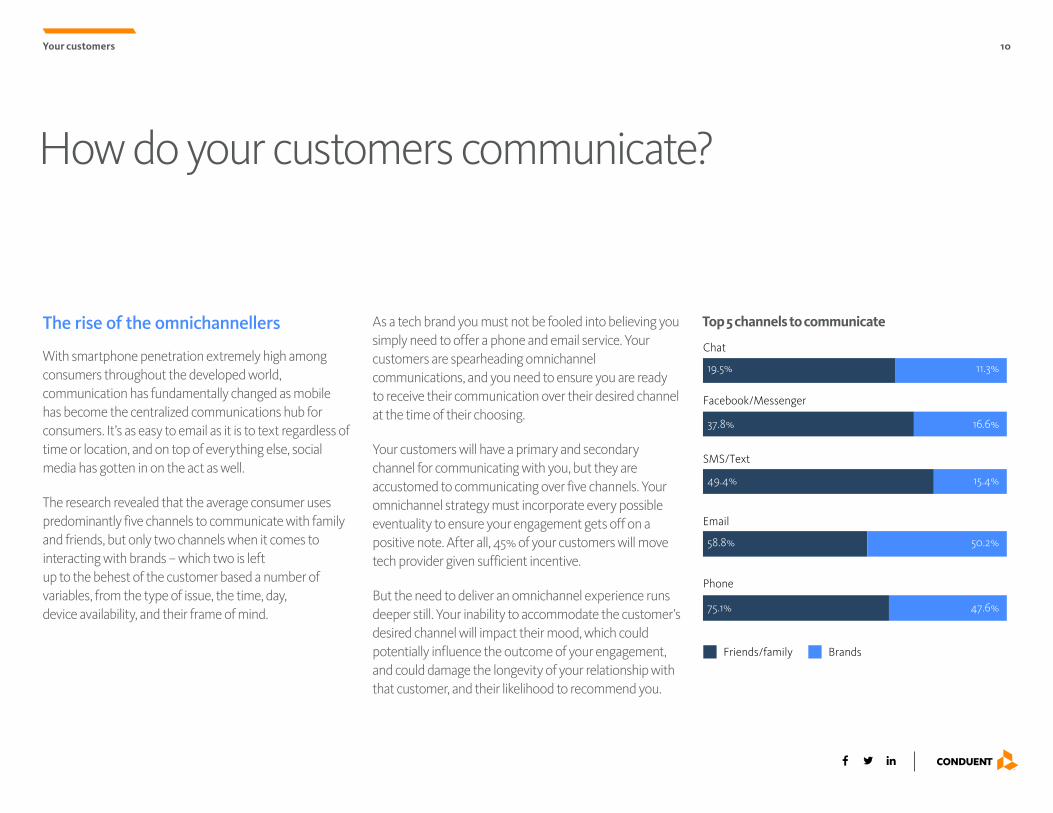
75.1% 47.6%
58.8% 50.2%
49.4% 15.4%
37.8% 16.6%
19.5% 11.3%
Phone
SMS/Text
Facebook/Messenger
Chat
Friends/family Brands
Top 5 channels to communicate
Your customers
11
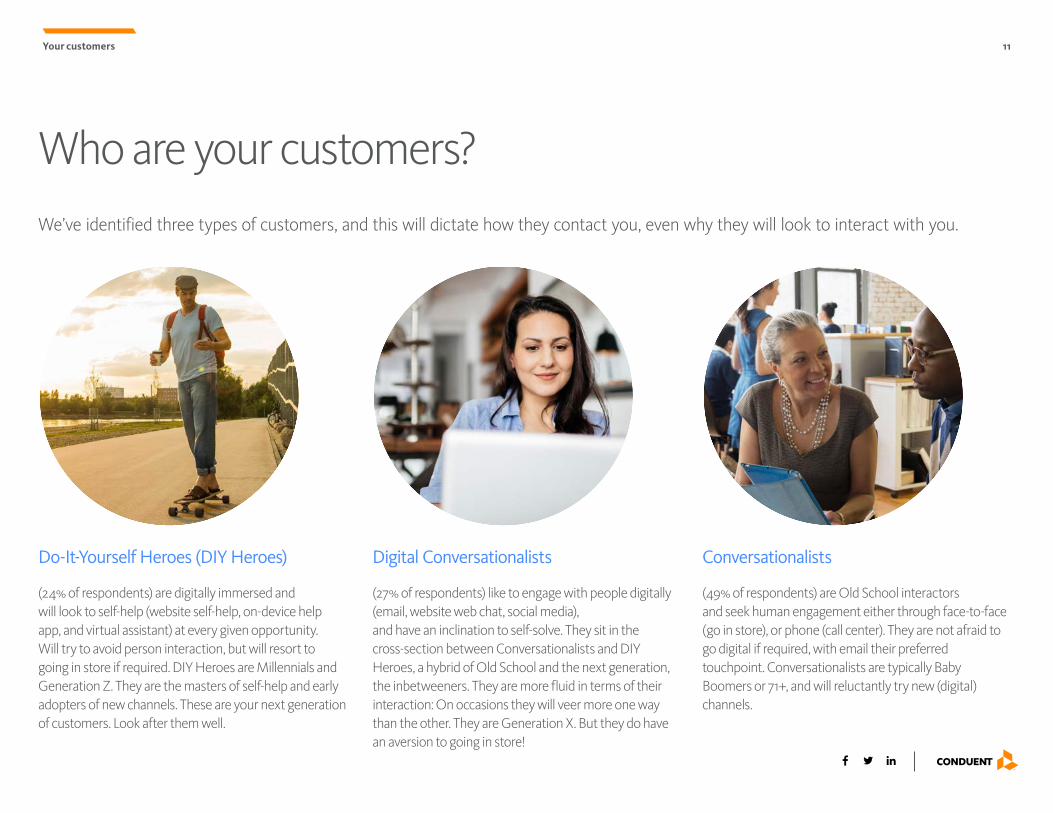
Digital Conversationalists
(27% of respondents) like to engage with people digitally (email, website web chat, social media), and have an inclination to self-solve. They sit in the cross-section between Conversationalists and DIY Heroes, a hybrid of Old School and the next generation, the inbetweeners. They are more fluid in terms of their interaction: On occasions they will veer more one way than the other. They are Generation X. But they do have an aversion to going in store!
Conversationalists
(49% of respondents) are Old School interactors and seek human engagement either through face-to-face (go in store), or phone (call center). They are not afraid to go digital if required, with email their preferred touchpoint. Conversationalists are typically Baby Boomers or 71+, and will reluctantly try new (digital) channels.
Do-It-Yourself Heroes (DIY Heroes)
(24% of respondents) are digitally immersed and will look to self-help (website self-help, on-device help app, and virtual assistant) at every given opportunity. Will try to avoid person interaction, but will resort to going in store if required. DIY Heroes are Millennials and Generation Z. They are the masters of self-help and early adopters of new channels. These are your next generation of customers. Look after them well.
Who are your customers?We’ve identified three types of customers, and this will dictate how they contact you, even why they will look to interact with you.
Your customers
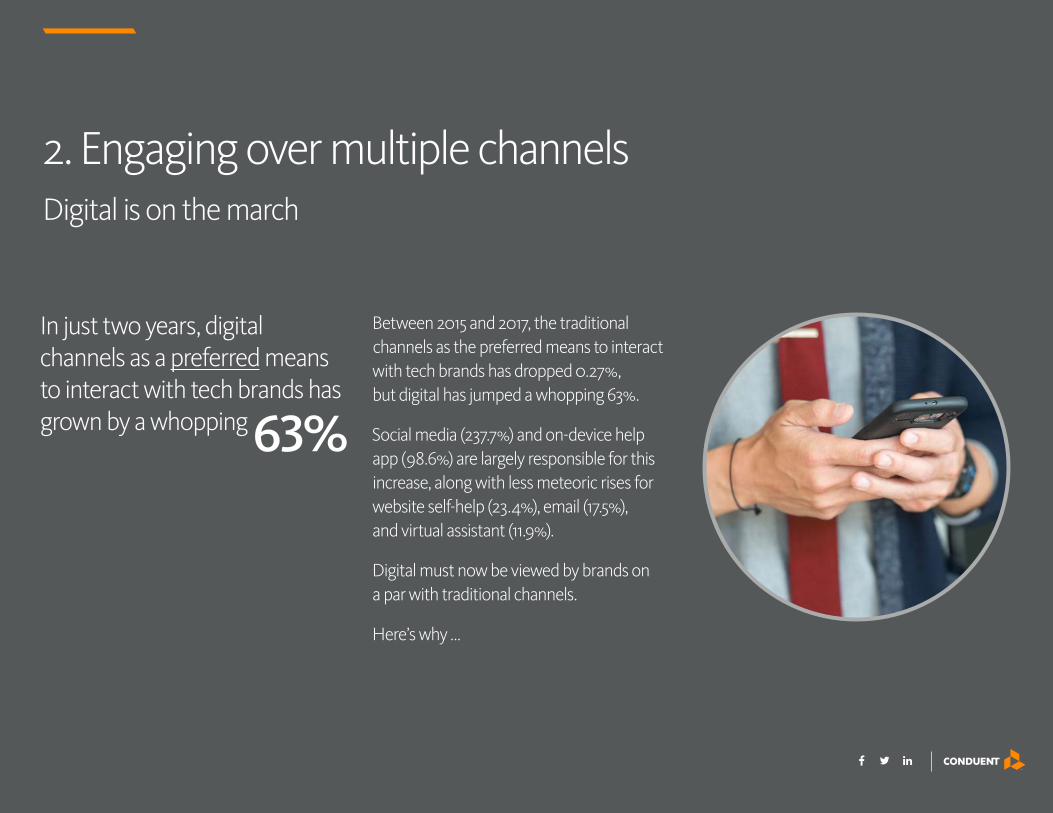
Between 2015 and 2017, the traditional channels as the preferred means to interact with tech brands has dropped 0.27%, but digital has jumped a whopping 63%.
Social media (237.7%) and on-device help app (98.6%) are largely responsible for this increase, along with less meteoric rises for website self-help (23.4%), email (17.5%), and virtual assistant (11.9%).
Digital must now be viewed by brands on a par with traditional channels.
Here’s why …
2. Engaging over multiple channelsDigital is on the march
In just two years, digital channels as a preferred means to interact with tech brands has grown by a whopping 63%
13Engaging over multiple channels
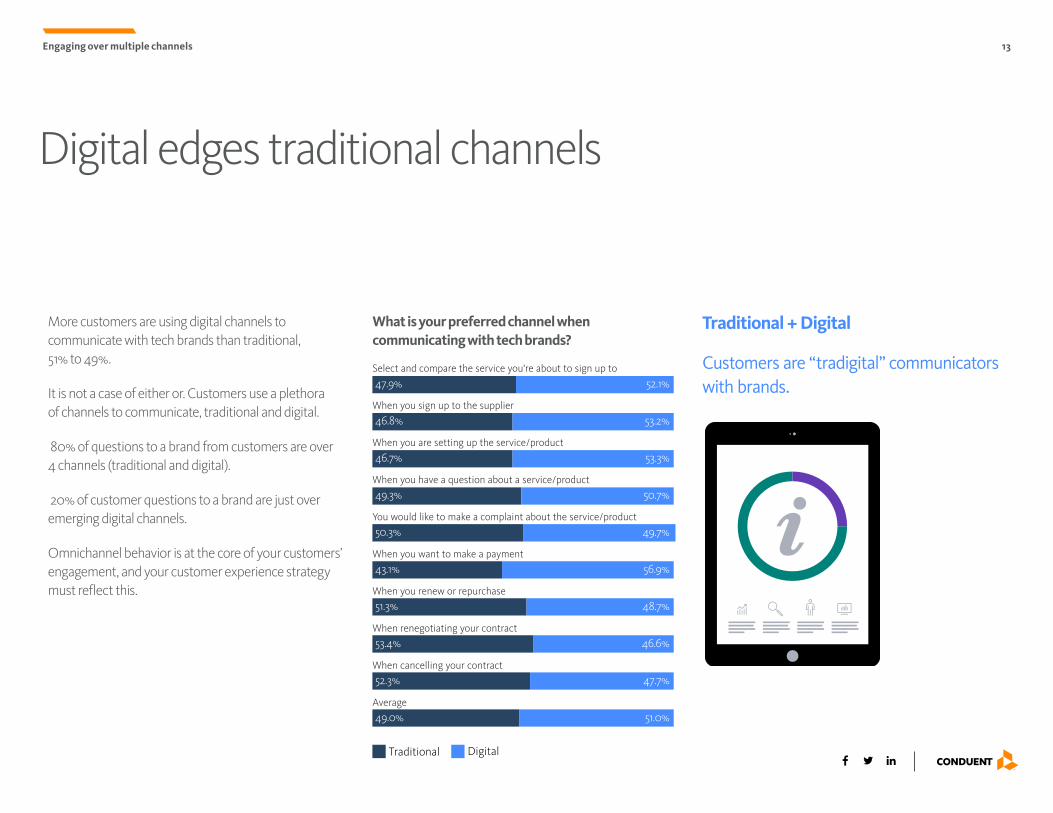
More customers are using digital channels to communicate with tech brands than traditional, 51% to 49%.
It is not a case of either or. Customers use a plethora of channels to communicate, traditional and digital.
80% of questions to a brand from customers are over 4 channels (traditional and digital).
20% of customer questions to a brand are just over emerging digital channels.
Omnichannel behavior is at the core of your customers’ engagement, and your customer experience strategy must reflect this.
Traditional + Digital
Customers are “tradigital” communicators with brands.
Digital edges traditional channels
47.9%
46.8%
46.7%
49.3%
50.3%
43.1%
51.3%
53.4%
52.3%
49.0%
52.1%
53.2%
53.3%
50.7%
49.7%
56.9%
48.7%
46.6%
47.7%
51.0%
Traditional Digital
When you sign up to the supplier
Select and compare the service you're about to sign up to
When you are setting up the service/product
When you have a question about a service/product
You would like to make a complaint about the service/product
When you want to make a payment
When you renew or repurchase
When cancelling your contract
When renegotiating your contract
Average
What is your preferred channel when communicating with tech brands?
14
Preferred channel
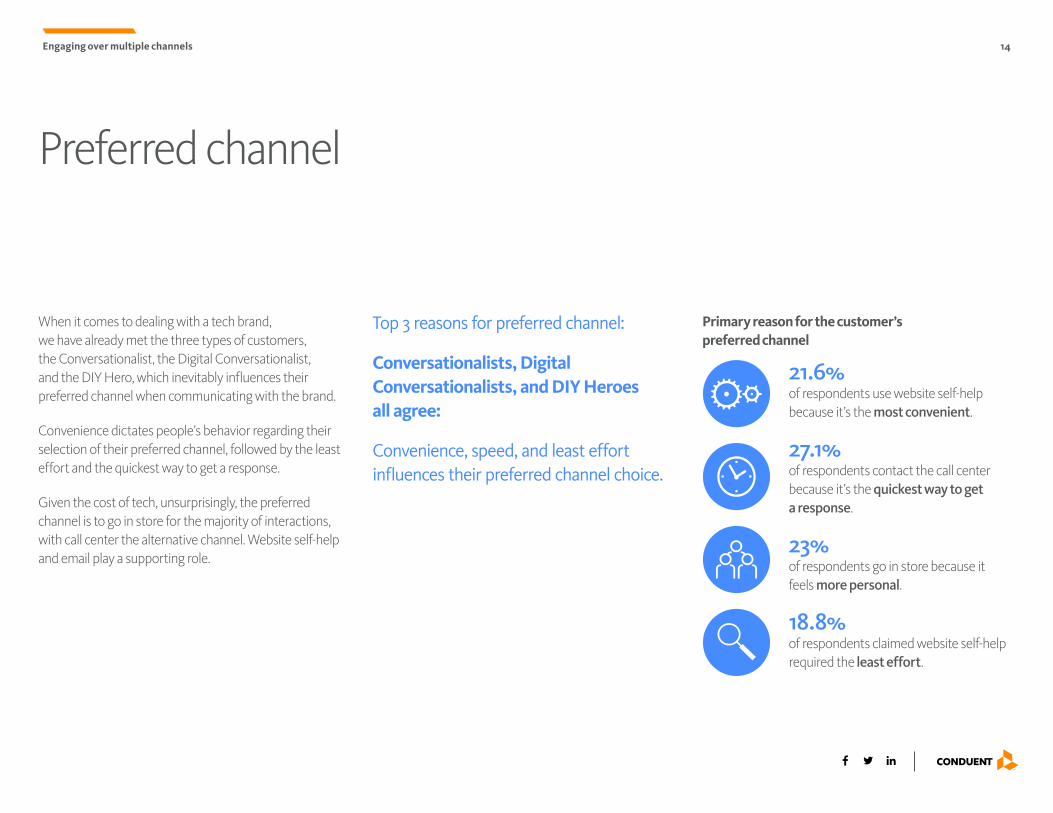
When it comes to dealing with a tech brand, we have already met the three types of customers, the Conversationalist, the Digital Conversationalist, and the DIY Hero, which inevitably influences their preferred channel when communicating with the brand.
Convenience dictates people’s behavior regarding their selection of their preferred channel, followed by the least effort and the quickest way to get a response.
Given the cost of tech, unsurprisingly, the preferred channel is to go in store for the majority of interactions, with call center the alternative channel. Website self-help and email play a supporting role.
Top 3 reasons for preferred channel:
Conversationalists, Digital Conversationalists, and DIY Heroes all agree:
Convenience, speed, and least effort influences their preferred channel choice.
Primary reason for the customer’s preferred channel
21.6% of respondents use website self-help because it’s the most convenient.
27.1% of respondents contact the call center because it’s the quickest way to get a response.
23% of respondents go in store because it feels more personal.
18.8% of respondents claimed website self-help required the least effort.
Engaging over multiple channels
15
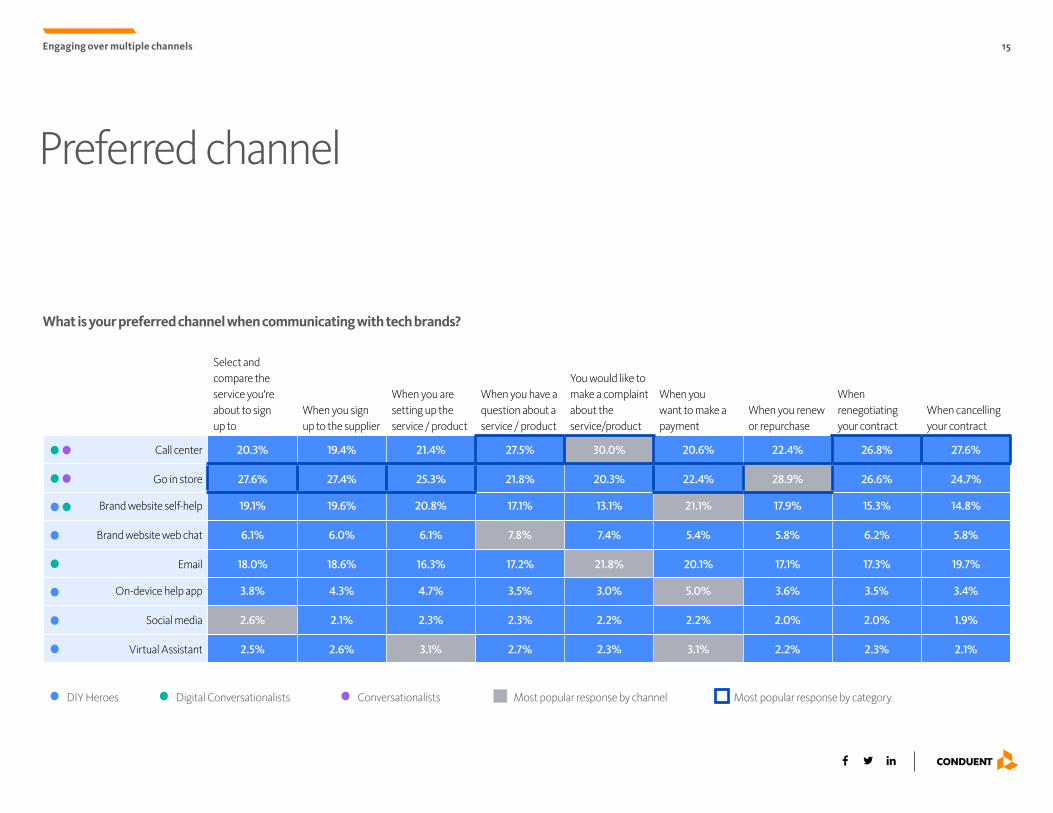
What is your preferred channel when communicating with tech brands?
Select and compare the service you're about to sign up to
When you sign up to the supplier
When you are setting up the service / product
When you have a question about a service / product
You would like to make a complaint about the service/product
When you want to make a payment
When you renew or repurchase
When renegotiating your contract
When cancelling your contract
Call center 20.3% 19.4% 21.4% 27.5% 30.0% 20.6% 22.4% 26.8% 27.6%
Go in store 27.6% 27.4% 25.3% 21.8% 20.3% 22.4% 28.9% 26.6% 24.7%
Brand website self-help 19.1% 19.6% 20.8% 17.1% 13.1% 21.1% 17.9% 15.3% 14.8%
Brand website web chat 6.1% 6.0% 6.1% 7.8% 7.4% 5.4% 5.8% 6.2% 5.8%
Email 18.0% 18.6% 16.3% 17.2% 21.8% 20.1% 17.1% 17.3% 19.7%
On-device help app 3.8% 4.3% 4.7% 3.5% 3.0% 5.0% 3.6% 3.5% 3.4%
Social media 2.6% 2.1% 2.3% 2.3% 2.2% 2.2% 2.0% 2.0% 1.9%
Virtual Assistant 2.5% 2.6% 3.1% 2.7% 2.3% 3.1% 2.2% 2.3% 2.1%
Preferred channel
Engaging over multiple channels
DIY Heroes Most popular response by channel Most popular response by categoryDigital Conversationalists Conversationalists
16
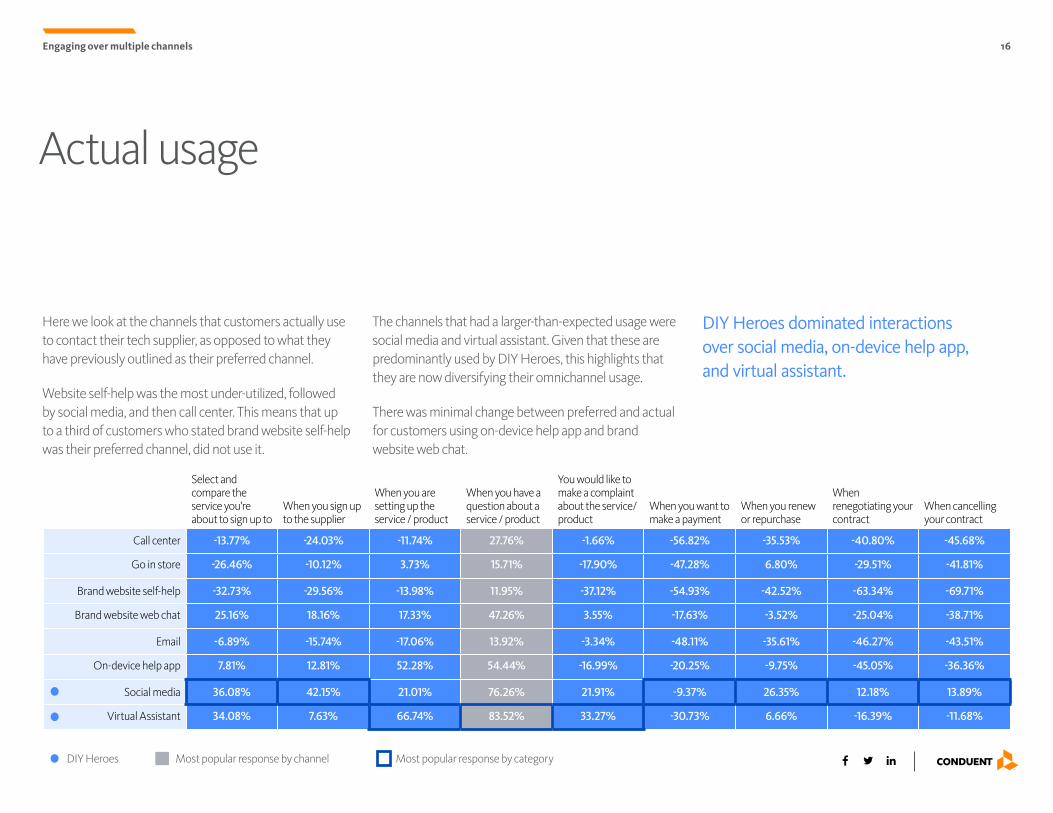
Here we look at the channels that customers actually use to contact their tech supplier, as opposed to what they have previously outlined as their preferred channel.
Website self-help was the most under-utilized, followed by social media, and then call center. This means that up to a third of customers who stated brand website self-help was their preferred channel, did not use it.
DIY Heroes dominated interactions over social media, on-device help app, and virtual assistant.
Actual usage
Engaging over multiple channels
The channels that had a larger-than-expected usage were social media and virtual assistant. Given that these are predominantly used by DIY Heroes, this highlights that they are now diversifying their omnichannel usage.
There was minimal change between preferred and actual for customers using on-device help app and brand website web chat.
Select and compare the service you're about to sign up to
When you sign up to the supplier
When you are setting up the service / product
When you have a question about a service / product
You would like to make a complaint about the service/product
When you want to make a payment
When you renew or repurchase
When renegotiating your contract
When cancelling your contract
Call center -13.77% -24.03% -11.74% 27.76% -1.66% -56.82% -35.53% -40.80% -45.68%
Go in store -26.46% -10.12% 3.73% 15.71% -17.90% -47.28% 6.80% -29.51% -41.81%
Brand website self-help -32.73% -29.56% -13.98% 11.95% -37.12% -54.93% -42.52% -63.34% -69.71%
Brand website web chat 25.16% 18.16% 17.33% 47.26% 3.55% -17.63% -3.52% -25.04% -38.71%
Email -6.89% -15.74% -17.06% 13.92% -3.34% -48.11% -35.61% -46.27% -43.51%
On-device help app 7.81% 12.81% 52.28% 54.44% -16.99% -20.25% -9.75% -45.05% -36.36%
Social media 36.08% 42.15% 21.01% 76.26% 21.91% -9.37% 26.35% 12.18% 13.89%
Virtual Assistant 34.08% 7.63% 66.74% 83.52% 33.27% -30.73% 6.66% -16.39% -11.68%
DIY Heroes Most popular response by channel Most popular response by category
17
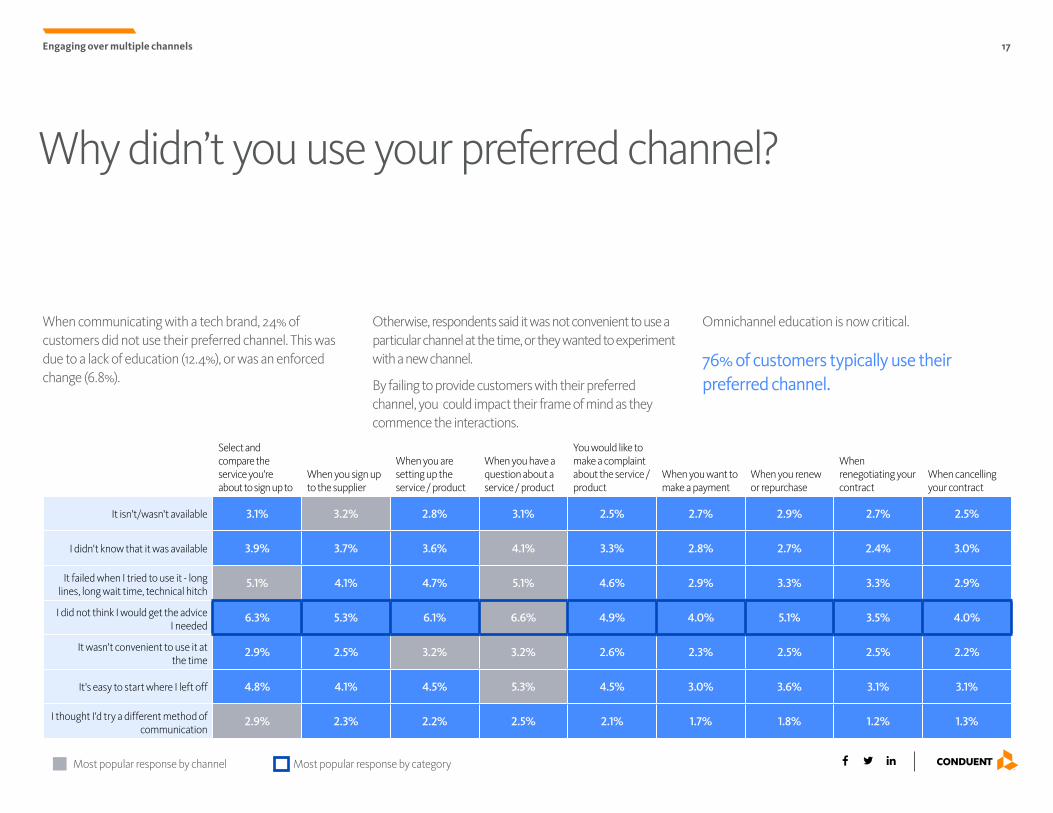
Otherwise, respondents said it was not convenient to use a particular channel at the time, or they wanted to experiment with a new channel.
By failing to provide customers with their preferred channel, you could impact their frame of mind as they commence the interactions.
When communicating with a tech brand, 24% of customers did not use their preferred channel. This was due to a lack of education (12.4%), or was an enforced change (6.8%).
Why didn’t you use your preferred channel?
Engaging over multiple channels
Omnichannel education is now critical.
76% of customers typically use their preferred channel.
Select and compare the service you're about to sign up to
When you sign up to the supplier
When you are setting up the service / product
When you have a question about a service / product
You would like to make a complaint about the service /product
When you want to make a payment
When you renew or repurchase
When renegotiating your contract
When cancelling your contract
It isn't/wasn't available 3.1% 3.2% 2.8% 3.1% 2.5% 2.7% 2.9% 2.7% 2.5%
I didn't know that it was available 3.9% 3.7% 3.6% 4.1% 3.3% 2.8% 2.7% 2.4% 3.0%
It failed when I tried to use it - long lines, long wait time, technical hitch
5.1% 4.1% 4.7% 5.1% 4.6% 2.9% 3.3% 3.3% 2.9%
I did not think I would get the advice I needed
6.3% 5.3% 6.1% 6.6% 4.9% 4.0% 5.1% 3.5% 4.0%
It wasn't convenient to use it at the time
2.9% 2.5% 3.2% 3.2% 2.6% 2.3% 2.5% 2.5% 2.2%
It's easy to start where I left off 4.8% 4.1% 4.5% 5.3% 4.5% 3.0% 3.6% 3.1% 3.1%
I thought I'd try a different method of communication
2.9% 2.3% 2.2% 2.5% 2.1% 1.7% 1.8% 1.2% 1.3%
Most popular response by channel Most popular response by category
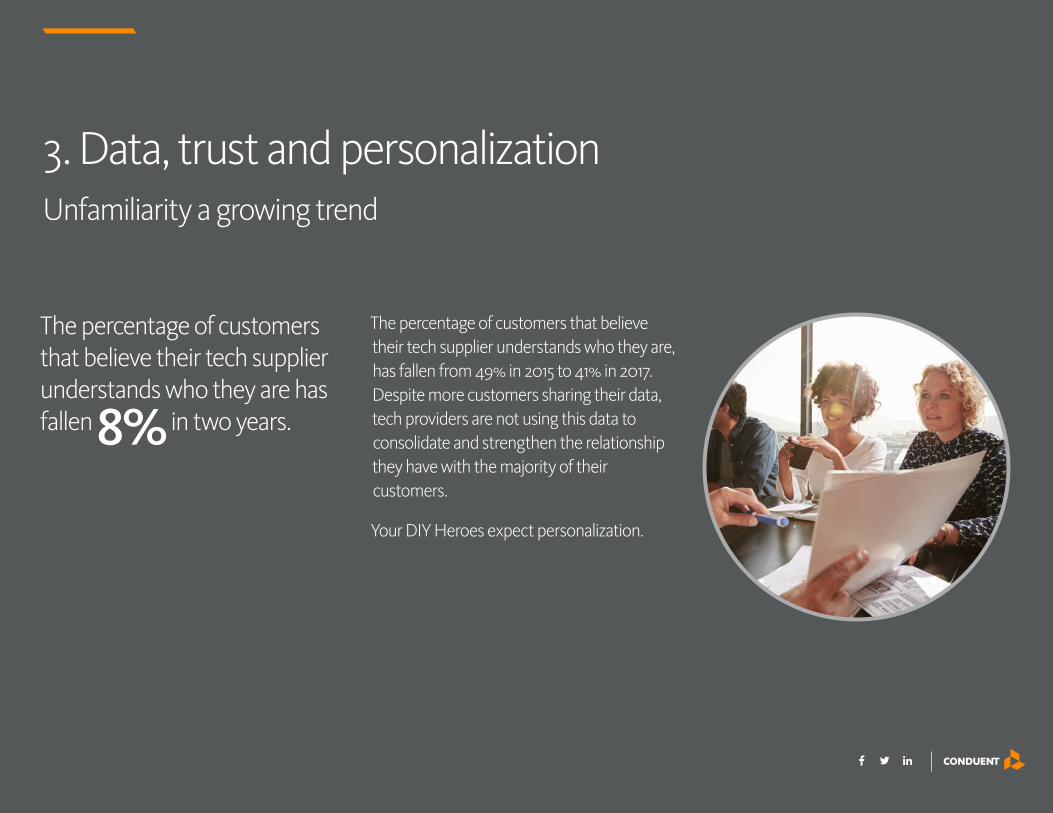
3. Data, trust and personalizationUnfamiliarity a growing trend
The percentage of customers that believe their tech supplier understands who they are, has fallen from 49% in 2015 to 41% in 2017. Despite more customers sharing their data, tech providers are not using this data to consolidate and strengthen the relationship they have with the majority of their customers.
Your DIY Heroes expect personalization.
The percentage of customers that believe their tech supplier understands who they are has fallen 8% in two years.
19
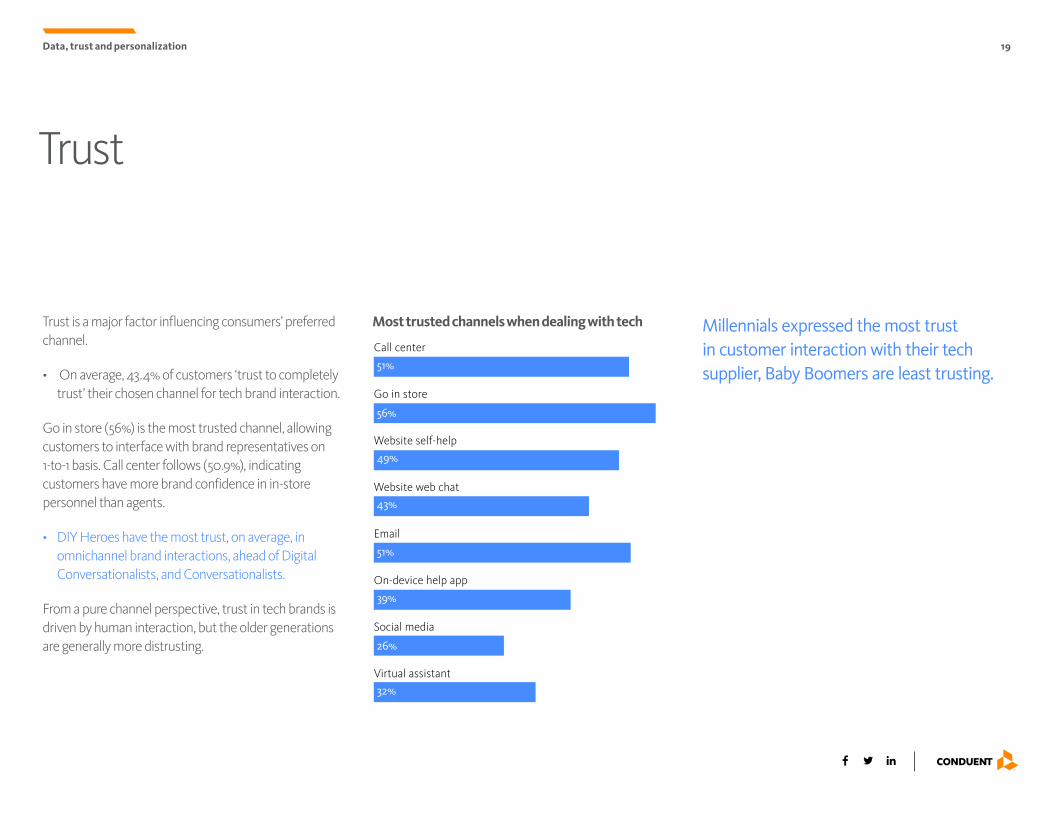
Trust is a major factor influencing consumers’ preferred channel.
• On average, 43.4% of customers ‘trust to completely trust’ their chosen channel for tech brand interaction.
Go in store (56%) is the most trusted channel, allowing customers to interface with brand representatives on 1-to-1 basis. Call center follows (50.9%), indicating customers have more brand confidence in in-store personnel than agents.
• DIY Heroes have the most trust, on average, in omnichannel brand interactions, ahead of Digital Conversationalists, and Conversationalists.
From a pure channel perspective, trust in tech brands is driven by human interaction, but the older generations are generally more distrusting.
Trust
Data, trust and personalization
Call center
Go in store
Website self-help
Website web chat
On-device help app
Social media
Virtual assistant 32%
26%
39%
51%
43%
49%
56%
51%
Millennials expressed the most trust in customer interaction with their tech supplier, Baby Boomers are least trusting.
Most trusted channels when dealing with tech
20
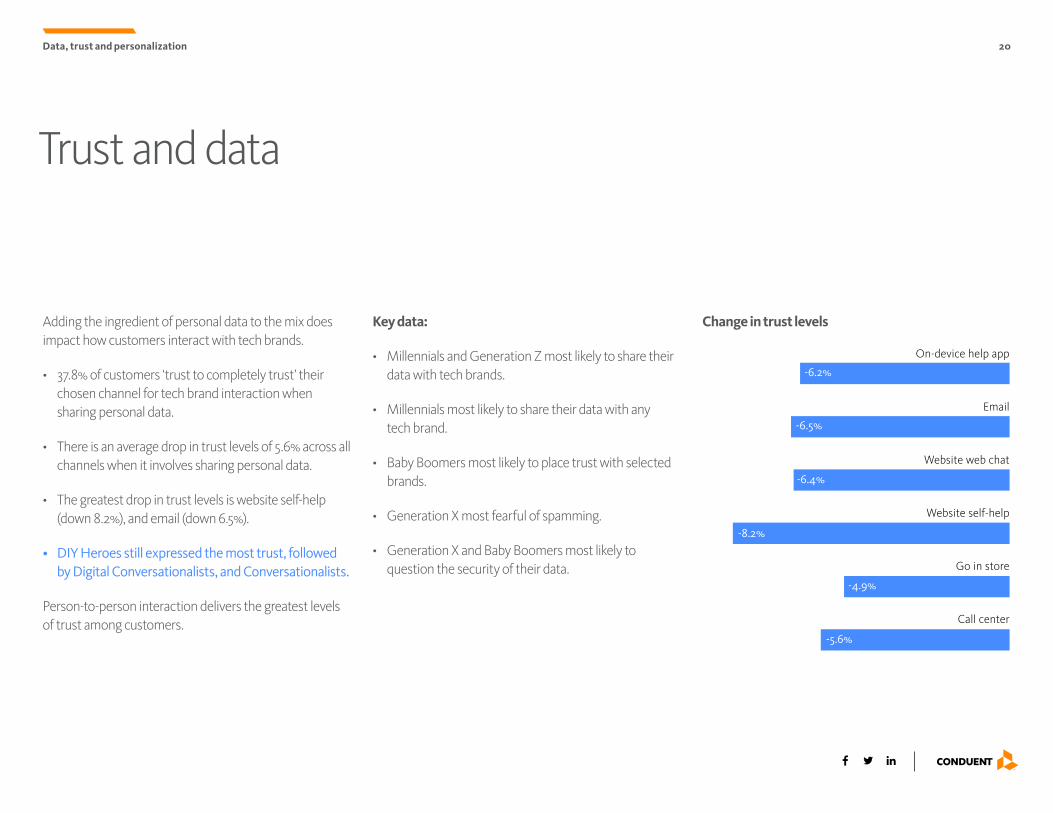
Key data:
• Millennials and Generation Z most likely to share their data with tech brands.
• Millennials most likely to share their data with any tech brand.
• Baby Boomers most likely to place trust with selected brands.
• Generation X most fearful of spamming.
• Generation X and Baby Boomers most likely to question the security of their data.
Trust and data
Data, trust and personalization
Adding the ingredient of personal data to the mix does impact how customers interact with tech brands.
• 37.8% of customers ‘trust to completely trust’ their chosen channel for tech brand interaction when sharing personal data.
• There is an average drop in trust levels of 5.6% across all channels when it involves sharing personal data.
• The greatest drop in trust levels is website self-help (down 8.2%), and email (down 6.5%).
• DIY Heroes still expressed the most trust, followed by Digital Conversationalists, and Conversationalists.
Person-to-person interaction delivers the greatest levels of trust among customers. Call center
Go in store
Website self-help
Website web chat
On-device help app
-6.2%
-6.5%
-6.4%
-8.2%
-4.9%
-5.6%
Change in trust levels
21
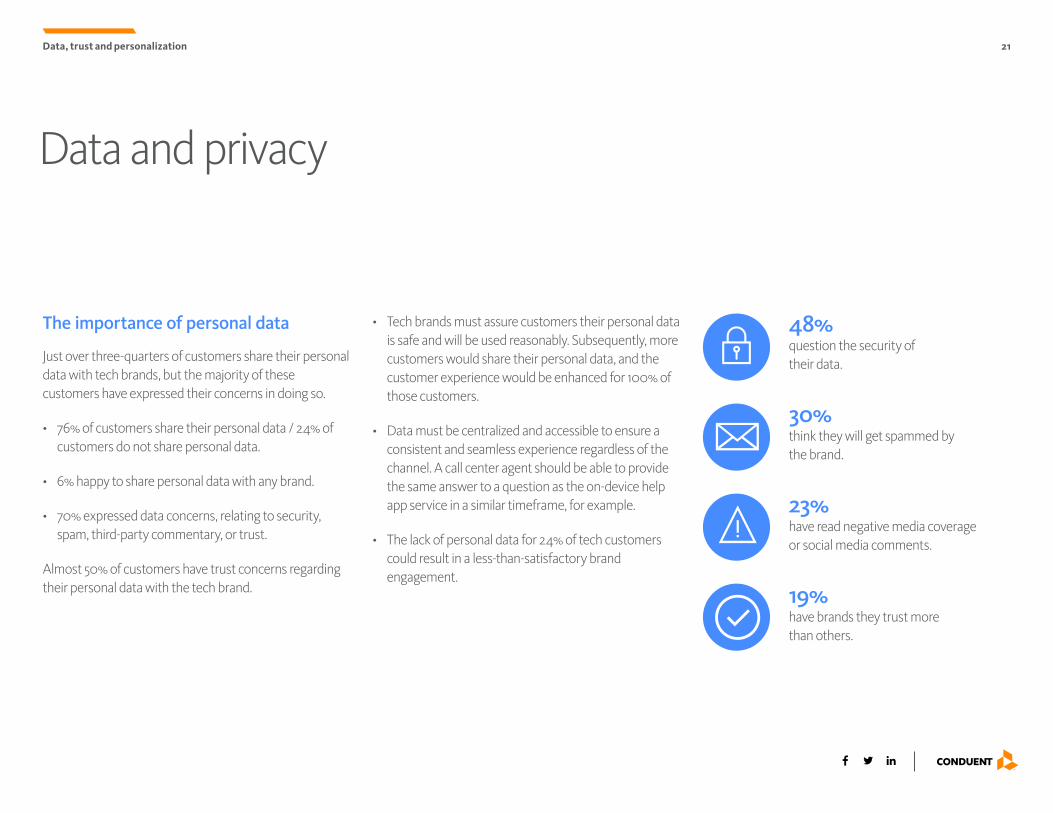
The importance of personal data
Just over three-quarters of customers share their personal data with tech brands, but the majority of these customers have expressed their concerns in doing so.
• 76% of customers share their personal data / 24% of customers do not share personal data.
• 6% happy to share personal data with any brand.
• 70% expressed data concerns, relating to security, spam, third-party commentary, or trust.
Almost 50% of customers have trust concerns regarding their personal data with the tech brand.
Data and privacy
Data, trust and personalization
• Tech brands must assure customers their personal data is safe and will be used reasonably. Subsequently, more customers would share their personal data, and the customer experience would be enhanced for 100% of those customers.
• Data must be centralized and accessible to ensure a consistent and seamless experience regardless of the channel. A call center agent should be able to provide the same answer to a question as the on-device help app service in a similar timeframe, for example.
• The lack of personal data for 24% of tech customers could result in a less-than-satisfactory brand engagement.
48% question the security of their data.
30% think they will get spammed by the brand.
23% have read negative media coverage or social media comments.
19% have brands they trust more than others.
22
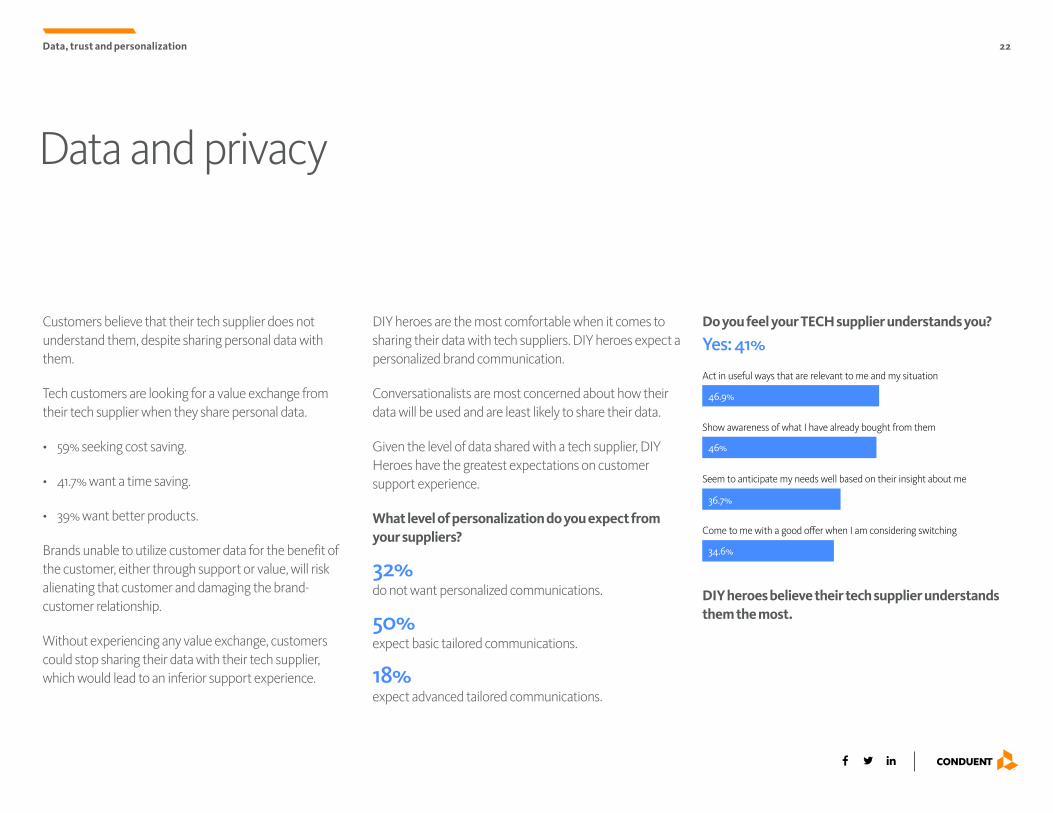
Customers believe that their tech supplier does not understand them, despite sharing personal data with them.
Tech customers are looking for a value exchange from their tech supplier when they share personal data.
• 59% seeking cost saving.
• 41.7% want a time saving.
• 39% want better products.
Brands unable to utilize customer data for the benefit of the customer, either through support or value, will risk alienating that customer and damaging the brand-customer relationship.
Without experiencing any value exchange, customers could stop sharing their data with their tech supplier, which would lead to an inferior support experience.
Data and privacy
Data, trust and personalization
DIY heroes are the most comfortable when it comes to sharing their data with tech suppliers. DIY heroes expect a personalized brand communication.
Conversationalists are most concerned about how their data will be used and are least likely to share their data.
Given the level of data shared with a tech supplier, DIY Heroes have the greatest expectations on customer support experience.
What level of personalization do you expect from your suppliers?
32% do not want personalized communications.
50% expect basic tailored communications.
18% expect advanced tailored communications.
Come to me with a good o�er when I am considering switching
Seem to anticipate my needs well based on their insight about me
Show awareness of what I have already bought from them
Act in useful ways that are relevant to me and my situation
46.9%
46%
36.7%
34.6%
Do you feel your TECH supplier understands you?
Yes: 41%
DIY heroes believe their tech supplier understands them the most.
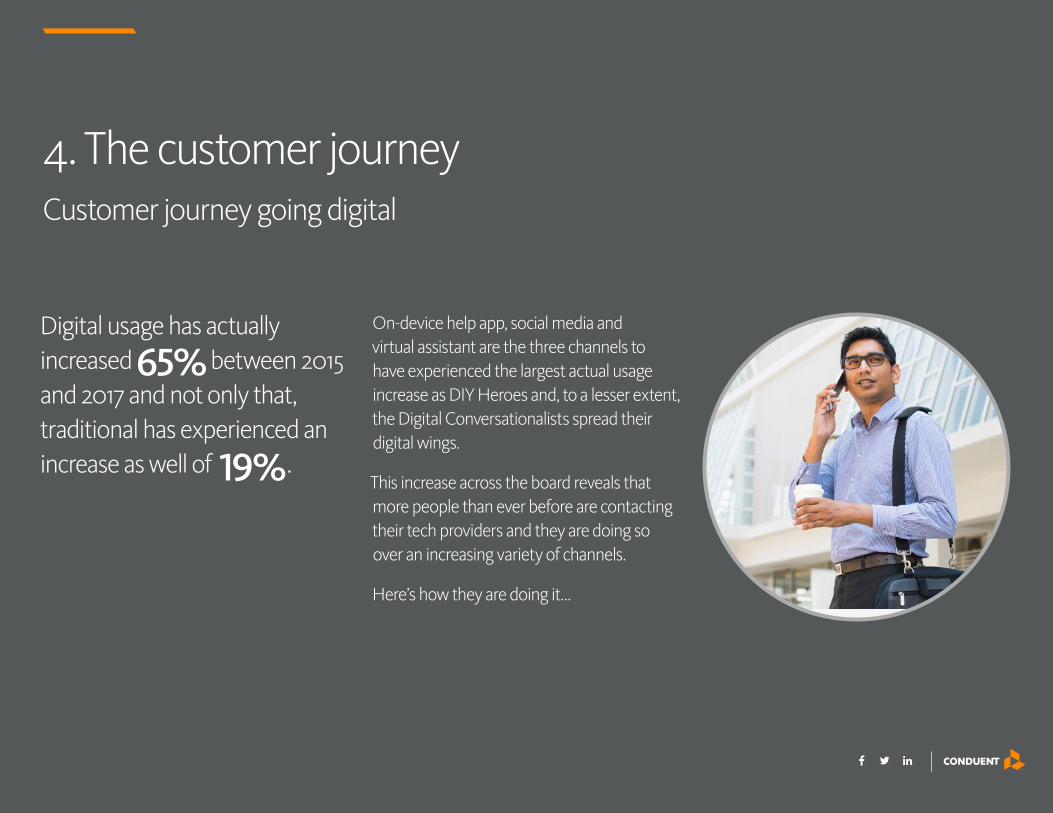
4. The customer journeyCustomer journey going digital
On-device help app, social media and virtual assistant are the three channels to have experienced the largest actual usage increase as DIY Heroes and, to a lesser extent, the Digital Conversationalists spread their digital wings.
This increase across the board reveals that more people than ever before are contacting their tech providers and they are doing so over an increasing variety of channels.
Here’s how they are doing it…
Digital usage has actually increased 65% between 2015 and 2017 and not only that, traditional has experienced an increase as well of 19%.
24
The DIY Heroes’ journey
Interaction meanders between human and self-help
The Digital Conversationalists’ journey
Interaction meanders between human and self-help
The Conversationalists’ journey
Human interaction dominant – involved in 4 steps
The customer journey
The customer journey
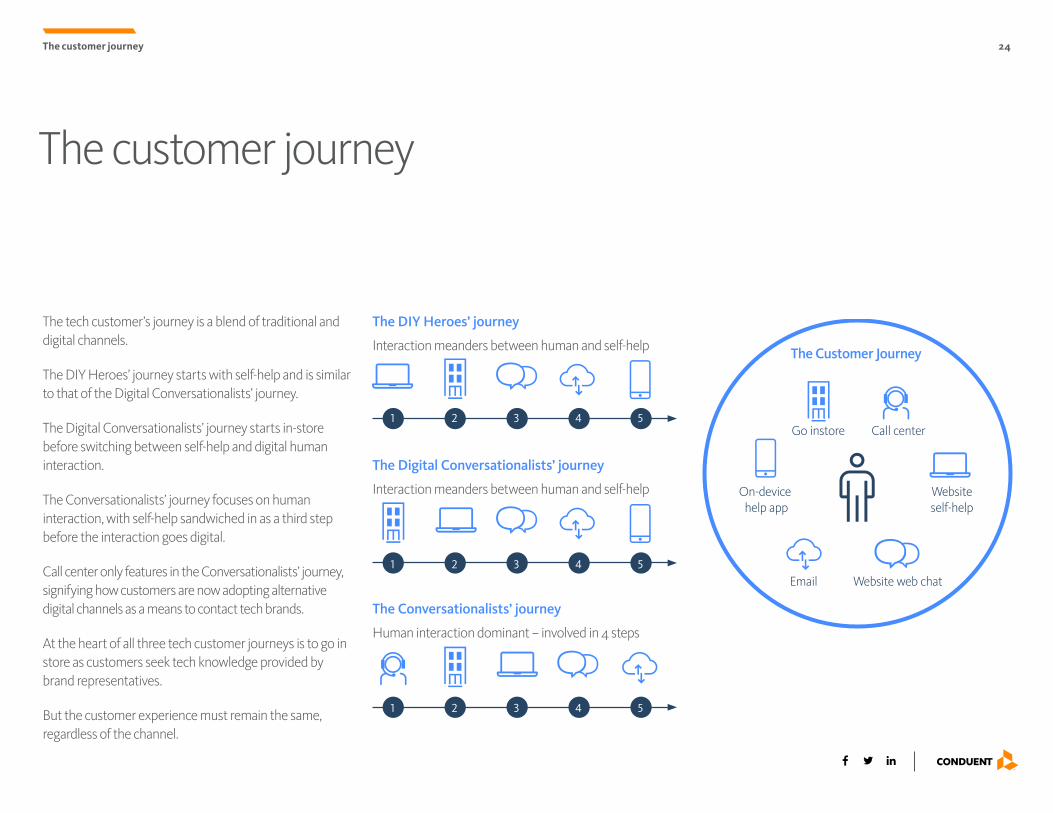
The tech customer’s journey is a blend of traditional and digital channels.
The DIY Heroes’ journey starts with self-help and is similar to that of the Digital Conversationalists’ journey.
The Digital Conversationalists’ journey starts in-store before switching between self-help and digital human interaction.
The Conversationalists’ journey focuses on human interaction, with self-help sandwiched in as a third step before the interaction goes digital.
Call center only features in the Conversationalists’ journey, signifying how customers are now adopting alternative digital channels as a means to contact tech brands.
At the heart of all three tech customer journeys is to go in store as customers seek tech knowledge provided by brand representatives.
But the customer experience must remain the same, regardless of the channel.
Go instore
The Customer Journey
Websiteself-help
Website web chatEmail
On-device help app
Call center1 2 3 4 5
1 2 3 4 5
1 2 3 4 5
25
Website self-help
• One-fifth of users will use website self-help as their first step when interacting with a tech brand.
• On average, one quarter of respondents are comfortable when using a brand’s website / 67.5% are indifferent / 6% have a negative experience.
• Users most comfortable navigating, comparing and making a purchase.
Website web chat
Website web chat is typically a website self-help fall-back channel following the customer’s failure to resolve the question using the website.
With the correct customer data available, web chat could become a mainstream customer experience channel for tech brands. Up to 46% of respondents would potentially use the channel if the experience was enhanced. If tech brands get their web chat model correct, two-thirds of their customers could be using it to communicate.
The rise of self-help
The customer journey
This opens the door automated web chat and the adoption of chatbots.
Typically, web chat and on-device help app viewed as a last resort channel for majority of customers. Potential of web chat would likely extend to on-device help app given prominence of apps.
54% of people have used self-help to successfully resolve an issue regarding tech.
Combined, 28.5% of users will use the brand’s website to self-help as the first step.
In total, 16.5% welcome web chat when on tech brand’s website.
9.5% of users will use website web chat as their first step when interacting with a tech brand.
Over half of respondents have successfully used self-help, yet only one-quarter stated that self-help was their preferred channel. Clearly, there is a split between those that had a good experience and those that did not. Tech brands need to develop their self-help offering to meet the growing percentage of customers looking to use those channels.
Customers feel that online solutions are insufficient when it comes to self-help to resolve an issue, or that an online solution did not exist.
Key website channel failings include:
• Online solution didn’t exist 29.3%
• Online solution was inadequate for my needs 30.7%
• FAQs too long 15.8%
• FAQs not specific 20.4%
• Forums were inadequate 9.1%
• Right tools were not available 13.2%
26
Self-help: Virtual assistants
The customer journey
Virtual assistants
More than two-thirds of customers communicating with their tech supplier have tried a virtual assistant, with just 7% enjoying the experience. Although a further 22% found it useful in-part.
Primarily, virtual assistants are called upon towards the end of the customer journey when frustration is boiling over with other channels and the need to achieve a resolution forces customers to experiment with alternative channels.
For those customers that use virtual assistants and are not driven there, it’s because of their convenience, speed of response and because they are always at hand. These three elements alone already make the virtual assistant an appealing channel for customer experience, but as part of a centralized omnichannel strategy, could become a central component for tech brands.
Almost 2/5 of respondents find virtual assistants useful, but only 2.7% will always turn to virtual assistants.
Convenience is the driving factor for using a virtual assistants, followed by speed of response.
DIY Heroes love tech and find virtual assistants fun to use.
DIY Heroes most likely to use virtual assistants.
Baby Boomers least likely to have used a virtual assistant.
27
Brands failing self-help customers
The customer journey
There is a need to provide more support to customers:
• Tech brands are failing 75% of their customers by not providing support to encourage successful self-help.
Online solutions inadequate for Conversationalists to effectively utilise self-help.
FAQs too long for DIY Heroes.
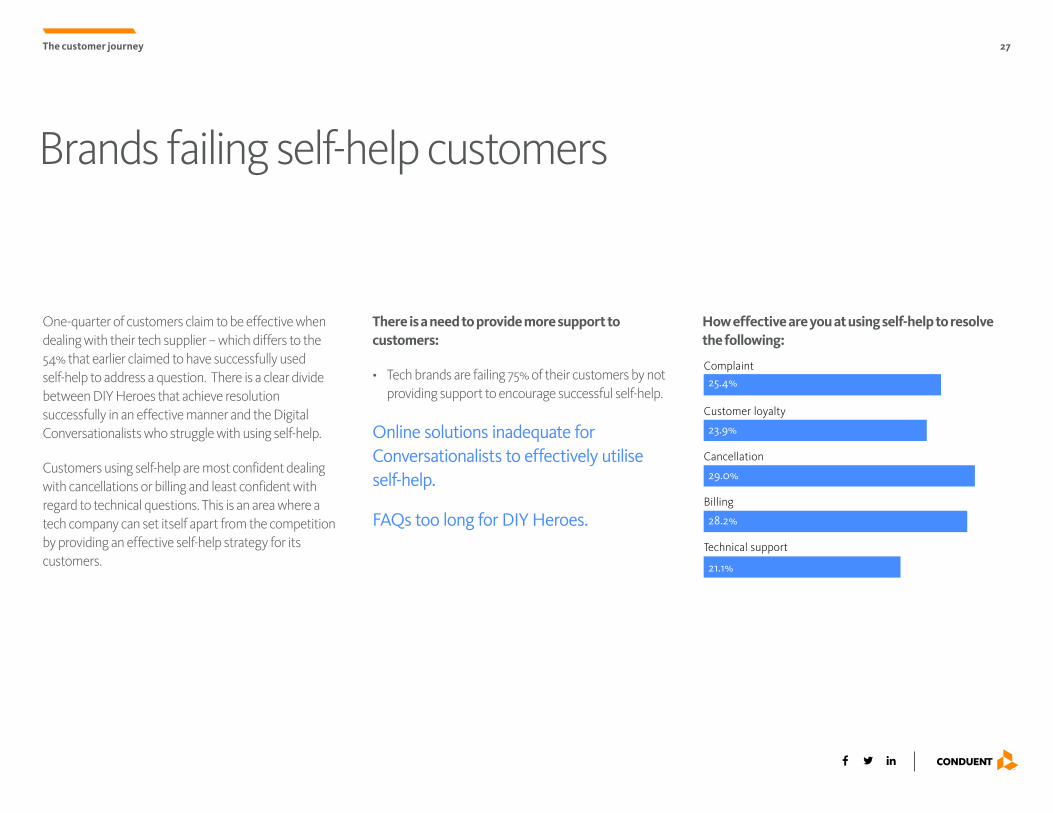
One-quarter of customers claim to be effective when dealing with their tech supplier – which differs to the 54% that earlier claimed to have successfully used self-help to address a question. There is a clear divide between DIY Heroes that achieve resolution successfully in an effective manner and the Digital Conversationalists who struggle with using self-help.
Customers using self-help are most confident dealing with cancellations or billing and least confident with regard to technical questions. This is an area where a tech company can set itself apart from the competition by providing an effective self-help strategy for its customers.
Technical support
Billing
Cancellation
Customer loyalty
Complaint 25.4%
23.9%
29.0%
28.2%
21.1%
How effective are you at using self-help to resolve the following:
28
Call center
The customer journey
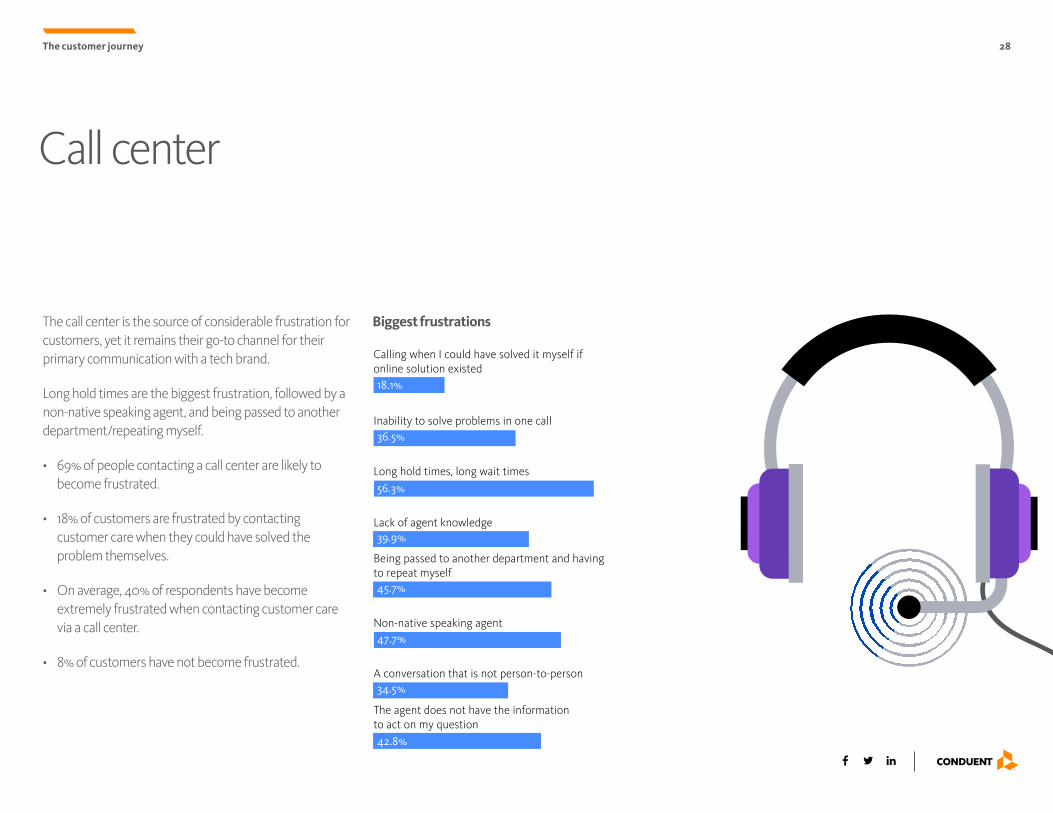
The call center is the source of considerable frustration for customers, yet it remains their go-to channel for their primary communication with a tech brand.
Long hold times are the biggest frustration, followed by a non-native speaking agent, and being passed to another department/repeating myself.
• 69% of people contacting a call center are likely to become frustrated.
• 18% of customers are frustrated by contacting customer care when they could have solved the problem themselves.
• On average, 40% of respondents have become extremely frustrated when contacting customer care via a call center.
• 8% of customers have not become frustrated.
Calling when I could have solved it myself if online solution existed
Inability to solve problems in one call
18.1%
36.5%
56.3%
39.9%
45.7%
47.7%
34.5%
42.8%
Long hold times, long wait times
Lack of agent knowledge
Being passed to another department and having to repeat myself
Non-native speaking agent
A conversation that is not person-to-person
The agent does not have the information to act on my question
Biggest frustrations
29
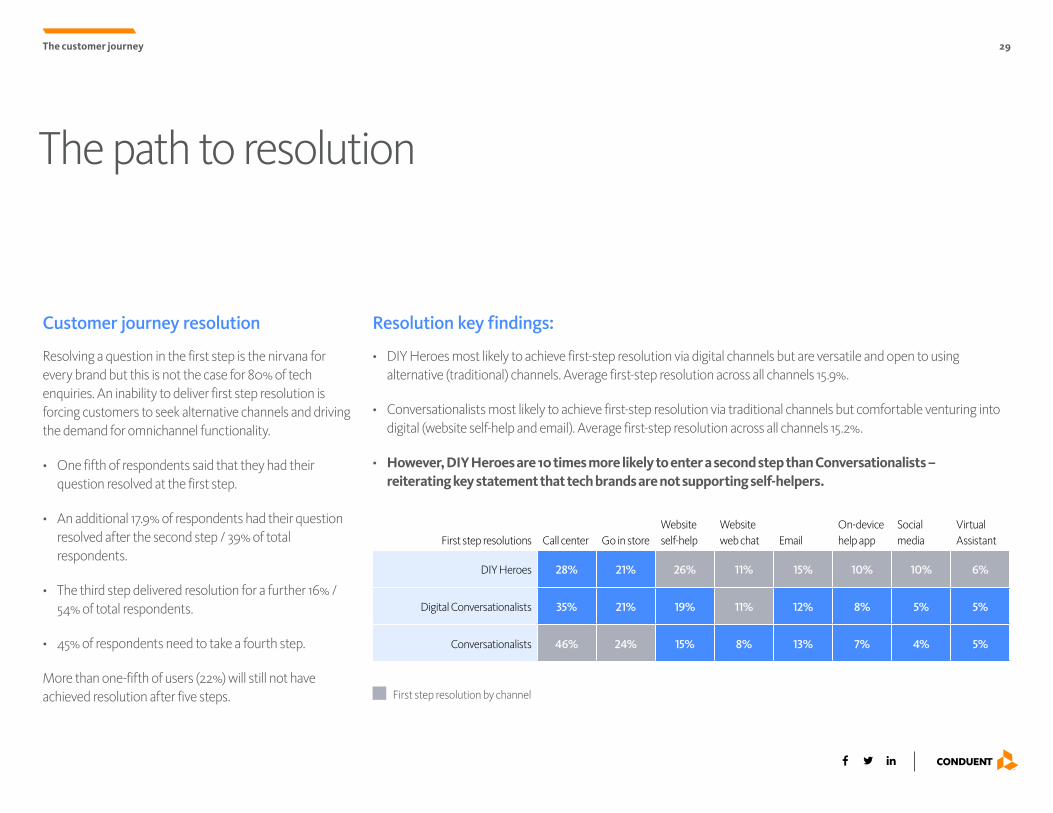
Customer journey resolution
Resolving a question in the first step is the nirvana for every brand but this is not the case for 80% of tech enquiries. An inability to deliver first step resolution is forcing customers to seek alternative channels and driving the demand for omnichannel functionality.
• One fifth of respondents said that they had their question resolved at the first step.
• An additional 17.9% of respondents had their question resolved after the second step / 39% of total respondents.
• The third step delivered resolution for a further 16% / 54% of total respondents.
• 45% of respondents need to take a fourth step.
More than one-fifth of users (22%) will still not have achieved resolution after five steps.
The path to resolution
The customer journey
Resolution key findings:
• DIY Heroes most likely to achieve first-step resolution via digital channels but are versatile and open to using alternative (traditional) channels. Average first-step resolution across all channels 15.9%.
• Conversationalists most likely to achieve first-step resolution via traditional channels but comfortable venturing into digital (website self-help and email). Average first-step resolution across all channels 15.2%.
• However, DIY Heroes are 10 times more likely to enter a second step than Conversationalists – reiterating key statement that tech brands are not supporting self-helpers.
First step resolutions Call center Go in storeWebsite self-help
Website web chat Email
On-device help app
Social media
Virtual Assistant
DIY Heroes 28% 21% 26% 11% 15% 10% 10% 6%
Digital Conversationalists 35% 21% 19% 11% 12% 8% 5% 5%
Conversationalists 46% 24% 15% 8% 13% 7% 4% 5%
First step resolution by channel
30
The risky second step
The customer journey
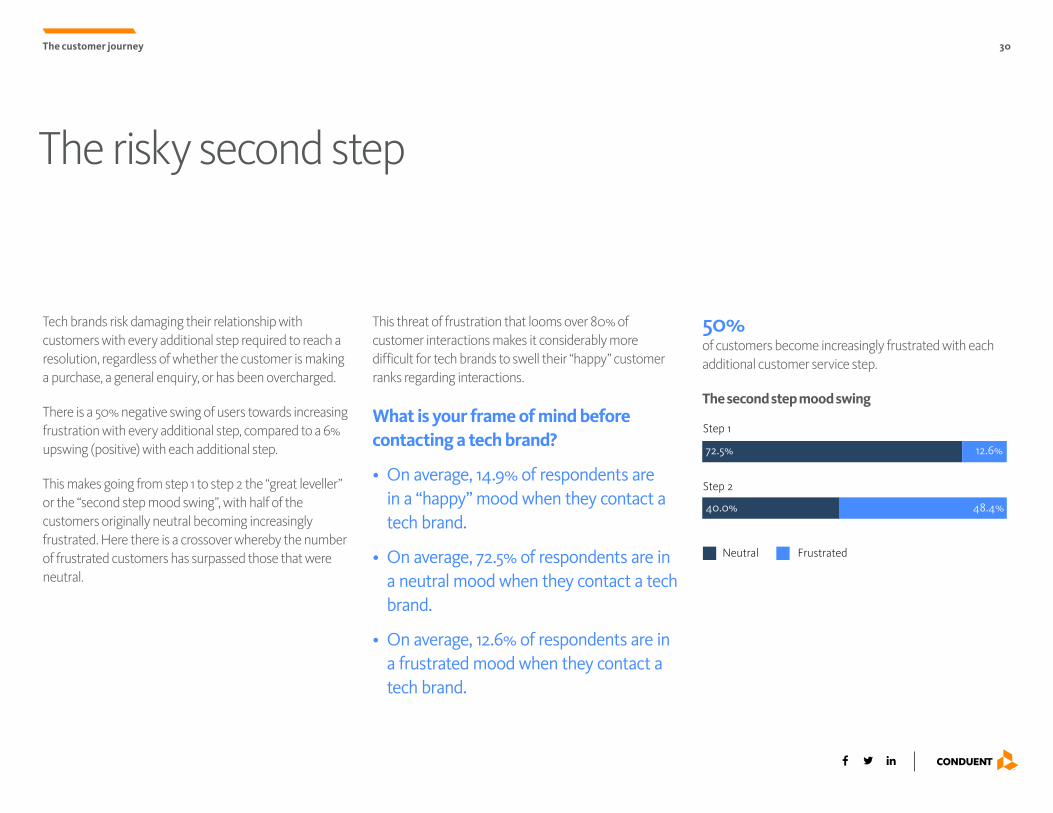
This threat of frustration that looms over 80% of customer interactions makes it considerably more difficult for tech brands to swell their “happy” customer ranks regarding interactions.
What is your frame of mind before contacting a tech brand?
• On average, 14.9% of respondents are in a “happy” mood when they contact a tech brand.
• On average, 72.5% of respondents are in a neutral mood when they contact a tech brand.
• On average, 12.6% of respondents are in a frustrated mood when they contact a tech brand.
Tech brands risk damaging their relationship with customers with every additional step required to reach a resolution, regardless of whether the customer is making a purchase, a general enquiry, or has been overcharged.
There is a 50% negative swing of users towards increasing frustration with every additional step, compared to a 6% upswing (positive) with each additional step.
This makes going from step 1 to step 2 the “great leveller” or the “second step mood swing”, with half of the customers originally neutral becoming increasingly frustrated. Here there is a crossover whereby the number of frustrated customers has surpassed those that were neutral.
50% of customers become increasingly frustrated with each additional customer service step.
The second step mood swing
40.0% 48.4%
72.5% 12.6%
Step 1
Step 2
Neutral Frustrated
31
The university of communication
The customer journey
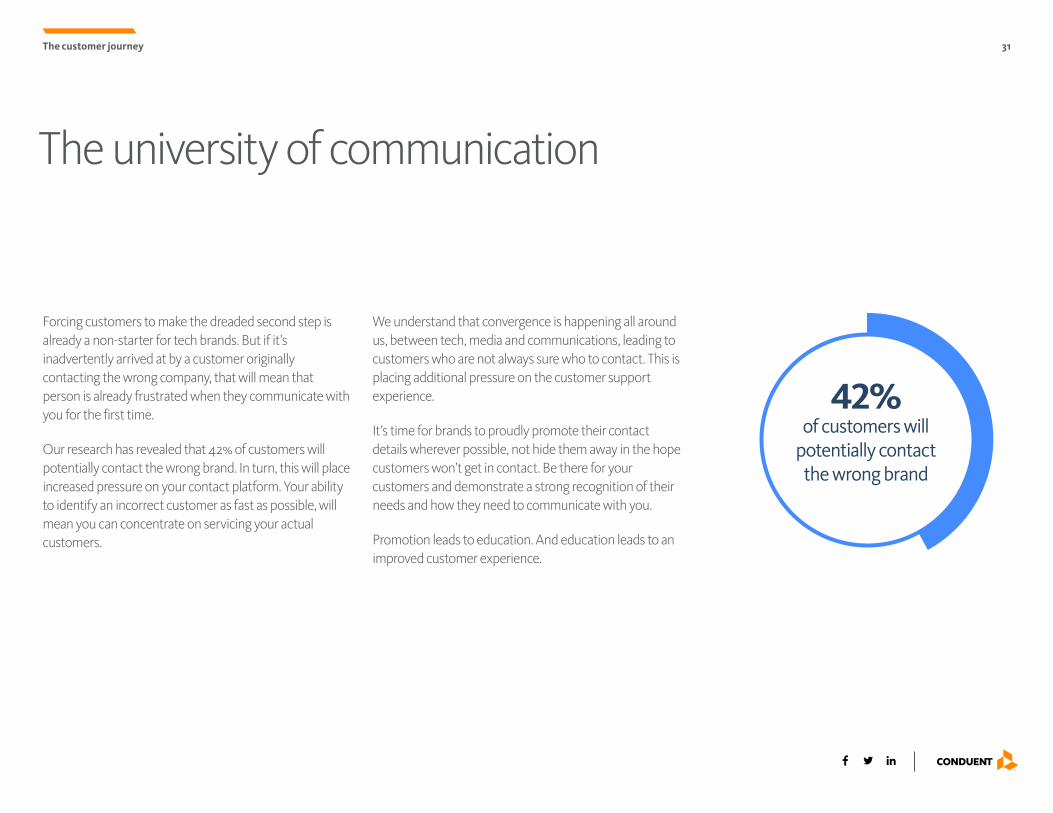
We understand that convergence is happening all around us, between tech, media and communications, leading to customers who are not always sure who to contact. This is placing additional pressure on the customer support experience.
It’s time for brands to proudly promote their contact details wherever possible, not hide them away in the hope customers won’t get in contact. Be there for your customers and demonstrate a strong recognition of their needs and how they need to communicate with you.
Promotion leads to education. And education leads to an improved customer experience.
Forcing customers to make the dreaded second step is already a non-starter for tech brands. But if it’s inadvertently arrived at by a customer originally contacting the wrong company, that will mean that person is already frustrated when they communicate with you for the first time.
Our research has revealed that 42% of customers will potentially contact the wrong brand. In turn, this will place increased pressure on your contact platform. Your ability to identify an incorrect customer as fast as possible, will mean you can concentrate on servicing your actual customers.
42% of customers will
potentially contact the wrong brand
32
Mood
The customer journey
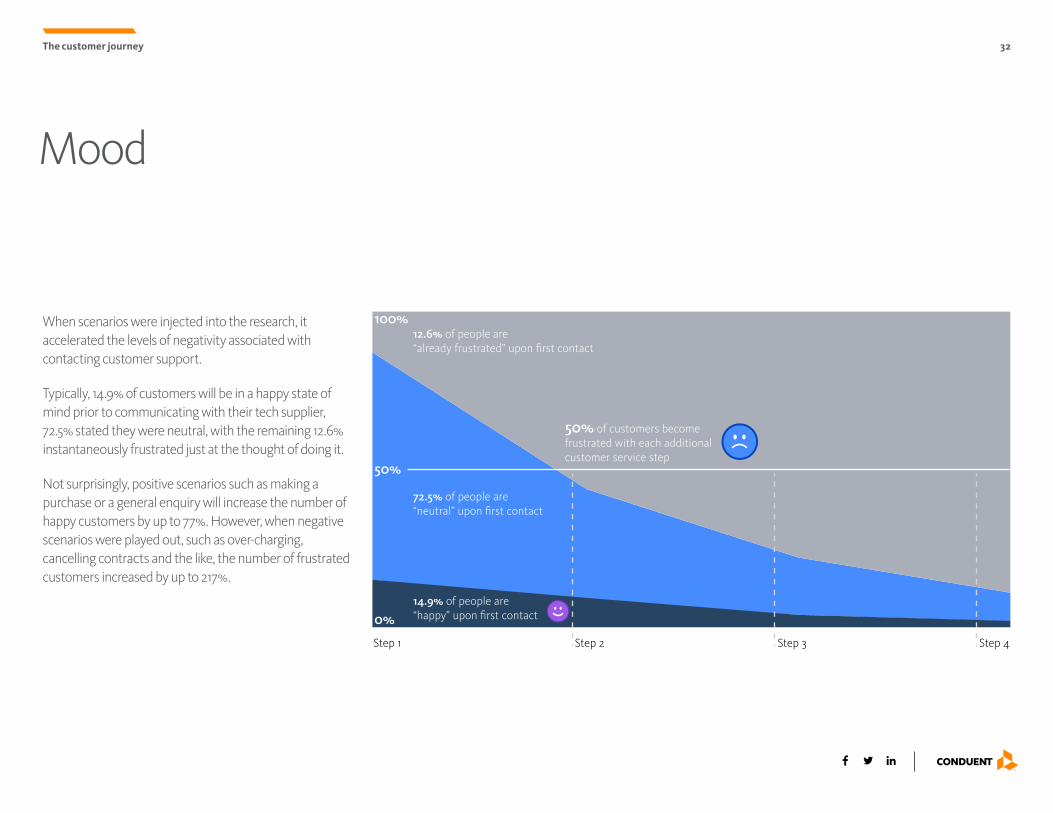
When scenarios were injected into the research, it accelerated the levels of negativity associated with contacting customer support.
Typically, 14.9% of customers will be in a happy state of mind prior to communicating with their tech supplier, 72.5% stated they were neutral, with the remaining 12.6% instantaneously frustrated just at the thought of doing it.
Not surprisingly, positive scenarios such as making a purchase or a general enquiry will increase the number of happy customers by up to 77%. However, when negative scenarios were played out, such as over-charging, cancelling contracts and the like, the number of frustrated customers increased by up to 217%.
50%
100%
72.5% of people are “neutral” upon �rst contact
12.6% of people are “already frustrated” upon �rst contact
50% of customers become frustrated with each additional customer service step
0% 14.9% of people are “happy” upon �rst contact
Step 1 Step 2 Step 3 Step 4
33
Leave them wanting more
The customer journey
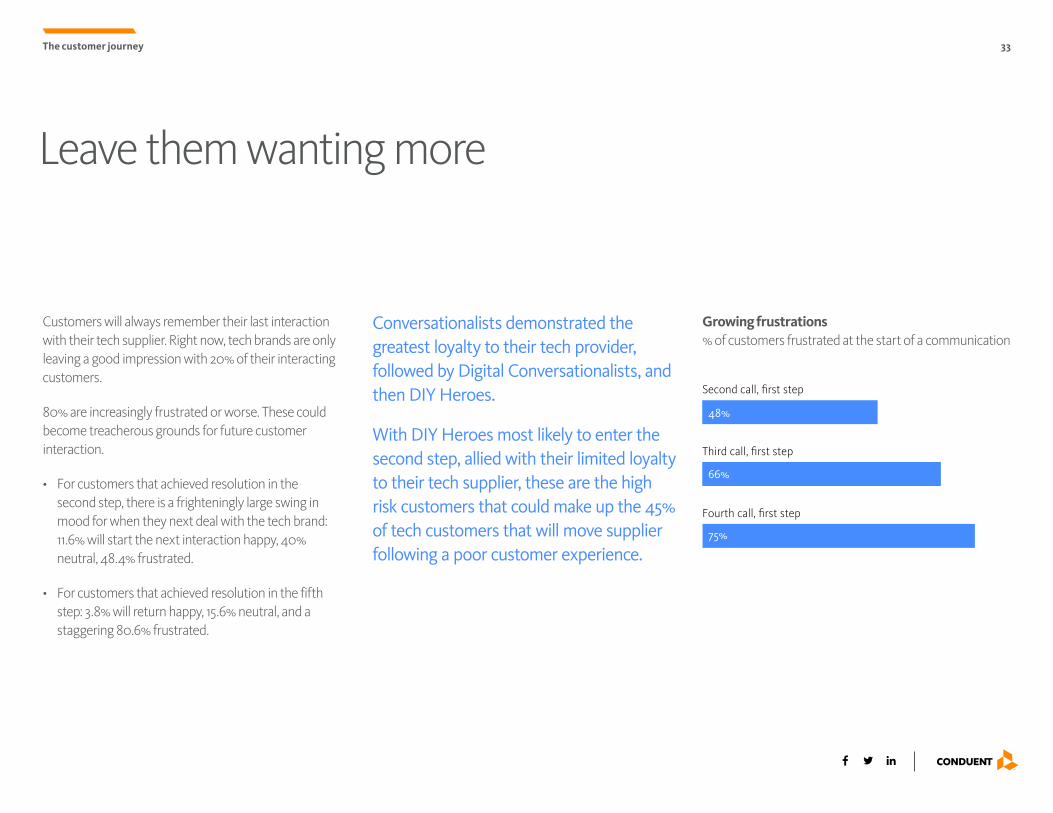
Conversationalists demonstrated the greatest loyalty to their tech provider, followed by Digital Conversationalists, and then DIY Heroes.
With DIY Heroes most likely to enter the second step, allied with their limited loyalty to their tech supplier, these are the high risk customers that could make up the 45% of tech customers that will move supplier following a poor customer experience.
Customers will always remember their last interaction with their tech supplier. Right now, tech brands are only leaving a good impression with 20% of their interacting customers.
80% are increasingly frustrated or worse. These could become treacherous grounds for future customer interaction.
• For customers that achieved resolution in the second step, there is a frighteningly large swing in mood for when they next deal with the tech brand: 11.6% will start the next interaction happy, 40% neutral, 48.4% frustrated.
• For customers that achieved resolution in the fifth step: 3.8% will return happy, 15.6% neutral, and a staggering 80.6% frustrated.
Growing frustrations% of customers frustrated at the start of a communication
Second call, �rst step
75%
66%
48%
Third call, �rst step
Fourth call, �rst step
5. Driving effective engagementSatisfaction on the wane
The increase in interaction between a tech supplier and customer is coming at a price.
Between 2015 and 2017, customer satisfaction based on the outcome of the interaction, has dropped by an average of 10%.
Brands are either struggling to cope with the increased demand or have yet to optimize their customer support platform or apply analytics, insight, and automation to deliver an exceptional customer experience.
While the drop has affected every channel, traditional has fared the worst, dropping 13%, compared to digital’s 9% drop.
35
Recommended channels
Driving effective engagement
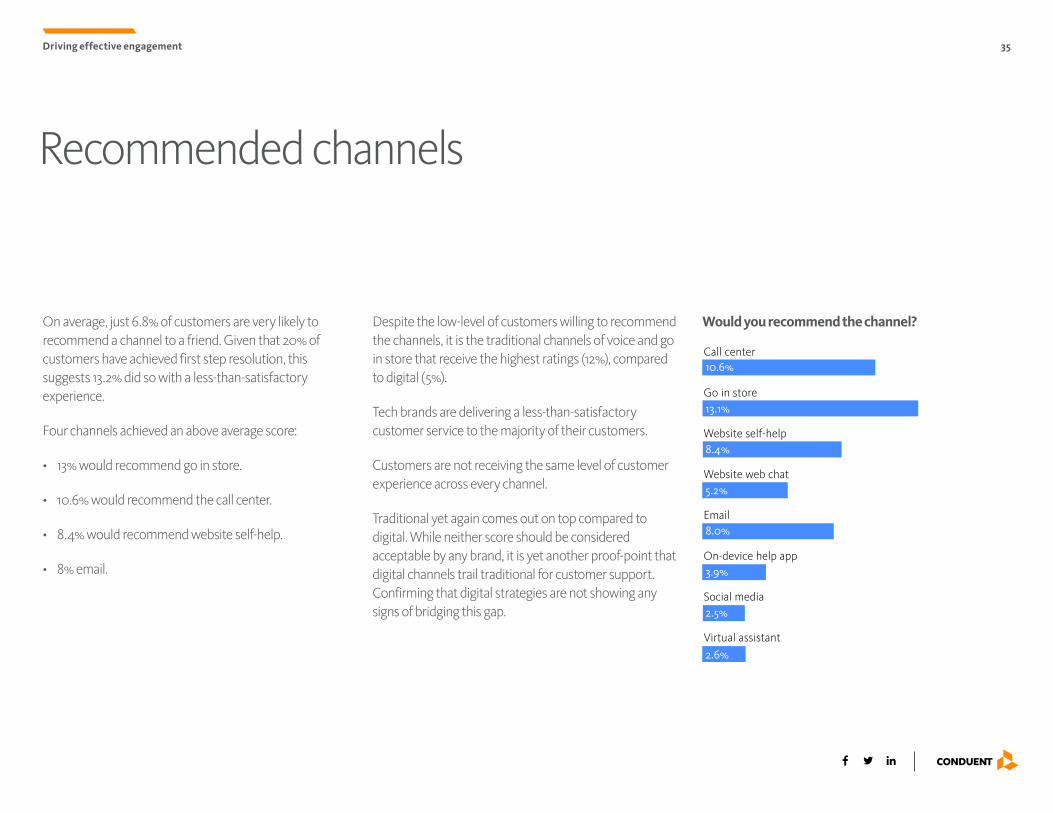
Despite the low-level of customers willing to recommend the channels, it is the traditional channels of voice and go in store that receive the highest ratings (12%), compared to digital (5%).
Tech brands are delivering a less-than-satisfactory customer service to the majority of their customers.
Customers are not receiving the same level of customer experience across every channel.
Traditional yet again comes out on top compared to digital. While neither score should be considered acceptable by any brand, it is yet another proof-point that digital channels trail traditional for customer support. Confirming that digital strategies are not showing any signs of bridging this gap.
On average, just 6.8% of customers are very likely to recommend a channel to a friend. Given that 20% of customers have achieved first step resolution, this suggests 13.2% did so with a less-than-satisfactory experience.
Four channels achieved an above average score:
• 13% would recommend go in store.
• 10.6% would recommend the call center.
• 8.4% would recommend website self-help.
• 8% email.
Would you recommend the channel?
Call center 10.6%
13.1%
8.4%
5.2%
8.0%
3.9%
2.5%
2.6%
Go in store
Website self-help
Website web chat
On-device help app
Social media
Virtual assistant
36
Gone in 600 seconds
Driving effective engagement
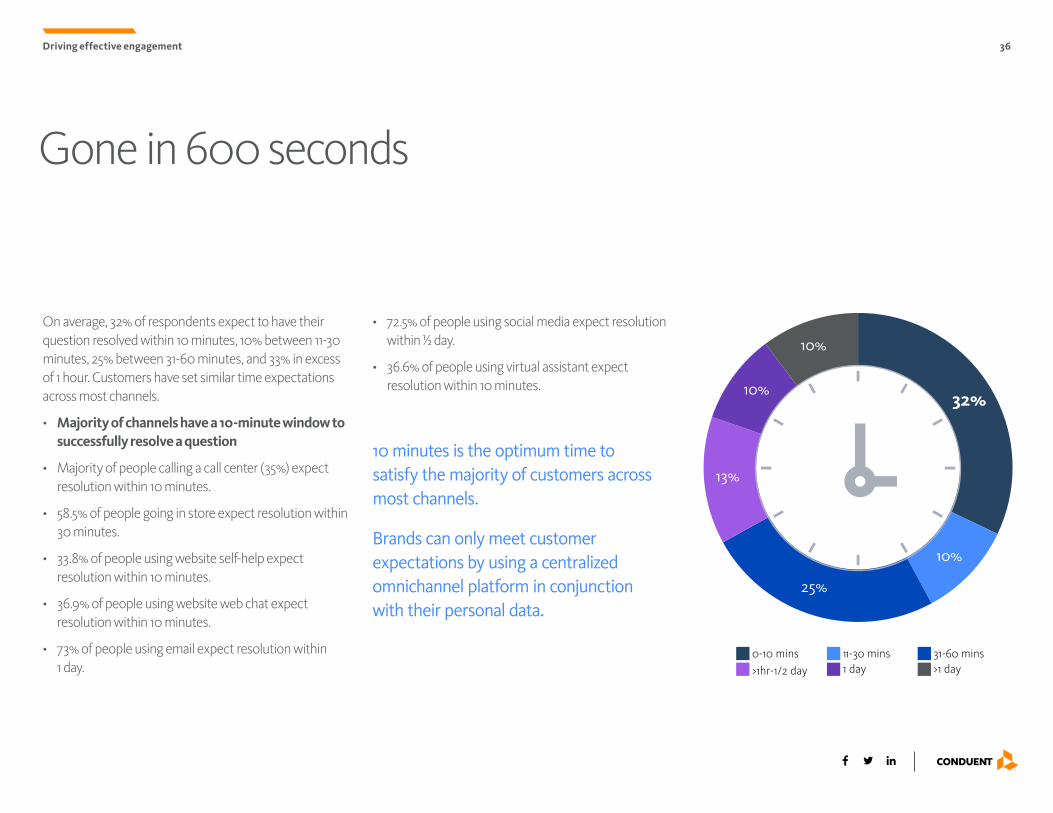
On average, 32% of respondents expect to have their question resolved within 10 minutes, 10% between 11-30 minutes, 25% between 31-60 minutes, and 33% in excess of 1 hour. Customers have set similar time expectations across most channels.
• Majority of channels have a 10-minute window to successfully resolve a question
• Majority of people calling a call center (35%) expect resolution within 10 minutes.
• 58.5% of people going in store expect resolution within 30 minutes.
• 33.8% of people using website self-help expect resolution within 10 minutes.
• 36.9% of people using website web chat expect resolution within 10 minutes.
• 73% of people using email expect resolution within 1 day.
• 72.5% of people using social media expect resolution within ½ day.
• 36.6% of people using virtual assistant expect resolution within 10 minutes.
10 minutes is the optimum time to satisfy the majority of customers across most channels.
Brands can only meet customer expectations by using a centralized omnichannel platform in conjunction with their personal data.
0-10 mins 11-30 mins 31-60 mins >1hr-1/2 day 1 day >1 day
32%
10%
25%
13%
10%
10%
37
I can’t get no satisfaction
Driving effective engagement
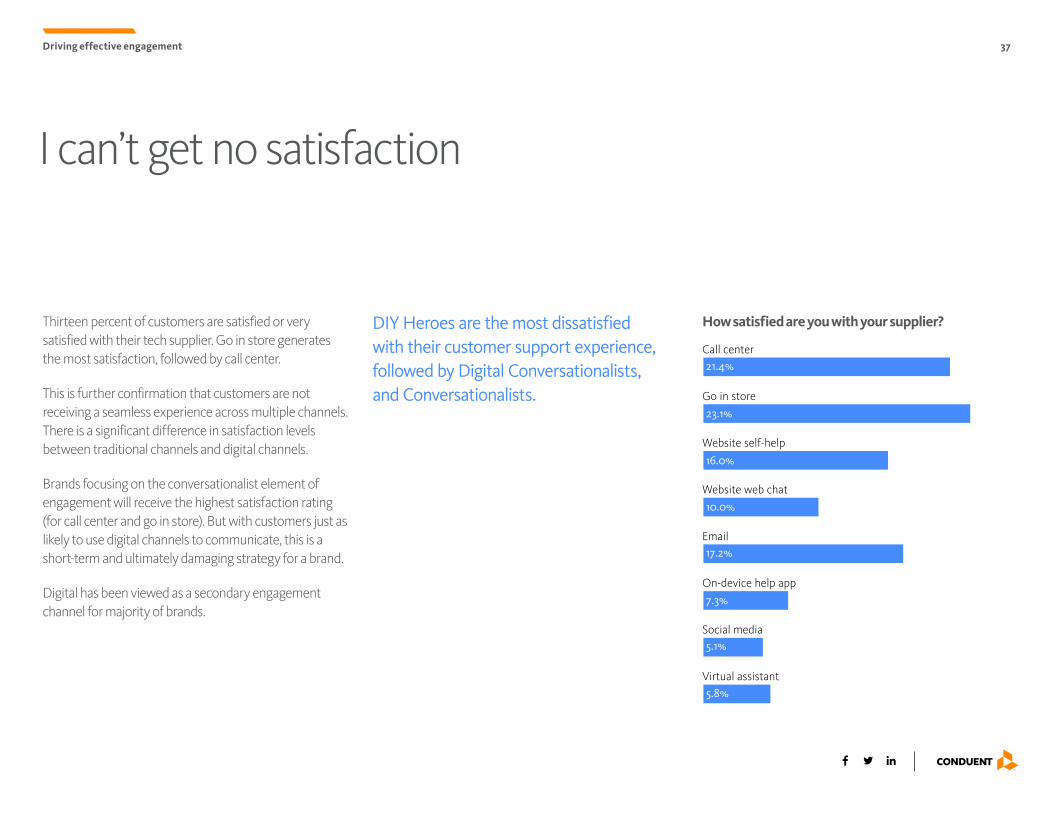
Thirteen percent of customers are satisfied or very satisfied with their tech supplier. Go in store generates the most satisfaction, followed by call center.
This is further confirmation that customers are not receiving a seamless experience across multiple channels. There is a significant difference in satisfaction levels between traditional channels and digital channels.
Brands focusing on the conversationalist element of engagement will receive the highest satisfaction rating (for call center and go in store). But with customers just as likely to use digital channels to communicate, this is a short-term and ultimately damaging strategy for a brand.
Digital has been viewed as a secondary engagement channel for majority of brands.
DIY Heroes are the most dissatisfied with their customer support experience, followed by Digital Conversationalists, and Conversationalists.
How satisfied are you with your supplier?
Call center 21.4%
23.1%
16.0%
17.2%
7.3%
5.1%
5.8%
10.0%
Go in store
Website self-help
Website web chat
On-device help app
Social media
Virtual assistant
38
I can’t get no digital satisfaction
Driving effective engagement
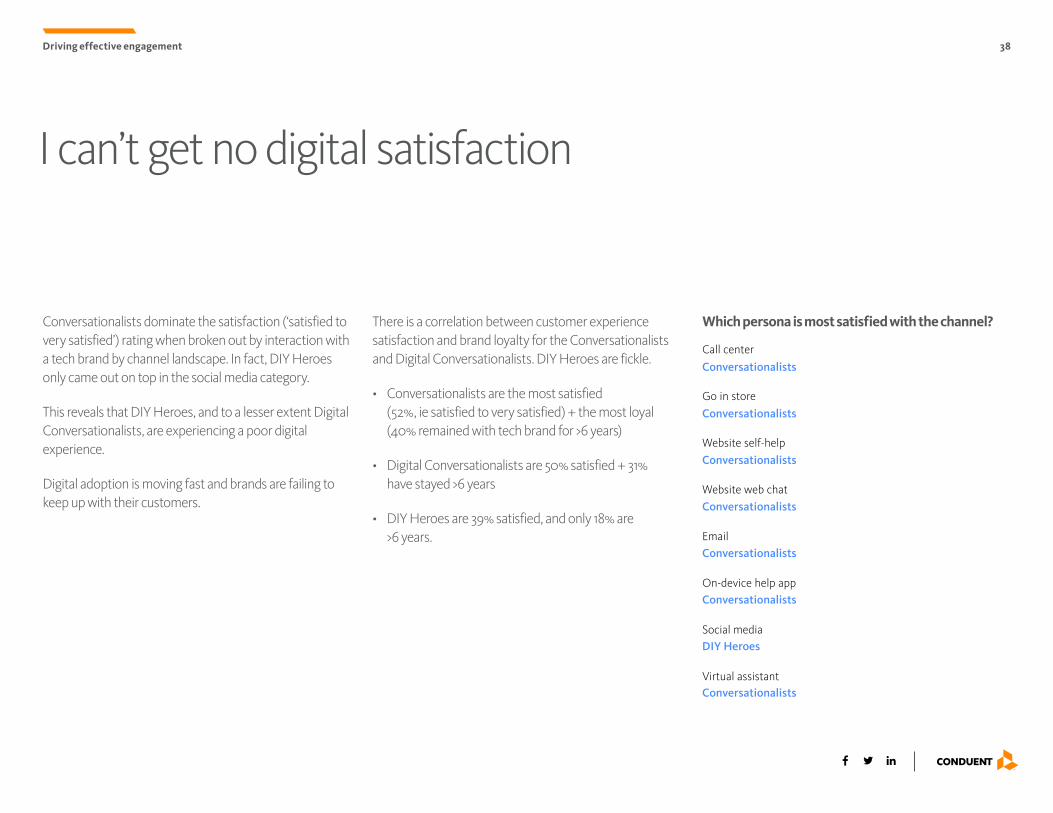
Conversationalists dominate the satisfaction (‘satisfied to very satisfied’) rating when broken out by interaction with a tech brand by channel landscape. In fact, DIY Heroes only came out on top in the social media category.
This reveals that DIY Heroes, and to a lesser extent Digital Conversationalists, are experiencing a poor digital experience.
Digital adoption is moving fast and brands are failing to keep up with their customers.
There is a correlation between customer experience satisfaction and brand loyalty for the Conversationalists and Digital Conversationalists. DIY Heroes are fickle.
• Conversationalists are the most satisfied (52%, ie satisfied to very satisfied) + the most loyal (40% remained with tech brand for >6 years)
• Digital Conversationalists are 50% satisfied + 31% have stayed >6 years
• DIY Heroes are 39% satisfied, and only 18% are >6 years.
Call center
Go in store
Website self-help
Website web chat
On-device help app
Social media
Virtual assistant
Conversationalists
Conversationalists
Conversationalists
Conversationalists
Conversationalists
Conversationalists
DIY Heroes
Conversationalists
Which persona is most satisfied with the channel?
Omnichannel wannabes
Driving effective engagement
The majority of Tech brands continue to offer disjointed, fragmented and siloed, omnichannel-esque customer support. Digital remains secondary.
Digital experience excellence must be a priority.
40
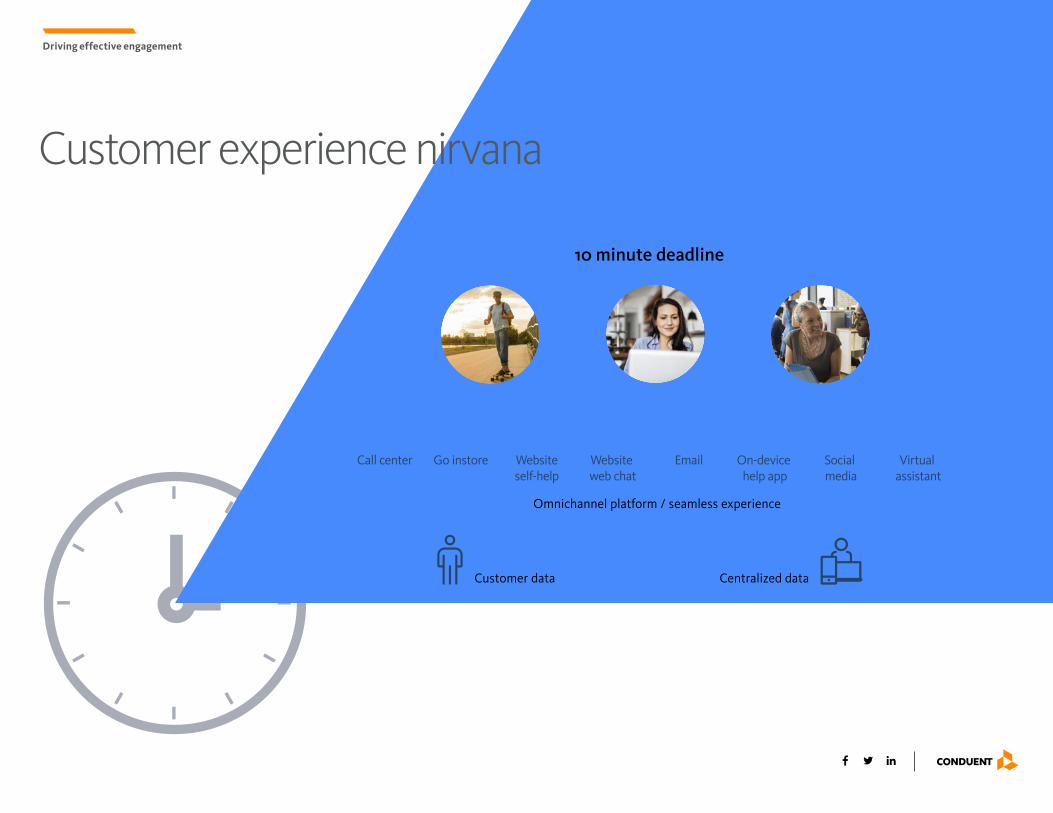
10 minute deadline
Omnichannel platform / seamless experience
Customer data Centralized data
Go instore Websiteself-help
Website web chat
Email On-device help app
Social media
Virtual assistant
Call center
Customer experience nirvana
Driving effective engagement
41
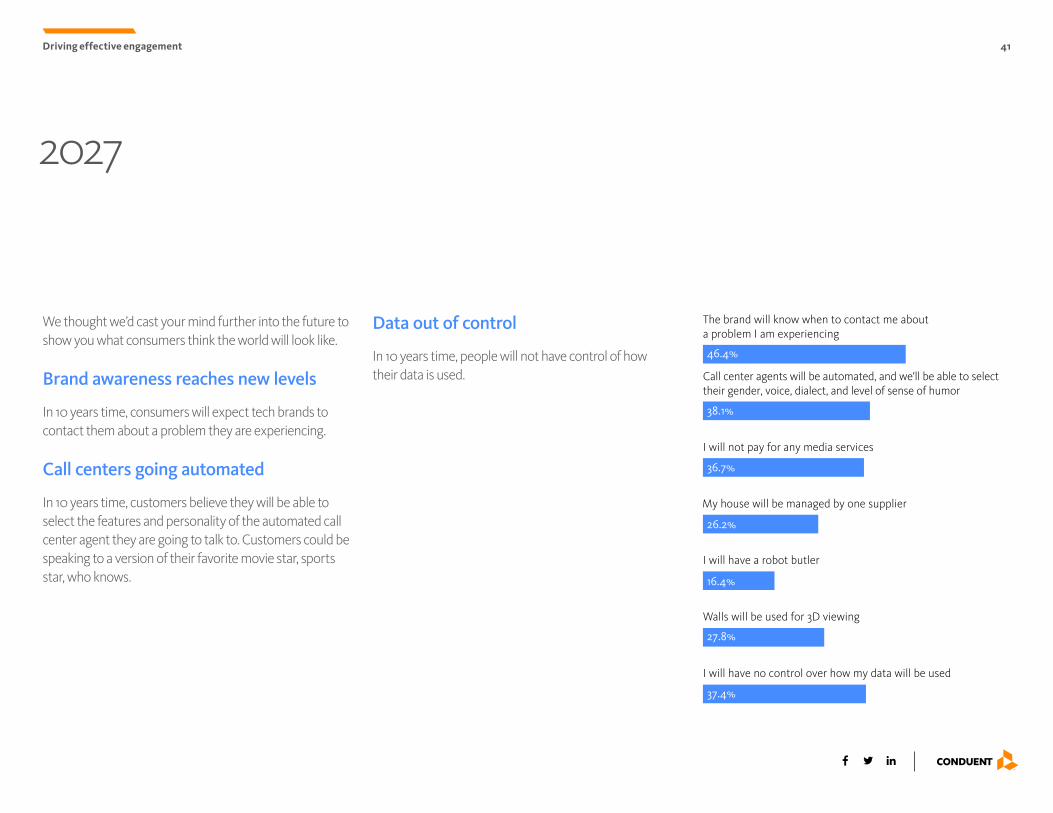
2027
Driving effective engagement
Data out of control
In 10 years time, people will not have control of how their data is used.
We thought we’d cast your mind further into the future to show you what consumers think the world will look like.
Brand awareness reaches new levels
In 10 years time, consumers will expect tech brands to contact them about a problem they are experiencing.
Call centers going automated
In 10 years time, customers believe they will be able to select the features and personality of the automated call center agent they are going to talk to. Customers could be speaking to a version of their favorite movie star, sports star, who knows.
The brand will know when to contact me about a problem I am experiencing
46.4%
38.1%
36.7%
26.2%
16.4%
27.8%
37.4%
Call center agents will be automated, and we'll be able to select their gender, voice, dialect, and level of sense of humor
I will not pay for any media services
My house will be managed by one supplier
I will have a robot butler
Walls will be used for 3D viewing
I will have no control over how my data will be used
About Conduent
Conduent is the world’s largest provider of diversified business process services with leading capabilities in transaction processing, automation, analytics and constituent experience.
We work with both government and commercial customers in assisting them to deliver quality services to the people they serve.
We manage interactions with patients and the insured for a significant portion of the U.S. healthcare industry. We’re the customer interface for large segments of the technology industry. And, we’re the operational and processing partner of choice for public transportation systems around the world.
Whether it’s digital payments, claims processing, benefit administration, automated tolling, customer care or distributed learning – Conduent manages and modernizes these interactions to create value for both our clients and their constituents.
Learn more at www.conduent.com.
© 2017 Conduent, Inc. All rights reserved. Conduent and Conduent Agile Star are trademarks of Conduent, Inc. and/or its subsidiaries in the United States and/or other countries. BR1611
Recommended