The Role of Renewables in Your The Role of Renewables in Your Future Resource PortfolioFuture Resource Portfolio
APPA National ConferenceAPPA National ConferenceJune 12, 2006June 12, 2006
Colorado Springs Utilities’ ApproachColorado Springs Utilities’ ApproachDiane Johnson
General Manager, Strategic PlanningColorado Springs Utilities
Presentation OverviewPresentation Overview
Colorado Springs Utilities Profile
Framework for a Renewable Energy Strategy Community Drivers – Customer surveys Industry Drivers – EIRP & WAPA requirements Regulatory Drivers – RPS - Amendment 37 Challenges & Potential Opportunities
Customer-side renewables programs Customer-side renewable energy plan Net metering PV rebate program Green product program
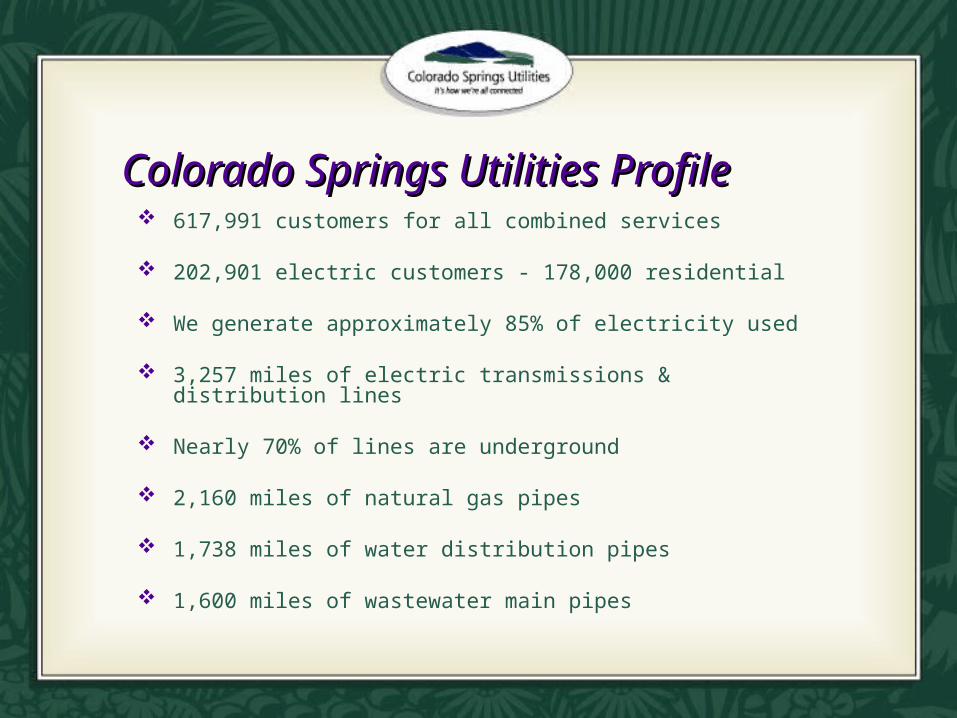
Colorado Springs Utilities ProfileColorado Springs Utilities Profile 617,991 customers for all combined services
202,901 electric customers - 178,000 residential
We generate approximately 85% of electricity used
3,257 miles of electric transmissions & distribution lines
Nearly 70% of lines are underground
2,160 miles of natural gas pipes
1,738 miles of water distribution pipes
1,600 miles of wastewater main pipes
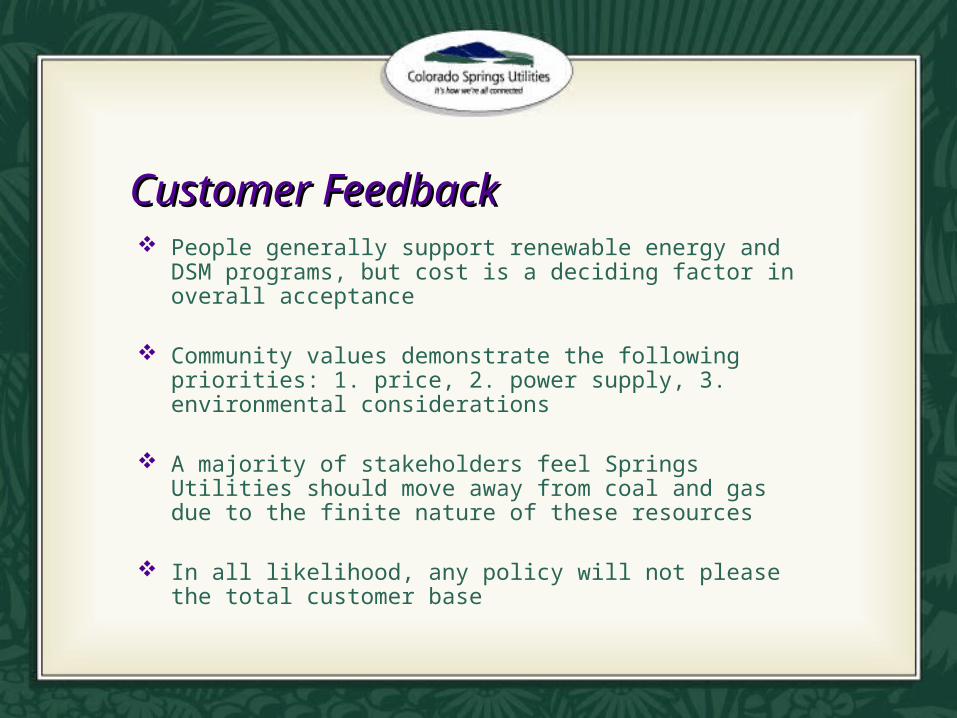
Customer FeedbackCustomer Feedback People generally support renewable energy and DSM
programs, but cost is a deciding factor in overall acceptance
Community values demonstrate the following priorities: 1. price, 2. power supply, 3. environmental considerations
A majority of stakeholders feel Springs Utilities should move away from coal and gas due to the finite nature of these resources
In all likelihood, any policy will not please the total customer base
Willingness-To-Pay & Who Should PayWillingness-To-Pay & Who Should Pay
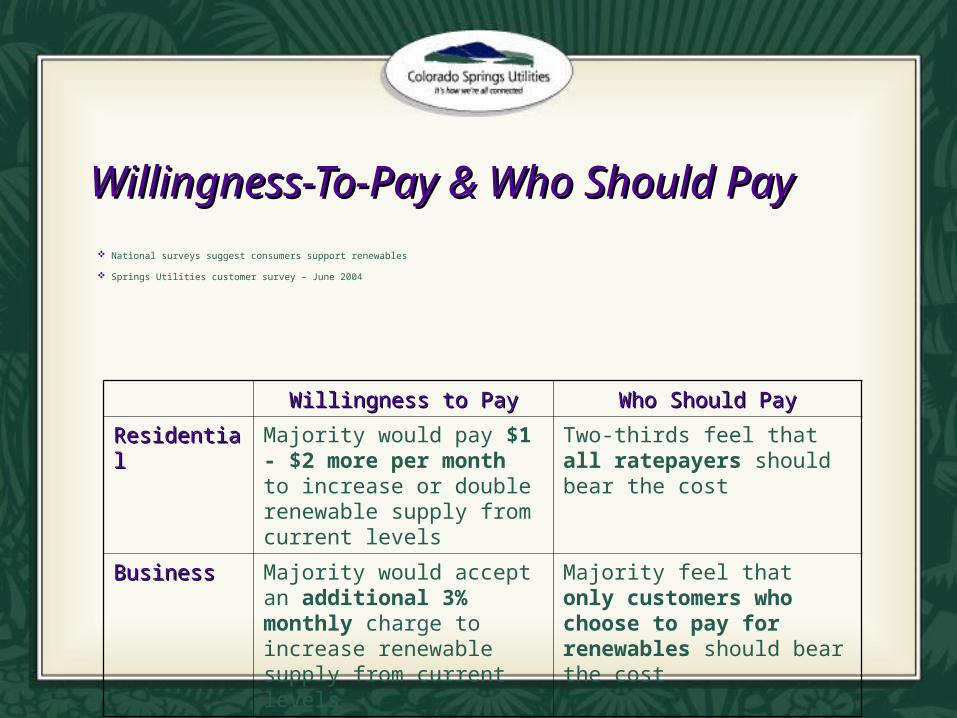
National surveys suggest consumers support renewables
Springs Utilities customer survey – June 2004
Willingness to PayWillingness to Pay Who Should PayWho Should Pay
ResidentialResidential Majority would pay $1 - $2 more per month to increase or double renewable supply from current levels
Two-thirds feel that all ratepayers should bear the cost
BusinessBusiness Majority would accept an additional 3% monthly charge to increase renewable supply from current levels
Majority feel that only customers who choose to pay for renewables should bear the cost
EIRP DriversEIRP Drivers Sound strategic & operational planning
Required by WAPA – PPA for 70MW large hydro
Minimize cost of electricity (rates)
Meet reliability requirements
Maintain financial soundness
Promote environmental stewardship
Balance risk and cost
Provide flexible plans

Public Process & Advisory Groups
EIRPAnalysis
Environmental & Reliability Requirements
Forecasts
Influencing Customers’Consumption thru DSM
Direction & Recommendations
ConventionalCoal, Gas, etc.
Renewable StrategyHydro, Wind, Solar, etc.
Supply Side Options
Transmission
Existing & New• Supply side resources• Demand side & RE programs• Legislative agenda• Short & long term budgets• Rate structure
Utilities BoardPolicies and Limitations
• Education• Efficiency• Regulation
• Load shaping• Rate Structure• Economic Development

EIRP Analysis ProcessEIRP Analysis ProcessGeneral Public Preference
Gen
eral
Pub
lic P
refe
renc
e
General Public Preference is to Rates Low
New REN by
2011
Current DSM Modest ModerateModerate to Aggressive
Aggressive
Refe
ren
ce
Case Coal-2014
Coal-2019Coal-2023
Coal-2015Coal-2020Coal-2024
Coal-2016Coal-2020
Coal-2018Coal-2023
Coal-2020
Lo
w
8 MW
3 MW Small Hydro-20065MW Wind-2006
Coal-2014Coal-2019Coal-2023
3 MW Small Hydro-20065MW Wind-2006
Coal-2015Coal-2020Coal-2024
3 MW Small Hydro-20065MW Wind-2006
Coal-2016Coal-2021
3 MW Small Hydro-20065MW Wind-2006
Coal-2018Coal-2023
3 MW Small Hydro-20065MW Wind-2006
Coal-2020
Me
diu
m
26 MW
3MW Small Hydro-200610MW Wind-2006
13MW Med Hydro-2011Coal-2015Coal-2019Coal-2024
3MW Small Hydro-200610MW Wind-2006
13MW Med Hydro-2011Coal-2016Coal-2020
3MW Small Hydro-200610MW Wind-2006
13MW Med Hydro-2011Coal-2016Coal-2021
3MW Small Hydro-200610MW Wind-2006
13MW Med Hydro-2011Coal-2019Coal-2023
3MW Small Hydro-200610MW Wind-2006
13MW Med Hydro-2011Coal-2021
Hig
h
50 MW
3MW Small Hydro-200625MW Wind-2006
1MW PV-20077MW Biomass-2011
13MW Med Hydro-20111MW PV-2011
Coal-2015Coal-2020Gas-2024
3MW Small Hydro-200625MW Wind-2006
1MW PV-20077MW Biomass-2011
13MW Med Hydro-20111MW PV-2011
Coal-2016Coal-2021
3MW Small Hydro-200625MW Wind-2006
1MW PV-20077MW Biomass-2011
13MW Med Hydro-20111MW PV-2011
Coal-2017Coal-2021
3MW Small Hydro-200625MW Wind-2006
1MW PV-20077MW Biomass-2011
13MW Med Hydro-20111MW PV-2011
Coal-2019Coal-2023
3MW Small Hydro-200625MW Wind-2006
1MW PV-20077MW Biomass-2011
13MW Med Hydro-20111MW PV-2011
Coal-2021
24 MW 38 MW 86 MW 128 MW
DEMAND SIDE MANAGEMENT OPTIONS
RE
NE
WA
BL
ES
DSM Cumulative Thru 2014

Operational Issues with WindOperational Issues with Wind•Wind integration is challenging for smaller utilitiesWind integration is challenging for smaller utilities•Wind RFP – supply profile is anti-coincident to demandWind RFP – supply profile is anti-coincident to demand
Wind Annual Capacity Factors
0.00
0.20
0.40
0.60
0.80
1.00
1.20
1 2 3 4 5 6 7 8 9 10 11 12 13 14 15 16 17 18 19 20 21 22 23 24
Hour
Wind Avg CF Typical summer peak day
WIND AVG HOURLY PROFILE
SUMMER PEAK DAY HOURLY PROFILE
EIRP Leverages Four-Service InfrastructureEIRP Leverages Four-Service Infrastructure New small hydro on water delivery system
2006 (560 kW) 2007 (900 kW) 11 sites under review (potential 2400+ kW)
Engineering and economic studies Biogas - Byproduct of waste water treatment Wind – Utilities-owned Biomass – Forest residue from fire treatment
Other Options Partner with DoD to purchase wind REC purchase

EIRP SummaryEIRP Summary 2004 EIRP Recommendations
Medium Renewables• 3 MW Hydro• 10 MW Wind• 13 MW Medium Hydro• Conduct additional analysis of biomass options, 2005-6
Moderate (National average) DSM • 0.25% of energy per year, 0.4% of demand
Traditional supply side resources • Coal – 2016• Coal – 2021
Key Drivers for 2006 EIRP Update/Changes Economics Operational issues RPS - Amendment 37 – Decision to self-certify
RPS BackgroundRPS Background RPS is a policy instrument that mandates distribution utilities to generate
(or cause to be generated) minimum amounts of renewables as a percent of electricity sales
17 states (and counting), since Massachusetts first adopted in 1997
Arguments in favor: Efficient means of meeting RE targets Incentives for cost minimization Low transaction costs Minimizes ongoing government intervention Spreads costs evenly over targeted area
Arguments against: Forced investment Rate impacts Possible supply/demand imbalance

Colorado Amendment 37Colorado Amendment 37 RPS passed by Colorado voters in Nov. 2004 – the first ever voter-initiated
RPS
Renewable Energy Standard 3% of retail sales by 2007; 6% by 2011; 10% by 2015 1.25 in-state multiplier Average standard compared to RPS policies in other states
Eligible renewables – wind, solar, biomass, small hydro (<10 MW), geothermal, RECs
Solar Mandates for IOUs 0.4% or retail sales by 2015 (1/2 on customer-side) Minimum rebates for solar PV – $2 per watt
Rate Cap – Maximum 1% retail rate impact on each customer’s annual electricity bill
Municipal Utilities Option to self-certify - no solar mandates Option to exempt through local election
Colorado Springs City Council Colorado Springs City Council Position on A37Position on A37
Opposed based on: State law imposed on a “home rule” city EIRP calls for optimum level of renewables Emission reductions similar from EIRP DSM does not count Issues addressed later in SB 143 Cost - mostly burdened business customers Small hydro definition excludes 28 MW Tesla

Amendment 37 Election ResultsAmendment 37 Election Results
Yes No
Colorado1,029,445 53% 898,360 47%
El Paso County98,518 45% 122,866 55%
City of Colorado Springs 46% 54%
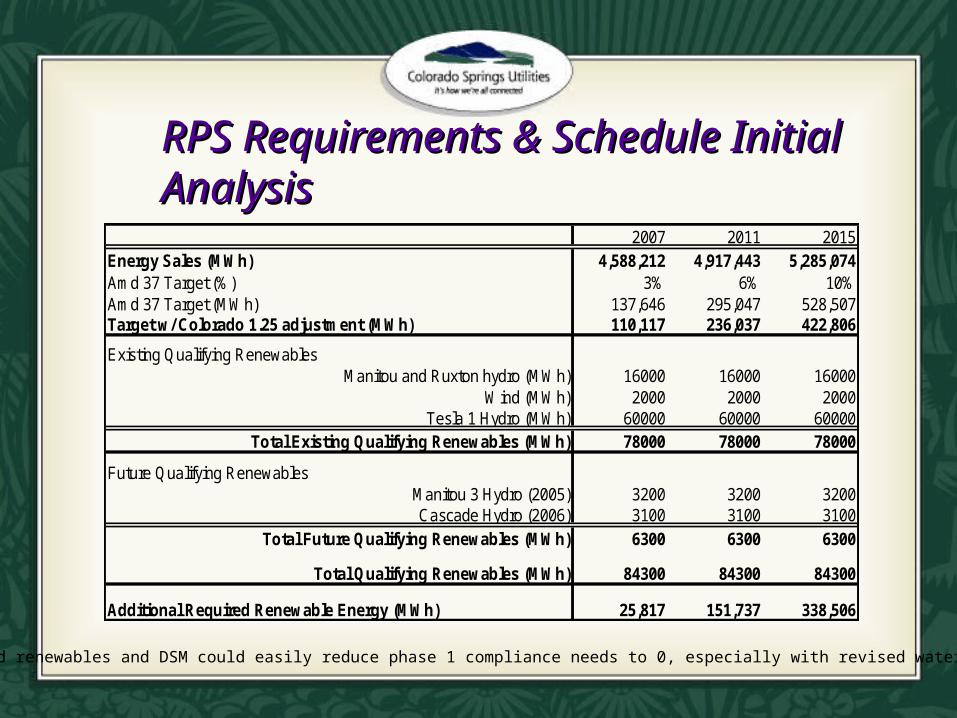
RPS Requirements & Schedule RPS Requirements & Schedule Initial AnalysisInitial Analysis
Planned renewables and DSM could easily reduce phase 1 compliance needs to 0, especially with revised water limits
2007 2011 2015Energy Sales (MWh) 4,588,212 4,917,443 5,285,074Amd 37 Target (%) 3% 6% 10%Amd 37 Target (MWh) 137,646 295,047 528,507Target w/ Colorado 1.25 adjustment (MWh) 110,117 236,037 422,806
Existing Qualifying RenewablesManitou and Ruxton hydro (MWh) 16000 16000 16000
Wind (MWh) 2000 2000 2000Tesla 1 Hydro (MWh) 60000 60000 60000
Total Existing Qualifying Renewables (MWh) 78000 78000 78000
Future Qualifying RenewablesManitou 3 Hydro (2005) 3200 3200 3200Cascade Hydro (2006) 3100 3100 3100
Total Future Qualifying Renewables (MWh) 6300 6300 6300
Total Qualifying Renewables (MWh) 84300 84300 84300
Additional Required Renewable Energy (MWh) 25,817 151,737 338,506

Customer-side Renewables and Customer-side Renewables and Amendment 37 StrategyAmendment 37 Strategy Amendment 37 (SB 143) compliance
Our direction is to comply with Amendment 37 by self-certifying a “substantially similar” renewable energy standard
We support & encourage voluntary additions of RE to our system
Springs Utilities’ objectives with customer-side RE programs Support the intent of Amendment 37 Provide customers greater choice Be good stewards of the environment Ensure safety and reliability of distributed energy resources Gain experience with small-scale, distributed generation Be an active partner in RE market development (e.g. PV)
Operational strategy – combine customer-side RE with DSM
Customer-side Renewable Energy PlanCustomer-side Renewable Energy Plan Background
2004 Renewable Energy Options Assessment study identified leading customer-side renewable energy options
Purpose Support the intent of EIRP Consistent with organizational strategy and environmental goals Acknowledge strategic role of customer-side renewables – i.e., A37
Objectives of the Customer-side Plan Benchmarking Gap analysis Develop scenarios Establish strategic direction Outline a 5-year tactical plan

Customer-side Scenario Contributions to Amendment 37 Compliance (2005-2011)
70,000
90,000
110,000
130,000
150,000
170,000
190,000
210,000
230,000
250,000
2005 2006 2007 2008 2009 2010 2011
MW
hs
of
Ren
ewab
les
A37 Targets
BAU Customer-sideScenario
Modest Customer-side Scenario
Moderate Customer-side Scenario
Aggressive Customer-side Scenario
Supply-sideResources
Note: Hatch marks overlap for customer-side scenarios with aggressive on bottom
109,295
232,016

Net Metering Pilot ProgramNet Metering Pilot Program Launched in 2004 to formalize what was an informal policy
City Council approved “enhancements” in the 2006 Rate Case
Supports RE plans and parallels amendment 37 requirements
Current participation 1 commercial customer 4 residential customers
More systems expected due to rebate program
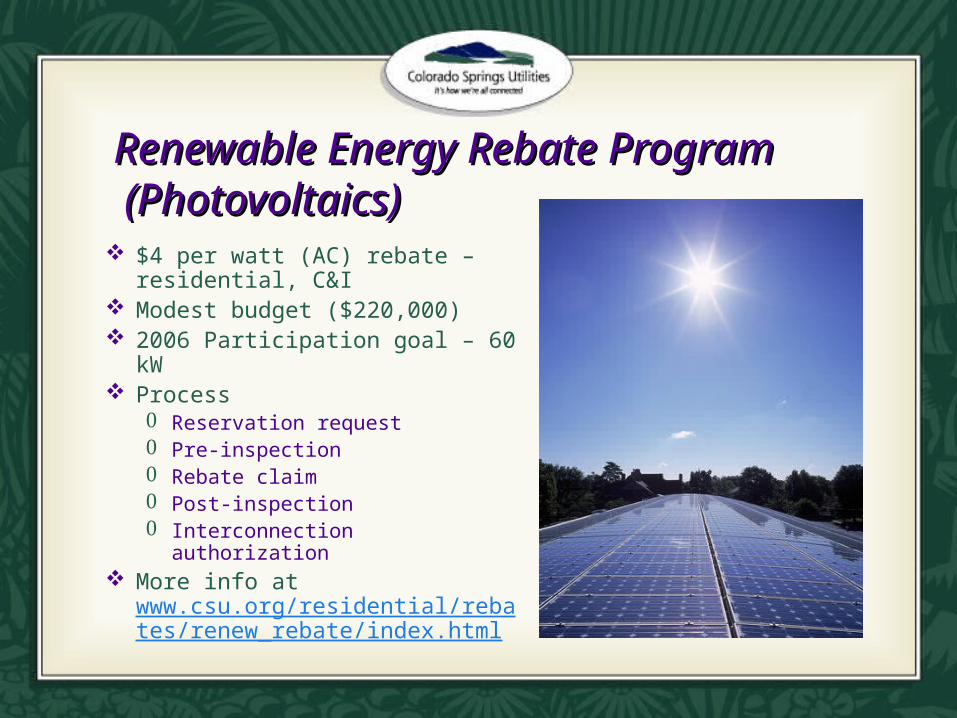
$4 per watt (AC) rebate – residential, C&I
Modest budget ($220,000) 2006 Participation goal – 60 kW Process
Reservation request Pre-inspection Rebate claim Post-inspection Interconnection authorization
More info at www.csu.org/residential/rebates/renew_rebate/index.html
Renewable Energy Rebate Program Renewable Energy Rebate Program (Photovoltaics) (Photovoltaics)

Green Power ProductGreen Power Product
Available since 1998
Objective are: (1) to give customers choice (2) to capture un-tapped demand exhibited in “willingness-to-pay” surveys
Sold in blocks: $3.32/100kWh, monthly payment
Hedging benefit – Electric cost adjustment credit for each block purchased
Customers: 1000 residential, 15 business
1 MW wind contract Source: Ponnequin Wind Farm on CO/WY border Actual wind production depends on intermittent resource True-up discrepancy with RECs or purchased wind
SummarySummary Balancing cost, reliability and environmental stewardship
Leveraging four-service infrastructure
Addressing the challenges of wind integration
Meeting RPS - Amendment 37 obligations via Springs Utilities’ own renewable energy standard
Supporting emerging renewable energy technologies through PV rebates & green product programs
Responding to diverse customer views on cost of renewables through voluntary programs

Questions??Questions??
Contact: Diane Johnson
General Manager, Strategic Planning
Colorado Springs Utilities
719.668.7513
Recommended