BEP 05‐2016 March 2016
Online: http://www.bep.bg
Contact for submissions and requests: [email protected]‐sofia.bg
Center for Economic Theories and Policies Sofia University St. Kliment Ohridski
Faculty of Economics and Business Administration
ISSN: 2367‐7082
The Road to Socioeconomic Fractality
George Mengov
BEP 05‐2016Publication: March 2016
1
The Road to Socioeconomic Fractality
George Mengov1
(Paper presented at the 18th Annual Conference on Social Sustainability through Competitiveness with
Qualitative Growth, 9-10 October, 2015, Sofia, Sofia University St Kliment Ohridski)
March 15, 2016
Abstract: Modelling socioeconomic phenomena is a challenge because of the difficulty to
relate abstract conceptual structures with complex empirical data. The standard econometric
approach takes whatever insight there exists, and simplifies it to fit into regression equations.
However, developing economic ideas and empirical models separately may foster a tendency
for science to diverge from reality, especially when those ideas originate in another discipline.
This paper suggests a stochastic-optimization-based mapping of concepts from any domain on
concepts from economics and management science. Such an approach could potentially
alleviate the divergence problem by outsourcing part of the researcher’s task to the
computational intelligence. By way of example I discuss the opportunities to use the field of
mathematical neuroscience as a source of knowledge to be transferred to socioeconomic
research.
Keywords: Economic modelling, socioeconomic fractality, stochastic optimization
JEL: B4, C63, D7.
1 Sofia University St. Kliment Ohridski, contact: [email protected].
2
1. Introduction
It is fashionable to lament about the discrepancy between economic theory and how the
economy and business actually function. The tone is set, as usual, by high profile figures,
including Nobel laureates. Amartya Sen proclaimed long ago that the axioms used in
economic and political theory need revision (Sen, 1997). The late Ronald Coase, a
centenarian, concluded that, “Economics as currently presented in textbooks and taught in the
classroom does not have much to do with business management, and still less with
entrepreneurship. The degree to which economics is isolated from the ordinary business of
life is extraordinary and unfortunate.” (Coase, 2012). This list of authorities and truisms could
be made very long, but two examples suffice to see where this chain of thought is pointing.
However, there seems to be less agreement on what should be done to get out of these dire
straits.
Here I suggest – with no intention to criticize – that part of the problem may lie with the
adopted modelling practice in the economic science. Because it is immensely difficult to
grasp quantitatively the complexity of socioeconomic life, researchers often resort to specific
combinations of mathematical and computational methods that serve as “crutches”. The result
may look like a piece of theoretical advancement, yet the price paid would most likely be a
thinned bond with reality. I discuss briefly the problem in Section 2, and then propose in
Section 3 a new idea about how better to conduct modelling research, aided by modern
computational techniques. Equipped with innovative armory, one could venture into the
uncharted territory of socioeconomic fractality. There, a new kind of plough meets a virgin
soil to produce a new kind of fruit. This is the topic of the concluding Section 4.
2. On the nature of quantitative modelling in economics
It is standard practice in the natural sciences to seek concepts, definitions, and measurements
that, when linked by laws, would explain phenomena in the observable world directly and
with a tolerable amount of error. In a sequence of refinements of both theory and method,
virtually everything amenable to discovery within the dominant paradigm is eventually
discovered. Then comes a crisis, a scientific revolution resolves it and the story continues
with a new set of concepts and methods.
However, social sciences are so complicated that they sometimes travel a more elliptic road to
discovering truths. Because direct link between theory and empirical observation is often
3
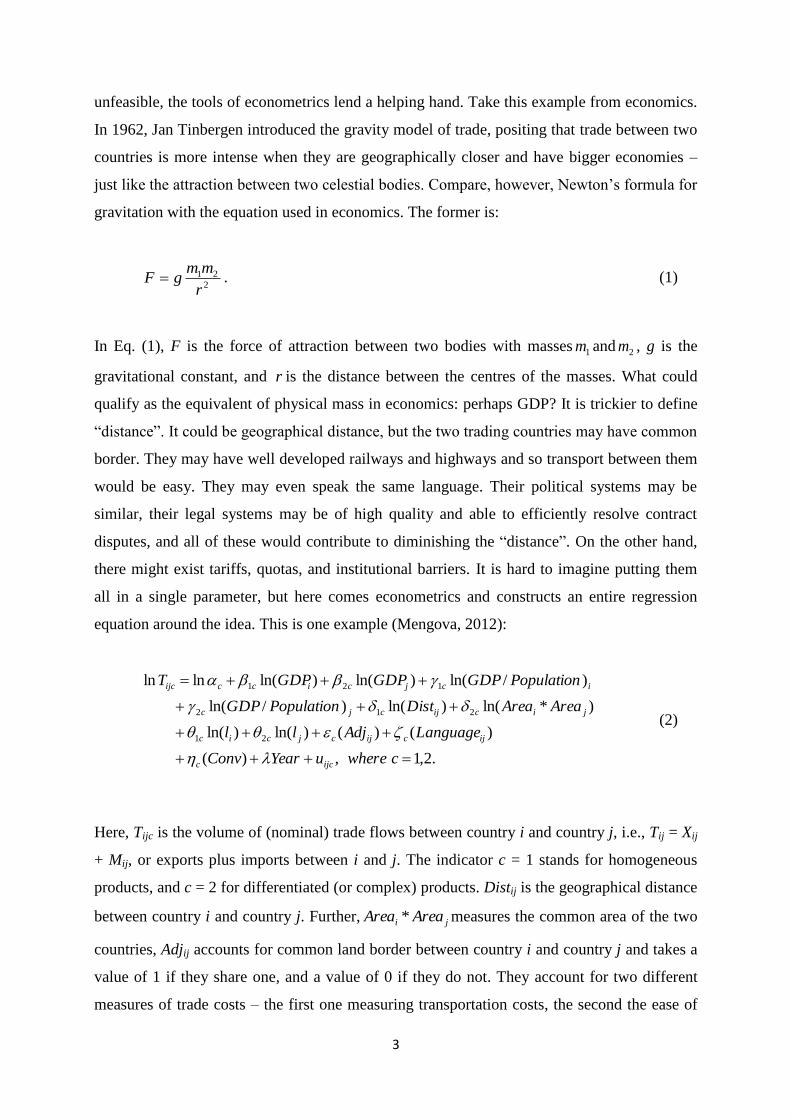
unfeasible, the tools of econometrics lend a helping hand. Take this example from economics.
In 1962, Jan Tinbergen introduced the gravity model of trade, positing that trade between two
countries is more intense when they are geographically closer and have bigger economies –
just like the attraction between two celestial bodies. Compare, however, Newton’s formula for
gravitation with the equation used in economics. The former is:
2
21
r
mmgF . (1)
In Eq. (1), F is the force of attraction between two bodies with masses 1m and 2m , g is the
gravitational constant, and r is the distance between the centres of the masses. What could
qualify as the equivalent of physical mass in economics: perhaps GDP? It is trickier to define
“distance”. It could be geographical distance, but the two trading countries may have common
border. They may have well developed railways and highways and so transport between them
would be easy. They may even speak the same language. Their political systems may be
similar, their legal systems may be of high quality and able to efficiently resolve contract
disputes, and all of these would contribute to diminishing the “distance”. On the other hand,
there might exist tariffs, quotas, and institutional barriers. It is hard to imagine putting them
all in a single parameter, but here comes econometrics and constructs an entire regression
equation around the idea. This is one example (Mengova, 2012):
.2,1,)(
)()()ln()ln(
)*ln()ln()/ln(
)/ln()ln()ln(lnln
21
212
121
cwhereuYearConv
LanguageAdjll
AreaAreaDistPopulationGDP
PopulationGDPGDPGDPT
ijcc
ijcijcjcic
jicijcjc
icjciccijc
(2)
Here, Tijc is the volume of (nominal) trade flows between country i and country j, i.e., Tij = Xij
+ Mij, or exports plus imports between i and j. The indicator c = 1 stands for homogeneous
products, and c = 2 for differentiated (or complex) products. Distij is the geographical distance
between country i and country j. Further, ji AreaArea * measures the common area of the two
countries, Adjij accounts for common land border between country i and country j and takes a
value of 1 if they share one, and a value of 0 if they do not. They account for two different
measures of trade costs – the first one measuring transportation costs, the second the ease of

4
trade exchange. Languageij takes a value of 1 if country i and country j share common
language and is 0 otherwise. Variable uijc is error term associated with the dependent variable
Tijc. Variables Conv, li, and lj account for the quality of the legal systems of the two countries
and the degree of convergence between those systems (Mengova, 2012). All Greek letters are
regression coefficients.
Apparently the gravity model idea is captured, yet Eq. (2) is no longer Newton’s formula. All
meaningful conclusions are drawn on the basis of the regression equation. Today’s economic
literature is full of similar examples where a theoretical insight leads to certain mathematical
model, which is in the end abandoned for a conventional regression model. This is sad
because the insight had often been economic rather than coming from another science, and its
mathematical derivation might have been quite sophisticated. Therefore, one of the claims
here is that developing two separate streaks – one of theory, and another of regressions – may
help, if not create, a tendency for the notorious divergence between economic science and
reality. Of course regression keeps analysis to the ground and related to reality. But its limits,
mostly in imagination, inevitably hamper the advancement of science. On the other hand,
‘high theory’ is free to roam, unrestricted by the need to say something precise about the
empirical world. Ultimately, we have nominal theoretical achievements, but not much of a
progress in understanding the economy. However, today’s computational methods may offer
an unexpected help in improving the usefulness of high theory.
3. A computer-aided search for knowledge
Computational intelligence gained respect in a number of applied sciences and its use in
economics is hardly surprising. Here I seek to present a novel application that might – at least
in some cases – ‘squeeze the lemon’ of theory much better than previously thought. Consider
Figure 1. Following Torgerson (1958), it gives an abstract overview of the relation between
scientific models and the observable world. Circles C1 – C5 represent the theoretical
constructs in each discipline. For example, in various branches of physics that can be length,
force, electric current etc. In every science, it is necessary that at least some theoretical
constructs be defined so as to have a clear connection with phenomena from the real world.
That is how a science gets linked to empirical observations. In Figure 1 these ‘hooks’ are the
constructs C’1, C’2, and C’3. Their definitions, shown with double lines, contain a prescription
of actions that always yield the same result when conducted by an expert. The sequence of

5
particular operations and procedures makes up the operational definition, and shows how
exactly a scientific theory connects with the observable world.
Figure 1. Computer-aided search for knowledge. Blue panel: a theoretical model with
scientific concepts C1, C2,… and relations among them (the black lines). Circles C’1, C’2, and
C’3 represent scientific concepts for which empirical measurement is possible. The blue bunch
of arrows designates the opportunity to find relations among theoretical and operational
concepts. See text for more detail.
Other constructs are defined only theoretically and together with the connections among them
form theoretical models. When a branch of science contains theoretical models of connected
constructs, and at the same time for some of the latter exist operational definitions, there is a
Scientific constructs and
their connections
Operational
definitions
(Rules of
correspondence)
C1’
C2’
C3’
C4
C3
C2
C1
C5
Observable
world,
Nature
Theoretical model

6
theory that can be empirically verified. Eventually, such theories are refined and become
useful in explaining and predicting phenomena from the surrounding world.
The economic variable inflation is a good example to illustrate the difference between
theoretical and operational definition. The former comes from Fisher’s monetary equation,
dealing with variables like price level, total stock of money, velocity of money circulation etc.
On the other hand, an operational definition of inflation is the consumer price index (CPI).
Apparently, the latter definition changes over time, unlike its theoretical counterpart. The
consumer basket evolves due to social progress and technological innovation, bringing out
new products to the market. One can view circles C1 and C’1 in Figure 1 as an illustration of
the two definitions, with the dotted line indicating the problematic relationship between them.
How about a theoretical model that comes from a field unrelated to economics – just like the
gravity model – and is considered useful for it. Which concepts from either science ought to
get paired, is the cardinal question. Now even the doted lines do not exist. And that is where
computational methods become relevant. Today’s technology is advanced enough to suggest
methods like stochastic optimization, which can find the best fit of variables from another
field of science onto economic concepts.
Exactly that automated process is depicted with the bright blue bunch of arrows in Figure 1.
Its purpose is to suggest that the search for variable match may be somewhat arbitrary. Many
traditionally minded economists may be puzzled by this seemingly erratic mapping between
sets of concepts, but they need not be. Figure 2 and Figure 3 show that a process of stochastic
optimization – in this case simulated annealing – can do the matchmaker’s job automatically.
Two points are relevant here. First, a theorem guarantees that if the stochastic optimization
process is slow enough, the system of equations will find its global minimum of error with
respect to the empirical data at hand. That is, if the data are adequate and fully describing the
process, the algorithm will match in an optimal way the elements from empirical economics
onto theoretical concepts from the other field.
In particular, Figure 2 shows an example of an objective/error function being minimized
along the way. A complementary look is provided by Figure 3, which shows how a particular
parameter, one among many, finds its optimal value after several thousand rounds of

7
computation. So the first point is that efficient algorithms can fit pieces of the two domains as
smoothly as possible.
Figure 2. An excerpt from a stochastic optimization process. See text for more detail.
Figure 3. Narrowing the interval of a parameter subjected to stochastic optimization.
8
The second point balances the first one. While an algorithm may do an extremely good job, it
can never compensate for a conceptual deficiency. If the model is not suitable to match, only
a modest result would be achieved. It is the role of the researcher to come up with an
insightful idea why such a mapping makes sense in the first place.
Of course, there is no limit to human imagination with regard to the set of possible mappings.
For example, one might try Newton’s formula and use stochastic optimization to map it
directly onto available data about international trade. Another example for creative mapping,
developed in the age before computational stochastics, was the Navier–Stokes equations for
heat and mass transfer that were adapted to describe stock options in the early 1970s. Physics
has been perhaps the most frequent source of inspiration for economic modelling. Other
sciences have also had a share. An example for potential future crossbreeding is given in the
next Section.
4. Socioeconomic fractality
A transfer of theoretical ideas among distant branches of science has for long been
widespread. The point has always been to take knowledge, really fitting well in the target
domain and thus invigorating it by producing some impressive small result and offering
immense opportunities for further research. Hardly any limitation other than the conceptual
ones could hinder the success of such research (but conceptual limitations are perhaps the
toughest).
In a few recent publications I have advocated the use of mathematical and computational
neuroscience in economics and management science (Mengov, 2013; 2014; 2015). This
suggestion is far less exotic than it might appear at first sight. Economics has routinely drawn
inspiration from biology-related disciplines such as evolutionary biology, ethology, and of
course psychology. With regard to the last one, the sway of behavioral economics shows no
signs of fading for decades already. It might even be argued that its presence, most visible in
behavioral finance, in our time is in fact gaining momentum (Sedlarski & Dimitrova, 2014;
Gerunov, 2013; 2014). Neuroscience is a kin discipline which also has some innovative
insights to offer.
9
To begin with, it is immediately obvious that, to quote Bruno Apolloni, “The social network
is a fractal extension of our brain networks” (Apolloni, 2013). Due to Facebook, LinkedIn,
and the likes, we are connected with one another better than ever and this has a profound
effect on the way we conduct our business. Neuroscience, with its century-long tradition,
could be a natural source of knowledge for the economic behaviour of the modern humans.
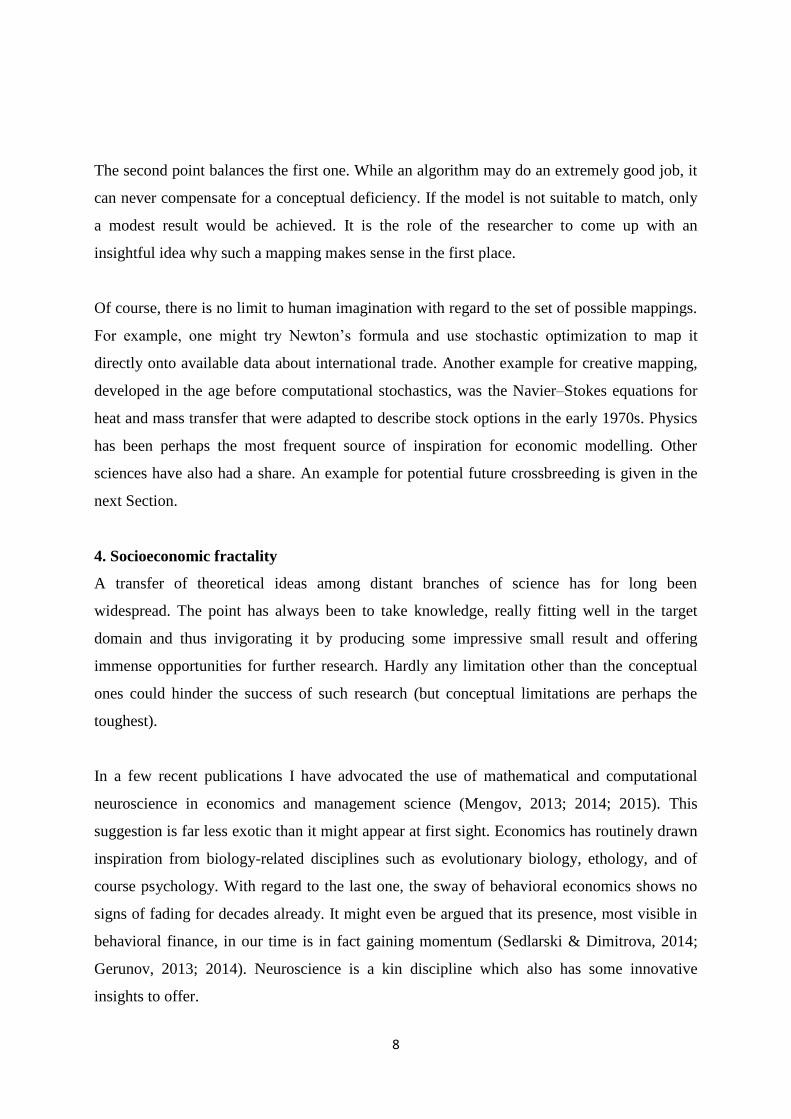
Figure 4. Adaptive resonance theory (ART) neural network.
One particular kind of neural system seems especially good candidate to model social
interactions. It is called Adaptive resonance theory (ART) neural network and was introduced
by Grossberg (1976a, 1976b). It was further refined and extended in hundreds of publications
over the ensuing decades, with a recent overview published in Grossberg (2013).
In brief, adaptive resonance theory describes how the human mind learns new knowledge
without forgetting the existing one. According to this theory, all knowledge is stored in
connections among neurons in the brain whereby, to a first approximation, three neural layers,
F1
Formation of momentary impressions
F0 Incoming information from the senses
F2 Learning new knowledge
Updating existing knowledge

10
F1, F2, and F3 are instrumental. They exchange signals in two directions: a “bottom-up“
stream comes in from the senses and provokes a “top-down” response of associations, based
on previous knowledge. Both streams are compared and matched to produce “impressions”,
which, if found adequate in a certain mathematical sense, are eventually memorized. These
interactions are shown in Figure 4. The theory posits that the brain is “plastic” as it is able to
accommodate change, and at the same time “stable” as it retains what has been learned
already. This is the solution to the famous “stability-plasticity dilemma”. The term “adaptive
resonance” denotes information processing analogous to physical resonance in mechanical
and electrical systems. It is information that “resonates” as multidimensional signals are
exchanged between layers F1 and F2. Responding to an incoming image, the neural network
instantly scans its memories in F2 to find a sufficiently close match. If one exists, all related
neurons are activated to exchange signals with the impressions layer F1. This process is called
adaptive resonance. Until it lasts, knowledge update takes place. The interaction is local as it
affects a limited number of synaptic connections. If no good match is found, then the
incoming pattern is deemed to be entirely new and is learned in a new set of connections
among neurons in F1 and F2. Again, a resonance takes place.
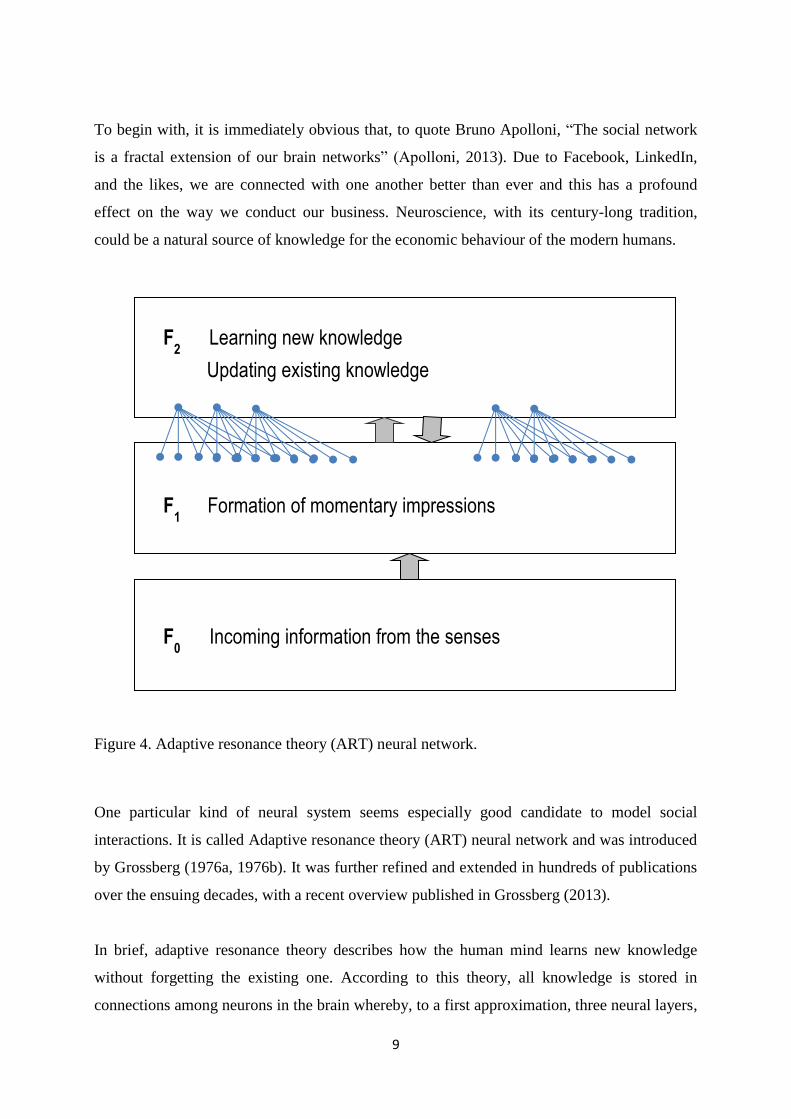
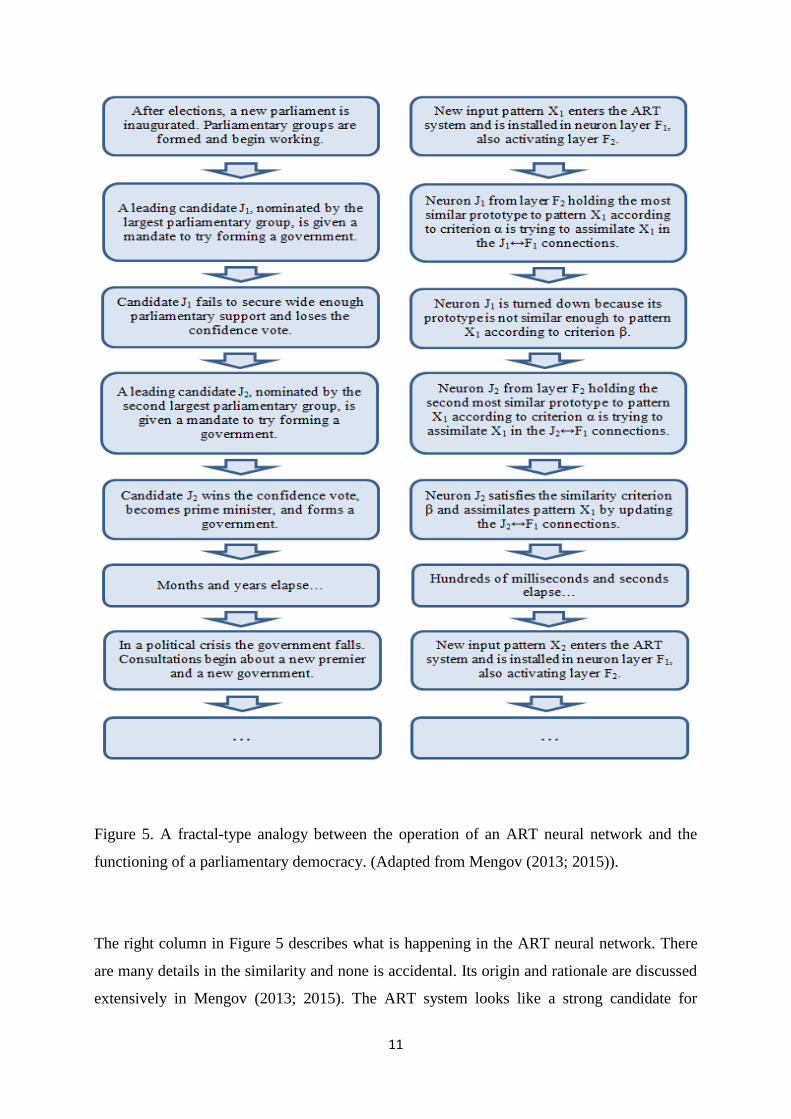
It is intriguing that the operations in the ART neural network have been identified as
analogous to some processes in a broad class of hierarchical social systems, existing in many
strata of human society (Mengov, 2013; 2015). The main idea is summarized in Figure 5,
showing how typical parliamentary procedures in a democratic establishment resemble the
ART functionality. There are many similar details between the two sequences of events.
Precisely that is what I call socioeconomic fractality (Mengov, 2015) – the projection of
events from the millisecond-to-second time span in a neural circuit, over a social system
operating on a months-to-years scale.
Let us look at the left column in Figure 5. It describes procedures in a parliamentary
democracy, but with some adaptation it would just as easily fit totalitarian states. Similar in
principle are the ways in which corporations and all kinds of institutions, large and small,
replace their chief executive officers, presidents, commanders-in-chief, etc. Hardly different,
though simpler, is the power handover in the animal world, where each species has developed
its own rituals, often brutal, to elect the next leader of the group.
11
Figure 5. A fractal-type analogy between the operation of an ART neural network and the
functioning of a parliamentary democracy. (Adapted from Mengov (2013; 2015)).
The right column in Figure 5 describes what is happening in the ART neural network. There
are many details in the similarity and none is accidental. Its origin and rationale are discussed
extensively in Mengov (2013; 2015). The ART system looks like a strong candidate for
12
computational mapping between socioeconomic theory and neuroscience as described earlier.
Moreover, as this effort one day produces fruit, it would become relevant to seek bridges to
more traditional economic fields such as new institutional economics, and especially its
modern treatments, accommodating contributions from behavioral economics (cf. Sedlarski,
2013).
The fractality concept is in no way limited to the ART example. That was first, but other
analogies across scale are immediately obvious. Many communities, markets, and other
collectives of people – physical or virtual, are good candidates to be modelled by the Gated
Dipole neural network (Grossberg, 1972), which is a mathematical model of the brain circuit,
responsible for emotion generation. Further, when a social or socioeconomic system of human
beings evolves and develops a kind of emotional memory – known perhaps by other names in
different scientific disciplines, then an augmented version of the dipole, i.e., the Recurrent
Associative gated Dipole (READ) would be a better model. In the more distant future one
could foresee going not only in the direction of more simplicity, but also in the direction of
more complexity – once the simpler models have explained many phenomena, more
complicated ones would become relevant.
References
Apolloni, B. (2013) Toward a cooperative brain: Continuing the work with John Taylor.
DOI: 10.1109/IJCNN.2013.6706715.
Coase, R. (2012) Saving Economics from the Economists. Harvard Business Review,
December 2012 online edition.
Gerunov, A. (2013). Behavioral Models of Economic Expectations as Foundations for
Sustainable Macroeconomic Policy. Sofia Conferences on Social and Economic Development
in Europe. Frankfurt Berlin: Peter Lang Verlag. [In print].
Gerunov, A. (2014). Dynamics of fundamental macroeconomic variables under
heterogeneous expectations. Doctoral Dissertation, Department of Economics, Faculty of
Economics and Business Administration, Sofia University St. Kliment Ohridski. [In
Bulgarian].

13
Grossberg, S. (1972) A neural theory of punishment and avoidance, II: Quantitative theory.
Mathematical Biosciences, 15, 253–285.
Grossberg, S. (1976a) Adaptive Pattern Classification and Universal Recoding: I. Parallel
Development and Coding of Neural Feature Detectors. Biological Cybernetics, 23, 121-134.
Grossberg, S. (1976b) Adaptive Pattern Classification and Universal Recoding: II. Feedback,
Expectation, Olfaction, Illusions. Biological Cybernetics, 23, 187-202.
Grossberg, S. (2013) Adaptive Resonance Theory: How a brain learns to consciously attend,
learn, and recognize a changing world. Neural Networks, 37, 1-47.
Mengov, G. (2013) Social fractality. Technosphere, 3(21), 25-36. [In Bulgarian].
Mengov, G. (2014) Person-by-person prediction of intuitive economic choice. Neural
Networks, 60, 232-245.
Mengov, G. (2015) Decision Science: A Human-Oriented Perspective. Springer Verlag:
Berlin Heidelberg.
Mengova, E. (2012) The Impact of Legal Systems on Trade Flows in Western and Eastern
Europe – An Empirical Evaluation. The International Trade Journal, 26(1), 37-60.
Sedlarski, T. (2013) New Institutional Economics. Sofia University Press: Sofia. [In
Bulgarian].
Sedlarski, T. & Dimitrova, G. (2014) Basic concepts of behavioral finance theory. Yearbook
of the Faculty of Economics and Business Administration of Sofia University St. Kliment
Ohridski, vol. 12, 195-219. [In Bulgarian].
Sen, A. (1997). Maximization and the act of choice. Econometrica, 65(4), 745-779.
Torgerson, W. (1958) Theory and Methods of Scaling. New York: Wiley.
Recommended