??The Real Cost ofPower

01
?The Real PowerCost of
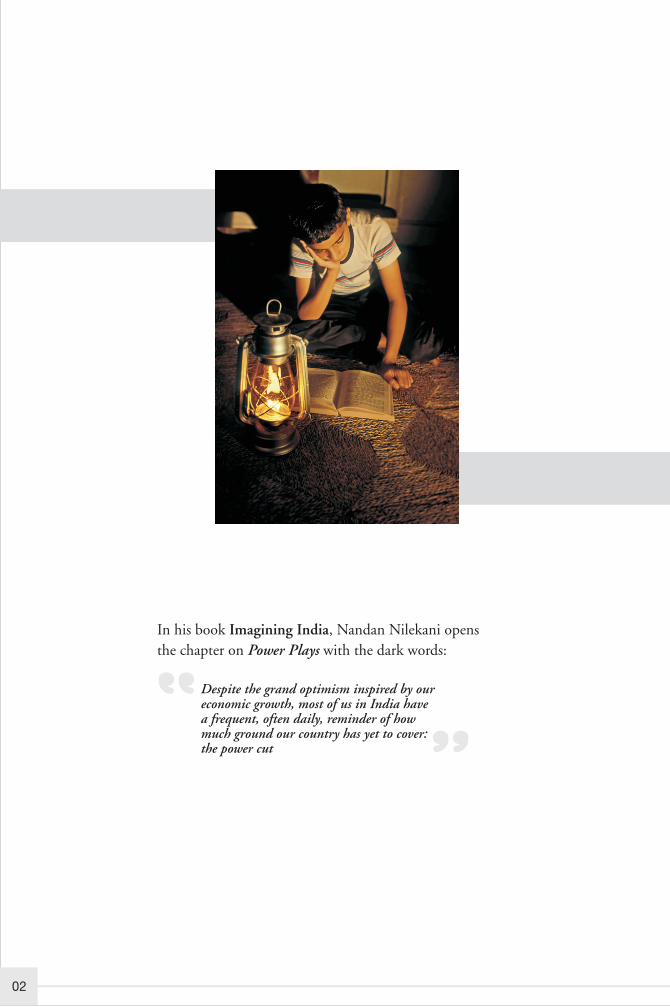
Despite the grand optimism inspired by our economic growth, most of us in India have a frequent, often daily, reminder of how much ground our country has yet to cover: the power cut
In his book Imagining India, Nandan Nilekani opens the chapter on Power Plays with the dark words:
02
That reliable power is one of the key components for fostering growth is an indisputable fact. The correlation between growth in GDP and addition to power generation capacity is close to 1. This means that to realize our ambition to grow by 9% (as expressed by the Honourable Finance Minister in his Budget speech of July 6, 2009), India needs additional generation capacity of 9%, year after year, after wiping out the substantial deficit existing now.
Power outages result in lost economic opportunities for the end consumer. World over, the cost of this opportunity loss is estimated in terms of metrics such as Value of Lost Load (VOLL) and Cost of Unserved Energy (CUE). A simple search on Google will produce links to several reports on this subject. For instance, in one of the projections, Power Grid Corporation of India has estimated the VOLL in India as Rs.34/kWh to Rs.112/kWh. Taking the recorded energy shortfall of 85 billion kWh in 2008-09, and the lower VOLL of Rs.34/kWh, the Value of Lost opportunity for the country translates to Rs. 289,000 crores. In GDP terms, this means a loss of nearly 6%.
In addition to the growth aspect, the quality of human lives today depends on electricity almost as much as on food and shelter.
While load shedding is rampant on one hand, efforts to cope with the chronic power problem continue on the other side. Common citizens as well as commercial organizations have had to resort to various alternatives to deal with this crisis. The source of back-up power varies from candles and kerosene lanterns, to battery Inverters, and generators, leaving aside captive power plants used by large industries.
The over all intent of providing cheap and affordable power to the consumers in the country is noble, but if the supplies are inadequate or unreliable, the consumers could actually end up paying a much higher price.
To get a perspective on how different types of urban consumers cope with the power shortage and what is their real cost of power, Wärtsilä India commissioned a pan-India study through a reputed strategy consulting firm. The findings of this study are interesting and provide an insight that the common man in the country will benefit immensely by paying a little extra sum of money in return for reliability in power supplies. A 'reliability surcharge' of as little as 50 paisa per unit can support rapid capacity build-up. This surcharge would be far less than the extra charges consumers are incurring today and would also offer the comfort of '24 x 7' availability. The nation would benefit from the resulting impact on GDP.
This study raises some important questions, and stakeholders across the power sector value chain need to work together to find and implement the right solutions.
Wärtsilä, with its wide experience in the global power market, looks forward to sharing its global experience and contributing to the cause of ensuring '24 x7' reliable power to all consumers in a growing India.
Rakesh SarinManaging DirectorWärtsilä India Ltd.
The Real Cost of Power
03
The Real Cost of Power
04
Contents
Introduction
Several cities are plagued by chronic power outages
Residential consumers predominantly choose to run low wattage appliances on back-up power
Commercial consumers use a mix of Inverters and gensets for back-up power
Premium paid above grid power cost for using an Inverter
Residential consumers employing back-up equipments pay varying premium
Back-up power premium increases multiple times should the consumer choose to run all appliances
Premium paid above grid power cost for using a generator
Commercial consumers end up paying an even higher amount of premium as compared to residential consumers
Premium above grid cost varies across consumers in different consumption brackets
Awareness of the premium paid for back-up power
Uncertain quality of power and use of voltage stabilizers
Investment in power back-up equipments
Battery related efficiency losses and environment
Conclusion
05
07
09
11
13
15
17
18
19
21
22
23
25
26
27
The Real Cost of Power
05
Exhibit 1
Introduction
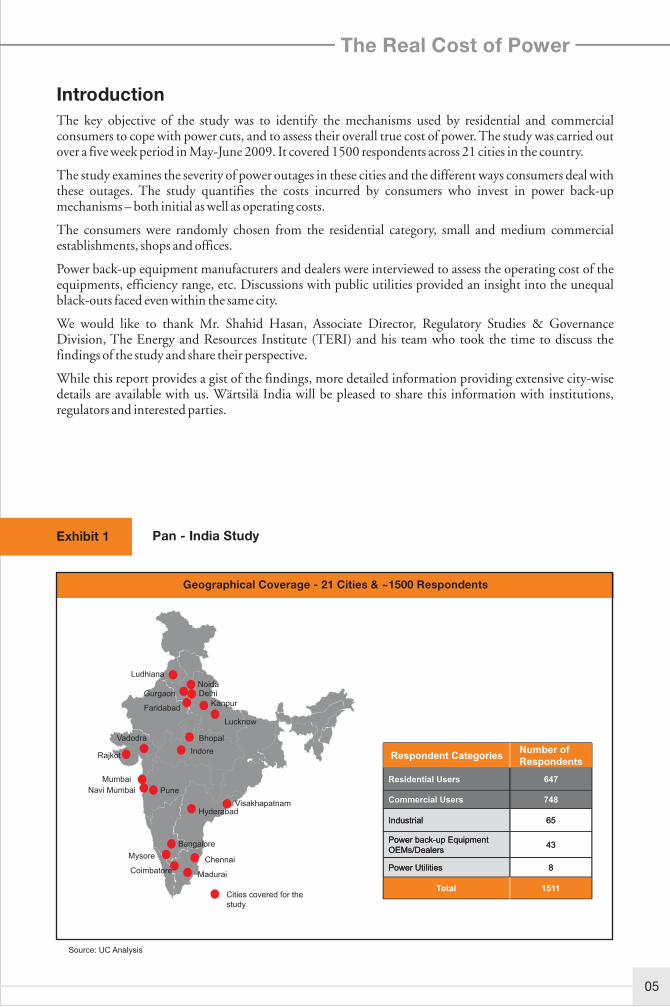
The key objective of the study was to identify the mechanisms used by residential and commercial consumers to cope with power cuts, and to assess their overall true cost of power. The study was carried out over a five week period in May-June 2009. It covered 1500 respondents across 21 cities in the country.
The study examines the severity of power outages in these cities and the different ways consumers deal with these outages. The study quantifies the costs incurred by consumers who invest in power back-up mechanisms – both initial as well as operating costs.
The consumers were randomly chosen from the residential category, small and medium commercial establishments, shops and offices.
Power back-up equipment manufacturers and dealers were interviewed to assess the operating cost of the equipments, efficiency range, etc. Discussions with public utilities provided an insight into the unequal black-outs faced even within the same city.
We would like to thank Mr. Shahid Hasan, Associate Director, Regulatory Studies & Governance Division, The Energy and Resources Institute (TERI) and his team who took the time to discuss the findings of the study and share their perspective.
While this report provides a gist of the findings, more detailed information providing extensive city-wise details are available with us. Wärtsilä India will be pleased to share this information with institutions, regulators and interested parties.
Source: UC Analysis
Mysore
Indore
Lucknow
Chennai
Bangalore
Visakhapatnam
Bhopal
Kanpur
Vadodra
Hyderabad
Pune
Coimbatore Madurai
Faridabad
Ludhiana
DelhiNoida
Mumbai
Navi Mumbai
Cities covered for the study
Gurgaon
Rajkot
8Power Utilities
65Industrial
43Power back-up Equipment OEMs/Dealers
748
647
Commercial Users
Residential Users
1511Total
8Power Utilities
65Industrial
43Power back-up Equipment OEMs/Dealers
748
647
Commercial Users
Residential Users
Number of Respondents
Respondent Categories
Pan - India Study
Geographical Coverage - 21 Cities & ~1500 Respondents
The Real Cost of Power
06
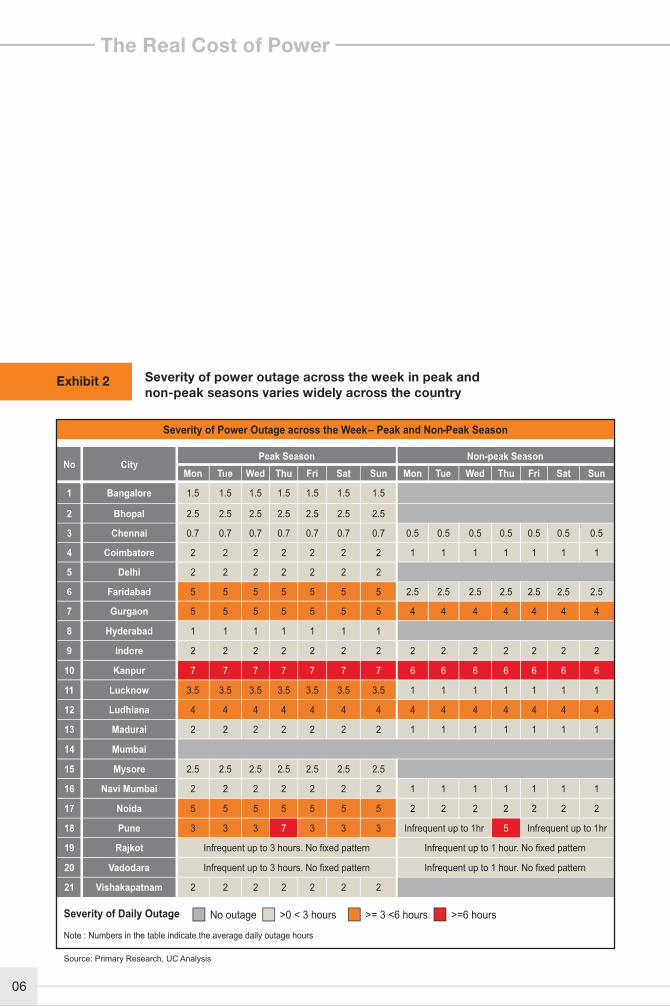
Severity of power outage across the week in peak and non-peak seasons varies widely across the country
Exhibit 2
Severity of Power Outage across the Week – Peak and Non-Peak Season
Severity of Daily Outage
Note : Numbers in the table indicate the average daily outage hours
Source: Primary Research, UC Analysis
>0 < 3 hours >= 3 <6 hours >=6 hoursNo outage
44444444444444Ludhiana12
11111112222222Madurai13
Mumbai14
2.52.52.52.52.52.52.5Mysore15
11111112222222Navi Mumbai16
22222225555555Noida17
Infrequent up to 1hr5Infrequent up to 1hr3337333Pune18
Infrequent up to 1 hour. No fixed patternInfrequent up to 3 hours. No fixed patternRajkot19
Infrequent up to 1 hour. No fixed patternInfrequent up to 3 hours. No fixed patternVadodara20
2222222Vishakapatnam21
11111113.53.53.53.53.53.53.5Lucknow11
1111111Hyderabad8
4444
2.52.52.52.5 2.52.52.55555555Faridabad6
4445555555Gurgaon7
2222222Delhi5
0.50.50.50.50.50.50.50.70.70.70.70.70.70.7Chennai3
1111 1112222222Coimbatore4
2.52.52.52.52.52.52.5Bhopal2
1.51.51.51.51.51.51.5Bangalore1
66666667777777Kanpur10
22222222222222Indore9
Sun Mon
Non-peak Season
Tue Wed Thu Fri Sat
Peak SeasonCityNo
Fri Sat SunThuWedTueMon
The Real Cost of Power
07
Several cities are plagued by chronic power outages
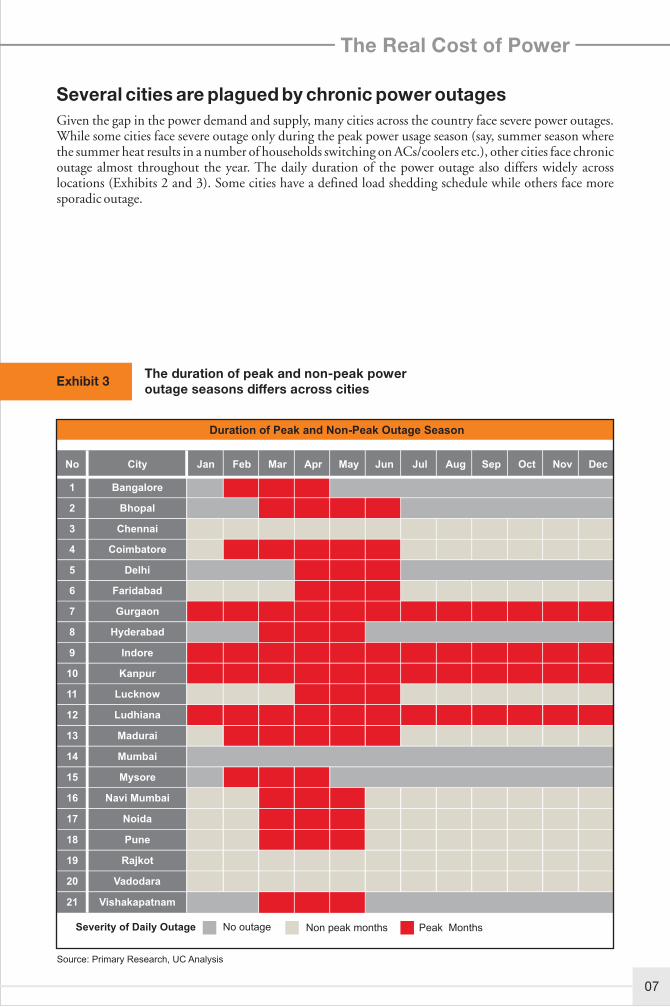
Given the gap in the power demand and supply, many cities across the country face severe power outages. While some cities face severe outage only during the peak power usage season (say, summer season where the summer heat results in a number of households switching on ACs/coolers etc.), other cities face chronic outage almost throughout the year. The daily duration of the power outage also differs widely across locations (Exhibits 2 and 3). Some cities have a defined load shedding schedule while others face more sporadic outage.
The duration of peak and non-peak power outage seasons differs across cities
Exhibit 3
Source: Primary Research, UC Analysis
Severity of Daily Outage Non peak months Peak MonthsNo outage
Rajkot19
Pune18
Noida17
Mysore15
Ludhiana12
Madurai13
Hyderabad8
Indore9
Kanpur10
Lucknow11
Faridabad6
Gurgaon7
Chennai3
Coimbatore4
Delhi5
Bhopal2
Bangalore1
Vishakapatnam21
20
16
14
No May Jun Jul Aug Sep Oct Nov
Vadodara
Navi Mumbai
Mumbai
DecAprMarFebJanCity
Rajkot19
Pune18
Noida17
Mysore15
Ludhiana12
Madurai13
Hyderabad8
Indore9
Kanpur10
Lucknow11
Faridabad6
Gurgaon7
Chennai3
Coimbatore4
Delhi5
Bhopal2
Bangalore1
Vishakapatnam21
20
16
14
No May Jun Jul Aug Sep Oct Nov
Vadodara
Navi Mumbai
Mumbai
DecAprMarFebJanCity
Duration of Peak and Non-Peak Outage Season
The Real Cost of Power
08
We are living in the world's largest democracy but I don't have the power to assure power supply to my family. Power is one of the biggest necessities to run all the other necessities of my life. All my other investments go waste if I don't have one thing in my home – Power. I want to be comfortable at the age of 60. I am ready to pay a premium for regular power supply but I don't have that choice.
Retired Lt. Colonel, Bangalore
The Real Cost of Power
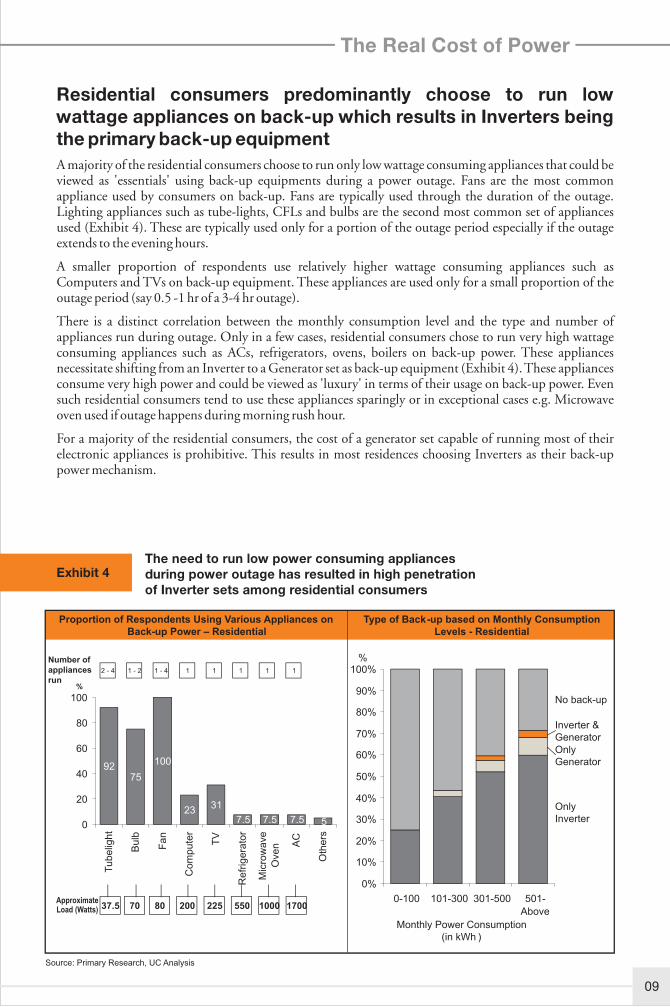
The need to run low power consuming appliances during power outage has resulted in high penetration of Inverter sets among residential consumers
Source: Primary Research, UC Analysis
Exhibit 4
Residential consumers predominantly choose to run low wattage appliances on back-up which results in Inverters being the primary back-up equipment
A majority of the residential consumers choose to run only low wattage consuming appliances that could be viewed as 'essentials' using back-up equipments during a power outage. Fans are the most common appliance used by consumers on back-up. Fans are typically used through the duration of the outage. Lighting appliances such as tube-lights, CFLs and bulbs are the second most common set of appliances used (Exhibit 4). These are typically used only for a portion of the outage period especially if the outage extends to the evening hours.
A smaller proportion of respondents use relatively higher wattage consuming appliances such as Computers and TVs on back-up equipment. These appliances are used only for a small proportion of the outage period (say 0.5 -1 hr of a 3-4 hr outage).
There is a distinct correlation between the monthly consumption level and the type and number of appliances run during outage. Only in a few cases, residential consumers chose to run very high wattage consuming appliances such as ACs, refrigerators, ovens, boilers on back-up power. These appliances necessitate shifting from an Inverter to a Generator set as back-up equipment (Exhibit 4). These appliances consume very high power and could be viewed as 'luxury' in terms of their usage on back-up power. Even such residential consumers tend to use these appliances sparingly or in exceptional cases e.g. Microwave oven used if outage happens during morning rush hour.
For a majority of the residential consumers, the cost of a generator set capable of running most of their electronic appliances is prohibitive. This results in most residences choosing Inverters as their back-up power mechanism.
0%
10%
20%
30%
40%
50%
60%
70%
80%
90%
100%
0-100 101-300 301-500 501-
Above
Type of Back-up based on Monthly Consumption Levels - Residential
Proportion of Respondents Using Various Appliances on Back-up Power – Residential
9275
100
23 31
7.5 7.5 7.5 50
20
40
60
80
100
Tu
be
ligh
t
Bu
lb
Fa
n
Co
mp
ute
r
TV
Re
frig
era
tor
Mic
row
ave
Ove
n AC
Oth
ers
Approximate Load (Watts) 37.5 80 200 550 1000225 170070
Number of appliances run
2 - 4 1 - 41 - 2 11 1 1 1
%
%
Only Inverter
Only Generator
Inverter & Generator
No back-up
Monthly Power Consumption (in kWh )
09
The Real Cost of Power
10
I have a small photostat business and I cannot afford a generator. I am losing all my business due to power cut
Photostat Shop Owner, Ludhiana
The Real Cost of Power
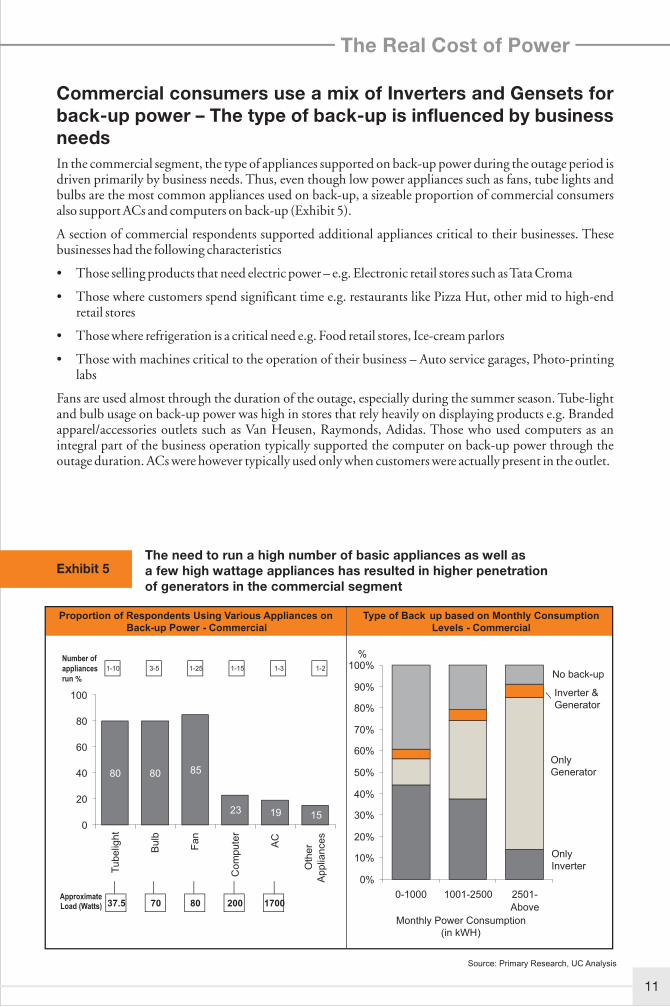
The need to run a high number of basic appliances as well as a few high wattage appliances has resulted in higher penetration of generators in the commercial segment
Exhibit 5
0%
10%
20%
30%
40%
50%
60%
70%
80%
90%
100%
0-1000 1001-2500 2501-Above
Source: Primary Research, UC Analysis
Type of Back up based on Monthly Consumption Levels - Commercial
Proportion of Respondents Using Various Appliances on Back-up Power - Commercial
80 80 85
23 19 150
20
40
60
80
100
Tu
be
ligh
t
Bu
lb
Fa
n
Co
mp
ute
r
AC
Oth
er
Ap
plia
nce
s
Approximate Load (Watts) 37.5 80 200 170070
Number of appliances run %
1-10 1-253-5 1-31-15 1-2
%
Monthly Power Consumption (in kWH)
Only Inverter
Only Generator
Inverter & Generator
No back-up
Commercial consumers use a mix of Inverters and Gensets for back-up power – The type of back-up is influenced by business needs
In the commercial segment, the type of appliances supported on back-up power during the outage period is driven primarily by business needs. Thus, even though low power appliances such as fans, tube lights and bulbs are the most common appliances used on back-up, a sizeable proportion of commercial consumers also support ACs and computers on back-up (Exhibit 5).
A section of commercial respondents supported additional appliances critical to their businesses. These businesses had the following characteristics
• Those selling products that need electric power – e.g. Electronic retail stores such as Tata Croma
• Those where customers spend significant time e.g. restaurants like Pizza Hut, other mid to high-end retail stores
• Those where refrigeration is a critical need e.g. Food retail stores, Ice-cream parlors
• Those with machines critical to the operation of their business – Auto service garages, Photo-printing labs
Fans are used almost through the duration of the outage, especially during the summer season. Tube-light and bulb usage on back-up power was high in stores that rely heavily on displaying products e.g. Branded apparel/accessories outlets such as Van Heusen, Raymonds, Adidas. Those who used computers as an integral part of the business operation typically supported the computer on back-up power through the outage duration. ACs were however typically used only when customers were actually present in the outlet.
11
The Real Cost of Power
A majority of the commercial consumers used Generators as the primary back-up mechanism (Exhibit 5). These establishments had characteristics listed below –
• Usage of high power appliances such as ACs, electronic appliances, machines critical to business needs
• Higher average consumption of electricity where back-up cannot be supported on Inverters
• Larger size of the shop or commercial area
Office complexes and malls that provide common back-up power to all the individual commercial outlets
In a small city like ours, TV is the only entertainment medium for my wife and parents who are at home. The power outages leave them with almost nothing to do. It's affecting everyone's happiness
Resident, Kanpur
12
The Real Cost of Power
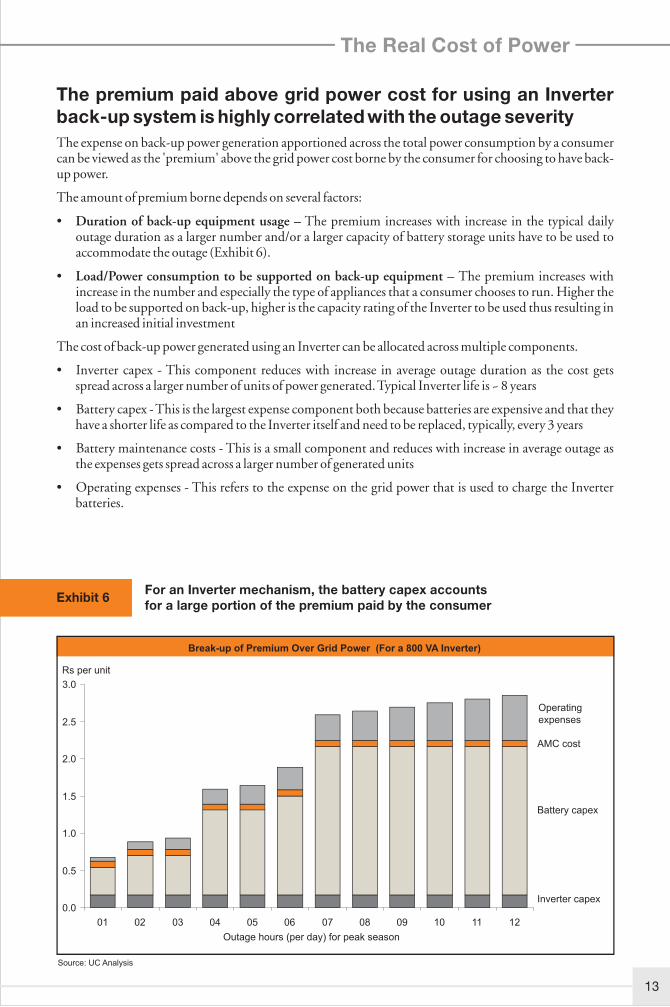
The premium paid above grid power cost for using an Inverter back-up system is highly correlated with the outage severity The expense on back-up power generation apportioned across the total power consumption by a consumer can be viewed as the 'premium' above the grid power cost borne by the consumer for choosing to have back-up power.
The amount of premium borne depends on several factors:
• Duration of back-up equipment usage – The premium increases with increase in the typical daily outage duration as a larger number and/or a larger capacity of battery storage units have to be used to accommodate the outage (Exhibit 6).
• Load/Power consumption to be supported on back-up equipment – The premium increases with increase in the number and especially the type of appliances that a consumer chooses to run. Higher the load to be supported on back-up, higher is the capacity rating of the Inverter to be used thus resulting in an increased initial investment
The cost of back-up power generated using an Inverter can be allocated across multiple components.
• Inverter capex - This component reduces with increase in average outage duration as the cost gets spread across a larger number of units of power generated. Typical Inverter life is ~ 8 years
• Battery capex - This is the largest expense component both because batteries are expensive and that they have a shorter life as compared to the Inverter itself and need to be replaced, typically, every 3 years
• Battery maintenance costs - This is a small component and reduces with increase in average outage as the expenses gets spread across a larger number of generated units
• Operating expenses - This refers to the expense on the grid power that is used to charge the Inverter batteries.
For an Inverter mechanism, the battery capex accounts for a large portion of the premium paid by the consumer
Exhibit 6
Break-up of Premium Over Grid Power (For a 800 VA Inverter)
0.0
0.5
1.0
1.5
2.0
2.5
3.0
01 02 03 04 05 06 07 08 09 10 11 12
AMC cost
Inverter capex
Source: UC Analysis
Operating expenses
Break-up of Premium Over Grid Power (For a 800 VA Inverter) Rs per unit
Outage hours (per day) for peak season
Battery capex
13

The Real Cost of Power
Mother of a 10th standard student, Pune
My son is about to face his board exams which will define his future. Ironically, I had to select his coaching classes based on whether they had a power back-up rather than the quality of the faculty
14
The Real Cost of Power
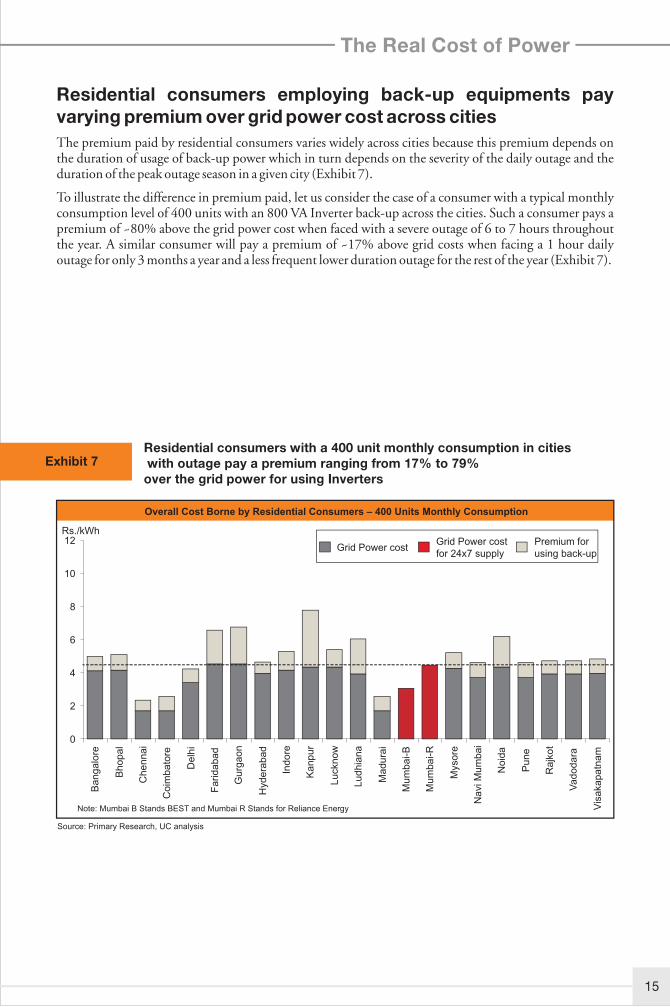
Residential consumers with a 400 unit monthly consumption in cities with outage pay a premium ranging from 17% to 79% over the grid power for using Inverters
Exhibit 7
Overall Cost Borne by Residential Consumers – 400 Units Monthly Consumption
0
2
4
6
8
10
12
Ba
ng
alo
re
Bh
op
al
Ch
en
na
i
Co
imb
ato
re
De
lhi
Fa
rid
ab
ad
Gu
rga
on
Hyd
era
ba
d
Ind
ore
Ka
np
ur
Lu
ckn
ow
Lu
dh
ian
a
Ma
du
rai
Mu
mb
ai-B
Mu
mb
ai-R
Myso
re
Na
vi M
um
ba
i
No
ida
Pu
ne
Ra
jko
t
Va
do
da
ra
Vis
aka
pa
tna
m
Rs./kWh
Source: Primary Research, UC analysis
Grid Power costPremium for using back-up
Grid Power cost for 24x7 supply
Note: Mumbai B Stands BEST and Mumbai R Stands for Reliance Energy
Residential consumers employing back-up equipments pay varying premium over grid power cost across cities
The premium paid by residential consumers varies widely across cities because this premium depends on the duration of usage of back-up power which in turn depends on the severity of the daily outage and the duration of the peak outage season in a given city (Exhibit 7).
To illustrate the difference in premium paid, let us consider the case of a consumer with a typical monthly consumption level of 400 units with an 800 VA Inverter back-up across the cities. Such a consumer pays a premium of ~80% above the grid power cost when faced with a severe outage of 6 to 7 hours throughout the year. A similar consumer will pay a premium of ~17% above grid costs when facing a 1 hour daily outage for only 3 months a year and a less frequent lower duration outage for the rest of the year (Exhibit 7).
15

The Real Cost of Power
I have recently started working in an IT firm and I need to practice at home whatever is told to me in the training sessions. Since there is no power when I return to home and I cannotrun my computer on the Inverter I am unable to practice. This is really affecting my performance in the firm
Resident, Patel Nagar, Gurgaon
16
The Real Cost of Power
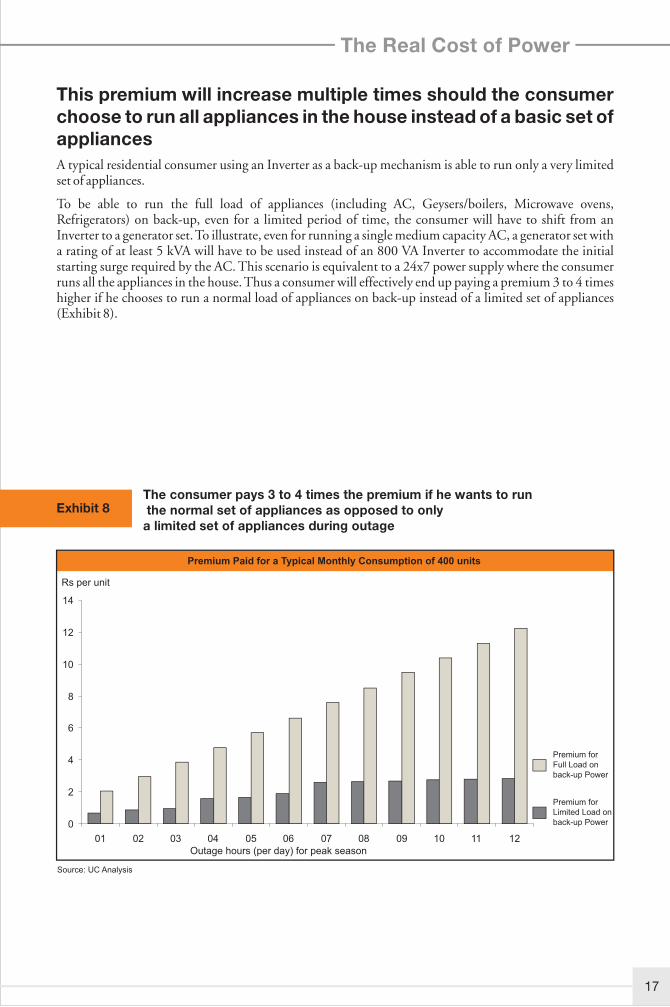
This premium will increase multiple times should the consumer choose to run all appliances in the house instead of a basic set of appliances
A typical residential consumer using an Inverter as a back-up mechanism is able to run only a very limited set of appliances.
To be able to run the full load of appliances (including AC, Geysers/boilers, Microwave ovens, Refrigerators) on back-up, even for a limited period of time, the consumer will have to shift from an Inverter to a generator set. To illustrate, even for running a single medium capacity AC, a generator set with a rating of at least 5 kVA will have to be used instead of an 800 VA Inverter to accommodate the initial starting surge required by the AC. This scenario is equivalent to a 24x7 power supply where the consumer runs all the appliances in the house. Thus a consumer will effectively end up paying a premium 3 to 4 times higher if he chooses to run a normal load of appliances on back-up instead of a limited set of appliances (Exhibit 8).
The consumer pays 3 to 4 times the premium if he wants to run the normal set of appliances as opposed to only a limited set of appliances during outage
Exhibit 8
0
2
4
6
8
10
12
14
01 02 03 04 05 06 07 08 09 10 11 12
Premium for Limited Load on back-up Power
Source: UC Analysis
Premium Paid for a Typical Monthly Consumption of 400 units
Rs per unit
Outage hours (per day) for peak season
Premium for Full Load on back-up Power
17
The Real Cost of Power
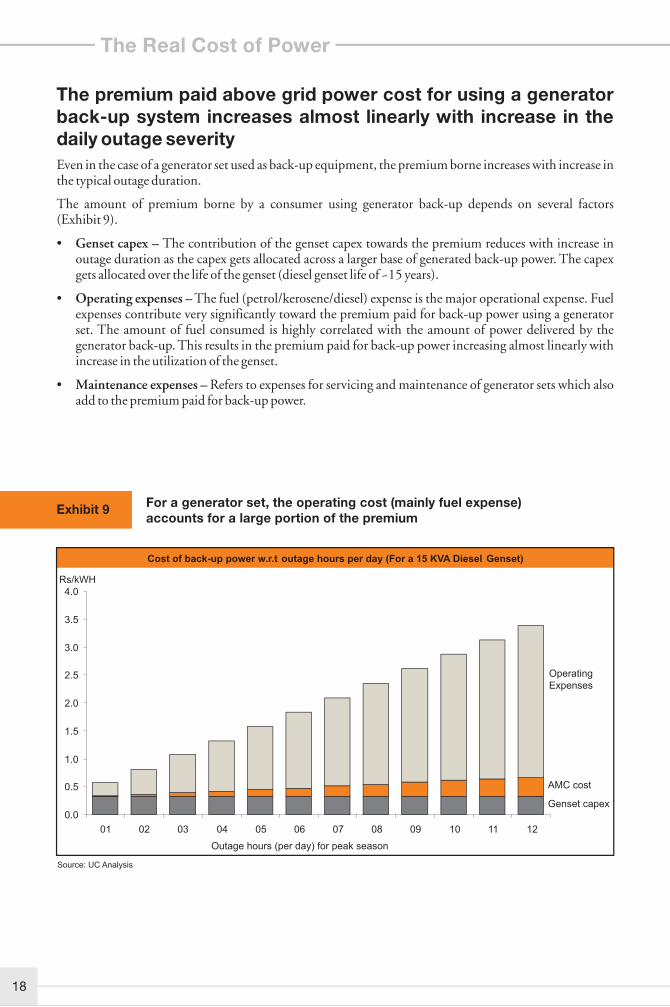
The premium paid above grid power cost for using a generator back-up system increases almost linearly with increase in the daily outage severity
Even in the case of a generator set used as back-up equipment, the premium borne increases with increase in the typical outage duration.
The amount of premium borne by a consumer using generator back-up depends on several factors (Exhibit 9).
• Genset capex – The contribution of the genset capex towards the premium reduces with increase in outage duration as the capex gets allocated across a larger base of generated back-up power. The capex gets allocated over the life of the genset (diesel genset life of ~15 years).
• Operating expenses – The fuel (petrol/kerosene/diesel) expense is the major operational expense. Fuel expenses contribute very significantly toward the premium paid for back-up power using a generator set. The amount of fuel consumed is highly correlated with the amount of power delivered by the generator back-up. This results in the premium paid for back-up power increasing almost linearly with increase in the utilization of the genset.
• Maintenance expenses – Refers to expenses for servicing and maintenance of generator sets which also add to the premium paid for back-up power.
For a generator set, the operating cost (mainly fuel expense) accounts for a large portion of the premium
Exhibit 9
Cost of back-up power w.r.t outage hours per day (For a 15 KVA Diesel Genset)
0.0
0.5
1.0
1.5
2.0
2.5
3.0
3.5
4.0
01 02 03 04 05 06 07 08 09 10 11 12
AMC cost
Genset capex
Source: UC Analysis
Operating Expenses
Rs/kWH
Outage hours (per day) for peak season
18
The Real Cost of Power
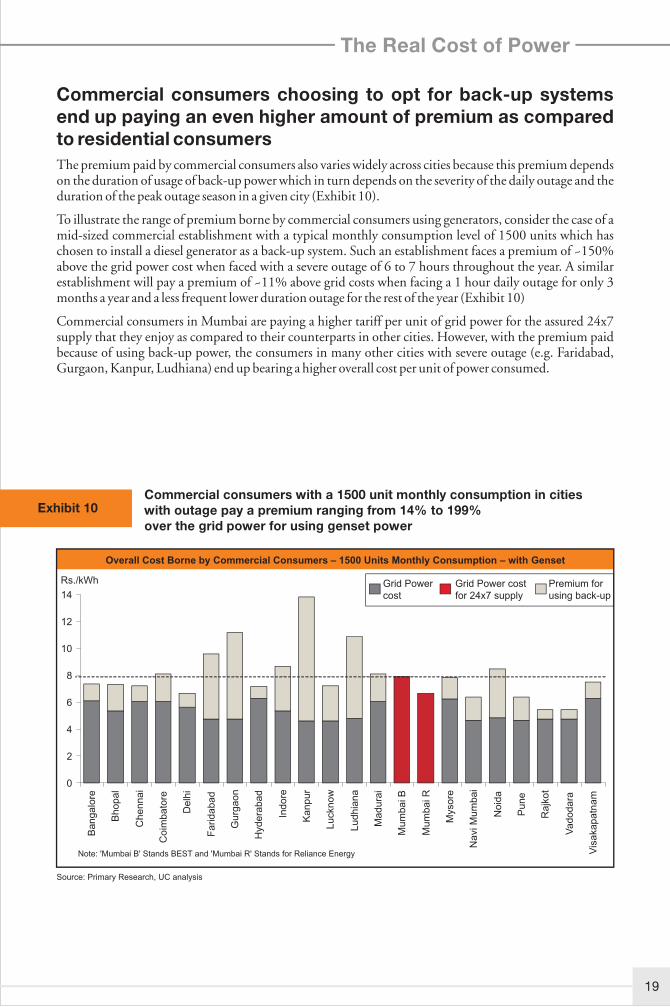
Commercial consumers choosing to opt for back-up systems end up paying an even higher amount of premium as compared to residential consumers
The premium paid by commercial consumers also varies widely across cities because this premium depends on the duration of usage of back-up power which in turn depends on the severity of the daily outage and the duration of the peak outage season in a given city (Exhibit 10).
To illustrate the range of premium borne by commercial consumers using generators, consider the case of a mid-sized commercial establishment with a typical monthly consumption level of 1500 units which has chosen to install a diesel generator as a back-up system. Such an establishment faces a premium of ~150% above the grid power cost when faced with a severe outage of 6 to 7 hours throughout the year. A similar establishment will pay a premium of ~11% above grid costs when facing a 1 hour daily outage for only 3 months a year and a less frequent lower duration outage for the rest of the year (Exhibit 10)
Commercial consumers in Mumbai are paying a higher tariff per unit of grid power for the assured 24x7 supply that they enjoy as compared to their counterparts in other cities. However, with the premium paid because of using back-up power, the consumers in many other cities with severe outage (e.g. Faridabad, Gurgaon, Kanpur, Ludhiana) end up bearing a higher overall cost per unit of power consumed.
19
Commercial consumers with a 1500 unit monthly consumption in cities with outage pay a premium ranging from 14% to 199% over the grid power for using genset power
Exhibit 10
0
2
4
6
8
10
12
14
Ba
ng
alo
re
Bh
op
al
Ch
en
na
i
Co
imb
ato
re
De
lhi
Fa
rid
ab
ad
Gu
rga
on
Hyd
era
ba
d
Ind
ore
Ka
np
ur
Lu
ckn
ow
Lu
dh
ian
a
Ma
du
rai
Mu
mb
ai B
Mu
mb
ai R
Myso
re
Na
vi M
um
ba
i
No
ida
Pu
ne
Ra
jko
t
Va
do
da
ra
Vis
aka
pa
tna
m
Overall Cost Borne by Commercial Consumers – 1500 Units Monthly Consumption – with Genset
Source: Primary Research, UC analysis
Grid Power cost
Premium for using back-up
Grid Power cost for 24x7 supply
Note: 'Mumbai B' Stands BEST and 'Mumbai R' Stands for Reliance Energy
Rs./kWh
The Real Cost of Power
20
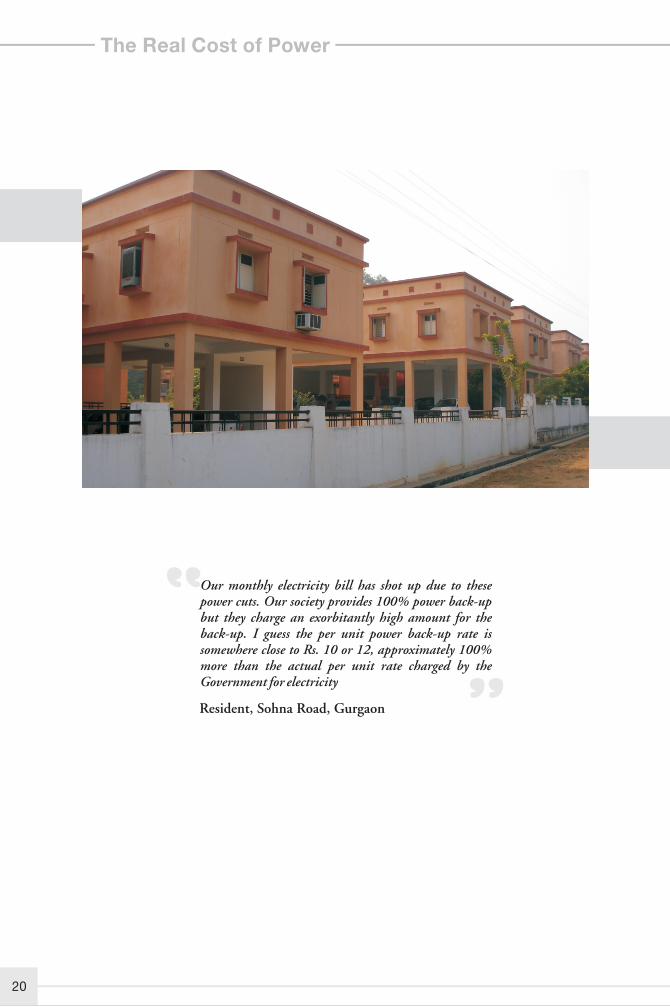
Our monthly electricity bill has shot up due to these power cuts. Our society provides 100% power back-up but they charge an exorbitantly high amount for the back-up. I guess the per unit power back-up rate is somewhere close to Rs. 10 or 12, approximately 100% more than the actual per unit rate charged by the Government for electricity
Resident, Sohna Road, Gurgaon
The Real Cost of Power
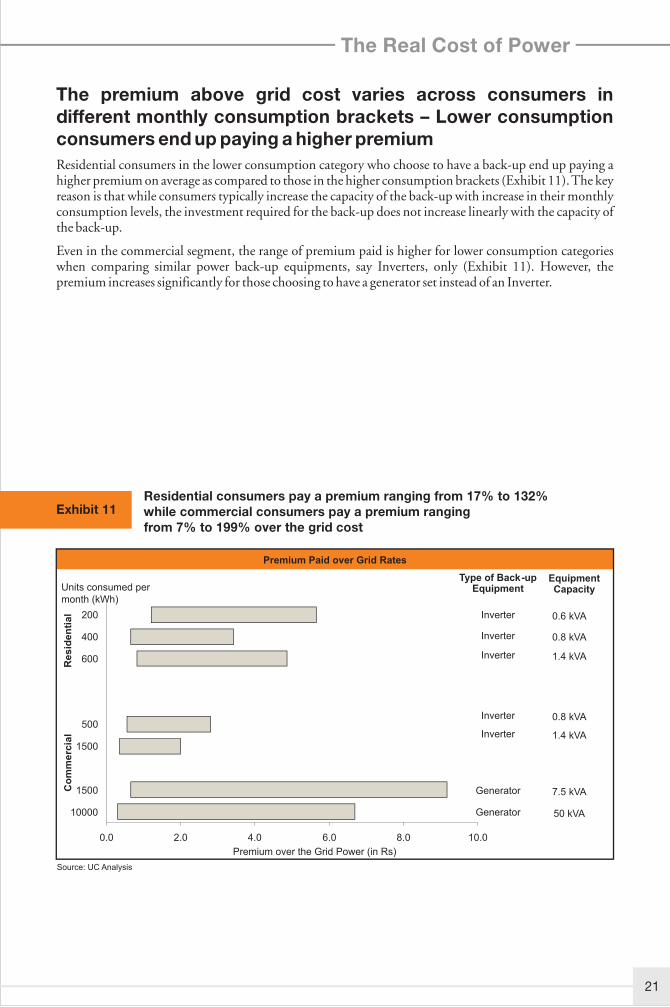
The premium above grid cost varies across consumers in different monthly consumption brackets – Lower consumption consumers end up paying a higher premium Residential consumers in the lower consumption category who choose to have a back-up end up paying a higher premium on average as compared to those in the higher consumption brackets (Exhibit 11). The key reason is that while consumers typically increase the capacity of the back-up with increase in their monthly consumption levels, the investment required for the back-up does not increase linearly with the capacity of the back-up.
Even in the commercial segment, the range of premium paid is higher for lower consumption categories when comparing similar power back-up equipments, say Inverters, only (Exhibit 11). However, the premium increases significantly for those choosing to have a generator set instead of an Inverter.
21
Premium Paid over Grid Rates
0.0 2.0 4.0 6.0 8.0 10.0
10000
1500
1500
500
600
400
200
Units consumed per month (kWh)
Source: UC Analysis
Type of Back-up Equipment
Inverter
Inverter
Generator
Re
sid
en
tia
lC
om
me
rcia
l
Premium over the Grid Power (in Rs)
Equipment Capacity
Inverter
Inverter
Inverter
Generator
1.4 kVA
0.6 kVA
50 kVA
0.8 kVA
1.4 kVA
0.8 kVA
7.5 kVA
Exhibit 11Residential consumers pay a premium ranging from 17% to 132% while commercial consumers pay a premium ranging from 7% to 199% over the grid cost
The Real Cost of Power
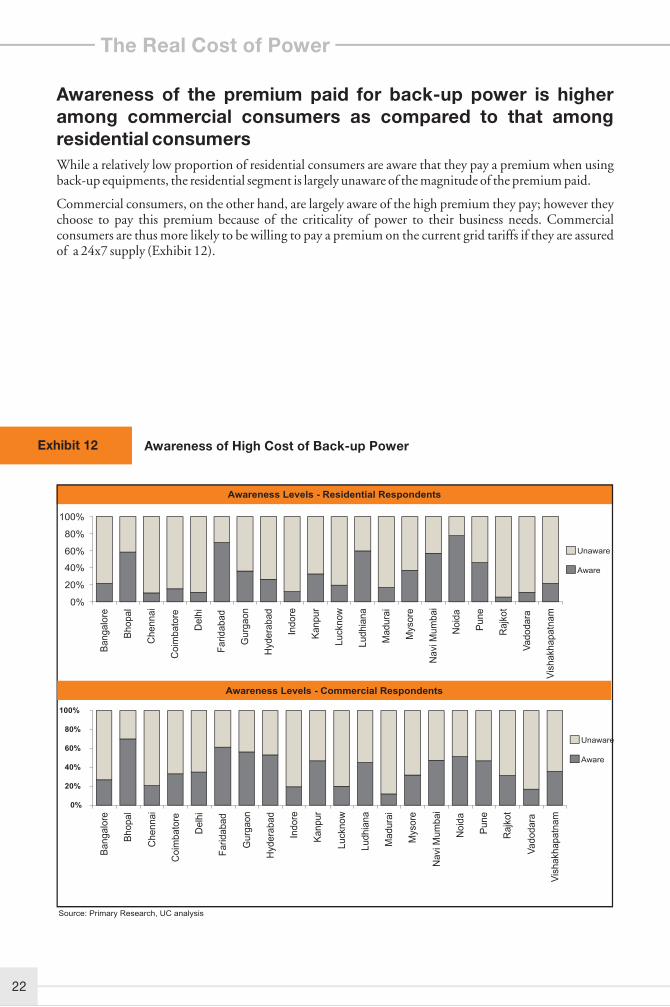
Awareness of the premium paid for back-up power is higher among commercial consumers as compared to that among residential consumers
While a relatively low proportion of residential consumers are aware that they pay a premium when using back-up equipments, the residential segment is largely unaware of the magnitude of the premium paid.
Commercial consumers, on the other hand, are largely aware of the high premium they pay; however they choose to pay this premium because of the criticality of power to their business needs. Commercial consumers are thus more likely to be willing to pay a premium on the current grid tariffs if they are assured of a 24x7 supply (Exhibit 12).
0%
20%
40%
60%
80%
100%
Ba
ng
alo
re
Bh
op
al
Ch
en
na
i
Co
imb
ato
re
De
lhi
Fa
rid
ab
ad
Gu
rga
on
Hyd
era
ba
d
Ind
ore
Ka
np
ur
Lu
ckn
ow
Lu
dh
ian
a
Ma
du
rai
Mys
ore
Na
vi M
um
ba
i
No
ida
Pu
ne
Ra
jko
t
Va
do
da
ra
Vis
ha
kha
pa
tna
m
0%
20%
40%
60%
80%
100%
Ba
ng
alo
re
Bh
op
al
Ch
en
na
i
Co
imb
ato
re
De
lhi
Fa
rid
ab
ad
Gu
rga
on
Hyd
era
ba
d
Ind
ore
Ka
np
ur
Lu
ckn
ow
Lu
dh
ian
a
Ma
du
rai
Mys
ore
Na
vi M
um
ba
i
No
ida
Pu
ne
Ra
jko
t
Va
do
da
ra
Vis
ha
kha
pa
tna
m
Awareness Levels - Residential Respondents
Source: Primary Research, UC analysis
Aware
Unaware
Awareness Levels - Commercial Respondents
Aware
Unaware
Awareness of High Cost of Back-up Power
Exhibit 12
22
The Real Cost of Power
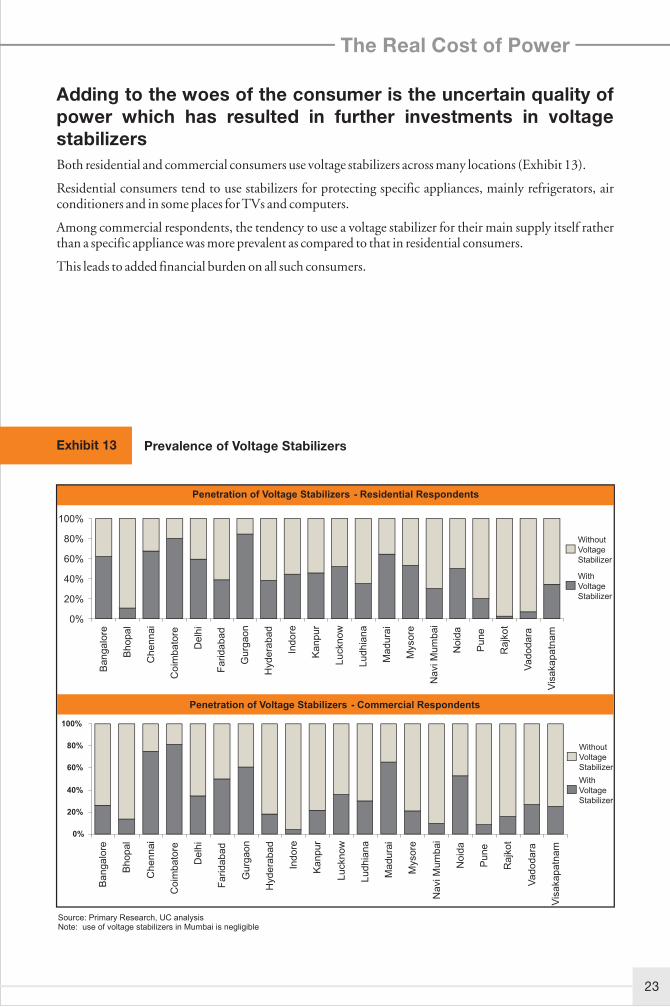
Adding to the woes of the consumer is the uncertain quality of power which has resulted in further investments in voltage stabilizers
Both residential and commercial consumers use voltage stabilizers across many locations (Exhibit 13).
Residential consumers tend to use stabilizers for protecting specific appliances, mainly refrigerators, air conditioners and in some places for TVs and computers.
Among commercial respondents, the tendency to use a voltage stabilizer for their main supply itself rather than a specific appliance was more prevalent as compared to that in residential consumers.
This leads to added financial burden on all such consumers.
Exhibit 13 Prevalence of Voltage Stabilizers
0%
20%
40%
60%
80%
100%
Ba
ng
alo
re
Bh
op
al
Ch
en
na
i
Co
imb
ato
re
De
lhi
Fa
rid
ab
ad
Gu
rga
on
Hyd
era
ba
d
Ind
ore
Ka
np
ur
Lu
ckn
ow
Lu
dh
ian
a
Ma
du
rai
Myso
re
Na
vi M
um
ba
i
No
ida
Pu
ne
Ra
jko
t
Va
do
da
ra
Vis
aka
pa
tna
m
0%
20%
40%
60%
80%
100%
Ba
ng
alo
re
Bh
op
al
Ch
en
na
i
Co
imb
ato
re
De
lhi
Fa
rid
ab
ad
Gu
rga
on
Hyd
era
ba
d
Ind
ore
Ka
np
ur
Lu
ckn
ow
Lu
dh
ian
a
Ma
du
rai
Myso
re
Na
vi M
um
ba
i
No
ida
Pu
ne
Ra
jko
t
Va
do
da
ra
Vis
aka
pa
tna
m
Penetration of Voltage Stabilizers - Residential Respondents
Source: Primary Research, UC analysisNote: use of voltage stabilizers in Mumbai is negligible
Penetration of Voltage Stabilizers - Commercial Respondents
With Voltage Stabilizer
Without Voltage Stabilizer
With Voltage Stabilizer
Without Voltage Stabilizer
23
The Real Cost of Power
24
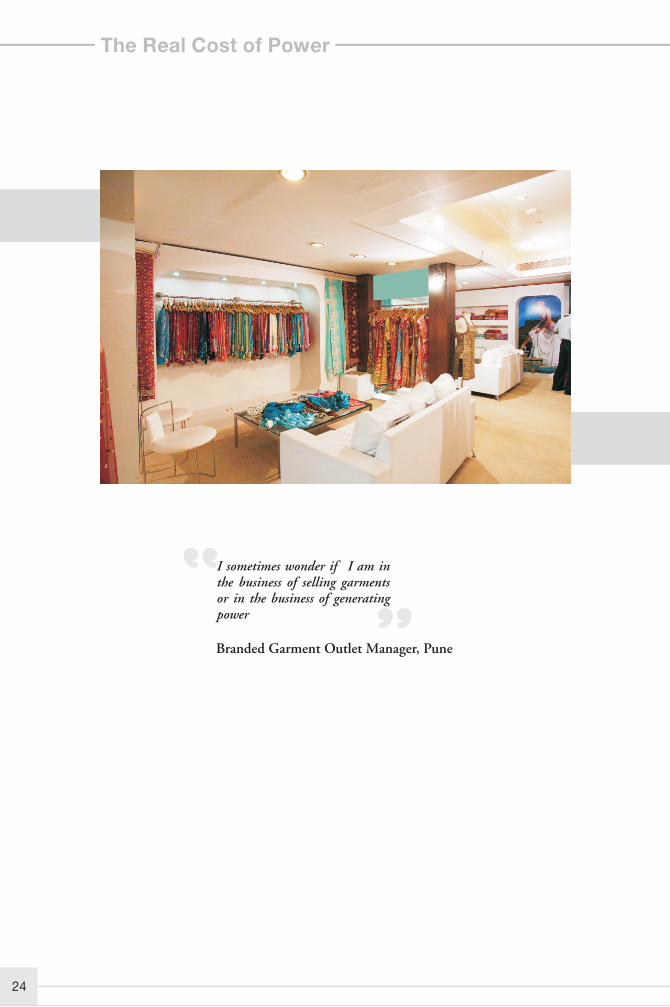
I sometimes wonder if I am in the business of selling garments or in the business of generating power
Branded Garment Outlet Manager, Pune
The Real Cost of Power
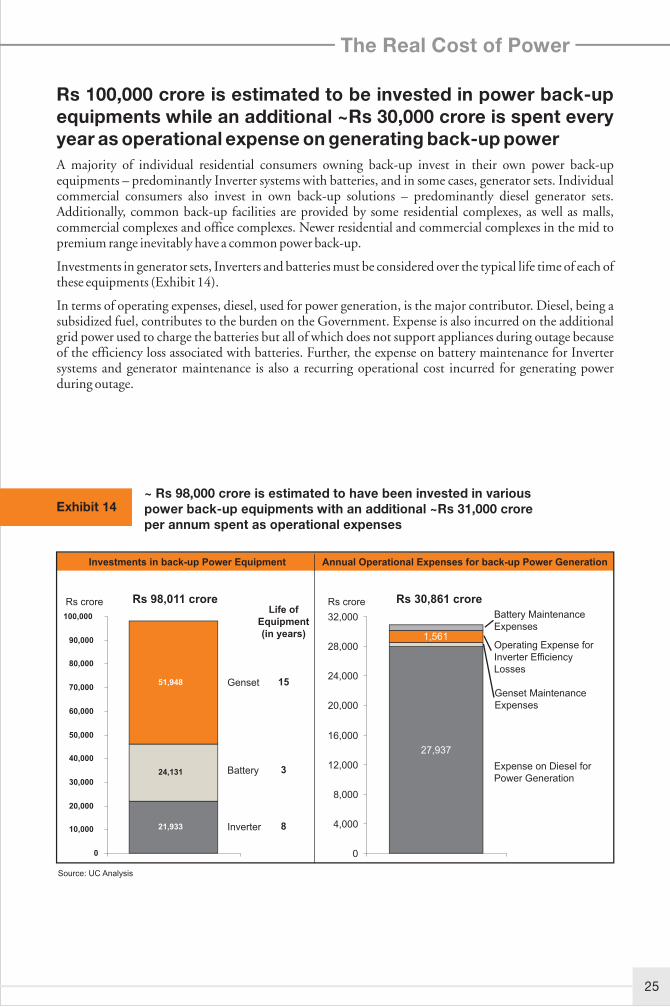
Rs 100,000 crore is estimated to be invested in power back-up equipments while an additional ~Rs 30,000 crore is spent every year as operational expense on generating back-up power
A majority of individual residential consumers owning back-up invest in their own power back-up equipments – predominantly Inverter systems with batteries, and in some cases, generator sets. Individual commercial consumers also invest in own back-up solutions – predominantly diesel generator sets. Additionally, common back-up facilities are provided by some residential complexes, as well as malls, commercial complexes and office complexes. Newer residential and commercial complexes in the mid to premium range inevitably have a common power back-up.
Investments in generator sets, Inverters and batteries must be considered over the typical life time of each of these equipments (Exhibit 14).
In terms of operating expenses, diesel, used for power generation, is the major contributor. Diesel, being a subsidized fuel, contributes to the burden on the Government. Expense is also incurred on the additional grid power used to charge the batteries but all of which does not support appliances during outage because of the efficiency loss associated with batteries. Further, the expense on battery maintenance for Inverter systems and generator maintenance is also a recurring operational cost incurred for generating power during outage.
~ Rs 98,000 crore is estimated to have been invested in various power back-up equipments with an additional ~Rs 31,000 crore per annum spent as operational expenses
Exhibit 14
27,937
1,561
0
4,000
8,000
12,000
16,000
20,000
24,000
28,000
32,000
21,933
24,131
51,948
0
10,000
20,000
30,000
40,000
50,000
60,000
70,000
80,000
90,000
100,000
Investments in back-up Power Equipment
Rs crore
Genset
Battery
Inverter
Source: UC Analysis
Rs 98,011 crore
15
3
8
Life of Equipment(in years)
Rs crore
Expense on Diesel for Power Generation
Operating Expense for Inverter Efficiency Losses
Battery Maintenance Expenses
Rs 30,861 crore
Annual Operational Expenses for back-up Power Generation
Genset Maintenance Expenses
25
The Real Cost of Power
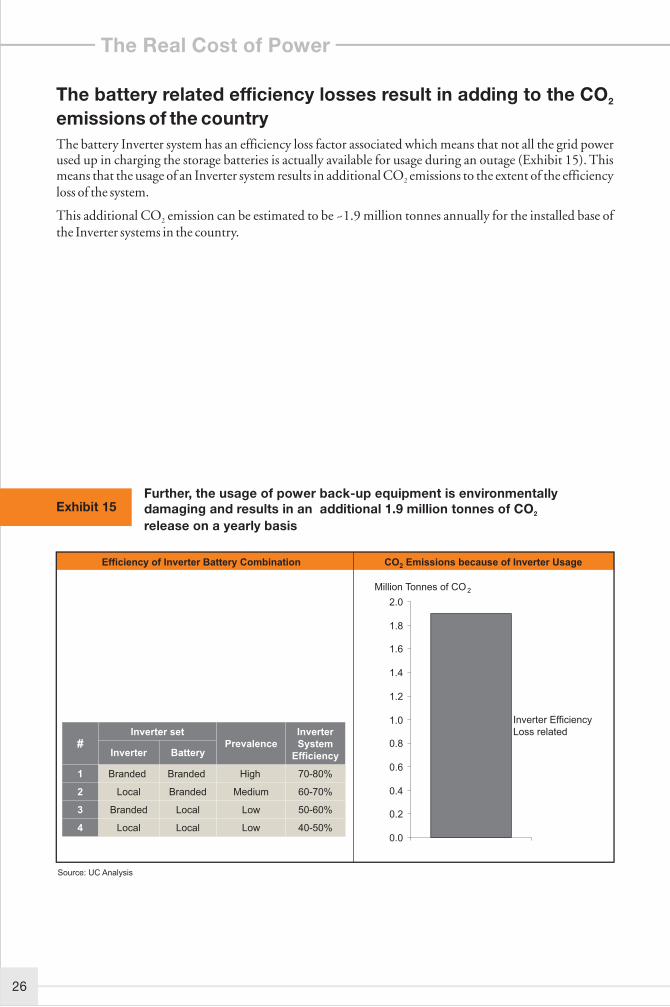
The battery related efficiency losses result in adding to the CO 2
emissions of the country
The battery Inverter system has an efficiency loss factor associated which means that not all the grid power used up in charging the storage batteries is actually available for usage during an outage (Exhibit 15). This means that the usage of an Inverter system results in additional CO emissions to the extent of the efficiency 2
loss of the system.
This additional CO emission can be estimated to be ~1.9 million tonnes annually for the installed base of 2
the Inverter systems in the country.
Efficiency of Inverter Battery Combination
Source: UC Analysis
CO2 Emissions because of Inverter Usage
Million Tonnes of CO 2
0.0
0.2
0.4
0.6
0.8
1.0
1.2
1.4
1.6
1.8
2.0
Inverter Efficiency Loss related
40-50%LowLocalLocal4
50-60%LowLocalBranded3
60-70%MediumBrandedLocal2
70-80%HighBrandedBranded1
BatteryInverter
Inverter System
EfficiencyPrevalence
Inverter set#
40-50%LowLocalLocal4
50-60%LowLocalBranded3
60-70%MediumBrandedLocal2
70-80%HighBrandedBranded1
BatteryInverter
Inverter System
EfficiencyPrevalence
Inverter set#
Further, the usage of power back-up equipment is environmentally damaging and results in an additional 1.9 million tonnes of CO2
release on a yearly basis
Exhibit 15
26
The Real Cost of Power
Conclusion
The real cost of power to the Indian consumer is higher than he or she realizes. The consumer is unwittingly paying a very high price because of power outages that are rampant across the country. On the brighter side, there are examples of consumers, like in Mumbai, who benefit from a 24x7 reliable power supply by paying a reliability charge.
The study also reveals that substantial investments have been made by individual consumers while setting up mechanisms to cope with power outage. The report estimates the total investment in the country for this purpose as Rs. 100,000 crores. To provide a perspective, this amount is equivalent to the cost that would be incurred in setting up power plants totaling to a capacity of 25,000 MW.
Additionally, consumers also bear significant annual operating expenses for back-up power equal to almost one third of the capital costs . The efficiency level of such equipment is often poor. The fuels used – such as diesel – are subsidized by the Government, adding to the tax-payers' burden. The inefficiency also inflicts damage on the environment. An estimated quantum of 1.98 million tones of CO is generated just 2
due to the losses incurred in battery back-up system.
These are strong pointers to stakeholders across the power sector value chain of the need to work together towards resolution of the following critical questions:
• How can the country move, at an accelerated pace, towards availability of reliable power?
• What is the technology mix available in today's world which can add to the reliability and efficiency, while at the same time enabling rapid deployment of generation capacity?
• How do we create PPP (public-private partnership) ventures to bridge the widening gap in generation capacity and demand?
• And at the same time, how do we ensure that the Indian citizen gets economical and reliable power in over all terms rather than so-called cheap power that is unreliable?
While initiatives such as the setting up of Ultra Mega Power Plants will, hopefully, help in adding base load capacities in the country, it is high time we looked at other complementary technologies and solutions to impart much-needed flexibility into the system and to improve peak-load management. Distributed generation based on high-efficiency, modular plants is a means to achieve both these objectives. To realise the nation's dream of high GDP growth, rapid deployment of such capacities is a matter of great priority.
27

The Real Cost of Power
?28

Wärtsilä India LimitedNeco Chambers, Plot No. 48, Sector 11, CBD Belapur, Navi Mumbai, 400614, IndiaTel.: +91-22-27575361/71 Fax.: +91-22-27575370
®WÄRTSILÄ is a registered trademark. Copyright © 2009 Wärtsilä Corporation
Our power plants produce roughly 1% of the world's electricity.
Our ship engines power every third ship and we service every second ship
sailing the world's seas.
Environmental concerns mean ever-growing demands for greener, more
efficient ways of working. At Wärtsilä, we are prepared for this challenge.
Our business is power, and our solutions are uniquely efficient . The simple
truth is that wise power practices save money while helping protect the
environment. We believe our customers should expect nothing less.
Wärtsilä has close to 19,000 professionals manning 160 locations in
70 countries around the world. Wärtsilä is listed on the NASDAQ OMX
Helsinki, Finland.
This study has been carried out by Universal Consulting India Private Limited.
Wärtsilä - A Source of Power
Recommended
![Welcome [greateroshkosh.com] · Real Estate Cost Analysis Real Estate Cost Analysis Cost Segregation (New Buildings) Commercial Energy Efficiency Deduction (179D) P Create Opportunities](https://img.pdfslide.us/doc/110x75/5f086ea97e708231d421fbc9/welcome-real-estate-cost-analysis-real-estate-cost-analysis-cost-segregation.jpg)