IFN Working Paper No. 944, 2012 The Psychology of the Entrepreneur and the Gender Gap in Entrepreneurship Ola Bengtsson, Tino Sanandaji and Magnus Johannesson
Research Institute of Industrial Economics P.O. Box 55665
SE-102 15 Stockholm, Sweden [email protected] www.ifn.se
The Psychology of the Entrepreneur and the Gender Gap in Entrepreneurship
Ola Bengtsson*, Tino Sanandaji** and Magnus Johannesson***
Abstract
Self-employment is often used as synonymous with entrepreneurship. We define entrepreneurship as having the ambition to grow or innovate. As part of a large and representative survey in Sweden, business owners were asked to self-identify as either entrepreneurs or self-employed. The survey in addition contains detailed questions on economic preferences, attitudes and behaviors as well as psychometrically validated measures of personality traits. We document significant psychological differences between self-identified entrepreneurs and the self-identified self-employed. Entrepreneurs differ substantially from the population; they are less risk and ambiguity averse, more aware of opportunity costs, exhibit greater tolerance of greed and are less behaviorally inhibited. With the notable exception of risk aversion the self-employed do not differ appreciably from wage-earners on most psychological characteristics. An interesting application of the distinction made above is gender differences in entrepreneurship. Measured psychological characteristics can account for one third of the large gender gap in entrepreneurship, but only one tenth of the smaller gender gap in self-employment. Men are one and a half times more likely to be self-employed than females but five times more likely to be entrepreneurs.
L26 – Entrepreneurship, J16 – Economics of Gender, D8 – Information, Knowledge, and Uncertainty, D03 – Behavioral Economics
* Lund University and Research Institute of Industrial Economics, [email protected] ** Research Institute of Industrial Economics, corresponding author [email protected] *** Stockholm School of Economics, [email protected]. This paper has been presented at the NBER Entrepreneurship meeting, the Canadian Conference on the Economics of Innovation and Entrepreneurship and the HEC Workshop on Entrepreneurship. We especially would like to thank David Cesarini for help with the data, and David Robinson, Douglas Cumming and Simon Parker for valuable discussant comments. All errors are our own.
1
1 Introduction
Scholars have long believed that individuals who blaze new paths and undertake
entrepreneurial ventures have a special psyche (Knight, 1921; Schumpeter, 1934). A
vast empirical literature exists on this topic. We attempt to contribute to this literature
by adding questions about entrepreneurship and economic preferences to an unusually
large and detailed Swedish survey. In particular, we distinguish between
entrepreneurs and non-entrepreneurial self-employed individuals by asking
proprietors to self-report based on their ambitions to grow or innovate. We rely on
this self-identified definition of entrepreneurship and extensive measures of economic
preferences to investigate an important and unresolved question, namely, the gender
gap in entrepreneurship.
Gender differences in labor market outcomes are large and ubiquitous, especially for
high-achieving jobs (Bertrand and Hallock, 2001). One explanation for this disparity
is gender differences in personality traits (Gneezy, Niederle, and Rustichini, 2003;
Niederle and Vesterlund, 2007; Croson and Gneezy, 2009). Entrepreneurship and
self-employment are among the areas in the labor market in which the gender gap is
the greatest. From a policy perspective, understanding the roots of this gender gap is
important because entrepreneurship carries considerable societal benefits—
entrepreneurs innovate, launch products, create jobs, and contribute to economic
growth (Asc and Audretsch, 1988; Kortum and Lerner, 2000; Carree and Thurik,
2003; Van Praag and Versloot, 2007).
In this paper, we study whether the extent to which gender differences in personality
traits explain gender differences in entrepreneurship. We find the gender gap in
2

entrepreneurship is significantly larger than the gender gap in self-employment.
Moreover, psychological gender differences play a more prominent role in the gender
gap in entrepreneurship than in the gender gap in self-employment.
Sweden presents a suitable testing ground for gender-based differences in labor
market outcomes as Sweden’s high degree of emancipation diminishes the influence
of institutional gender discrimination. An advantage of this sample is that it is large,
containing 7,331 individuals, and is representative of the cross section of the working
Swedish population. Another advantage of our dataset is its unusual level of detail.
Based on a multitude of survey questions, we identify 14 distinct personality traits:
risk aversion, loss aversion, ambiguity aversion, time discount rate (i.e., payoff
patience), numeracy (i.e., ability to calculate odds), illusion of control, belief that
money is fungible, awareness about the opportunity costs concept, tolerance of greed
(i.e., acceptance of market economy outcomes that may be “unfair”), trust in others,
locus of control, positive attitude toward civic engagement, behavioral inhibition, and
happiness. The fact that we simultaneously investigate a large number of personality
traits allows us to capture a bigger share of the gender gap that is driven by
personality traits.
Our empirical testing analysis proceeds in three steps. In the first step, we confirm
significant gender differences in personality traits. Women have weaker numeracy
skills and more control illusion, believe less in the fungibility of money, are less
tolerant of greed and more trusting in others, have a weaker internal locus of control,
are less favorable toward civic engagements, and are less behaviorally inhibited.
Interestingly, we find that women are more risk averse but less ambiguity averse than
men. An ambiguity-averse individual, whom we identify by asking a question based
on the classical Ellsberg paradox, is unwilling to make choices associated with
3

unknown probabilities. Ambiguity aversion is distinct from risk aversion, both
conceptually (Fox and Tversky, 1995; Maccheroni, Marinacci, and Rustichini, 2005)
and empirically—the correlation between the two is virtually zero in our data.
In our second step, we relate the likelihood of being an entrepreneur to the 14
personality traits (with controls for gender and age). We find that, compared with
others, entrepreneurs are less risk and ambiguity averse. Numerous prior studies have
documented the finding pertaining to risk aversion. This study, however, is one of the
first to document entrepreneurs’ ambiguity aversion relative to non-entrepreneurs (see
Knight, 1921).1 We further show entrepreneurs are more aware of opportunity cost,
more tolerant of greed, have a stronger internal locus of control, are more civic
minded, and are less behaviorally inhibited.
In the third step, we unify the above results. We find that measured personality
traits account for around one third of the gender gap in entrepreneurship.
In the concluding part of our empirical analysis, we compare the personality traits
between non-entrepreneurial self-employed individuals and the general population
(i.e., employees and those who are inactive in the labor market). Excluding
entrepreneurs from the sample, we find that only one entrepreneurial trait—lower risk
aversion—differs significantly between the non-entrepreneurial self-employed and the
general population. Personality traits can explain much less of the gender gap in self-
employment than the gender gap in entrepreneurship. This result highlights the
potential problem of using self-employment as an empirical proxy for
entrepreneurship.
1 Holm, Opper and Nee (2013) study ambiguity aversion among CEOs in China, finding no difference with the control group.
4
The literature on gender differences in entrepreneurship is vast and growing. A recent
extensive review includes Jennings and Brush (2013). Wagner (2007), Zhang et al.
(2009), and Verheul et al. (2011) more specifically study the role of personality
differences in the gender gap in entrepreneurship. Croson and Gneezy (2009) review
the literature on gender differences in personality and psyche, and find “robust
[gender] differences in risk preferences, social (other-regarding) preferences, and
competitive preferences.”
This paper is linked to the literature that studies how personality and psyche relate
to entrepreneurship (see Shane, 2003, for a review). Numerous studies have linked
higher risk tolerance with a higher propensity to engage in self-employment
(Kihlstrom and Laffont, 1979; Rees and Shah, 1986; Begley and Boyd, 1987; Stewart
et al., 1999; Van and Cramer, 2001; Cramer et al., 2002; Caliendo et al., 2009; Roach
and Sauermann, 2011), though not all studies have been conclusive, such as Cramer et
al. (2002). We confirm entrepreneurs are less risk averse, and also show they are less
ambiguity averse than non-entrepreneurs. We also confirm the finding of Brockhaus
(1980) and Mueller and Thomas (2001) that entrepreneurs have a stronger internal
locus of control. Finally our findings relate to papers linking behavioral biases to
entrepreneurship (Olson, 1986; Cooper et al., 1988, Forbes, 2005; Koellinger et al.,
2007; Burmeister and Schade 2007).
The remainder of this paper is organized as follows. Section 2 presents evidence on
the prevalence of gender differences in entrepreneurship and briefly reviews the
literature on the topic. Section 3 introduce the sample and explain our focal variables.
Section 4 presents results on gender differences and entrepreneurship, and section 5
presents results on entrepreneurship and self-employment. The paper ends with a brief
conclusion in section 6.
5

2 Evidence on the Entrepreneurship Gender Gap
Female self-employment rates have climbed somewhat in the United States and most
other developed countries during the last several decades. Nevertheless, the gender
gap in this labor-market outcome remains large and ubiquitous. Table 1 illustrates this
fact by presenting self-employment statistics from United States and 33 European
countries. We collected the figures from Eurostat, the U.S. Bureau of Labor Statistics,
and the U.S. Census Survey of Business Owners. Men are more likely than women to
be self-employed in virtually all industrialized countries. In the United States, 14% of
the male labor force is self-employed versus 8% of the female labor force.
Panel A reports the fraction of the self-employed working population. Across the
countries, the average self-employment rate is 19% for men versus 10% for women.
Hence men are twice as likely as women to be self-employed. This pattern holds for
every country we report. Panel B reports the fraction of the working population that is
self-employed and employs at least one person other than the owner. The self-
employed-with-employees measure is likely to correspond more closely (though still
far from perfectly) with entrepreneurship. The gender gap in employer firms is even
wider: across the countries, men are about three times as likely as women to be self-
employed with employees.
In the United States, whereas men are overrepresented by 70% among all self-
employed individuals, they are overrepresented by 200% among those self-employed
individuals who employ at least one external worker. In a recent Kauffman
Foundation study focusing on the gender gap in U.S. entrepreneurship, Mitchell
(2011) confirms self-employed women are underrepresented as employer firms, and
are far less likely to have sales above one million dollars per year. Other research has
6
shown that female-owned firms are on average smaller than male-owned firms
(Coleman, 2002; Robb and Wolken, 2002; Fairlie and Robb, 2009), and that female
business owners tend to be less growth oriented than their male counterparts (Orser
and Hogarth-Scott, 2002; Morris et al., 2006).
3 Data
3.1 Sample
We obtain our data from the Swedish Twin Registry, which is the largest twin
registry in the world. Beginning in early 2009, the registry sent out a detailed
survey—Screening Across the Life-span Twin (SALTY)—to 24,914 Swedish twins
born between 1943 and 1958. The sample includes monozygotic and fraternal twins.
A total of 11,743 individuals answered the survey, reflecting a response rate of 47%.
Each respondent answered a battery of detailed questions on his or her economic
preferences, such as risk and ambiguity attitudes. A team of researchers designed the
questions based on existing theoretical and empirical work in economics, psychology,
and behavioral science. The questions were not designed with the specific purpose of
studying the gender gap in self-employment and entrepreneurship. However since
many important behavioral traits were included in the survey, we are able to analyses
an unusually large number of traits which may be important for occupational choice.
To construct our final sample, we exclude 4,403 individuals who did not answer all
the survey questions that we use to create the 14 personality traits we study. Panel A
of Table 2 summarizes our sample. We study 7,331 individuals, of whom 49% are
women and 51% men.
7

Cesarini et al. (2011) merge the SALTY survey data with information from
Swedish administrative records, and make an in-depth investigation of the population
representativeness of this sample using that data. Comparing income, education, and
other similar variables with the Swedish average, they find the twin sample is
observationally representative of the Swedish population as a whole.2 This evidence
corroborates previous research, which shows twins are similar to the full population in
most important dimensions, including personality and psyche (Kendler et al., 1995;
Johnson et al., 2002). This fact enables population validity of our findings, a key
assumption of the growing economic literature that uses twins (surveyed in Cesarini et
al., 2009) to study economic behavior.
The fact that the sample consists of twins is valuable for many applications, though of
limited use for investigating the gender gap. Relating gender differences to genetics is
impossible as all monozygotic twins are of the same gender. The choice of analyzing
the twin dataset is thus not driven by particular features of twins, but rather by data
availability. The Swedish twin database is one of the largest and most detailed studies
of personality traits in existence. For this paper, the twin status makes including twin-
pair fixed effects in regressions on how personality traits relate to entrepreneurship
possible. We can thereby test whether each trait affects entrepreneurship through
genetics and childhood experiences (which twins partly share), or has other
explanations.
The dataset also has two limitations. First, our sample only includes Swedes between
the ages of 51 and 66. More problematically, we observe personality traits and
employment choices contemporaneously. Some traits may be the result, rather than
2 The twins have marginally higher average income and marriage rates, slightly lower birth weight, but no differences in educational attainment.
8

the determinant, of entrepreneurship. For example, an entrepreneurial career might
make individuals more prone to take risks. In an untabulated test, we use as
instruments the traits of twins who are not entrepreneurs, and find your siblings’
personality traits can explain your entrepreneurial behavior. This finding suggests
“treatment” is unlikely to fully account for differences in personality differences
between entrepreneurs and others. Further evidence against the “treatment”
explanation is that Cesarini et al. (2011) finds significant genetic component in
several of the personality traits we study.
3.2 Self-Employment and Entrepreneurship
Each respondent was asked a series of questions about self-employment and
business ownership. About 16% of the sample consists of proprietors, including both
entrepreneurs and the non-entrepreneurial self-employed. The figure is twice as high
for men (22%) as for women (11%).
Although self-employment is an interesting phenomenon in and of itself, it is an
increasingly questionable proxy for innovative entrepreneurship. Motivations for the
non-entrepreneurial self-employed include non-pecuniary benefits from working for
themselves (Hamilton, 2000; Hurst and Pugsley, 2010), a greater possibility of
avoiding taxes (Cullen and Gordon, 2007), regulatory barriers to employment, or the
fact that self-employment reduces agency costs (Bitler et al., 2005).
When academics and business leaders were asked to define entrepreneurship, the most
common answers were the creation and development of new ventures, followed by
innovation. By contrast, respondents did not view “the creation of a mom-and-pop
business” as entrepreneurship (Gartner 1990). As an empirical matter, the
overwhelming majority of self-employed individuals are not entrepreneurs in the
9

Schumpeterian sense, because they do not bring a new innovation to the market or
plan to grow their business. Rather, many of them are construction workers, shop
owners, taxi and truck drivers, gardeners, plumbers, fast food vendors, hairdressers,
and on the high-skilled end, are lawyers, physicians, consultants, and accountants who
have chosen a particular legal employment form in which to perform their work.
The Census Bureau’s Survey of Business Owners provides several pieces of
evidence that self-employment is not equal to entrepreneurship: First, the median
business owner who works full time has zero employees. Second, of small firms
started in 2002, 90% were either out of business or had fewer than five employees
four years later. Hurst and Pugley (2010) provide a wide range of survey evidence
suggesting the vast majority of self-employed Americans neither innovate or grow,
nor intend to innovate or grow. Though some small-scale ventures are indeed nascent
entrepreneurs who had not yet had time to grow, the large numbers of non-
entrepreneurial self-employed individuals dominate this tiny segment in the data.
The distinction between entrepreneurship and other types of self-employment has
implications for the psychological literature on entrepreneurship. Theories are
designed for the psychology of Schumpeterian entrepreneurs, but are commonly
tested using self-employment as a proxy for entrepreneurship. The traits required to
become an entrepreneur may be different than the traits required to be a self-
employed plumber or dentist. For instance, as Knight (1921) argued, innovative
businesses need to deal with uncertainty associated with bringing truly novel products
and technologies to the market. However, a self-employed plumber or dentist who
sells a familiar product does not typically need to wrestle with uncertainty about the
distribution of outcomes, for example, regarding consumer demand or the
technological feasibility of some projects. The findings in section 5 confirm that using
10

the self-employed to test Knight’s theory about entrepreneurs’ risks leading to
misleading results.
Though we cannot hope to perfectly separate the self-employed from entrepreneurs,
we attempt to remove at least those who are obviously not entrepreneurs. For this
purpose, we included in the SALTY survey a question that explicitly distinguishes
entrepreneurship from other types of self-employment:
Sometimes it is desirable to differentiate between being an entrepreneur and being
self-employed. An entrepreneur commercializes a new innovation or idea. An
entrepreneur has, or plans to have, a number of employees and strives to expand the
business. A self-employed person owns and runs his/her own company, for instance
a restaurant or a law firm, where he/she works. A self-employed person normally
does not strive to expand over a certain limit and has 0 or a few employees. Would
you say that you are primarily an entrepreneur or a self-employed person?
Using this question to identify entrepreneurs, we find the gender difference in
entrepreneurship is much stronger than in self-employment. As Panel A of Table 2
reports, we find close to five times as many male entrepreneurs (9%) than female ones
(2%). Men are 4.9 times more likely to be entrepreneurs than women, but merely 1.6
times more likely to be self-employed.
One objection to our measure of entrepreneurship is that it is self-reported. Some
individuals might state in the survey that they want to expand their company, not
because they are true entrepreneurs, but rather because they are overly optimistic or
like to boast. If men were more prone than women to such misreporting, this
possibility could be one explanation for the observed gender difference in
entrepreneurship. There is some evidence that contradicts this explanation: the
11

compensation premium for entrepreneurship (which is positive) is significantly higher
for men than for women. If men were more biased toward over-claiming
entrepreneurial status, one would expect them to have a lower compensation premium
than women. Compensation data come from Swedish administrative records from
1996-2000 and includes wage labor, income from own business, pension income and
unemployment compensation. The compensation premium to entrepreneurship —
measured using twin-fixed effects — is SEK 54K for men and SEK 20K for women.
The average earning in the sample is SEK 290K3.
3.3 Personality Traits
We capture four traits that measure the individual’s attitude toward various types of
risk and the timing of payoffs, respectively. We infer the trait Risk Aversion from
hypothetical choice questions about the individual’s willingness to substitute safer
future income for riskier, higher future income. We measure risk aversion using a
series of questions that are experimentally validated and shown to be predictive of
real-life risk-taking behavior (Dohmen et al., 2011). Another trait is Loss Aversion,
which refers to the documented tendency to prefer avoiding losses to acquiring gains
(Kahneman and Tversky, 1992). We also infer Ambiguity Aversion from a
hypothetical choice question that builds on the classic Ellsberg (1961) paradox.
Whereas Risk Aversion refers to the preference for certain outcomes over uncertain
outcomes, Ambiguity Aversion refers to the preference for known risks over unknown
risks. Studying the cross-correlation matrix, we find Risk Aversion and Loss Aversion
have a positive correlation of 0.14, but Ambiguity Aversion is uncorrelated with these
traits. Finally, we use another set of hypothetical choice questions to infer Time
3 Interestingly, the compensation premium for non-entrepreneurial self-employment is negative, again relying on twin-fixed effects.
12
Preference, a trait that captures the strength of the individual’s preference for
receiving payoffs later versus earlier.
We identify five traits that capture, each in its own unique way, how much the
individual resembles the profit-making decision-maker envisioned by economics. We
measure the individual’s cognitive ability with respect to numerical calculations,
which we label Numeracy.4 5 We also capture whether the individual suffers from
Illusion of Control, that is, whether the individual has the irrational belief that he/she
can influence a lottery outcome that—by design—is outside his/her control. We
measure Fungibility of Money using hypothetical choice questions based on Tversky
and Kahneman (1981). The basic idea of these questions is to identify individuals who
view money as having intrinsic value beyond the actual consumption value. As a
related trait, we measure whether the individual values something based on its
purchase price or on its current market value. We call this trait Opportunity-Cost
Awareness. Finally, we measure the extent to which the individual is willing to accept
outcomes resulting from market economic forces, but that may be viewed as socially
unjust. We call this trait Greed Tolerance. The questions measuring this trait are based on
Kahneman et al (1986).
We identify three traits that, in a broad sense, capture the individual’s view of
himself and others. We ask individuals if they feel they could trust others, a trait we
label Trust in Others. The trait Locus of Control measures to how strongly the
individual believes one’s own efforts—rather than fate and luck—matter for life
outcomes. We use a survey with 14 questions to measure this trait. With the exception
of risk preferences, Locus of Control is the personality trait the literature has most
4 In an unreported analysis, we find that for men, this trait has a significantly positive correlation with the score on the Swedish Military's standardized intelligence test. 5 Cesarini et al, 2011, denotes this trait "the representativeness heuristic".
13
strongly linked with entrepreneurship. We also identify the individual’s attitude
toward civic engagements, and label this trait Civic Mindedness. A high Civic
Mindedness means the individual is willing to donate blood and organs (in the case of
death), and to contribute time and money to non-profit civic activities. Note we
measure Civic Mindedness based on the individual’s actions rather than his/her
beliefs or stated preferences. For this reason, a treatment effect from being an
entrepreneur may influence this trait.
Finally, we identify two traits that capture the individual’s behavioral inhibition and
happiness, respectively. We measure Lack of Behavioral Inhibition, which shares
some similarity with extroversion, through a series of questions about how actively
the individual interacts with other people. We measure Happiness using a
straightforward question about how happy the individual would describe him/herself
to be. Happiness is often found to be correlated with optimism, an important
entrepreneurial trait that we unfortunately do not measure.
4 Results
We next study whether and how gender differences in psyche explain gender
differences in entrepreneurship. We conduct this investigation in three steps. First, we
analyze which personality traits differ between women and men. Second, we analyze
which traits differ between entrepreneurs and non-entrepreneurs. Third, we combine
these two analyses and make inferences about (i) the aggregate effect of all traits on
the gender difference in entrepreneurship and (ii) which traits contribute to this effect.
4.1 Gender and Psyche
14

To relate personality traits to gender, we run a probit regression in which the
dependent variable is Female Gender, that is, is 1 if the individual is a woman, and is
0 if the individual is a man. We include fixed effects for the individual’s age, and
cluster residuals by twin pair (regressions without such clustering yield qualitatively
similar results). We also include the 14 personality traits. Table 3 presents the results.
Consistent with the prior literature, we document that women are more risk and loss
averse. Similar to Borghans et al. (2009), we find the opposite is true for ambiguity
aversion: women are less ambiguity averse than men. Women score lower on
numeracy, have more control illusion, but believe more in the fungibility of money.
Women also have less tolerance for greed, more trust in others, and have a weaker
internal locus of control and a less favorable attitude toward civic engagements.
Finally, women are more behaviorally inhibited than men. Overall, we find
statistically significant differences for 11 of the 14 personality traits.
A series of unreported robustness tests confirms this conclusion. In a first set of
tests, we run separate regressions for each personality trait. We find that all traits,
except behavioral inhibition, that are significant in Specification 1 of Table 3 remain
significant. In a second set of tests, we replicate Specification 1 but add additional
control variables. The control variables are Years Education (Specification 1), Annual
Income (Specification 2), Married Dummy (Specification 3), and Number of Children
(Specification 4). The addition of these control variables does not appear to
substantially influence the magnitude of the coefficients for the personality traits,
which that differences in education, income, or family characteristics do not explain
the results.
4.2 Entrepreneurship and Psychological traits
15

We next relate personality traits to the likelihood of being an entrepreneur. We run
probit regressions in which the dependent variable is 1 if the individual is an
entrepreneur, and is 0 otherwise. We include fixed effects for the individual’s age, and
cluster residuals by twin pair (regressions without such clustering yield qualitatively
similar results).
Table 4 presents the results. Specification 1 includes as an independent variable only
the Female Gender dummy, and Specifications 2 and 3 add the 14 personality traits.
We first turn our attention to the coefficients on the traits reported in Specification 2.
A positive coefficient means an entrepreneur is more likely to possess a certain trait.
We find that entrepreneurs are less risk and ambiguity averse. These traits are both
related to uncertainty; however, ambiguity aversion is conceptually and empirically
distinct from risk aversion. Our finding that these traits are different for entrepreneurs
is consistent with entrepreneurial work tasks being uncertain in both execution and
outcome. Although the linkage between entrepreneurship and risk aversion is well
documented (Kihlstrom and Laffont, 1979; Rees and Shah, 1986; Stewart et al., 1999;
Van Praag and Cramer, 2001, Caliendo et al., 2009), we are the first to use a large-
scale dataset to show the linkage between entrepreneurship and ambiguity aversion.
We further show that entrepreneurs are more aware of opportunity cost and more
tolerant of greed. These results are intuitive, because a person launching an innovative
firm requires the ability to make cogent business decisions. Finally, we show that
entrepreneurs have a stronger internal locus of control and a more favorable attitude
toward civic engagement, and are less behaviorally inhibited and happier. Our results
on locus of control corroborate the findings of existing studies (Brockhaus, 1980;
Mueller and Thomas, 2001). Overall, these traits are consistent with the view that
entrepreneurship requires an outgoing, “salesman” personality type.
16

We conduct a series of unreported robustness tests to validate our results. In a first
set of tests, we run separate regressions for each personality trait. We find that all
coefficients that are significant in Specification 2 of Table 4 remain significant. In a
second set of robustness tests, we replicate Specification 2 of Table 4 but also include
an additional control variable. The control variables are Years Education
(Specification 1), Annual Income (Specification 2), Married Dummy (Specification
3), and Number of Children (Specification 4). We find that neither control has any
substantive effect on the magnitude of Female-Dummy or on the personality-trait
variables. From this result, we infer the above results are robust in the sense that
differences in education, income, or family do not explain them.
4.3 The Effect of Gender Differences in Psyche on Entrepreneurship
We next compute the aggregate effect of the gender differences in personality traits
on the likelihood of being an entrepreneur. We compare the coefficient on the Female
Gender dummy in Specification 1, which excludes all traits, to the same coefficient in
Specification 2 of Table 4, which includes all traits. We find the inclusion of traits
reduces the coefficient estimate from 6.9 percentage points to 5.5 percentage points.
In Specification 2, instead of measuring personality traits using dummies, we use
fixed effects to capture each unique coding based on the full range of survey
responses. For example, we now include 20 dummies for the Trust in Others trait,
because we posed two trust-related questions, and each had a possible answer from 1
(least trusting) to 10 (most trusting). Specification 3 shows results, with only the
coefficient on Female Gender reported for brevity. We find the coefficient on Female
Gender is 4.7 percentage points, which reflects a 32% decline from Specification 1
without any personality trait variables. We conclude from all these tests that gender
17
differences in psyche can explain around one third of the gender differences in
entrepreneurship.
We conduct an unreported robustness test of the importance of gender differences
in traits in explaining the gender gap in entrepreneurship. We here follow the
technique of decomposing inter-group differences in mean levels of an outcome into
those due to different observable characteristics across groups and those due to
different effects of the impact of these characteristics between groups. The technique
is commonly attributed to Oaxaca (1973) and Blinder (1973), and we use the
particular refinement developed by Fairlie (2005) that allows for a binary dependent
variable. We confirm with this technique that gender differences in traits can explain
about one third of the gender gap in entrepreneurship. The decomposition analysis
demonstrates risk aversion is the most important contributor, followed by greed
tolerance, behavioral inhibition, and trust in others.
We next analyze which particular traits contribute to this effect of gender
differences in psyche on entrepreneurship. We compare the results from Table 3 with
Specification 2 of Table 4. We find that six personality traits—risk aversion,
ambiguity aversion, greed tolerance, locus of control, civic mindedness, and
behavioral inhibition—are significantly different for both women and entrepreneurs.
Hence five gender differences in psyche do not have any significant effect on gender
differences in entrepreneurship, because these traits are not more (or less) prevalent
for entrepreneurs. Also, two gender differences for entrepreneurs do not have any
significant effect on gender differences in entrepreneurship, because these traits are
not more (or less) prevalent for women. This finding is one reason we find a relatively
modest aggregate effect of the gender differences in psyche on the likelihood of being
an entrepreneur.
18
Another reason is that gender differences in traits do not uniformly reduce the
likelihood of a woman being an entrepreneur. On the one hand, women are less likely
to be entrepreneurs because they are more risk averse, have a weaker internal locus of
control, have a stronger sense of fairness, and are less positive toward civic
engagements. On the other hand, women are more likely to be entrepreneurs, because
they are less ambiguity averse and less behaviorally inhibited. The existence of such
opposite effects means researchers studying only a small subset of personality traits
could come to the wrong conclusion about gender differences in entrepreneurship.
4.4 Gender Differences in Importance of Psyche for Entrepreneurship
In this section we ask if the psychological traits have similar effects on occupational
choice in men and women by extending our baseline specification to allow for
interactions between the psychological characteristics and gender. For example,
women may not only be generally less risk averse than their male counterparts (as our
findings show), but this difference could be particularly large for those women who
are entrepreneurs. To test this possibility, we create 14 new variables that interact
Female Gender with each personality trait. We then replicate Specification 2 of Table
4 but also include these interactions as independent variables. If the hurdle were
different for women, we would expect to find several significant coefficients on the
interaction variables.
Table 5 presents results on the interaction variables, with other independent
variables left unreported for brevity. With a couple of weakly significant coefficients
(Fungibility of Money and Opportunity-Cost Awareness), the impact of a trait on
entrepreneurship is about the same for men as for women.
19

5 Results on Self-employment and Psyche
5.1 Non-entrepreneurial Self-employment and Psyche
We conclude our empirical analysis by investigating whether non-entrepreneurial
self-employed individuals differ from other individuals in the same way entrepreneurs
do. We replicate the analyses of Table 4 but exclude entrepreneurs from the sample
and use a dependent variable that is 1 if the individual is non-entrepreneurial self-
employed, and is 0 otherwise. Table 6 presents the results. In Specification 2, which
includes the personality traits, we find that with one exception—risk aversion—the
traits common among entrepreneurs are not common for non-entrepreneurial self-
employed individuals.
Moreover, we find that non-entrepreneurial self-employed individuals differ from
others along several traits for which no difference exists between entrepreneurs and
others. Non-entrepreneurial self-employed individuals have lower time-discount rates,
lower control illusion, higher fungibility of money, and less trust in others. These
patterns suggest the psychological determinants of entrepreneurship and other types of
self-employment differ from each other. These findings highlight that researchers who
want to study entrepreneurship must distinguish this phenomenon from other types of
self-employment. This separation is important in practice, because a sample of the
self-employed typically includes more non-entrepreneurial self-employed people
(twice as many in our dataset). Most established datasets do not separately identify
entrepreneurs, making it difficult to draw reliable conclusions on entrepreneurship.
5.2 The Effects of Gender Differences in Psyche on Non-entrepreneurial Self-
employment
20

Table 6 also provides evidence on the extent to which personality traits can explain
gender differences in non-entrepreneurial self-employment. Comparing the coefficient
on the Female Gender dummy across Specifications 1–3, we find the inclusion of the
14 personality traits reduces the gender difference from 5.5 percentage points to 5.0
percentage points. Interestingly, this decline of about 9% is considerably lower than
the corresponding 32% decline we found for entrepreneurs. This difference suggests
gender differences in psyche are a much more important factor for entrepreneurship
than for other types of self-employment, another manifestation that the two
phenomena are distinct.
6 Conclusion
We study the extent to which gender differences in psyche can explain gender
difference in entrepreneurship. We find women differ significantly from men in most
studied traits (11 out of 14 traits are significant). Moreover, we find entrepreneurs
have different psyches than others (8 out of 14 traits are significant). Entrepreneurs
are less risk averse, less ambiguity averse, more aware of opportunity costs, more
tolerant of greed, have a stronger internal locus of control, are more favorable toward
civic engagements, and are less behaviorally inhibited. We find that gender
differences in psyche explain around one third of the gender gap in entrepreneurship.
Our finding that most distinct psychological traits found among entrepreneurs cannot
be identified among the non-entrepreneurial self-employed is both relevant for the
gender gap and interesting on its own. Personality traits can explain much less of the
gender difference in non-entrepreneurial self-employment than it can for the gender
difference in entrepreneurship.
21

A natural question to ask is what explains the gender difference in
entrepreneurship that the 14 personality traits we study cannot explain. One
explanation is that measurement error could be present in the way we measure the
traits (Beauchamp et. al., 2011). Measurement errors in traits where men are more
entrepreneurial would bias the estimate of the share of the gap explained by
personality downward, whereas measurement error in traits where women are more
entrepreneurial would bias it upward. A related explanation is that the set of
personality traits we study is incomplete. One trait our analysis excludes is over-
optimism (Puri and Robinson, 2006), although we likely capture it in part with our
happiness and locus-of-control traits, which are associated with over-optimism.
Another excluded trait is the willingness to compete, but measuring this trait outside
laboratory experiments is difficult (see Gneezy, Niederle, and Rustichini, 2003).
Bönte and Piegeler (2012) find that differences in stated preferences for competitive
situations contribute to the gender gap in self-employment. Finally, our survey data do
not ask questions about the fear of failure or confidence in their entrepreneurial skills,
which Koellinger, Minnitti, and Schade (2011) find can explain part of the gender gap
in entrepreneurship.
Likely, the most important explanation is that non-psychological factors play a
dominant role in the gender difference in entrepreneurship. An exploration of the
importance of such factors is beyond the scope of our paper and the limits of our
dataset, but we note that previous research suggests various possibilities. One strand
of the literature emphasizes gender discrimination in product and credit markets (e.g.,
Borjas and Bronars, 1989; Muravyev et al., 2009). Female business owners tend to
work fewer hours, likely because of greater family responsibilities (Sanandaji and
Wallen, 2009). They also have less capital and are less likely to have prior experience
22

in industry or in managerial roles compared to men (Carter et al., 1997; Boden and
Nucci, 2000; Fairlie and Robb, 2009). Prior research also documents that women are
less likely to have degrees in business or technical fields, fields of study associated
with entrepreneurship (Menzies et al., 2004). Another possibility is that parents make
gender-based choices on how to transmit human capital to their children. Robinson
(2011) shows such transmission could be an important factor driving self-employment
choices. Choice of industry also seems to be important. Du Rietz and Henrekson
(2000) show that women entrepreneurs tend to be active in industries in which
expansion is generally more difficult, in part accounting for the lower growth rate for
firms headed by women. Finally, social norms, the lack of role models, and cultural
factors—as emphasized by the sociological and feminist literatures—may contribute
to the gender difference in entrepreneurship.
We conclude that although personality traits are highly correlated with
entrepreneurship, gender differences along these traits cannot fully explain why the
existence of a large gender gap in entrepreneurship. One must take into account
external factors, such as the education system, the labor market, traditional household
division of labor, the role of the public sector, discrimination, or social norms, to
explain why women are underrepresented as entrepreneurs.
23
References Acs, Zoltan, and David Audretsch, 1988, "Innovation in Large and Small Firms: An
Empirical Analysis, " American Economic Review, 78, 678–90.
Begley, Thomas, and David Boyd, 1987, "Psychological Characteristics Associated with Performance in Entrepreneurial Firms and Smaller Businesses", Journal of Business Venturing, 21, 79–93.
Bertrand, Marianne, and Kevin Hallock, 2001, "The Gender Gap in Top Corporate Jobs", Industrial and Labor Relations Review, 55, 3–21.
Beauchamp, Jonathan, David Cesarini, and Magnus Johannesson, 2011, "The Psychometric Properties of Measures of Economic Risk Preferences", Working Paper
Bitler, Marianne, Tobias Moskowitz, and Annette Vissing-Jørgensen, 2005, "Testing Agency Theory with Entrepreneur Effort and Wealth", Journal of Finance, 602, 539–576, 04.
Blinder, Alan, 1973, "Wage Discrimination: Reduced Form and Structural Estimates", Journal of Human Resources, 8, 436–455.
Borghans, Lex, Bart Golsteyn, James Heckman and Huub Meijers, 2009. "Gender Differences in Risk Aversion and Ambiguity Aversion," Journal of the European Economic Association 7, 649-658
Boden, Richard, and Alfred Nucci, 2000, "On the Survival Prospects of Men’s and Women’s New Business Ventures", Journal of Business Venturing, 15, 347–362.
Borjas, George, and Stephen Bronars, 1989, "Consumer Discrimination and Self-employment", Journal of Political Economy, 97, 581–605.
Bönte, Werner and Monica Piegeler, 2012, "The Gender Gap in Latent and Nascent Entrepreneurship: Driven by Competitiveness", Small Business Economics 1–27
Brockhaus, Robert, 1980, "Risk Taking Propensity of Entrepreneurs", Academy of Management Journal, 23, 509–520.
Burmeister, Katrin, and Christian Schade, 2007, "Are Entrepreneurs’ Decisions More Biased? An Experimental Investigation of the Susceptibility to Status Quo Bias", Journal of Business Venturing, 22, 340–362.
Caliendo, Marco, Frank Fossen, and Alexander Kritikos, 2009, "Risk Attitudes of Nascent Entrepreneurs - New Evidence from an Experimentally Validated Survey", Small Business Economics, 32,153–167.
Carter, Nancy, Marcy Williams, and Paul Reynolds, 1997, "Discontinuance Among New Firms in Retail: the Influence of Initial Resources Strategy and Gender", Journal of Business Venturing, 12, 125–145.
Carree, Martin, and Roy Thurik. 2003, "The Impact of Entrepreneurship on Economic Growth", in Handbook of Entrepreneurship Research, David Audretsch and Zoltan Acs eds, Kluwer Academic Publishers, Boston/Dordrecht: 437–471.
24
Cesarini, David, Christopher Dawes, Magnus Johannesson, Paul Lichtenstein, and Björn Wallace, 2009, "Genetic Variation in Preferences for Giving and Risk-Taking", Quarterly Journal of Economics, 124, 809–842.
Cesarini, David, Magnus Johannesson, Patrik Magnusson and Björn Wallace, 2011,"The Behavioral Genetics of Behavioral Anomalies", Management Science, 1–14.
Coleman, Susan, 2002, "Constraints faced by women small business owners: Evidence from the Data", Journal of Developmental Entrepreneurship, 7, 151–174.
Cooper, Arnold, Carolyn Woo, and Willian Dunkelberg ,1988, "Entrepreneurs’ Perceived Chances for Success", Journal of Business Venturing, 3, 97–108.
Cramer, Jan Salomon, Jopp Hartog, Nicole Jonker, and Mirjam Van Praag, 2002, "Low Risk Aversion Encourages the Choice for Entrepreneurship: an Empirical Test of a Truism", Journal of Economic Behavior & Organization, 48, 29–36.
Croson, Rachel, and Uri Gneezy, 2009. "Gender Differences in Preferences", Journal of Economic Literature, 47, 448–474.
Cullen, Julie, and Roger Gordon, 2007, "Taxes and Entrepreneurial Risk-taking: Theory and Evidence for the U.S", Journal of Public Economics, 9, 1479–1505.
Dohmen, Thomas, Armin Falk, David Huffman, Uwe Sunde, Jürgen Schupp, and Gert Wagner, 2011, "Individual Risk Attitudes: Measurement, Determinants and Behavioral Consequences", Journal of the European Economic Association, 9, 522–550.
Du Rietz, Anita, and Magnus Henrekson, 2000, "Testing the Female Underperformance Hypothesis”, Small Business Economics, 14, 1–10.
Ellsberg, Daniel, 1961, "Risk, Ambiguity, and The Savage Axioms", Quarterly Journal of Economics, 75, 643–669.
Fairlie, Robert, 2005, "An extension of the Blinder-Oaxaca Decomposition Technique to Logit and Probit Models", Journal of Economic and Social Measurement, 30, 305–16.
Fairlie, Robert, and Alicia Robb, 2009, "Gender Differences in Business Performance: Evidence from the Characteristics of Business Owners Survey", Small Business Economics, 33, 379–395.
Forbes, Daniek, 2005, "Are Some Entrepreneurs More Overconfident than Others? ", Journal of Business Venturing, 20, 623–640.
Fox, Craig, and Amos Tversky, 1995, "Ambiguity Aversion and Comparative Ignorance", The Quarterly Journal of Economics, 110, 585–603.
Gartner, William, 1990, "What Are We Talking About When We Talk About Entrepreneurship?", Journal of Business Venturing, 5, 15–28.
Gneezy Uri, Muriel Niederle, and Aldo Rustichini, 2003, "Performance In Competitive Environments: Gender Differences", The Quarterly Journal of Economics, 118, 1049–1074.
25

Hamilton Barton, 2000, "Does Entrepreneurship Pay? An Empirical Analysis of the Returns to Self-Employment", Journal of Political Economy, 108, 604–631.
Holm, Jerger, Sonja Opper and Victor Nee, "Entrepreneurs under Uncertainty: An Economic Experiment in China. Management Science", Management Science, Forthcoming.
Hurst, Erik and Benjamin Pugsley, 2010, "Non Pecuniary Benefits of Small Business Ownership", Working Paper
Jennings, Jennifer and Candida Brush, 2013, "Research on Women Entrepreneurs" The Academy of Management Annals, 7, 661–713,
Johnson, Wendy, Robert Krueger, Thomas Bouchard, and Matt McGue, 2002, "The Personalities of Twins: Just Ordinary Folks", Twin Research, 5, 125–131.
Kahneman, Daniel, Jack Knetsch, and Richard Thaler, 1986, "Fairness as a Constraint on Profit Seeking: Entitlements in the Market", American Economic Review, 76, 728–741.
Kendler, Kenneth, Nicholas Martin, Andrew Heath, and Lyndon Eaves, 1995, Self-report Psychiatric Symptoms in Twins and their Nontwin Relatives: Are Twins Different? ", American Journal of Medical Genetics, 60, 588–591.
Kihlstrom, Robert, and Jean-Jacques Laffont, 1979, "A General Equilibrium Entrepreneurship Theory of the Firm Based on Risk Aversion", Journal of Political Economy, 87, 719–48.
Klibanoff Peter, Massimo Marinacci, and Sujoy Mukerji, 2005, "A Smooth Model of Decision Making under Ambiguity", Econometrica, 73, 1849–1892.
Knight, Frank, 1921, Risk, Uncertainty and Profit. New York: Houghton Mifflin.
Koellinger, Philipp, Maria Minniti, Christian Schade, 2007, "I Think I Can, I Think I Can": Overconfidence and Entrepreneurial Behavior", Journal of Economic Psychology, 28, 502–527.
Koellinger, Philipp, Maria Minniti, Christian Schade, 2011, "Gender Differences in Entrepreneurial Propensity”, Oxford Bulletin of Economics and Statistics, Forthcoming
Kortum, Samuel, and Josh Lerner, 2000, "Assessing The Contribution Of Venture Capital To Innovation", Rand Journal of Economics, 31, 674–692.
Menzies, Teresa, Monica Diochon, and Yvon Gasse. 2004, "Examining Venture-related Myths Concerning Women Entrepreneurs", Journal of Developmental Entrepreneurship, 9, 89–107.
Mitchell, Lesa (2011) "Overcoming the Gender Gap: Women Entrepreneurs as Economic Drivers", Kauffman Foundation report
Morris, Michael, Nola Miyasaki, Craig Watters, and Susan Coombes, 2006, "The Dilemma of Growth: Understanding Venture Size Choices of Women Entrepreneurs", Journal of Small Business Management, 44, 221–244.
26
Mueller, Stephen, and Anisya Thomas, 2001, "Culture and Entrepreneurial Potential: A Nine Country Study of Locus of Control and Innovativeness", Journal of Business Venturing, 16, 51–75.
Muravyev, Alexander, Oleksandr Talavera, and Dorothea Schaefer, 2009, "Entrepreneurs' Gender and Financial Constraints: Evidence from International Data", Journal of Comparative Economics, 37, 270–286.
Niederle, Muriel, and Lise Vesterlund, 2007, "Do Women Shy Away From Competition? Do Men Compete Too Much? ", Quarterly Journal of Economics, 1067–1101.
Oaxaca, Ronald, 1973, "Male-female Wage Differentials in Urban Labor Markets", International Economic Review, 14, 693–709.
Olson, Phillip, 1986, "Entrepreneurs: Opportunistic Decision Makers", Journal of Small Business Management 24, 29–35.
Orser, Barbara, and Sandra Hogarth-Scott, 2002, "Opting for Growth: Gender Dimensions of Choosing Enterprise Development", Canadian Journal of Administrative Sciences, 19, 284–300.
Puri, Manju and David Robinson, 2006, "Who are Entrepreneurs and Why Do They Behave that Way?" Working Paper
Roach, Michael and Henry Sauermann, 2011, "Who Wants to Be a Founder, and Who Wants to Join One? Exploring the Entrepreneurial Types of Scientists and Engineers", Working Paper
Rees, Hedley, and Anup Shah, 1986, "An Empirical Analysis of Self-employment in the U.K", Journal of Applied Econometrics, 1, 95–108.
Robb, Alicia, and John Wolken, 2002, "Firm, Owner, and Financing Characteristics: Differences between Female- and Male-owned Small Businesses", Finance and Economics Discussion Series 2002–18,
Sanandaji, Tino, and Fabian Wallen, 2009. "Allocation of Time and Leisure in Europe and the U.S", Mimeo, Confederation of Swedish Enterprise, Stockholm.
Shane, Scott, 2003, A General Theory of Entrepreneurship: The Individual-opportunity Nexus, Edward Elgar, Northampton, MA.
Schumpeter, Joseph, 1934, The Theory of Economic Development: An Inquiry into Profits, Capital, Credit, Interest and the Business Cycle. London: Oxford University Press.
Stewart, Wayne, Warren Watson, James Carland, and Joan Carland, 1999, "A Proclivity for Entrepreneurship: A Comparison of Entrepreneurs, Small Business Owners, and Corporate Managers", Journal of Business Venturing, 14, 189–214.
Tversky, Amos, and Daniel Kahneman, 1992, "Advances in Prospect Theory: Cumulative Representation of Uncertainty", Journal of Risk and Uncertainty, 5, 297–323.
27

Van Praag, Mirjam, and Jan Cramer, 2001, "The Roots of Entrepreneurship and Labour Demand: Individual Ability and Low Risk Aversion", Economica, 68, 45–62.
Van Praag, Mirjam, and Peter Versloot, 2007, "What is the value of entrepreneurship? A review of recent research", Small Business Economics, 29, 351–382.
Verheul, Ingrid, Roy Thurik, Isabel Grilo, and Peter van der Zwan, 2011, "Explaining Preferences and Actual Involvement in Self-employment: Gender and the Entrepreneurial Personality", Journal of Economic Psychology, forthcoming.
Wagner, Joachim, 2007, "What a Difference a Y makes—Female and Male Nascent Entrepreneurs in Germany", Small Business Economics, 28, 1–21.
Zhang, Zhen, Michael Zyphur, Jayanth Narayanan, Richard Arvey, Sankalp Chaturvedi, Bruce Avolio, Paul Lichtenstein, and Gerry Larsson, 2009, "The Genetic Basis of Entrepreneurship: Effects of Gender and Personality", Organizational Behavior and Human Decision Processes, 110, 93–107.
28

Appendix A: Survey Questions for Each Psychological Trait Below we list the questions used to measure each psychological trait. These questions have been translated from Swedish. 1 SEK is approximately 1/7 USD (September 2011). Please note the order of questions does not always correspond to the order in which we asked these questions in the SALTY survey.
A.1 RISK AVERSION 1. Imagine the following hypothetical situation. You are the sole provider of your household and you have the choice between two equally good jobs: Job A will with certainty give you SEK 25,000 per month after taxes for the rest of your life. Job B will give you a 50-50 chance of SEK 50,000 per month after taxes for the rest of your life, and a 50-50 chance of SEK 20,000 per month after taxes for the rest of your life. Which job do you choose?
• Job A • Job B
2. Imagine the following hypothetical situation. You are the sole provider of your household and you have the choice between two equally good jobs: Job A will with certainty give you SEK 25,000 per month after taxes for the rest of your life. Job B will give you a 50-50 chance of SEK 50,000 per month after taxes for the rest of your life, and a 50-50 chance of SEK 22,000 per month after taxes for the rest of your life. Which job do you choose?
• Job A • Job B
3. Imagine the following hypothetical situation. You are the sole provider of your household and you have the choice between two equally good jobs: Job A will with certainty give you SEK 25,000 per month after taxes for the rest of your life. Job B will give you a 50-50 chance of SEK 50,000 per month after taxes for the rest of your life, and a 50-50 chance of SEK 17,000 per month after taxes for the rest of your life. Which job do you choose?
• Job A • Job B
A.2 LOSS AVERSION 1. Imagine that you could participate in a lottery where you can toss a coin to determine if you will win SEK 2000 (heads in the toin toss) or lose SEK 1000 (tails in the coin toss). Would you choose to participate in the lottery?
• Yes • No
2. Imagine that you could participate in a lottery where you can toss a coin to determine if you will win SEK 1500 (heads in the coin toss) or lose SEK 1000 (tails in the coin toss). Would you choose to participate in the lottery?
• Yes
29

• No
3. Imagine that you could participate in a lottery where you can toss a coin to determine if you will win SEK 2500 (heads in the coin toss) or lose SEK 1000 (tails in the coin toss). Would you choose to participate in the lottery?
• Yes • No
A.3 AMBIGUITY AVERSION 1. Imagine that there is an urn with 30 red balls and 60 other balls that are either black or yellow. The number of balls of each color is determined in advance, but you do not know the exact number of balls that are black or yellow, just that the total number is 60. The balls are well mixed so that every ball has the same chance of being drawn. Imagine that you could draw one ball from this urn and that you can choose between three different lotteries. Which lottery would you choose?
• Lottery A: You receive SEK 900 if a red ball is drawn • Lottery B: You receive SEK 1000 if a black ball is drawn • Lottery C: You receive SEK 1000 if a yellow ball is drawn
A.4 TIME PREFERENCE 1. Imagine that you can choose between receiving a sum of money today, or to wait and receive a larger sum in one week. Which would you choose?
• SEK 5000 today • SEK 6000 in a week
2. Imagine that you can choose between receiving a sum of money today, or to wait and receive a larger sum in one week. Which would you choose?
• SEK 5000 today • SEK 7000 in a week
3. Imagine that you can choose between receiving a sum of money today, or to wait and receive a larger sum in one week. Which would you choose?
• SEK 5000 today • SEK 5500 in a week
A.5 NUMERACY 1. Linda is 31 years old, single, outspoken, and very talented. She has a university degree in philosophy. As a student, she was very involved in discrimination and social justice issues. She also participated in several anti-nuclear demonstrations. Which of the following alternatives is the most likely?
• A: Linda works in a bank • B: Linda works in a bank and is active in the feminist movement
30

• Alternative A • Alternative B
2. Kalle is attractive, athletic, drives a Mercedes, and has a very attractive girlfriend. Which of the following alternatives is the most likely?
• A: Kalle is a professional tennis player • B: Kalle works as a nurse • Alternative A • Alternative B
3. There are two hospitals in a city. In the big hospital, 45 children are born every day, and in the small hospital, 15 children are born every day. On average 50% of the children born are boys, but it varies from day to day. In which hospital do you think that it is most likely that more than 60% of the children born are boys in a specific day?
• The big hospital • The small hospital
4. Imagine that you toss a coin 8 times. Which of the following two outcomes is the most likely?
• A: Head, Head, Tail, Head, Tail, Tail, Head, Head • B: Tail, Head, Tail, Head, Tail, Head, Tail, Head • Alternative A • Alternative B • Both are equally likely
A.6 ILLUSION OF CONTROL 1. Imagine that you could participate in one of the two lotteries below, where the chance of winning is the same.
• Lottery 1: You are allocated a lottery ticket and every one in a thousand of the participants will win SEK 10000
• Lottery 2: You can pick a lottery ticket yourself and every one in a thousand of the participants will win SEK 9000
Which of these two lotteries would you choose?
• Lottery 1 • Lottery 2
A.7 FUNGIBILITY OF MONEY
31
1. Imagine that you have decided to watch a play that costs SEK 100. When you enter the theatre to buy the ticket, you discover that you have lost a SEK 100 bill. Will you still pay SEK 100 to watch the play?
• Yes • No
2. Now imagine that you have decided to watch a play and that you have already bought a ticket for SEK 100. When you enter the theatre, you discover that you have lost the ticket. It is impossible to get a refund for the lost ticket. Would you buy a new ticket for SEK 100?
• Yes • No
A.8 OPPORTUNITY-COST AWARENESS 1. Imagine that a year ago you bought a box of rare wine for the price of SEK 250 per bottle. At the latest auction in Stockholm, this same wine was sold for SEK 750 per bottle. Which of the following alternatives is the best description of your cost of drinking a bottle of the wine?
• SEK 0 • SEK 250 • SEK 250 + interest • SEK 750
A.9 GREED TOLERANCE 1. A hardware store has been selling snow shovels for SEK 150. The morning after a large snowstorm, the store raises the price to SEK 200. How fair do you think that is?
• Completely fair • Acceptable • Unfair • Very unfair
2. A company is making a small profit. However, due to a recession, unemployment is high and it is easy to hire people. The company therefore decides to decrease wages and salaries by 10 for all its employees. How fair do you think that is?
• Completely fair • Acceptable • Unfair • Very unfair
3. A small factory is making kitchen tables. Because of changes in the price of materials, the cost of making each table has decreased by SEK 200. But the factory does not lower its price for the tables. How fair do you think that is?
32

• Completely fair • Acceptable • Unfair • Very unfair
A.10 TRUST IN OTHERS 1. Generally speaking, would you say that most people can be trusted or that you need to be very careful in dealing with people? Please tick on the scale below, where the value 0 means “need to be very careful” and the value 10 means “most people can be trusted.”
• Need to be very careful (0)— Most people can be trusted (10)
2. Do you think that most people would try to take advantage of you if given the opportunity, or do you think that most people would treat you correctly? Please tick on the scale below, where the value 0 means “would take advantage of me” and the value 10 means “would treat me correctly.”
• Would take advantage of me (0)—Would treat me correctly (10)
A.11 LOCUS OF CONTROL Choose the most appropriate between the following paired sentences:
1.
• Difficulties in life depend partly on bad luck. • Difficulties in life depend on mistakes that people make.
2.
• An important reason there are wars is that people are not sufficiently interested in politics.
• Wars will always exist regardless of people’s efforts to prevent them.
3.
• In the long run, people get the respect they deserve. • Unfortunately, a person may not realize his/her value regardless of how hard he/she
tries.
4.
• The idea that teachers may be unfair to students is absurd. • Most students do not realize the extent to which their grades are affected by luck.
5.
• Without luck, one cannot become an effective leader. • Capable people who fail to become leaders have not exploited the possibilities given
to them.
33

6.
• Regardless of how hard someone tries, there are always some people who dislike you. • People who are not liked do not understand how to interact with others.
7.
• Destiny determines what happens in life. • Trusting destiny has never worked as well for me as making decisions based on a
plan of action.
8.
• To succeed is a function of hard work and has little or nothing to do with luck. • To get a good job, one needs to be at the right place at the right time.
9.
• The average citizen can affect how the government makes decisions. • The world is ruled by a few powerful people, about which the ordinary person cannot
do anything.
10.
• When I make plans, I am almost certain that I can fulfill them. • It is not wise to plan far in advance, because many things are heavily influenced by
luck.
11.
• In my case, getting what I want has nothing to do with luck. • Often, one could make a decision simply based on a coin flip.
12.
• What happens to me is my responsibility. • Sometimes I feel that I am not in sufficient control over my life’s direction.
A.12 CIVIC MINDEDNESS 1. Are you a registered blood donor?
• Yes • No
2. Are you registered as an organ donor?
• Yes • No
3. How much money do you give to charity?
• SEK 0 per year
34

• Less than SEK 100 per year • SEK 100-500 per year • SEK 500-1000 per year • SEK 1000-3000 per year • SEK 3000-5000 per year • More than SEK 5000 per year
4. How much time do you devote to unpaid voluntary work?
• 0 hours per week • Less than 1 hour per week • 1-2 hours per week • 2-5 hours per week • 5-10 hours per week • More than 10 hours per week
A.13 NON-BEHAVIORAL INHIBITION Each below question has the answer alternatives
• Yes • No
1 Do you tend to become vigilant and wary of your surroundings? 2 Do you feel awkward when you are approached by someone new? 3 Do you tend to become quiet? 4 Do you tend to approach people whom you don’t know and talk to them? 5 Do you tend to spend time observing strangers from a distance first, before being able to
mix in? 6 Do you tend to be chatty in conversation when you are speaking to someone new? 7 Are you likely to spend most of your time next to a person whom you know well? 8 Do you tend to feel physically anxious (e.g., racing pulse, sweaty, butterflies)? 9 Do you tend to introduce yourself to new people? 10 Do you tend to keep a fair distance away from strangers? 11 Do you tend to withdraw and retreat from those around you?
Generally, not just in new or unfamiliar situations:
12 Do you prefer your own company to the company of others? 13 Do you usually enjoy going to social events with large crowds of people? 14 Would you tend to choose solitary leisure activities over spending time with close
friends? 15 Do you prefer to be surrounded by lively activity rather than a quiet gathering?
A.14 HAPPINESS Would you, in general, describe yourself as
• Very happy • Rather happy
35

• Not very happy • Not at all happy
Table 1: Statistics on Self-employment Rate in United States and European Countries
This table lists the fraction of employed individuals who are self-employed. Panel A includes all self-employed individuals, and Panel B includes only self-employed individuals who employ others (i.e., a better definition of entrepreneur). Men/Women is the ratio of the fraction of self-employed men over the fraction of self-employed women. The figures for Switzerland and the United States refer to 2009. European data come from own calculations based on the Eurostat database, including those above the age of 15 who are employed. Because Eurostat does not include data for the United States, we rely on the Bureau of Labor Statistics for a measure of American self-employment (Hipple 2010). The Bureau of Labor Statistics records whether the firm employs others than the owner for the two thirds of self-employed Americans who are unincorporated, but not for incorporated firms. We therefore estimate the employer share of this group using data from the Census Survey of Business Owners from 2007.
Panel A: Self-employed All Women Men Men/Women Austria 11.6% 8.9% 14.0% 1.6 Belgium 13.4% 9.0% 17.0% 1.9 Bulgaria 11.7% 8.9% 14.3% 1.6 Croatia 19.8% 17.2% 22.1% 1.3 Cyprus 16.7% 10.2% 22.2% 2.2 Czech Republic 17.1% 11.1% 21.6% 1.9 Denmark 8.5% 4.8% 11.9% 2.5 Estonia 8.0% 5.1% 11.2% 2.2 Finland 12.8% 8.5% 16.9% 2.0 France 10.9% 6.7% 14.7% 2.2 Germany 11.0% 7.5% 14.0% 1.9 Greece 30.3% 22.1% 35.8% 1.6 Hungary 11.9% 8.4% 15.0% 1.8 Iceland 12.5% 8.3% 16.3% 2.0 Ireland 16.4% 6.9% 24.6% 3.6 Italy 23.6% 16.2% 28.6% 1.8 Latvia 10.1% 8.0% 12.3% 1.5 Lithuania 9.3% 7.2% 11.5% 1.6 Luxembourg 7.7% 6.1% 9.0% 1.5 Macedonia 18.5% 8.4% 24.8% 3.0 Malta 14.2% 6.1% 18.4% 3.0 Netherlands 14.4% 10.4% 17.8% 1.7 Norway 7.5% 4.1% 10.5% 2.5 Poland 18.9% 14.4% 22.7% 1.6 Portugal 21.8% 18.9% 24.3% 1.3 Romania 21.7% 13.6% 28.1% 2.1 Slovakia 15.8% 9.2% 21.2% 2.3
36

Slovenia 12.4% 7.8% 16.2% 2.1 Spain 16.0% 11.4% 19.6% 1.7 Sweden 10.7% 6.2% 14.7% 2.4 Switzerland 13.1% 10.2% 15.5% 1.5 Turkey 25.5% 14.1% 30.0% 2.1 United Kingdom 13.7% 8.7% 18.0% 2.1 United States 10.9% 7.9% 13.7% 1.7 AVERAGE 14.7% 9.8% 18.5% 2.0
Table 1 continued
Panel B: Self-employed with Employees All Women Men Men/Women
Austria 4.8% 2.7% 6.6% 2.5 Belgium 4.5% 2.4% 6.2% 2.6 Bulgaria 3.8% 2.4% 5.0% 2.1 Croatia 4.7% 2.8% 6.4% 2.3 Cyprus 4.9% 1.4% 7.8% 5.7 Czech Republic 3.6% 1.8% 5.0% 2.8 Denmark 3.6% 1.6% 5.4% 3.5 Estonia 3.3% 1.3% 5.5% 4.2 Finland 4.2% 2.1% 6.1% 2.9 France 4.4% 2.1% 6.6% 3.1 Germany 4.8% 2.6% 6.8% 2.6 Greece 8.0% 4.1% 10.6% 2.6 Hungary 5.5% 3.5% 7.2% 2.1 Iceland 4.1% 2.3% 5.8% 2.5 Ireland 5.2% 2.4% 7.7% 3.2 Italy 6.7% 3.6% 8.7% 2.4 Latvia 3.9% 2.7% 5.3% 2.0 Lithuania 2.2% 1.1% 3.4% 3.0 Luxembourg 3.2% 1.8% 4.3% 2.4 Macedonia 5.4% 3.5% 6.6% 1.9 Malta 4.4% 1.3% 6.0% 4.8 Netherlands 3.9% 1.9% 5.5% 2.9 Norway 2.2% 1.1% 3.1% 2.8 Poland 4.2% 2.7% 5.4% 2.0 Portugal 5.2% 2.9% 7.1% 2.4 Romania 1.3% 0.7% 1.8% 2.5 Slovakia 3.6% 2.0% 4.8% 2.3 Slovenia 3.8% 2.1% 5.2% 2.5 Spain 5.6% 3.5% 7.2% 2.0 Sweden 4.0% 1.8% 5.9% 3.3 Switzerland 5.8% 3.2% 8.0% 2.5 Turkey 5.3% 1.3% 6.9% 5.4 United Kingdom 2.6% 1.5% 3.7% 2.5
37
United States 2.5% 1.2% 3.6% 3.0 AVERAGE 4.3% 2.2% 5.9% 2.9
38

Table 2: Sample Overview
Sample is 7,331 Swedish twins who responded to the SALTY survey (we include only respondents who answered all of the relevant questions). Panel A describes the sample. Panel B reports the mean of the dummy variables that we create, based on the survey questions (see Appendix A), to capture different psychological traits. For each trait, we report the mean and its cross correlation with other traits.
Panel A: Description of Sample
All Individuals Women Men Men/Women
Full sample 7 331 3 621 3 710
Fraction of All Individuals 49% 51% Self-employed sample 1 198 382 816
Fraction of Full Sample 16% 11% 22% 2.1 Entrepreneur sample 393 67 326
Fraction of Full Sample 5% 2% 9% 4.7 Fraction of Self-Employed Sample 33% 18% 40% Panel B: Summary Statistics of Traits (all variables are dummies)
Mean Cross-Correlation Matrix
1 2 3 4 5 6 7 8 9 10 11 12 13
1 RISK AVERSION 0.62 2 LOSS AVERSION 0.82 0.14 3 AMBIGUITY AVERSION 0.63 -0.01 0.02 4 TIME PREFERENCE 0.93 -0.07 -0.01 0.00 5 NUMERACY 0.45 -0.08 0.00 0.03 0.01 6 ILLUSION OF CONTROL 0.78 -0.08 -0.02 0.08 0.05 0.03 7 FUNGIBILITY OF MONEY 0.95 -0.04 -0.02 0.02 0.03 -0.01 0.02 8 OPPORTUNITY COST AWARENESS 0.13 -0.06 -0.06 -0.01 0.03 0.01 0.00 -0.02 9 GREED TOLERANCE 0.36 -0.11 -0.09 0.03 0.00 0.03 0.04 0.05 0.01 10 TRUST IN OTHERS 0.25 -0.03 0.00 0.04 0.05 0.01 0.02 0.04 -0.01 0.01 11 LOCUS OF CONTROL 0.51 -0.08 0.00 0.07 0.05 0.02 0.04 0.05 0.01 0.08 0.11 12 CIVIC MINDEDNESS 0.48 -0.09 -0.03 0.05 0.05 0.07 0.05 0.04 0.00 0.07 0.04 0.08 13 NON-BEHAVIORAL INHIBITION 0.45 -0.13 -0.04 0.03 0.02 0.03 -0.01 0.06 0.01 0.07 0.15 0.15 0.12 14 HAPPINESS 0.29 -0.01 0.00 -0.02 -0.01 0.00 -0.01 0.03 -0.01 0.04 0.14 0.08 0.03 0.13
39

Table 3: Gender and Psychological Traits
Data from SALTY Twin Surveys. Specification 1 is a probit regression in which the dependent variable is 1 if the individual is a woman, and is 0 if the individual is a man. The specification includes age fixed effects. Coefficients reflect marginal effects. Residuals are clustered by twin pair. Significance at 1% level marked with ***, at 5% with **, and at 10% with *.
1
RISK AVERSION 0.111***
[0.013]
LOSS AVERSION 0.057***
[0.016]
AMBIGUITY AVERSION -0.085***
[0.013]
TIME PREFERENCE -0.027
[0.025]
NUMERACY -0.061***
[0.012]
ILLUSION OF CONTROL -0.058***
[0.015]
FUNGIBILITY OF MONEY -0.123***
[0.029]
OPPORTUNITY-COST AWARENESS 0.012
[0.018]
GREED TOLERANCE -0.119***
[0.013]
TRUST IN OTHERS 0.130***
[0.014]
LOCUS OF CONTROL -0.069***
[0.012]
CIVIC MINDEDNESS -0.146***
[0.012]
NON-BEHAVIORAL INHIBITION 0.059***
[0.013]
HAPPINESS -0.008
[0.014]
Nr of Observations 7 331 R-squared 0.07 Sample Full Fixed Effects Age Clustering of Residuals Twin
40

Table 4: Entrepreneurship and Psychological Traits
Data from SALTY Twin Surveys. Specification 1 is a probit regression in which the dependent variable is 1 if the individual is a woman, and is 0 if the individual is a man. The specifications include age fixed effects. Coefficients reflect marginal effects. Residuals are clustered by twin pair. Significance at 1% level marked with ***, at 5% with **, and at 10% with *.
1 2 3
FEMALE GENDER -0.069*** -0.055*** -0.047***
[0.005] [0.005] [0.005]
RISK AVERSION
-0.023***
Included as fixed effect dummies formed based on the coding of
each trait.
[0.005]
LOSS AVERSION
-0.005
[0.005]
AMBIGUITY AVERSION
-0.012**
[0.005]
TIME PREFERENCE
0.002
[0.008]
NUMERACY
0.000
[0.004]
ILLUSION OF CONTROL
0.003
[0.005]
FUNGIBILITY OF MONEY
0.008
[0.010]
OPPORTUNITY-COST AWARENESS 0.016**
[0.007]
GREED TOLERANCE
0.019***
[0.005]
TRUST IN OTHERS
-0.007
[0.005]
LOCUS OF CONTROL
0.011***
[0.004]
CIVIC MINDEDNESS
0.012***
[0.004]
NON-BEHAVIORAL INHIBITION
0.017***
[0.005]
HAPPINESS
0.013**
[0.005]
Nr of Observations 7 331 7 331 7 331 R-squared 0.06 0.11 0.15 Sample Full Full Full Fixed Effects Age Age Age Clustering of Residuals Twin Twin Twin
41
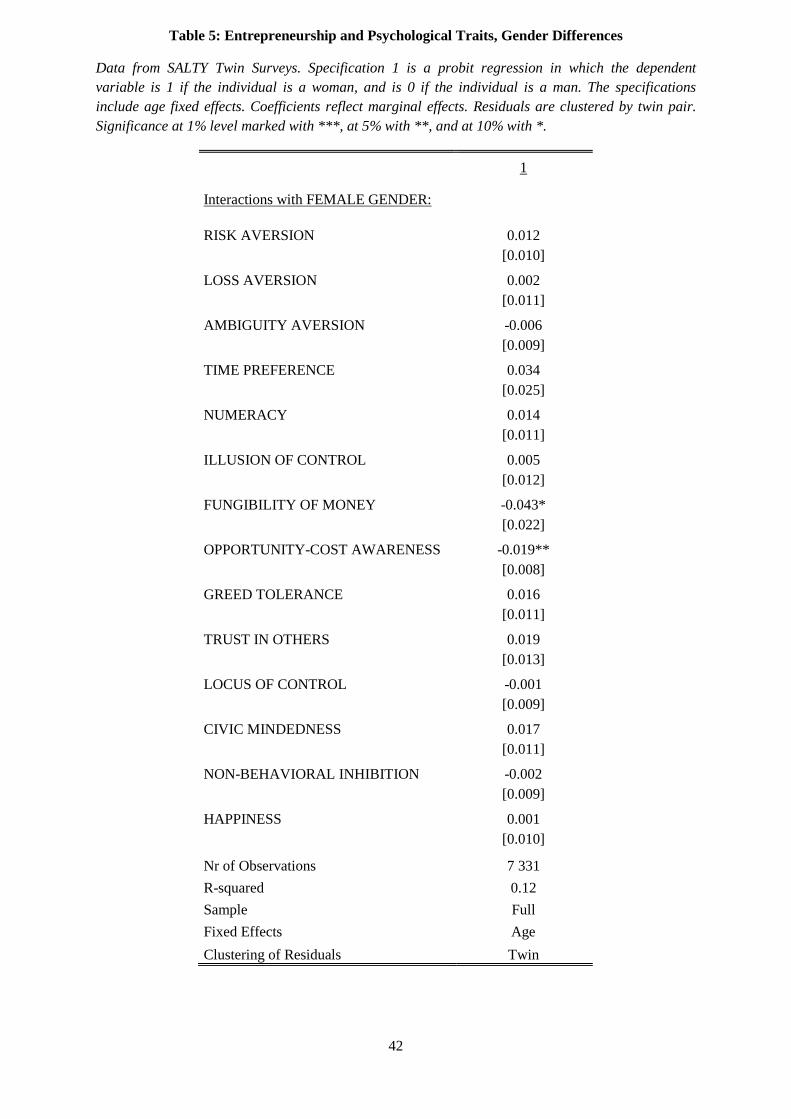
Table 5: Entrepreneurship and Psychological Traits, Gender Differences
Data from SALTY Twin Surveys. Specification 1 is a probit regression in which the dependent variable is 1 if the individual is a woman, and is 0 if the individual is a man. The specifications include age fixed effects. Coefficients reflect marginal effects. Residuals are clustered by twin pair. Significance at 1% level marked with ***, at 5% with **, and at 10% with *.
1
Interactions with FEMALE GENDER:
RISK AVERSION 0.012
[0.010]
LOSS AVERSION 0.002
[0.011]
AMBIGUITY AVERSION -0.006
[0.009]
TIME PREFERENCE 0.034
[0.025]
NUMERACY 0.014
[0.011]
ILLUSION OF CONTROL 0.005
[0.012]
FUNGIBILITY OF MONEY -0.043*
[0.022]
OPPORTUNITY-COST AWARENESS -0.019**
[0.008]
GREED TOLERANCE 0.016
[0.011]
TRUST IN OTHERS 0.019
[0.013]
LOCUS OF CONTROL -0.001
[0.009]
CIVIC MINDEDNESS 0.017
[0.011]
NON-BEHAVIORAL INHIBITION -0.002
[0.009]
HAPPINESS 0.001
[0.010]
Nr of Observations 7 331 R-squared 0.12 Sample Full Fixed Effects Age Clustering of Residuals Twin
42

Table 6: Self-employment and Psychological Traits
Data from SALTY Twin Surveys. Specification 1 is a probit regression in which the dependent variable is 1 if the individual is a woman, and is 0 if the individual is a man. The specification includes age fixed effects. Coefficients reflect marginal effects. Residuals are clustered by twin pair. Significance at 1% level marked with ***, at 5% with **, and at 10% with *.
1 2 3 Sp. 2, Tab. 4
FEMALE GENDER -0.055*** -0.052*** -0.050*** -
[0.008] [0.008] [0.008]
RISK AVERSION
-0.023***
Included as fixed effect dummies
formed based on the coding of each trait.
-
[0.008]
LOSS AVERSION
0.003
[0.010]
AMBIGUITY AVERSION
-0.007 -
[0.008]
TIME PREFERENCE
-0.039**
[0.017]
NUMERACY
0.000
[0.008]
ILLUSION OF CONTROL
-0.032***
[0.010]
FUNGIBILITY OF MONEY
0.038**
[0.015]
OPPORTUNITY-COST AWARENESS 0.015 +
[0.012]
GREED TOLERANCE
0.005 +
[0.008]
TRUST IN OTHERS
-0.021**
[0.009]
LOCUS OF CONTROL
-0.003 +
[0.008]
CIVIC MINDEDNESS
0.004 +
[0.008]
NON-BEHAVIORAL INHIBITION 0.001 +
[0.008]
HAPPINESS
0.005 +
[0.009]
Nr of Observations 6 938 6 938 6 938 R-squared 0.02 0.02 0.04 Sample Non-Entrep. Non-Entrep. Non-Entrep. Fixed Effects Age Age Age Clustering of Residuals Twin Twin Twin
43

Robustness Table 1: Gender and Psychological Traits, Robustness of Specification 1 in Table 3
1 2 3 4
Sp. 1, Tab. 3
RISK AVERSION 0.121*** 0.098*** 0.111*** 0.107***
+
[0.013] [0.013] [0.013] [0.013]
LOSS AVERSION 0.061*** 0.051*** 0.057*** 0.057***
+
[0.016] [0.016] [0.016] [0.016]
AMBIGUITY AVERSION
-0.092***
-0.081***
-0.085***
-0.084***
-
[0.013] [0.013] [0.013] [0.013]
TIME PREFERENCE -0.04 -0.02 -0.03 -0.027
[0.025] [0.025] [0.025] [0.025]
NUMERACY
-0.064***
-0.054***
-0.061***
-0.060***
-
[0.012] [0.012] [0.012] [0.012]
ILLUSION OF CONTROL
-0.062***
-0.047***
-0.058***
-0.058***
-
[0.015] [0.015] [0.015] [0.015]
FUNGIBILITY OF MONEY
-0.122***
-0.115***
-0.123***
-0.123***
-
[0.029] [0.029] [0.029] [0.029]
OPPORTUNITY-COST AWARENESS 0.01 0.01 0.01 0.013
[0.018] [0.018] [0.018] [0.018]
GREED TOLERANCE -
0.126*** -
0.114*** -
0.119*** -
0.118***
-
[0.013] [0.013] [0.013] [0.013]
TRUST IN OTHERS 0.122*** 0.132*** 0.130*** 0.131***
+
[0.014] [0.014] [0.014] [0.014]
LOCUS OF CONTROL
-0.078***
-0.059***
-0.069***
-0.068***
-
[0.013] [0.013] [0.012] [0.012]
CIVIC MINDEDNESS
-0.150***
-0.140***
-0.146***
-0.142***
-
[0.012] [0.012] [0.012] [0.012]
NON-BEHAVIORAL INHIBITION 0.055*** 0.068*** 0.059*** 0.060***
+
[0.013] [0.013] [0.013] [0.013]
HAPPINESS -0.01 0.00 -0.01 -0.007
[0.014] [0.014] [0.014] [0.014]
YEARS EDUCATION 0.014***
[0.003]
ANNUAL INCOME (1996-2000)
-0.112***
[0.024] MARRIED DUMMY
0.00
[0.013]
NUMBER OF CHILDREN
-0.036***
[0.008] Estimation Technique Probit Probit Probit Probit Nr of Observations 7 340 7 340 7 340 7 340
44

R-squared 0.07 0.09 0.07 0.07 Sample Full Full Full Full Fixed Effects Age Age Age Age Clustering of Residuals Twin Twin Twin Twin
Robustness Table 2: Entrepreneurship and Psychological Traits, Robustness of Specification 2 in Table 4
1 2 3 4 5
Sp. 2, Tab. 4
FEMALE GENDER
-0.055**
*
-0.054**
*
-0.054**
*
-0.054**
*
-0.055**
*
-
[0.005] [0.005] [0.005] [0.005] [0.015]
RISK AVERSION
-0.023**
*
-0.023**
*
-0.023**
*
-0.023**
* -0.016
-
[0.005] [0.005] [0.005] [0.005] [0.013]
LOSS AVERSION -0.01 -0.01 -0.01 -0.01 0.006
[0.005] [0.005] [0.005] [0.005] [0.015]
AMBIGUITY AVERSION
-0.012**
* -
0.012**
-0.012**
* -
0.012** -0.025**
-
[0.005] [0.005] [0.005] [0.005] [0.010]
TIME PREFERENCE 0.00 0.00 0.00 0.00 -0.01
[0.008] [0.008] [0.008] [0.008] [0.018]
NUMERACY 0.00 0.00 0.00 0.00 0.006
[0.004] [0.004] [0.004] [0.004] [0.012]
ILLUSION OF CONTROL 0.00 0.00 0.00 0.00 0.002
[0.005] [0.005] [0.005] [0.005] [0.013]
FUNGIBILITY OF MONEY 0.01 0.01 0.01 0.01 -0.017
[0.010] [0.010] [0.010] [0.010] [0.019]
OPPORTUNITY-COST AWARENESS 0.016** 0.015** 0.016** 0.015** 0.017
+
[0.007] [0.007] [0.007] [0.007] [0.018]
GREED TOLERANCE
0.019***
0.019***
0.019***
0.019*** 0.018
+
[0.005] [0.005] [0.005] [0.005] [0.012]
TRUST IN OTHERS -0.01 -0.01 -0.01 -0.01 0.021*
[0.005] [0.005] [0.005] [0.004] [0.012]
LOCUS OF CONTROL
0.011***
0.011***
0.011***
0.011***
0.035***
+
[0.004] [0.004] [0.004] [0.004] [0.012]
CIVIC MINDEDNESS
0.012***
0.012*** 0.011**
0.011*** 0.027**
+
[0.004] [0.004] [0.004] [0.004] [0.012]
NON-BEHAVIORAL INHIBITION
0.016***
0.017***
0.016***
0.016*** 0.008
+
[0.005] [0.005] [0.005] [0.005] [0.012]
HAPPINESS 0.012** 0.013** 0.011** 0.012** 0.012
+
[0.005] [0.005] [0.005] [0.005] [0.013]
YEARS EDUCATION 0.000 45

[0.001]
ANNUAL INCOME (1996-2000)
0.00
[0.003]
MARRIED DUMMY
0.009**
[0.004]
NUMBER OF CHILDREN
0.003
[0.002]
Estimation Technique Probit Probit Probit Probit OLS Nr of Observations 7 340 7 340 7 340 7 340 7 340 R-squared 0.11 0.11 0.11 0.11 0.03 Sample Full Full Full Full Full
Fixed Effects Age Age Age Age Age, Twin
Clustering of Residuals Twin Twin Twin Twin None
46
Recommended