i
The production of fresh produce in Africa forexport to the United Kingdom:mapping different value chains
Natural Resources Institute
Contributing Authors:
Alan Legge
John Orchard
Andy Graffham
Peter Greenhalgh
Ulrich Kleih
October 2006
Contents
Executive summary.................................................................................................................. i
Acknowledgements ............................................................................................................. vi
Abbreviations and acronyms............................................................................................. vi
Part 1: Main report..................................................................................................................1
1 Introduction ................................................................................................................1
2 Overview of the United Kingdom fruit and vegetable market ........................6
3 UK fruit and vegetable imports from sub-Saharan Africa and the role of
smallholders......................................................................................................................12
4 Trends in produce sourcing ...................................................................................22
5 Study findings ..........................................................................................................43
Part 2: Country studies .........................................................................................................48
6 Kenya..........................................................................................................................48
7 Ghana .........................................................................................................................55
8 Tanzania.....................................................................................................................64
9 Uganda .......................................................................................................................71
10 Zambia........................................................................................................................75
Appendix 1: Terms of reference ....................................................................................79
Appendix 2: Literature consulted..................................................................................83
Appendix 3: Trade data...................................................................................................87

i
Executive summary
In 2005, sub-Saharan African (SSA) countries (excluding South Africa) exported 73,788
tonnes of vegetables worth £105 million and 209,555 tonnes of fruit (mostly bananas)
worth £89 million to the UK.
This represents a relatively small volume in the context of the overall UK trade for fruit
and vegetables (F&V) valued at £4.7 billion. However, the trade from SSA to the UK is
of enormous benefit to an estimated 715,000 resource-poor small-scale growers (SSG),
workers and their families (Table 1). If exporting SSGs and their dependents from South
Africa (an important supplier of fruits to the UK) were included the figure would be
substantially in excess of one million.
No overall data exists for the wider impact of high-value export horticulture on African
small-scale growers but individual studies have shown significant income benefits for
SSGs involved in export horticulture. For example, in Zambia 73 per cent of
smallholder farmers fall within the category of those experiencing money income
poverty with an average per capita income of £70 per annum. However, smallholders
involved in export of peas and baby corn to UK supermarkets had incomes ranging from
£1,000 to £7,500 during the 2003-2004 season with most growers having an income of
£2,000 to £3,000 per annum from export horticulture. In Kenya, a study of farmers
growing green beans for export to UK supermarkets found incomes ranging from £417 to
£1,250 per annum in rural areas where an annual household income of approximately
£100 is considered normal.
Table 1. Numbers of small (SSGs) and large-scale (LSGs) farmers exporting to the UK
retail and wholesale sector and associated numbers of dependents and ancillary workers
FarmerNumber
Market Ghana Kenya Tanzania Uganda Zambia OtherSSA
Totals
SSGs Wholesale 3,438 2,815 2,070 1,800 10 10,193
LSGs(Large-scalegrowers)
Wholesale 10 191 1 12 2 216
SSGs Retail 160 4,140 2 200 0 4,502
LSGs Retail 10 191 0 2 2 205Dependents& ancillaryworkers
70,433 171,237 30,330 29,963 6,948 308,910
Total73,691 178,574 32,397 31,609 6,954 392,165 715,390

ii
Data from the UK Office of National Statistics show that in 2005 F&V sales (including
processed products) totalled £20.6 billion of which retail sales accounted for almost £12.2
billion (59.1 per cent) compared with £8.4 billion in wholesale and foodservices markets
(40.9 per cent). The retail sector is dominated by the major supermarkets with sales of £11
billion, which represents 53.4 per cent of total UK F&V sales and 90 per cent of retail
sales.
In the recent past, accessing the high-value supermarket sector has been an important
income-earner for SSGs from Africa, particularly Kenya. However, the opportunity for
SSGs to access these high-value markets has reduced dramatically over the past 6 - 18
months. The number of SSGs supplying the UK supermarket sector has declined
significantly to some 4,500, markedly less than half the number of SSGs supplying the
wholesale and foodservice sector (Table 1).
Most of the decline has occurred in Kenya, despite the large amount of donor support.
Kenyan SSGs supplying UK supermarkets have declined by a half to 4,100 in the past
year indicating how procurement patterns can change rapidly. This indicates the harsh
reality and high risks of supplying this highly demanding sector. The SSG decline reflects
the increased costs and managerial burden associated with meeting private sector
standards and the decrease in external funds to maintain smallholder participation.
Although the number of sub-Saharan African SSGs supplying retailers is less than those
delivering produce to the wholesale sector, the volume and value of produce they supply is
more, reflecting the high value associated with these products (Table 2).
Table 2. Volume and value of fruit and vegetable export from target case studies to UK
in 2005 destined for retail and non-retail markets.
Market Ghana Kenya Tanzania Uganda Zambia Total Percentageof total
Non-retailvolume(tonnes)
19,445 8,166 287 2,800 0 30,689 47
Non-retailvalue(£’000)
11,760 18,511 288 566 0 12.633 31
Retailvolume(tonnes)
5,920 24,498 670 240 3,444 34.772 53
Retailvalue(£’000)
2,940 55,532 912 3,050 7,400 69,883 69

iii
There are some initiatives that are trying to increase the involvement of SSGs in the high-
value export sector but this is taking place at a time when some in the industry believe that
in three to five years the market for procuring high- value produce could shift away from
sub-Saharan Africa.
In contrast to the decline of smallholder involvement in the retail sector, more than double
the number of SSGs are accessing the non-retail market. Nearly 25 per cent of the volume
of produce imported from the case studies in SSA now flows into the catering sector
(Table 3). Since smallholders are an important supplier of produce into the foodservice
sector, there would appear to be some opportunities for market entry to replace the trade
into supermarkets.
Table 3. Summary of final retail and non-retail destination of fruit and vegetables
exported from the five case study countries to the UK in 2005.
UK final use (tonnes)Country/
commodity
Total volume(tonnes) Supermarket Foodservice Stores & markets
Volume of produce
exported
65,363 38,707 14,851 12,281
Percentage of total 59.2 22.7 18.8
Less yams 57,061 38,707 14,021 4,810
Percentage of total 67.8 24.6 8.4
However, the non-supermarket supply opportunities for SSGs are beginning to face the
same pressures as in the retail sector since the major catering suppliers have begun to
assume greater governance over the supply chain, requiring compliance with the same
private sector standards. In addition, there are growing demands for greater local sourcing.
Although opportunities for SSGs may continue in the traditional wholesale markets and
some parts of the foodservice supply chain, this sector presents a complex supply arena
encompassing traditional wholesale market activities (now dominated by ethnically-based
traders) and the increasingly dynamic foodservice sector supplying the growing catering
trade. There is negligible data (both published and un-published) defining the patterns of
procurement. There is acknowledgement within the sector that it has received
considerably less attention and support from donors and merits more detailed analysis to
assess the size and needs of the sector and the opportunities for smallholders.

iv
Some new procurement models involving SSG are being developed with the support of
retail category managers (as long as they are fully EurepGAP certified). However,
category managers are no longer willing or able to provide direct management support
and are looking for third party involvement for both technical and managerial
support, often research institutions and NGOs, respectively. For this reason, examples
from Tanzania, with the development of the Market Intermediary Concept (based on
public- private sector partnership), provide an important approach for involving
smallholders. However, the applicability of other procurement models should be
analysed, particularly with respect to accessing markets other than supermarkets.
Some in the industry feel that Fair Trade is an attractive approach to secure greater
returns for smallholders and create a more sustainable basis for their participation in high
value markets. However, both Fair Trade and organic production are niche markets that
cannot absorb the larger volumes associated with conventional markets.
The development of new approaches to procurement must address the need to take
account of how produce is transported to the UK. Nearly 90 per cent of SSA produce
imported into the UK is transported by air (Table 4). Opportunities should be explored to
make use of new storage technology to allow the use of sea transport but the ability to
manage these new systems plus the additional cost may be a negative factor in their
uptake.
Table 4. Mode of transport for the delivery of produce from five case study countries to
the UK in 2005.
Country Air (Tonnes) Sea (Tonnes)
Kenya 31,807 1,508
Ghana 7,117 3,982
Tanzania 3,866 2
Uganda 2,965 101
Zambia 3,444 0
Total 49,200 5,594
Percentage of total 89.8 10.2
This study to map produce flows from sub-Saharan Africa into UK markets has shown a
disturbing trend towards decreased procurement by supermarkets of fresh produce from
small-scale growers. This is mainly due to a continuing rise in requirements of private
standards with associated increases in cost and capacity to show compliance. The
question must be asked whether these trends are inevitable or whether alternative options

v
exist? In order to assess options within the supermarket supply chain there would be
merit in investigating in more detail how best to support small-scale growers to meet the
requirements of private standards in a cost effective and sustainable manner.
Notwithstanding the importance of the high-value supermarkets, it is necessary to
examine in greater detail the wholesale and foodservice markets as potential alternatives to
supermarket retail especially as the foodservice market is growing in size and value.
Analysis is required particularly in the supplier countries to improve understanding of the
mechanisms of produce procurement that is destined for non-supermarket UK outlets.
Greater information is required on the governance of these chains and the costs and returns
available to different players.
At the UK end of the chain, surveys undertaken under the current study showed a general
ignorance of the new EU regulatory mechanisms amongst players in the major UK
wholesale markets. Enforcement agencies may focus resources on high risk products of
animal origin and the current situation of loose enforcement for fresh produce may remain
the same. It would be useful to establish a dialogue with the relevant agencies and market
associations to explore this area in more detail. In a few cases, primary importers in the
Western International market in London are already requesting higher standards and
one importer had mentioned future requirements for EurepGAP. If regulatory
requirements become stricter or private standards become a feature of wholesale markets it
will have negative implications for African smallholders.
The foodservice market is a growing sector, but there is a need to characterise current and
future trends on food safety and quality requirements to determine if this sector will offer
opportunities for African smallholders. Given the difficulties experienced in establishing
a dialogue with players in this sector, it would be essential to involve appropriate sector
organisations to conduct the survey work. Also it will be necessary to provide a reason for
the industry to participate in such an exercise. Given recent problems with the unreliability
in terms of food safety and quality of some raw ingredients used in mass production of
ethnic foods a possible line of promotion would be to present the study as aimed at
understanding the needs of the foodservice sector and then determining cost-effective
means by which the supply base can meet the challenge of higher standards. This could be
presented as a winning scenario in terms of protection of brand image and avoiding
problems with supply like those experienced when the EU changed the regulatory
requirements for Bombay duck in 1995 (avoiding another Sudan1/Parared incident).

vi
Acknowledgements
This publication was funded by the Department for International Development (DFID) of the
Government of the United Kingdom as part of a project entitled “Small-scale producers and
standards in agrifood supply chains: Phase 2, 2005-2008 (AG3815)”. However, the views
expressed may not necessarily reflect that of official DFID and UK Government policy.
The authors would like to express their gratitude to the many organisations,
companies and individuals who assisted in the preparation of the study, particularly those
cited in the list of contacts. The views and opinions expressed are those of the authors alone
and do not necessarily reflect those of organisations and individuals contacted.
Abbreviations and acronyms
ACP African, Caribbean and Pacific countries
billion Billion
BRC British Retail Consortium
CA Competent Authority
CBI Centre for the Promotion of Exports from Developing Countries
DEFRA Department of Environment, Food and Rural Affairs, UK
EC European Commission
EHPEA Ethiopian Horticulture Producers and Exporters Association
EU European Union
EurepGAP European Retailers Protocol for Good Agricultural Practice
F&V Fresh fruit and vegetables
FLO Fairtrade Labelling Organisations International
FPC Fresh Produce Consortium
GAP Good Agricultural Practice
G2G Gateway to Growth
GEL Gomba Estates Limited, Tanzania
GROTETU Ghana Root and Tubers Exporters Union
GYPEA Ghana Yam Producers and Exporters Association
GROCETU Ghana Root Crops and Tubers Exporters Union
GSP Generalised System of Preferences
HACCP Hazard analysis and critical control point
ICM Integrated Crop Management
IFOAM International Federation of Organic Agricultural Movements
IPM Integrated Pest Management

vii
LOD Limit of determination
LSGs Large scale growers
MIM Market Intermediary Management
million Million
MRL Maximum Residue Level
NRI Natural Resources Institute
NZTT P33 original text
NGO Non-governmental organisation
ONS Office of National Statistics (UK)
PMO Primary marketing organisation
PSD Pesticide Safety Directorate
SPS Sanitary and Phytosanitary measures
SSA Sub Saharan Africa
SSG Small scale growers
TOR Terms of Reference
UK United Kingdom
UKROFS UK Register of Organic Food Standards
UN-ECE United Nations Economic Commission for Europe
VREL Volta River Estates Ltd.
YTL York Farm Ltd.
ZEGA Zambia Export Growers’ Association

1
Part 1: Main report
1 Introduction
1.1 Background
Objectives and rationale
The DFID/IIED/NRI project “Small-Scale Producers and Standards in Agrifood Supply
Chains “is primarily about finding ways to apply political leverage to make positive changes
to existing systems that lead to more favourable conditions for access to high-value EU
markets by small-scale growers (SSG) in sub-Saharan Africa (SSA).
One aspect of the initial work is an activity to map the involvement of African SSGs in
supplying produce to UK markets (with emphasis on detailed characterisation of UK
markets) by determining origin of product, types of product, volumes, values and numbers of
SSGs (and their dependents) involved and destination markets. The Terms of Reference
(TOR) for the study are contained in Appendix 1.
The study is important because there is strong evidence that exporters and importers are
moving away from the smallest growers, not because of product quality or productivity, but
because of transaction costs associated with private retailer standards. This includes both
managing the implementation of, and demonstrating compliance with, the standards. At
present, it is not clear whether production by small-scale farmers throughout Africa destined
for export to retailers abroad can remain viable.
Over the past two decades many sub-Saharan African entrepreneurs and farmers have
endeavoured to develop and expand export horticulture, supported by governments and
donors, who see horticulture as an important source of employment and export earnings.
Horticulture, particularly vegetables, makes intensive use of land and labour, especially
women, and can produce high output value per hectare. SSA has several advantages in
horticulture production, including suitable soils and climate, water for irrigation, low labour
costs and relative proximity to growing horticultural markets in Europe and the Middle East.
However, SSA producers are facing increasing competition from other producers especially
from North Africa and Asia who have easier access to EU markets.

2
Methodology and timing
The research for this report was undertaken between June and October 2006 and involved
two major components.
The first component was desk research on the structure of the horticultural sector and food
retailing in the United Kingdom (UK). A detailed analysis of import trade data provided by
Eurostat and UK Customs and Excise data was carried out with special emphasis on the
volume and value of imports into the UK and EU from SSA and other competitive countries
as well as exports from selected Africa countries. Literature reviews were undertaken dealing
with both the UK and European Union (EU) horticulture markets as well as the horticulture
sectors in a range of SSA countries that were exporting to the UK.
The second component involved structured interviews with a wide range of
stakeholders in the supply chain including importers, exporters, primary marketing
organizations, category managers, supermarkets, horticulture sector consultants, food safety
experts and visits to wholesale markets and retail outlets. Appendix 2 contains details of the
various contacts made, although for confidentiality reasons some companies and individuals
have not been named.
Structure of the report
The study is divided into two parts: Part A is the main body of the report and Part B contains
five SSA country briefs, namely Kenya, Ghana, Tanzania, Uganda and Zambia. Part A is
made up of five chapters. This introductory chapter also includes (in Section 1.4) an
overview of trade in F&V to put the role of SSA producers and the UK market in context.
Chapter 2 provides an overview of the UK fruit and vegetable market and structures,
including the volume and value of the fruit and vegetable market and the relative importance
of domestic and imported supplies. Retail and non-retail supply chains are both outlined.
Chapter 3 quantifies the flow of horticultural produce from SSA, excluding South Africa, to
the UK. A summary of the key points and trends relating to the selected SSA country
suppliers is outlined. This includes a quantification of the role of smallholders and their
dependents in African export horticulture and employment multipliers. Chapter 4 outlines
trends in produce sourcing providing a snapshot of the flows and trends of produce to the
various broad UK market sectors including supermarkets, foodservice, wholesale, ethnic
shops, convenience stores and discount supermarkets, and London and regional markets.
The role of various stakeholders in the value chain, especially category managers, and trends
with regard to private standards and EU regulations are also outlined. In addition, some of the
procurement models used to source smallholder produce for export are summarised. Chapter
5 summarises the study’s findings including key present and future trends and risks

3
influencing smallholders’ competitiveness, the competitive incentives facing key sectors;
consumption, procurement and production trends; as well as the structural changes in the
sector including horizontal and vertical integration and consolidation and development in
standards, EU regulations and transportation. Finally information and data gaps are identified
and a series of recommendations made.
Part B includes the five country briefs which provide some background to SSA countries
exporting to the UK along with estimates of smallholders and others dependent on export
horticulture. The countries analysed include Kenya (Chapter 6), the major SSA exporter to
the UK, along with Ghana (Chapter 7), Tanzania (Chapter 8), Uganda (Chapter 9) and
Zambia (Chapter 10). This is followed by four appendices which contain the TOR
(Appendix 1); a list of individuals and organisations contacted (Appendix 2); details of
literature and data sources consulted (Appendix 3) and trade data for countries exporting to
the UK other than SSA countries (Appendix 4).
1.2 An overview of global and EU fruit and vegetable consumption and trade
It is important to place SSA exports of fresh F&V and United Kingdom F&V imports in the
context of overall global F&V production and trade.1
Production and international trade in F&V has grown by 43 per cent and 37 per cent
respectively in volume terms over the last decade. The volume of trade has grown more than
for any other agricultural commodity group. The annual volumes of F&V entering
international trade is approximately 73 million tonnes – equal to just over 5 per cent of
production – while the value is approximately US$45 billion.
The annual value of international traded fruits in 2003 was $26.4 billion compared with $18.3
billion in 1993. During the past decade exports of “non-traditional” tropical fruits (e.g.
mangoes, papayas and pineapples) have been one of the fastest growth sectors with values
doubling over the past decade to $2.6 billion (excluding bananas).
Growth of temperate fruits (e.g. apples, stone fruit) and traditional sub-tropical fruit (e.g.
bananas, and citrus) has been more modest.
International trade in fresh vegetables during the decade has increased from $11.5 billion to
$18.7 billion, with the fastest growth being in the category of chillies and green peppers. The
fastest growth of all has been in “green beans not for shelling” with export growth of 3,577
1 The analysis is based on FAOSTAT, CBI 2005, Hallam et al., 2004 and Stichele et al., 2005

4
per cent over the decade.
Developing countries dominate F&V production and account for approximately a third of
global F&V trade. However, this trade is very concentrated with approximately two
thirds of developing country exports accounted for by eight countries only one of which is
African, namely South Africa. There are no least developed countries among leading F&V
exporters although within Africa, Egypt, Kenya and Morocco are important exporters (See
Appendix 4 for data on exports to UK).
Factors cited for the growth in developing countries F&V supplies include:
Low labour and input costs;
Improved storage techniques;
Improved input use e.g. irrigation, seeds, fertiliser and pesticides;
Better production techniques;
Improved logistics and transport including refrigerated bulk sea freight services
and, increased demand from developed countries.
A range of growers and production systems are involved in F&V exports. This can range
from smallholders to very large-scale farmers employing modern crop management
systems. Larger producers are often involved in most aspects of pre- and post-harvest
operations while smallholders adopt a range of practices including selling their produce to
local operators or traders; exporting their produce jointly with other smallholders or
undertaking outgrowing or contract farming for larger operations.
The countries that are successful in exporting F&V have more developed
infrastructures and mostly rely on large-scale commercial farming and an integrated supply
chain. In contrast smallholders have been less able to meet quality standards, price, volume
and delivery schedules of the developed country buyers.

5
Real prices for horticultural commodities have declined over the past decade but much less
than other commodities. Tropical fruit prices have shown sizeable fluctuations
compared with vegetables which have shown relative stability.
EU consumption and trade
EU fresh fruit and vegetable consumption in 2003 totalled 25 million tonnes and 30 million
tonnes, respectively. Despite the trend towards healthier diets consumption has been
relatively stable over the past decade. Per capita F&V consumption is often well below
recommended levels and there are wide variations between countries in consumption levels.
Thus, F&V consumption is relatively high in Italy and Germany and low in Scandinavian
countries. In the UK, F&V consumption is typically low but there have been divergent trends
in the types of F&V consumed. Thus, fresh fruit consumption increased by 23 per cent
between 1990 and 2000 while consumption of potatoes and fresh green vegetables decreased
by 29 per cent and 13 per cent respectively over the same period. Tropical and off-season
F&V have shown an upward trend alongside a growing demand for convenience F&V
products (e.g. prepared and pre- packed vegetables, salads and fresh fruit).
The EU is the world’s biggest importer and the second largest exporter of F&V. Overall EU
(and UK) consumption of F&V has remained relatively stable over recent years but there has
been a growth of F&V imports from developing countries making them an increasingly
important source of supply.
The leading imported fresh fruit is bananas accounting for a quarter of EU fruit imports.
Annual EU imports are approximately 5 million tonnes predominantly from Latin America
and the Caribbean. In 2002, EU imports of fresh fruit from developing countries accounted
for 35 per cent of all fruit imports and totalled 6.9 billion tonnes valued at almost US$ 5
billion. Developing countries are major EU suppliers of bananas, pineapples, papayas,
tamarinds and lychees, dates, guavas, mangoes and passion fruit. The leading suppliers of
fresh fruit from developing countries to EU markets in order of importance are South Africa,
Costa Rica, Ecuador, Chile and Colombia.
Tomatoes are the leading imported fresh vegetable accounting for 22 per cent of total EU
vegetable imports. EU imports of fresh vegetables amounted to 696 million tonnes and US$
793 million in 2002. Developing countries account for 10 per cent of all EU imports with
Morocco as the supplier followed in order by Kenya, Turkey, Egypt and Thailand.

6
2 Overview of the United Kingdom fruit and vegetable market
2.1 Introduction
This chapter provides an overview of the UK F&V market and structure. A brief overview of
market structures is provided in section 2.2, including the importance of various retail and
non-retail outlets, which are analysed in greater details in Chapter 4. In Section 2.3 there is a
review of the volumes and values of UK F&V imports and the relative importance of
domestic and imported supplies. Section 2.4 analyses UK consumption trends for F&V.
2.2 Market structure
Despite the perishability of fresh F&V, there are a range of different actors in the supply
chain e.g. producers; exporters; transport and distribution companies; importers;
commission agents; auctions; wholesale traders; importers including category managers;
sorting, processing and packaging companies. The sector is dynamic and the different
functions of exporter, importer, wholesale trader and distributor are becoming increasingly
blurred as mergers and acquisitions bring them under individual company control. Thus, the
wholesale trade has become almost completely excluded from supplying the major retail
supermarkets with the growth of direct links between producer, importers and retailers.
Fresh horticultural2 produce flows through a number of routes to reach consumers. In the UK,
based on sales value, 57 per cent of fresh produce is sold via multiple retailers, 11 per cent in
wholesale market, and 32 per cent through foodservice (FPC, 2003). These observations are
borne out by data from the UK’s Office of National Statistics (ONS) which has a slightly
higher percentage in the retail sector but this does include all types of processed fruit and
vegetables. The ONS data for the sales of F&V passing through retail and wholesale markets
are shown in Table 2.1. In 2004, total F&V sales including processed products totalled £20.6
billion, with retail sales accounting for just over £12 billion (59.1 per cent) of which
supermarkets sales came to £11 billion (53.4 per cent), compared with £8.4 billion in
wholesale markets (40.9 per cent).
2 Unless otherwise stated “horticulture” refers to fresh fruit and vegetables.
7
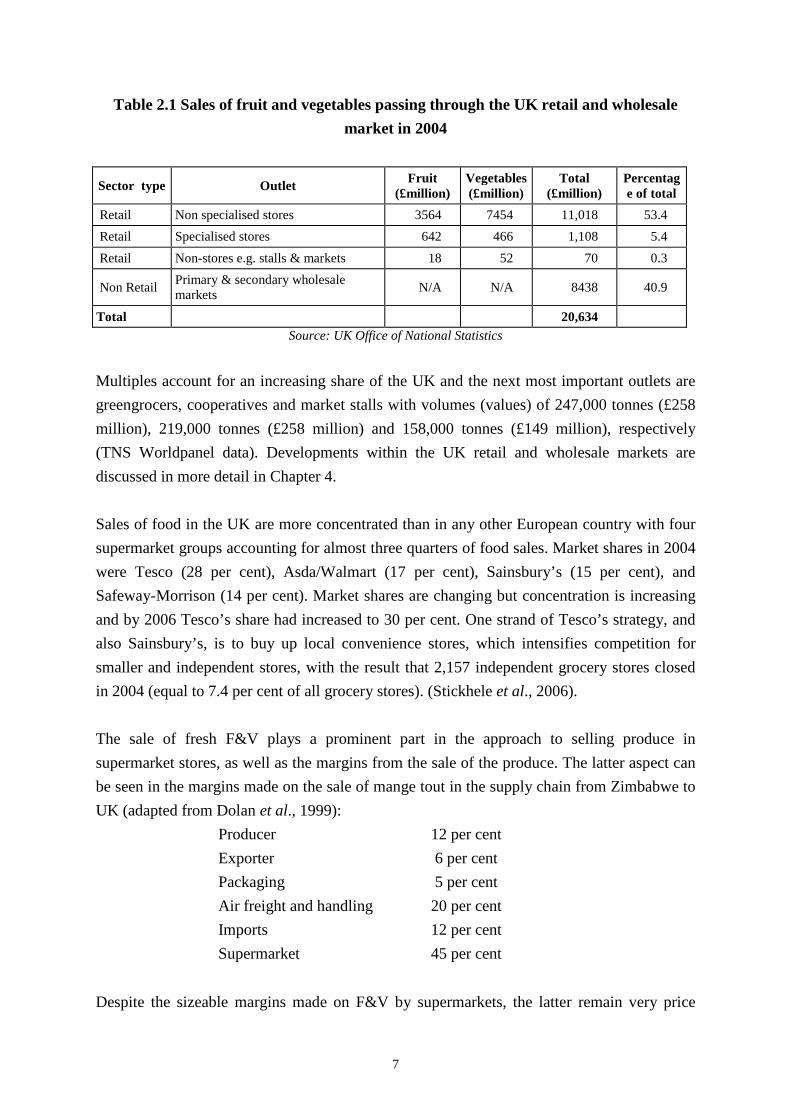
Table 2.1 Sales of fruit and vegetables passing through the UK retail and wholesale
market in 2004
Sector type OutletFruit
(£million)Vegetables(£million)
Total(£million)
Percentage of total
Retail Non specialised stores 3564 7454 11,018 53.4
Retail Specialised stores 642 466 1,108 5.4
Retail Non-stores e.g. stalls & markets 18 52 70 0.3
Non RetailPrimary & secondary wholesalemarkets
N/A N/A 8438 40.9
Total 20,634
Source: UK Office of National Statistics
Multiples account for an increasing share of the UK and the next most important outlets are
greengrocers, cooperatives and market stalls with volumes (values) of 247,000 tonnes (£258
million), 219,000 tonnes (£258 million) and 158,000 tonnes (£149 million), respectively
(TNS Worldpanel data). Developments within the UK retail and wholesale markets are
discussed in more detail in Chapter 4.
Sales of food in the UK are more concentrated than in any other European country with four
supermarket groups accounting for almost three quarters of food sales. Market shares in 2004
were Tesco (28 per cent), Asda/Walmart (17 per cent), Sainsbury’s (15 per cent), and
Safeway-Morrison (14 per cent). Market shares are changing but concentration is increasing
and by 2006 Tesco’s share had increased to 30 per cent. One strand of Tesco’s strategy, and
also Sainsbury’s, is to buy up local convenience stores, which intensifies competition for
smaller and independent stores, with the result that 2,157 independent grocery stores closed
in 2004 (equal to 7.4 per cent of all grocery stores). (Stickhele et al., 2006).
The sale of fresh F&V plays a prominent part in the approach to selling produce in
supermarket stores, as well as the margins from the sale of the produce. The latter aspect can
be seen in the margins made on the sale of mange tout in the supply chain from Zimbabwe to
UK (adapted from Dolan et al., 1999):
Producer 12 per cent
Exporter 6 per cent
Packaging 5 per cent
Air freight and handling 20 per cent
Imports 12 per cent
Supermarket 45 per cent
Despite the sizeable margins made on F&V by supermarkets, the latter remain very price

8
competitive with smaller retails outlets, making it very difficult for the smaller outlets to
survive. The occasional price wars by supermarkets intensify these difficulties. Within
Europe discounters usually offer F&V at the lowest prices of the supermarket groups.
However, their range is limited and they are willing to take a lower margin – one source
suggesting 10 per cent compared with 30 per cent – 40 per cent margin by the supermarkets
(Cioffi et al., 2004). Discounters have been increasing their market share in Europe since the
1990s. Their overall market share rose from 7 per cent in 1992 to 10 per cent in 2004 but
market shares vary considerably between countries. Thus in the UK, discounters (e.g. Aldi,
Lidl, Netto) accounted for only 3.7 per cent of grocery sales in 2005, whereas in Germany
their share was 32 per cent and rising. (M & M, Planet Retail). Discounters look for the
cheapest price available and tend to buy on the spot at wholesale markets and as such do not
provide sound mid-term prospects of good prices for producers. However, UK-based
discounters do source produce from F&V distributors including category managers.
2.3 UK vegetable and fruit market
The sources and range of horticultural products available in UK retail outlets has expanded
rapidly in recent years. Thus, in almost any major UK supermarket there are usually well
over a hundred different kinds of horticultural products for sale, sourced from several dozen
countries. This has been achieved over the past two decades by a substantial growth in the
volume and value of both intra-European Union (EU) trade in horticultural products, and also
from third countries. Increasing disposable income has resulted in larger imports of off-
season fresh fruit and vegetables.
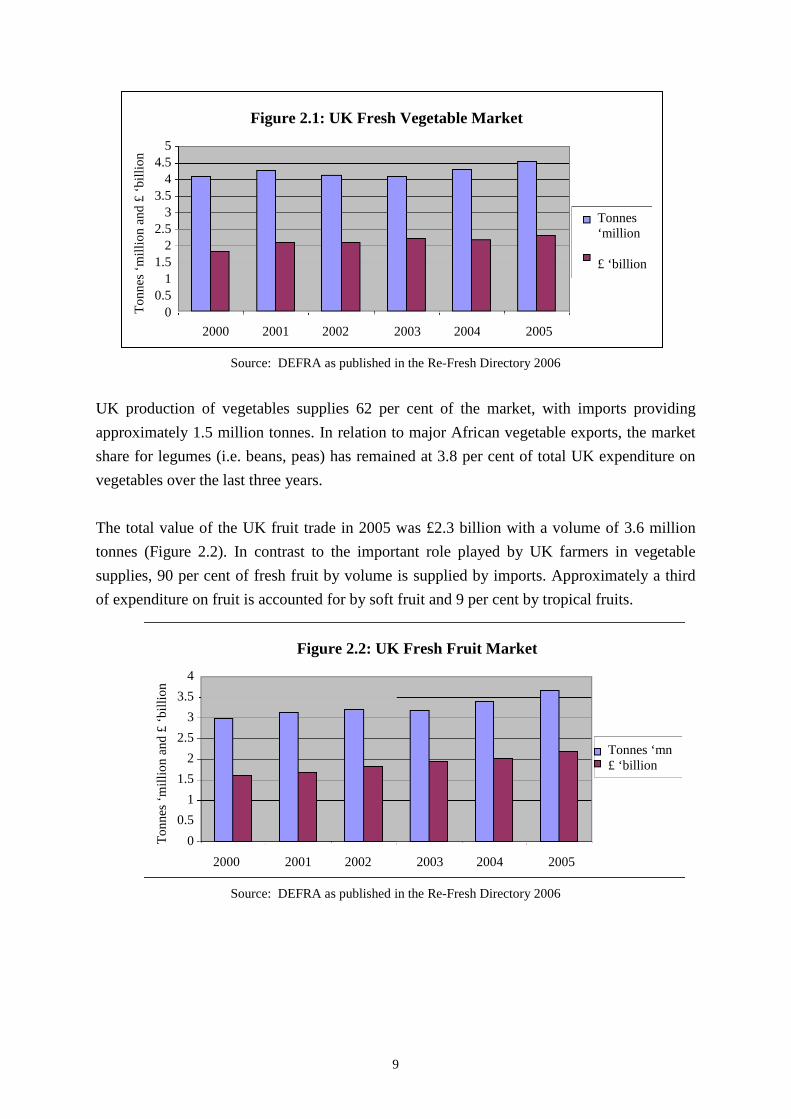
The UK fresh vegetable market is currently trading about 4.5 million tonnes of produce,
valued at £2.4 billion (Figure 2.1). Salads account for just over one-third of expenditure on
vegetables.
9
2000 2001 2002 2003 2004 2005
54.5
43.5
32.5
21.5
10.5
0
Figure 2.1: UK Fresh Vegetable MarketT
on
nes
‘mil
lio
nan
d£
‘bil
lio
n
Tonnes‘million
£ ‘billion
2000 2001 2002 2003 2004 2005
4
3.5
3
2.5
2
1.5
1
0.5
0To
nn
es‘m
illi
on
and
£‘b
illi
on
Tonnes ‘mn£ ‘billion
Figure 2.2: UK Fresh Fruit Market
Source: DEFRA as published in the Re-Fresh Directory 2006
UK production of vegetables supplies 62 per cent of the market, with imports providing
approximately 1.5 million tonnes. In relation to major African vegetable exports, the market
share for legumes (i.e. beans, peas) has remained at 3.8 per cent of total UK expenditure on
vegetables over the last three years.
The total value of the UK fruit trade in 2005 was £2.3 billion with a volume of 3.6 million
tonnes (Figure 2.2). In contrast to the important role played by UK farmers in vegetable
supplies, 90 per cent of fresh fruit by volume is supplied by imports. Approximately a third
of expenditure on fruit is accounted for by soft fruit and 9 per cent by tropical fruits.
Source: DEFRA as published in the Re-Fresh Directory 2006

10
2.4 Consumption trends
In the UK, F&V consumption is typically low. However, fresh fruit consumption increased
by 23 per cent between 1990 and 2000, while vegetable consumption remained relatively
stable despite sizeable variation between products. With the growing demand for
convenience F&V (e.g. pre-packed and cut) combined with growing health concerns, it is
anticipated that consumption of prepared F&V (including salads) will grow.
UK consumption of fruit and vegetables
UK household purchases of F&V (excluding potatoes) from 2001/02 to 2004/05 both in
grams per person per week (Table 2.2) and pence per person per week (Table 2.3) increased
by 0.2 per cent, but the table understates the rise because in previous years some fruit drinks
were recorded as fruit juices. While, household purchases of fresh fruit increased by 2.1 per
cent, overall fruit consumption (including processed and fruit juices) declined by a similar
amount.
Table 2.2: UK purchases of fruit and vegetables 2001/02 to 2004/05
(grams per person per week)
Household
Purchases
1975 1990 2000 2001/2 2002/3 2003/4 2004/5 % change2003/4 to
2004/5
F&V (excl. potatoes) 1,868 2,070 2,336 2,248 2,307 2,269 2,274 +0.2
Vegetables (excl. potatoes) 1,131 1,208 1,147 1,092 1,101 1,079 1,106 +2.5
All fruit (inc. processedand fruit juices)
1,156 1,206 1,190 1,168 -1.8
Fresh fruit 511 624 765 750 794 789 805 +2.1
Eating out purchases
Vegetables 34 34 34 33 -0.8
Source: UK purchases and expenditure on food and drink and derived energy and nutrient intakes in 2004-05
Table 2.3: UK expenditure on fruit and vegetables 2001/02 to 2004/05
(pence per person per week)
Household
expenditure
2001/2 2002/3 2003/4 2004/5 % change into2004/5
Vegetables (excl potatoes) 167 170 177 182 +2.8
Fresh fruit 150 159 163 167 +2.7
Source: UK purchases and expenditure on food and drink and derived energy and nutrient intakes in 2004-05
Overall UK demand has been relatively stable, but there is growth in specific produce, e.g.
exotic F&V, grapes, organic, fair trade and pre-packaged produce, particularly salads.
Overall the UK retail market for F&V is a relatively mature market with steady growth, led

11
largely by (exotic) fruits and prepared, pre-packaged vegetables. A study of the UK F&V
market between 1998 and 2003 showed overall growth in retail sales between 1998 and 2003
of 4 per cent in nominal values, but an actual decline in real terms (Mintel 2003). Since 2003,
there has been an increase in market volumes and value for both fresh fruit and vegetables,
which may be partly associated with the impact of the government message on fresh
vegetable and fruit consumption and the various government–funded campaigns such as the
‘5 a day’ and the School Fruit and Vegetable Scheme initiatives. As one in three people
believe that they do not eat five portions daily, there is potential to expand the market. The
fresh produce industry believes that fruit will continue to experience a rise in demand,
particularly through retail of processed products and demand in the food service sector.
Meanwhile, vegetables are seen as having fewer opportunities for growth (Anon, 2006).
The UK, with a population of 60 million, is marked by considerable income and ethnic
diversity. It has become a sizeable market for SSA produce. This is partly because of its
seasonal marketing windows, attractive prices, diverse consumption patterns and rising
demand for certain products. However, fresh F&V consumption varies by income group with
growth likely to be more buoyant in higher income groups: the upper income decile
consumes, on average per person, over 2.5 times the consumption of the lower decile
group (Anon, 2006).
UK society is increasingly polarised between rich and poor; consumption patterns are
markedly different between the socio-economic groups ABC1 (who account for about half
the population) and Groups C2, D and E. Group ABC1 invariably shop in major multiples
and demand premium and convenient food products. Lower income groups are more likely to
shop at markets or discount retailers. Non-white ‘ethnic’ groups are less likely to shop at
major multiples for F&V. The five million ‘ethnic’ people living in the UK have significantly
higher per capita F&V consumption than the rest of the population. (Mintel 2003)
UK consumption of organic F&V has been growing strongly and commands a price
premium. Sales have been encouraged by environmental concerns, food chain issues and
various food scares, and are likely to continue to grow quickly, particularly through
supermarkets. However, developing organic production can be difficult and risky and
certification (and preparation for certification) is costly, particularly for smallholders. In
addition, demand for organic produce varies across the food sector, with the foodservice
sector having a low requirement.
12
3 UK fruit and vegetable imports from sub-Saharan Africa and therole of smallholders
3.1 Introduction
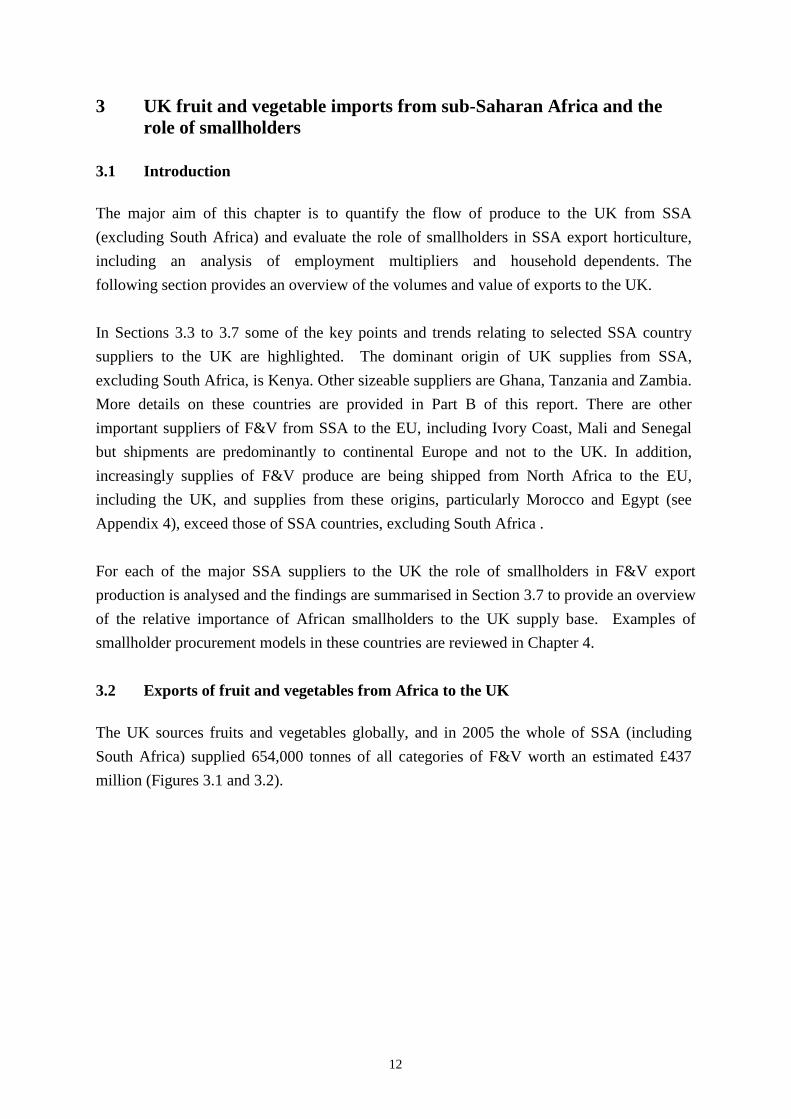
The major aim of this chapter is to quantify the flow of produce to the UK from SSA
(excluding South Africa) and evaluate the role of smallholders in SSA export horticulture,
including an analysis of employment multipliers and household dependents. The
following section provides an overview of the volumes and value of exports to the UK.
In Sections 3.3 to 3.7 some of the key points and trends relating to selected SSA country
suppliers to the UK are highlighted. The dominant origin of UK supplies from SSA,
excluding South Africa, is Kenya. Other sizeable suppliers are Ghana, Tanzania and Zambia.
More details on these countries are provided in Part B of this report. There are other
important suppliers of F&V from SSA to the EU, including Ivory Coast, Mali and Senegal
but shipments are predominantly to continental Europe and not to the UK. In addition,
increasingly supplies of F&V produce are being shipped from North Africa to the EU,
including the UK, and supplies from these origins, particularly Morocco and Egypt (see
Appendix 4), exceed those of SSA countries, excluding South Africa .
For each of the major SSA suppliers to the UK the role of smallholders in F&V export
production is analysed and the findings are summarised in Section 3.7 to provide an overview
of the relative importance of African smallholders to the UK supply base. Examples of
smallholder procurement models in these countries are reviewed in Chapter 4.
3.2 Exports of fruit and vegetables from Africa to the UK
The UK sources fruits and vegetables globally, and in 2005 the whole of SSA (including
South Africa) supplied 654,000 tonnes of all categories of F&V worth an estimated £437
million (Figures 3.1 and 3.2).

13
NorthAmerica
OtherAmerica
M East &N Africa
(excl EU25)
SubSaharanAfrica
Asia &Oceania
200
180160140120100
80604020
0
£m
illi
on
and
ton
nes
’00
0Figure 3.1: Regional exports of vegetables to UK for 2005
£ milliontonnes’000
NorthAmerica
OtherAmerica
M East &N Africa
(excl EU25)
SubSaharanAfrica
Asia &Oceania
1200
1000
800
600
400
200
0
£m
illi
on
and
ton
nes
’00
0
Figure 3.2: Regional exports of fruits to UK for 2005
£ milliontonnes’000
Source: HM Revenue & Customs Statistics and Analysis of Trade Unit (for HTS 07 and 08).
Source: HM Revenue & Customs Statistics and Analysis of Trade Unit (for HTS 07 and 08)3
If South Africa is excluded from the data, then in 2005, SSA countries exported:
73,788 tonnes of vegetables worth £105 million;
209,555 tonnes of fruit worth £89 million.
Disaggregating this regional data to focus on the target countries of the project highlights that
the volume of vegetables exported from SSA continues to be dominated by Kenya, who
3 Unless otherwise stated all data for each country is from the same source.
14
Eth
iop
ia.
30
25
20
15
10
5
0
£m
illi
on
and
ton
nes
’00
0
Figure 3.3: Export of vegetables from target countries toUK for 2005
£’million
tonnes’000
Gh
ana
.
Ken
ya
.
Tan
zan
ia.
Ug
and
a.
Zam
bia
.
Ivory Coast Ghana Kenya
30
25
20
15
10
5
0
£m
illi
on
and
ton
nes
’00
0
Figure 3.4: Export of Fruit from Sub-Saharan Africa toUK for 2005
£’million
tonnes’000
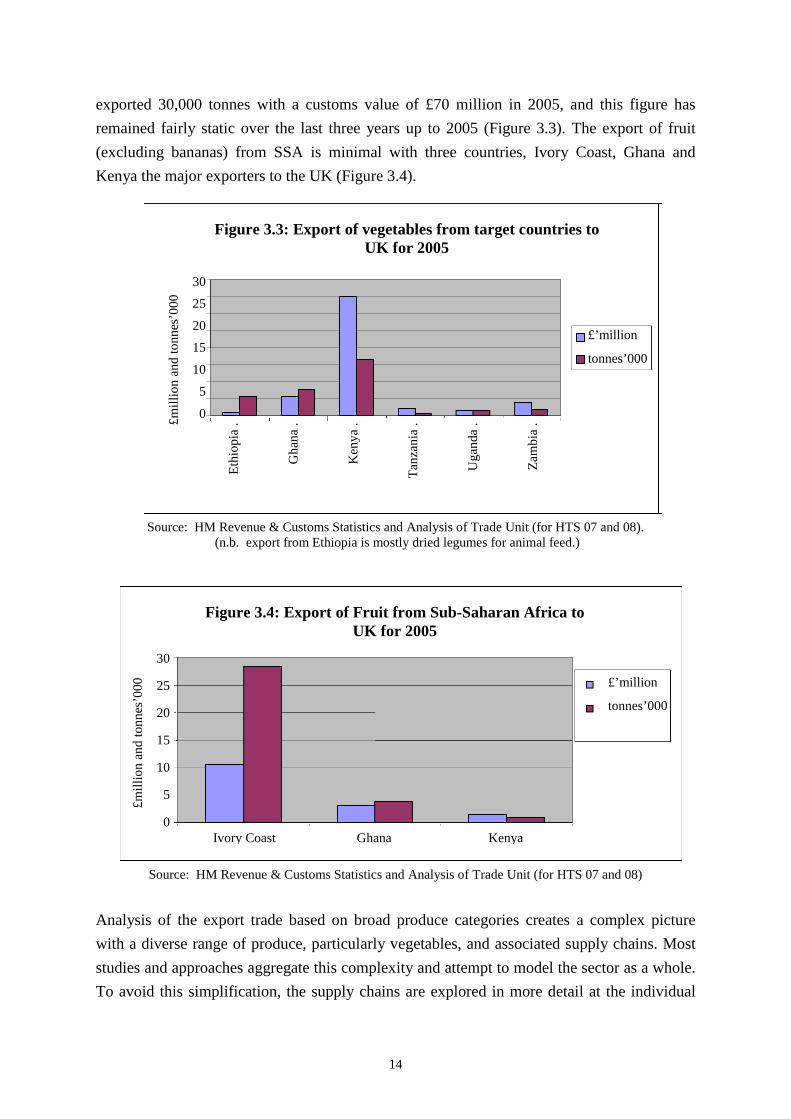
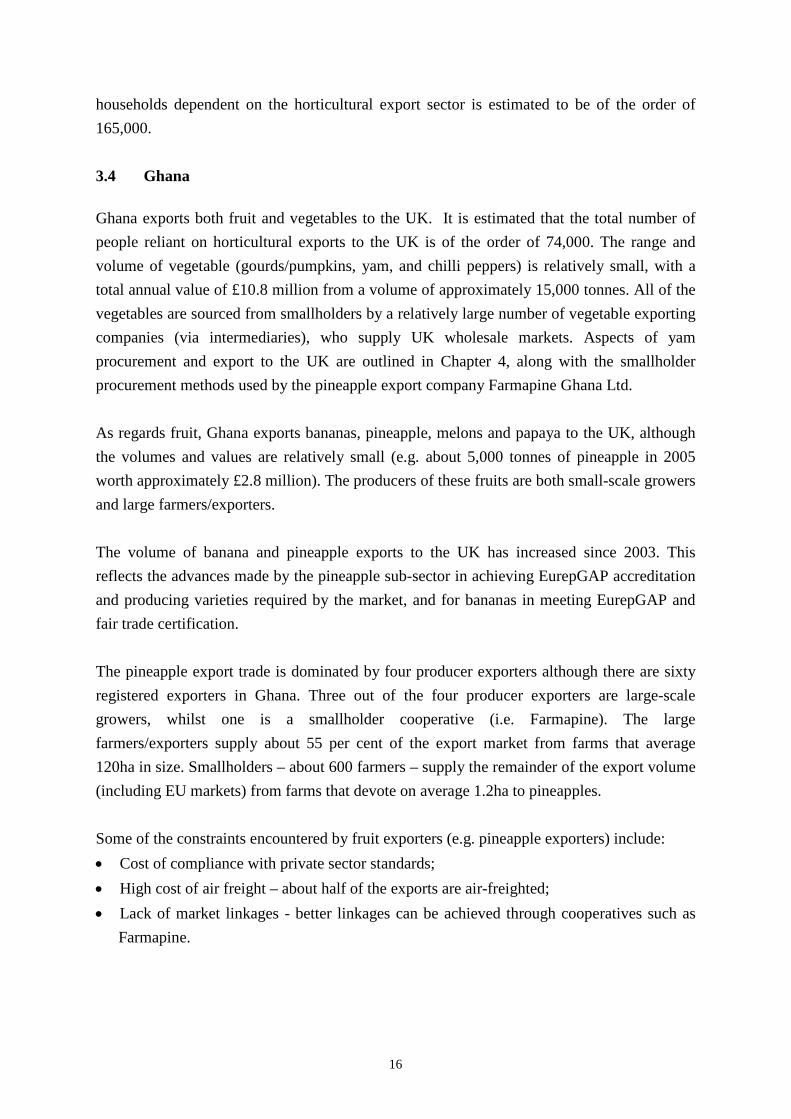
exported 30,000 tonnes with a customs value of £70 million in 2005, and this figure has
remained fairly static over the last three years up to 2005 (Figure 3.3). The export of fruit
(excluding bananas) from SSA is minimal with three countries, Ivory Coast, Ghana and
Kenya the major exporters to the UK (Figure 3.4).
Source: HM Revenue & Customs Statistics and Analysis of Trade Unit (for HTS 07 and 08).(n.b. export from Ethiopia is mostly dried legumes for animal feed.)
Source: HM Revenue & Customs Statistics and Analysis of Trade Unit (for HTS 07 and 08)
Analysis of the export trade based on broad produce categories creates a complex picture
with a diverse range of produce, particularly vegetables, and associated supply chains. Most
studies and approaches aggregate this complexity and attempt to model the sector as a whole.
To avoid this simplification, the supply chains are explored in more detail at the individual

15
country level and for each specific commodity in the individual country briefs presented in
Part B. A summary of the country briefs are presented below.
Almost all imports to the UK are direct from SSA countries, although there are occasionally
some re-exports. For example, small quantities of prepared Ethiopian green beans are
imported to the UK via the Netherlands but invariably the quantities are very small, for
example 17.5 tonnes in 2005 for all legumes (HS 0708). Not only is the role of entrepots
small but it would appear that the limited F&V re-export trade that exists for produce from
SSA is not on a regular basis.
3.3 Kenya: the major SSA country supplying the UK
In 2005, Kenya exported some 33,000 tonnes of vegetables and 955 tonnes of fruit to the UK.
Kenya is one of the world’s leading exporters of fresh green beans (French and runner beans,
snow peas and sugar snaps) as well as a minor exporter of tropical fruits (e.g. avocado,
papaya and passion fruit). Other vegetables exported include squash, peas, aubergines, chilli,
and sweet corn.
Key factors behind Kenya’s success are a dynamic private sector that has benefited from
structural and macro-economic reforms as well as an efficient transport hub. Approximately
75 per cent of exported produce is marketed through supermarkets, with the remainder
entering the wholesale and foodservice sectors (Jaffee 2003).
Exports of fresh produce from Kenya have been associated with significant smallholder
involvement. In the 1990s, researchers estimated that three quarters of horticultural export
production came from small-scale growers (SSGs). However, smallholder participation has
declined in recent years due to the high cost of managing smallholder outgrowers and the
need to have a critical size and number. It is readily accepted that smallholder involvement
has significantly declined due to pressures from EurepGAP compliance. The results of the
project’s recent surveys confirm that the number of vegetable SSGs has fallen from an
estimated 11,600 in 2004-05 to about 5,500 smallholder growers in 2005-06.
Export horticulture represents an opportunity for poverty reduction through income
generation among smallholders, rural labourers on larger farms, and unskilled or semi-skilled
processing factory workers. A number of studies have suggested that all of these benefit from
their involvement in the export horticulture sector, including rural labourers, and packhouse
workers (about three quarters of whom are women). Women also tend to play a leading role
in vegetable production on smallholder farms, according to one estimate accounting for two-
thirds of the hours worked over the course of a season. The total number of workers and their
16
households dependent on the horticultural export sector is estimated to be of the order of
165,000.
3.4 Ghana
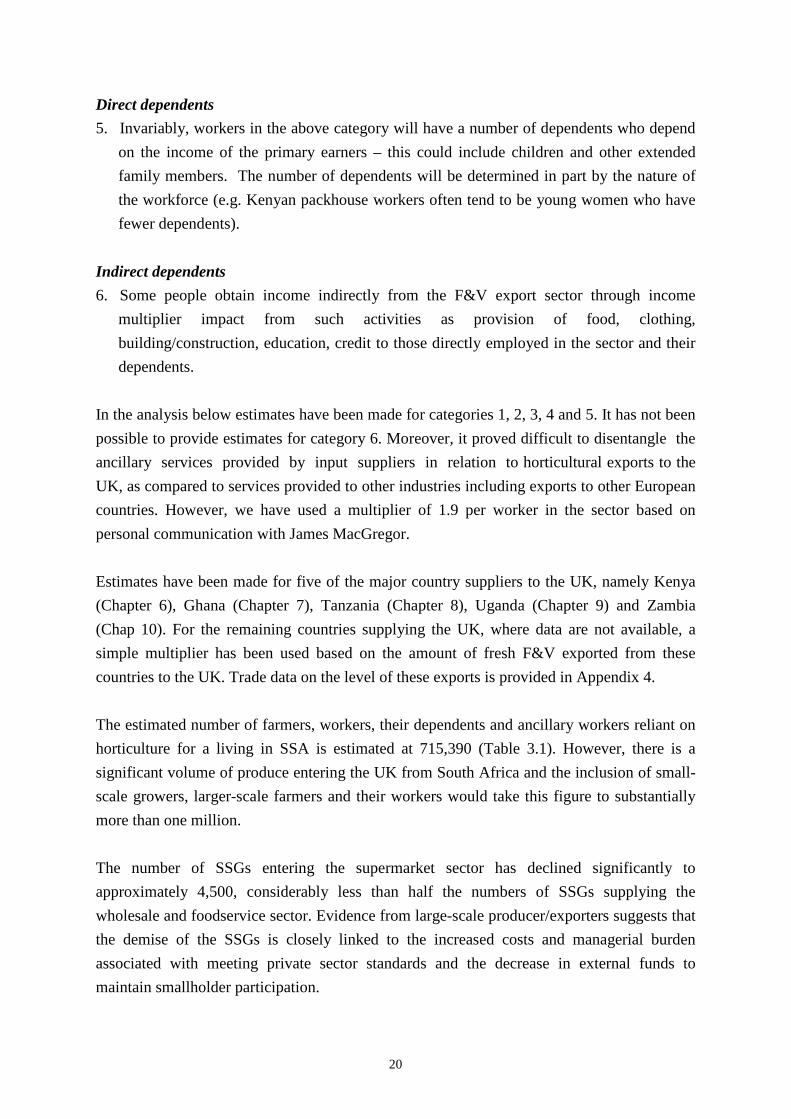
Ghana exports both fruit and vegetables to the UK. It is estimated that the total number of
people reliant on horticultural exports to the UK is of the order of 74,000. The range and
volume of vegetable (gourds/pumpkins, yam, and chilli peppers) is relatively small, with a
total annual value of £10.8 million from a volume of approximately 15,000 tonnes. All of the
vegetables are sourced from smallholders by a relatively large number of vegetable exporting
companies (via intermediaries), who supply UK wholesale markets. Aspects of yam
procurement and export to the UK are outlined in Chapter 4, along with the smallholder
procurement methods used by the pineapple export company Farmapine Ghana Ltd.
As regards fruit, Ghana exports bananas, pineapple, melons and papaya to the UK, although
the volumes and values are relatively small (e.g. about 5,000 tonnes of pineapple in 2005
worth approximately £2.8 million). The producers of these fruits are both small-scale growers
and large farmers/exporters.
The volume of banana and pineapple exports to the UK has increased since 2003. This
reflects the advances made by the pineapple sub-sector in achieving EurepGAP accreditation
and producing varieties required by the market, and for bananas in meeting EurepGAP and
fair trade certification.
The pineapple export trade is dominated by four producer exporters although there are sixty
registered exporters in Ghana. Three out of the four producer exporters are large-scale
growers, whilst one is a smallholder cooperative (i.e. Farmapine). The large
farmers/exporters supply about 55 per cent of the export market from farms that average
120ha in size. Smallholders – about 600 farmers – supply the remainder of the export volume
(including EU markets) from farms that devote on average 1.2ha to pineapples.
Some of the constraints encountered by fruit exporters (e.g. pineapple exporters) include:
Cost of compliance with private sector standards;
High cost of air freight – about half of the exports are air-freighted;
Lack of market linkages - better linkages can be achieved through cooperatives such as
Farmapine.

17
3.5 Tanzania, Uganda and Ethiopia
Tanzania
Tanzania’s horticultural export production base has two nuclear estates and currently some
2,070 SSGs supplying vegetables to the UK retail (dominant part) and wholesale markets.
The number of dependents associated with the export sector is over 32,000 and opportunities
for expansion exist.
Green beans represent the major export by far (i.e. close to 700 tonnes worth about £2 million
in 2005). Other produce includes peas, chilli pepper, sweet corn, and gourds. Tanzania does
not export any significant volumes of fruit.
The production area is viewed positively by supermarkets as an alternative source to Kenya
at certain times of the year having different climatic conditions and also possessing the
potential for expansion. One of the exporters, Gomba Estates, feels that export expansion can
be achieved by involving smallholders and has developed, with external support, an
intermediary management organisation, Market Intermediary Management (MIM) Limited.
MIM is discussed in greater detail in Chapter 4.
Uganda
Uganda exports a relatively small volume of fresh produce to the UK (i.e. just under 3,000
tons in 2005), okra being by far the main product. Other produce includes chilli pepper,
matooke and pineapple. About 500 tonnes of green beans was exported in 2004 but hardly
anything in 2005.
Overall, levels of exports over the last three years have remained fairly constant, despite
considerable donor-supported projects to the sector (although flower exports have increased
significantly under the same programme).
There are seventeen farmer/exporter companies but only one of these regularly supplies the
UK retail sector - i.e. Maiyre Estates. Whilst Maiyre Estates is able to access high value retail
markets due to its EurepGAP certification, Amfri supplies high value organic produce
markets, although it is also preparing for EurepGAP certification.
Together with another eleven companies these two firms also supply the wholesale markets.
Most companies are small, exporting 1-5 tonnes per week, but four companies export
between 15-25 tonnes per week each.
2,060 Ugandan small-scale growers are active in export production. 1,713 of these supply a

18
relatively wide variety of produce to the UK market - i.e. mainly the wholesale/catering
sector. Nonetheless, an estimated 200 SSGs also supply hot- pepper, chilli, and okra to the
UK retailers.
All the Ugandan produce is transported by air to the UK. Constraints encountered by the
export sector include:
Cost of compliance with private sector standards.
Lack of training of outgrowers in food safety, the safe use of pesticides, traceability
systems, and IPM techniques. • Lack of access to and high cost of air freight.
In total, it is estimated that the number of Ugandan large producer/exporters, SSGs,
employees and dependents involved in supplying the UK fruit and vegetable sector are close
to 32,000.
Ethiopia
Negligible quantities of Ethiopian produce other than dried pulses are imported into the UK.
Based on the rapid expansion of cut flower exports in part through substantial inward
investment efforts are being made to expand horticulture exports including semi-prepared
green beans. Some semi-processed and packaged green beans are re-exported into the UK
from the Netherlands. Some of the green beans are produced by smallholders acting as
outgrowers to existing producer/exporting companies. As volumes of produce exported to
UK from Ethiopia are negligible, they will not be discussed further as the absence of
information does not justify a separate chapter.
3.6 Zambia
Exports of vegetables from Zambia to the UK totalled £7.4 million in 2005, with peas (about
1,300 tonnes in 2005) and beans being the dominant products. Other vegetables include
sweet corn, chilli, and courgette.
Currently, production and export of produce from Zambia has been reduced because the rise
in the value of the Zambian kwacha versus the pound sterling has rendered exports of
produce uncompetitive compared to other African and particularly, Latin American sources.
This has had a negative impact on the opportunities for SSG involvement (i.e. only ten SSGs
are currently involved in the export sector) and employment opportunities in the large estate
sector have also been negatively affected. The number of SSGs, workers and dependents
involved in supplying the UK fruit and vegetable sector totals approximately 7,000.
The export production base is currently centred on two large producers/exporters – Borassus

19
Estates and York Farms Ltd. Both farms have EurepGAP certification, whilst the former also
grows organic produce under Eco-Cert. Shipments are handled by ZEGA (Zambian Export
Growers Association) and air freighted primarily to supermarkets in the UK, but also to
clients in South Africa.
In the past, smallholders exported from Zambia through Agriflora Limited but following the
collapse of Agriflora in July 2004 the farmers formed a secondary management level
cooperative known as the Lubulima Agricultural Commercial Cooperatives Union (LACCU).
LACCU has an active membership of 89 farmers out of a total of 500. The 89 farmers
exported via York Farms in 2005, but in 2006 macro-economic problems reduced
smallholder involvement in export horticulture to a low level.
3.7 Role of African horticulture exports for smallholders and employment
The main objective of this section is to provide estimates of the role of the export of fresh
produce to the UK as an opportunity for reducing poverty through income generation among
various stakeholders in the supply chain. In addition to the direct benefit to smallholders,
there are various categories of labour that can benefit from the sector and include:
Direct employment
1. Rural labourers are often directly employed by smallholders in producing F&V, many of
whom could be seasonal. It should be noted here that women often play a leading role in
vegetable production on smallholder farms (i.e. according to one estimate accounting for
two-thirds of the hours worked over the course of a season).
2. Labourers and other workers/employees on the larger farms.
3. Unskilled and skilled workers in the packhouse.
4. Workers employed in the provision of ancillary services to the sector e.g. inputs of seed,
fertilisers and tools; distribution, irrigation, transport, auditing, banking and credit
provision activities.
20
Direct dependents
5. Invariably, workers in the above category will have a number of dependents who depend
on the income of the primary earners – this could include children and other extended
family members. The number of dependents will be determined in part by the nature of
the workforce (e.g. Kenyan packhouse workers often tend to be young women who have
fewer dependents).
Indirect dependents
6. Some people obtain income indirectly from the F&V export sector through income
multiplier impact from such activities as provision of food, clothing,
building/construction, education, credit to those directly employed in the sector and their
dependents.
In the analysis below estimates have been made for categories 1, 2, 3, 4 and 5. It has not been
possible to provide estimates for category 6. Moreover, it proved difficult to disentangle the
ancillary services provided by input suppliers in relation to horticultural exports to the
UK, as compared to services provided to other industries including exports to other European
countries. However, we have used a multiplier of 1.9 per worker in the sector based on
personal communication with James MacGregor.
Estimates have been made for five of the major country suppliers to the UK, namely Kenya
(Chapter 6), Ghana (Chapter 7), Tanzania (Chapter 8), Uganda (Chapter 9) and Zambia
(Chap 10). For the remaining countries supplying the UK, where data are not available, a
simple multiplier has been used based on the amount of fresh F&V exported from these
countries to the UK. Trade data on the level of these exports is provided in Appendix 4.
The estimated number of farmers, workers, their dependents and ancillary workers reliant on
horticulture for a living in SSA is estimated at 715,390 (Table 3.1). However, there is a
significant volume of produce entering the UK from South Africa and the inclusion of small-
scale growers, larger-scale farmers and their workers would take this figure to substantially
more than one million.
The number of SSGs entering the supermarket sector has declined significantly to
approximately 4,500, considerably less than half the numbers of SSGs supplying the
wholesale and foodservice sector. Evidence from large-scale producer/exporters suggests that
the demise of the SSGs is closely linked to the increased costs and managerial burden
associated with meeting private sector standards and the decrease in external funds to
maintain smallholder participation.

21
Table 3.1: The numbers of small and large-scale farmers exporting to the UK retail and
wholesale sector and associated numbers of dependents and ancillary workers
Farmer
and
dependent
number
Market Ghana Kenya Tanzania Uganda Zambia Other
SSA
Totals
SSGs Wholesale 3,438 2,815 2,070 1,800 10 10,193
LSGs Wholesale 10 191 1 12 2 216
SSGs Retail 160 4,140 2 200 0 4,502
LSGs Retail 10 191 0 2 2 205
Dependents
and
ancillary
workers
70,433 171,237 30,330 29,963 6,948 308,910
Total 73,691 178,574 32,397 31,609 6,954 392,165 715,390
Whilst it may appear that the non-retail sector offers a market opportunity for SSGs from
Africa it is a complex supply arena encompassing the traditional wholesale market activities
(now dominated by ethnically-based traders) and the increasingly dynamic foodservice sector
supplying the growing catering trade. The latter is showing a higher rate of growth than the
other food sectors but is increasingly a more demanding supply chain with greater
governance exerted by the major foodservice supply companies. These companies are under
pressure to supply traceable, high quality produce and they are therefore demanding that
farmers comply with EurepGAP, BRC or their own in-house standards. These issues are
addressed in Chapter 4.

22
4 Trends in produce sourcing
Supermarkets remain wary of sourcing from small farmers. They realise that failure to meet
food safety or ethical trading standards can result in bad publicity and undermine their
position in the market place. Because of this, they believe that concentrating their grower
base will reduce their exposure to risk by giving them greater control over the production
and distribution processes.” (Dolan and Humphrey, 2000)
The export of horticultural produce from smallholders in Africa to the UK is only viable
when donors or large producing companies are able to provide some form of support to
smallholder operations. (UK horticulture advisor and consultant)
4.1 Introduction
This chapter provides an overview of the trends in the broad UK market sectors including
supermarkets, foodservice and wholesale, ethnic shops, and the role of various stakeholders
in the value chain, especially category managers (Sections 4.2 to 4.4). Private standards and
EU regulations have had an important impact on UK sourcing and their role and trends are
outlined in section 4.5, while the impact of possible trade liberalisation is discussed in section
4.6. Various procurement models, particularly those relating to smallholders are presented in
section 4.7.
The UK market has mostly become a highly demanding premium quality market. It is
strongly competitive and adequately supplied by existing sources. Competition and a
shrinking number of importers are driving down margins and increasing the risk that
suppliers who perform poorly in terms of quality or reliability of supply will lose market
share. In highly demanding, premium quality segments, it is very difficult for new suppliers
to enter the market place without sizeable investment and support and certification to satisfy
EU laws and retailer standards. Expanding sales in the UK market is therefore a significant
challenge for SSA producers and exporters.
4.2 The retail sector
As outlined in chapter 2, some 90 per cent of total F&V trade at the retail level is sold in
supermarkets (FPC 2006). The next most important retail outlets are greengrocers,
cooperatives and market stalls with volumes (values) of 247,000 tonnes (£258 million),
219,000 tonnes (£258 million) and 158,000 tonnes (£149 million), respectively.

23
Past
From the 1960s until 1980, supermarkets tended to undertake their purchasing via the
wholesale markets, although pioneer work at Marks and Spencer and Sainsbury’s was
beginning to show the value of buying against a specification, and starting to negotiate
directly with large farming groups and major cooperatives in the UK. From 1980 onwards
this process accelerated with all of the supermarkets developing programming of UK
supplies and later, overseas supplies, as the only way to ensure that their fast growing shelf
space remained filled. Much was made of enhancing the ‘value’ of the name of the
supermarket, and at the same time that programming commenced, the first ‘auditing’ of the
supply chain’s food safety and technical aspects took place.
Technical staff found that standards needed a significant boost, not least in the UK, where,
for example, pressure had to be applied to ensure that all soft fruit growers’ provided mobile
toilets and hand washing facilities for harvest staff. As the proportion of produce sold via
supermarkets rapidly increased, in parallel with the need to control and reduce the cost of
head offices, supermarkets increasingly relied on suppliers ‘self’ audits, backed up with a
supervisory visit from the customer. This had evolved by 2002 into a requirement that every
farm in the supply chain for every major supermarket submit (and pay for) a third party
audit. The audit is either to EurepGAP standards (or equivalent national standard) or to the
supermarkets' own standards. Whether, in practice, this is absolutely observed when supplies
from usual sources are in short supply is a moot point. At the same time, by 1997, all UK
pack houses serving supermarkets had to comply with BRC published standards, while
shortly afterwards all pack houses in the supply chain had to be audited and pass the BRC
standards.
Current – category managers
The concept of category management came into vogue with British supermarkets in the
mid/late 1990s. The often large number of suppliers4 of a category of produce e.g. melon
which might number 30-35 companies across the year was reduced to a single ‘category
captain’, with two or three ‘supporting’ companies. The ‘captain’ would supply about 50 per
cent of the total, with the balance supplied by the supporters, and the companies being
required to collaborate to ensure a full and uninterrupted supply of the category to the
customer. Although the elimination process was harsh on those who lost out, some of whom
had many years of loyal supply behind them, nevertheless, for the category captain and
supporters, they could expect to be able to plan for the long term, and be able to invest in the
supply chain. For the supermarkets, the benefit was to be a lower cost of produce, from
‘rationalisation’ in the supply chain, and a lower administration burden resulting from a huge
4 Suppliers are companies that source, consolidate, pack and distribute produce for retailers. Foodservicesuppliers will provide produce to restaurants, cafes, pubs and other catering operations e.g. schools.

24
reduction in the number of suppliers with whom they were dealing.
Future - auction
Whilst category management has been adopted at differing rates and in a variety of ways by
the leading supermarkets, a clear trend has evolved over the last three years. Some retailers
offer programmes that may run for an entire season or a significant number of months, giving
a degree of stability to the successful suppliers, whilst others offer quarterly reverse auctions,
with the programmes going to the lowest bidder(s). All those who supply under either regime
are expected to offer fully certified sources of supply. Whilst both systems operate with
seeming success, from the farmers’ point of view the quarterly reverse auction does not
appear to offer long term stability. In the last decade of the twentieth century the trend for
UK supermarkets had been to plan supplies well in advance, with pre-selected
exporters/growers so that a farm or cooperative entered a season with the assurance that
providing they delivered an agreed quality, marketing was more or less assured.
A sign of change may be the recent comment of Helen Browning. In the July 14 issue of the
Fresh Produce Journal the Soil Association’s food and farming director, Helen Browning,
said that Tesco, which was castigated last year for its less than wholesome treatment of
suppliers, has since had a noticeable change of heart. “There has been quite a significant
change in tactics and a shift in practice and Tesco has committed to longer-term supply,” she
says.
Other UK supermarket F&V sourcing strategies are constantly evolving with new models
being developed. For example, Walmart/Asda is cutting out the intermediary and
endeavouring to source directly from exporters and producers.
4.3 The non-retail sector: wholesale markets
Wholesale markets supply many of the smaller independent retail outlets, processors, street
markets, catering suppliers and foodservice outlets with fresh produce.
In the UK, where the percentage wholesale market value share (rather than the overall
volume of sales) has diminished, there are still some 37 remaining wholesale markets selling
fresh produce, with turnovers ranging from £5 million to £300 million a year. While these
markets handle mainly domestic fruit and vegetables, they still deal with a substantial
amount of imports. Some of the markets in the major cities (e.g. New Covent Garden,
Spitalfields and Western International markets in London, and the Birmingham and Bradford
markets) handle substantial amounts of exotic, ethnic and tropical produce.

25
The fortunes of the wholesale sector have varied in the last twenty to thirty years. Their
market share for supplying produce decreased dramatically in the 1990s with changes in
supermarket sourcing, and many traders exited the business, but on the back of an increase in
the foodservice sector, it then experienced a revival, particularly those markets in city centres
(see Table 4.1). For example, New Covent Garden in 1974 had some 200 traditional F&V
wholesale traders but this declined to 30 who have now experienced an upturn in business
through supplying small and medium catering companies and restaurants, often with an
ethnic focus.
Table 4.1 Performance of wholesale markets in the UK 1995-2004
Year Number of businesses Turnover (£ million)
1995 1,500 5,806
1996 1,789 6,545
1997 2,011 6,442
1998 2,111 7,822
1999 2,151 7,689
2000 2,193 7,654
2001 2,134 7,465
2002 2,094 8,108
2003 2,099 8,571
2004 2,096 8,438
Source: Office of National Statistics
Many new catering distributors have been established in the wholesale markets, often ethnic
specialists supplying into parallel restaurants and shops (Jaffee, 2003; FPC. 2006). For
instance, in Spitalfields there is a preponderance of Chinese and Turkish wholesalers who
supply low priced ethnic produce, with limited added value (compared to other catering
sectors). In Western International wholesale market, Asian ethnic wholesalers supply their
produce, particularly to west London and secondary wholesale markets in the West Country
e.g. Bristol. This growing ethnic community within the wholesale markets may continue to
offer opportunities for developing country producers, but it is difficult to predict the volumes
required.
A survey in 2002 of the destination of produce from the principal London wholesale markets
confirmed the importance of catering for two of the markets (Table 4.2).

26
Table 4.2: Destination of fresh produce from London wholesale markets in 2002 (%)
Spitalfields Western
International
New Covent
Garden
Retail 35 52 29
Catering 42 14 39
2o wholesalers 19 25 14
Processors 2 2 5
Other 1 7 13
Source: Saphire (2002)
More recent data on the segmentation of produce sold in the wholesale markets are scarce
(personal communication, Department of Horticulture, DEFRA). A project survey of some
wholesalers based in New Covent Garden Markets indicated an increase in supply to the
catering industry (e.g. restaurants, schools, hotels, prisons, etc) varying between 60 per cent
and 90 per cent of produce traded by the wholesalers.
It is possible to make approximations of the UK final usage of produce from the target
countries in the supermarkets, foodservice and other retail outlets e.g. ethnic stores and street
market stalls, based on: the above and other wholesale interviews on the amount of produce
being delivered from the wholesale to catering; the returns of the questionnaires from
catering suppliers detailing the produce currently imported from Africa; and in- country data
and observations (Table 4.3).

27
Table 4.3 Final retail and non-retail destination of fruit and vegetables exported to the
UK in 2005
UK Final Use (tonnes)
Volume
(tonnes)
Super-
marketFoodservice
Store &
markets
Ghana
Yams 8,302 0 830 7,472
Aubergines 102 0 77 26
Chilli pepper 993 0 745 248
Gourds, etc 5,401 0 4,051 1,350
Banana 5,172 4,655 388 129
Pineapple 4,884 4,640 0 232
Papaya 179 170 0 9
Total 25,033 9,465 6,090 9,466
% of Total 38 24 38
Tanzania
Peas 330 313 12 4
Green Beans 690 655 26 9
Chilli Pepper 36 34 1 0
Sweetcorn 84 80 3 1
Gourds 60 57 2 1
Total 1,200 1,140 45 15
% of Total 95 4 1
Kenya
Onions/leeks 312 234 59 20
Cabbages 412 309 77 26
Peas 5,047 3,785 946 315
Beans 19,619 14,714 3,679 1,226
Aubergines 775 581 145 48
Chilli 359 269 67 22
Sweetcorn 360 270 67 22
Asian veg. 5,760 4,320 1,080 360
Total 32,644 24,483 6,121 2,040
% of Total 75 19 6
Uganda
Chilli pepper 198 0 147 50
Okra 2,633 520 1,948 658
Pineapple 63 0 47 16
Matooke 148 0 110 37

28
Total 3,042 520 2,251 761
% of Total 17 74 9
Zambia
Brassicas 32 29 3 0
Peas 1,275 1,148 128 0
Beans 1,157 1,041 116 0
Chilli 277 250 28 0
Sweetcorn 559 503 56 0
Courgette 126 113 13 0
Squash 18 17 2 0
Total 3,444 3,100 344 0
% of Total 90 10 -
TOTAL 65,363 38,707 14,851 12,281
% TOTAL 59.2 22.7 18.8
Less yams 57,061 38,707 14,021 4,810
% TOTAL- less yams 67.8 24.6 8.4
Almost 60 per cent (by volume) of produce enters the supermarket sector, with 22.7 per cent
destined for the foodservice sector and 18.8 per cent for the non-supermarket retail sector. If
the estimates are made without yams, which are both a large component of the non- retail
sector and of minor importance in the catering sector, then the amount of produce flowing to
the foodservice sector increases to nearly 25 per cent, with only 8.4 per cent destined for
stores and market stalls.
The wholesale suppliers have paid great attention to the varying needs of the many
foodservice outlets and their suppliers. This aspect of the wholesale sector illustrates that
most wholesale traders have minimal contact with and governance of their supply base but
fully understand their customer needs5. This has created a wholesale supply chain that is less
efficient than the more highly governed supermarket supply chain. It means that producers
have less information on meeting new opportunities that exist for supplying specialist retail
and catering outlets.
In recent years, with the increase in food eaten outside of the home, companies in the
foodservice sector have changed their procurement practices opting for direct supplies in
order to meet their customer requirements and the wholesale markets have become less
important as suppliers (see below). This has meant both consolidation and a shift of these
companies away from the wholesale markets.
5 This lack of awareness of the wholesale supply chain was confirmed in project interviews in Spitalfields, NewCovent Garden and Western International.

29
With the catering sector moving towards greater governance of the supply chain and a
decreasing reliance on the wholesale sector, the future of wholesale markets is again entering
a phase of uncertainty.
Discussions with wholesale traders demonstrated a lack of awareness of the supply side in
relation to produce coming from sub-Sahara Africa. Project surveys of traders in both
Spitalfields and Western International markets, found that:
In both markets, SSA produce was available on about one third of the stands, but
never in large volumes, except for yams.
On the great majority of stands with African produce, it was sourced from the primary
importer/trader in the market.
Unlabelled pre-packs of African fine beans, curry leaf, sugar snap and mange tout
were all available in August – a traditionally ‘low’ time for imports.
Issues with African produce mentioned by stand staff included:
The need for growers to cooperate to achieve volumes;
Packaging quality – poor quality, insufficient information, brown card, poor printing,
lack of bright appearance to the carton;
Labelling was often inadequate; (recent figures released by DEFRA show that over 70
per cent of rejections on imported produce are for labelling deficiencies);
Post-harvest cooling;
Lack of infrastructure and poor logistics (particularly loss of temperature control)
between the farm and the airport in some countries leading to produce deterioration;
The poor handling of cartons at airports in the senders’ country;
Lack of knowledge concerning certification requirements – e.g. one importer believed
that to import organic produce into the UK he had to have his source certified by a UK
certification company.
To a lesser extent, some of the above findings were confirmed in discussions with traders in
New Covent Garden.
One of the major concerns of SSA exporters was that the F&V wholesale trade invariably
involves verbal agreements rather than contracts. This increases the insecurity faced by
producers and exporters throughout the sector. In addition many shipments are undertaken on
a consignment basis where the exporter/producer pays all the costs (e.g. shipping, insurance,
commission, etc.) to deliver the produce yet does not know how much he will receive until
the produce is sold. Consignment sales are typical of the wholesale F&V sector.

30
There are pressures on the wholesale sector to modernise and consolidate in order to
compete with retail and direct-access foodservice. For example, New Covent Garden has
became a one-stop-shop wholesale market, with the whole range of horticultural produce,
meat and fish, with further consolidation expected and increased targeting of marketing and
distribution to specific groups, including specialised foodservice and ethnic communities.
Efforts are being made to bring in food hygiene standards under the Good Practice Guide,
but the sector as a whole is still significantly behind in this area compared with both the
retail sector and the increasing demands of quality and traceability from the foodservice
sector.
4.4 The non-retail sector: foodservice
In the out-of-home food sector, an estimated 2,267 million meals were consumed in 2005
(TNS data) of which 32.4 per cent required fresh seed vegetables in bars/pubs; fruit salad
consumption is highest in hotels (32.8 per cent) compared to only 18.2 per cent in schools.
Within the foodservice sector, prepared F&V are seen as a growing and lucrative sector,
including targeting public sector procurement. Quick service restaurants, hotels and public
houses make up 80 per cent of catering sales and education and health outlets comprise 6 per
cent.
Foodservice or catering is commonly described as the provision of these meals outside the
home. The foodservice sector is more complex than the grocery retail sector being composed
of two broad categories of outlets:
profit sub-sector: restaurants, pubs, hotels and leisure;
cost sub-sector: staff catering, education, health care, custodial, government (e.g.
Army) and welfare.
In, addition to these outlets, there are a range of different types of foodservice supply
companies that deliver food to these outlets. However, the supply or distribution companies
operating in the foodservice sector do not necessarily do the same thing. Some companies
are called delivered wholesalers, procuring produce either directly from farmers or through
wholesalers and supplying produce to the operators i.e. foodservice outlets. Other companies
act purely as a contract distributor, and do not take title of the goods but offer only a delivery
function.
Some wholesalers do not deliver directly, particularly those in the large markets such as New
Covent Garden, but rather provide a cash and carry service.
Traditionally, the intermediary distribution companies for the foodservice sector sourced

31
F&V from the wholesale market. However, the supply side of the foodservice sector is
undergoing the same trends of consolidation with a relatively small number of large
companies such as Compass and Sodexho dominating the supply chain, either at point of sale
or in terms of processing and/or distribution. These large to medium sized companies have
moved out of the wholesale markets and now source their produce directly and have set up
regional distribution points. The move to regional market distribution centres, often out of
town with everything under one roof, has facilitated a great improvement in hygiene. In
addition, this permits customers to browse and order with delivery direct.
There is increased competition within the foodservice sector and the larger companies are
forming direct relationships with producers (e.g. Chef’s Direct) but these are predominantly
with European suppliers. Foodservice sector companies are also setting up fixed price
contracts. For example, Compass, one of the world’s largest foodservice companies, talks in
its public statements about one to two year price contracts with suppliers in its public
statements – far longer than supermarkets will go.
These companies work with a range of suppliers, with a tendency for long-term supplier
relationships e.g. 5-year plan of production, but their requirements are becoming as stringent
as those sourcing the supermarkets. Some companies, such as Compass, set their own
standards on quality, safety and traceability, whilst others use wider industry standards
such as EurepGAP and BRC. However, in public sector catering, EU procurement rules do
allow country of origin to be specified.
The scale of orders and volume for F&V is still relatively small compared to the supermarket
sector and should not be viewed as an easier option for producers without access to the retail
sector. Tesco probably buys as much produce as the whole foodservice sector combined.
There has been a big increase in prepared and pre-packed produce and large companies such
as Del Monte Foodservice offer prepared and pre- packed single fruits to a range of
customers such as Wetherspoons and British Airways.
Understanding these more fragmented and complex distribution patterns is one key for
farmers’ access. However, because of this increasing fragmentation and complexity of the
sector no data exist on the levels of imports and the category of produce purchased (Anon.,
2005a; Finlayson, 2004; Jenny, 2006). The project requested information from over twenty
companies from each of the wholesale and foodservice sectors but there was either minimal
knowledge or lack of interest in providing information on the produce flows. Nonetheless,
foodservice suppliers have identified the need for more research to assess the size and needs
of the sector (Anon., 2006). However, there is a difficulty in collecting data since in some
wholesale markets there are no statutory authorities obliged to collect such data.

32
Within the non-retail sector, the foodservice sub-sector is expected to show greater growth in
both volume and value (particularly for fruit and salads) than the other parts of the industry,
with the emphasis on fresh, good quality produce, ethically produced6 and sourced locally. It
has been estimated that the demand for fresh produce by the foodservice sector is growing by
4 per cent per annum and could equal that of retail by the year 2035 (Finlayson, 2004). Some
farmers and suppliers are increasingly seeing this sector as offering the greatest returns in the
future and not the multiple retailers. However, this sector is increasingly adopting similar
procurement practices to the retail sector. Traditionally this sector would obtain produce
through the wholesale sector but increasingly they are opting for direct supplies in order to
meet their customer requirements. Whilst this has meant both consolidation and a shift of
these companies away from the wholesale markets, there is a growing ethnic community
within the wholesale markets that continues to offer opportunities for developing country
producers.
Within both the retail and foodservice sectors there appears to be a trend towards more local
sourcing of produce in part encouraged by the increased ease of traceability as well as
environmental (“food miles”) and ‘buy British’ concerns. For example “3663” is reported to
be giving more attention to this, in part because of “chef’s voicing: (a) environmental
concerns and (b) vogue for quality, regional, & British”.
4.5 Public and private standards
UK consumers and regulatory authorities are increasingly concerned about production and
processing methods, labelling and product traceability. Increasingly food products have to be
monitored from “farm to fork”. This is a major reason why the standards required in the UK
(and EU markets) are now very demanding; they have been steadily broadening, across
several dimensions, including pesticide residues, environmental impact, traceability and
treatment of labour.
Key areas of EU legislation are trade policies, quality standards; food safety where HACCP
(hazard analysis and critical control point) analysis is the main tool used; pesticide residue
levels and organic standards.
Private sector standards and codes of practice play a key role in F&V supplies. Thus, the
supermarkets have established their own non-negotiable standards that are even stricter than
the basic EU regulations. UK supermarkets are generally considered the most demanding in
6 Organic produce is not showing the same increase in demand in foodservice as experienced in the retailsector.
33
the EU. The EurepGAP regime (European Retailers Protocol for Good Agricultural Practice)
will increasingly be the reference framework against which EU or non-EU producers will be
assessed. EurepGAP covers production activities up to the farm gate while BRC (the British
Retail Consortium) has developed standards to certify packhouses. Wholesale markets are
less demanding and have relatively straightforward purchasing criteria but standards are
rising and there is the likelihood that traceability will be enforced. Certainly in the
foodservice sector, which used to be predominantly supplied by wholesale markets, there is
an increasing demand for BRC and other standards to be met.
Pesticide usage
The harmonisation of European regulations on pesticide residues (Directive
91/414/EEC) has severely limited pesticide usage and has had a major impact on smallholder
horticulture exports to the EU, particularly the UK market. The legislation has entailed
the revision of some 834 substances, and often results in the removal of pesticides from
authorised lists if data have not been developed and submitted in the support of certain
crop/chemical combinations. Agro-chemical companies do not see the financial benefits of
financing crop-pesticide trials and developing dossiers for minor crops where there is a high
risk that the commercial returns would not the meet the high costs. Where dossiers have not
been prepared the maximum residue limit (MRL) has been set at the limit of determination
for a large range of crop/chemical combinations important for African producers. During
import controls, all products that exceed the limit of determination are rejected.
In most cases the regulatory authority will not impose any penalty other than the removal of
the produce. However, in certain circumstances where the produce can be traced back along
the supply chain this can lead to the irrevocable loss of the market for the farmer. This has
influenced the use of pesticides in producer countries, with either outright bans or
modifications to usage. The harvest interval (HI), i.e. the time between the last application of
the chemical and the date of harvest has, for some crops, been increased considerably e.g.
from 14 days to 80 days, to ensure the disappearance of any residues. This lessens the
protection these pesticides offer against pests and diseases. This has resulted in a
considerable increase in the level of rejections. This can lead to considerable loss of
revenue and inefficiencies, particularly for fruit where certain diseases (e.g. Anthracnose)
are only present symptoms at the point of ripening. This often occurs after the produce has
been shipped to the UK. It is not uncommon for whole consignments to be rejected by the
importer because of high disease levels where excessive costs that would be required to grade
out the diseased fruit. Importers will not pay for any diseased fruit and transport costs are
borne by the exporter. Work is needed on the benefits of CA transport in containers that
could overcome the problem in a non-chemical way.

34
The need to control pesticide use has led to a change in procurement practices. It must be
recognised that UK supermarkets have forced growers and their suppliers to enhance
production, logistics and packaging, food safety, environmental and ethical accountability
and full traceability, but this process has eroded the margins of many of those in the supply
chain, and has reduced their ability to invest in the source countries for long term growth.
A large number of the current production systems were established with certain varieties and
pest and disease management practices, making use of pesticides. In the past, a category
manager would have been able to have one producer/exporter supplying for the whole season
and only a few suppliers for the whole year, making use of pesticides to control disease
throughout the whole growing season. Now the category manager takes produce from
suppliers only over a short period (usually a window of four to five weeks) when diseases are
not prevalent. As soon as the favourable climatic conditions change, usually with the onset of
the rainy season, the category manager will switch to another supplier. Category managers
are increasing the amounts spent on testing produce for pesticide residues to monitor
chemical use and prevent problems before they arise.
In certain circumstances, importers are unable to source produce even though a demand
exists. For instance, category managers are unable to purchase passion fruit from Kenya
because farmers, predominantly smallholders, do not have the capability to provide fruit
without using banned pesticides and high levels of residues.
Paradoxically, some category managers have responded to the need to expand their supply
base by exploring opportunities to increase the involvement of smallholders, ideally in
locations where disease pressure is low. This is typically in dry regions making use of
irrigation. However, there is concern over:
o their ability to implement the necessary GAP systems, particularly in relation to pesticide
use and management;
o weakness in running the quality management systems;
o lack of logistical systems capable of delivering the produce from a large number of
smallholders;
o the long term sustainability of running and meeting the costs of the farming and GAP
systems.
4.6 Trade liberalisation
Another impact on the sourcing opportunities for the sector may come from greater trade
liberalization, although this may not have much of an impact in Sub-Saharan Africa. The
Euro-Mediterranean Partnership Agreement aims to establish a free trade area in the

35
Mediterranean region by 2010. Vegetable producers in Morocco and Egypt could make use
of their comparative advantage to further expand their F&V exports to the EU. Preferential
access to the EU has already been granted to Mediterranean Partnership Countries for a range
of fresh and processed vegetables: this process may also facilitate growth in other parts of
North Africa and the Middle East. This trend may be accelerated by a number of other
factors, including:
o advantages from using road vehicular transport on sea-going vessels counteracting
concerns around carbon emissions from air transport and potential increases in
aviation fuel prices;
o direct foreign investment in production systems;
o donor support to infrastructure improvements in cold storage and port facilities;
o proven ability to implement private sector standards such as EurepGAP;
However, modelling the impact of liberalization has indicated that there would be little
impact (up to 2.6 per cent increase) on horticulture output from the Middle East and Africa,
and a small increase in prices (Anon., 2005b). Reform of the vegetable sector has been
predicted to increase the welfare of developing countries by $15 million compared to $209
million in developed countries.
4.7 Smallholder procurement models
The export production of fresh F&V is highly fragmented and diversified, ranging from
small-scale farmers and farmer cooperatives to large-scale commercial farmers using modern
crop management systems and large estates owned by multinationals. The involvement of
large scale production businesses varies for different F&V. In some SSA countries, a few
large farming operations are responsible for a significant proportion of F&V exports e.g.
Homegrown in Kenya (vegetables) and Safina in Senegal (F&V). For a variety of reasons,
some of which are outlined above, there has been a tendency for large-scale production of
F&V to squeeze smallholders out of the export market. Nevertheless, there are a number of
schemes whereby smallholders have been involved in procurement, and some of these are
outlined below.
Outgrower and contracting out schemes
A sizeable proportion of Kenya’s initial horticultural export production was based on the
production of smallholders through contract or out-growing schemes. Similar schemes have
operated in export horticulture in other SSA countries including Ethiopia, Ghana, Zambia and
Zimbabwe. Under a contracting out scheme, a commercial large-scale grower or exporting
company provides the support which would otherwise make it impossible for smallholder
horticulture farmers to export, such as inputs of technical advice, finance, seed,
36
agrochemicals, cold storage, export logistics and marketing services. Outgrower schemes can
allow smallholders to benefit from export development. There can be additional advantages
to production by smallholders compared with larger commercial farmers: family labour is
cheaper; crop care may be better; labour motivation and management may be easier. Also
smallholders’ plots may reduce weather and disease-related risks because they are more
scattered. Contracting out to smallholders can be attractive to exporters since smallholders
bear all the production risks. Conversely, the arrangement transfers much of the marketing
risks to the exporter.
However, there are major obstacles to expanding horticultural exports to the UK and EU
from smallholder farmers. These are associated primarily with the difficulty of ensuring that
production meets the demanding buyer expectations with regard to reliability of supply,
product consistency and quality, and compliance with health, safety and audit requirements.
Providing sufficient support to a large number of dispersed smallholders in order to meet
these requirements is a costly and risky challenge for any commercial grower or exporter. In
Kenya, these difficulties underlie the contraction of smallholder exports to the UK and EU in
recent years and the corresponding concentration of export-oriented production in the hands
of fewer larger growers.
In addition, contracting out schemes have faced a number of other problems, including “side-
selling” when smallholders sell their product to competing buyers they undermine cost
recovery by the exporter who has provided them with inputs; loan default – some
smallholders given small loans to purchase inputs have defaulted on repayment; and creditors
have been reluctant to legally enforce their rights; high costs of production, for example,
irrigation investment and operation costs per hectare may be more costly for smallholders
than larger farmers; high post-harvest costs in that collecting output from dispersed
smallholdings is likely to entail relatively high transport costs and losses in transit because of
produce perishability (Dearden et al., 2002).
The Market Intermediary concept
A major Tanzanian horticultural exporter, Gomba Estates Limited (GEL), sees smallholders
as being an important source of export produce. To achieve this GEL has developed, with
external support, an intermediary management organisation, Market Intermediary
Management (MIM) Limited. The Market Intermediary (MI) concept is a smallholder
development method in which processors, traders or exporters promote the establishment of
intermediary entities to both access the production from small growers and develop with
them the capacity to successfully manage the production of export crops. It is a structured
system based on demand sided development of the market chain that argues small grower
capacity building should follow, and not precede, identifying and securing an export market.

37
Market Intermediary Management Limited (MIM) is a Tanzania registered company limited
by guarantee, which was set up as a non-profit organization to ensure clarity and
transparency. GEL is a group of Tanzanian registered companies involved in the production
and export of horticultural crops. At present they are the largest such company in Tanzania.
GEL has a 75 per cent shareholding in MIM and has supplied MIM with the GAP capacity,
the market and the MI conceptual structure. Gateway to Growth (G2G) is a UK-based NGO
specializing in the development of projects to bring African smallholders into the market
chain supplying the UK and continental supermarkets. G2G has a 25 per cent shareholding in
MIM. G2G has access to a very significant pool of experience in the fresh produce sector in
both technical and financial aspects.
Homegrown/Flamingo7
High value export horticulture is an attractive option for small-scale growers due to relatively
high prices and market stability, many exporters favoured using smallholder farmers for
reasons of quality, distribution of risk and political incentives. Prior to the introduction of EU
private standards such as EurepGAP, buyer specifications were comparatively simple and not
expensive to achieve. However, EurepGAP has caused a massive increase in costs and
technical and managerial capacity to achieve standard compliance. Most smallholder
exclusions are due to a combination of financial, technical and managerial issues.
One solution to these problems is to develop a paternalistic procurement model where the
exporter takes responsibility for all of the technical and managerial elements of EurepGAP
compliant procurement and also pays for most of the establishment and maintenance costs
associated with a compliant production system. A good example of the paternalistic model
would be the Homegrown / Flamingo outgrower scheme in Kenya. The Homegrown scheme
consists of 750 small-scale growers (0.01 – 0.03 hectares of beans per week) and 150 larger
outgrowers (>30 hectares of productive area) in nine regions of Kenya. Larger growers
operate as autonomous units with their own produce collection facilities, whereas the 750
SSGs are grouped (within ~3.5km) around sixty communal collection sheds. The outgrowers
grow fine beans, extra-fine beans, peas and baby corn on a rotational basis. In order to
manage the smallholder scheme the exporter employs 120 full-time staff, 70 per cent of the
activities of these staff are associated with standards compliance while just 30 per cent
are associated with production related issues. A summary of the key features of the
Homegrown outgrower scheme is provided in Table 4.3.
In essence, the exporter is hiring management and land capacity via the outgrower scheme.
7 All material in this section was sourced from personal interviews and the cost benefit analysis of Homegrownconducted by Dr Andrew Graffham in May 2006 as part of the standards project.

38
The advantage to the exporter is that the farmer is paying for the cost of unwanted produce
resulting from fluctuations in market demand and any problems with product quality and land
on the exporters own farms is made available for other purposes. In the paternalistic model
the exporter takes charge of all the management and technical aspects of the outgrower
scheme and pays for a significant share of the establishment and maintenance costs. This has
obvious advantages for the individual farmers, but is also useful for the exporter as increased
levels of management and control reduce the level of potential risk and increase buyer
confidence to accept sensitive products such as peas procured from the outgrower scheme. In
the Homegrown scheme individual farmers are responsible for purchase of agrochemicals,
pesticide storage on farm and spraying of pesticides according to the exporters instructions.
In some paternalistic schemes such as the former Agriflora and Hortico Agri-Systems
schemes in Zambia and Zimbabwe purchase and storage of chemicals was centralised and all
pesticide spraying was carried out by spray operators employed by the exporter. Centralising
all aspects of pesticide application reduces both costs and risks, but costs were borne by the
exporter whereas in the Homegrown scheme the costs of pesticide stores, knapsack sprayers
and protective clothing were paid by the farmers. Hence the exporter who owns and controls
the system is not concerned that 750 separate on-farm pesticide stores cost the farmers
£36,000 when this could have been reduced to £2,880 if storage was centralised at the
collection centres.
Small-scale growers in the Homegrown scheme have incomes from export vegetable sales
ranging from £417 to £1,250 per annum depending on the area planted, frequency of planting
and quality of final product (exportable percentage). EurepGAP compliance cost £636
per farmer to establish and £175 per annum to maintain, thus standards compliance accounts
for 14-42 per cent of yearly profits and individual farmers said that it took two to three years
to get a return on their investment. However, the paternalistic model practiced by
Homegrown is heavily subsidised by the exporter. Without support from Homegrown,
establishment costs for EurepGAP compliance would have been £1,819 per farmer and
£1,314 for maintenance of EurepGAP. The Homegrown procurement model offers a very
high level of management and control and reduces food safety risks to a very low level, but
the system is too costly and too complex for farmers to operate on their own without the
exporter.

39
Table 4.3. Key features of the homegrown outgrower scheme in Kenya – an example
of a paternalistic procurement model
Exporter responsibilities Farmer responsibilities
Legal responsibility for standards compliance as
the primary marketing organisation (PMO) of the
outgrower scheme
Management of the outgrower scheme including
an ISO compliant quality management system
Technical advice
Training
Technical support
Farm inspection and internal auditing
Sample collection and laboratory analysis
Maintenance and calibration of knapsack
sprayers
Crop scouting
Authorisation for pesticide spraying
Selection and approval of agro-chemicals,
volumes, re-entry periods and pre-harvest
intervals
Setting harvesting dates to comply with pre-
harvest interval of pesticides
Refrigerated transport from collection centres to
the main pack-house
Documentation
Vertical and horizontal traceability to plot level
Arrangement and payment for external audits
50% of overall establishment costs for the
outgrower scheme1
87% of overall maintenance costs for the
outgrower scheme
11% of costs for establishment of a EurepGAP
compliant system2
69% of costs for maintenance of EurepGAP
compliance
Provision of land
Provision of water
Provision of labour
Management of farm labour
Basic record keeping
Field markers
Cost of agricultural inputs
Storage of agro-chemicals on farm
Spraying of pesticides
Harvesting
Transport to collection centre
35% of overall establishment costs for the
outgrower scheme1
13% of overall maintenance costs for the
outgrower scheme
61% of costs for establishment of a EurepGAP
compliant system2
31% of costs for maintenance of EurepGAP
compliance
Cost of unwanted produce
1 15% of the overall establishment costs for the outgrower scheme were donor funded.2 28% of the establishment costs for standard compliance were donor funded.

40
Other models in Kenya
In order to reduce costs related to smallholder supplies two of the larger producers/exporters
procure produce through an organised smallholders vegetable marketing association called
the Fresh Link Marketing organisation using programmed intake volumes throughout the
season. The association has six groups of farmers with a total of 181 SSGs, 126 of which
have EurepGAP certification. Farm size varies from 0.25 to 1.5 acres. The association
provides the managerial and technical support to the SSGs.
Farmapine Ghana Limited
One of the constraints encountered by small-scale pineapple producers in Ghana is the lack of
market linkages. Farmapine Ghana Limited was formed to improve market linkages and
counteract export uncertainties and improve returns to growers. With assistance from donors
and the NGO Technoserve, this export company supports five smallholder cooperatives with
178 members. Through acting as a primary marketing organisation, the company was able to
increase the volume exported by the cooperative to the extent that production has reached
3,500 tonnes. Surveys have determined that Farmapine farmers have profits of about
US$450/ha with average member holdings of 2.2 ha, which is double that of non-cooperative
farmers. Although positive results have been achieved through the formation of Farmapine,
there are concerns that the true costs of funding the scheme and standards certification have
been achieved only through significant donor support and long-term sustainability will be an
issue once this support is withdrawn.
Ghana Yam Marketing
The yam export market to the UK is solely supplied by small-scale growers and should
represent an ideal opportunity for higher margins than the national market. However, the
following features of the sector negate this opportunity:
large national production base but exports represent less than 1 per cent of the
national output;
exporters mainly rely on intermediary traders which means a lack of traceability and
opportunities for due diligence;
poor post-harvest handling practices lead to relatively high losses;
exports to the UK are mainly by sea although the premium prices obtainable at the
start of the season enable produce to withstand the substantially higher air freight
costs;
exporters deal with a limited number of importers in the UK who themselves trade in
the wholesale markets in London and the Midlands;
produce is sold on a consignment basis, i.e. the importer pays for the produce once it

41
is sold;
returns from export markets are not passed on to farmers.
Efforts to regulate yam imports to the UK were encouraged by some of the major UK
importing companies who sent a representative to the Ghana in December 2000 with the aim
of working with the Ghana Yam Producers and Exporters Association to develop a scheme
which would bring greater regularity (and higher prices) to yam exports. A scheme was
agreed beginning January 2001 whereby approximately 6,000 boxes (25kg each) of yams
were to be shipped every ten days to the UK and the importers agreed to pay a price of £9 per
box for Pona and £8 for white yam, with the UK import group paying 50 per cent of the value
up-front. It was thought that the Government would promulgate a regulatory mechanism to
streamline and regulate exports but this proved to be impossible because of the impending
elections. Therefore, the scheme lacked the means of enforcement and as a result some
exporters and importers (“free riders”) continued to trade - and in the short term benefited
from the higher prices that the temporary ban created. Thus, the imposition of quotas was
dependent on moral persuasion rather than legally binding enforcement.
A further attempt at developing a quota system was made based on exporters using their own
packhouse to pack the yams in 25 kg boxes which were then despatched to a single Tema
packhouse managed by the umbrella organisation of several yam associations. At this transit
warehouse the yams were unloaded, X-rayed for drugs, quality checked and put on pallets.
However, this system has been abandoned because, according to some sources, some yams
were being exported without passing through the packhouse and also quality checks at the
packhouse were somewhat cursory.
Clearly more research is required to develop a marketing system that creates more benefits
for farmers.
Fair trade
F&V producers and exporters are under pressure to deliver better produce for lower prices
that can even fall below production costs. Fair trade (FT) initiatives have been developed in
order to pay fair prices mostly to smallholders and a number of F&V products from
developing countries are now sold as ‘fair trade’. Fundamentally fair trade aims to benefit
primary producers and attempts to sell their produce to a niche market of consumers that are
willing to buy goods that are identified as ‘fair trade’ and for the benefit of the producer,
often at a premium price.
There are two basic approaches to fair trade, namely the brand approach and the labelling
approach. The brand approach usually adopted by alternative trading organisations (ATO) is
42
a process approach, in which fair trade is expressed through the objectives of the fair trade
organisations and their practices. Performance standards are not set; rather the fair trade
organisation sets objectives for its trading relationships. In contrast to the ATO criteria,
which are based on the aspirations of the ATO for the nature of the trading relationship, fair
trade labelling criteria are specified quite clearly.
There are however some general principles that apply to a greater or lesser extent to both the
labelling and branding models. These are:
Pre-payment – smallholders often have difficulty in paying for inputs and so FT aims to
offer a percentage of the final price up front to reduce the credit barrier of small
producers;
Good price – aim to arrive at a mutually agreed price; in labelling there is a minimum
price, based on the international commodity price;
Price premium – some FT relationships involve the payment of a premium; this is
something over and above the minimum. It may be based on an assessment of what the
consumer is willing to pay for a FT product or a percentage of the operating profit of the
ATO (e.g. Oxfam Fair Trade Company sets aside a percentage of profits as a fund for
trade development);
Long term trading relationship - FT aims at building up trading relationships that last
longer than one buying season.
During interviews with supermarket supplier, a number of category managers saw fair trade
as a sustainable opportunity for small-scale farmers to gain a premium that would allow
investment in other certification schemes such as organic and EurepGAP.

43
5 Study findings
“Procurement from sub-Saharan Africa is only secure for 3-5 years, we are developing
relationships in South and South East Asia and North Africa. Key factors that will influence
future procurement are production efficiencies, transport systems (food miles) and water
supply.” Statement from several UK category managers.
The supply of fresh F&V from Sub-Saharan Africa to the UK represents a small percentage
of the volume of F&Vs traded in the UK. However, returns from certain produce line, such
as green beans from Kenya, have been important income-earning opportunities for those
smallholders that can access the high value retail market.
Despite its relatively small size, the trade from SSA to the UK is of enormous benefit to an
estimated 715,000 resource-poor small-scale growers (SSG), workers and their families
(Table 5.1)8. No aggregated data exist for the wider impact of high-value export horticulture
on African small-scale growers but individual studies have shown significant income
benefits for SSGs involved in export horticulture. For example in Zambia 73% of
smallholder farmers fall within the category of those experiencing money income poverty
with an average per capita income of £70 per annum (pers. comm., Graffham, 2006).
However, smallholders involved in export of peas and baby-corn to UK supermarkets had
incomes ranging from £1,000 to £7,500 during the 2003-2004 season with most growers
having an income of £2,000 to £3,000 per annum from export horticulture. In Kenya, a study
of farmers growing green beans for export to UK supermarkets found incomes ranging from
£417 to £1,250 per annum in rural areas where an annual household income of ~£100 is
considered normal.
Thus it can be seen that there can be considerable benefits in obtaining a place in the market.
However, this position is now under serious threat and the opportunity for SSGs to access
these high-value markets has declined dramatically over the past 6 - 18 months. The number
of SSGs from the case study countries supplying the UK supermarket sector has declined
significantly to approximately 4,500 in the last 12 months, a decline of over 50% (Table 5.1).
Most of the decline has occurred in Kenya, despite the large amount of donor support e.g.
USAID and EC Pesticide Initiative Programme. Kenyan SSGs supplying UK supermarkets
have declined by a half to 4,100 in the past year indicating how procurement patterns can
change rapidly. This indicates the harsh reality and high risk of supplying into this highly-
demanding sector. The SSG decline reflects the increased costs and managerial burden
8 If exporting SSGs and their dependents from South Africa (an important supplier of fruits to the UK) areincluded the figure would be substantially in excess of one million.

44
associated with meeting private sector standards and the decrease in external funds to
maintain smallholder participation.
The reasons for this are well documented and have their origins, in part, in the UK retailers’
response to the need to manage pesticide use. The need to control pesticide use has led to the
introduction and widespread demand for compliance to EurepGAP by UK supermarkets that
have forced growers and their suppliers to enhance production, logistics and packaging, food
safety, environmental and ethical accountability and full traceability. This process and
continuing enhancement of the requirements to meet the EurepGAP standards has eroded the
margins of many of those in the supply chain and has led to reluctance by category managers
and large producer/exporters to invest in supply chain from SSGs.
The decline in SSG participation in the export chain has taken place despite the relatively
large number of donor projects aiming to support SSG inclusion by supporting training,
infrastructure and certification costs.
Table 5.1: The numbers of small (SSGs) and large-scale (LSGs) farmers exporting to
the UK retail and wholesale sector and the associated numbers of dependents and
ancillary workers.
Farmer
number
Market Ghana Kenya Tanzania Uganda Zambia Other
SSA
Totals
SSGs Wholesale 3,438 2,815 2,070 1,800 10 10,193
LSGs Wholesale 10 191 1 12 2 216
SSGs Retail 160 4,140 2 200 0 4,502
LSGs Retail 10 191 0 2 2 205
Dependents
& ancillary
workers
70,433 171,237 30,330 29,963 6,948 308,910
Total 73,691 178,574 32,397 31,609 6,954 392,165 715,390
In contrast to the low number of smallholders involved in the retail sector, more than
double the number of SSGs is accessing the non-retail market (Table 5.1). It is important
to note that smallholders have a significant role in supplying non-retail markets even
though this supply chain, from farmer through to consumer, has received little attention to-
date compared to the focus devoted to the retail supply chains. The non-retail sector for
F&V encompassing traditional wholesale markets, catering and food service sectors may
represent a significant opportunity (currently 40 % of all F&V sold in the UK) for
smallholders given the lower barriers for entry in relation to private sector standards and

45
quality requirements (Class 2 is more readily accepted).
Nearly 25% of the volume of produce imported from the five case study countries in SSA
now flows into the catering sector (Table 5.2). Since smallholders are an important supplier
of produce into the foodservice sector, there would appear to be some opportunities for
market entry to replace the trade into supermarkets.
Table 5.2: Summary of final retail and non-retail destination of fruit and vegetables
exported from case study countries to the UK in 2005
UK final use (tonnes)Country/
commodity
Total volume(tonnes) Supermarket Foodservice Stores & markets
Volume of produce
exported
65,363 38,707 14,851 12,281
% of total 59.2 22.7 18.8
Less yams 57,061 38,707 14,021 4,810
% of total 67.8 24.6 8.4
However, farmers and distributors of imports must be careful not to view these as ad- hoc
markets which offer an opportunity to offload poor quality produce or surplus to supermarket
needs, a process that can ultimately only damage every one in the supply chain. In addition,
the returns to smallholders are relatively low and less secure because of the fragmented
nature and lack of integration of the supply chain. As noted in Chapter 4, there is little
governance in the traditional wholesale market sector. Wholesalers are seldom able to pay
great attention to the supply chain, beyond developing linkages with exporters, which has
created a wholesale supply chain which is less efficient with more wastage that the more
highly governed supermarket supply chain. This means that producers having less
information in meeting new opportunities that exist in the supply of specialist retail and
catering outlets. However, it is difficult to see within the present market structures who could
take the initiative to support sustainable and more integrated smallholder participation in the
wholesale supply chain.
In the past, the wholesale markets contained a number of companies that supplied produce to
the foodservice sector. This sector has expanded considerable with the increase in
consumption of food outside of the home. A few large companies are now beginning to
dominate the sector which has meant that the location and procurement practices of these
companies have moved away from the traditional wholesale approach. Foodservice suppliers
to the catering industry are becoming more like supermarket category managers and have
introduced a greater degree of governance to ensure higher quality, reduce the risk of
contamination and ensure traceability. A few companies now dominate the sector, with
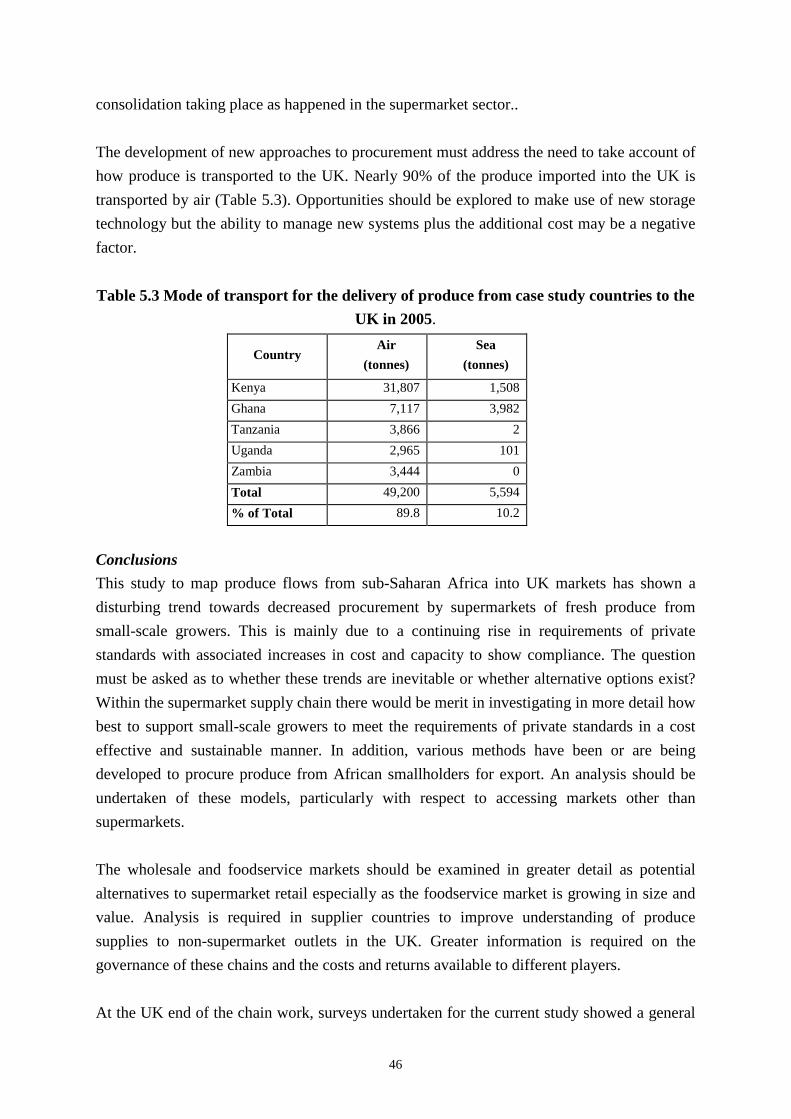
46
consolidation taking place as happened in the supermarket sector..
The development of new approaches to procurement must address the need to take account of
how produce is transported to the UK. Nearly 90% of the produce imported into the UK is
transported by air (Table 5.3). Opportunities should be explored to make use of new storage
technology but the ability to manage new systems plus the additional cost may be a negative
factor.
Table 5.3 Mode of transport for the delivery of produce from case study countries to the
UK in 2005.
CountryAir
(tonnes)
Sea
(tonnes)
Kenya 31,807 1,508
Ghana 7,117 3,982
Tanzania 3,866 2
Uganda 2,965 101
Zambia 3,444 0
Total 49,200 5,594
% of Total 89.8 10.2
Conclusions
This study to map produce flows from sub-Saharan Africa into UK markets has shown a
disturbing trend towards decreased procurement by supermarkets of fresh produce from
small-scale growers. This is mainly due to a continuing rise in requirements of private
standards with associated increases in cost and capacity to show compliance. The question
must be asked as to whether these trends are inevitable or whether alternative options exist?
Within the supermarket supply chain there would be merit in investigating in more detail how
best to support small-scale growers to meet the requirements of private standards in a cost
effective and sustainable manner. In addition, various methods have been or are being
developed to procure produce from African smallholders for export. An analysis should be
undertaken of these models, particularly with respect to accessing markets other than
supermarkets.
The wholesale and foodservice markets should be examined in greater detail as potential
alternatives to supermarket retail especially as the foodservice market is growing in size and
value. Analysis is required in supplier countries to improve understanding of produce
supplies to non-supermarket outlets in the UK. Greater information is required on the
governance of these chains and the costs and returns available to different players.
At the UK end of the chain work, surveys undertaken for the current study showed a general

47
ignorance of EU regulatory mechanisms amongst players in the major UK wholesale
markets. Hence primary importers and secondary sellers are currently unlikely in most cases
to be pushing for third country suppliers to meet the requirements of the law. As the new
regulations were only introduced in January 2006, and implementation is unlikely to be
complete until late 2007, this may be a factor of the implementation period that will change
by early 2008. Alternatively as fresh produce is generally considered a low risk it is possible
that enforcement agencies will focus resources on high risk products of animal origin and the
situation of loose enforcement for fresh produce will remain the same. It would be useful to
establish a dialogue with the relevant agencies and market associations to explore this area in
more detail. In a few cases primary importers in the Western International market in London
are already requesting higher standards and one importer had mentioned future requirements
for EurepGAP. If regulatory requirements become stricter or private standards become a
feature for wholesale markets it will have negative implications for African smallholders.
The foodservice market is a growing sector, but there is a need to characterise current and
future trends on food safety and quality requirements to determine if this sector will offer
opportunities for African smallholders. Given the difficulties experienced in establishing a
dialogue with players in this sector, it would be essential to involve appropriate sector
organisations to conduct the survey work. Also it will be necessary to provide a reason for the
industry to participate in such an exercise. Given recent problems with the unreliability in
terms of food safety and quality of some raw ingredients used in mass production of ethnic
foods a possible line of promotion would be to present the study as aimed at understanding
the needs of service sector and then determining cost-effective means by which the supply
base can meet the challenge of higher standards. This could be presented as a winning
scenario in terms of protection of brand image and avoiding problems with supply like those
experienced when the EU changed the regulatory requirements for Bombay duck in 1995.

48
Part 2: Country studies
6 Kenya
After South Africa, Kenya has been the most successful SSA exporter of horticultural
products, with exports exceeding $300 million per year. Kenya is one of the world’s leading
exporters of fresh green beans (French and runner beans, snow peas and sugar snaps). The
EU is the dominant market for Kenyan exports – and after Morocco it is the biggest fresh
vegetable supplier to the EU. Other markets for Kenyan exports include Saudi Arabia and
South Africa. Key factors behind Kenya’s success are a dynamic private sector that has
benefited from structural and macro-economic reforms as well as an efficient transport hub.
Vegetable exports
Kenya is the main exporter of fresh vegetables to the UK, exporting a range of legumes (fine
and extra fine beans, runner and bobby beans), peas (mange tout and sugar snaps), chilli
peppers, aubergines, sweet corn, squashes, okra, dudhi and other Asian vegetables. The
customs value of vegetable exports was approximately £33 million from a volume of 70,000
tonnes for 2005 (Figure 6.1). It has been reported that 75 per cent of produce is destined for
supermarkets and 20 per cent for wholesale (Jaffee, 2003).
Note: Other vegetable category includes squash, pumpkins, okra and dhudi.
Source: UK Customs and Excise Data
45
40
35
30
25
20
15
10
5
0
On
ion
s/leeks
Cab
bag
es
Peas
Bean
s
Au
berg
ines
Ch
illi
Sw
eetcorn
Oth
erv
eg.
To
nn
es’0
00
and
£’m
illi
on
Figure 6.1 Export of vegetables from Kenya to UK for 2005
£’million
tonnes’000

Bean and pea exports have experienced growth in exports over the last three years (Figure
6.2) but not the other categories.
Role of smallholde
Exports of fresh pr
smallholders. In the
from smallholders
involvement has d
there is no firm agr
per cent of fresh v
(SSGs). Therefore
which account for 9
SSGs. The results
falling from an est
2005-06 (Table 6.1
Figure 6.2 Export of vegetables from Kenya to UK for 2003, 2004 & 2005OSCABP
5000
0
2005
To
nn
es
CO
25000
20000
15000
10000
49
Source: UK Customs and Excise Database
rs
oduce from Kenya have been associated with a significant in
1990s, researchers estimated that 75 per cent of export prod
(Muendo and Tschirley, 2003). It is readily accepted that
eclined because of the pressures from EurepGAP complia
eement as to the current levels, with figures varying from 11 p
egetables and 85 per cent of fresh fruit provided by small s
data were collected directly from the main vegetable produc
0 per cent of exports, to determine their current sourcing of p
confirm that the number of vegetable SSGs has significan
imated 11,631 in 2004-5 to approximately 5,520 smallholde
).
ther
veg
.
weetco
rn
hilli
ub
ergin
e
eans
eas
abb
ages
nio
ns
2003
2004
volvement of
uction came
smallholder
nce although
er cent to 30
cale growers
er/exporters,
roduce from
tly declined,
r growers in

50
Table 6.1: Kenya: small-scale growers in vegetable export production 2004-06
ExporterLarge Scale
Growers
LSG
EurepGAP
certified1
SSG current
2005-2006
SSG 2004-
2005
SSGs
removed
SSGs
Certified1
1 150 150 750 750 0 750
2 6 6 300 1,180 880 50
3 1 0 14 400 386 0
4 2 2 360 360 0 0
5 3 3 55 300 245 0
6 2 2 33 107 74 33
7 2 2 182 305 123 126
8 2 2 170 500 400 18
9 2 2 2,000 4,000 2,000 200
10 1 1 0 240 240 20
11 20 1,656 3,489 1,833 N/D
Total 211 170 5,520 11,631 6,181 1,197
Source: Graffham et al., (2006)
1– As of September 2006, EurepGAP had issued 386 option 1 & 2 certificates for producers in Kenya,this implies that the figure for LSGs is greater than stated above, but it is difficult to determine howmany option 2 certificates have been issued as there is no set number of growers per certificate.
Export horticulture represents an opportunity for reducing poverty through income generation
among various stakeholders in the supply chain. This can include smallholders, rural
labourers on larger farms, unskilled or semi-skilled packhouse workers, as well as others
involved in the provision of inputs, transport and other services to the sector. Invariably,
these workers will have a number of dependents that could include children and other
extended family members. The number of dependents will be determined in part by the
nature of the workforce. In the Kenyan export vegetable sector most of the workforce is
below 29 years of age (McCulloch and Ota, 2002). Thus, packhouses employ mostly migrant
women (65 per cent) of which 86 per cent are less than 29 years old (men employees are also
of the same age range). On a typical contract farm, 60 per cent of the workforce is female (84
per cent under 29 years). In relation to household dependents, the average household size for
packhouse employees (where the majority have women-headed households) is 2.78 and for
large contract farms 2.55 and for SSGs 4.93 (McCulloch and Ota, 2002). Using this
dependency information with the data from the project survey presented in Table 6.1, it is
possible to estimate that the number of dependents reliant on the vegetable sector is close to
165,000 (Table 6.2) and almost 15,000 in the fruit sector (Table 6.3) making a total of almost
180,000 dependents.

51
Table 6.2: Kenya: Estimates of numbers dependent on the vegetable export sector
Factor Participants Notes
Number of exporters involved 1818 Largest 6 producer/exporters provide 60% of
exports (Jaffee, 2003)
Number of LSGs currently involved 191 From project survey data
Number of SSGs currently involved 5,520 From project survey data
Number of EurepGAP certified 1,197
Household dependents of SSGs 21,69421694 3.93 (excluding worker) from McCulloch and
Ota (2002)
No of permanent waged employees
of SSGs
11,040 Most labour from family
No of permanent waged employees
of LSGs & exporters
41,800 Estimate from project survey. Dolan and Sorby
(2003) estimate
30 -32,000 workers
No of dependents of LSG and
exporters
72,732 1.74 (excluding worker) from McCulloch and
Ota (2002)
Number of ancillary workers in the
fresh produce export industry
10,885 Estimate based on multiplier of 1.9 (pers.
comm. J MacGregor)
Total number of people reliant on
exports to UK
163,880
No of SSGs excluded by
EUREPGAP
6,181 From project survey data
Number of SSG dependants &
workers affected by EUREPGAP
exclusion
30,472 From project survey data
Although the number of vegetable smallholders has decreased significantly over the last year
or two, overall export volumes have been maintained through higher productivity per farm
improved agricultural practices and increasing farm sizes.
The reasons for the reduction in smallholder participation are well documented in the
literature, but one of the stated causes is the high cost of managing smallholder outgrowers
and the need to have a critical size and number. Others aspects of outgrower and contract
farming operations involving smallholders are discussed in Chapter 4.
In addition to the fresh produce exporters, there are over ten horticultural processing firms in
Kenya. The processes include canning, freezing, bottling, solar drying, dehydration or
preservation in brine. In the European Union, there is an increased demand for semi-prepared
foods, added value preparations/presentation and “easy prepare/easy eat foods”. Increasingly

52
a growing proportion of F&V exports are being further processed at origin. The majority of
Kenyan “added value” produce is destined for UK supermarket chains and the trend is likely
to continue.
Fruit exports
The volume of fruit exports to the UK has a small commodity range, mostly pineapple,
passion fruit and papaya, and a comparatively low volume. However, it represents an
important source of revenue for SSGs and an opportunity for growth (Figure 6.3). There have
been no consistent changes in the volumes exported to the UK over the last three years
(Figure 6.4).
Source: UK Customs and Excise Data
Source: UK Customs and Excise Data
Figure 6.3 Export of fruit from Kenya to UK for 2005
Avocado Papaya Passionfruit
700
600
500
400
300
200
100
0
£’0
00an
dto
nn
es
£’000
Tonnes
Figure 6.4 Volume of fruit exports from Kenya to UK for 2003,
2004 and 2005
Avocado Papaya Passionfruit
700
600
500
400
300
200
100
0
To
nn
es 2003
2004
2005

53
The production of avocados, papayas and passions fruit is predominantly a smallholder
activity, although there is little information or data on the structure of the fruit sector in
relation to the export market. Of the commodities, most is known about avocado because of
its greater importance with an overall export volume of 12,000 tonnes, mostly to France
(Dobson et al., 2003). The majority of the avocado crop is exported through six companies;
Kenya Horticultural Exporters (KHE), East African Growers, Sunripe, Indu Farms and
Vegpro but these companies rely extensively on smallholders (estimated to number 32,000)
who supply 85 per cent of the export volume (Dobson et al., 2003). From this data it is
possible to estimate the number of SSGs and their dependents to be approximately 1,435 and
12,626, respectively (Table 6.3).
Table 6.3: Number of farmers and dependents in the export of avocados to the UK for
2005
Factor Quantity Notes
Export volume to UK 633 12,000 tonnes exported annually
SSGs 1435Based on smallholder number of 32,000 supplying
85% of exports
Direct and indirect dependents 12,626 Based on average household size of 6.8 in Kenya
Total number of people reliant
on exports to UK14,694
Source: Dobson et al., (2003)

54
Map 6.1: Mapping vegetable supplies from Kenya to UKChain
ProducersThere are 6producers/exporterssupplying 60% ofexports
TransportDirectly by air byNairobi. Scheduledand chartered flights
ImporterRange of categorymanagers
Retailer
5,520 small-scalefarmers
191 large-scalefarmers
18 large-scaleproducers/exporters
Category managers
Supermarkets
Wholesalem
BRCauditors
EUREPGAPauditors
FOODPLUS
EUREPGAP
Nationalcompetentauthorities
BRC
UKCAs
UKCAs
BRCauditors
100
%A
IR7
5%
Constraints
High levels ofmanagement andassociated costs reduceopportunities for SSGaccess to markets
Fuel prices a concernplus availability ofspace on scheduledflights

55
7 Ghana
Ghana exports both fruit and vegetables to the UK. The range and volume of vegetables
(chilli peppers, gourds/pumpkins and yams) is relatively small, with a total value of £10.8
million and a volume of approximately 15,000 tonnes in 2005 (Figure 7.1). Smallholders
produce all of the vegetables to supply the UK wholesale markets. Ghanaian produce was
highly visible in the wholesale markets covered by the survey.
Source: UK Customs and Excise data
The volume of produce supplied to the UK has not shown any consistent trends in the last
few years (Figure 7.2).
Source: UK Customs and Excise data
Figure 7.1: Export of vegetables from Ghana to UK for 2005
Yams Aubergines Chillipepper
9,000
8,000
7,000
6,000
5,000
4,000
3,000
2,000
1,000
0
£’0
00an
dto
nn
es
£’000
Tonnes
Gourds, etc.
Figure 7.2: Volumes of vegetables exported from Ghana to UK for 2003, 2004
and 2005
Chilli pepper Gourds Yam
9000
8000
7000
6000
5000
4000
3000
2000
1000
0
To
nn
es
2003
2004
2005

56
Ghana exports bananas, pineapple and melons and papaya to the UK, although the volumes
and value are relatively small (Figure 7.3). The producers of these fruits are both small-
scale growers and large farmers/exporters.
Source: HM Revenue & Customs Statistics and Analysis of Trade Unit
The volume of banana and pineapple exports to the UK has increased since 2003 (Figure
7.4). This reflects the progress made by the pineapple sub-sector in achieving accreditation
and producing varieties required by the market, and for bananas in meeting fair trade
certification.
Source: HM Revenue & Customs Statistics and Analysis of Trade Unit Source
Figure 7.3: Export of fruit from Ghana to UK for 2005
Banana Papaya
6
5
4
3
2
1
0
£’m
illi
on
and
tonn
es’0
00
£’000
Tonnes
Pineapple
Figure 7.4: Export volumes of fruit from Ghana to UK
in 2003, 2004 and 2005
Banana Pineapples Papaya
6000
5000
4000
3000
2000
1000
0
To
nn
es 2003
2004
2005
57
The vegetable and fruit sectors represent contrasting supply chain models for the involvement
of smallholders in the export market to the UK.
Fruit supply chains
Pineapple exports
The pineapple supply chain from Ghana to the UK is illustrated in Map 7.1. Four producer
exporters dominate the export trade although there are sixty registered exporters in Ghana:
Jei River Farm – large-scale farmer/exporter
Koranco Farms - large-scale farmer/exporter
Prudent Farms - large-scale farmer/exporter
Farmapine – smallholder cooperative
The majority of production comes from two districts - the Awutu Efutu District and the
Akuapim South District. Production comes from about ten medium to large-scale operations
(average area of 120ha) and 300-400 smallholder farmers (1ha of production area). Slightly
less than half of the total pineapple production comes from the smallholder farmers. Average
yield of export quality fruit ranges between 10-20 metric tons per hectare from the
smallholder producers and about 30 metric tons per hectare from the large-scale producers
(Gogoe, 2004).
Most of the large producers have obtained certification, some encompassing outgrowers
under Option 2 certification. The exporters have formed associations to help market and
trade their produce. The largest of the exporters associations is the Sea-Freight Pineapple
Exporters Association of Ghana (SPEG). SPEG represents the interests of pineapple
exporters relying on sea-freight (77 per cent of pineapple exports in 2003) and has been
highly successful in developing a regular twice weekly freight service to three ports in
Europe.
The majority of the smallholders sell to export companies (except for Farmapine), but the
supply chain is mostly non-transparent, with three categories of SSGs:
outgrowers who have a direct relationship with exporters;
cooperatives who have no consistent direct relationship with exporters;
independent growers who sell whenever they can to exporters.
Although surveys suggest that there are over 600 smallholders that could supply the export
sector not all are able to gain access to the exporters. Recent project survey work indicates
that about 600 smallholders supply the main exporters who send produce to the UK

58
(personal communication, Graffham, 2006). This estimate could be compared with a survey
undertaken by Takane (2004) who surveyed smallholders and found that only 55 per cent of
smallholder pineapple farmers (about 300 nationally) were selling to exporters, and the
remainder sell at low prices on local markets or to processors, particularly at times of
abundant production. Furthermore, even if the exporters bought from the smallholders,
payment occurred after the exporter was reimbursed, which usually took several weeks or
even months.
In order to counteract this uncertainty and poor return, an export company, Farmapine Ghana
Limited, was formed to support five cooperatives of smallholders (with 178 members), with
the assistance from donors and the NGO Technoserve. Through acting as a primary
marketing organisation, the company was able to increase the volume exported by the
cooperative to the extent that production has reached 3,500 tonnes. Surveys have determined
that Farmapine farmers have profits of about US$450/ha with average member holdings of
2.2ha, which is double that of the non-cooperative farmers (Yeboah, 2005). Although this
approach has shown positive results there are concerns that the true costs of funding the
scheme and standards certification have been achieved only through significant donor
support. Long term sustainability will be an issue once this support is withdrawn and full
operational costs have to be met. The aspects raised above and other features of the pineapple
supply chain to UK supermarkets are presented in Map 7.1.
Banana exports
Ghana has a successful and expanding banana exporting sector centred on one company,
Volta River Estates, Limited (VREL). VREL has adopted a marketing approach of certifying
produce through fair trade. The premiums achieved through fair trade enable it to compete in
the highly competitive EU banana market. Fair trade premiums have provided increased
margins to assist in meeting the costs of running the estate and investment in achieving
organic certification. In the UK most of the bananas are sold through the Co-operative
Society.
Although VREL is a medium-sized company, developmental benefits are being achieved
through the creation of 720 permanent jobs in an area where income-earning opportunities
are seasonal and limited and additional jobs for some 2,000 women involved in the sale and
distribution of bananas from the company sold on the local market.
Vegetable exports
In contrast to the fruit export sector, exports of yams, chilli peppers and gourds are sourced
wholly from smallholders by a large number of vegetable exporting companies via
intermediary traders and agents. Using yams as a case study (see Map 7.2 for an overview of

59
the supply chain), the export supply chain has the following features:
o large national production base e.g. the national yam market is supplied by 600,000
farmers producing 3.5 million tonnes annually of which exports represent below 1 per
cent of the national output – this creates a lack of competition in some yam-growing
areas which leads to low and fluctuating prices for farmers;
o exporters rely on intermediary traders, wholesale markets and itinerant traders to
source produce and do not have direct contact with farmers which means a complete
lack of traceability and opportunities for due diligence;
o poor post-harvest handling is a feature throughout the whole chain leading to
relatively high losses - between exporters and importers, the maximum agreed rejects
is between 3 per cent and 10 per cent. Above that limit, the loss is counted as a cost to
the exporter.
o exporters trade with a limited number of importers in the UK who themselves
trade in the wholesale markets in London and the Midlands. However, there is
generally a lack of trust between exporters and importers and between traders in
the wholesale markets.
To improve trading conditions, attempts have been made to regulate the market through the
formation of the Ghana Yam Producers and Exporters Association, which tried and failed to
regulate the market through setting a quota for exports. However, there are over a hundred
exporters and not all joined the Association. Other associations have been formed including
an umbrella organisation, the Ghana Root Crop and Tubers Exporters Union (GROCETU),
which runs a central warehouse through which all exports are supposed to pass for inspection
and checking of documents. It is not clear what impact this would have on increasing returns
to farmers.
Smallholder involvement in the F&V export sector
Due to the nature of the supply chain, very little information is available on the number of
smallholders involved in exports. Estimates of smallholder numbers can be calculated based
on farm sizes, yields and export data for each of the commodities as shown in Table 7.1
below.
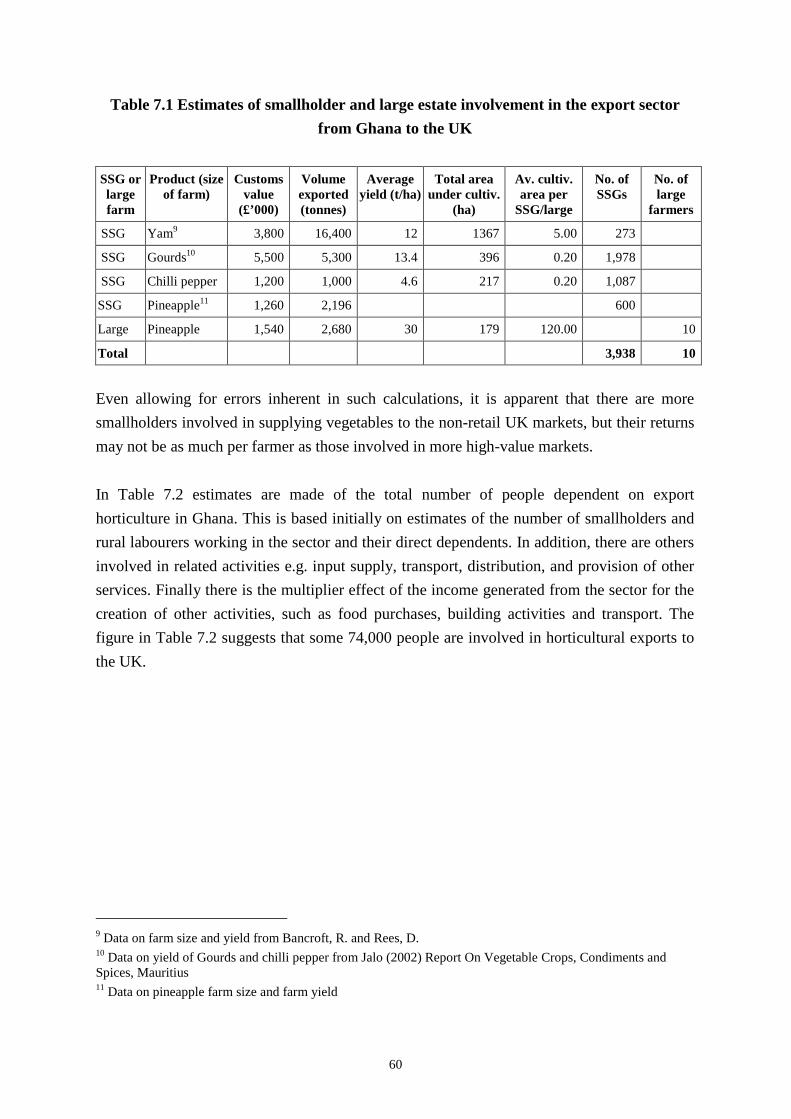
60
Table 7.1 Estimates of smallholder and large estate involvement in the export sector
from Ghana to the UK
SSG orlargefarm
Product (sizeof farm)
Customsvalue
(£’000)
Volumeexported(tonnes)
Averageyield (t/ha)
Total areaunder cultiv.
(ha)
Av. cultiv.area per
SSG/large
No. ofSSGs
No. oflarge
farmers
SSG Yam9 3,800 16,400 12 1367 5.00 273
SSG Gourds10 5,500 5,300 13.4 396 0.20 1,978
SSG Chilli pepper 1,200 1,000 4.6 217 0.20 1,087
SSG Pineapple11 1,260 2,196 600
Large Pineapple 1,540 2,680 30 179 120.00 10
Total 3,938 10
Even allowing for errors inherent in such calculations, it is apparent that there are more
smallholders involved in supplying vegetables to the non-retail UK markets, but their returns
may not be as much per farmer as those involved in more high-value markets.
In Table 7.2 estimates are made of the total number of people dependent on export
horticulture in Ghana. This is based initially on estimates of the number of smallholders and
rural labourers working in the sector and their direct dependents. In addition, there are others
involved in related activities e.g. input supply, transport, distribution, and provision of other
services. Finally there is the multiplier effect of the income generated from the sector for the
creation of other activities, such as food purchases, building activities and transport. The
figure in Table 7.2 suggests that some 74,000 people are involved in horticultural exports to
the UK.
9 Data on farm size and yield from Bancroft, R. and Rees, D.10 Data on yield of Gourds and chilli pepper from Jalo (2002) Report On Vegetable Crops, Condiments andSpices, Mauritius11 Data on pineapple farm size and farm yield

61
Table 7.2 Farmer, employee and dependent profile of the Ghanaian horticulture export
sector supplying the UK market in 2005
Market Wholesale/catering Retail Wholesale/catering
Produce type Fruit Fruit Vegetable
Types of commodities Pineapple, mango,papaya, melon(pineapple is majorexport others are minoritems)
Pineapple, banana (bananais limited by EC quota only1 farm involved relies onFT premium to becompetitive
Yams, gourds, chilli,dudhi, speciality Asianvegetables (aubergine,garden-egg, okra, tinda,guar, yard-long-bean)
Value (£) per annum £1,260,000 £2,940,000 £10,500,000
Number of exportersinvolved
47 13 420
Number of LSGscurrently involved
Same farms as retailsector are involved inproduction for wholesalemarkets
10 2
Number of SSGscurrently involved
100 500 3,338
No of certified LSGs 0 10 2
No of certified SSGs 0 32 0
Household dependents ofSSGs
600 3,000 20,028
No of permanent wagedemployees of SSGs
200 64 6,676
No of permanent wagedemployees of LSGs &exporters
Same farms as retailsector are involved inproduction for wholesalemarkets
2,000 2,110
No of direct dependentsof LSGs & exporters
380 12,000 12,660
Number of ancillaryworkers
469 994 7,144
Total number of peoplereliant on exports to UK
1,796 19,517 52,378
TOTAL 73,691

62
Chain
ProducersLarge-scaleproducers/exporterswith outgrowers.Smallholders supply45% of exporters asoutgrowers. Co-operatives operational
TransportAir and sea
ImporterRequires farmers tohave
125 small-scale farmers –1.2ha farm size Medium-scale farmers –
50 to 300 ha
11 large-scaleproducers/exporters
Category managers
Supermarkets
Wholesalem
BRC
Auditors
FOODPLUS
EUREPGAP
GhanaCAs
BRC
UKCAs
UKCAs
BRCauditors
48
%A
IR
Constraints
High levels ofmanagement andassociated costsreduce opportunitiesfor SSG access tomarkets
Lack of access andhigh cost of airfreight
Lack of awareness ofEC food and feedlaws
52
%S
EA
1-2%
Map 7.1: Pineapple supply chain from Ghana to UK
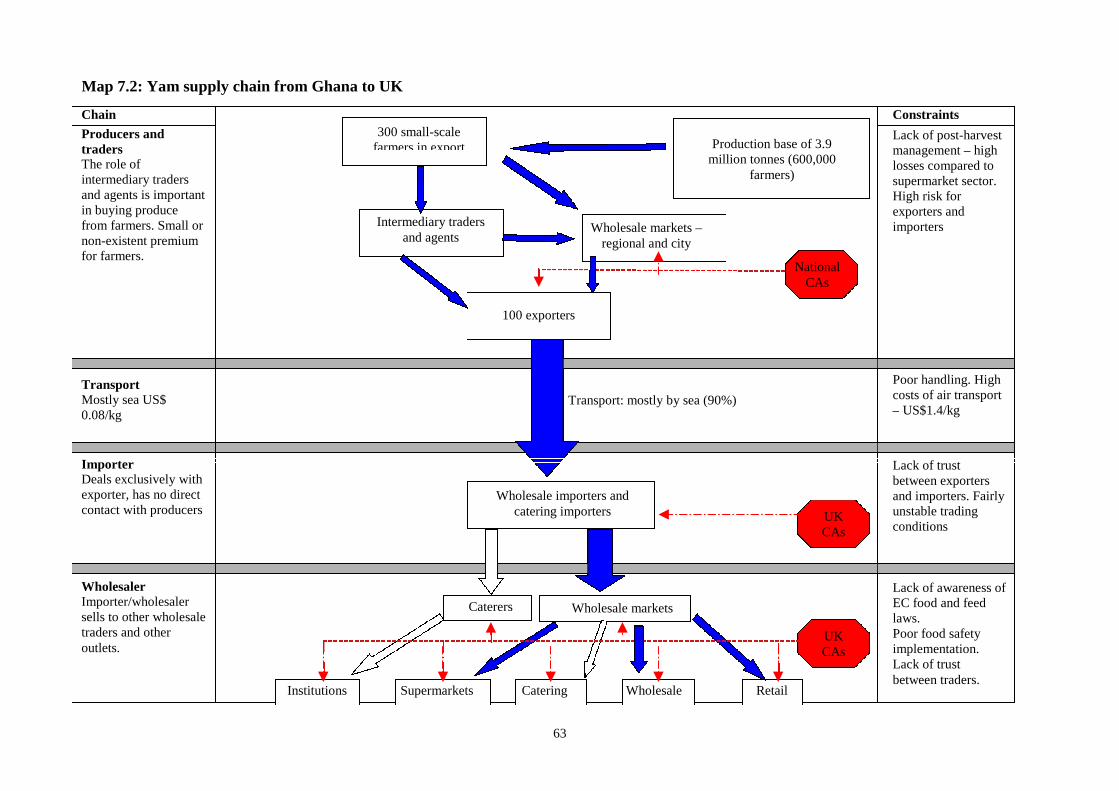
63
Chain
Producers andtradersThe role ofintermediary tradersand agents is importantin buying producefrom farmers. Small ornon-existent premiumfor farmers.
TransportMostly sea US$0.08/kg
ImporterDeals exclusively withexporter, has no directcontact with producers
WholesalerImporter/wholesalersells to other wholesaletraders and otheroutlets.
300 small-scalefarmers in export Production base of 3.9
million tonnes (600,000farmers)
Intermediary tradersand agents
Wholesale importers andcatering importers
Institutions
Wholesale marketsCaterers
UKCAs
NationalCAs
Constraints
Lack of post-harvestmanagement – highlosses compared tosupermarket sector.High risk forexporters andimporters
Poor handling. Highcosts of air transport– US$1.4/kg
Lack of trustbetween exportersand importers. Fairlyunstable tradingconditions
Lack of awareness ofEC food and feedlaws.Poor food safetyimplementation.Lack of trustbetween traders.
Map 7.2: Yam supply chain from Ghana to UK
Wholesale markets –regional and city
100 exporters
Supermarkets Catering Wholesale
Transport: mostly by sea (90%)
UKCAs
Retail

64
8 Tanzania
Tanzania exports a relatively small volume of vegetables to the UK (Figure 8.1) concentrated
on five products, although green beans represent the major export by far, with year on growth
since 2003 (Figure 8.2). Tanzania does not export any significant volumes of fruit, although
cashews are listed under fruit and nut exports (HTS 0802), with exports predominantly to
India.
Source: HM Revenue & Customs Statistics and Analysis of Trade Unit
Source: HM Revenue & Customs Statistics and Analysis of Trade Unit
Figure 8.1: Export of vegetables from Tanzania to UK for 2005
Peas Chillipepper
2500
2000
1500
1000
500
0
£’’
000
and
tonn
es
£’000
Tonnes
GourdsSweetcornGreenbeans
Chillipepper
GourdsSweetcorn
Figure 8.2: Volume of vegetables exported from Tanzania to UK for
2003, 2004 and 2005800
700
600
500
400
300
200
100
0
To
nn
es
2003
2004
2005
Greenbeans
Peas

65
The production base has two nuclear estates and currently 2,070 SSGs (pers. comm. Dr Alan
Legge – Gateway to Growth) supplying vegetables to the UK retails and wholesale markets
(Table 8.1). The number of dependents associated with the export sector is over 32,000 and
opportunities for expansion exist. The estimates are based on the number of smallholders and
rural labourers working on the estates and their direct dependents. In addition, there are
others involved in related activities e.g. input supply, transport, distribution, and provision of
other services. Finally there is the multiplier effect of the income generated from the sector
for the creation of other activities, such as food purchases, building activities and transport.
Table 8.1 Crop, farmer, employee and dependent profile of the Tanzanian vegetable
export sector supplying the UK market in 2005
Market Wholesale/catering Retail
Types of commoditiesChilli, gourds, green beans,
peas
Green beans, peas, baby
corn
Number of exporters involved 2 2
Number of LSGs currently involved 3 7
Number of SSGs currently involved12 2,070 0
No of EUREPGAP certified LSGs 0 7
No of EUREPGAP certified SSGs 16813 0
Household dependents of SSGs 12,420 0
No of permanent waged employees of SSGs 4,140 0
No of permanent waged employees of LSGs
& exporters0 1,400
No of direct dependents of LSGs & exporters 0 8,400
No of indirect dependents on the fresh
produce export industry3,933 0
Total number of people reliant on exports to
UK22,563 9,807
TOTAL 32,370
12 Based on information from large estates13 A further 1700 SSGs are being audited for EurepGAP compliance at the end of October 2006 (pers.comm.Gomba Estates Ltd.)

66
The production area is viewed positively by supermarkets as an alternative source to Kenya
at certain times of the year having different climatic conditions and also possessing the
potential for expansion. One of the exporters, Gomba Estates, sees that export expansion can
be achieved by involving smallholders and has developed, with external support, an
intermediary management organisation, Market Intermediary Management (MIM) Limited,
which is discussed below.
Supply chain
The supply chain map (Map 8.1.) highlights the steps and issues in the chain from Tanzania
to the UK. Exports for retail go through a category manager, a process that supports the
smallholder expansion plan.
Case study of managing smallholder entry in the UK market: Market Intermediary
Management (MIM)
The Market Intermediary (MI) concept is a smallholder development method in which
processors, traders or exporters promote the establishment of intermediary entities to both
access the production from small growers and develop with them the capacity to successfully
manage the production of export crops. It is a structured system based on demand side
development of the market chain that argues small grower capacity building should follow,
and not precede, identifying and securing an export market.
Market Intermediary Management Limited (MIM) is a Tanzania registered company limited
by guarantee. MIM was set up as a non profit organization to ensure clarity and transparency.
It is clearly understood that any profit or benefit developed by the smallholder entities set up
by MIM is for the SSG groups and does not accrue to the shareholders of MIM. MIM
therefore is a type of ‘firewall’ that allows capacity to flow to small growers from the private
sector but ensures that they receive their fair benefit.
Gomba Estates Limited (GEL) is a group of Tanzanian registered companies including
Gomba Development (holding) Gomba Export (processing and export) and Gomba growers
(farm management) involved in the production and export of horticultural crops. At present
they are the largest such company in Tanzania. Gomba Estates is 75% shareholder in MIM
and has supplied MIM with the GAP capacity, the market and the MI conceptual structure.
67
Gateway to Growth (G2G) is a UK-based NGO specializing in the development of projects
to bring African smallholders into the market chain supplying the UK and continental
supermarkets. G2G has a 25 per cent shareholder in MIM. G2G has access to a very
significant pool of experience in the fresh produce sector in both technical and financial
aspects.
Market Intermediary (MI) Concept
The MI concept as outlined above is applicable to a wide variety of agricultural crops where
there is presently no market access. The core issue is that processors, traders or exporters
who have a market for such crops develop production through the creation of
intermediaries, or ‘Market Intermediaries’, which will both access production for the
processors, traders or exporters and access capacity for producers to be able to comply with
the requirements of the exporter, and the ultimate purchasers.
Such a market intermediary role can be played through a number of different legal
frameworks (i.e. private entrepreneurs, management teams of cooperatives, private
companies and NGO’s) the emphasis within the MI system is on the structure of the market
chain. In general, processors and exporters need to have a significant economy of scale to be
competitive as even locally produced produce is effectively in competition with imports. By
definition small growers have a small economy of scale. When growers group together into
viable groups they invariably have no means of self developing their capacity. An MI is
simply a tool to allow the larger commercial entities that have market hold to interact
commercially with the smaller ones and allow capacity and product to flow.
Vision: the MIM vision is to create an entity that connects market to grower through creating
growers’ groups specifically tailored to fulfil contracted market undertakings. As MIM has a
connection to its first client (GEL) to create MIs for their supply, a track record is available
to encourage other processors and exporters. Experience in the EU market shows products
suitable for the area, namely baby corn and mangetout/sugarsnap peas are very much in
demand. Experience on the ground shows productive capacity is very much under-utilised.
The MIM vision starts with a market in the commercial sense, an entity that is ready to buy,
and works logically back from their developing a market chain that can also fulfil the
transfer of capacity back to the farmer.
Principal constraint: the infrastructure and technical capacity of farmers in Tanzania, for
export crops to meet the requirements of the EU market is in need of improvement.

68
However, the principal constraint in Tanzania is actually a cultural – political one in that
Tanzania is still in the process of change from a socialist to a market oriented economy. At
the same time the socio-economic cultural background is overwhelmingly subsistence
agriculture. These two aspects of the present developmental status of the country promote a
strong focus on smallholder development and a particular reluctance to let go of
preconceptions. This reluctance is evident all the way from the smallholder through the
social and political hierarchy. Developing smallholder market oriented programs has in the
past concentrated on trying to help them to grow better, rather than promoting those
structures which will bring market to them. A successful model needs to be built on
developing demand, not supply.
Method: The MI concept approaches the constraints in two ways both of which are
based on its core concept. This core concept is about the definition of market. To the MIM
the term ‘market’ is actual commercial contracts and transactions. The MI concept then
takes a real contracted commercial opportunity and moves step by step creating the capacity
in each entity. MIM applies this core concept two ways, namely communication and
flexibility.
Communication: the attractiveness of starting with a market in hand is clear to everyone in
principle, though it does not immediately dispel the established preconceptions. MIM’s
approach is to make sure that everyone is approached. A dialogue is undertaken with the
growers, the village authorities, the district authorities, the key officials, the Ministers and the
Donors.
The second important element is flexibility and MIM works in a structured manner moving
step by step from the established demand to supply. At each point of development the system
needs flexibility so that the structures created are appropriate. For instance the first MIs are
management teams of coops but in other circumstances they could be individual
entrepreneurs. In the first cases the farmers put forward 0.15ha at a time, which was generally
no more than 40 per cent of their land, but in other circumstances this could be very different.
The other way to look at the MIM’s modus operandi is in terms of risk and security. MIM
starts with a firm base of having secured an export market contract, programme or
understanding with an importer. At each step the most effective or lowest risk option has to
be developed in creating the market linkages. Such an appreciation of developing structures
cannot be made without a precise knowledge of what the market wants.

69
The first crop that the pioneer MIMs were asked to grow was baby corn. The market,
obtained by Gomba, existed in Europe, and the crop is straightforward to grow, and the
smallholders have been growing maize for years. It has proved a suitable trial crop, allowing
systems to be ‘bedded down’ before more demanding crops, such as mange tout, sugar snap
or podded peas are attempted. A future development can be to seek fair trade registration for
the grower groups.
The relationship between management and farmers is structured so as to guarantee
transparency and self-policing. Both the farmers, who know the price per kilogram at
planting, and the management, are present when the crop is harvested and yields are
recorded. Every cent goes back to the farmer who can average $700 over a 16-week
programme.
The project was recently visited by Paul Wolfowitz, President of the World Bank, who
viewed the project as an innovative approach that shows that using the country’s traditional
culture is not a barrier to economic progress and supports his point that sustainable economic
health in Africa depends on working with local customs and practices.

70
Chain
ProducersThere are twoproducer/exporters inTanzania:
- Gomba Estates;- Serenegti Estates.
2,070 smallholderscurrently exporting toUK.
TransportEither directly by airfrom Kilimanjaro orthrough Nairobi aftertravel by road.Scheduled flights
ImporterUK multiple
RetailerInterested inexpanding supply basefrom Tanzania.Smallholder schemerepresents a usefulmodel.
2,070 small-scalefarmers
2 large-scaleproducers/exporters
Category manager
Supermarkets
Wholesale andfoodservice
BRC
EUREPGAPAuditors
FOODPLUS
EUREPGAP
Nationalcompetentauthorities
BRCauditors
UKCAs
UKCAs
BRCauditors
10
0%
AIR
Constraints
Snow pea, mangetout& bean suppliersmust use four-yearcrop rotation withhigh land and waterdemands. Well-managed smallholderschemes offer thisopportunity. Highlevel of inspection bynational CAs.
Unpredictable costs –fuel prices are oneconcern.
Map 8.1 Mapping vegetable supplies from Tanzania to UK

71
9 Uganda
Uganda exports a relatively small volume of fresh produce to the UK, delivering just under
3,000 tons in 2005 (Figure 9.1).
Source: HM Revenue & Customs Statistics and Analysis of Trade Unit
Levels of exports over the last three years have remained fairly constant (Figure 9.2), despite
considerable donor supported projects to the sector (although flower exports have increased
significantly under the same programme).
Source: HM Revenue & Customs Statistics and Analysis of Trade Unit
Figure 9.1: Export of fresh produce from Uganda to UK for 2005
Chillipepper
3000
2500
2000
1500
1000
500
0
To
nn
esan
d£
’’0
00
Tonnes
£’000
MatookePineappleOkra
Figure 9.2: Volumes of produce exported from Uganda to UK for 2003, 2004
and 2005
Chillipepper
MatookeOkra
3000
2500
2000
1500
1000
500
0
To
nn
es
2003
2004
2005
Greenbeans
Peas Pineapple

72
Uganda has a relatively large number of farmer/exporters relative to the volume of produce
exported. There are 17 farmer/exporter companies and 2,060 small-scale growers active in
export production (Table 9.1). Of these, only one company, Maiyre Estates regularly supplies
the UK retail sector. They, also with another eleven companies, supply the wholesale
markets. Most companies are small, exporting 1-5 tonnes per week, but four companies
export between 15-25 tonnes per week each. Maiyre Estates is able to access high value retail
markets, supplying scotch bonnet pepper, chilli pepper, okra, and passion fruit, because it is
EurepGAP certified. Amfri supplies high value markets through producing organic produce
(IMO certified to EC/2092/91), although it is preparing for EurepGAP certification.
Table 9.1 Profile of large-scale producers/exporters and small-scale growers supplying
UK retail and wholesale markets
Exporter SSG 2005 SSG Future Tonnes
exported per
week
UK Retail
suppliers
UK
Wholesale
suppliers
Coseda14 120 0 4 0 0
Kakunyu 56 0 5 0 0
London F&V 205 0 15 0 1
Lusaka GR 50 50 8 0 1
Maiyre 200 0 20 1 1
Jaksons 85 0 3 0 1
Aseel 70 0 3 0 1
Sulma 126 74 3 0 1
Zijja 4 0 7 0 1
Sanena 16 14 3 0 1
Uga-fresh 75 0 3.5 0 1
Nami 26 0 1.5 0 1
Me Ent 50 0 0 0 0
Amfri 306 0 15 1 1
Sera 34 0 0 0 0
Flona 35 0 0 0 0
Icemark 602 0 25 0 1
TOTAL UK 2,060 138 116 1 12
Source: Data compiled by A Graffham from interviews with exporters
The number of large producer/exporters, SSGs, employees and dependents involved in
supplying the UK fruit and vegetable sector totals nearly 32,000 (Table 9.2 ). The
estimates are based on the number of smallholders and other labour working on the estates
14 Where companies are recorded as not supplying the UK market, they export to other EU countries.

73
and their direct dependents. It is not clear whether others involved in related activities e.g.
input supply, transport, distribution, and provision of other services are included. Also the
multiplier effect of the income generated from the sector for the creation of other
activities, such as food purchases, building activities and transport must be taken into
account.
Table 9.2 Profile of farmers, employment and dependents in Uganda fruit and vegetable
export sector
Market Wholesale and catering Retail
Types of commodities hot-pepper, chilli, okra,
matooke, ginger, dudhi, sweet
potato, red-bean, karela;
Pineapple, avocado, passion
fruit, mango, apple-banana,
papaya
hot-pepper,
chilli, okra
Number of exporters involved 12 1
Number of LSGs currently involved 4 1
Number of SSGs currently involved 1,860 200
No of EUREPGAP certified LSGs 1 1
No of EUREPGAP certified SSGs 0 0
Household dependents of SSGs 11,160 1,200
No of permanent waged employees of SSGs 3720 400
No of permanent waged employees of LSGs &
exporters
1200 100
No of direct dependents of LSGs & exporters 7,200 600
Number of ancillary workers in the fresh produce
export industry
3,564 386
Total number of people reliant on exports to UK 28,720 2,889
Total Dependents in Uganda 31,609
Source: Data supplied by A Graffham based on farmer interviews.
The supply chain is summarised below in Map 9.1.
Organic production, led by the initiative of Amfri, is seen as an opportunity for smallholders
to gain access to high value markets (large producers tend to concentrate on conventional
production systems). However, organic small-scale growers face many of the same problems
as conventional small-scale producers in relation to certification costs. In addition, they also
face specific problems, such as specific cultivation systems, and transportation and storage
costs may be higher, as organic products must be segregated from conventional ones.

74
Chain
Producers2 out of 13producers export toUK high valuemarkets. Wholesalemarkets are moreimportant for mostproducer/ exporters.
TransportAirfreight only
ImporterCategory managersrequires farmers tohave EUREPGAPand BRC.
Retailer
200 small-scalegrowers - retail
2 producers/exporters
Category managers
SupermarketsRetail
EUREPGAP and BRCauditors
FOODPLUS
EUREPGAP
UKCAs
UKCAs
10
0%
AIR
Constraints
Cost of compliancewith private standards.Lack of training foroutgrowers in foodsafety and the safe useof pesticides,traceability systems,training in techniques.
Lack of access to andhigh cost of air freight.
Wholesale marketsthreatened by lack ofawareness of Ec foodand hygiene laws.
Map 9.1 Overview of fruit and vegetable supply chain from Uganda to United Kingdom
BRC
11 producers/exporters
10
0%
AIR
Wholesale importers
Street markets Caterer
Wholesale markets
2o wholesalers
1,513 small-scalegrowers - wholesale

75
10 Zambia
The customs value of exports for vegetables from Zambia to the UK totalled £7.4 million in
2005, with peas and beans as the dominant commodities (Figure 10.1).
Source: HM Revenue & Customs Statistics and Analysis of Trade Unit
The volume of exports has not exhibited any consistent trends over the last three years
(Figure 10.2). Bean and squash exports have shown a decline.
Source: HM Revenue & Customs Statistics and Analysis of Trade Unit
Currently, production and export of produce from Zambia has been reduced to a ‘care and
maintenance' basis, because the rise in the value of the Zambian kwacha versus the pound
sterling has rendered exports of produce uncompetitive with other African and particularly
Latin American sources. Exports still continue but margins have been reduced for the
producers and exporters. This has had a negative impact on SSG involvement: only 89 SSGs
are currently involved in the export sector (Table 10.1). Also employment opportunities in
Figure 10.2: Vegetable exports from Zambia to UK for 2003, 2004 and 2005
4000350030002500200015001000
5000
To
nn
es
2003
2004
2005
Car
rots
Bra
ssic
as
Pea
s
Bea
ns
Ch
illi
Sw
eetc
orn
Co
ure
tte
Sq
uas
h
Figure 10.1: Export of vegetables from Zambia to UK for 2005
4000
3500
3000
2500
2000
1500
1000
500
0
£’’
000
and
tonn
es
£’000
Tonnes
Beans SweetcornChilliPeasBrassicas Courgette Squash

76
the large estate sector have declined (Legge, pers. comm.). The number of SSGs and
employees and dependents involved in supplying the UK fruit and vegetable sector totals
approximately 7,000 (Table 10.1). As explained in chapter 3 the estimates are based on the
number of smallholders and rural labourers working on the estates and their direct
dependents. It is difficult to estimate the number of other workers involved in related
ancillary activities e.g. input supply, transport, distribution, and provision of other services.
Similarly no estimates have been made of the multiplier effect of income generated by the
sector through the creation of other activities, e.g. food purchases, building activities and
transport.
The export production base is currently centred on two large producer/exporters, Borassus
Estates and York Farms Ltd, whose operations are briefly discussed below. Ten SSGs have
achieved EurepGAP certification in June 2006 and thus are able to export baby corn to UK
retailers via one of the major exporters.
Table 10.1 Farmer, worker and dependent profile of the vegetable export sector
supplying the UK in 2005
Market Wholesale/catering Retail
Produce type Vegetable Vegetable
Types of commodities Negligible amount of pre-cutcatering packs of baby-corn(volume and value unknown)
Peas, beans, chilli, baby-corn, courgette, squash
Tonnage per annum 0 3,800
Value (£) per annum £0 £7,400,000
Number of exporters involved 0 2
Number of LSGs currently involved 0 9
Number of SSGs currently involved 10 0
No. of EurepGAP certified LSGs 0 9
No. of EurepGAP certified SSGs 10 0
Household dependents of SSGs 350 55
No. permanent waged SSG employees 651 98
No. of permanent waged employees ofLSGs & exporters
0 800
No. of direct dependents of LSGs &exporters
4,800
No. of ancillary workers in the freshproduce export industry
150 40
No. of people reliant on exports to UK 1,140 5,814
Total no. of people reliant on exports toUK
6,954
No. of SSGs excluded by EurepGAP 0 437
No. of SSG dependants & workersaffected by EurepGAP exclusion
0 3,496
Source: Data obtained by Graffham

77
Borassus Estates
Borassus Estates specialises in legumes and herbs, producing mange tout, courgettes, sugar
snaps, tenderstem broccoli, fine beans, baby corn, and herbs for the UK market. The total
farm area is about 380ha, of which 70ha is given over to organic production (Eco-Cert). For
the remainder of the farm it has EurepGAP certification (Option 1). All shipments are
handled by ZEGA (the Zambian Export Growers Association) whose chilled warehouse
ensures the cold chain is kept unbroken. Produce is dispatched by airfreight primarily to two
category managers in the UK, but also to clients in South Africa.
York Farm Ltd.
The company consist of York Farm, where a range of vegetables are grown, and a large
packhouse where produce is packed for export. The farm is EurepGAP certified under Option
1 to export baby corn, chillies, leeks, onions, courgette, mange tout, sugar-snap peas and fine
beans. Packed produce is transported to Lusaka Airport where it is handled by the Zambian
Export Growers Association (ZEGA) Ltd and air-freighted primarily to one UK supermarket,
and to buyers in South Africa.
YFL have also been assessed to meet the Tesco’s Nature’s Choice standard. An increasing
proportion of the farm is being used for organic production (with EcoCert certification).
The YFL packhouse also packs produce from several other farms and outgrowers, including
Kashime Farm (sister to York Farm and under the same management) and the NZTT.
Kashime Farm is also EurepGAP and Nature’s Choice certified, all of the outgrowers are
EurepGAP certified.
Small-grower involvement in export horticulture
Historically (1999-2004), 447 small-scale growers around Lusaka were organised into eight
primary production cooperatives to grow baby-corn, mange tout and sugar-snap peas for
export via Agriflora Limited. Agriflora established a unit called Agriflora Small-Scale to
provide technical, managerial and logistical support for SSG production using a procurement
model modified from the systems used by Homegrown in Kenya and Hortico Agrisystems in
Zimbabwe. In the 2003-2004 season, 121 farmers were active with 64 working towards
EurepGAP and incomes ranged from £1,000 to £7,500 per annum with most growers
achieving incomes of £2,000 to £3,000 per annum. In July 2004, Agriflora Limited went
bankrupt thus depriving the SSGs of a market outlet, technical, managerial and logistical
support.
The farmers formed a secondary level management cooperative known as the Lubulima
Agricultural Commercial Cooperatives Union (LACCU). LACCU is farmer owned and run

78
and has the task of negotiating with buyers, input suppliers, financial institutions and
technical service providers. In addition LACCU provides a centralised quality management
unit and operates the produce handling facilities (depots) and a 10 tonne truck to collect
produce from the depots in the production areas. In October 2004, LACCU negotiated a
contract to supply baby corn to York Farms Limited but were unable to get a contract to
supply peas as the exporter was wary of food safety risks associated with production of peas.
Reduced volumes and a drought made the 2005 season difficult and only 89 farmers grew
crops for export with 25 working towards EurepGAP. Between November 2005 and January
2006, increases in the value of the Zambian kwacha and the introduction of harsh taxation on
agricultural inputs and produce sales reduced the number of growers to ten and these
growers achieved EurepGAP certification in June 2006. The exporter was pleased with
production in the 2005 season and had planned to increase the value of produce procured
from SSGs from £91,000 to £170,000 but due to the economic conditions orders were
reduced to £12,870. The future of SSG involvement in Zambian export horticulture remains
uncertain and will be determined by macroeconomic factors rather than the ability of farmers
to meet buyer requirements for food safety and good agricultural practice.

79
Appendix 1: Terms of reference
Smallholder production of fresh produce in Africa – mapping different value chainsto the UKThere is strong evidence that exporters are moving away from the smallest of growers, notbecause of product quality or productivity, nor with a scientific basis, but because oftransaction costs associated with private retailer standards, both in terms of managing theirimplementation and demonstrating compliance. At present, it is not clear whether productionby small-scale farmers throughout Africa destined for export to retailers abroad can remainviable. The cost-price squeeze generated by downstream industry participants includes lowerprices but is underscored by higher standards of production and is increasingly felt byproducers. Still, these export markets remain considered lucrative and sought-after. Otherprocurement practices of retailers, particularly supermarket chains, contain implicit yet non-financial/ non-price standards and barriers to entry to markets. These include imposing finesif delivered short and requirements of continuity of supply— which in turn requires advancedtechnology—and can work against small-scale producers. The standards issue compoundsother constraints facing sub-Saharan African production, such as high costs of air-freight,lowering their competitive advantage. Additionally, there is widespread perception that thecost of training, certification, internal monitoring currently has to be paid from outside. Nosmallholder group in Africa has achieved certification on its own, including paying for it.
There are several schools of thought about how to reverse the marginalisation of small-scaleproducers and SMEs.1. Some people support: sharing costs and risk between retailers and small-scale producers;
or at least contributing to the initial investments required for small-scale producercompliance and certification such as training and shared responsibility for raisingstandards; or translating certification into better margins for producers, because currentlythere are no premiums.
2. Another option for retailers could be the implementation of policies to source a portionof their produce from small-scale producers.
3. Other opinions hold that retailers will not pay more and therefore we must search forefficiencies in implementation and certification. This includes emphasis on bringingdown the cost of certification, e.g. through establishing national accredited bodies.
The parent project, over a three-year period, will work with food retailers, manufacturers,standard-setting bodies, traders and producers to look at all three options, towards ensuringthat supply chain standards and other procurement practices do not unduly discriminateagainst small-scale producers in developing countries. The project focuses in particular onexport horticulture in Africa, in the context of the Africa Commission report, the focus onAfrica within the 2005 UK G8 Presidency, and the debate on the private sector’s role indevelopment.
As a starting point it is agreed that the project is primarily about finding ways to applypolitical leverage to make positive changes to existing systems that lead to more favourableconditions for access to high-value EU markets by small-scale growers (SSG) in sub-Saharan Africa.
One aspect of the initial work is an activity to map the involvement of African SSGs insupplying produce to UK markets (with emphasis on detailed characterisation of UKmarkets) by determining origin of produce, types of produce, volumes, values and numbers

80
of SSGs involved and destination markets. This work is UK-based, involving visits to UK-based supply chain participants and stakeholders to gather information on their roles andrelevant views on proposed changes.
Terms of Reference for consultancyFor the activity on mapping smallholder involvement in supplying UK markets NRI & IIEDwish to commission a consultant to undertake a short-term study under the project Small-Scale Producers and Standards in Agrifood Supply Chains. The objective is to answer thefollowing research questions:
1. What is the relative importance of different fresh produce value chains from Africa tothe UK, specifically the supermarket and non-supermarket chains?
2. How does the structure and regulation of each chain affect the ability of smallholdersto be players in those chains? What are the trends?
3. What are the principal keys to inclusion of African producers in general andsmallholders in particular in exporting to the UK via the different chains?
Specifically, this consultancy will research and prepare report(s) provisionally titled Africanfresh produce and the UK consumer: supply chains and smallholders. This will cover:
An overview of the functioning, flows, location and dynamics of the UK freshproduce sector supply chains with focus on both the non-supermarket supply chainsand supermarkets [subsequent research will be guided by the proportional location ofAfrican produce in these supply chains]
Quantification of the “value chain”/ flows of fresh produce from Africa (with focus on Sub-Saharan Africa excluding RSA) into the UK including the quality, grade andstandards defining the produce – this will include production and trade data fromAfrican countries (and any key nations – such as Djibouti, the Netherlands); importvolume and value data from UK/ EU; and the dynamics/ logistics of the UK market topoint of final sale.
Develop some snapshots of broad UK sectors to illustrate their significance in theflow of African produce in the UK – including food service, processing, wholesaling,ethnic shops, convenience stores, discount supermarkets, London versus non-London,hauliers (?), street markets, etc.
Develop some illustrative examples/ case studies of key fresh produce (fruit and vegetable) supply and value chains where smallholders have an established position inthe market
Provide both a current snapshot, identify key trends, and forecast key future trends and risks that can influence the competitive position of African smallholders.Particularly competitive incentives facing key sectors, the role of private standardsand EU regulations on the supply chain, transportation and air freight issues,procurement changes, EU subsidy changes, consumption and/ or production trends,inventory management, consolidation in sectors, horizontal and vertical integration.
Identify future necessary information or actions to fill information and data gaps.
The methodology is not pre-determined and will be discussed and decided by theconsultant(s) and NRI/IIED in advance. It is anticipated that a mixture of interviews (in-person, by email correspondence and by phone) in addition to the use of industry and greyliterature. To this end, travel costs will be one aspect of this project to locations in the UK.Indeed, a first task will be to define the TOR for this project.
81
It is envisaged that the consultant will work in close cooperation with IIED and NRI staff, aswell as with partners at EurepGAP, DFID, FPC, etc.
Given the policy focus of the IIED/NRI project, this consultancy needs to conform to highlevels of scrutiny by external reviewers – hence, quotes should be indicated whereappropriate, literature cited and comments attributed, and consultant insights labelled as such.
Funding:
IIED and NRI have £12,000 for this consultancy, which must cover all fees and traveland subsistence costs.
The consultant will be based outside NRI and IIED and will be culpable for all costs and expenses incurred except when prior approval has been obtained from IIED/ NRIstaff.
The following is an outline of a possible approach for the work but flexibility for developingthe actual work programme remains with the consultant.
Initial development work collecting and collating data & contacting potential sources.
Supply chain discovery Direct import organisations (Minor, Weir & Willis, Mack)Multiples etcProcessorsLondon marketsProvincial markets
System interviews EUREP GAP OrganisationAsda/Wal-MartTesco – Nature’s ChoiceM & S Field-to-ForkDEFRA – HMIs, EU/UK lawsOne of: Sainsbury/Waitrose/Somerfield (EUREP GAP users)Discounters: One of: Aldi, Netto etcRegional Greengrocer chain e.g. Stokes (West Country)Small scale ‘ethnic produce retailers (a) London (b) RegionalOthers, to be discussed: Spar, Cost Cutter, Londis etc.Processors – to be identified and contacted
Data discovery AWB (Customs & Excise)DEFRA records
Report writingIn order to facilitate access by the consultant to the various players with the UK marketchains, IIED & NRI will seek the support of FPC and BRC respectively with the request thatthese organisations become partners in the study and contribute towards the study by writingto their members to request full and open support for the study as its outcomes will bebeneficial for the UK fresh produce industry, retail and wholesale sectors.
The introductory letters will focus on the benefits of participation, and different letters will be

82
provided for each area. Letters to supermarkets will stress that the study will reveal the‘inclusivity’ of their approach, and that they are getting the maximum ‘developmentpremium’ for their work. It should also be stressed that all participants will receive a copy ofthe study report and the content of the report will be structured to ensure that commerciallysensitive information is not released to a wider audience.
In view of the amount of work required for this study, staff at IIED and NRI will makeadditional inputs in support of the consultant especially in terms of background data anddeveloping contacts for the field work interviews.
Outcomes expected1. A full exposition of the current situation.2. A demonstration that there exists ‘ecological’ room for produce from sub-Saharan
Africa in the EU market.3. A clear demonstration of a system/structure that would allow wholesalers and
distributors of fresh produce to develop and expand their trade with sub-Saharanfarmers/exporters in a safe and sustainable fashion.
4. A series of policy pointers for DfID

83
Appendix 2: Literature consulted
Anonymous. (2005a). Understanding foodservice opportunities for farmers and smallfood producers. Guide produced by IGD. pp 39.
Anonymous (2005b). The environmental impacts of trade liberalisation and potentialflanking measures. Institute for European Environmental Policy and GHK consulting.Report to DEFRA. pp 169.
Anonymous (2006). ‘Foodservice’. Fresh Produce Journal Supplement. July 2006. pp70.
Blanchard S., Gray S., (2005) Compass Group Presentation to IGD SuppliersConference Seville 7 April 2005
CBI (2005) EU Market Survey: Fresh Fruit and Vegetables, compiled for CBI byProFound. Netherlands
Cioffi, A. and C. dell'Aquila. (2004). ‘The effects of trade policies for fresh fruit andvegetables of the European Union’, Food Policy, 29(2): 169-85.
Coote, C., Greenhalgh, P. and Orchard, J. (2003) High value horticulture and organicexport markets for sub-Saharan Africa, NRI
Dearden, P., Greenhalgh, P. and E. Havis. (2002). Horticulture Exports from Ethiopiaand EU Supermarket Sourcing, London: DFID.
DEFRA (2005) UK Purchases and Expenditure on Food and Drink and DerivedEnergy and Nutrient Intakes in 2004-05, London
DEFRA (2006) Family Food in 2004-2005 National Statistics, London TSO
Dolan, C., Humphrey, J. and Harris-Pascal, C (2000) Horticulture commodity chains:the impact of the UK market on the African fresh vegetable industry, IDS WorkingPaper 96. Institute for Development Studies.
Dolan, C., and Sorby, K. (2003). Gender and Employment in High-Value AgricultureIndustries. International Bank for Reconstruction and Development. Agriculture andRural Development Department. Agriculture and Rural Development. Working Paper7. Washington, D.C.: World Bank. pp 77.
Esmee Fairbairn Foundation (2005) Sustainable Food Procurement for FoodserviceCompanies: A User’s Guide to Non-Financial Reporting. Oxford Brookes University
EurepGAP (2003). Protocol for Fresh Fruit and Vegetables. Cologne: EuropeanRetailer Produce Working Group.
Eurofruit Magazine – various issues.

84
FAO (2001a). New and Emerging Issues Afecting Commodity Markets, 63rd Session ofthe Committee on Commodity Problems: Food and Agriculture Organisation, Rome.
FAO (2001b). World Markets for Organic Fruit and Vegetables; Opportunities forDeveloping Countries in the Production and Export of Organic Horticultural Products:Food and Agriculture Organisation, Rome.
FAO (2003). Working Papers prepared for the Inter-Governmental Group on Bananasand Tropical Fruits. Third Session: Food and Agriculture Organisation, Rome.
Finlayson, I. (2004). A review of the Foodservice supply chain for the PesticidesResidue Committee. A report by Practical Solutions International Ltd. pp 11.
Fresh Produce Consortium (2006). Re:Fresh Directory.
Fresh Produce Desk Book (2004). Published by Fresh Produce Journal.Fresh Produce Journal (various issues).
Garcia. M., Poole M. and Skinner C. (2002) Development of private food safety andquality standards and impact on exports from Mediterranean countries, Department ofAgricultural Sciences, Agricultural Economics and Business Management ResearchSection, Imperial College, London.
Garcia. M et al (2003) Benchmarking Safety and Quality Management Practices in theMediterranean Fresh Produce Export Sector, Department of Agricultural Sciences,Agricultural Economics and Business Management Research Section, Imperial College,London.
Gogoe, S. (2004) Helping smallholders to supply European markets. PAN-UK. pp 4.
Graffham A., MacGregor J. (2006) Impact of EurepGAP on small-scale growers offruits and vegetables in Zambia (draft).
Graffham A., Karehu E., and MacGregor J. (2006) Impact of EurepGAP on access toEU retails markets by small-scale growers of fruits and vegetables in Kenya andZambia (draft.).
Grant Thornton (2006) Fresh Thinking: insights into the present and future state of theUK Fresh Produce industry.
Hallam D., Liu P., Lavers G., Pilkauskas P., Rapsomanikis G., Claro J. (2004) Themarket for non-traditional agricultural exports FAO Commodities and TradeTechnical Paper No. 3
Hubbard, M., Herbert, A. and Roumain de la Touche. (2000). Country Report onAssistance to Cameroon. EU-EVA Association. pp 111
85
IGD (2005) Understanding food service opportunities for farmers and small foodproducers, Watford UK.
ITC (weekly publication). Market News Service (MNS): Fresh Tropical and Of-Season Fruit & Vegetables: International Trade Centre, Geneva
Jabarin, A., Al-Bakri, B, Arabiat, M and Darwish, S (2002) Marketing Windows ofSelected Fresh Fruit and Vegetables in European and Gulf Countries Markets, Ministryof Agriculture of Jordan, Capacity Building on Agricultural Policy and Project Planning(TCP/JOR/0066).
Jaffee, S.(2003). From Challenge to Opportunity: The Transformation of the FreshVegetable Trade in the Context of Emerging Food Safety and Other Standards, WorldBank PREM Trade Unit (draft): World Bank, Washington D.C.
Jaffee, S. and P. Gordon (1993). Exporting High-Value Food Commodities: SuccessStories from Developing Countries, World Bank Discussion Paper #198: World Bank,Washington D.C.
Jenney. N. (2006). Foodservice. Fresh Produce Journal Supplement. July 2006. pp 70.McCulloch, N. and Ota, M. (2002). Export horticulture and poverty in Kenya. IDSWorking Paper 174. pp 40.
Mintel (2003) Fresh Fruit and Vegetables, Market Intelligence, May 2003. Mintel.
Muendo K.M. and Tschirley D.(2004). ‘Improving Kenya's domestic horticulturalproduction and marketing system: current competitiveness, forces of change, andchallenges for the future’. Volume iii: Horticultural research and input sector regulationin Kenya and Tanzania. Tegemeo Institute of Agricultural Policy and Development,Egerton University. Working Paper No. 08C/2004. pp 33.
NRI (2003) Agricultural Product Grades and Standards, Working Paper for WorldBank, NRI Report 2763, October 2003, Natural Resources Institute, Chatham.
NRI (2003). Small Producers in Export Horticulture: A Guide to Good Practice.Natural Resources Institute, Chatham.
Rees, D., Bancroft R.D.,(2003) Development of integrated protocols to safeguard thequality of fresh yams. Final Technical Report NRI, Natural Resources Institute,Chatham.
Saphire, N. (2002). Review of London Wholesale Markets. Sponsored by DEFRA andthe Corporation of London.
Stichele M.V., van der Wal, S. and Oldenziel J. (December 2005), Who reaps the fruit?Critical Issues in the Fresh Fruit and Vegetable Chain SOMO – Centre for Research onMultilateral Organisations, Amsterdam.

86
Takane, T. (2004). Smallholders and non-traditional exports under Economicliberalization: the case of pineapples in Ghana. African Study Monographs, 25(1): 29-43.
Thoen, R., Jaffee, S. and C. Dolan, (forthcoming) ‘Equatorial Rose: The Kenyan-European Cut Flower Supply Chain’, in R. Kopiki (ed.), Supply Chain Development inEmerging Markets: Case Studies of Supportive Public Policy, Boston: MIT Press.
Tsutomu Takane (2004) Smallholders and non-traditional exports under economicliberalization: the case of pineapples in Ghana. African Study Monographs, 25(1): 29-43.
UNCTAD/SGS Societe Generale de Surveillance S.A. (1998). International MarketAccess Information: Horticulture Sector, New York and Geneva.
Vinning, G. and T. Moody. (1997). A Market Compendium of Tropical Fruit, Reportprepared for the Rural Industries Research and Development Corporation, Canberra
Yeboah, G. (2005). Project Summary and Research Findings. Final report for USAIDCompetitive Grants Programme.

87
Appendix 3: Trade data
Table 4.1: Volume of exports of vegetables and number of dependents fromselected sub Saharan African countries to UK in 2005
Tonnes No. dependents Av/tonne
Ghana 15058 39886 2.648825
Kenya 32963 172359 5.228854
Tanzania 1236 34470 27.88803
Uganda 2908 26096 8.973796
Zambia 3448 5720 1.658904
Country Average 9.279681
Tonnes
Burkina Faso 1
Congo(Republic) 7
Ivory Coast 80
Cameroon 151
Eritrea 1
Gabon 1
Gambia 314
Guinea 8
Comoros 3
Zimbabwe 3331
Madagascar 425
Mauritania 6
Mauritius 46
Malawi 424
Mozambique 10
Namibia 21
Nigeria 720
Sierra Leone 21
Senegal 1,436
Swaziland 3
Togo 88
Total 7,097
TotalDependents 65858

88
Table 4.1: Volume of exports of fruits and number of dependents from selectedsub Saharan African countries to UK in 2005
Tonnes
No.Dependents Av./tonne
Ghana 10307 17537 1.70
Cameroon15 152,757 240,000 1.57
CountryAverage 1.64
Tonnes Dependents
Burkina Faso 135 221
Botswana 16 26
Ivory Coast 33,582 54950
Cameroon1 152,757240000
Ethiopia 278 455
Gabon 1 2
Gambia 657 1075
Guinea 1 2
Kenya 955 12626
Madagascar 72 118
Mauritania 26 43
Mauritius 11 18
Malawi 16 26
Mozambique 1 2
Namibia 800 1309
Nigeria 511 9
Rwanda 1 2
Sierra Leone 1 2
Senegal 1025 1677
Sao Tome-Princ. 1
2
Swaziland 3831 6269
Togo 7 11
Tanzania 60 98
Uganda 173 283
Zambia 25 41
Zimbabwe 4304 7043
Total 198119 326307
1 5 Hubbard, M., Herbert, A. and Roumain de la Touche.(2000). Country Report on Assistance to Cameroon. EU-EVA Association. pp 111

Uk Imports from Egypt, Morroco and Thailand
Volume of exports of fresh beans and peas fromEygpt and Morocco to UK for 2003, 2004 and 2005
5
4332211
44332211
000
405050505
505050505
50000
89
00000000000000
0
Eygpt Morocco
2003 20052004
Volume of exports of fresh vegetables from ThailandUK for 2003, 2004 and 2005
000000000000000000
0
2003
2004
2005
to
Recommended