THE NEXUS BETWEEN FDI, TRADE OPENNESS, REAL EXCHANGE RATE AND INFRASTRUCTURE
QUALITY: INDIA’S POST LIBERALIZATION
GAN JUN HAO GOH THIAN WEAI
HONG HAO SEANG HUN MOOI EAM
TEO ZHEN SHYANG
BACHELOR OF ECONOMICS (HONS) FINANCIAL ECONOMICS
UNIVERSITI TUNKU ABDUL RAHMAN
FACULTY OF BUSINESS AND FINANCE DEPARTMENT OF ECONOMICS
AUGUST 2014
ii
THE NEXUS BETWEEN FDI, TRADE OPENNESS,
REAL EXCHANGE RATE AND INFRASTRUCTURE
QUALITY: INDIA’S POST LIBERALIZATION
BY
GAN JUN HAO
GOH THIAN WEAI
HONG HAO SEANG
HUN MOOI EAM
TEO ZHEN SHYANG
A research project submitted in partial fulfillment of the
requirement for the degree of
BACHELOR OF ECONOMICS (HONS) FINANCIAL
ECONOMICS
UNIVERSITI TUNKU ABDUL RAHMAN
FACULTY OF BUSINESS AND FINANCE
DEPARTMENT OF ECONOMICS
AUGUST 2014

iii
Copyright @ 2014
ALL RIGHTS RESERVED. No part of this paper may be reproduced, stored in a
retrieval system, or transmitted in any form or by any means, graphic, electronic,
mechanical, photocopying, recording, scanning, or otherwise, without the prior
consent of the authors.
iv
DECLARATION
We hereby declare that:
(1) This undergraduate research project is the end result of our own work and that
due acknowledgement has been given in the references to ALL sources of
information be they printed, electronic, or personal.
(2) No portion of this research project has been submitted in support of any
application for any other degree or qualification of this or any other university,
or other institutes of learning.
(3) Equal contribution has been made by each group member in completing the
research project.
(4) The word count of this research report is 11,360 words.
Name of Student: Student ID: Signature:
1. GAN JUN HAO 12ABB00811 _______________
2. GOH THIAN WEAI 12ABB00193 _______________
3. HONG HAO SEANG 12ABB07600 _______________
4. HUN MOOI EAM 12ABB00829 _______________
5. TEO ZHEN SHYANG 12ABB00755 _______________
Date: 27th August 2014
v
ACKNOWLEDGEMENT
Apart from the efforts of the team, the success of this research project largely
depends on the encouragement and guidelines of many others. We would like to
take this opportunity to express our deepest gratitude to the people who have been
instrumental in the successful completion of this project.
We would like to show our greatest appreciation to Ms. Tang Siu Eng. We can’t
thank her enough for her tremendous support and help. We feel motivated and
encouraged every time we attend her meeting. Without her encouragement and
guidance, this project would not have materialized.
We would also like to extend our gratitude to Mr. Go You How for his advice on
econometric techniques which is really important to us and we appreciate that. We
are also grateful to the other lecturers who have helped in improving this research.
The guidance and support received from all the members who contributed to this
project was vital for the success of the project and we are grateful for the constant
support and help.
vi
DEDICATION
This research project is lovingly dedicated to our respective parents and also our
friends who have been our constant source of inspiration and energy. They have
given us the drive and discipline to tackle any task with enthusiasm and
determination. Without their love and support this project would not have been
made possible.
vii
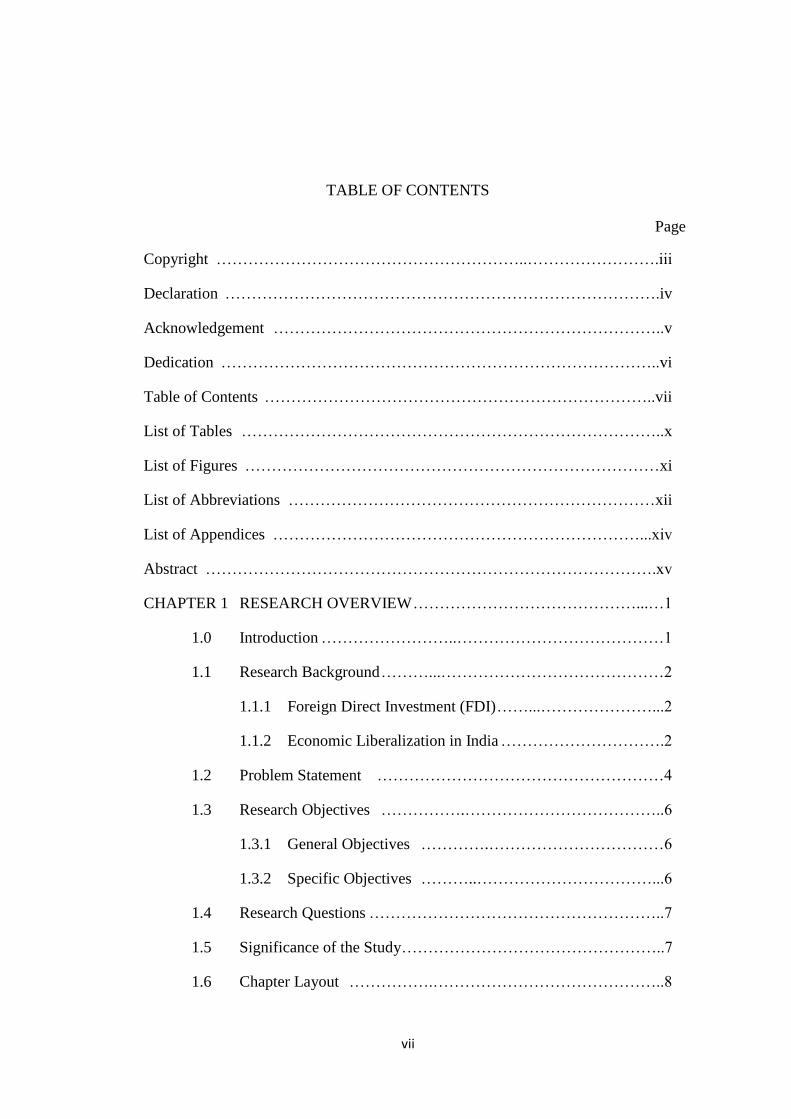
TABLE OF CONTENTS
Copyright …………………………………………………..…………………….iii
Declaration ……………………………………………………………………….iv
Acknowledgement ………………………………………………………………..v
Dedication ………………………………………………………………………..vi
Table of Contents ………………………………………………………………..vii
List of Tables ……………………………………………………………………..x
List of Figures ……………………………………………………………………xi
List of Abbreviations ……………………………………………………………xii
List of Appendices ……………………………………………………………...xiv
Abstract ………………………………………………………………………….xv
CHAPTER 1 RESEARCH OVERVIEW ……………………………………...…1
1.0 Introduction ……………………..…………………………………1
1.1 Research Background ………...……………………………………2
1.1.1 Foreign Direct Investment (FDI) ……...…………………...2
1.1.2 Economic Liberalization in India ………………………….2
1.2 Problem Statement ………………………………………………4
1.3 Research Objectives …………….………………………………..6
1.3.1 General Objectives ………….……………………………6
1.3.2 Specific Objectives ………..……………………………...6
1.4 Research Questions ………………………………………………..7
1.5 Significance of the Study…………………………………………..7
1.6 Chapter Layout …………….……………………………………..8
Page
viii
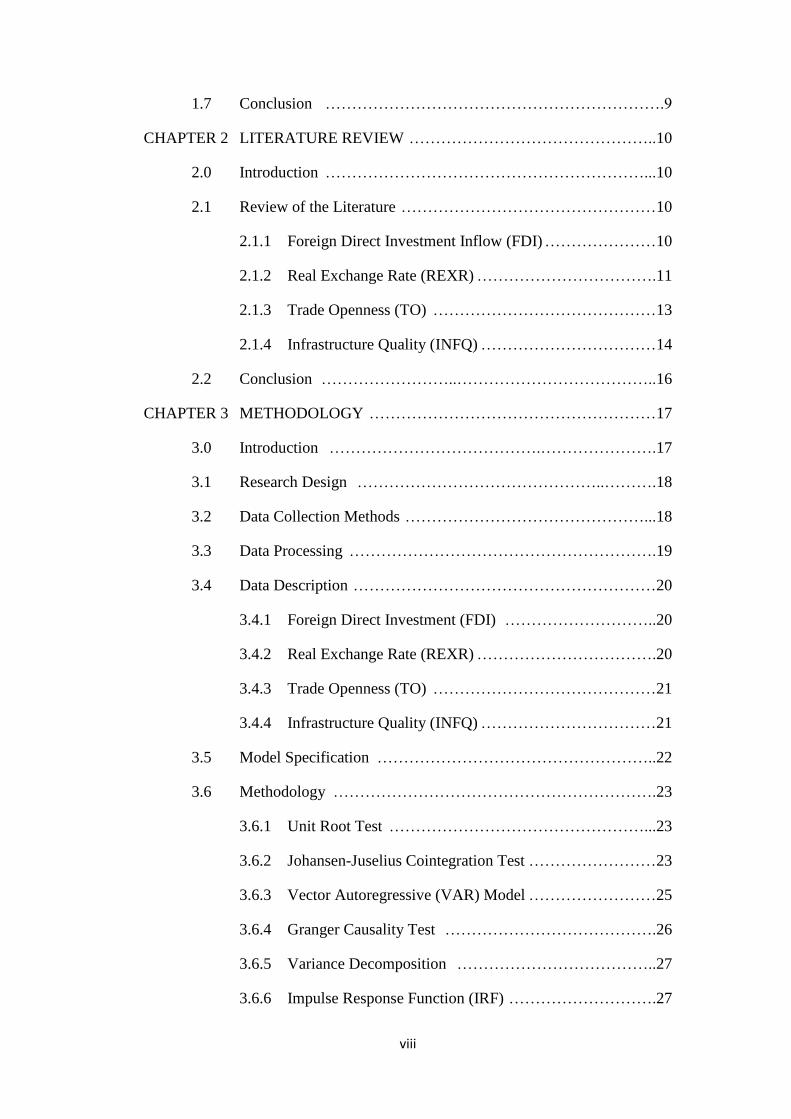
1.7 Conclusion ……………………………………………………….9
CHAPTER 2 LITERATURE REVIEW ………………………………………..10
2.0 Introduction ……………………………………………………...10
2.1 Review of the Literature …………………………………………10
2.1.1 Foreign Direct Investment Inflow (FDI) …………………10
2.1.2 Real Exchange Rate (REXR) …………………………….11
2.1.3 Trade Openness (TO) ……………………………………13
2.1.4 Infrastructure Quality (INFQ) ……………………………14
2.2 Conclusion ……………………..………………………………..16
CHAPTER 3 METHODOLOGY ………………………………………………17
3.0 Introduction ………………………………….………………….17
3.1 Research Design ………………………………………..……….18
3.2 Data Collection Methods ………………………………………...18
3.3 Data Processing ………………………………………………….19
3.4 Data Description …………………………………………………20
3.4.1 Foreign Direct Investment (FDI) ………………………..20
3.4.2 Real Exchange Rate (REXR) …………………………….20
3.4.3 Trade Openness (TO) ……………………………………21
3.4.4 Infrastructure Quality (INFQ) ……………………………21
3.5 Model Specification ……………………………………………..22
3.6 Methodology …………………………………………………….23
3.6.1 Unit Root Test …………………………………………...23
3.6.2 Johansen-Juselius Cointegration Test ……………………23
3.6.3 Vector Autoregressive (VAR) Model ……………………25
3.6.4 Granger Causality Test ………………………………….26
3.6.5 Variance Decomposition ………………………………..27
3.6.6 Impulse Response Function (IRF) ……………………….27
ix
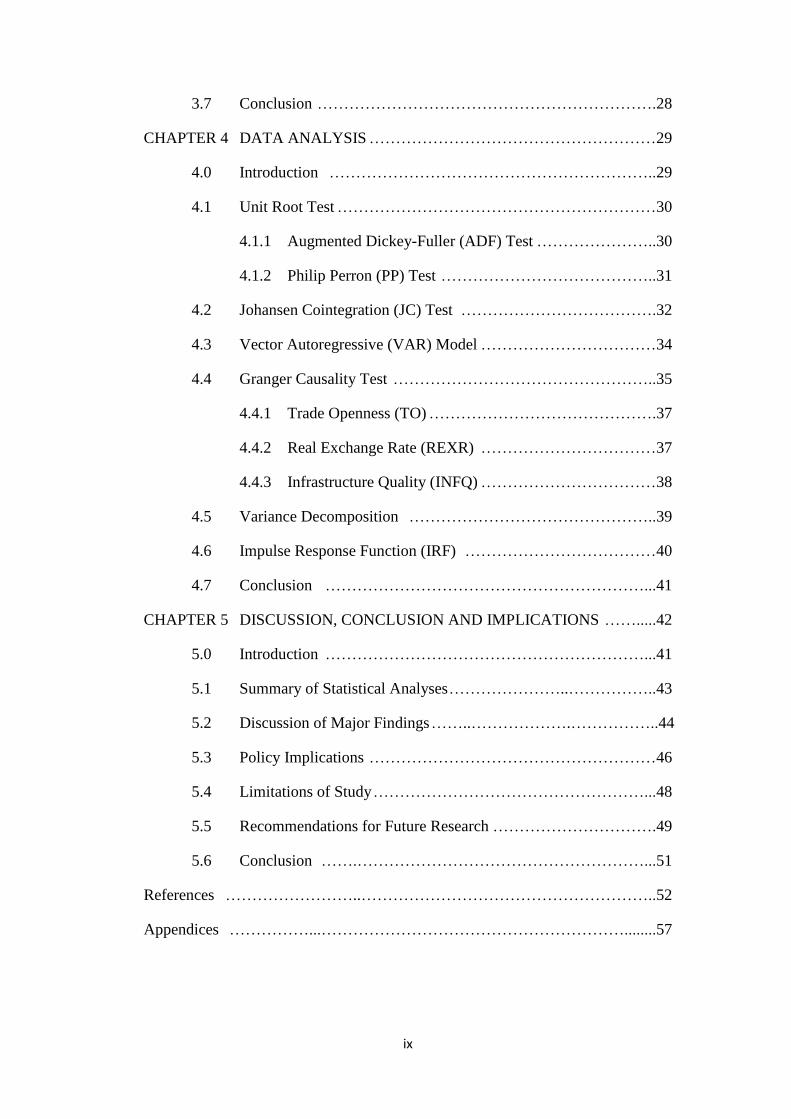
3.7 Conclusion ……………………………………………………….28
CHAPTER 4 DATA ANALYSIS ………………………………………………29
4.0 Introduction ……………………………………………………..29
4.1 Unit Root Test ……………………………………………………30
4.1.1 Augmented Dickey-Fuller (ADF) Test …………………..30
4.1.2 Philip Perron (PP) Test …………………………………..31
4.2 Johansen Cointegration (JC) Test ……………………………….32
4.3 Vector Autoregressive (VAR) Model ……………………………34
4.4 Granger Causality Test …………………………………………..35
4.4.1 Trade Openness (TO) …………………………………….37
4.4.2 Real Exchange Rate (REXR) ……………………………37
4.4.3 Infrastructure Quality (INFQ) ……………………………38
4.5 Variance Decomposition ………………………………………..39
4.6 Impulse Response Function (IRF) ………………………………40
4.7 Conclusion ……………………………………………………...41
CHAPTER 5 DISCUSSION, CONCLUSION AND IMPLICATIONS …….....42
5.0 Introduction ……………………………………………………...41
5.1 Summary of Statistical Analyses …………………..……………..43
5.2 Discussion of Major Findings ……..……………….……………..44
5.3 Policy Implications ………………………………………………46
5.4 Limitations of Study ……………………………………………...48
5.5 Recommendations for Future Research ………………………….49
5.6 Conclusion …….………………………………………………...51
References ……………………..………………………………………………..52
Appendices ……………...…………………………………………………........57
x
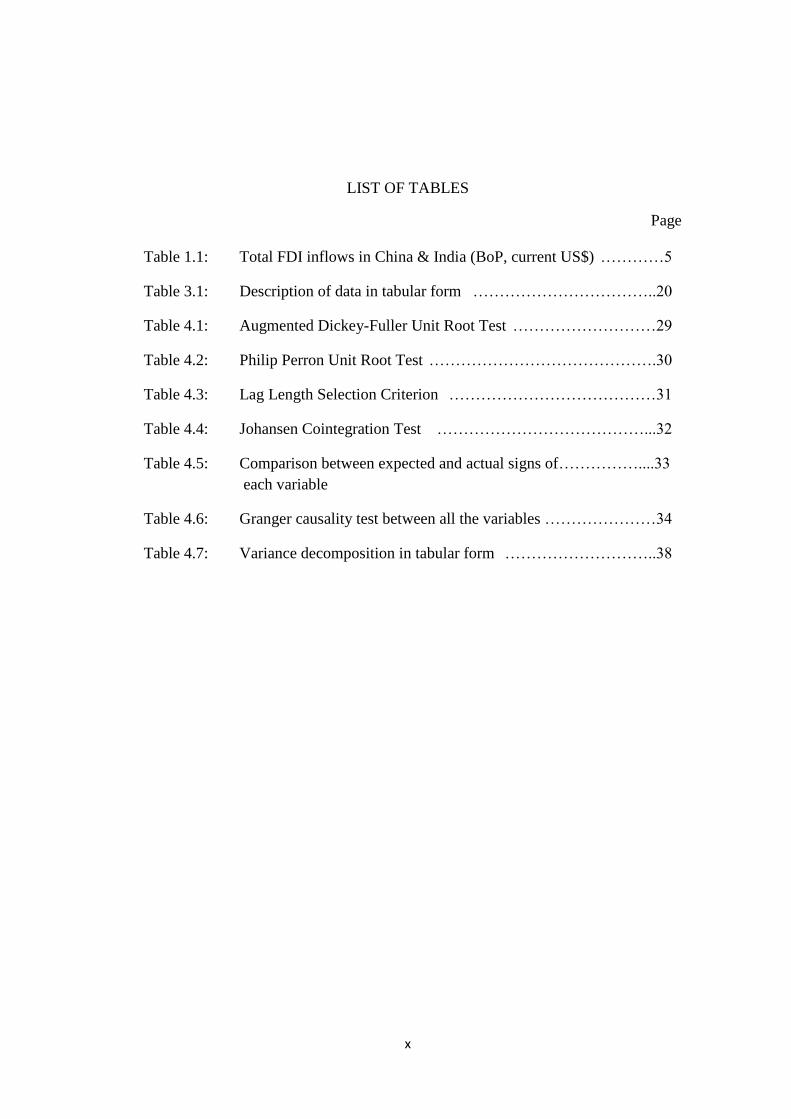
LIST OF TABLES
Table 1.1: Total FDI inflows in China & India (BoP, current US$) …………5
Table 3.1: Description of data in tabular form ……………………………..20
Table 4.1: Augmented Dickey-Fuller Unit Root Test ………………………29
Table 4.2: Philip Perron Unit Root Test …………………………………….30
Table 4.3: Lag Length Selection Criterion …………………………………31
Table 4.4: Johansen Cointegration Test …………………………………...32
Table 4.5: Comparison between expected and actual signs of……………....33
each variable
Table 4.6: Granger causality test between all the variables …………………34
Table 4.7: Variance decomposition in tabular form ………………………..38
Page
xi
LIST OF FIGURES
Figure 1.1: Total FDI inflows of India (BoP, current US$)…………………...4
– 1975 to 2012
Figure 3.1: Steps of data processing ………………………………………...19
Figure 4.1: Granger causal relationships between the variables ……………..35
Figure 4.2: Impulse response functions (IRFs) for ten periods ………………39
Page
xii
LIST OF ABBREVIATIONS
ADF Augmented Dickey-Fuller
AIC Akaike Information Criterion
BOP Balance of Payment
BRICS Brazil, Russia, India, China, and South Africa
EG Engle-Granger
EVIEW Economic View
FDI Foreign Direct Investment
FTA Free Trade Agreement
GDP Gross Domestic Product
INFQ Infrastructure Quality
IMF International Monetary Fund
INR Indian Rupee
IRF Impulse Response Function
JC Johansen Cointegration
MNCs Multinational Companies
PP Philip-Perron
REXR Real Exchange Rate
SIC Schwarz Information Criterion
SSA Sub-Sahara African
TO Trade Openness
xiii
US United States
USD United States Dollar
VAR Vector Autoregression
VECM Vector Error Correction Model
xiv
LIST OF APPENDICES
Appendix 1 : Unit Root Test on Foreign Direct Investment ……56
Appendix 2 : Unit Root Test on Infrastructure Quality ………...64
Appendix 3 : Unit Root Test on Real Exchange Rate ………….72
Appendix 4 : Unit Root Test on Trade Openness ………………80
Appendix 5 : Lag Length Selection Criterion ………………….88
Appendix 6 : Johansen Cointegration Test ……………………..89
Appendix 7 : Vector Autoregressive Estimates ………………..91
Appendix 8 : Granger Causality Test …………………………..92
Appendix 9 : Variance Decomposition ………………………..93
Appendix 10 : Impulse Response Function ……………………..95
xv
ABSTRACT
This study tends to investigate the nexus between foreign direct investment, real
exchange rate, trade openness, and infrastructure quality in India after
liberalization. The period studied upon is from the second quarter of 1991 to the
fourth quarter of 2013. In the empirical analysis, vector autoregressive (VAR)
model is used to estimate the regression. Unit root test, Johansen cointegration test,
Granger causality test, variance decomposition, and impulse response functions
(IRFs) are also used in this paper. The empirical result shows that trade openness
is a major influence and has a positive relationship with the foreign direct
investment inflows in India. Besides, real exchange rate was found to have a
positive impact on foreign direct investment in India too, though not that much
compared to the influence of trade openness. Infrastructure quality, on the other
hand, was found to have a negative relationship with and the impact is extremely
small in influencing foreign direct investment. Policy implications suggest the
Indian government to focus on improving trade openness by liberalizing trade
policies, maintain a stable exchange rate to improve investors’ confidence.
The Nexus Between FDI, Trade Openness, Real Exchange Rate and Infrastructure Quality in India
Undergraduate Research Project Page 1 of 96 Faculty of Business and Finance
CHAPTER 1: RESEARCH OVERVIEW
1.0 Introduction
Foreign direct investment inflow (FDI) is important and is considered a key
element in illustrating a country’s international economic integration, and at the
same time promotes technology transfer between countries. India, the second most
populous country in the world has been experiencing fluctuations in FDI in the
past decades even after its economic liberalization in 1991. Thus, it is of upmost
importance to study the nexus between India’s FDI and some of its important
determinants since its economic reformation taking in consideration of exchange
rate, trade openness, and infrastructure quality. In this chapter, a theoretical
outline will be presented with the inclusion of research background, problem
statement, research objectives, research questions, as well as significance of study.
The Nexus Between FDI, Trade Openness, Real Exchange Rate and Infrastructure Quality in India
Undergraduate Research Project Page 2 of 96 Faculty of Business and Finance
1.1 Research Background
1.1.1 Foreign Direct Investment (FDI)
According to the International Monetary Fund (IMF), foreign direct
investment inflows, otherwise known as FDI, refers to investments made
outside of the economy of the investor to obtain long-term interest in
enterprises. Why is FDI so important to a country? FDI allows companies
to increase their production rate, remove trade barriers, at the same time
allow joint ventures and acquisitions to happen. FDI is an essential factor
which will improve economic growth and enhance the economic structure
quality of a country. A research done by Chaitanya (2004) stated that FDI
provides more yearned for resources which can help to accelerate capital
formation, at the same time smoothen the progress of transfer of
technology, knowledge, and skills. India actually has a few benefits to
offer its foreign investors such as political stability, an enormous market,
huge and increasingly skilled labor, single digit inflation rate, and a
steadily growing economy.
1.1.2 Economic Liberalization in India
The economic liberalization in India has paved the way for economic
reformations which include deregulation, relaxing government control,
allowing of foreign capital inflows, allowing for greater privatization,
decreasing tax rates, and loosening economic barriers. Before
liberalization, India was in deep trouble and suffered a Balance of Payment
(BoP) crisis in 1985. India was not able to pay for important imports and
experienced high deficits, rising inflation, and increased borrowings from
external sources to finance it and the crisis pushed India to near
bankruptcy.
The Nexus Between FDI, Trade Openness, Real Exchange Rate and Infrastructure Quality in India
Undergraduate Research Project Page 3 of 96 Faculty of Business and Finance
In July 1991, Manmohan Singh, former Prime Minister of India, made a
major decision to implement reforms which include devaluation of the
rupee, eradication of most quotas and production licenses, and allow
certain industries to accept foreign capital. This liberalization has led to an
expansion in India’s economy and also foreign investment inflows.
According to a research done by Bhattacharya and Palaha (1996), the
number of foreign collaborations went up from a mere 950 cases in 1991
to 1854 cases in 1994, which almost doubled. Besides, the actual FDI rose
more than eight times in a short span of three years.
A more detailed explanation would be this. India was faced with depleting
of foreign reserves that necessitated devaluation in 1991 (Kalirajan, Prasad
& Drysdale, 2012). India was still using a fixed exchange rate system then.
When the exchange rate is under the fixed exchange rate system and a
country experience high inflation rate relative to other countries, the
country’s goods become much more expensive which causes the foreign
goods to become cheaper. Thus, India devalued its currency, a move to
lower the prices of its good so that foreign countries would purchase goods
from India. A year after the currency devaluation, India implemented the
dual exchange rate regime. Under this regime, the government allows
importers to pay for some imports with foreign exchange valued at free-
market rates and other imports could be purchased with foreign exchange
purchased at a government-mandated rate.
The Nexus Between FDI, Trade Openness, Real Exchange Rate and Infrastructure Quality in India
Undergraduate Research Project Page 4 of 96 Faculty of Business and Finance
1.2 Problem Statement
India is a developing country whose future growth is heavily dependent on the
participation of world economy.
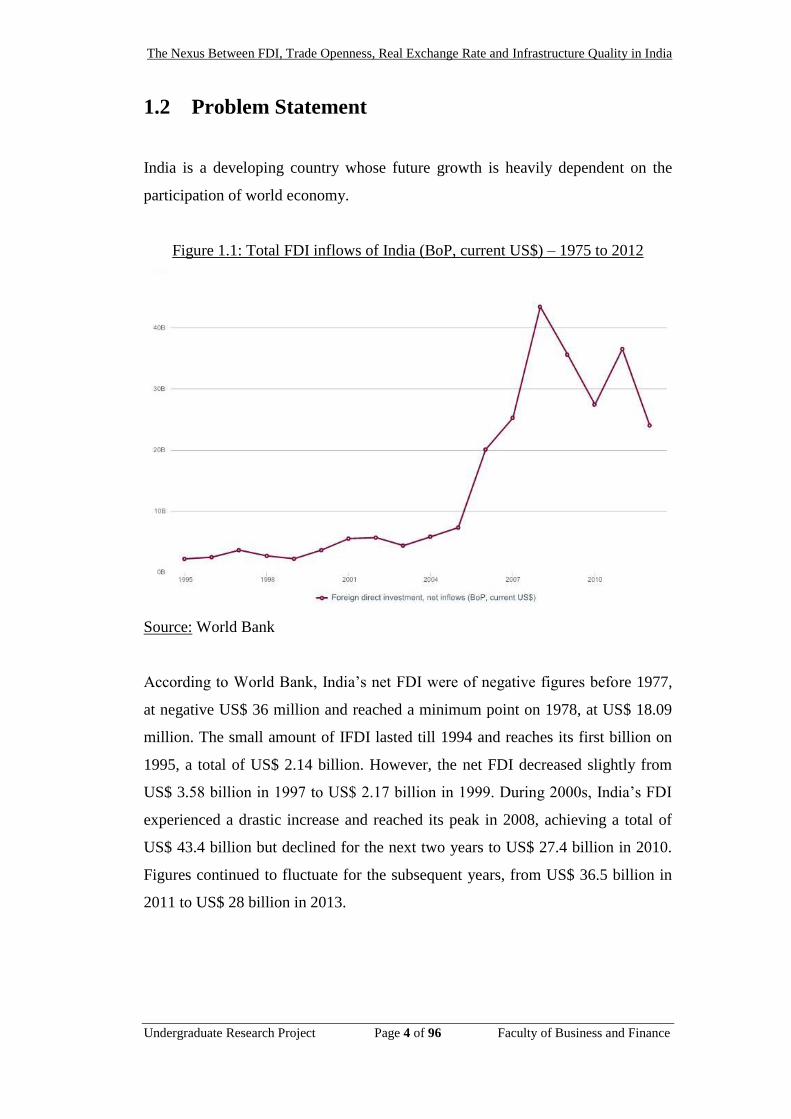
Figure 1.1: Total FDI inflows of India (BoP, current US$) – 1975 to 2012
Source: World Bank
According to World Bank, India’s net FDI were of negative figures before 1977,
at negative US$ 36 million and reached a minimum point on 1978, at US$ 18.09
million. The small amount of IFDI lasted till 1994 and reaches its first billion on
1995, a total of US$ 2.14 billion. However, the net FDI decreased slightly from
US$ 3.58 billion in 1997 to US$ 2.17 billion in 1999. During 2000s, India’s FDI
experienced a drastic increase and reached its peak in 2008, achieving a total of
US$ 43.4 billion but declined for the next two years to US$ 27.4 billion in 2010.
Figures continued to fluctuate for the subsequent years, from US$ 36.5 billion in
2011 to US$ 28 billion in 2013.
The Nexus Between FDI, Trade Openness, Real Exchange Rate and Infrastructure Quality in India
Undergraduate Research Project Page 5 of 96 Faculty of Business and Finance
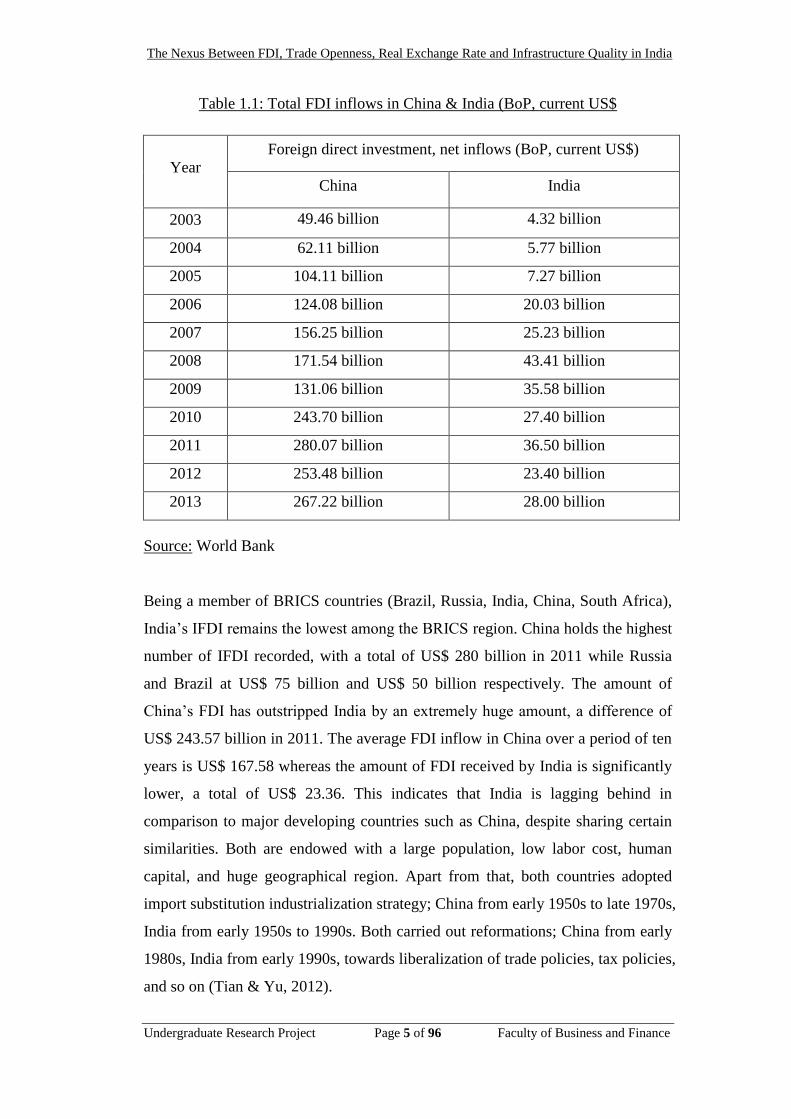
Table 1.1: Total FDI inflows in China & India (BoP, current US$
Year
Foreign direct investment, net inflows (BoP, current US$)
China India
2003 49.46 billion 4.32 billion
2004 62.11 billion 5.77 billion
2005 104.11 billion 7.27 billion
2006 124.08 billion 20.03 billion
2007 156.25 billion 25.23 billion
2008 171.54 billion 43.41 billion
2009 131.06 billion 35.58 billion
2010 243.70 billion 27.40 billion
2011 280.07 billion 36.50 billion
2012 253.48 billion 23.40 billion
2013 267.22 billion 28.00 billion
Source: World Bank
Being a member of BRICS countries (Brazil, Russia, India, China, South Africa),
India’s IFDI remains the lowest among the BRICS region. China holds the highest
number of IFDI recorded, with a total of US$ 280 billion in 2011 while Russia
and Brazil at US$ 75 billion and US$ 50 billion respectively. The amount of
China’s FDI has outstripped India by an extremely huge amount, a difference of
US$ 243.57 billion in 2011. The average FDI inflow in China over a period of ten
years is US$ 167.58 whereas the amount of FDI received by India is significantly
lower, a total of US$ 23.36. This indicates that India is lagging behind in
comparison to major developing countries such as China, despite sharing certain
similarities. Both are endowed with a large population, low labor cost, human
capital, and huge geographical region. Apart from that, both countries adopted
import substitution industrialization strategy; China from early 1950s to late 1970s,
India from early 1950s to 1990s. Both carried out reformations; China from early
1980s, India from early 1990s, towards liberalization of trade policies, tax policies,
and so on (Tian & Yu, 2012).
The Nexus Between FDI, Trade Openness, Real Exchange Rate and Infrastructure Quality in India
Undergraduate Research Project Page 6 of 96 Faculty of Business and Finance
The economic reforms led to a sturdy growth of FDI in both countries but in a
different scale over the years (Drysdale, Kalirajan & Prasad, 2012). Reports have
been reporting that the attractiveness of India’s FDI has decreased and has been
surpassed by other emerging economies although it was previously one of the
largest and fastest growing economies. China is currently the globe’s leading FDI
recipient, while India on the other hand, is still struggling with unstable FDI. The
interesting question is as to how China is attracting significantly more FDI
compared to India despite having similar volume in population size, China with a
population of 1.39 billion and India at 1.26 billion. Besides, China’s FDI
recovered rapidly after the financial crisis in 2008 whereas India’s FDI remains
below its initial volume.
1.3 Research Objectives
1.3.1 General Objectives
This research paper seeks to identify the relationship between FDI and
infrastructure quality, FDI and trade openness, and FDI and real exchange
rate in India during 1999 to 2013.
1.3.2 Specific Objectives
1. To study the trends of FDI in India.
2. To examine the nexus between FDI and trade openness, FDI and
infrastructure quality, FDI and real exchange rate in India
respectively.
The Nexus Between FDI, Trade Openness, Real Exchange Rate and Infrastructure Quality in India
Undergraduate Research Project Page 7 of 96 Faculty of Business and Finance
1.4 Research Questions
India, a major emerging economy, has been experiencing fluctuant FDI during
recent years despite its effort in liberalising the economy over the years whereas
China, also an emerging economy, saw its FDI increase at a shocking rate where it
surpassed United States as the world’s largest FDI recipient in 2011. Why is the
gap between the two developing countries so huge despite having similar
population size and implementing economic reformation. This research paper
aims to answer a few questions. By studying the relationship between real
exchange rate, trade openness, and infrastructure quality to FDI, how different is
each variable responding in terms of its impact? Besides, are they positively
related or negatively related to India’s FDI? These are questions that are worthy of
further research and discussion.
1.5 Significance of the Study
As discussed above, India did indeed saw an improvement in FDI since the
economic liberalization but it is of a fluctuant trend. This research paper can help
in identifying which variable is of upmost importance in influencing FDI in India
as it includes several essential factors such as trade openness, infrastructure
quality, and real exchange rate.
By carrying out this research, it will help in contributing to previous researches
and further strengthen the significance of the mentioned independent variables,
providing stronger results overall. Furthermore, if any of the variables are found to
be insignificant, policymakers in India can prevent wastage of capital and
resources at the same time allocate these expenditures into other important areas,
as so to improve the inflows of FDI into India, which will result in a more robust
economy.
Besides the contribution to policymakers, this research can also be used as a form
of reference for future potential investors who are looking to invest in India, as
The Nexus Between FDI, Trade Openness, Real Exchange Rate and Infrastructure Quality in India
Undergraduate Research Project Page 8 of 96 Faculty of Business and Finance
they will understand which determinants are of more important in contribute to
India’s FDI.
1.6 Chapter Layout
Chapter 1 is an overview of the research study, which explains the research
problem and also provides the research objectives and aims to be achieved.
Besides, it establishes the research questions that need to be tested.
Chapter 2 consists of literature review, a study of existing published work of other
researchers. By reviewing published journal articles by other researchers, it helps
in the understanding of the research topic and the development of a sound
theoretical framework.
Chapter 3 talks about the methodologies used in the research, which depicts how
the research is carried out in regarding its design, data collection techniques,
sampling design, measurement scales, and data analysis methods and constructs
measurement.
Chapter 4 provides the results and data analysis which is significant in answering
the research questions and hypotheses tested.
Chapter 5 is made up of discussion, implications and conclusion of the research.
Recommendations are provided in this chapter to future researchers who are
interested into carrying out further research.
The Nexus Between FDI, Trade Openness, Real Exchange Rate and Infrastructure Quality in India
Undergraduate Research Project Page 9 of 96 Faculty of Business and Finance
1.7 Conclusion
This study aims at finding out the nexus between FDI in India in relation to real
exchange rate, infrastructure quality, and trade openness from 1999 to 2013. This
research not only intends on contributing in strengthening the results of previous
researches, but also gives an insight to policymakers. The next chapter discusses
regarding literature review, which is a study of existing studies done by previous
researchers.
The Nexus Between FDI, Trade Openness, Real Exchange Rate and Infrastructure Quality in India
Undergraduate Research Project Page 10 of 96 Faculty of Business and Finance
CHAPTER 2: LITERATURE REVIEW
2.0 Introduction
Previous studies regarding the determinants of FDI are reviewed in this chapter. In
this chapter, linkage is provided between the dependent variable, FDI, and
independent variables which include real exchange rate, trade openness, and
infrastructure quality. Relevant literatures have been reviewed and the findings of
previous studies are useful in the development research paper.
2.1 Review of the Literature
2.1.1 Foreign Direct Investment Inflow (FDI)
Foreign direct investment inflow (FDI) is a main contribution of funds
formation in developing countries, as well as strengthening connection to
world trade and finances its development path. When compared to other
types of capital flows, FDI is more advantageous as it is more stable and
would not create obligations when there is a financial crisis. This was
observed in the study done by Cho (2013). FDI improves the capacity of
the host country to act in response when there are available opportunities
due to global economic integration. Most countries in the world would not
reject FDI, as it is extremely crucial and contains positive effects in
generating income from inflows of capital, advanced technology, and
so on. Besides, FDI is a dependable indicator in indicating globalization
due to the transfer of resources across borders such as technological skill.
Firms would also set up production facilities abroad, in order to lower
production cost and to protect existing markets.
The Nexus Between FDI, Trade Openness, Real Exchange Rate and Infrastructure Quality in India
Undergraduate Research Project Page 11 of 96 Faculty of Business and Finance
2.1.2 Real Exchange Rate (REXR)
Theoretically, the influence of exchange rate on FDI is vague and relies on
the motivation of foreign investors. Depreciation in the exchange rate of
the host country will lower local assets and production cost which in turn
generate higher FDI inflows. In contrary, it may reduce motivation for
foreign firms to penetrate the local market through local production, due to
tariff jumping becoming less useful. Firms are assumed to not invest in
countries with weaker currencies as they are related to exchange rate risk.
Conversely, an increase in exchange rate, in result of a shortage in
exchange supply, may cause FDI inflows to increase. Previous studies
carried out that examined the effect of exchange rate on FDI inflows
produced mixed results.
A research by Enu, Havi, and Obeng (2013) investigated the determinants
of FDI into Ghana during 1980 to 2012 by using vector autoregression
(VAR) analysis. Results show that during the last two years, exchange rate
is statistically significant in encouraging IFDI. Granger causality test
indicates that FDI and exchange rate have bidirectional causality. Another
research carried out by Jin and Zang (2013) which investigates the impact
of change in exchange rate on FDI in China from 1997 to 2012 by using
VAR approach and concluded that a unilateral directional causality
relationship exists between real effective exchange rate and FDI, where a
change in exchange rate with change FDI significantly. A research carried
out by Danmola (2013) studied the effect of exchange rate on FDI in
Nigeria from 1980 to 2010 by running several tests such as Augmented
Dickey Fuller (ADF), Philip Perron (PP) and Granger causality test to
identify short run dynamics and results indicate that not only there exist an
unidirectional causality in the relationship between exchange rate volatility
and FDI, it has a positive influence on FDI too.
Another research carried out by Chowdhury and Wheeler (2008) which
investigates how does real exchange rate volatility affects foreign direct
The Nexus Between FDI, Trade Openness, Real Exchange Rate and Infrastructure Quality in India
Undergraduate Research Project Page 12 of 96 Faculty of Business and Finance
investment in Japan, China, the United Kingdom, and the United States by
using vector autoregressive models. The results obtained through variance
decompositions and impulse response functions indicate a positive impact
from exchange rate volatility to FDI. Besides, a research paper by Khan,
Rahman and Sattar (2012) on the effectiveness of exchange rate on FDI by
implementing causality analysis found out an existence of a positive and
bidirectional relationship among exchange rate and FDI which means an
increase in exchange rate will raise the value of foreign currency and
decrease the cost of production in host currency. Albert and Stuart (2008)
ran a VAR analysis on the determinants of FDI in the case of Sri Lanka
and findings indicate that a host country’s currency depreciation of the
repatriation of profits derived from reinvested earnings are a long run
concern and suggest Sri Lankan policymakers to focus on the health of
major economic indices, such as exchange rate. In addition, Egwaikhide,
Ogun and Ogunleye (2010) examined the relationship between real
exchange rate and FDI in selected Sub-Sahara African (SSA) countries and
found it inconclusive as different countries seems to have different
exchange rate effects on FDI. The effect of real exchange rate movements
on FDI in Botswana, Ghana, Central African Republic and South Africa
was found to be ambiguously negative whereas in Kenya and Uganda real
exchange rate has unambiguous positive effects on FDI.
Despite many studies illustrating causality between exchange rate and FDI,
other researchers did not manage to identify a significant relationship
between them. A study done by Boahen and Evans (2014) on the impact of
exchange rate on FDI in Ghana by using a VAR model found the
relationship between exchange rate and IFDI to be statically insignificant.
In addition, Emmanue and Luther (2014) did a causality analysis of FDI
and exchange rate volatility in Ghana and found exchange rate and FDI to
not have a significant relationship. Moreover, Kirchner (2012) found a
unidirectional causality between trade openness and FDI in Australia.
The Nexus Between FDI, Trade Openness, Real Exchange Rate and Infrastructure Quality in India
Undergraduate Research Project Page 13 of 96 Faculty of Business and Finance
2.1.3 Trade Openness (TO)
Openness of trade of a country itself reflects trade liberalization, where the
country opens its markets to allow international trade, at the same time
reducing trade barriers such as tariffs and quotas. This increases
specialization and also division of labour, which results in not only an
improvement towards export capability and productivity, but to economic
growth as well.
In a study done by Ay, Mangir and Sarac (2012), a bidirectional causality
relationship was found between trade openness and FDI in Poland as well
as unidirectional causality between trade openness and FDI in Turkey
when a comparative analysis between Turkey and Poland on the
determinants of FDI was carried out. Besides, Albert and Stuart (2008) ran
a vector auto-regression (VAR) analysis to investigate the impact of
changes in several macroeconomic variables on Sri Lanka’s FDI which
include trade openness as well. Results shown a greater degree of openness
to trade was favorable as it has a positive influence on FDI in Sri Lanka.
Fida, Naqvi and Zakaria (2014) studied the impact of trade openness on
FDI in Pakistan during 1972 to 2010 and a significant positive relationship
between trade openness and FDI was found. Demirhan and Masca (2008)
analysed the determinants of FDI in 38 developing countries from 2000 to
2004 and found that trade openness has a positive and significant
relationship with FDI, which means it is able to indicate a country’s
willingness to take in foreign investment.
However, several researches did not manage to find causal relationship
between trade openness and FDI. One of them was a study done by Enu,
Havi and Obeng (2013) which applied a VAR analysis on major
macroeconomic determinants of FDI in Ghana from 1980 to 2012. No
causal relationship between trade openness and FDI was found.
Furthermore, Chang (2007) did a study on analyzing relationships among
FDI and degree of openness in Taiwan but did not manage to find a causal
The Nexus Between FDI, Trade Openness, Real Exchange Rate and Infrastructure Quality in India
Undergraduate Research Project Page 14 of 96 Faculty of Business and Finance
relationship between the two. Donga, Hayatudeen and Umaru (2013)
investigate the effect of trade openness of Nigerian economy by using
VAR model and results did not depict an existence of causation between
trade openness and FDI. Results from other researchers show otherwise.
Rao, Sridharan and Vijayakumar (2010) studied the determinants
responsible in affecting FDI inflows on BRICS countries from 1975 to
2007, using panel data analysis. The impact of trade openness on FDI is
not confirmed in this study. This result is identical to that of Mateev
(2009), where he examined the major determinants of FDI flows in Central
and Southeastern European countries and found that trade openness do not
seem to have an impact on FDI flows. Likewise, a study conducted by
Hassan and Khan (2013) on analyzing the determinants of FDI in Malaysia
from 1980 to 2010 found trade openness and FDI to not have a causal
relationship between each another.
2.1.4 Infrastructure Quality (INFQ)
Infrastructure is extremely crucial, as poor quality of infrastructure may
increase costs for firms and if inversed will attract FDI inflows. By
reducing costs, business will be able to obtain and maximize their profit.
Thus, infrastructure quality is essential to improve FDI (Liu, 2013).
Krugell (2005) stated that the quality of infrastructure is vital in attracting
FDI into a country.
Gwenhamo (2009) highlighted that the availability and quality of
infrastructure some of which are transportation, communications and
energy supply, affects FDI positively because better form of infrastructure
decreases transaction and production costs while increasing the country’s
attractiveness as an investment destination. Besides, higher level of
infrastructure quality generally requires a developed system of roads,
airports, seaports, supply of electricity and water and also internet and
telephone network (Onyeiwu & Shrestha, 2004). A study done by Rusike
(2007) on examining the trends and determinants of FDI to South Africa
The Nexus Between FDI, Trade Openness, Real Exchange Rate and Infrastructure Quality in India
Undergraduate Research Project Page 15 of 96 Faculty of Business and Finance
for 1975 to 2005 found an existence of a positive relationship between
infrastructure quality and FDI inflow.
According to Bhattacharya (2012), electric, water and gas supply when
used as a proxy for infrastructure quality, is positive and statistically
significant at 5% significance level which implies that a higher level of
infrastructure has positive impact in the short run. Bidirectional causality
is observed only in the case of FDI and electricity, gas and water supply.
Similarly, a study was conducted to examine the economic impact of FDI
in Sri Lanka by taking in GDP and level of infrastructure from 1980 to
2011. Thus, results revealed a significant impact of level of infrastructure
on FDI. Based on the results, the findings with respect to causality indicate
that the level of infrastructure plays a crucial role in attracting FDI into Sri
Lanka. Since level of infrastructure is responsible for attracting FDI, more
attention should be paid to development of infrastructure as poor
infrastructure would be an impediment to future growth in FDI inflows.
Moreover, Esew and Yaroson (2014) explained that the availability of
good infrastructure such as roads and energy supply will reduce the cost of
doing business for investors and the ability of these investors to maximize
the rate of return of their investment. By conducting this study, supply of
energy was used as a proxy for infrastructural development.
However, no causal relationship was found between energy supply and
FDI in the study. Mustajab (2009) carried out a research to study the
process and impact of infrastructure investment in Indonesia and findings
revealed that electricity is insignificant in having an impact on FDI. A
study by Carike, Elsabe and Henri (2012) on the relationship between
Chinese FDI in Africa found quality infrastructure to be an inconclusive
determinant of Chinese FDI. Chinese firms seem to either target countries
which possess a low infrastructure quality or does not seem to consider
infrastructure in a country at all when investing in other countries.
The Nexus Between FDI, Trade Openness, Real Exchange Rate and Infrastructure Quality in India
Undergraduate Research Project Page 16 of 96 Faculty of Business and Finance
2.2 Conclusion
There are a total of three independent variables used in this study, which consist
of real exchange rate, infrastructure quality, and trade openness. Previous studies
shows that the chosen independent variables consist of mixed results in terms of
determining FDI inflows in many othercuntries. Thus, researchers will collect
indicator’s observation from a consistent database and plan the research carefully
especially methodologies so as to prove the determinants are actually related to
each another.
The Nexus Between FDI, Trade Openness, Real Exchange Rate and Infrastructure Quality in India
Undergraduate Research Project Page 17 of 96 Faculty of Business and Finance
CHAPTER 3: METHODOLOGY
3.0 Introduction
This chapter is regarding the research methodology, which consists of research
design, data collection methods, data processing, and data analysis. It is important
to choose an appropriate methodology because if the methodology used is
inappropriate in the study, results obtained could be misleading. The
methodologies discussed in this chapter will be put to further usage in the
upcoming chapters but for now, only explanation regarding the nature of the tests
will be discussed. The following tests will be discussed in order.
a) Augmented Dickey-Fuller (ADF) and Philip Perron (PP) unit root test
b) Johansen Cointegration test
c) Vector Autoregressive (VAR) model
d) Granger Causality test
e) Variance Decomposition
f) Impulse Response Function (IRF)
The Nexus Between FDI, Trade Openness, Real Exchange Rate and Infrastructure Quality in India
Undergraduate Research Project Page 18 of 96 Faculty of Business and Finance
3.1 Research Design
In this study, quantitative research was used to meet our research objectives.
Quantitative methods are particularly useful when researchers seek to study large-
scale patterns of behavior as they can be measured and quantified. According to
Muijs (2000), quantitative research is labelled as explaining incidents by
collecting numerical data that are explored by using mathematical techniques, in
particular statistics. The main purpose of carrying out a research is to explain the
phenomenon. This study seeks to identify the nexus between FDI inflow and
infrastructure quality, FDI inflow and trade openness, and FDI inflow and real
exchange rate in India during 1999 to 2013. Data is collected and analyzed using
mathematical methods but in order to do so, data collected have to be in numerical
form.
3.2 Data Collection Methods
Secondary data were used to carry out this research. In order to determine the
impact the variables have on FDI inflows in India, data regarding real exchange
rate, trade openness, and infrastructure quality were obtained from Thomson
Datastream. Researchers used quarterly time series data to conduct this study,
which stretches from 1999 to 2013, a period of 14 years (59 observations). One of
the reason researchers use secondary data is to save time and also reduce cost of
researching as data were made available and current researchers do not need to
spend more time to obtain the data by themselves because the data were already
collected and published for free and is available from many sources.
The Nexus Between FDI, Trade Openness, Real Exchange Rate and Infrastructure Quality in India
Undergraduate Research Project Page 19 of 96 Faculty of Business and Finance
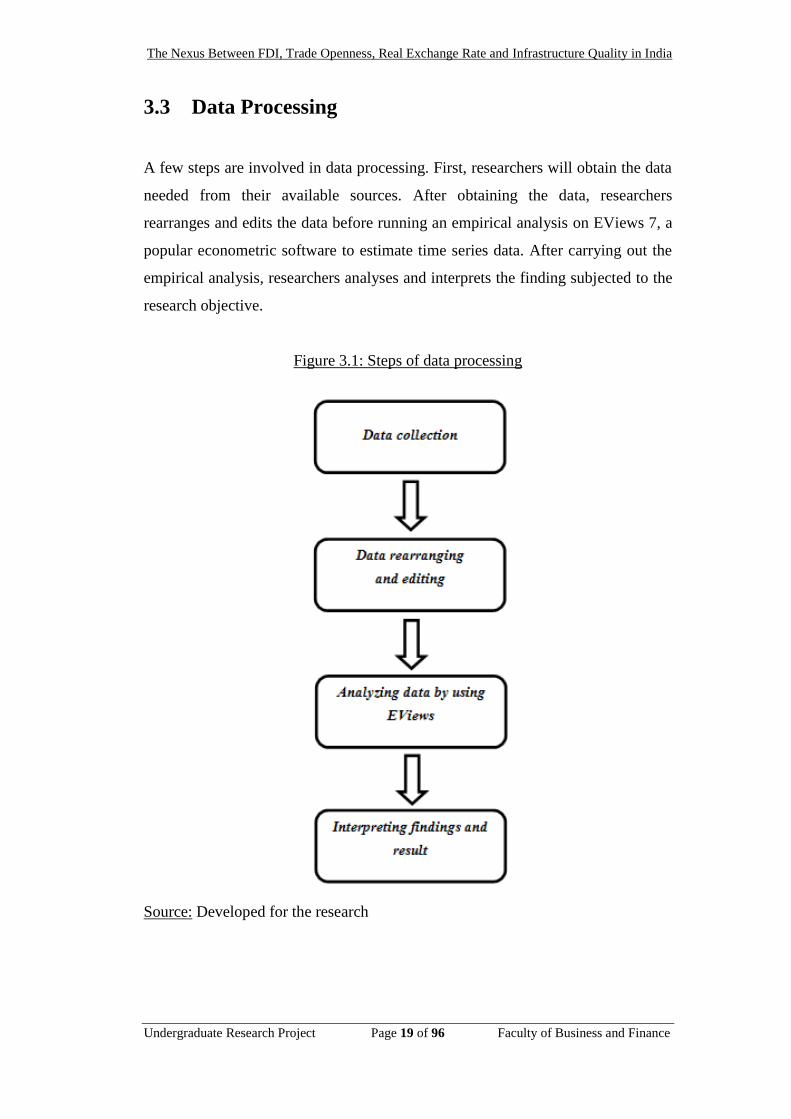
3.3 Data Processing
A few steps are involved in data processing. First, researchers will obtain the data
needed from their available sources. After obtaining the data, researchers
rearranges and edits the data before running an empirical analysis on EViews 7, a
popular econometric software to estimate time series data. After carrying out the
empirical analysis, researchers analyses and interprets the finding subjected to the
research objective.
Figure 3.1: Steps of data processing
Source: Developed for the research
The Nexus Between FDI, Trade Openness, Real Exchange Rate and Infrastructure Quality in India
Undergraduate Research Project Page 20 of 96 Faculty of Business and Finance
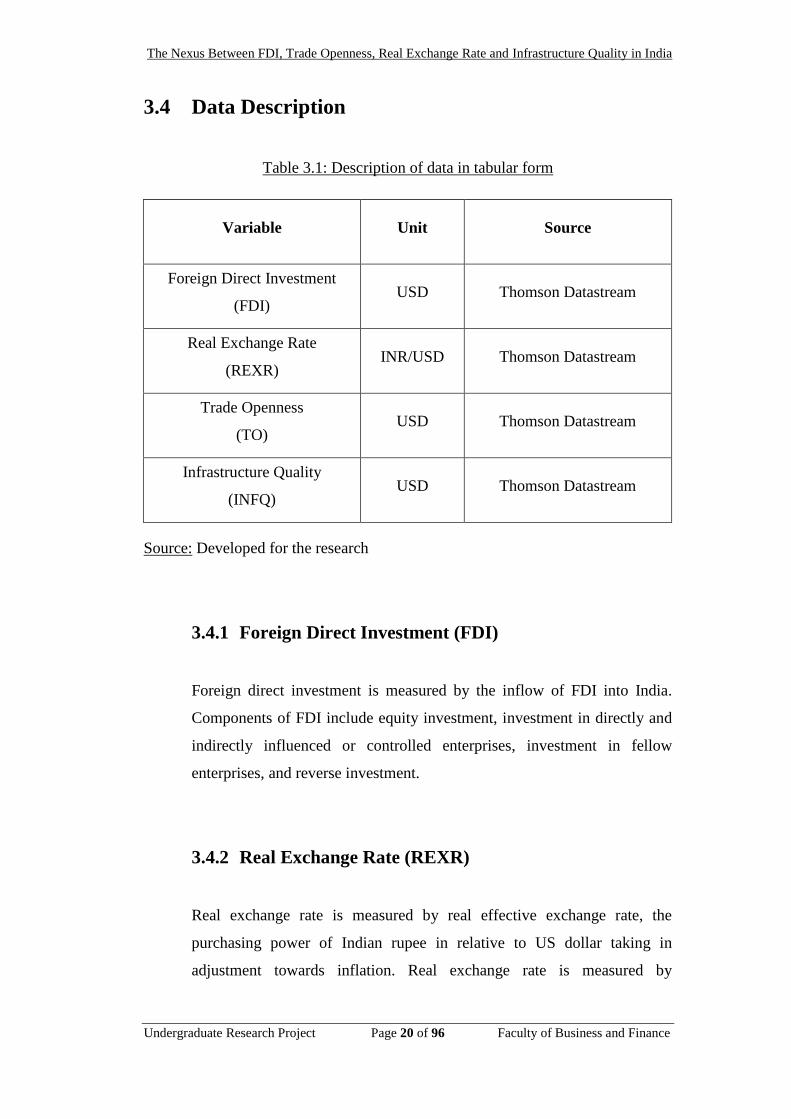
3.4 Data Description
Table 3.1: Description of data in tabular form
Variable Unit Source
Foreign Direct Investment
(FDI) USD Thomson Datastream
Real Exchange Rate
(REXR) INR/USD Thomson Datastream
Trade Openness
(TO) USD Thomson Datastream
Infrastructure Quality
(INFQ) USD Thomson Datastream
Source: Developed for the research
3.4.1 Foreign Direct Investment (FDI)
Foreign direct investment is measured by the inflow of FDI into India.
Components of FDI include equity investment, investment in directly and
indirectly influenced or controlled enterprises, investment in fellow
enterprises, and reverse investment.
3.4.2 Real Exchange Rate (REXR)
Real exchange rate is measured by real effective exchange rate, the
purchasing power of Indian rupee in relative to US dollar taking in
adjustment towards inflation. Real exchange rate is measured by
The Nexus Between FDI, Trade Openness, Real Exchange Rate and Infrastructure Quality in India
Undergraduate Research Project Page 21 of 96 Faculty of Business and Finance
multiplying the nominal exchange rate with the domestic price of a good
divided by the foreign price of the item.
The expected sign for real exchange rate is positive, as an increase in
exchange rate will raise the value of foreign currency and decrease the cost
of production in host currency (Khan, Rahman & Sattar, 2012).
3.4.3 Trade Openness (TO)
Trade openness is computed by adding up the total of exports and imports
of India.
The expected sign for trade openness is positive because trade openness is
able to indicate a country’s willingness to take in foreign investment
(Demirhan & Masca, 2008).
3.4.4 Infrastructure Quality
Infrastructure quality is measured by the sum of supply of delivery
systems for gas, water, and electric services in India.
The expected sign for infrastructure quality is positive as good
infrastructure lowers transaction and production costs while increasing the
country’s attractiveness as an investment destination (Gwenhamo, 2009).
The Nexus Between FDI, Trade Openness, Real Exchange Rate and Infrastructure Quality in India
Undergraduate Research Project Page 22 of 96 Faculty of Business and Finance
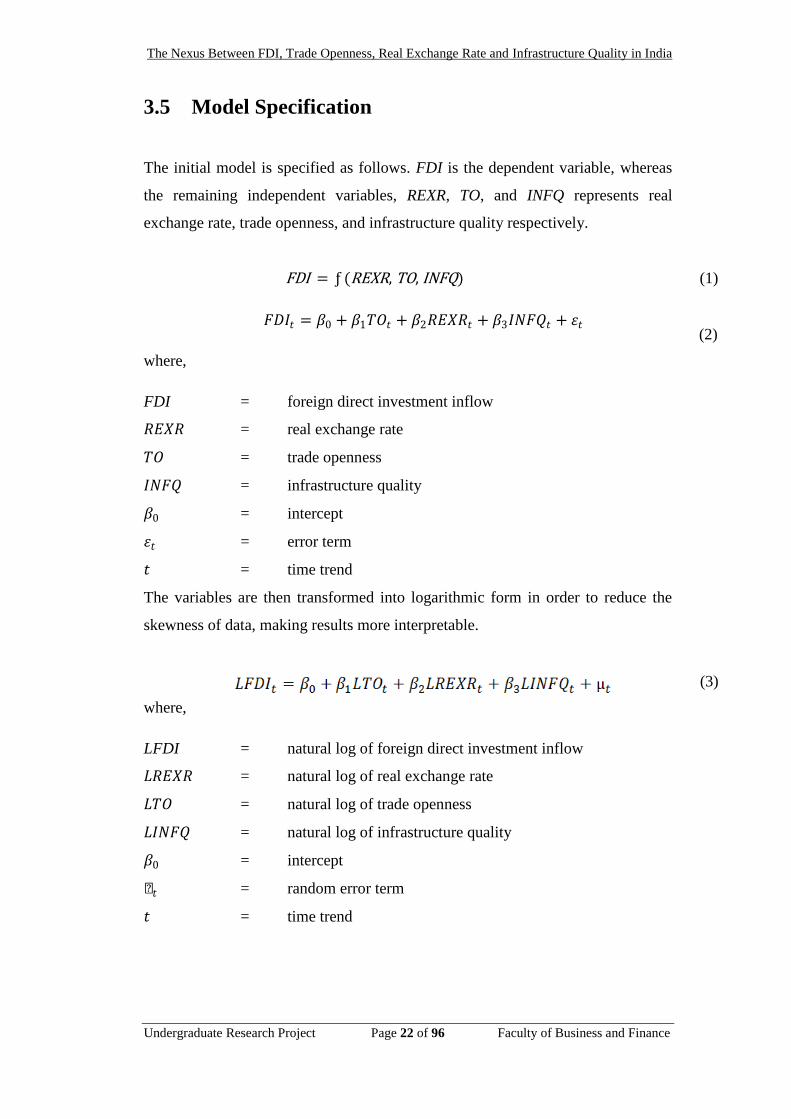
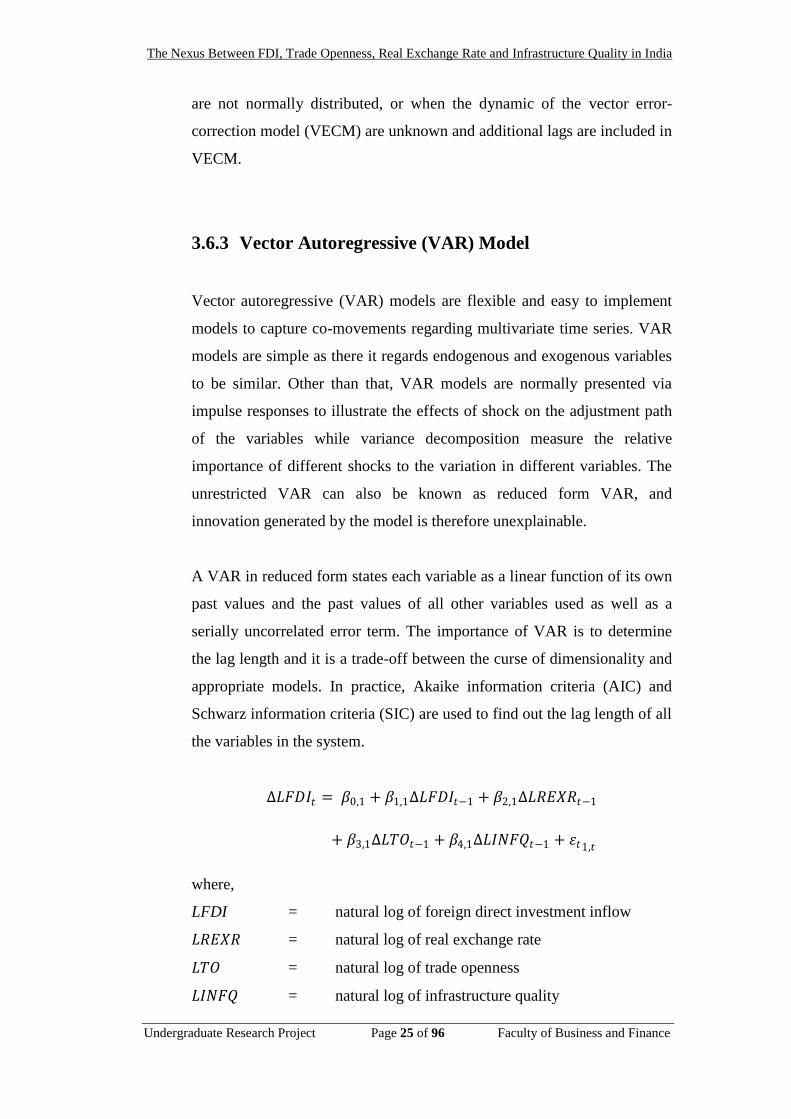
3.5 Model Specification
The initial model is specified as follows. FDI is the dependent variable, whereas
the remaining independent variables, REXR, TO, and INFQ represents real
exchange rate, trade openness, and infrastructure quality respectively.
FDI = ƒ (REXR, TO, INFQ) (1)
𝐹𝐷𝐼𝑡 = 𝛽0 + 𝛽1𝑇𝑂𝑡 + 𝛽2𝑅𝐸𝑋𝑅𝑡 + 𝛽3𝐼𝑁𝐹𝑄𝑡 + 𝜀𝑡
where,
FDI = foreign direct investment inflow
𝑅𝐸𝑋𝑅 = real exchange rate
𝑇𝑂 = trade openness
𝐼𝑁𝐹𝑄 = infrastructure quality
𝛽0 = intercept
𝜀𝑡 = error term
𝑡 = time trend
The variables are then transformed into logarithmic form in order to reduce the
skewness of data, making results more interpretable.
where,
LFDI = natural log of foreign direct investment inflow
𝐿𝑅𝐸𝑋𝑅 = natural log of real exchange rate
𝐿𝑇𝑂 = natural log of trade openness
𝐿𝐼𝑁𝐹𝑄 = natural log of infrastructure quality
𝛽0 = intercept
µ𝑡 = random error term
𝑡 = time trend
(2)
(3)
The Nexus Between FDI, Trade Openness, Real Exchange Rate and Infrastructure Quality in India
Undergraduate Research Project Page 23 of 96 Faculty of Business and Finance
3.6 Methodology
3.6.1 Unit Root Test
In this study, unit root test is performed to determine the stationarity of the
data. The data with stationary time series have constant mean and variance
over a time period while the data with non-stationary time series will have
inconstant mean and variance over period. Time series data that are not
stationary do not have a long run mean which the series return.
Furthermore, the variance is dependent over time and goes to infinity as
sample period approaches infinity. According to Granger and Newbold
(1974), the estimated regression result will be spurious if there exist
random walks between the dependent and independent variable. It could
cause econometric problem where the normality assumption of hypothesis
testing such as T-statistics to become useless and invalid. So, we use
Augmented Dickey-Fuler (ADF) and Phillips-Perron (PP) test to test the
stationary of the model.
ADF and PP are used to identify the problem of having a unit root in the
model. ADF test is a parametric test which assumes that a model is
normally distributed and there is a need to increase the lag length in order
to remove the impact of serial correlation (Phillips & Xiao, 1998). PP test
is the opposite of ADF test, which is non-parametric as it does not assume
a normal distribution and the expansion of lag length when there exist
serial correlation.
The parametric test for stationary, ADF test, and the non-parametric test,
PP test, have identical null hypothesis (H0) and alternative hypothesis (H1)
where H0 depicts that there is unit root (non-stationary) and H1 means there
is no unit root (stationary). To conduct these tests, two ways can be used to
choose an appropriate lag length which is Schwarz Information Criterion
(SIC) and Akaike Information Criterion (AIC). According to Ayalew,
Babu, and Rao (2012), SIC is advantageous towards ample statistical
problems as it is order consistent; when the sample size raises to infinity,
The Nexus Between FDI, Trade Openness, Real Exchange Rate and Infrastructure Quality in India
Undergraduate Research Project Page 24 of 96 Faculty of Business and Finance
the odds of selecting the correct model converges to unity. This leads to
additional parsimonious models. Identical to the AIC, a lower value a SIC
obtained means the better the model will be. The difference between AIC
and SIC is that AIC is designed to select model which can predict better
and is less concerned with having too many parameters which can cause
overestimation of true lag length and pick inconsistent correct lag length.
3.6.2 Johansen-Juselius Cointegration Test
Johansen-Juselius cointegration test is carried out to determine an existing
long run equilibrium relationship between the macroeconomic variables.
The test suggests that time series variables cannot move far away from one
another if there is a stationary long run relationship between the integrated
variables. This technique is based on the vector autoregressive (VAR)
models and permits the testing of hypothesis regarding the equilibrium
relationship between the variables (Abubakar & Abudllahi, 2013). The
cointegration test also helps reduce the spurious rejection frequency.
Nevertheless, the mentioned frequency seems to increase in relation with
the number of variables and stays large despite applying several
specification tests (Hjalmarsson & Osterholm, 2007).
Another cointegration test is known as the Engle-Granger (EG) approach.
Johansen-Juselius is a much better approach compared to EG approach.
This is because researchers are more likely to apply the results of
Johansen-Juselius on the asymptotic distribution of the likelihood ratio test.
These distributions are given in terms of a multivariate Brownian motion
process (Johansen and Juselius, 1990). On the other hand, EG approach
can only include up to two variables in the model. Besides, most of the
researchers conduct this test by using Trace and Maximum Eigenvalue test
in order to examine the cointegration of the model. If the null hypothesisis
rejected, there exists a cointegrating relationship. Gonzalo (1994)
concluded that the Johansen’s approach performs better when the errors
The Nexus Between FDI, Trade Openness, Real Exchange Rate and Infrastructure Quality in India
Undergraduate Research Project Page 25 of 96 Faculty of Business and Finance
are not normally distributed, or when the dynamic of the vector error-
correction model (VECM) are unknown and additional lags are included in
VECM.
3.6.3 Vector Autoregressive (VAR) Model
Vector autoregressive (VAR) models are flexible and easy to implement
models to capture co-movements regarding multivariate time series. VAR
models are simple as there it regards endogenous and exogenous variables
to be similar. Other than that, VAR models are normally presented via
impulse responses to illustrate the effects of shock on the adjustment path
of the variables while variance decomposition measure the relative
importance of different shocks to the variation in different variables. The
unrestricted VAR can also be known as reduced form VAR, and
innovation generated by the model is therefore unexplainable.
A VAR in reduced form states each variable as a linear function of its own
past values and the past values of all other variables used as well as a
serially uncorrelated error term. The importance of VAR is to determine
the lag length and it is a trade-off between the curse of dimensionality and
appropriate models. In practice, Akaike information criteria (AIC) and
Schwarz information criteria (SIC) are used to find out the lag length of all
the variables in the system.
∆𝐿𝐹𝐷𝐼𝑡 = 𝛽0,1 + 𝛽1,1∆𝐿𝐹𝐷𝐼𝑡−1 + 𝛽2,1∆𝐿𝑅𝐸𝑋𝑅𝑡−1
+ 𝛽3,1∆𝐿𝑇𝑂𝑡−1 + 𝛽4,1∆𝐿𝐼𝑁𝐹𝑄𝑡−1 + 𝜀𝑡1,𝑡
where,
LFDI = natural log of foreign direct investment inflow
𝐿𝑅𝐸𝑋𝑅 = natural log of real exchange rate
𝐿𝑇𝑂 = natural log of trade openness
𝐿𝐼𝑁𝐹𝑄 = natural log of infrastructure quality
The Nexus Between FDI, Trade Openness, Real Exchange Rate and Infrastructure Quality in India
Undergraduate Research Project Page 26 of 96 Faculty of Business and Finance
𝛽0 = intercept
𝜀𝑡 = error term
𝑡 = time trend
𝑡−1 = one period lagged value
3.6.4 Granger Causality Test
Granger (1969) developed a moderately straightforward test that defined
causality as variable Y is said to Granger cause X, if X can be predicted
with greater accuracy by using past values of variable Y rather than not
using such past values, all other terms remain unaffected. Since future
cannot predict the past, if variable X Granger causes variable Y, then
changes in X should precede changes in Y. The concept of Granger
Causality test is defined in terms of predictability and exploits the
direction of the flow of time to achieve a causal ordering of associated
variables. Since it does not rely on the specification of an econometric
model, it is particularly suited for empirical model building strategies as
such suggested by Sims (1980). According to Foresti (2007), Granger-
causality test can be applied when under three different circumstances.
First, a simple Granger-causality test between two variables and their lags.
Second, a simple Granger-causality test between more than two variables
and their lags. Last, a VAR framework, in this case the multivariate model
is enlarged in order to test for the simultaneity of each and every one of the
included variables.
Aravanan and Raza (2014) stated that Granger causality test requires all
data series involved to be stationary. Otherwise, the inference from the F-
statistics might be spurious because the test statistics will have non-
standard distributions. The null hypothesis (H0) is that the X variable does
not Granger cause variable Y and variable Y does not Granger cause
variable X. In conclusion, one variable (Xt) is said to Granger cause
another variable (Yt) if the lagged values of Xt can predict Yt and vice
versa.
The Nexus Between FDI, Trade Openness, Real Exchange Rate and Infrastructure Quality in India
Undergraduate Research Project Page 27 of 96 Faculty of Business and Finance
3.6.5 Variance Decomposition
Variance decomposition is used to capture how much of the forecasted
error variance for variables in the system is explained by innovations to
each explanatory variable including its own in the system over a series of
time horizons. The shock (error term) does not necessarily affect other
variables in the system, but also affects other shocks in the same system.
According to Lastrapes (1992), variance decomposition analysis suggests
that fluctuations in real and nominal exchange rates are due primarily to
real shocks. Thus, real shocks dominate nominal shocks for both exchange
rate series over short and long frequencies. Other than that, the behavior of
the conditions of the real exchange rate differs greatly between countries
with the characteristics just described and the industrial countries for
which variance decompositions of real exchange rates are normally
applied (Mendoza, 2000). Furthermore, Morales-Zumaquero (2006)
proved that non-stability in the variance decomposition of the real
exchange rates for advanced economies across samples saw a growing
importance of nominal shocks.
3.6.6 Impulse Response Function (IRF)
Impulse response function (IRF) is a form of output of a dynamic system
which refers to a reaction of a dynamic system when external changes
occur. IRF shows the effects of shocks on the adjustment path of the
variables and projects a time path for a variable explained in a VAR model.
Pesavento and Rossi (2005) found IRFs to play a vital role in relating the
impact that shocks have on the variables and are normally obtained from
VAR. The impulse response function (IRF) is employed to determine the
responsiveness of each of the macroeconomic variables towards an oil
price shock (Enders & Serletis, 2010). In general, an impulse response
refers to the response of any dynamic system in reaction to several external
change (Lu & Xin, 2010). In addition, Borovicka, Hansen and Scheinkman
The Nexus Between FDI, Trade Openness, Real Exchange Rate and Infrastructure Quality in India
Undergraduate Research Project Page 28 of 96 Faculty of Business and Finance
(2014) found that impulse response function characterize the impact of a
stream of erratic shocks on dynamic economic models. For instance, they
measure the consequences of alternative shocks on the future variables
within the dynamic system.
3.7 Conclusion
This chapter provides discussion of data collection, data processing, data
description, and also the methodologies to be used in the following chapter. The
methodologies discussed are made up of unit root tests, cointegration test, error
correction model, variance decomposition, and impulse response functions. These
tests can be applied in order to find out the impact real exchange rate, trade
openness, and infrastructure quality have on FDI. The following chapter is data
analysis, where results from the mentioned tests will be presented and interpreted
clearly.
The Nexus Between FDI, Trade Openness, Real Exchange Rate and Infrastructure Quality in India
Undergraduate Research Project Page 29 of 96 Faculty of Business and Finance
CHAPTER 4: DATA ANALYSIS
4.0 Introduction
In this chapter, empirical results were discussed for several forms of test. First,
augmented Dickey-Fuller (ADF) and Philip Perron (PP) unit root test will be
performed to check for the existence of unit root in the time series data. Next,
Johansen Cointegration Test is used to test for cointegration between the time
series. Vector Autogressive (VAR) model is then used in order to proceed to the
remaining tests. Granger causality test is then performed to verify how useful a
time series is in forecasting another set of time series followed by variance
decomposition and impulse response function (IRFs).
The Nexus Between FDI, Trade Openness, Real Exchange Rate and Infrastructure Quality in India
Undergraduate Research Project Page 30 of 96 Faculty of Business and Finance
4.1 Unit Root Test
Augmented Dickey-Fuller (ADF) and Philip Perron (PP) test were ran to detect
whether a unit root exists in the time series data and to ensure that the series are
stationary in order to avoid spurious results.
H0 : There is a unit root (Non-stationary).
H1 : There is no unit root (Stationary).
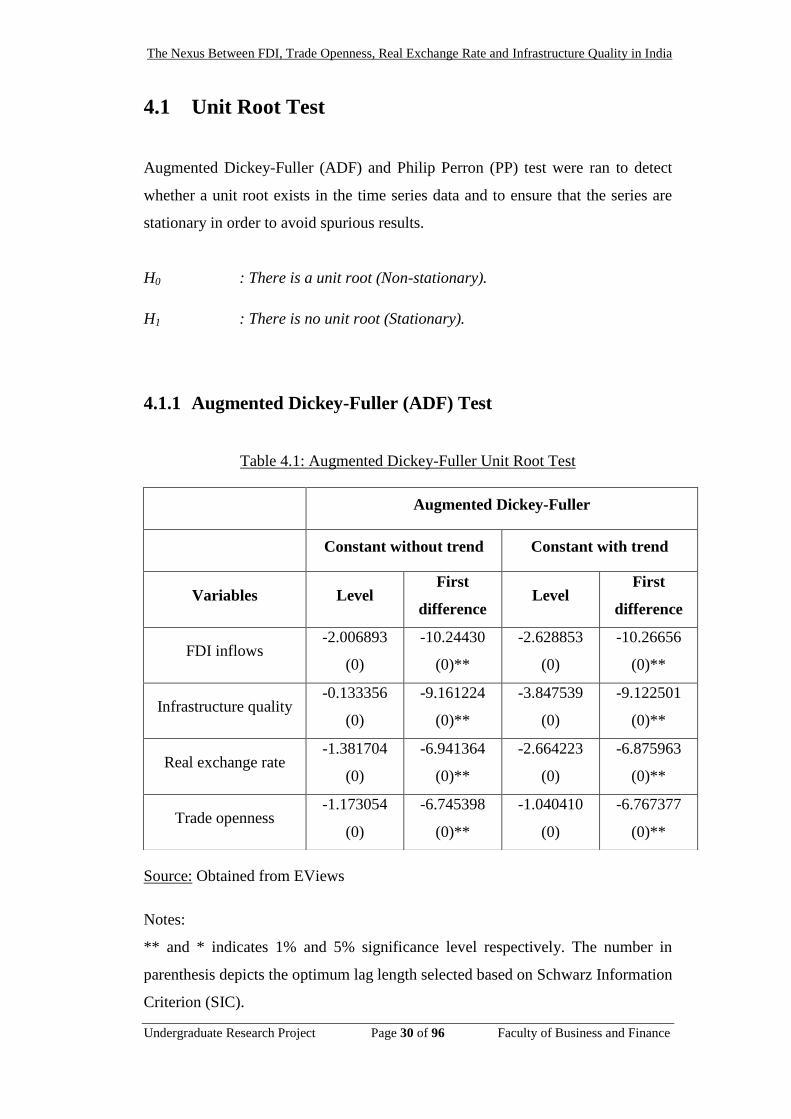
4.1.1 Augmented Dickey-Fuller (ADF) Test
Table 4.1: Augmented Dickey-Fuller Unit Root Test
Source: Obtained from EViews
Notes:
** and * indicates 1% and 5% significance level respectively. The number in
parenthesis depicts the optimum lag length selected based on Schwarz Information
Criterion (SIC).
Augmented Dickey-Fuller
Constant without trend Constant with trend
Variables Level First
difference Level
First
difference
FDI inflows -2.006893
(0)
-10.24430
(0)**
-2.628853
(0)
-10.26656
(0)**
Infrastructure quality -0.133356
(0)
-9.161224
(0)**
-3.847539
(0)
-9.122501
(0)**
Real exchange rate -1.381704
(0)
-6.941364
(0)**
-2.664223
(0)
-6.875963
(0)**
Trade openness -1.173054
(0)
-6.745398
(0)**
-1.040410
(0)
-6.767377
(0)**
The Nexus Between FDI, Trade Openness, Real Exchange Rate and Infrastructure Quality in India
Undergraduate Research Project Page 31 of 96 Faculty of Business and Finance
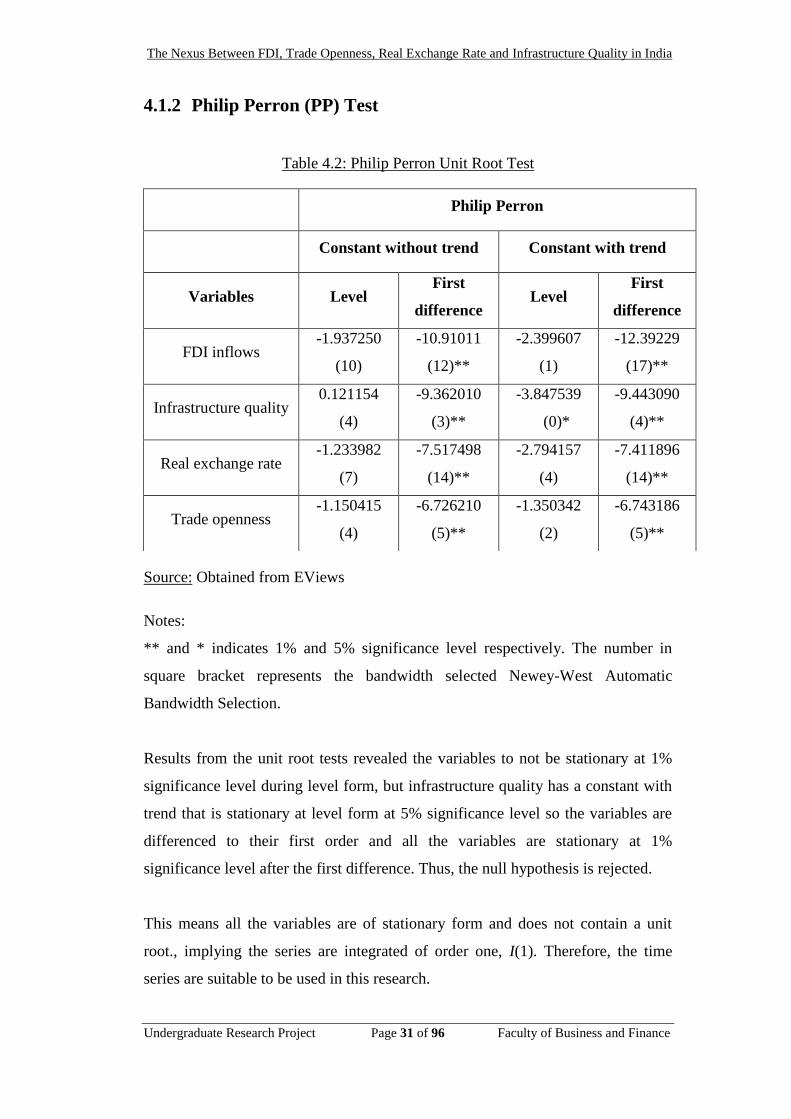
4.1.2 Philip Perron (PP) Test
Table 4.2: Philip Perron Unit Root Test
Source: Obtained from EViews
Notes:
** and * indicates 1% and 5% significance level respectively. The number in
square bracket represents the bandwidth selected Newey-West Automatic
Bandwidth Selection.
Results from the unit root tests revealed the variables to not be stationary at 1%
significance level during level form, but infrastructure quality has a constant with
trend that is stationary at level form at 5% significance level so the variables are
differenced to their first order and all the variables are stationary at 1%
significance level after the first difference. Thus, the null hypothesis is rejected.
This means all the variables are of stationary form and does not contain a unit
root., implying the series are integrated of order one, I(1). Therefore, the time
series are suitable to be used in this research.
Philip Perron
Constant without trend Constant with trend
Variables Level First
difference Level
First
difference
FDI inflows -1.937250
(10)
-10.91011
(12)**
-2.399607
(1)
-12.39229
(17)**
Infrastructure quality 0.121154
(4)
-9.362010
(3)**
-3.847539
(0)*
-9.443090
(4)**
Real exchange rate -1.233982
(7)
-7.517498
(14)**
-2.794157
(4)
-7.411896
(14)**
Trade openness -1.150415
(4)
-6.726210
(5)**
-1.350342
(2)
-6.743186
(5)**
The Nexus Between FDI, Trade Openness, Real Exchange Rate and Infrastructure Quality in India
Undergraduate Research Project Page 32 of 96 Faculty of Business and Finance
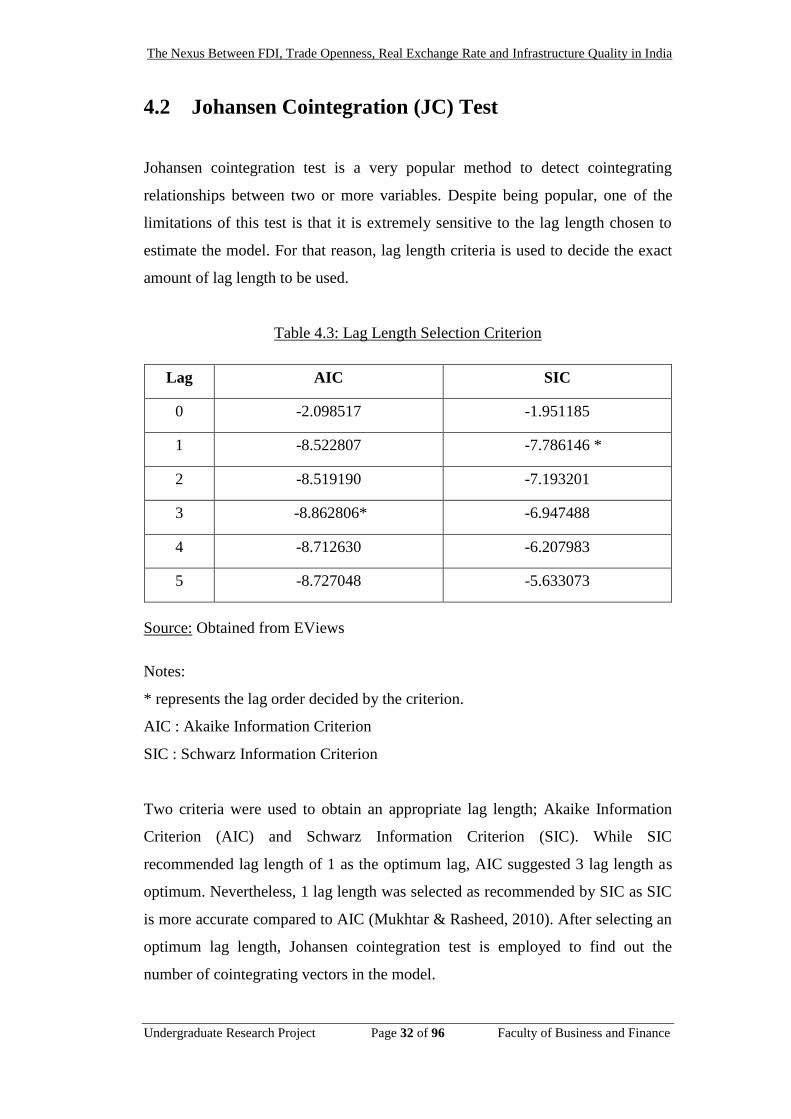
4.2 Johansen Cointegration (JC) Test
Johansen cointegration test is a very popular method to detect cointegrating
relationships between two or more variables. Despite being popular, one of the
limitations of this test is that it is extremely sensitive to the lag length chosen to
estimate the model. For that reason, lag length criteria is used to decide the exact
amount of lag length to be used.
Table 4.3: Lag Length Selection Criterion
Lag AIC SIC
0 -2.098517 -1.951185
1 -8.522807 -7.786146 *
2 -8.519190 -7.193201
3 -8.862806* -6.947488
4 -8.712630 -6.207983
5 -8.727048 -5.633073
Source: Obtained from EViews
Notes:
* represents the lag order decided by the criterion.
AIC : Akaike Information Criterion
SIC : Schwarz Information Criterion
Two criteria were used to obtain an appropriate lag length; Akaike Information
Criterion (AIC) and Schwarz Information Criterion (SIC). While SIC
recommended lag length of 1 as the optimum lag, AIC suggested 3 lag length as
optimum. Nevertheless, 1 lag length was selected as recommended by SIC as SIC
is more accurate compared to AIC (Mukhtar & Rasheed, 2010). After selecting an
optimum lag length, Johansen cointegration test is employed to find out the
number of cointegrating vectors in the model.
The Nexus Between FDI, Trade Openness, Real Exchange Rate and Infrastructure Quality in India
Undergraduate Research Project Page 33 of 96 Faculty of Business and Finance
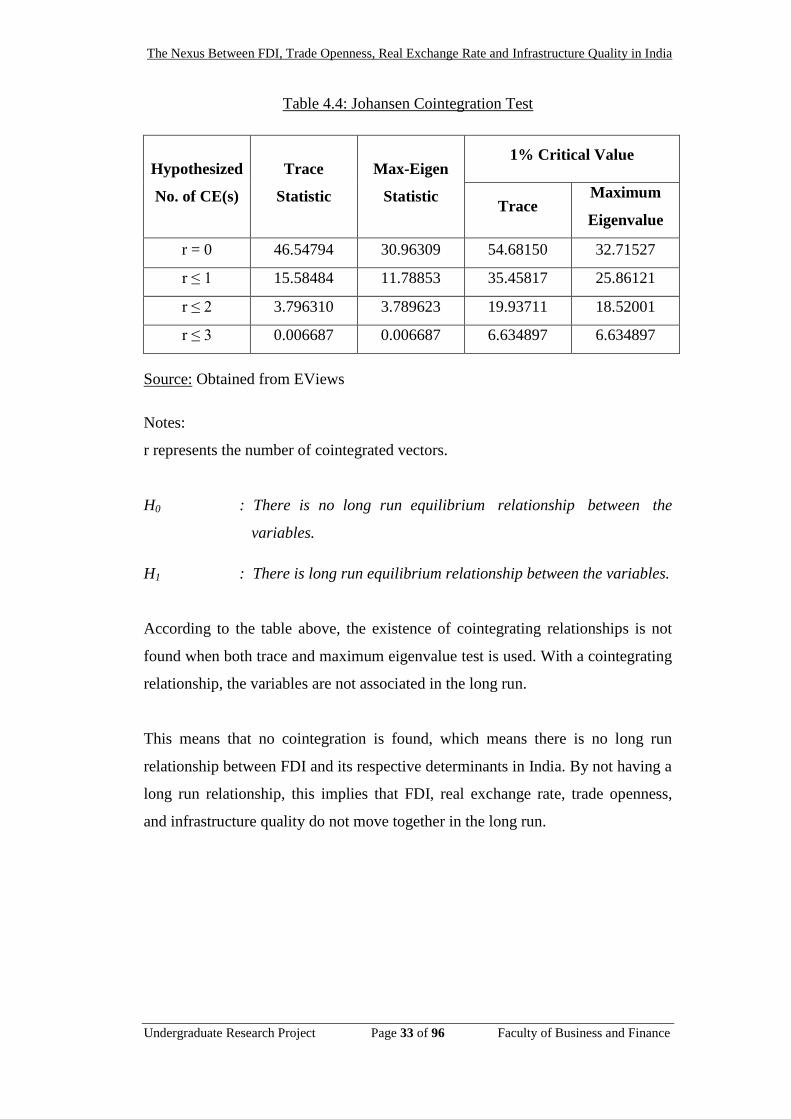
Table 4.4: Johansen Cointegration Test
Hypothesized
No. of CE(s)
Trace
Statistic
Max-Eigen
Statistic
1% Critical Value
Trace Maximum
Eigenvalue
r = 0 46.54794 30.96309 54.68150 32.71527
r ≤ 1 15.58484 11.78853 35.45817 25.86121
r ≤ 2 3.796310 3.789623 19.93711 18.52001
r ≤ 3 0.006687 0.006687 6.634897 6.634897
Source: Obtained from EViews
Notes:
r represents the number of cointegrated vectors.
H0 : There is no long run equilibrium relationship between the
variables.
H1 : There is long run equilibrium relationship between the variables.
According to the table above, the existence of cointegrating relationships is not
found when both trace and maximum eigenvalue test is used. With a cointegrating
relationship, the variables are not associated in the long run.
This means that no cointegration is found, which means there is no long run
relationship between FDI and its respective determinants in India. By not having a
long run relationship, this implies that FDI, real exchange rate, trade openness,
and infrastructure quality do not move together in the long run.
The Nexus Between FDI, Trade Openness, Real Exchange Rate and Infrastructure Quality in India
Undergraduate Research Project Page 34 of 96 Faculty of Business and Finance
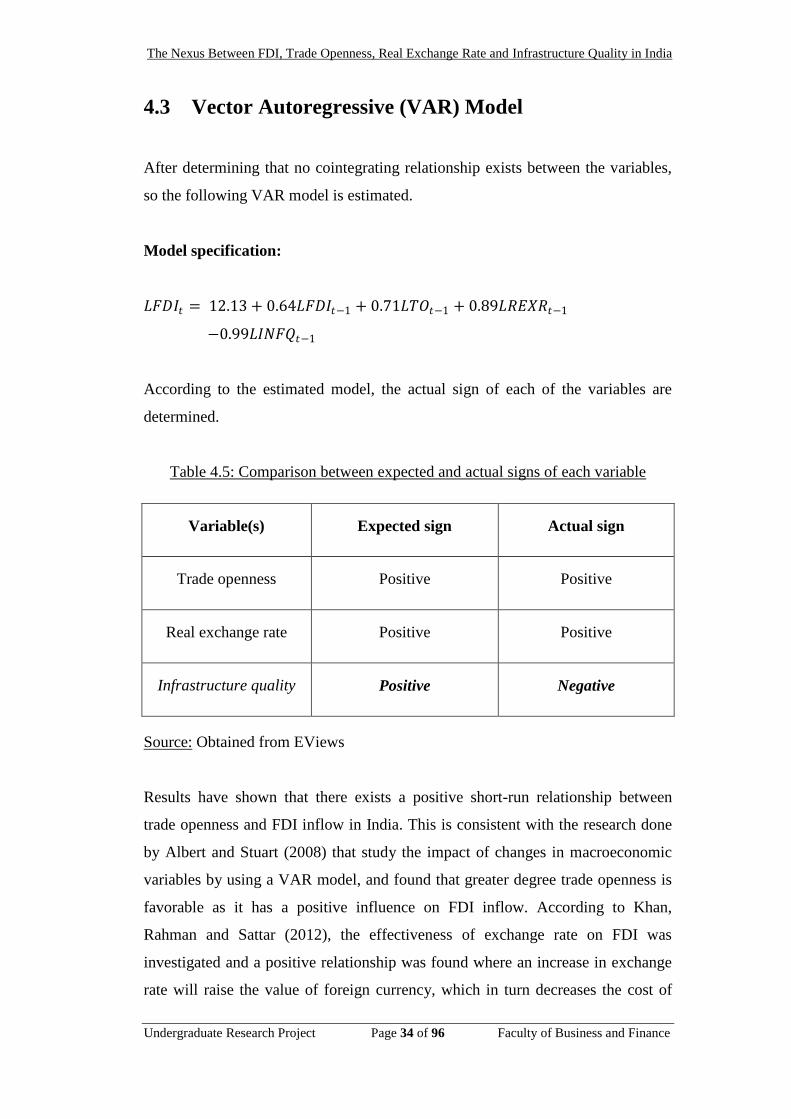
4.3 Vector Autoregressive (VAR) Model
After determining that no cointegrating relationship exists between the variables,
so the following VAR model is estimated.
Model specification:
𝐿𝐹𝐷𝐼𝑡 = 12.13 + 0.64𝐿𝐹𝐷𝐼𝑡−1 + 0.71𝐿𝑇𝑂𝑡−1 + 0.89𝐿𝑅𝐸𝑋𝑅𝑡−1
−0.99𝐿𝐼𝑁𝐹𝑄𝑡−1
According to the estimated model, the actual sign of each of the variables are
determined.
Table 4.5: Comparison between expected and actual signs of each variable
Variable(s) Expected sign Actual sign
Trade openness Positive Positive
Real exchange rate Positive Positive
Infrastructure quality Positive Negative
Source: Obtained from EViews
Results have shown that there exists a positive short-run relationship between
trade openness and FDI inflow in India. This is consistent with the research done
by Albert and Stuart (2008) that study the impact of changes in macroeconomic
variables by using a VAR model, and found that greater degree trade openness is
favorable as it has a positive influence on FDI inflow. According to Khan,
Rahman and Sattar (2012), the effectiveness of exchange rate on FDI was
investigated and a positive relationship was found where an increase in exchange
rate will raise the value of foreign currency, which in turn decreases the cost of
The Nexus Between FDI, Trade Openness, Real Exchange Rate and Infrastructure Quality in India
Undergraduate Research Project Page 35 of 96 Faculty of Business and Finance
production in local currency. However, the actual sign of infrastructure quality on
FDI is of a negative relation, which differs from our expected sign. This is
consistent with a study done by Head, Ries and Swenson (1999) where there is a
negative effect between FDI inflow and infrastructure.
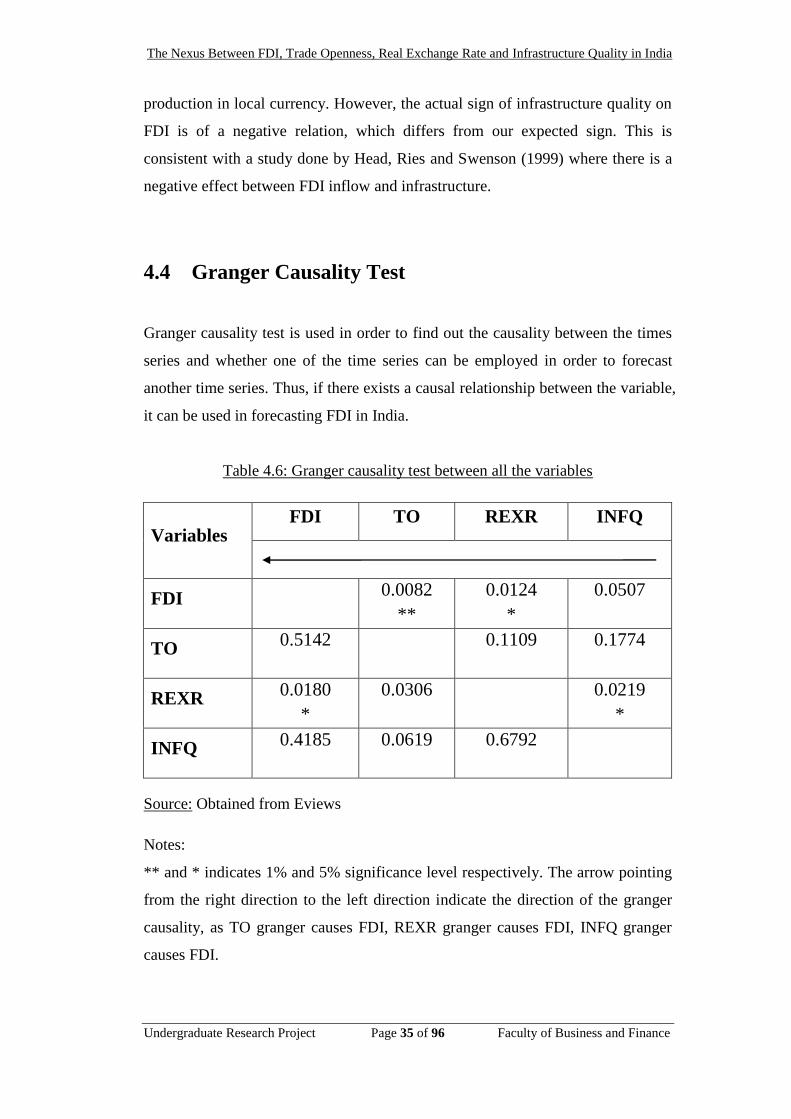
4.4 Granger Causality Test
Granger causality test is used in order to find out the causality between the times
series and whether one of the time series can be employed in order to forecast
another time series. Thus, if there exists a causal relationship between the variable,
it can be used in forecasting FDI in India.
Table 4.6: Granger causality test between all the variables
Variables FDI TO REXR INFQ
FDI 0.0082
**
0.0124
*
0.0507
TO 0.5142
0.1109
0.1774
REXR 0.0180
*
0.0306
0.0219
*
INFQ 0.4185
0.0619
0.6792
Source: Obtained from Eviews
Notes:
** and * indicates 1% and 5% significance level respectively. The arrow pointing
from the right direction to the left direction indicate the direction of the granger
causality, as TO granger causes FDI, REXR granger causes FDI, INFQ granger
causes FDI.
The Nexus Between FDI, Trade Openness, Real Exchange Rate and Infrastructure Quality in India
Undergraduate Research Project Page 36 of 96 Faculty of Business and Finance
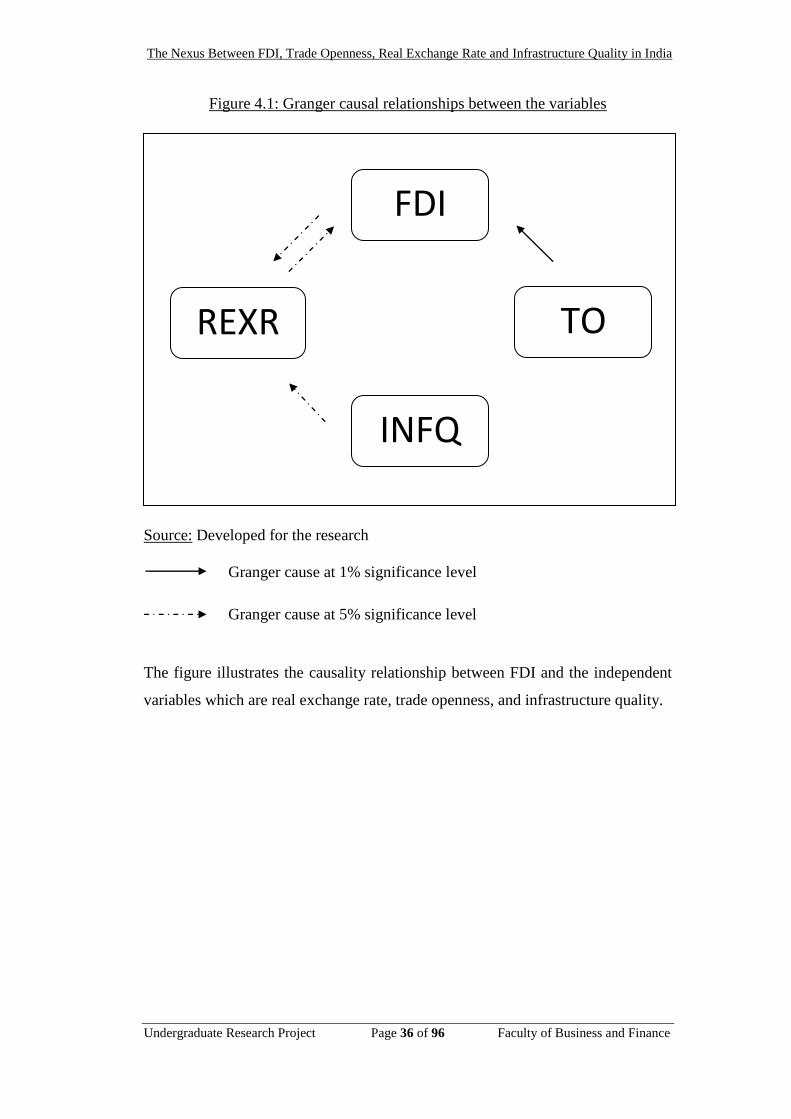
Figure 4.1: Granger causal relationships between the variables
.
Source: Developed for the research
Granger cause at 1% significance level
Granger cause at 5% significance level
The figure illustrates the causality relationship between FDI and the independent
variables which are real exchange rate, trade openness, and infrastructure quality.
FDI
REXR
INFQ
TO
The Nexus Between FDI, Trade Openness, Real Exchange Rate and Infrastructure Quality in India
Undergraduate Research Project Page 37 of 96 Faculty of Business and Finance
4.4.1 Trade Openness (TO)
H0: There is no short run causality from trade openness to FDI inflow.
H1: There is short run causality from trade openness to FDI inflow.
Based on the results shown above, trade openness granger causes FDI at 1%
significance level with a p-value of 0.0082, 0.82%. Hence, the null
hypothesis is rejected and shows unidirectional relationship running from
trade openness to FDI inflow. This finding is similar to that of Ay, Mangir
and Sarac (2012) as the outcome of the test shows that there is
unidirectional causality between FDI and trade openness in Turkey.
There is a unidirectional causality from trade openness to FDI at 1%
significance level.
4.4.2 Real Exchange Rate (REXR)
H0: There is no short run causality from real exchange rate to FDI
inflow.
H1: There is short run causality from real exchange rate to FDI inflow.
From Figure 4.1, a bidirectional causality can be observed between real
exchange rate and FDI inflow, where real exchange rate granger causes
FDI at 5% significance level with a p-value of 0.0124, 1.24% and a reverse
causality with a p-value of 0.0180, 1.80%. Thus, the alternative hypothesis
is accepted and the finding is consistent with previous studies done by
Khan, Rehamn and Sattar (2012) where a bidirectional causality
relationship was found between FDI and real exchange rate.
There is bidirectional causality running from real exchange rate to FDI and
a reverse causality from FDI to real exchange rate at 5% significance level.
The Nexus Between FDI, Trade Openness, Real Exchange Rate and Infrastructure Quality in India
Undergraduate Research Project Page 38 of 96 Faculty of Business and Finance
4.4.3 Infrastructure Quality (INFQ)
H0: There is no short run causality from infrastructure quality to FDI
inflow.
H1: There is short run causality from infrastructure quality to FDI
inflow.
For infrastructure quality, there is no granger causal relationship towards
FDI in the short run at both 5% and 1% significance level. A research done
by Sathye (2011) too did not manage to find a relationship between
infrastructure and FDI. This is consistent with our finding.
The Nexus Between FDI, Trade Openness, Real Exchange Rate and Infrastructure Quality in India
Undergraduate Research Project Page 39 of 96 Faculty of Business and Finance
4.5 Variance Decomposition
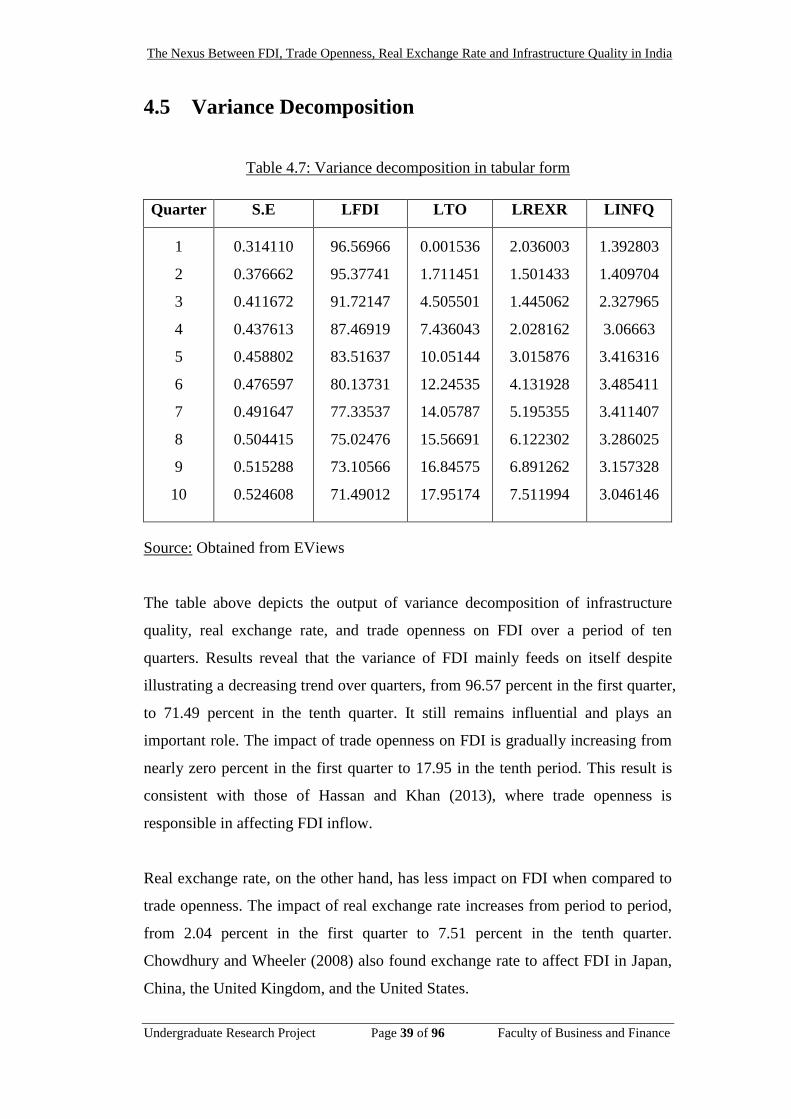
Table 4.7: Variance decomposition in tabular form
Quarter S.E LFDI LTO LREXR LINFQ
1
2
3
4
5
6
7
8
9
10
0.314110
0.376662
0.411672
0.437613
0.458802
0.476597
0.491647
0.504415
0.515288
0.524608
96.56966
95.37741
91.72147
87.46919
83.51637
80.13731
77.33537
75.02476
73.10566
71.49012
0.001536
1.711451
4.505501
7.436043
10.05144
12.24535
14.05787
15.56691
16.84575
17.95174
2.036003
1.501433
1.445062
2.028162
3.015876
4.131928
5.195355
6.122302
6.891262
7.511994
1.392803
1.409704
2.327965
3.06663
3.416316
3.485411
3.411407
3.286025
3.157328
3.046146
Source: Obtained from EViews
The table above depicts the output of variance decomposition of infrastructure
quality, real exchange rate, and trade openness on FDI over a period of ten
quarters. Results reveal that the variance of FDI mainly feeds on itself despite
illustrating a decreasing trend over quarters, from 96.57 percent in the first quarter,
to 71.49 percent in the tenth quarter. It still remains influential and plays an
important role. The impact of trade openness on FDI is gradually increasing from
nearly zero percent in the first quarter to 17.95 in the tenth period. This result is
consistent with those of Hassan and Khan (2013), where trade openness is
responsible in affecting FDI inflow.
Real exchange rate, on the other hand, has less impact on FDI when compared to
trade openness. The impact of real exchange rate increases from period to period,
from 2.04 percent in the first quarter to 7.51 percent in the tenth quarter.
Chowdhury and Wheeler (2008) also found exchange rate to affect FDI in Japan,
China, the United Kingdom, and the United States.
The Nexus Between FDI, Trade Openness, Real Exchange Rate and Infrastructure Quality in India
Undergraduate Research Project Page 40 of 96 Faculty of Business and Finance
Last but not least, the impact of infrastructure quality on FDI is the least
significant, from 1.39 percent in the first period to 3.05 percent in the tenth period.
In conclusion, the unpredictability of FDI is mainly fed by its own discrepancy
followed by the most impactful, trade openness, real exchange rate, and then
infrastructure quality.
4.6 Impulse Response Function (IRFs)
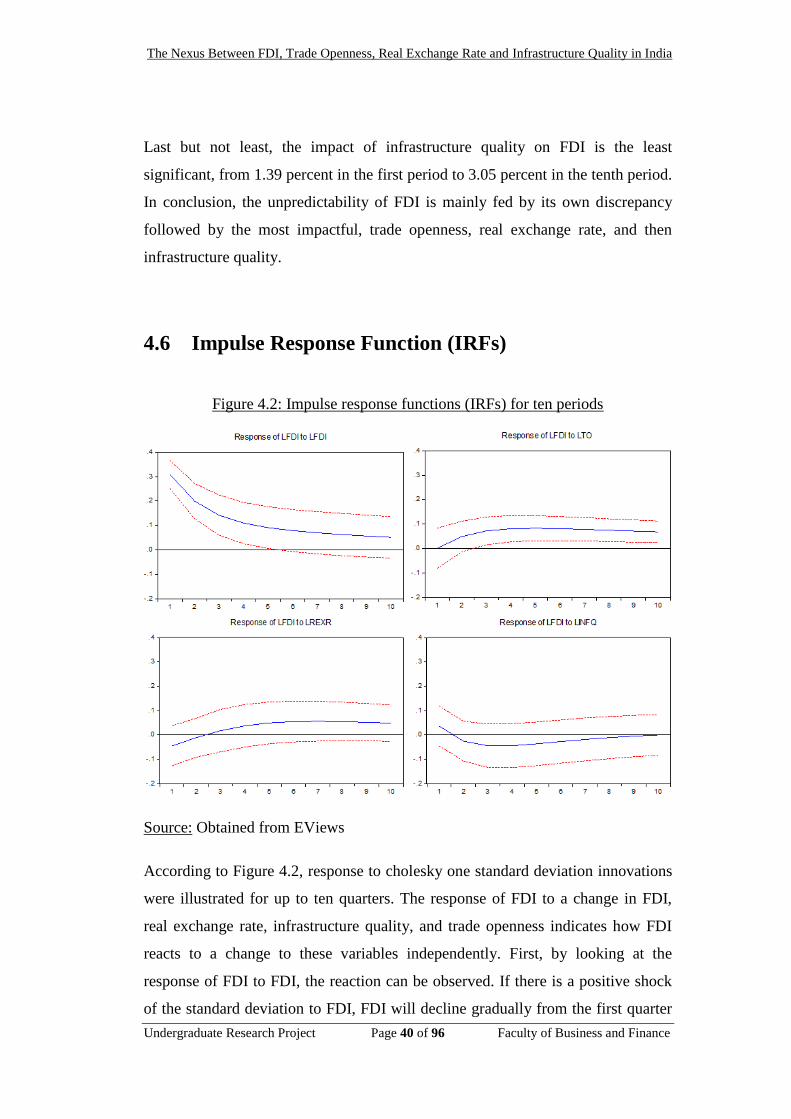
Figure 4.2: Impulse response functions (IRFs) for ten periods
Source: Obtained from EViews
According to Figure 4.2, response to cholesky one standard deviation innovations
were illustrated for up to ten quarters. The response of FDI to a change in FDI,
real exchange rate, infrastructure quality, and trade openness indicates how FDI
reacts to a change to these variables independently. First, by looking at the
response of FDI to FDI, the reaction can be observed. If there is a positive shock
of the standard deviation to FDI, FDI will decline gradually from the first quarter
The Nexus Between FDI, Trade Openness, Real Exchange Rate and Infrastructure Quality in India
Undergraduate Research Project Page 41 of 96 Faculty of Business and Finance
to the tenth quarter, depicting a downward trend of FDI in the future. The second
graph illustrates the response of FDI to a change in trade openness. If one positive
shock of standard deviation is given to trade openness, FDI will remain relatively
stable from the first to the tenth quarter. In other words, trade openness and FDI
have a stable and positive relationship in the future. Real exchange rate will cause
FDI to grow from the first quarter to the fifth quarter. After fifth quarter, FDI still
remains stable. At the first quarter, FDI and real exchange rate has a negative
relationship. However, the trend became a positive one after the second quarter.
What about the response of FDI to infrastructure quality? If there is a positive
shock on one standard deviation to infrastructure quality, FDI will decline from
the first to third quarter, dropping to below zero. This means that there is a
negative relationship where when infrastructure quality increases, FDI will decline
at the same time and vice versa. Eventually, FDI performs steadily at zero
equilibrium level.
4.7 Conclusion
By carrying out various data analysis such as Unit Root Test, estimating lag length
criteria, finding the cointegrating relationship via Johansen Cointegration test,
estimating VAR to find out the actual sign of the variables, and then Variance
Decomposition and Impulse Response Function, the trend of the chosen
independent variables towards FDI can be known. This next chapter discusses
about our conclusion and also includes policy implications and limitations of
study. Last but not least, policy recommendations will be made to improve the
country’s condition in relation to FDI.
The Nexus Between FDI, Trade Openness, Real Exchange Rate and Infrastructure Quality in India
Undergraduate Research Project Page 42 of 96 Faculty of Business and Finance
CHAPTER 5: DISCUSSION, CONCLUSION AND
IMPLICATIONS
5.0 Introduction
This chapter is structured as follows. First, a summary of statistical analyses done
in the previous chapter will be provided. Second, major findings of this study will
be discussed in order to validate the research objective. In addition, policy
implications for policy makers will be discussed before moving on to the
limitations faced during the progress of completing this study. Last but not least,
recommendations are made for future research in order to improve the results and
findings.
The Nexus Between FDI, Trade Openness, Real Exchange Rate and Infrastructure Quality in India
Undergraduate Research Project Page 43 of 96 Faculty of Business and Finance
5.1 Summary of Statistical Analyses
Before moving on to vector autoregressive (VAR) model and causality tests, the
first requirement is to conduct unit root test as it serves as a purpose to ensure the
time series data are of stationary form. Most of the time series data are of non-
stationary form, so testing for unit root is extremely important because if data are
non-stationary, results may be spurious. When spurious results are obtained, other
econometric problems will happen which can cause the tests to become invalid,
which means the whole study will become useless as the results are not accurate.
By running ADF and PP test, all the variables are confirmed to be stationary at
first difference and does not contain a unit root, which means the series are
integrated of order one, I(1). Thus, the time series are suitable to be used in this
research.
After testing for unit root, Johansen cointegration test is used to determine any
long run equilibrium relationship within the variables. In this case, no
cointegrating vector is found which means there is a long run equilibrium
relationship within the model does not exists. Detecting for cointegrating vector is
important as it determines what model to use in the next step, vector
autoregressive (VAR) or vector error correction (VEC) model. In this case, VAR
model will be used as no long run relationship is found between FDI and the
independent variables, and the purpose of using VAR model is to determine how
short run dynamics of the time series moves. Results from VAR model shows that
both the coefficients of trade openness and real exchange rate is of a positive
value, which means trade openness and real exchange rate has a positive
relationship with FDI.
Of course, just by obtaining the coefficients to explain the model is not sufficient
so Granger causality test have to be carried out to detect short run causality
between the variables. By doing so, directional causal relationships can be
detected between variables and it will show whether a variable is unidirectional or
bidirectional causal towards FDI. By knowing which variable is responsible in
The Nexus Between FDI, Trade Openness, Real Exchange Rate and Infrastructure Quality in India
Undergraduate Research Project Page 44 of 96 Faculty of Business and Finance
causing another variable, policy and recommendations towards improving FDI
can be more accurate as the time series can be used to forecast FDI in the future.
After detecting for short run causality, variance decomposition and impulse
response function were carried out. Variance decomposition shows the changes in
dependent variable caused by its own error term and the impact of other variables
on itself. By using variance decomposition, researchers will be able to know how
much exactly this particular independent variable is influencing the dependent
variable. The larger the percentage shown out of a hundred of an independent
variable, the more influential that variable is. In this study, trade openness has the
highest percentage in influencing FDI compared to real exchange rate and
infrastructure quality. Impulse response function, on the other hand, studies the
effect of a shock in the independent variable to the response of the dependent
variable, in this case, the response of FDI to a change in real exchange rate,
infrastructure quality and trade openness.
5.2 Discussion of Major Findings
Several tests were conducted in this study such as unit root test, Johansen
cointegration test, vector error correction (VAR) model, Granger causality test,
variance decomposition, and impulse response function. The purpose of running
these entire tests is to determine the relationship between the variables to FDI and
also its causality and impact. Johansen cointegration test was carried out to
determine the long run relationship between the variables and results illustrates
the non-existence of a long run relationship. Hence, VAR model was constructed
and the actual sign of the independent variables were identified as well. Granger
causality test was then used to determine short run causality relation. Based on the
causality test, only real exchange rate and trade openness has a granger causal
relationship with FDI while infrastructure quality does not granger causes FDI.
Moving forward to variance decomposition, results show that all variables
influencing FDI despite infrastructure quality having a smaller impact compared
to the other two variables. Impulse response function was then used and findings
The Nexus Between FDI, Trade Openness, Real Exchange Rate and Infrastructure Quality in India
Undergraduate Research Project Page 45 of 96 Faculty of Business and Finance
show that FDI will tend to be affected in the first few quarters but will stabilize
over time when the time period is longer.
In this study, real exchange rate, trade openness, and infrastructure quality were
examined in terms of its impact on FDI inflows. Based on the result attained, trade
openness has a huge impact on FDI in India. It is found to be significant and have
a positive relationship with FDI inflows, which is consistent to the findings by
Dinda (2009) who stated that this can be explained by resource seeking FDI. This
means that if India is a country with high level of openness to trade, it will attract
FDI inflow as it will be easier to trade with other countries as there are no barriers
on trade. Besides, Esew and Yaroson (2014) found a significant and positive
relationship between trade openness and FDI. In addition, Liargovas and
Skandalis (2013) found free trade agreements (FTA) to be helpful in attracting
FDI inflow. All these studies indicate that if trade openness increases, it will boost
the inflow of FDI into a country.
Real exchange rate too has a positive relationship with FDI in India. Based on the
results obtained, real exchange rate does have some impact on FDI but it is not as
strong as the impact given by trade openness. The positive relationship between
FDI and real exchange rate is similar as a research done by Nyamruda (2012)
depicts a positive influence between exchange rate and FDI inflow. Besides, an
appreciation towards exchange rate will raise the value of foreign currency and
decrease the cost of production in host currency. Hence, a positive relationship
exists among FDI and exchange rate as it will be able to attract FDI inflow. In
addition, infrastructure quality is found to not have so much of an impact on FDI
inflows and this finding is consistent to that of Onyeiwe and Shrestha (2004)
where infrastructure is less influential to FDI inflows because poor infrastructure
is not as important as other factors such as availability of natural resources, trade
openness and other macroeconomic variables which may be more significant in
influencing FDI inflows.
Moreover, a research done by Pradhan (2008) found a negative relationship
between infrastructure quality and FDI inflow, where an increase in infrastructure
quality tend to lower foreign investment inflow. This is due to more competition
The Nexus Between FDI, Trade Openness, Real Exchange Rate and Infrastructure Quality in India
Undergraduate Research Project Page 46 of 96 Faculty of Business and Finance
in the domestic market, which restricts FDI inflows. All these findings are very
informative and powerful to policymakers and foreign investors as all the
determinants studied upon are important variable which can be used to forecast
and determine the trend of FDI inflow of India.
5.3 Policy Implications
During post reform period, India’s competence in drawing in FDI as a host has
been relatively low compared to other developing countries. Investment climate,
fluctuating foreign exchange rate, poor infrastructure are a few of the reasons for
low FDI inflows (Ahktar, 2013).
Main reasons for these low FDI inflows has been related to the investment climate,
poor infrastructure, foreign exchange rate fluctuation and business facilitation,
which are comparatively at a lower level (Akhtar, 2013). Therefore, policies
should focus on improving trade openness and stability of exchange rate.
In another case, trade openness should be promoted in attracting FDI. Dinda (2009)
stated that the policymakers should intensify the trade liberalization policy which
was initiated under the structural adjustment program in 1986, so as to increase
the openness of the economy that attract FDI to and should be cautious about
political crises and social unrest that discourage foreign investment. Thus, Indian
policymakers should concerns about the critical of the trade openness that would
bring a negative impact on FDI inflows to the country. When trade is being
liberalized, the Indian economy grows rapidly over the past decade. Government
has reduced the tariff rate on imports and reduced export constraint. However, the
level of protection through tariff remains relatively high. Eventually, it is crucial
to address the problem of fiscal deficits which reduces public spending. Therefore,
policymakers should reduce the tariff given the acceptance level of protection.
According to Topalova (2010), he examines that the decline in tariffs was
followed by a substantial increase in trade flows.
The Nexus Between FDI, Trade Openness, Real Exchange Rate and Infrastructure Quality in India
Undergraduate Research Project Page 47 of 96 Faculty of Business and Finance
India devalued its Indian rupee in 1991 as part of the economic liberalization.
When a currency depreciates, its value declines relative to the value of another
currency which reduces that country’s wages and production costs relative to
those of its foreign counterpart (Goldberg, 2006). By devaluing its currency, it
also increases the attractiveness from foreigners. Therefore, it has been proven
that the exchange rate depreciation improves the rate of return to foreigners
considering an investment project overseas in this country. In other word, the
exchange rate depreciation will inversely affect the FDI inflows from the country.
Besides, India had implemented fixed exchange rate. This system will minimize
the exchange rate volatility towards the country. For this purpose, it is crucial to
improve domestic competitiveness and build the investor’s confidence. Thus,
government is advised to keep the exchange rate at a relatively stable value. After
1993, government started to implement the floating exchange rate regime. The
floating exchange rate system is relatively riskier than fixed exchange rate
because the it will introduces instability as well as uncertainty into trade at each
time period. However, it would be more competitive given their inflation rate than
fixed exchange rate. In addition, the floating exchange rate permits a country to
re-adjust flexibly to peripheral shock. Azim, Haider and Ullah (2012) highlighted
that their policy recommendation is to minimize the exchange rate volatility and
keep exchange rates in at a stable value.
Based on the findings, the level of infrastructure of India has a minor impact on
FDI inflows. According to Thilakaweera (2014), she found that strategies to
enhance level of infrastructure of the country should be developed by the policy
makers to enhance the economic growth of Sri Lanka. MNCs seeking to invest in
infrastructure development also consider the income level of the host country and
structure of the income distribution in order to assess the expected return on their
investments. Initially, it is advisable for the government of India to enhance the
income level of India thus increase the infrastructure development. In other word,
when the income level of the country increases, more funding will be allocated to
be spent on infrastructure development. However, India does not possess such
funding for it to spend on developing infrastructure as the income level of India is
lower compared to other such as the United States and China. According to
Renard (2011), China has developed industries and competitive services with
The Nexus Between FDI, Trade Openness, Real Exchange Rate and Infrastructure Quality in India
Undergraduate Research Project Page 48 of 96 Faculty of Business and Finance
special expertise in the execution of public work based on constructing huge
infrastructure projects. Therefore, China has a larger income level to develop on
its infrastructure compared to India.
In order to attract FDI inflows in India, government is advised to focus on
improving these three components by using appropriate and efficient policies. For
instance, implementing a stable exchange rate in the country to improve the
investor’s confidence can lead to an increase in FDI inflows. On the other hand,
the Indian government should also be obligated to liberalize the trade policy to
increase openness in the country. These are essential in order to achieve long term
goals of the country. Since India is a developing country, there are a lot of
underdeveloped sectors that needs attention and improvement. Nevertheless,
policymakers should also be more concerned with other macroeconomic variables
that are useful in attracting FDI inflows in India.
5.4 Limitations of Study
During the progress of completing this paper, several limitations have been found.
The main problem is due to limited sources of data. First, only three forms of
independent variable are studied upon in order to find out the relationship on FDI
inflow. Initially this research consists of over 6 independent variables some of
which are education, market size, and inflation. The problem is with the missing
values in some of the periods for the mentioned variables. Therefore, the results
obtained from data analysis may not be accurate as the missing values may have
cause the model to be spurious. That is why the mentioned variables were not
included into this study. This limitation will cause researchers to omit possibly
important determinants that may be influential and useful to the study and end up
causing model specification bias and inaccuracy to the research.
In addition, the sample size of this study is considered as a small sample size,
consisting of a mere 59 quarterly observations ranging from 1999 to 2013. With
such a small sample size, the model may not be as precise compared to a model
with a huge sample size, causing the small sample sized model to lose information.
The Nexus Between FDI, Trade Openness, Real Exchange Rate and Infrastructure Quality in India
Undergraduate Research Project Page 49 of 96 Faculty of Business and Finance
Besides, this limitation will result in less precise results, as a small sample size has
confidence interval which tends to be wider. Furthermore, time constraint is
another limitation while carrying out this study. Under normal circumstances,
researchers will allocate a lot of time for reading materials such as literature,
journal articles and books in order to understand more about the research,
compare between several studies, and many other details so that they are able to
perfect their results and thesis. Due to time constraint, not enough time was
allocated and only three variables were chosen to study upon.
5.5 Recommendations for Future Research
Since the main limitations encountered during this study are data constraint,
insufficient sample size and time constraint, recommendations will be provided to
future researchers who are interested in further researching this title or paper. First,
it is correct that 30 observations is the minimum sample period to study a linear
regression model, but for VAR model, the sample size needs to exceed more than
a mere 30 observations as it has to go through a particular process in VAR model
such as the lag length criteria process and the 59 observations used in this study is
just sufficient. So, the number of observations should be increased accordingly to
the increase in independent variable. In this paper, the interval for time series data
is of a quarterly trend and it is more appropriate to use monthly data instead of
quarterly and annual. The larger the sample size, the lower the probability of the
model experiencing econometric problems such as specification bias,
heteroscedasticity, autocorrelation, and so on.
Second, due to data collection constraint, future researchers are encouraged to
obtain data from institutional database instead. There are many alternatives for
data collection such as International Monetary Fund (IMF), World Bank Database,
Yahoo Finance, Mundi Index which provides not just annually, but also quarterly
and monthly too. In addition, the government official website such as India
Finance Department and India Statistics Department will also provide free and
The Nexus Between FDI, Trade Openness, Real Exchange Rate and Infrastructure Quality in India
Undergraduate Research Project Page 50 of 96 Faculty of Business and Finance
accurate data as the departments mentioned above are fully funded by the
government to implement census annually, quarterly, and monthly.
Third, as this study focuses mainly on time series data and India, researchers are
suggested to employ panel data to conduct their research for this topic as these
countries are the fastest growing FDI inflow recipients and share similar
backgrounds thus is suitable for comparison. By doing so, researchers may
provide a totally different perspective on studying the impact of variables on FDI
inflows. Therefore, it is recommended that future researchers employ panel data to
avoid the limitations caused by time series data.
Besides, future researchers who intend to conduct a study based on this title are
advised to use other proxies such as the availability of telecommunications
(landlines, internet) and availability of transport (roads, railways, ports) for
infrastructure quality besides electric, water and gas supply as it only represents
part of a country’s infrastructure quality but not as a whole. Future researchers
should replace it with a better proxy in order to attain the best result. Moreover,
other variables can be included in order to estimate a better and more relevant
model.
The Nexus Between FDI, Trade Openness, Real Exchange Rate and Infrastructure Quality in India
Undergraduate Research Project Page 51 of 96 Faculty of Business and Finance
5.6 Conclusion
By understanding the dynamics between these variables, the objectives of this
study are fulfilled. First, the trend of FDI can be seen from the impulse responses
by understanding how does FDI react to a shock in trade openness, real exchange
rate, and infrastructure quality. Second, the nexus between FDI and the mentioned
variables above is clarified as the percentage of the variables in causing FDI
independently is shown by variance decomposing them. Besides, limitations of
this study were also pointed out and recommendations were given in order to curb
the said limitations.
In conclusion, this study sheds light on the nexus between FDI inflow, trade
openness, real exchange rate and infrastructure quality in India. Trade openness is
indeed a major influence towards FDI as it has a positive relationship with FDI
inflow in India. Besides trade openness being an impact, real exchange rate was
found to have a positive impact on FDI too, just not that much compared to trade
openness. Despite this, infrastructure quality which was thought to have a major
impact towards FDI was found to have a negative relationship with FDI and was
found to only have a mere 3 percent or lesser impact in a time span of ten quarters.
The findings of this study can be used as a reference for the policymakers of India
to stimulate FDI inflow.
The Nexus Between FDI, Trade Openness, Real Exchange Rate and Infrastructure Quality in India
Undergraduate Research Project Page 52 of 96 Faculty of Business and Finance
REFERENCES
Abubakar, M., & Abdullahi, F. A. H. (2013). An inquiry into the determinants of
foreign direct investment in Nigeria. European Scientific Journal, 9(25),
293-308.
Akhtar, G. (2013). Inflows of FDI in India: Pre and post reform period.
International Journal of Humanities and Social Science Invention, 2(2),
1-11.
Albert, W., & Stuart, M. (2008). A VAR analysis on the determinants of FDI
inflows: The case of Sri Lanka. Applied Econometrics and International
Development, 8(1), 189-198.
Aravanan, S., & Raza, M. T. (2014). Dynamics of stock returns and exchange
rates: Evidence from India. Asia Pacific Journal of Applied Finance, 3(3),
1-17.
Ay, A., Mangir, F., & Sarac, T. B. (2012). Determinants of foreign direct
investment: a comparative analysis of Turkey and Poland. Economic and
Environmental Studies, 12(1), 65-85.
Ayalew, S., Babu, M. C., & Rao, L. K. M. (2012). Comparison of new approach
criteria for estimating the order of autoregressive process. Journal of
Mathematics, 1(3), 10-20.
Azim, P., Haider, S. Z., & Ullah, S. (2012). Impact of exchange rate volatility on
foreign direct investment-A case study of Pakistan. Pakistan Economic
and Social Review, 50(2), 121-138.
Bhattacharya, M. (2012). Foreign investment inflows and industrial sector growth
in India-An empirical study. Annales Universitatis Apulensis Series
Oeconomica, 14(1), 204-216.
Bhattacharyya, B., & Palaha, S. (1996). Foreign direct investment in India.
Occasional Paper 2, 1-21.
Boahen, E. A., & Evans, O. (2014). The effect of exchange rate volatility on
foreign direct investment in Ghana. International Journal of Economic
Behavior and Organization, 2(2), 20-28.
Borovicka, J., Hansen, L. P., & Scheinkman, J. (2014). Shock elasticities and
impulse responses. Mimeo, 1-29.
Carike, C., Elsabe, L., & Henri, B. (2012). Chinese foreign direct investment in
Africa: Making sense of a new economic reality. African Journal of
Business Management, 6(47), 11583-11597.
The Nexus Between FDI, Trade Openness, Real Exchange Rate and Infrastructure Quality in India
Undergraduate Research Project Page 53 of 96 Faculty of Business and Finance
Chaitanya, V. K. (2004). Foreign direct investment in India. SCMS Journal of
Indian Management, 1, 69-86.
Chang, S. C. (2007). The interactions among foreign direct investment, economic
growth, degree of openness and unemployment in Taiwan. Applied
Economics, 39, 1647-1661.
Cho, C. (2013). The causal relationship between trade and FDI: Implication for
India and East Asian countries. KIEP working paper 13-06, 1-35.
Chowdhury, A., & Wheeler, M. (2008). Does real exchange rate volatility affect
foreign direct investment? Evidence from four developed economies.
International Trade Journal, 22, 1-27.
Danmola, R. A. (2013). The impact of exchange rate volatility on the macro
economic variables in Nigeria. European Scientific Journal, 9(7), 152-165.
Demirhan, E., & Masca, M. (2008). Determinants of foreign direct investment
flows to developing countries: A cross-sectional analysis. Prague
Economic Papers, 4, 356-369.
Dinda, S. (2009). Factors Attracting FDI to Nigeria: An Empirical Investigation.
Madras School of Economics, 1-23.
Donga, M., Hayatudeen, S. Z., & Umaru, A. (2013). An empirical investigation
into the effect of openness of the economy on the growth of output (RGDP)
in Nigeria from 1986-2010. Journal of Emerging Trends in Economics and
Management Sciences, 4(6), 554-564.
Drysdale, P., Kalirajan, K., & Prasad, R. (2012). Have China & India achieved
their potential in attracting foreign investment? Journal of Emerging
Knowledge on Emerging Markets, 4, 1-20.
Egwaikhide, F. O., Ogun, O., & Ogunleye, E. K. (2010). Real exchange rate and
foreign direct investment in Sub-Saharan Africa some empirical results.
Economía mexicana nueva época, 1(21), 175-202.
Elder, J., & Serletis, A. (2010). Oil price uncertainty. Journal of Money, Credit
and Banking, 42(6), 1137-1159.
Emmanue, A. B., & Luther, N. A. (2014). Causality analysis of foreign direct
investment, exchange rate and interest rate volatility in Ghana. Journal
of Economics and Sustainable Development, 5(9), 17-25.
Enu, P., Havi, E. D. K., & Oberg, P. A. (2013). Impact of macroeconomic factors
on foreign direct investment in Ghana: A co integration analysis.
European Scientific Journal, 9(28), 331-348.
The Nexus Between FDI, Trade Openness, Real Exchange Rate and Infrastructure Quality in India
Undergraduate Research Project Page 54 of 96 Faculty of Business and Finance
Esew, N. G., & Yaroson, E. (2014). Institutional quality and foreign direct
investment (FDI) in Nigeria: A Prognosis. Journal of Humanities and
Social Science, 19(6), 37-45.
Fida, B. A., Naqvi, H. A., & Zakaria, M. (2014). Openness and FDI in Pakistan:
What does the data tell us? Middle-East Journal of Scientific Research,
19(12), 1587-1597.
Foresti, P. (2007). Testing for granger causality between stock prices and
economic growth. MPRA Paper, 1-10.
Goldberg, L. S. (2006). Exchange rates and foreign direct investment. Princeton
Encyclopedia of the World Economy, 1-7.
Gonzalo, J. (1994). Five Alternative methods of estimating long-run equilibrium
relationships. Journal Of Econometrics, 60, 203-233.
Granger, C. W. J. & Newbold, P. (1974). Spurious regressions in econometrics.
Journal of Econometrics, 2, 111-120.
Granger, C. W. J. (1969). Investigating causal relations by econometric models
and cross-spectral methods. Econometrica, 37(3), 424-438.
Gwenhamo, F. (2009). Foreign direct investment in Zimbabwe: The role of
institutional factors. Working Paper Number 144, 1-25.
Hassan, I., & Khan, G. A. (2013). Analyzing the determinants of foreign direct
investment (FDI): A study of Malaysia from 1980-2010. Management and
Administrative Sciences Review, 1(2), 33-39.
Head, C. K., Ries, J. C., & Swenson, D. L. (1999). Attracting foreign
manufacturing: Investment promotion and agglomeration. Regional
Science and Urban Economics, 29(2), 197-218.
Hjalmarsson, E., & Osterholm, P. (2007). Testing for cointegration using the
Johansen methodology when variables are near-integrated. IMF Working
Paper, 1-19.
Jin, W. F., & Zang, Q. (2013). Impact of change in exchange rate on foreign direct
investment: Evidence from China. Lingnan Journal of Banking, Finance
and Economics, 4, 1-17.
Johansen, S., & Juselius, K. (1990). Maximum likelihood estimation and inference
on cointegration–with applications to the demand for money. Oxford
Bulletin of Economics and Statistics, 52, 169-210.
Kalirajan, K., Prasad, R., & Drysdale, P. (2012). Have China & India achieved
their potential in attracting Foreign Direct Investment? Journal of
Emerging Knowledge on Emerging Markets, 4, 1-20.
The Nexus Between FDI, Trade Openness, Real Exchange Rate and Infrastructure Quality in India
Undergraduate Research Project Page 55 of 96 Faculty of Business and Finance
Khan, R. E. A., Rehman, H., & Sattar, R. (2012). Effectiveness of exchange rate
in Pakistan: Causality analysis. Pak. J. Commer. Soc. Sci., 6(1), 83-96.
Kirchner, S. (2012). Foreign direct investment in Australia following the
Australia–US free trade agreement. The Australian Economic Review,
45(4), 410–421.
Krugell, W. (2005). The Determinants of Foreign Direct Investment in Africa.
Multinational Enterprises, Foreign Direct Investment and Growth in
Africa: South-African Perspectives, Physica-Verlag GmbH & Co, Berlin.
Lastrapes, W. D. (1992). Sources of fluctuations in real and nominal exchange
rates. The Review of Economics and Statistics, 74, 530-539.
Liargovas, P. G., & Skandalis, K. S. (2013). Foreign direct investment and trade
openness: The case of developing economies. Social Indicators Research,
106(2), 323-331.
Liu, Z. (2013). The relationship between FDI and international trade: Evidence
from P.R.China and OECD. The University of HULL, 1-291.
Lu, C., & Xin, Z. (2010). Impulse response function analysis: An application to
macroeconomic data of China. D-level Essay in Statistics, 1-22.
Mateev, M. (2009). Determinants of foreign direct investment in Central and
Southeastern Europe: New empirical tests. Oxford Journal, 8(1), 133-149.
Mendoza, E. G. (2000). On the instability of variance decomposition of the real
exchange rate across exchange-rate-regimes: Evidence from Mexico and
the United States. Duke University and NBER, 1-16.
Morales-Zumaquero, A. (2006). Explaining real exchange rate fluctuations.
Journal of Applied Economics, 9(2), 345-360.
Muijs, D. (2000). Doing quantitative research in education with SPSS.
London, UK: Sage.
Mukhtar, T., & Rasheed, S. (2010). Testing long run relationship between exports
and imports: Evidence from Pakistan. Journal of Economic Cooperation
and Development, 30(1), 41-58.
Mustajab, M. (2009). Infrastructure investment in Indonesia: Process and impact.
Rijksuniversiteit Groningen, 1-161.
Nyamrunda, G. C. (2012). An empirical study on the long-run relationships
between lower exchange rates and foreign direct investments in
developing economies; Evidence from Tanzania. Journal of Applied
Economics and Business Research, 2(4), 212-220.
The Nexus Between FDI, Trade Openness, Real Exchange Rate and Infrastructure Quality in India
Undergraduate Research Project Page 56 of 96 Faculty of Business and Finance
Onyeiwu, S., & Shrestha, H. (2004). Determinants of foreign direct investment in
Africa. Journal of Developing Societies, 20, 89-106.
Pesavento, E., & Rossi, B. (2005). Small sample confidence intervals for
multivariate impulse response functions at long horizons. Journal of
Applied Econometrics, 21(8), 1135-1155.
Phillips, P. C. B., & Xiao, Z. (1998). A primer on unit root testing. Journal of
Economic Surveys, 12(5), 424-467.
Pradhan, R. P. (2008). Does infrastructure play a role in foreign direct investment?
The IUP Journal of Financial Economics, 4(2), 48-60.
Rao, K. C. S., Sridharan, P., & Vijayakumar, N. (2010). Determinants of FDI in
BRICS countries: A panel analysis. Journal of Business Science and
Applied Management, 5(3), 1-13.
Renard, F. M. (2011). China’s trade and FDI in Africa. Working Paper No.126,
1-38.
Rusike, T. G. (2007). Trends and determinants of inward foreign direct investment
to South Africa. Rhodes University, 1, 1-101.
Sathye, S. (2011). Foreign direct investment and economic growth: Is
infrastructure an issue? Journal of Academy of Business and Economics,
11(2), 123-129.
Sims, C. A. (1980). Macroeconomics and reality. Econometrica 48, 1-48.
Thilakaweera, B. H. P. K. (2014). Economic impact of foreign direct investment
in Sri Lanka. Staff Studies, 41(2), 89-115.
Tian, W., & Yu, M. (2012). China and India: Trends in trade over the last decade.
The Journal of China and Global Economics, 1(1), 27-38.
Topalova, P. (2010). Factor immobility and regional impacts of trade
liberalization: Evidence on poverty from India. IMF Working Paper, 1-45.
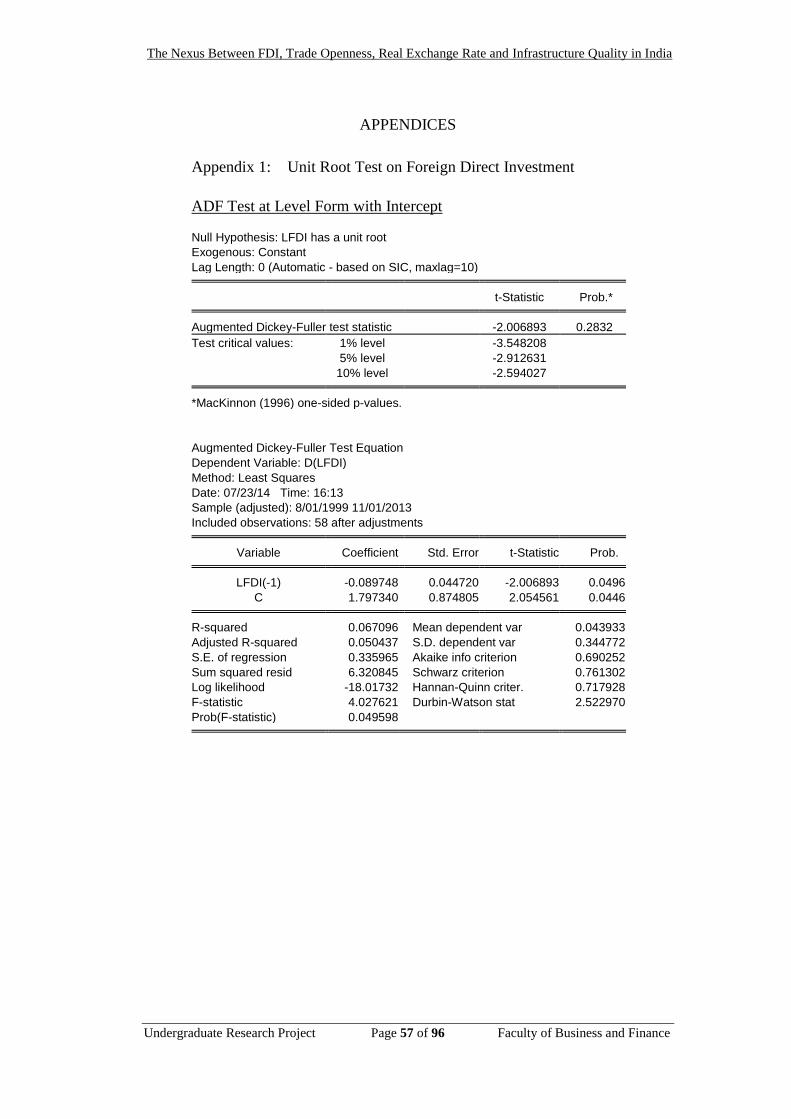
The Nexus Between FDI, Trade Openness, Real Exchange Rate and Infrastructure Quality in India
Undergraduate Research Project Page 57 of 96 Faculty of Business and Finance
APPENDICES
Appendix 1: Unit Root Test on Foreign Direct Investment
ADF Test at Level Form with Intercept
Null Hypothesis: LFDI has a unit root
Exogenous: Constant
Lag Length: 0 (Automatic - based on SIC, maxlag=10) t-Statistic Prob.* Augmented Dickey-Fuller test statistic -2.006893 0.2832
Test critical values: 1% level -3.548208
5% level -2.912631
10% level -2.594027 *MacKinnon (1996) one-sided p-values.
Augmented Dickey-Fuller Test Equation
Dependent Variable: D(LFDI)
Method: Least Squares
Date: 07/23/14 Time: 16:13
Sample (adjusted): 8/01/1999 11/01/2013
Included observations: 58 after adjustments Variable Coefficient Std. Error t-Statistic Prob. LFDI(-1) -0.089748 0.044720 -2.006893 0.0496
C 1.797340 0.874805 2.054561 0.0446 R-squared 0.067096 Mean dependent var 0.043933
Adjusted R-squared 0.050437 S.D. dependent var 0.344772
S.E. of regression 0.335965 Akaike info criterion 0.690252
Sum squared resid 6.320845 Schwarz criterion 0.761302
Log likelihood -18.01732 Hannan-Quinn criter. 0.717928
F-statistic 4.027621 Durbin-Watson stat 2.522970
Prob(F-statistic) 0.049598

The Nexus Between FDI, Trade Openness, Real Exchange Rate and Infrastructure Quality in India
Undergraduate Research Project Page 58 of 96 Faculty of Business and Finance
ADF Test at First Difference with Intercept
Null Hypothesis: D(LFDI) has a unit root
Exogenous: Constant
Lag Length: 0 (Automatic - based on SIC, maxlag=10) t-Statistic Prob.* Augmented Dickey-Fuller test statistic -10.24430 0.0000
Test critical values: 1% level -3.550396
5% level -2.913549
10% level -2.594521 *MacKinnon (1996) one-sided p-values.
Augmented Dickey-Fuller Test Equation
Dependent Variable: D(LFDI,2)
Method: Least Squares
Date: 07/23/14 Time: 16:20
Sample (adjusted): 11/01/1999 11/01/2013
Included observations: 57 after adjustments Variable Coefficient Std. Error t-Statistic Prob. D(LFDI(-1)) -1.320607 0.128911 -10.24430 0.0000
C 0.055037 0.044254 1.243671 0.2189 R-squared 0.656133 Mean dependent var -0.013556
Adjusted R-squared 0.649881 S.D. dependent var 0.558150
S.E. of regression 0.330262 Akaike info criterion 0.656596
Sum squared resid 5.999013 Schwarz criterion 0.728282
Log likelihood -16.71299 Hannan-Quinn criter. 0.684456
F-statistic 104.9457 Durbin-Watson stat 1.997376
Prob(F-statistic) 0.000000
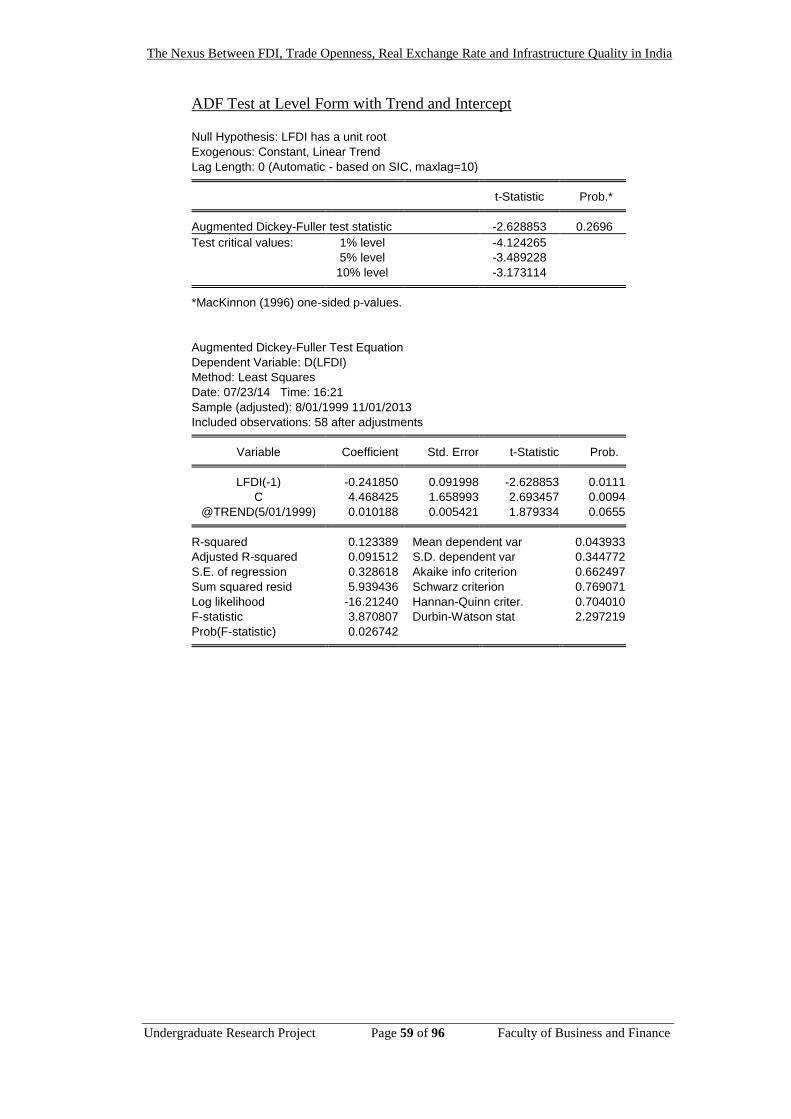
The Nexus Between FDI, Trade Openness, Real Exchange Rate and Infrastructure Quality in India
Undergraduate Research Project Page 59 of 96 Faculty of Business and Finance
ADF Test at Level Form with Trend and Intercept
Null Hypothesis: LFDI has a unit root
Exogenous: Constant, Linear Trend
Lag Length: 0 (Automatic - based on SIC, maxlag=10) t-Statistic Prob.* Augmented Dickey-Fuller test statistic -2.628853 0.2696
Test critical values: 1% level -4.124265
5% level -3.489228
10% level -3.173114 *MacKinnon (1996) one-sided p-values.
Augmented Dickey-Fuller Test Equation
Dependent Variable: D(LFDI)
Method: Least Squares
Date: 07/23/14 Time: 16:21
Sample (adjusted): 8/01/1999 11/01/2013
Included observations: 58 after adjustments Variable Coefficient Std. Error t-Statistic Prob. LFDI(-1) -0.241850 0.091998 -2.628853 0.0111
C 4.468425 1.658993 2.693457 0.0094
@TREND(5/01/1999) 0.010188 0.005421 1.879334 0.0655 R-squared 0.123389 Mean dependent var 0.043933
Adjusted R-squared 0.091512 S.D. dependent var 0.344772
S.E. of regression 0.328618 Akaike info criterion 0.662497
Sum squared resid 5.939436 Schwarz criterion 0.769071
Log likelihood -16.21240 Hannan-Quinn criter. 0.704010
F-statistic 3.870807 Durbin-Watson stat 2.297219
Prob(F-statistic) 0.026742

The Nexus Between FDI, Trade Openness, Real Exchange Rate and Infrastructure Quality in India
Undergraduate Research Project Page 60 of 96 Faculty of Business and Finance
ADF Test at First Difference with Trend and Intercept
Null Hypothesis: D(LFDI) has a unit root
Exogenous: Constant, Linear Trend
Lag Length: 0 (Automatic - based on SIC, maxlag=10) t-Statistic Prob.* Augmented Dickey-Fuller test statistic -10.26656 0.0000
Test critical values: 1% level -4.127338
5% level -3.490662
10% level -3.173943 *MacKinnon (1996) one-sided p-values.
Augmented Dickey-Fuller Test Equation
Dependent Variable: D(LFDI,2)
Method: Least Squares
Date: 07/23/14 Time: 16:23
Sample (adjusted): 11/01/1999 11/01/2013
Included observations: 57 after adjustments Variable Coefficient Std. Error t-Statistic Prob. D(LFDI(-1)) -1.329784 0.129526 -10.26656 0.0000
C 0.127934 0.092051 1.389810 0.1703
@TREND(5/01/1999) -0.002414 0.002672 -0.903582 0.3702 R-squared 0.661255 Mean dependent var -0.013556
Adjusted R-squared 0.648709 S.D. dependent var 0.558150
S.E. of regression 0.330814 Akaike info criterion 0.676677
Sum squared resid 5.909661 Schwarz criterion 0.784206
Log likelihood -16.28531 Hannan-Quinn criter. 0.718467
F-statistic 52.70597 Durbin-Watson stat 2.013278
Prob(F-statistic) 0.000000
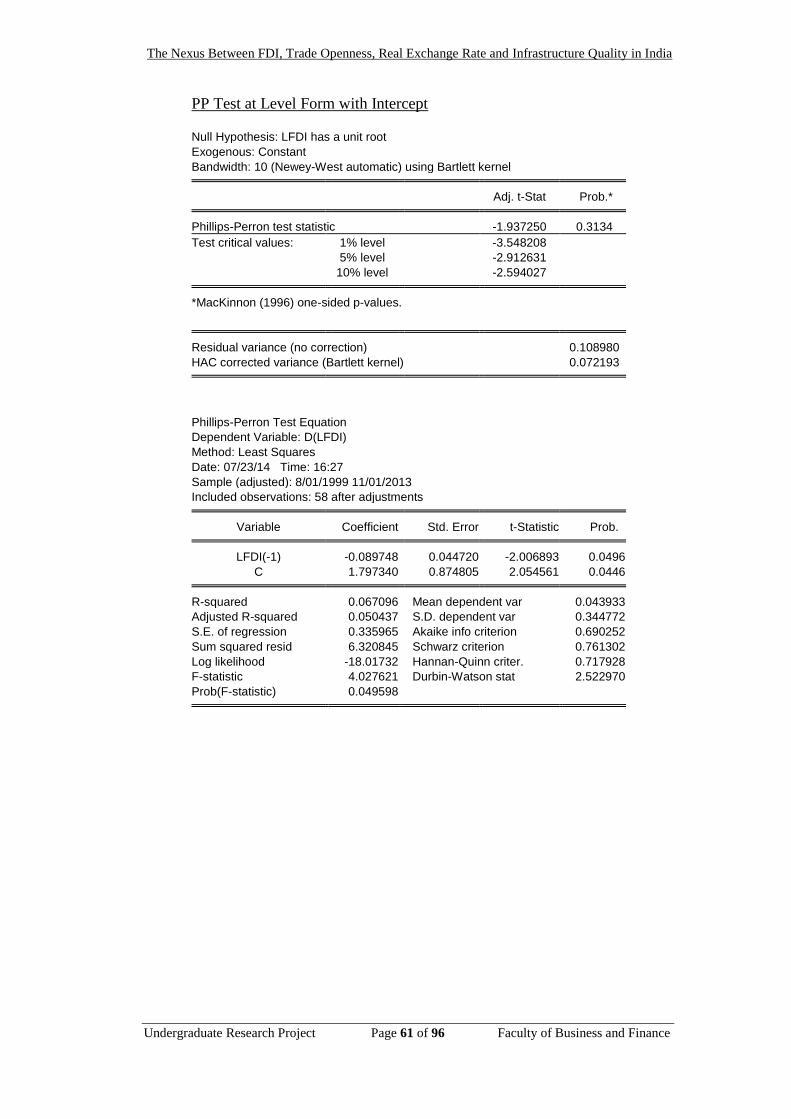
The Nexus Between FDI, Trade Openness, Real Exchange Rate and Infrastructure Quality in India
Undergraduate Research Project Page 61 of 96 Faculty of Business and Finance
PP Test at Level Form with Intercept
Null Hypothesis: LFDI has a unit root
Exogenous: Constant
Bandwidth: 10 (Newey-West automatic) using Bartlett kernel Adj. t-Stat Prob.* Phillips-Perron test statistic -1.937250 0.3134
Test critical values: 1% level -3.548208
5% level -2.912631
10% level -2.594027 *MacKinnon (1996) one-sided p-values.
Residual variance (no correction) 0.108980
HAC corrected variance (Bartlett kernel) 0.072193
Phillips-Perron Test Equation
Dependent Variable: D(LFDI)
Method: Least Squares
Date: 07/23/14 Time: 16:27
Sample (adjusted): 8/01/1999 11/01/2013
Included observations: 58 after adjustments Variable Coefficient Std. Error t-Statistic Prob. LFDI(-1) -0.089748 0.044720 -2.006893 0.0496
C 1.797340 0.874805 2.054561 0.0446 R-squared 0.067096 Mean dependent var 0.043933
Adjusted R-squared 0.050437 S.D. dependent var 0.344772
S.E. of regression 0.335965 Akaike info criterion 0.690252
Sum squared resid 6.320845 Schwarz criterion 0.761302
Log likelihood -18.01732 Hannan-Quinn criter. 0.717928
F-statistic 4.027621 Durbin-Watson stat 2.522970
Prob(F-statistic) 0.049598

The Nexus Between FDI, Trade Openness, Real Exchange Rate and Infrastructure Quality in India
Undergraduate Research Project Page 62 of 96 Faculty of Business and Finance
PP Test at First Difference with Intercept
Null Hypothesis: D(LFDI) has a unit root
Exogenous: Constant
Bandwidth: 12 (Newey-West automatic) using Bartlett kernel Adj. t-Stat Prob.* Phillips-Perron test statistic -10.91011 0.0000
Test critical values: 1% level -3.550396
5% level -2.913549
10% level -2.594521 *MacKinnon (1996) one-sided p-values.
Residual variance (no correction) 0.105246
HAC corrected variance (Bartlett kernel) 0.074897
Phillips-Perron Test Equation
Dependent Variable: D(LFDI,2)
Method: Least Squares
Date: 07/23/14 Time: 16:28
Sample (adjusted): 11/01/1999 11/01/2013
Included observations: 57 after adjustments Variable Coefficient Std. Error t-Statistic Prob. D(LFDI(-1)) -1.320607 0.128911 -10.24430 0.0000
C 0.055037 0.044254 1.243671 0.2189 R-squared 0.656133 Mean dependent var -0.013556
Adjusted R-squared 0.649881 S.D. dependent var 0.558150
S.E. of regression 0.330262 Akaike info criterion 0.656596
Sum squared resid 5.999013 Schwarz criterion 0.728282
Log likelihood -16.71299 Hannan-Quinn criter. 0.684456
F-statistic 104.9457 Durbin-Watson stat 1.997376
Prob(F-statistic) 0.000000

The Nexus Between FDI, Trade Openness, Real Exchange Rate and Infrastructure Quality in India
Undergraduate Research Project Page 63 of 96 Faculty of Business and Finance
PP Test at Level Form with Trend and Intercept
Null Hypothesis: LFDI has a unit root
Exogenous: Constant, Linear Trend
Bandwidth: 1 (Newey-West automatic) using Bartlett kernel Adj. t-Stat Prob.* Phillips-Perron test statistic -2.399607 0.3759
Test critical values: 1% level -4.124265
5% level -3.489228
10% level -3.173114 *MacKinnon (1996) one-sided p-values.
Residual variance (no correction) 0.102404
HAC corrected variance (Bartlett kernel) 0.084912
Phillips-Perron Test Equation
Dependent Variable: D(LFDI)
Method: Least Squares
Date: 07/23/14 Time: 16:29
Sample (adjusted): 8/01/1999 11/01/2013
Included observations: 58 after adjustments Variable Coefficient Std. Error t-Statistic Prob. LFDI(-1) -0.241850 0.091998 -2.628853 0.0111
C 4.468425 1.658993 2.693457 0.0094
@TREND(5/01/1999) 0.010188 0.005421 1.879334 0.0655 R-squared 0.123389 Mean dependent var 0.043933
Adjusted R-squared 0.091512 S.D. dependent var 0.344772
S.E. of regression 0.328618 Akaike info criterion 0.662497
Sum squared resid 5.939436 Schwarz criterion 0.769071
Log likelihood -16.21240 Hannan-Quinn criter. 0.704010
F-statistic 3.870807 Durbin-Watson stat 2.297219
Prob(F-statistic) 0.026742

The Nexus Between FDI, Trade Openness, Real Exchange Rate and Infrastructure Quality in India
Undergraduate Research Project Page 64 of 96 Faculty of Business and Finance
PP Test at First Difference with Trend and Intercept
Null Hypothesis: D(LFDI) has a unit root
Exogenous: Constant, Linear Trend
Bandwidth: 17 (Newey-West automatic) using Bartlett kernel Adj. t-Stat Prob.* Phillips-Perron test statistic -12.39229 0.0000
Test critical values: 1% level -4.127338
5% level -3.490662
10% level -3.173943 *MacKinnon (1996) one-sided p-values.
Residual variance (no correction) 0.103678
HAC corrected variance (Bartlett kernel) 0.046241
Phillips-Perron Test Equation
Dependent Variable: D(LFDI,2)
Method: Least Squares
Date: 07/23/14 Time: 16:31
Sample (adjusted): 11/01/1999 11/01/2013
Included observations: 57 after adjustments Variable Coefficient Std. Error t-Statistic Prob. D(LFDI(-1)) -1.329784 0.129526 -10.26656 0.0000
C 0.127934 0.092051 1.389810 0.1703
@TREND(5/01/1999) -0.002414 0.002672 -0.903582 0.3702 R-squared 0.661255 Mean dependent var -0.013556
Adjusted R-squared 0.648709 S.D. dependent var 0.558150
S.E. of regression 0.330814 Akaike info criterion 0.676677
Sum squared resid 5.909661 Schwarz criterion 0.784206
Log likelihood -16.28531 Hannan-Quinn criter. 0.718467
F-statistic 52.70597 Durbin-Watson stat 2.013278
Prob(F-statistic) 0.000000
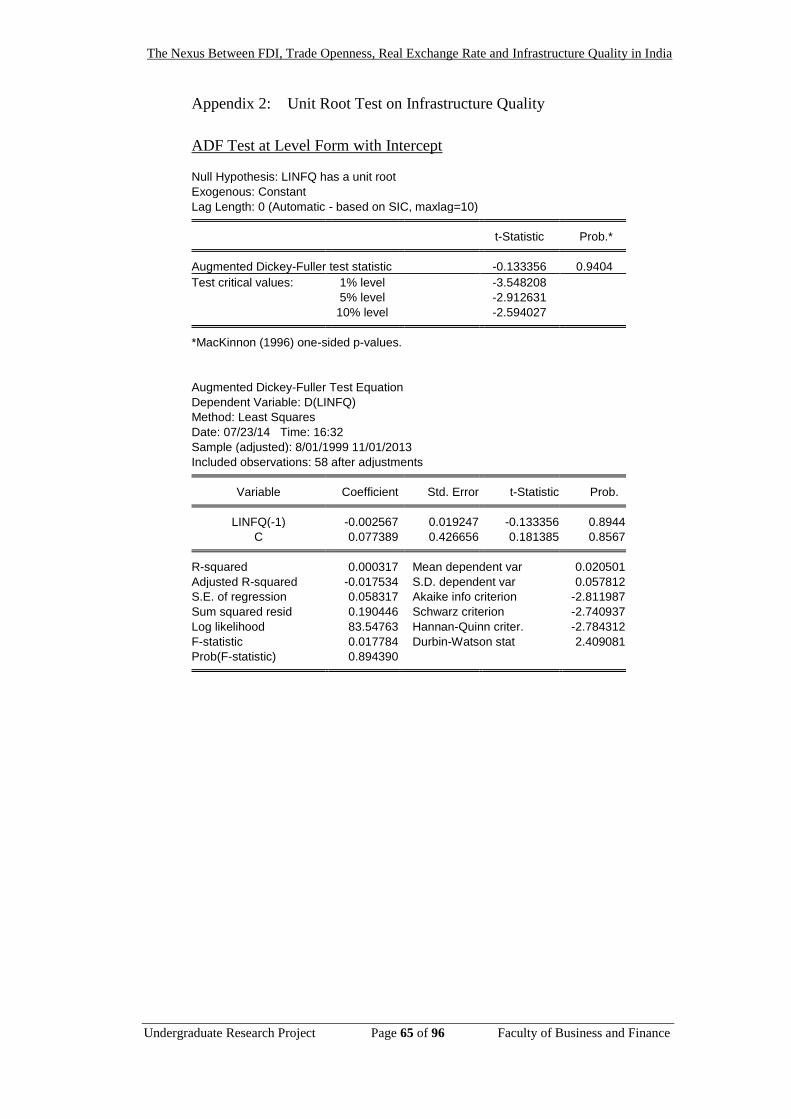
The Nexus Between FDI, Trade Openness, Real Exchange Rate and Infrastructure Quality in India
Undergraduate Research Project Page 65 of 96 Faculty of Business and Finance
Appendix 2: Unit Root Test on Infrastructure Quality
ADF Test at Level Form with Intercept
Null Hypothesis: LINFQ has a unit root
Exogenous: Constant
Lag Length: 0 (Automatic - based on SIC, maxlag=10) t-Statistic Prob.* Augmented Dickey-Fuller test statistic -0.133356 0.9404
Test critical values: 1% level -3.548208
5% level -2.912631
10% level -2.594027 *MacKinnon (1996) one-sided p-values.
Augmented Dickey-Fuller Test Equation
Dependent Variable: D(LINFQ)
Method: Least Squares
Date: 07/23/14 Time: 16:32
Sample (adjusted): 8/01/1999 11/01/2013
Included observations: 58 after adjustments Variable Coefficient Std. Error t-Statistic Prob. LINFQ(-1) -0.002567 0.019247 -0.133356 0.8944
C 0.077389 0.426656 0.181385 0.8567 R-squared 0.000317 Mean dependent var 0.020501
Adjusted R-squared -0.017534 S.D. dependent var 0.057812
S.E. of regression 0.058317 Akaike info criterion -2.811987
Sum squared resid 0.190446 Schwarz criterion -2.740937
Log likelihood 83.54763 Hannan-Quinn criter. -2.784312
F-statistic 0.017784 Durbin-Watson stat 2.409081
Prob(F-statistic) 0.894390

The Nexus Between FDI, Trade Openness, Real Exchange Rate and Infrastructure Quality in India
Undergraduate Research Project Page 66 of 96 Faculty of Business and Finance
ADF Test at First Difference with Intercept
Null Hypothesis: D(LINFQ) has a unit root
Exogenous: Constant
Lag Length: 0 (Automatic - based on SIC, maxlag=10) t-Statistic Prob.* Augmented Dickey-Fuller test statistic -9.161224 0.0000
Test critical values: 1% level -3.550396
5% level -2.913549
10% level -2.594521 *MacKinnon (1996) one-sided p-values.
Augmented Dickey-Fuller Test Equation
Dependent Variable: D(LINFQ,2)
Method: Least Squares
Date: 07/23/14 Time: 16:33
Sample (adjusted): 11/01/1999 11/01/2013
Included observations: 57 after adjustments Variable Coefficient Std. Error t-Statistic Prob. D(LINFQ(-1)) -1.209434 0.132017 -9.161224 0.0000
C 0.025029 0.008106 3.087897 0.0032 R-squared 0.604112 Mean dependent var -0.000252
Adjusted R-squared 0.596914 S.D. dependent var 0.090630
S.E. of regression 0.057540 Akaike info criterion -2.838203
Sum squared resid 0.182099 Schwarz criterion -2.766517
Log likelihood 82.88879 Hannan-Quinn criter. -2.810344
F-statistic 83.92803 Durbin-Watson stat 2.044251
Prob(F-statistic) 0.000000

The Nexus Between FDI, Trade Openness, Real Exchange Rate and Infrastructure Quality in India
Undergraduate Research Project Page 67 of 96 Faculty of Business and Finance
ADF Test at Level Form with Trend and Intercept
Null Hypothesis: LINFQ has a unit root
Exogenous: Constant, Linear Trend
Lag Length: 0 (Automatic - based on SIC, maxlag=10) t-Statistic Prob.* Augmented Dickey-Fuller test statistic -3.847539 0.0208
Test critical values: 1% level -4.124265
5% level -3.489228
10% level -3.173114 *MacKinnon (1996) one-sided p-values.
Augmented Dickey-Fuller Test Equation
Dependent Variable: D(LINFQ)
Method: Least Squares
Date: 07/23/14 Time: 16:34
Sample (adjusted): 8/01/1999 11/01/2013
Included observations: 58 after adjustments Variable Coefficient Std. Error t-Statistic Prob. LINFQ(-1) -0.381776 0.099226 -3.847539 0.0003
C 8.212076 2.130737 3.854101 0.0003
@TREND(5/01/1999) 0.009151 0.002358 3.880471 0.0003 R-squared 0.215186 Mean dependent var 0.020501
Adjusted R-squared 0.186647 S.D. dependent var 0.057812
S.E. of regression 0.052138 Akaike info criterion -3.019495
Sum squared resid 0.149512 Schwarz criterion -2.912921
Log likelihood 90.56537 Hannan-Quinn criter. -2.977982
F-statistic 7.540152 Durbin-Watson stat 2.089114
Prob(F-statistic) 0.001277

The Nexus Between FDI, Trade Openness, Real Exchange Rate and Infrastructure Quality in India
Undergraduate Research Project Page 68 of 96 Faculty of Business and Finance
ADF Test at First Difference with Trend and Intercept
Null Hypothesis: D(LINFQ) has a unit root
Exogenous: Constant, Linear Trend
Lag Length: 0 (Automatic - based on SIC, maxlag=10) t-Statistic Prob.* Augmented Dickey-Fuller test statistic -9.122501 0.0000
Test critical values: 1% level -4.127338
5% level -3.490662
10% level -3.173943 *MacKinnon (1996) one-sided p-values.
Augmented Dickey-Fuller Test Equation
Dependent Variable: D(LINFQ,2)
Method: Least Squares
Date: 07/23/14 Time: 16:35
Sample (adjusted): 11/01/1999 11/01/2013
Included observations: 57 after adjustments Variable Coefficient Std. Error t-Statistic Prob. D(LINFQ(-1)) -1.215319 0.133222 -9.122501 0.0000
C 0.017093 0.016039 1.065763 0.2913
@TREND(5/01/1999) 0.000269 0.000467 0.574636 0.5679 R-squared 0.606518 Mean dependent var -0.000252
Adjusted R-squared 0.591944 S.D. dependent var 0.090630
S.E. of regression 0.057894 Akaike info criterion -2.809212
Sum squared resid 0.180992 Schwarz criterion -2.701683
Log likelihood 83.06253 Hannan-Quinn criter. -2.767422
F-statistic 41.61808 Durbin-Watson stat 2.046478
Prob(F-statistic) 0.000000

The Nexus Between FDI, Trade Openness, Real Exchange Rate and Infrastructure Quality in India
Undergraduate Research Project Page 69 of 96 Faculty of Business and Finance
PP Test at Level Form with Intercept
Null Hypothesis: LINFQ has a unit root
Exogenous: Constant
Bandwidth: 4 (Newey-West automatic) using Bartlett kernel Adj. t-Stat Prob.* Phillips-Perron test statistic 0.121154 0.9647
Test critical values: 1% level -3.548208
5% level -2.912631
10% level -2.594027 *MacKinnon (1996) one-sided p-values.
Residual variance (no correction) 0.003284
HAC corrected variance (Bartlett kernel) 0.001929
Phillips-Perron Test Equation
Dependent Variable: D(LINFQ)
Method: Least Squares
Date: 07/23/14 Time: 16:37
Sample (adjusted): 8/01/1999 11/01/2013
Included observations: 58 after adjustments Variable Coefficient Std. Error t-Statistic Prob. LINFQ(-1) -0.002567 0.019247 -0.133356 0.8944
C 0.077389 0.426656 0.181385 0.8567 R-squared 0.000317 Mean dependent var 0.020501
Adjusted R-squared -0.017534 S.D. dependent var 0.057812
S.E. of regression 0.058317 Akaike info criterion -2.811987
Sum squared resid 0.190446 Schwarz criterion -2.740937
Log likelihood 83.54763 Hannan-Quinn criter. -2.784312
F-statistic 0.017784 Durbin-Watson stat 2.409081
Prob(F-statistic) 0.894390
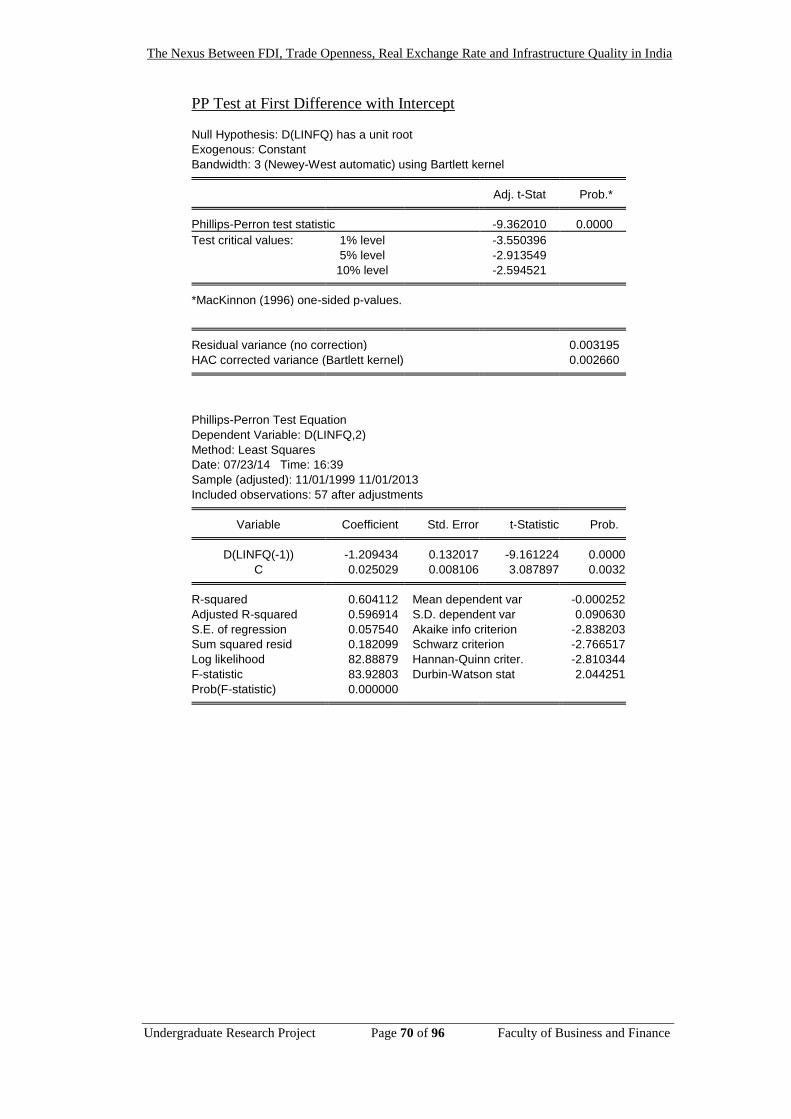
The Nexus Between FDI, Trade Openness, Real Exchange Rate and Infrastructure Quality in India
Undergraduate Research Project Page 70 of 96 Faculty of Business and Finance
PP Test at First Difference with Intercept
Null Hypothesis: D(LINFQ) has a unit root
Exogenous: Constant
Bandwidth: 3 (Newey-West automatic) using Bartlett kernel Adj. t-Stat Prob.* Phillips-Perron test statistic -9.362010 0.0000
Test critical values: 1% level -3.550396
5% level -2.913549
10% level -2.594521 *MacKinnon (1996) one-sided p-values.
Residual variance (no correction) 0.003195
HAC corrected variance (Bartlett kernel) 0.002660
Phillips-Perron Test Equation
Dependent Variable: D(LINFQ,2)
Method: Least Squares
Date: 07/23/14 Time: 16:39
Sample (adjusted): 11/01/1999 11/01/2013
Included observations: 57 after adjustments Variable Coefficient Std. Error t-Statistic Prob. D(LINFQ(-1)) -1.209434 0.132017 -9.161224 0.0000
C 0.025029 0.008106 3.087897 0.0032 R-squared 0.604112 Mean dependent var -0.000252
Adjusted R-squared 0.596914 S.D. dependent var 0.090630
S.E. of regression 0.057540 Akaike info criterion -2.838203
Sum squared resid 0.182099 Schwarz criterion -2.766517
Log likelihood 82.88879 Hannan-Quinn criter. -2.810344
F-statistic 83.92803 Durbin-Watson stat 2.044251
Prob(F-statistic) 0.000000

The Nexus Between FDI, Trade Openness, Real Exchange Rate and Infrastructure Quality in India
Undergraduate Research Project Page 71 of 96 Faculty of Business and Finance
PP Test at Level Form with Trend and Intercept
Null Hypothesis: LINFQ has a unit root
Exogenous: Constant, Linear Trend
Bandwidth: 0 (Newey-West automatic) using Bartlett kernel Adj. t-Stat Prob.* Phillips-Perron test statistic -3.847539 0.0208
Test critical values: 1% level -4.124265
5% level -3.489228
10% level -3.173114 *MacKinnon (1996) one-sided p-values.
Residual variance (no correction) 0.002578
HAC corrected variance (Bartlett kernel) 0.002578
Phillips-Perron Test Equation
Dependent Variable: D(LINFQ)
Method: Least Squares
Date: 07/23/14 Time: 16:40
Sample (adjusted): 8/01/1999 11/01/2013
Included observations: 58 after adjustments Variable Coefficient Std. Error t-Statistic Prob. LINFQ(-1) -0.381776 0.099226 -3.847539 0.0003
C 8.212076 2.130737 3.854101 0.0003
@TREND(5/01/1999) 0.009151 0.002358 3.880471 0.0003 R-squared 0.215186 Mean dependent var 0.020501
Adjusted R-squared 0.186647 S.D. dependent var 0.057812
S.E. of regression 0.052138 Akaike info criterion -3.019495
Sum squared resid 0.149512 Schwarz criterion -2.912921
Log likelihood 90.56537 Hannan-Quinn criter. -2.977982
F-statistic 7.540152 Durbin-Watson stat 2.089114
Prob(F-statistic) 0.001277

The Nexus Between FDI, Trade Openness, Real Exchange Rate and Infrastructure Quality in India
Undergraduate Research Project Page 72 of 96 Faculty of Business and Finance
PP Test at First Difference with Trend and Intercept
Null Hypothesis: D(LINFQ) has a unit root
Exogenous: Constant, Linear Trend
Bandwidth: 4 (Newey-West automatic) using Bartlett kernel Adj. t-Stat Prob.* Phillips-Perron test statistic -9.443090 0.0000
Test critical values: 1% level -4.127338
5% level -3.490662
10% level -3.173943 *MacKinnon (1996) one-sided p-values.
Residual variance (no correction) 0.003175
HAC corrected variance (Bartlett kernel) 0.002419
Phillips-Perron Test Equation
Dependent Variable: D(LINFQ,2)
Method: Least Squares
Date: 07/23/14 Time: 16:44
Sample (adjusted): 11/01/1999 11/01/2013
Included observations: 57 after adjustments Variable Coefficient Std. Error t-Statistic Prob. D(LINFQ(-1)) -1.215319 0.133222 -9.122501 0.0000
C 0.017093 0.016039 1.065763 0.2913
@TREND(5/01/1999) 0.000269 0.000467 0.574636 0.5679 R-squared 0.606518 Mean dependent var -0.000252
Adjusted R-squared 0.591944 S.D. dependent var 0.090630
S.E. of regression 0.057894 Akaike info criterion -2.809212
Sum squared resid 0.180992 Schwarz criterion -2.701683
Log likelihood 83.06253 Hannan-Quinn criter. -2.767422
F-statistic 41.61808 Durbin-Watson stat 2.046478
Prob(F-statistic) 0.000000
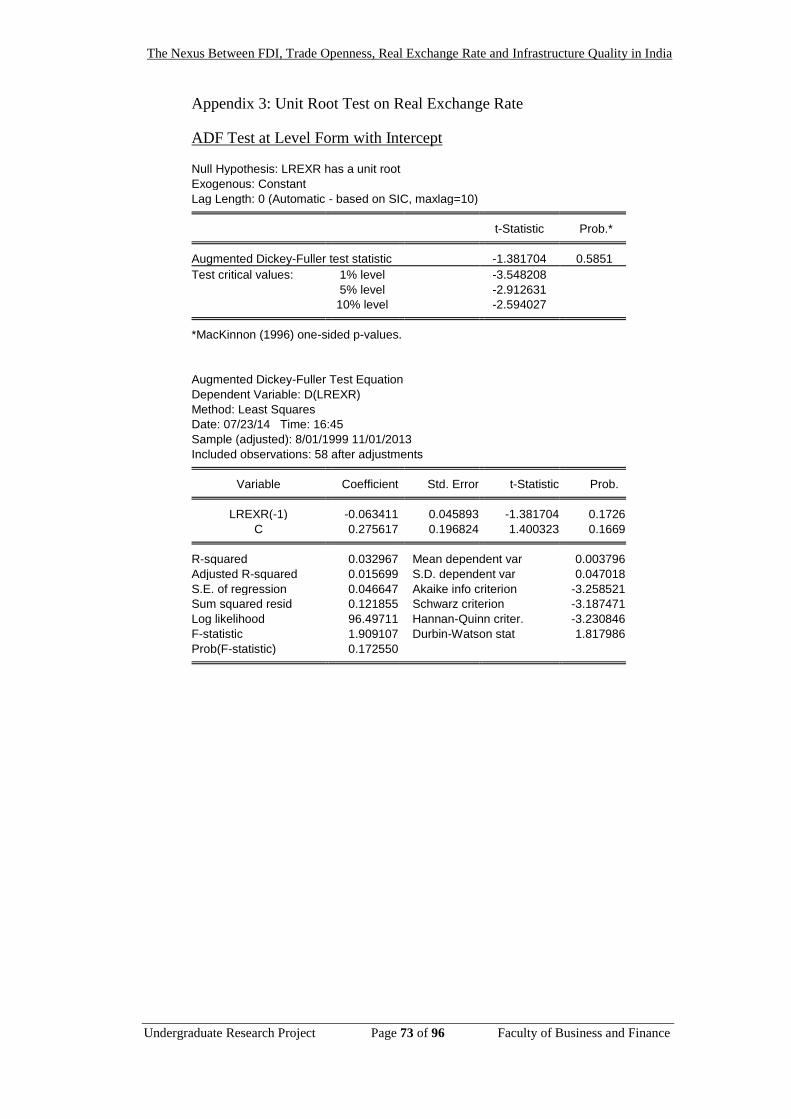
The Nexus Between FDI, Trade Openness, Real Exchange Rate and Infrastructure Quality in India
Undergraduate Research Project Page 73 of 96 Faculty of Business and Finance
Appendix 3: Unit Root Test on Real Exchange Rate
ADF Test at Level Form with Intercept
Null Hypothesis: LREXR has a unit root
Exogenous: Constant
Lag Length: 0 (Automatic - based on SIC, maxlag=10) t-Statistic Prob.* Augmented Dickey-Fuller test statistic -1.381704 0.5851
Test critical values: 1% level -3.548208
5% level -2.912631
10% level -2.594027 *MacKinnon (1996) one-sided p-values.
Augmented Dickey-Fuller Test Equation
Dependent Variable: D(LREXR)
Method: Least Squares
Date: 07/23/14 Time: 16:45
Sample (adjusted): 8/01/1999 11/01/2013
Included observations: 58 after adjustments Variable Coefficient Std. Error t-Statistic Prob. LREXR(-1) -0.063411 0.045893 -1.381704 0.1726
C 0.275617 0.196824 1.400323 0.1669 R-squared 0.032967 Mean dependent var 0.003796
Adjusted R-squared 0.015699 S.D. dependent var 0.047018
S.E. of regression 0.046647 Akaike info criterion -3.258521
Sum squared resid 0.121855 Schwarz criterion -3.187471
Log likelihood 96.49711 Hannan-Quinn criter. -3.230846
F-statistic 1.909107 Durbin-Watson stat 1.817986
Prob(F-statistic) 0.172550
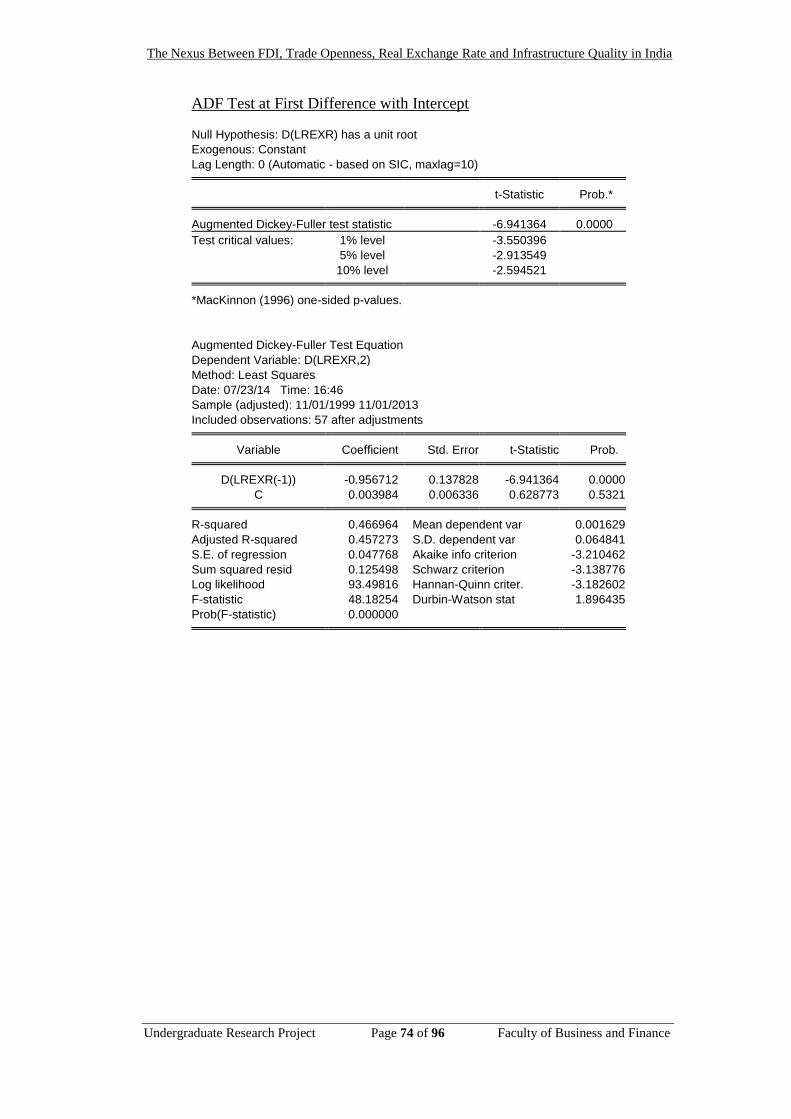
The Nexus Between FDI, Trade Openness, Real Exchange Rate and Infrastructure Quality in India
Undergraduate Research Project Page 74 of 96 Faculty of Business and Finance
ADF Test at First Difference with Intercept
Null Hypothesis: D(LREXR) has a unit root
Exogenous: Constant
Lag Length: 0 (Automatic - based on SIC, maxlag=10) t-Statistic Prob.* Augmented Dickey-Fuller test statistic -6.941364 0.0000
Test critical values: 1% level -3.550396
5% level -2.913549
10% level -2.594521 *MacKinnon (1996) one-sided p-values.
Augmented Dickey-Fuller Test Equation
Dependent Variable: D(LREXR,2)
Method: Least Squares
Date: 07/23/14 Time: 16:46
Sample (adjusted): 11/01/1999 11/01/2013
Included observations: 57 after adjustments Variable Coefficient Std. Error t-Statistic Prob. D(LREXR(-1)) -0.956712 0.137828 -6.941364 0.0000
C 0.003984 0.006336 0.628773 0.5321 R-squared 0.466964 Mean dependent var 0.001629
Adjusted R-squared 0.457273 S.D. dependent var 0.064841
S.E. of regression 0.047768 Akaike info criterion -3.210462
Sum squared resid 0.125498 Schwarz criterion -3.138776
Log likelihood 93.49816 Hannan-Quinn criter. -3.182602
F-statistic 48.18254 Durbin-Watson stat 1.896435
Prob(F-statistic) 0.000000
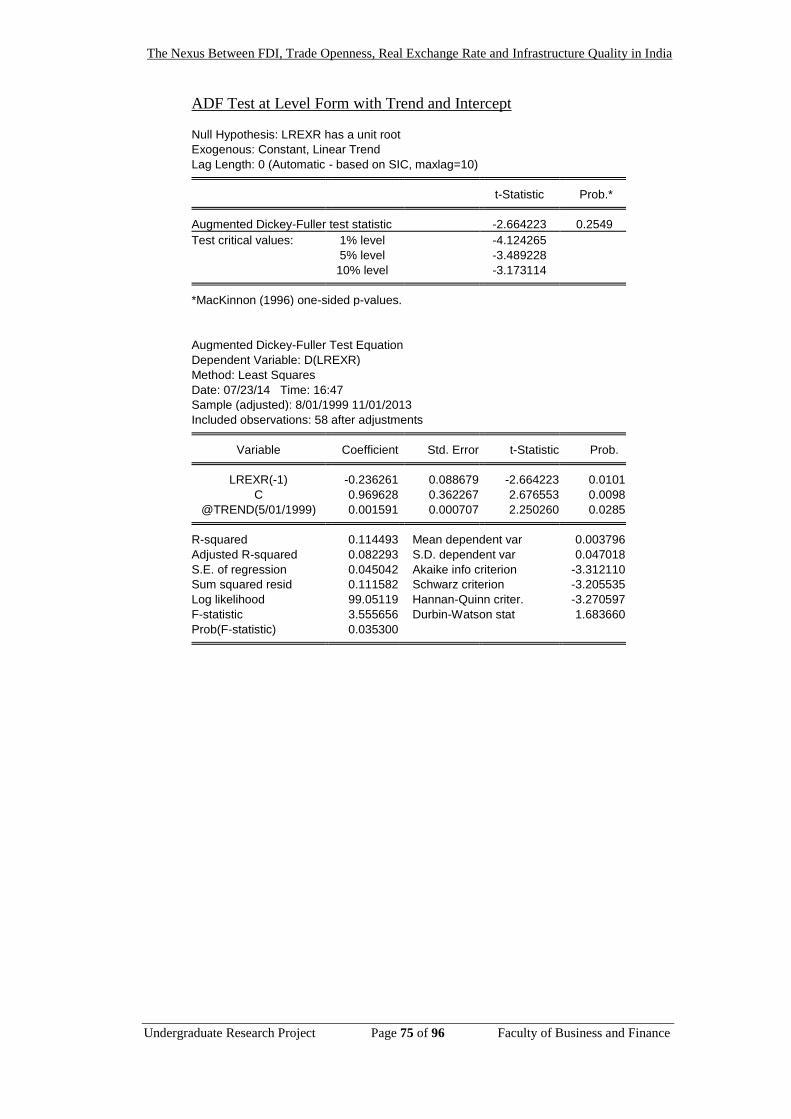
The Nexus Between FDI, Trade Openness, Real Exchange Rate and Infrastructure Quality in India
Undergraduate Research Project Page 75 of 96 Faculty of Business and Finance
ADF Test at Level Form with Trend and Intercept
Null Hypothesis: LREXR has a unit root
Exogenous: Constant, Linear Trend
Lag Length: 0 (Automatic - based on SIC, maxlag=10) t-Statistic Prob.* Augmented Dickey-Fuller test statistic -2.664223 0.2549
Test critical values: 1% level -4.124265
5% level -3.489228
10% level -3.173114 *MacKinnon (1996) one-sided p-values.
Augmented Dickey-Fuller Test Equation
Dependent Variable: D(LREXR)
Method: Least Squares
Date: 07/23/14 Time: 16:47
Sample (adjusted): 8/01/1999 11/01/2013
Included observations: 58 after adjustments Variable Coefficient Std. Error t-Statistic Prob. LREXR(-1) -0.236261 0.088679 -2.664223 0.0101
C 0.969628 0.362267 2.676553 0.0098
@TREND(5/01/1999) 0.001591 0.000707 2.250260 0.0285 R-squared 0.114493 Mean dependent var 0.003796
Adjusted R-squared 0.082293 S.D. dependent var 0.047018
S.E. of regression 0.045042 Akaike info criterion -3.312110
Sum squared resid 0.111582 Schwarz criterion -3.205535
Log likelihood 99.05119 Hannan-Quinn criter. -3.270597
F-statistic 3.555656 Durbin-Watson stat 1.683660
Prob(F-statistic) 0.035300

The Nexus Between FDI, Trade Openness, Real Exchange Rate and Infrastructure Quality in India
Undergraduate Research Project Page 76 of 96 Faculty of Business and Finance
ADF Test at First Difference with Trend and Intercept
Null Hypothesis: D(LREXR) has a unit root
Exogenous: Constant, Linear Trend
Lag Length: 0 (Automatic - based on SIC, maxlag=10) t-Statistic Prob.* Augmented Dickey-Fuller test statistic -6.875963 0.0000
Test critical values: 1% level -4.127338
5% level -3.490662
10% level -3.173943 *MacKinnon (1996) one-sided p-values.
Augmented Dickey-Fuller Test Equation
Dependent Variable: D(LREXR,2)
Method: Least Squares
Date: 07/23/14 Time: 16:48
Sample (adjusted): 11/01/1999 11/01/2013
Included observations: 57 after adjustments Variable Coefficient Std. Error t-Statistic Prob. D(LREXR(-1)) -0.958302 0.139370 -6.875963 0.0000
C 0.005985 0.013323 0.449241 0.6551
@TREND(5/01/1999) -6.66E-05 0.000389 -0.171210 0.8647 R-squared 0.467253 Mean dependent var 0.001629
Adjusted R-squared 0.447522 S.D. dependent var 0.064841
S.E. of regression 0.048195 Akaike info criterion -3.175917
Sum squared resid 0.125430 Schwarz criterion -3.068388
Log likelihood 93.51362 Hannan-Quinn criter. -3.134127
F-statistic 23.68074 Durbin-Watson stat 1.895321
Prob(F-statistic) 0.000000

The Nexus Between FDI, Trade Openness, Real Exchange Rate and Infrastructure Quality in India
Undergraduate Research Project Page 77 of 96 Faculty of Business and Finance
PP Test at Level Form with Intercept
Null Hypothesis: LREXR has a unit root
Exogenous: Constant
Bandwidth: 7 (Newey-West automatic) using Bartlett kernel Adj. t-Stat Prob.* Phillips-Perron test statistic -1.233982 0.6539
Test critical values: 1% level -3.548208
5% level -2.912631
10% level -2.594027 *MacKinnon (1996) one-sided p-values.
Residual variance (no correction) 0.002101
HAC corrected variance (Bartlett kernel) 0.001624
Phillips-Perron Test Equation
Dependent Variable: D(LREXR)
Method: Least Squares
Date: 07/23/14 Time: 16:50
Sample (adjusted): 8/01/1999 11/01/2013
Included observations: 58 after adjustments Variable Coefficient Std. Error t-Statistic Prob. LREXR(-1) -0.063411 0.045893 -1.381704 0.1726
C 0.275617 0.196824 1.400323 0.1669 R-squared 0.032967 Mean dependent var 0.003796
Adjusted R-squared 0.015699 S.D. dependent var 0.047018
S.E. of regression 0.046647 Akaike info criterion -3.258521
Sum squared resid 0.121855 Schwarz criterion -3.187471
Log likelihood 96.49711 Hannan-Quinn criter. -3.230846
F-statistic 1.909107 Durbin-Watson stat 1.817986
Prob(F-statistic) 0.172550

The Nexus Between FDI, Trade Openness, Real Exchange Rate and Infrastructure Quality in India
Undergraduate Research Project Page 78 of 96 Faculty of Business and Finance
PP Test at First Difference with Intercept
Null Hypothesis: D(LREXR) has a unit root
Exogenous: Constant
Bandwidth: 14 (Newey-West automatic) using Bartlett kernel Adj. t-Stat Prob.* Phillips-Perron test statistic -7.517498 0.0000
Test critical values: 1% level -3.550396
5% level -2.913549
10% level -2.594521 *MacKinnon (1996) one-sided p-values.
Residual variance (no correction) 0.002202
HAC corrected variance (Bartlett kernel) 0.000758
Phillips-Perron Test Equation
Dependent Variable: D(LREXR,2)
Method: Least Squares
Date: 07/23/14 Time: 16:51
Sample (adjusted): 11/01/1999 11/01/2013
Included observations: 57 after adjustments Variable Coefficient Std. Error t-Statistic Prob. D(LREXR(-1)) -0.956712 0.137828 -6.941364 0.0000
C 0.003984 0.006336 0.628773 0.5321 R-squared 0.466964 Mean dependent var 0.001629
Adjusted R-squared 0.457273 S.D. dependent var 0.064841
S.E. of regression 0.047768 Akaike info criterion -3.210462
Sum squared resid 0.125498 Schwarz criterion -3.138776
Log likelihood 93.49816 Hannan-Quinn criter. -3.182602
F-statistic 48.18254 Durbin-Watson stat 1.896435
Prob(F-statistic) 0.000000

The Nexus Between FDI, Trade Openness, Real Exchange Rate and Infrastructure Quality in India
Undergraduate Research Project Page 79 of 96 Faculty of Business and Finance
PP Test at Level Form with Trend and Intercept
Null Hypothesis: LREXR has a unit root
Exogenous: Constant, Linear Trend
Bandwidth: 4 (Newey-West automatic) using Bartlett kernel Adj. t-Stat Prob.* Phillips-Perron test statistic -2.794157 0.2053
Test critical values: 1% level -4.124265
5% level -3.489228
10% level -3.173114 *MacKinnon (1996) one-sided p-values.
Residual variance (no correction) 0.001924
HAC corrected variance (Bartlett kernel) 0.002142
Phillips-Perron Test Equation
Dependent Variable: D(LREXR)
Method: Least Squares
Date: 07/23/14 Time: 16:53
Sample (adjusted): 8/01/1999 11/01/2013
Included observations: 58 after adjustments Variable Coefficient Std. Error t-Statistic Prob. LREXR(-1) -0.236261 0.088679 -2.664223 0.0101
C 0.969628 0.362267 2.676553 0.0098
@TREND(5/01/1999) 0.001591 0.000707 2.250260 0.0285 R-squared 0.114493 Mean dependent var 0.003796
Adjusted R-squared 0.082293 S.D. dependent var 0.047018
S.E. of regression 0.045042 Akaike info criterion -3.312110
Sum squared resid 0.111582 Schwarz criterion -3.205535
Log likelihood 99.05119 Hannan-Quinn criter. -3.270597
F-statistic 3.555656 Durbin-Watson stat 1.683660
Prob(F-statistic) 0.035300

The Nexus Between FDI, Trade Openness, Real Exchange Rate and Infrastructure Quality in India
Undergraduate Research Project Page 80 of 96 Faculty of Business and Finance
PP Test at First Difference with Trend and Intercept
Null Hypothesis: D(LREXR) has a unit root
Exogenous: Constant, Linear Trend
Bandwidth: 14 (Newey-West automatic) using Bartlett kernel Adj. t-Stat Prob.* Phillips-Perron test statistic -7.411896 0.0000
Test critical values: 1% level -4.127338
5% level -3.490662
10% level -3.173943 *MacKinnon (1996) one-sided p-values.
Residual variance (no correction) 0.002201
HAC corrected variance (Bartlett kernel) 0.000750
Phillips-Perron Test Equation
Dependent Variable: D(LREXR,2)
Method: Least Squares
Date: 07/23/14 Time: 16:55
Sample (adjusted): 11/01/1999 11/01/2013
Included observations: 57 after adjustments Variable Coefficient Std. Error t-Statistic Prob. D(LREXR(-1)) -0.958302 0.139370 -6.875963 0.0000
C 0.005985 0.013323 0.449241 0.6551
@TREND(5/01/1999) -6.66E-05 0.000389 -0.171210 0.8647 R-squared 0.467253 Mean dependent var 0.001629
Adjusted R-squared 0.447522 S.D. dependent var 0.064841
S.E. of regression 0.048195 Akaike info criterion -3.175917
Sum squared resid 0.125430 Schwarz criterion -3.068388
Log likelihood 93.51362 Hannan-Quinn criter. -3.134127
F-statistic 23.68074 Durbin-Watson stat 1.895321
Prob(F-statistic) 0.000000

The Nexus Between FDI, Trade Openness, Real Exchange Rate and Infrastructure Quality in India
Undergraduate Research Project Page 81 of 96 Faculty of Business and Finance
Appendix 4: Unit Root Test on Trade Openness
ADF Test at Level Form with Intercept
Null Hypothesis: LTO has a unit root
Exogenous: Constant
Lag Length: 0 (Automatic - based on SIC, maxlag=10) t-Statistic Prob.* Augmented Dickey-Fuller test statistic -1.173054 0.6803
Test critical values: 1% level -3.548208
5% level -2.912631
10% level -2.594027 *MacKinnon (1996) one-sided p-values.
Augmented Dickey-Fuller Test Equation
Dependent Variable: D(LTO)
Method: Least Squares
Date: 07/23/14 Time: 16:57
Sample (adjusted): 8/01/1999 11/01/2013
Included observations: 58 after adjustments Variable Coefficient Std. Error t-Statistic Prob. LTO(-1) -0.014590 0.012437 -1.173054 0.2457
C 0.305993 0.228003 1.342055 0.1850 R-squared 0.023983 Mean dependent var 0.038784
Adjusted R-squared 0.006554 S.D. dependent var 0.075560
S.E. of regression 0.075312 Akaike info criterion -2.300490
Sum squared resid 0.317623 Schwarz criterion -2.229440
Log likelihood 68.71421 Hannan-Quinn criter. -2.272815
F-statistic 1.376056 Durbin-Watson stat 1.815282
Prob(F-statistic) 0.245740
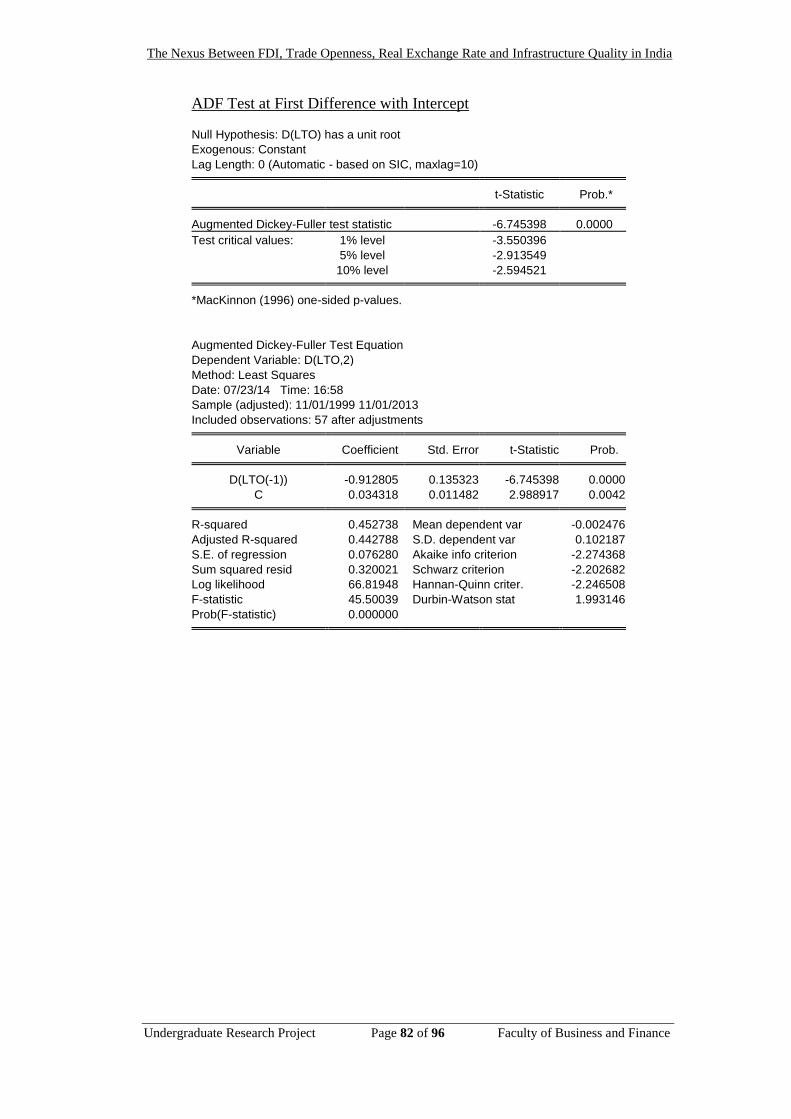
The Nexus Between FDI, Trade Openness, Real Exchange Rate and Infrastructure Quality in India
Undergraduate Research Project Page 82 of 96 Faculty of Business and Finance
ADF Test at First Difference with Intercept
Null Hypothesis: D(LTO) has a unit root
Exogenous: Constant
Lag Length: 0 (Automatic - based on SIC, maxlag=10) t-Statistic Prob.* Augmented Dickey-Fuller test statistic -6.745398 0.0000
Test critical values: 1% level -3.550396
5% level -2.913549
10% level -2.594521 *MacKinnon (1996) one-sided p-values.
Augmented Dickey-Fuller Test Equation
Dependent Variable: D(LTO,2)
Method: Least Squares
Date: 07/23/14 Time: 16:58
Sample (adjusted): 11/01/1999 11/01/2013
Included observations: 57 after adjustments Variable Coefficient Std. Error t-Statistic Prob. D(LTO(-1)) -0.912805 0.135323 -6.745398 0.0000
C 0.034318 0.011482 2.988917 0.0042 R-squared 0.452738 Mean dependent var -0.002476
Adjusted R-squared 0.442788 S.D. dependent var 0.102187
S.E. of regression 0.076280 Akaike info criterion -2.274368
Sum squared resid 0.320021 Schwarz criterion -2.202682
Log likelihood 66.81948 Hannan-Quinn criter. -2.246508
F-statistic 45.50039 Durbin-Watson stat 1.993146
Prob(F-statistic) 0.000000

The Nexus Between FDI, Trade Openness, Real Exchange Rate and Infrastructure Quality in India
Undergraduate Research Project Page 83 of 96 Faculty of Business and Finance
ADF Test at Level Form with Trend and Intercept
Null Hypothesis: LTO has a unit root
Exogenous: Constant, Linear Trend
Lag Length: 0 (Automatic - based on SIC, maxlag=10) t-Statistic Prob.* Augmented Dickey-Fuller test statistic -1.040410 0.9298
Test critical values: 1% level -4.124265
5% level -3.489228
10% level -3.173114 *MacKinnon (1996) one-sided p-values.
Augmented Dickey-Fuller Test Equation
Dependent Variable: D(LTO)
Method: Least Squares
Date: 07/23/14 Time: 16:59
Sample (adjusted): 8/01/1999 11/01/2013
Included observations: 58 after adjustments Variable Coefficient Std. Error t-Statistic Prob. LTO(-1) -0.071132 0.068369 -1.040410 0.3027
C 1.260984 1.158161 1.088781 0.2810
@TREND(5/01/1999) 0.002731 0.003247 0.841123 0.4039 R-squared 0.036379 Mean dependent var 0.038784
Adjusted R-squared 0.001338 S.D. dependent var 0.075560
S.E. of regression 0.075509 Akaike info criterion -2.278789
Sum squared resid 0.313589 Schwarz criterion -2.172214
Log likelihood 69.08487 Hannan-Quinn criter. -2.237276
F-statistic 1.038178 Durbin-Watson stat 1.739299
Prob(F-statistic) 0.360934

The Nexus Between FDI, Trade Openness, Real Exchange Rate and Infrastructure Quality in India
Undergraduate Research Project Page 84 of 96 Faculty of Business and Finance
ADF Test at First Difference with Trend and Intercept
Null Hypothesis: D(LTO) has a unit root
Exogenous: Constant, Linear Trend
Lag Length: 0 (Automatic - based on SIC, maxlag=10) t-Statistic Prob.* Augmented Dickey-Fuller test statistic -6.766377 0.0000
Test critical values: 1% level -4.127338
5% level -3.490662
10% level -3.173943 *MacKinnon (1996) one-sided p-values.
Augmented Dickey-Fuller Test Equation
Dependent Variable: D(LTO,2)
Method: Least Squares
Date: 07/23/14 Time: 17:00
Sample (adjusted): 11/01/1999 11/01/2013
Included observations: 57 after adjustments Variable Coefficient Std. Error t-Statistic Prob. D(LTO(-1)) -0.923610 0.136500 -6.766377 0.0000
C 0.049308 0.022341 2.207082 0.0316
@TREND(5/01/1999) -0.000485 0.000619 -0.783143 0.4370 R-squared 0.458884 Mean dependent var -0.002476
Adjusted R-squared 0.438843 S.D. dependent var 0.102187
S.E. of regression 0.076549 Akaike info criterion -2.250573
Sum squared resid 0.316427 Schwarz criterion -2.143044
Log likelihood 67.14134 Hannan-Quinn criter. -2.208784
F-statistic 22.89690 Durbin-Watson stat 1.991908
Prob(F-statistic) 0.000000

The Nexus Between FDI, Trade Openness, Real Exchange Rate and Infrastructure Quality in India
Undergraduate Research Project Page 85 of 96 Faculty of Business and Finance
PP Test at Level Form with Intercept
Null Hypothesis: LTO has a unit root
Exogenous: Constant
Bandwidth: 4 (Newey-West automatic) using Bartlett kernel Adj. t-Stat Prob.* Phillips-Perron test statistic -1.150415 0.6898
Test critical values: 1% level -3.548208
5% level -2.912631
10% level -2.594027 *MacKinnon (1996) one-sided p-values.
Residual variance (no correction) 0.005476
HAC corrected variance (Bartlett kernel) 0.006079
Phillips-Perron Test Equation
Dependent Variable: D(LTO)
Method: Least Squares
Date: 07/23/14 Time: 17:01
Sample (adjusted): 8/01/1999 11/01/2013
Included observations: 58 after adjustments Variable Coefficient Std. Error t-Statistic Prob. LTO(-1) -0.014590 0.012437 -1.173054 0.2457
C 0.305993 0.228003 1.342055 0.1850 R-squared 0.023983 Mean dependent var 0.038784
Adjusted R-squared 0.006554 S.D. dependent var 0.075560
S.E. of regression 0.075312 Akaike info criterion -2.300490
Sum squared resid 0.317623 Schwarz criterion -2.229440
Log likelihood 68.71421 Hannan-Quinn criter. -2.272815
F-statistic 1.376056 Durbin-Watson stat 1.815282
Prob(F-statistic) 0.245740
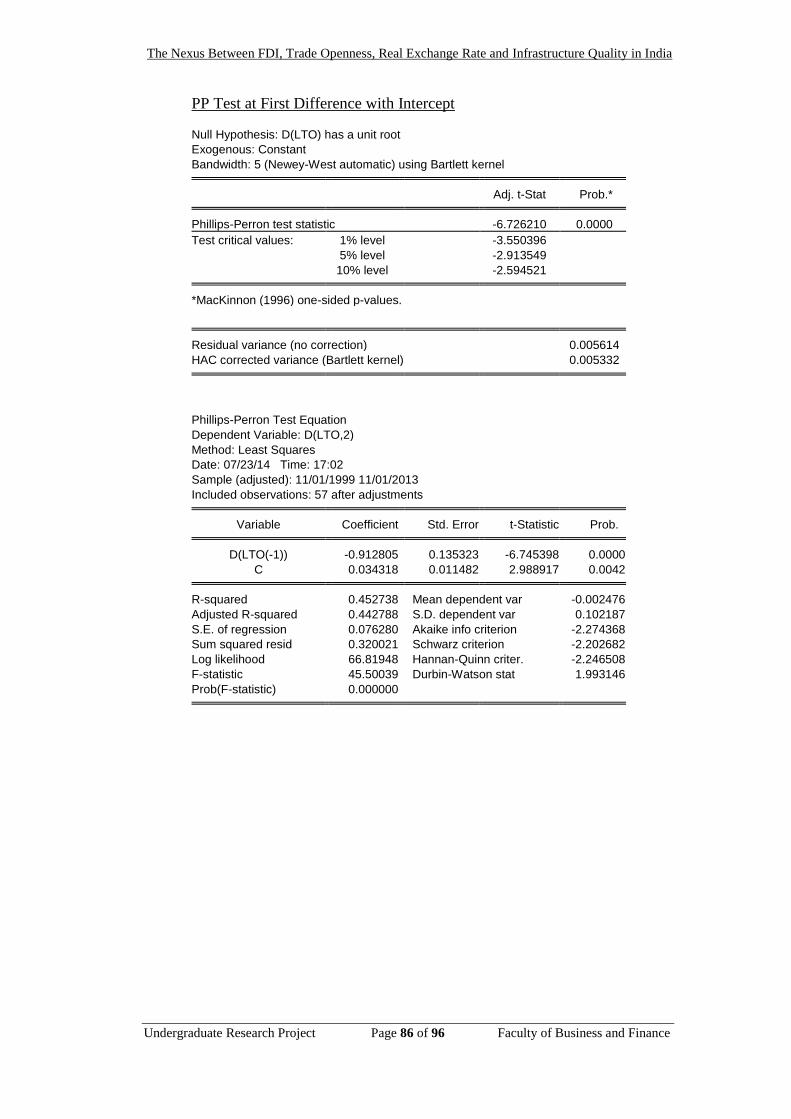
The Nexus Between FDI, Trade Openness, Real Exchange Rate and Infrastructure Quality in India
Undergraduate Research Project Page 86 of 96 Faculty of Business and Finance
PP Test at First Difference with Intercept
Null Hypothesis: D(LTO) has a unit root
Exogenous: Constant
Bandwidth: 5 (Newey-West automatic) using Bartlett kernel Adj. t-Stat Prob.* Phillips-Perron test statistic -6.726210 0.0000
Test critical values: 1% level -3.550396
5% level -2.913549
10% level -2.594521 *MacKinnon (1996) one-sided p-values.
Residual variance (no correction) 0.005614
HAC corrected variance (Bartlett kernel) 0.005332
Phillips-Perron Test Equation
Dependent Variable: D(LTO,2)
Method: Least Squares
Date: 07/23/14 Time: 17:02
Sample (adjusted): 11/01/1999 11/01/2013
Included observations: 57 after adjustments Variable Coefficient Std. Error t-Statistic Prob. D(LTO(-1)) -0.912805 0.135323 -6.745398 0.0000
C 0.034318 0.011482 2.988917 0.0042 R-squared 0.452738 Mean dependent var -0.002476
Adjusted R-squared 0.442788 S.D. dependent var 0.102187
S.E. of regression 0.076280 Akaike info criterion -2.274368
Sum squared resid 0.320021 Schwarz criterion -2.202682
Log likelihood 66.81948 Hannan-Quinn criter. -2.246508
F-statistic 45.50039 Durbin-Watson stat 1.993146
Prob(F-statistic) 0.000000
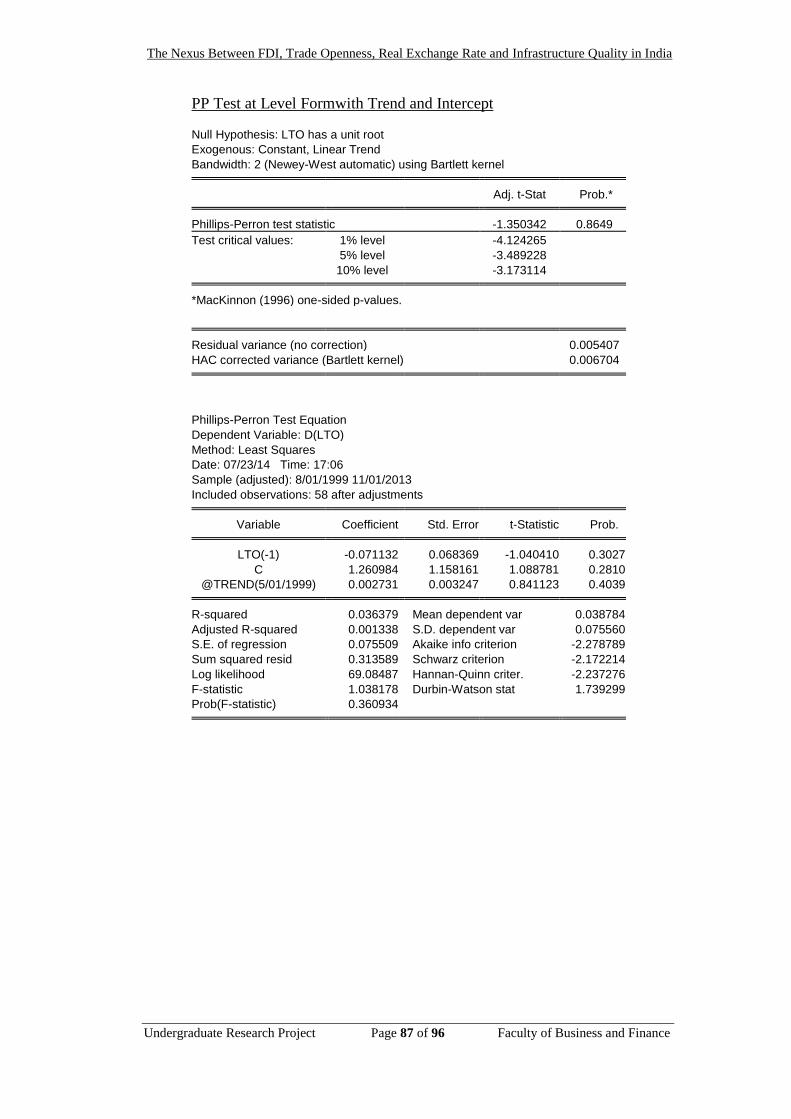
The Nexus Between FDI, Trade Openness, Real Exchange Rate and Infrastructure Quality in India
Undergraduate Research Project Page 87 of 96 Faculty of Business and Finance
PP Test at Level Formwith Trend and Intercept
Null Hypothesis: LTO has a unit root
Exogenous: Constant, Linear Trend
Bandwidth: 2 (Newey-West automatic) using Bartlett kernel Adj. t-Stat Prob.* Phillips-Perron test statistic -1.350342 0.8649
Test critical values: 1% level -4.124265
5% level -3.489228
10% level -3.173114 *MacKinnon (1996) one-sided p-values.
Residual variance (no correction) 0.005407
HAC corrected variance (Bartlett kernel) 0.006704
Phillips-Perron Test Equation
Dependent Variable: D(LTO)
Method: Least Squares
Date: 07/23/14 Time: 17:06
Sample (adjusted): 8/01/1999 11/01/2013
Included observations: 58 after adjustments Variable Coefficient Std. Error t-Statistic Prob. LTO(-1) -0.071132 0.068369 -1.040410 0.3027
C 1.260984 1.158161 1.088781 0.2810
@TREND(5/01/1999) 0.002731 0.003247 0.841123 0.4039 R-squared 0.036379 Mean dependent var 0.038784
Adjusted R-squared 0.001338 S.D. dependent var 0.075560
S.E. of regression 0.075509 Akaike info criterion -2.278789
Sum squared resid 0.313589 Schwarz criterion -2.172214
Log likelihood 69.08487 Hannan-Quinn criter. -2.237276
F-statistic 1.038178 Durbin-Watson stat 1.739299
Prob(F-statistic) 0.360934

The Nexus Between FDI, Trade Openness, Real Exchange Rate and Infrastructure Quality in India
Undergraduate Research Project Page 88 of 96 Faculty of Business and Finance
PP Test at First Difference with Trend and Intercept
Null Hypothesis: D(LTO) has a unit root
Exogenous: Constant, Linear Trend
Bandwidth: 5 (Newey-West automatic) using Bartlett kernel Adj. t-Stat Prob.* Phillips-Perron test statistic -6.743186 0.0000
Test critical values: 1% level -4.127338
5% level -3.490662
10% level -3.173943 *MacKinnon (1996) one-sided p-values.
Residual variance (no correction) 0.005551
HAC corrected variance (Bartlett kernel) 0.005192
Phillips-Perron Test Equation
Dependent Variable: D(LTO,2)
Method: Least Squares
Date: 07/23/14 Time: 17:07
Sample (adjusted): 11/01/1999 11/01/2013
Included observations: 57 after adjustments Variable Coefficient Std. Error t-Statistic Prob. D(LTO(-1)) -0.923610 0.136500 -6.766377 0.0000
C 0.049308 0.022341 2.207082 0.0316
@TREND(5/01/1999) -0.000485 0.000619 -0.783143 0.4370 R-squared 0.458884 Mean dependent var -0.002476
Adjusted R-squared 0.438843 S.D. dependent var 0.102187
S.E. of regression 0.076549 Akaike info criterion -2.250573
Sum squared resid 0.316427 Schwarz criterion -2.143044
Log likelihood 67.14134 Hannan-Quinn criter. -2.208784
F-statistic 22.89690 Durbin-Watson stat 1.991908
Prob(F-statistic) 0.000000
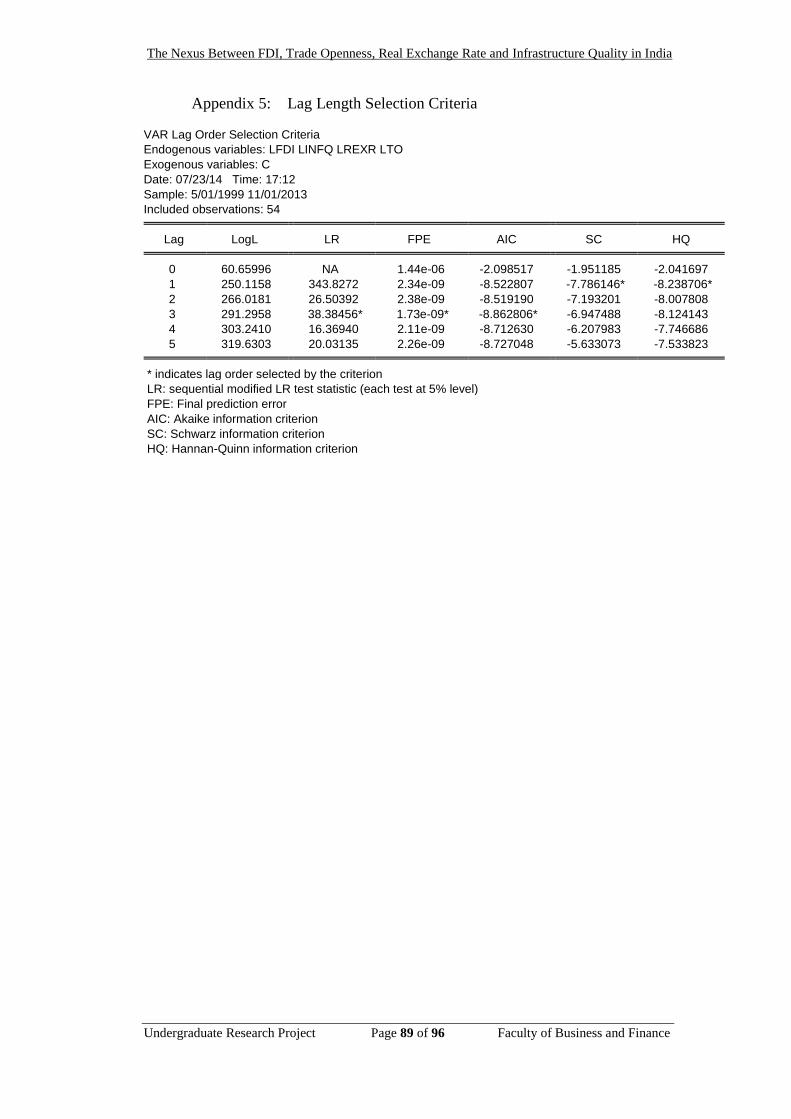
The Nexus Between FDI, Trade Openness, Real Exchange Rate and Infrastructure Quality in India
Undergraduate Research Project Page 89 of 96 Faculty of Business and Finance
Appendix 5: Lag Length Selection Criteria
VAR Lag Order Selection Criteria
Endogenous variables: LFDI LINFQ LREXR LTO
Exogenous variables: C
Date: 07/23/14 Time: 17:12
Sample: 5/01/1999 11/01/2013
Included observations: 54 Lag LogL LR FPE AIC SC HQ 0 60.65996 NA 1.44e-06 -2.098517 -1.951185 -2.041697
1 250.1158 343.8272 2.34e-09 -8.522807 -7.786146* -8.238706*
2 266.0181 26.50392 2.38e-09 -8.519190 -7.193201 -8.007808
3 291.2958 38.38456* 1.73e-09* -8.862806* -6.947488 -8.124143
4 303.2410 16.36940 2.11e-09 -8.712630 -6.207983 -7.746686
5 319.6303 20.03135 2.26e-09 -8.727048 -5.633073 -7.533823 * indicates lag order selected by the criterion
LR: sequential modified LR test statistic (each test at 5% level)
FPE: Final prediction error
AIC: Akaike information criterion
SC: Schwarz information criterion
HQ: Hannan-Quinn information criterion
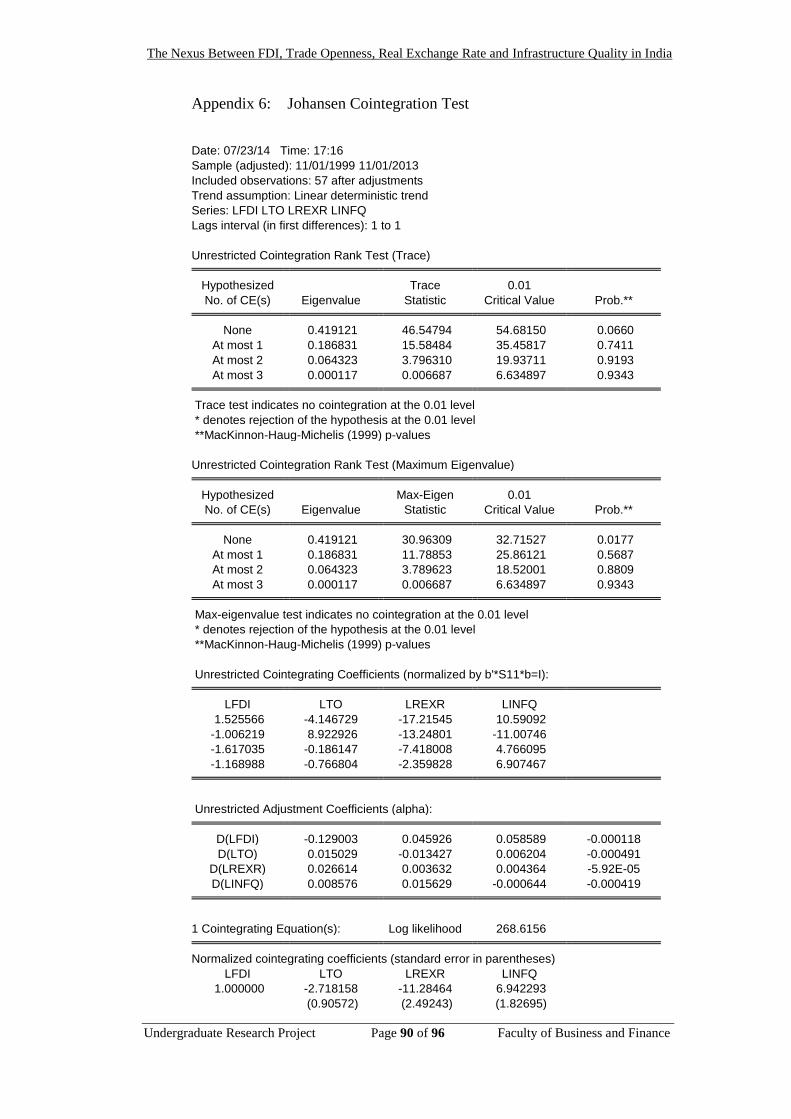
The Nexus Between FDI, Trade Openness, Real Exchange Rate and Infrastructure Quality in India
Undergraduate Research Project Page 90 of 96 Faculty of Business and Finance
Appendix 6: Johansen Cointegration Test
Date: 07/23/14 Time: 17:16
Sample (adjusted): 11/01/1999 11/01/2013
Included observations: 57 after adjustments
Trend assumption: Linear deterministic trend
Series: LFDI LTO LREXR LINFQ
Lags interval (in first differences): 1 to 1
Unrestricted Cointegration Rank Test (Trace) Hypothesized Trace 0.01
No. of CE(s) Eigenvalue Statistic Critical Value Prob.** None 0.419121 46.54794 54.68150 0.0660
At most 1 0.186831 15.58484 35.45817 0.7411
At most 2 0.064323 3.796310 19.93711 0.9193
At most 3 0.000117 0.006687 6.634897 0.9343 Trace test indicates no cointegration at the 0.01 level
* denotes rejection of the hypothesis at the 0.01 level
**MacKinnon-Haug-Michelis (1999) p-values
Unrestricted Cointegration Rank Test (Maximum Eigenvalue) Hypothesized Max-Eigen 0.01
No. of CE(s) Eigenvalue Statistic Critical Value Prob.** None 0.419121 30.96309 32.71527 0.0177
At most 1 0.186831 11.78853 25.86121 0.5687
At most 2 0.064323 3.789623 18.52001 0.8809
At most 3 0.000117 0.006687 6.634897 0.9343 Max-eigenvalue test indicates no cointegration at the 0.01 level
* denotes rejection of the hypothesis at the 0.01 level
**MacKinnon-Haug-Michelis (1999) p-values
Unrestricted Cointegrating Coefficients (normalized by b'*S11*b=I): LFDI LTO LREXR LINFQ
1.525566 -4.146729 -17.21545 10.59092
-1.006219 8.922926 -13.24801 -11.00746
-1.617035 -0.186147 -7.418008 4.766095
-1.168988 -0.766804 -2.359828 6.907467
Unrestricted Adjustment Coefficients (alpha): D(LFDI) -0.129003 0.045926 0.058589 -0.000118
D(LTO) 0.015029 -0.013427 0.006204 -0.000491
D(LREXR) 0.026614 0.003632 0.004364 -5.92E-05
D(LINFQ) 0.008576 0.015629 -0.000644 -0.000419
1 Cointegrating Equation(s): Log likelihood 268.6156 Normalized cointegrating coefficients (standard error in parentheses)
LFDI LTO LREXR LINFQ
1.000000 -2.718158 -11.28464 6.942293
(0.90572) (2.49243) (1.82695)
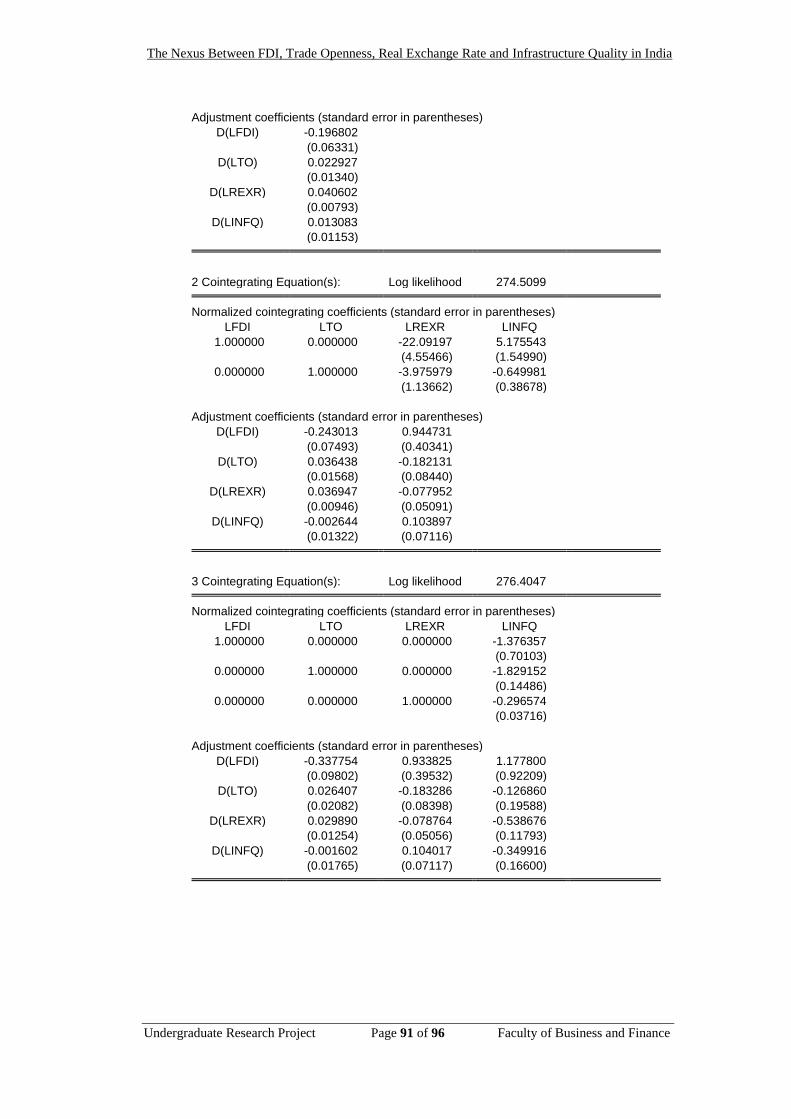
The Nexus Between FDI, Trade Openness, Real Exchange Rate and Infrastructure Quality in India
Undergraduate Research Project Page 91 of 96 Faculty of Business and Finance
Adjustment coefficients (standard error in parentheses)
D(LFDI) -0.196802
(0.06331)
D(LTO) 0.022927
(0.01340)
D(LREXR) 0.040602
(0.00793)
D(LINFQ) 0.013083
(0.01153)
2 Cointegrating Equation(s): Log likelihood 274.5099 Normalized cointegrating coefficients (standard error in parentheses)
LFDI LTO LREXR LINFQ
1.000000 0.000000 -22.09197 5.175543
(4.55466) (1.54990)
0.000000 1.000000 -3.975979 -0.649981
(1.13662) (0.38678)
Adjustment coefficients (standard error in parentheses)
D(LFDI) -0.243013 0.944731
(0.07493) (0.40341)
D(LTO) 0.036438 -0.182131
(0.01568) (0.08440)
D(LREXR) 0.036947 -0.077952
(0.00946) (0.05091)
D(LINFQ) -0.002644 0.103897
(0.01322) (0.07116)
3 Cointegrating Equation(s): Log likelihood 276.4047 Normalized cointegrating coefficients (standard error in parentheses)
LFDI LTO LREXR LINFQ
1.000000 0.000000 0.000000 -1.376357
(0.70103)
0.000000 1.000000 0.000000 -1.829152
(0.14486)
0.000000 0.000000 1.000000 -0.296574
(0.03716)
Adjustment coefficients (standard error in parentheses)
D(LFDI) -0.337754 0.933825 1.177800
(0.09802) (0.39532) (0.92209)
D(LTO) 0.026407 -0.183286 -0.126860
(0.02082) (0.08398) (0.19588)
D(LREXR) 0.029890 -0.078764 -0.538676
(0.01254) (0.05056) (0.11793)
D(LINFQ) -0.001602 0.104017 -0.349916
(0.01765) (0.07117) (0.16600)
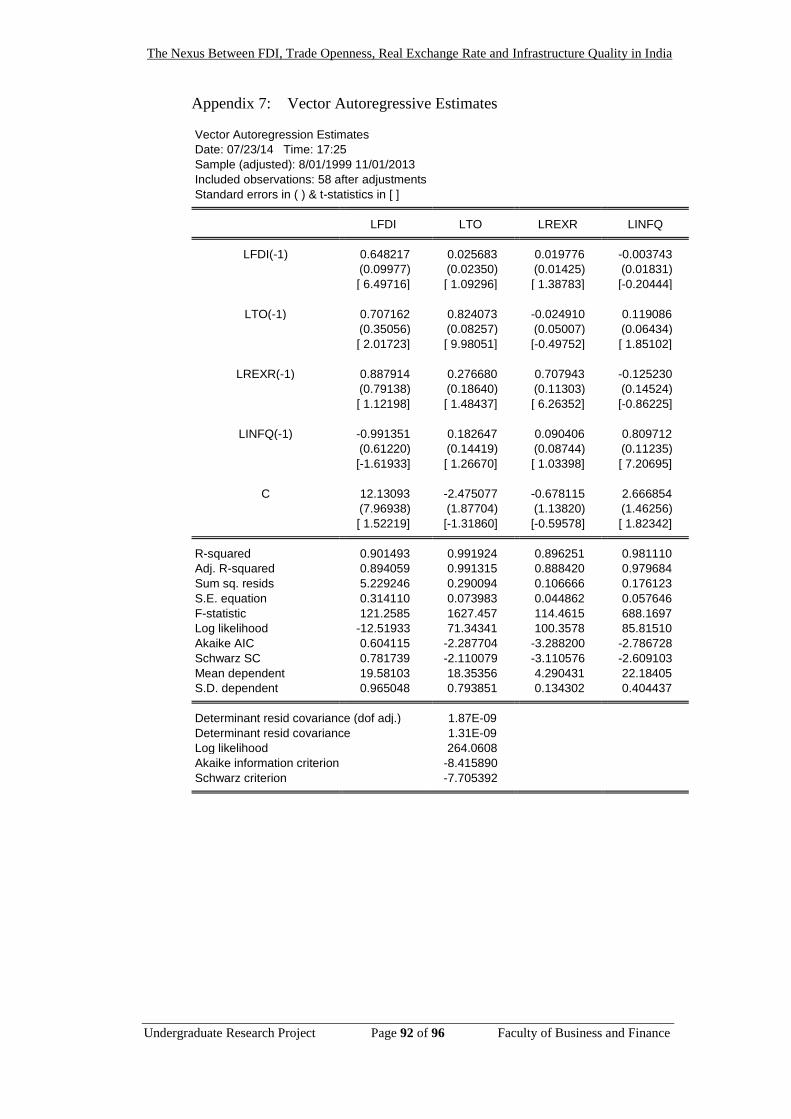
The Nexus Between FDI, Trade Openness, Real Exchange Rate and Infrastructure Quality in India
Undergraduate Research Project Page 92 of 96 Faculty of Business and Finance
Appendix 7: Vector Autoregressive Estimates
Vector Autoregression Estimates
Date: 07/23/14 Time: 17:25
Sample (adjusted): 8/01/1999 11/01/2013
Included observations: 58 after adjustments
Standard errors in ( ) & t-statistics in [ ] LFDI LTO LREXR LINFQ LFDI(-1) 0.648217 0.025683 0.019776 -0.003743
(0.09977) (0.02350) (0.01425) (0.01831)
[ 6.49716] [ 1.09296] [ 1.38783] [-0.20444]
LTO(-1) 0.707162 0.824073 -0.024910 0.119086
(0.35056) (0.08257) (0.05007) (0.06434)
[ 2.01723] [ 9.98051] [-0.49752] [ 1.85102]
LREXR(-1) 0.887914 0.276680 0.707943 -0.125230
(0.79138) (0.18640) (0.11303) (0.14524)
[ 1.12198] [ 1.48437] [ 6.26352] [-0.86225]
LINFQ(-1) -0.991351 0.182647 0.090406 0.809712
(0.61220) (0.14419) (0.08744) (0.11235)
[-1.61933] [ 1.26670] [ 1.03398] [ 7.20695]
C 12.13093 -2.475077 -0.678115 2.666854
(7.96938) (1.87704) (1.13820) (1.46256)
[ 1.52219] [-1.31860] [-0.59578] [ 1.82342] R-squared 0.901493 0.991924 0.896251 0.981110
Adj. R-squared 0.894059 0.991315 0.888420 0.979684
Sum sq. resids 5.229246 0.290094 0.106666 0.176123
S.E. equation 0.314110 0.073983 0.044862 0.057646
F-statistic 121.2585 1627.457 114.4615 688.1697
Log likelihood -12.51933 71.34341 100.3578 85.81510
Akaike AIC 0.604115 -2.287704 -3.288200 -2.786728
Schwarz SC 0.781739 -2.110079 -3.110576 -2.609103
Mean dependent 19.58103 18.35356 4.290431 22.18405
S.D. dependent 0.965048 0.793851 0.134302 0.404437 Determinant resid covariance (dof adj.) 1.87E-09
Determinant resid covariance 1.31E-09
Log likelihood 264.0608
Akaike information criterion -8.415890
Schwarz criterion -7.705392
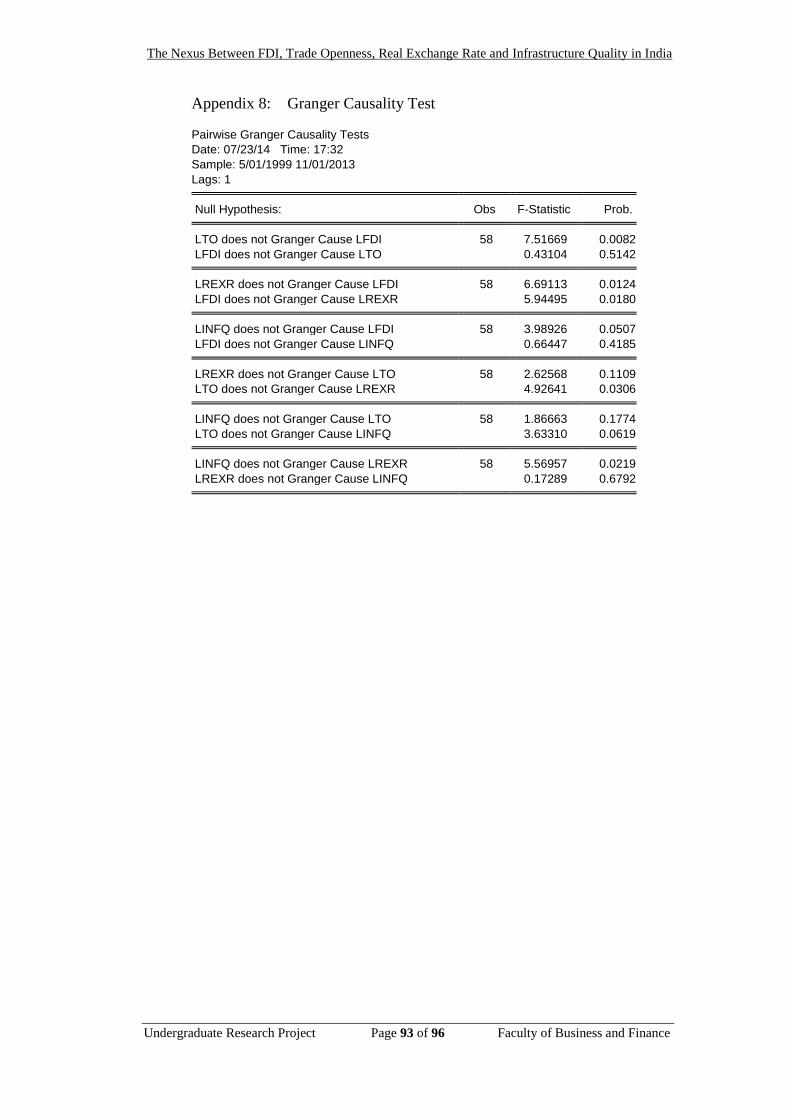
The Nexus Between FDI, Trade Openness, Real Exchange Rate and Infrastructure Quality in India
Undergraduate Research Project Page 93 of 96 Faculty of Business and Finance
Appendix 8: Granger Causality Test
Pairwise Granger Causality Tests
Date: 07/23/14 Time: 17:32
Sample: 5/01/1999 11/01/2013
Lags: 1 Null Hypothesis: Obs F-Statistic Prob. LTO does not Granger Cause LFDI 58 7.51669 0.0082
LFDI does not Granger Cause LTO 0.43104 0.5142 LREXR does not Granger Cause LFDI 58 6.69113 0.0124
LFDI does not Granger Cause LREXR 5.94495 0.0180 LINFQ does not Granger Cause LFDI 58 3.98926 0.0507
LFDI does not Granger Cause LINFQ 0.66447 0.4185 LREXR does not Granger Cause LTO 58 2.62568 0.1109
LTO does not Granger Cause LREXR 4.92641 0.0306 LINFQ does not Granger Cause LTO 58 1.86663 0.1774
LTO does not Granger Cause LINFQ 3.63310 0.0619 LINFQ does not Granger Cause LREXR 58 5.56957 0.0219
LREXR does not Granger Cause LINFQ 0.17289 0.6792
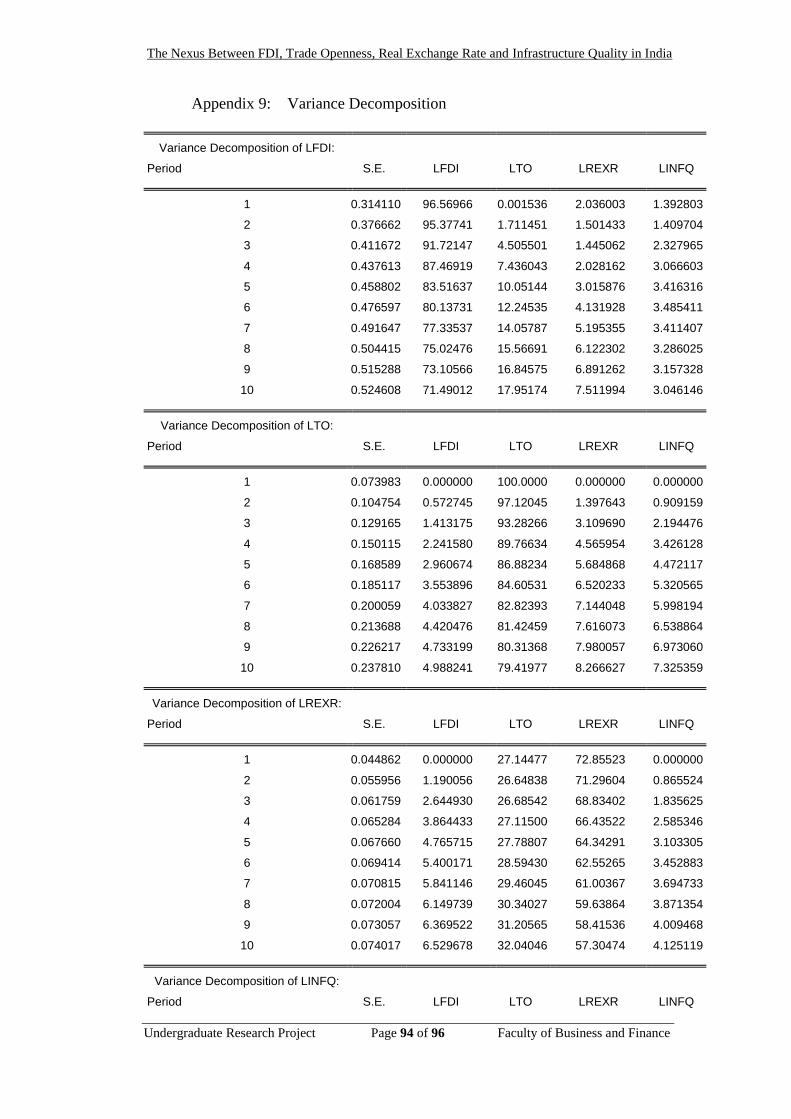
The Nexus Between FDI, Trade Openness, Real Exchange Rate and Infrastructure Quality in India
Undergraduate Research Project Page 94 of 96 Faculty of Business and Finance
Appendix 9: Variance Decomposition
Variance Decomposition of LFDI:
Period S.E. LFDI LTO LREXR LINFQ
1 0.314110 96.56966 0.001536 2.036003 1.392803
2 0.376662 95.37741 1.711451 1.501433 1.409704
3 0.411672 91.72147 4.505501 1.445062 2.327965
4 0.437613 87.46919 7.436043 2.028162 3.066603
5 0.458802 83.51637 10.05144 3.015876 3.416316
6 0.476597 80.13731 12.24535 4.131928 3.485411
7 0.491647 77.33537 14.05787 5.195355 3.411407
8 0.504415 75.02476 15.56691 6.122302 3.286025
9 0.515288 73.10566 16.84575 6.891262 3.157328
10 0.524608 71.49012 17.95174 7.511994 3.046146
Variance Decomposition of LTO:
Period S.E. LFDI LTO LREXR LINFQ
1 0.073983 0.000000 100.0000 0.000000 0.000000
2 0.104754 0.572745 97.12045 1.397643 0.909159
3 0.129165 1.413175 93.28266 3.109690 2.194476
4 0.150115 2.241580 89.76634 4.565954 3.426128
5 0.168589 2.960674 86.88234 5.684868 4.472117
6 0.185117 3.553896 84.60531 6.520233 5.320565
7 0.200059 4.033827 82.82393 7.144048 5.998194
8 0.213688 4.420476 81.42459 7.616073 6.538864
9 0.226217 4.733199 80.31368 7.980057 6.973060
10 0.237810 4.988241 79.41977 8.266627 7.325359
Variance Decomposition of LREXR:
Period S.E. LFDI LTO LREXR LINFQ
1 0.044862 0.000000 27.14477 72.85523 0.000000
2 0.055956 1.190056 26.64838 71.29604 0.865524
3 0.061759 2.644930 26.68542 68.83402 1.835625
4 0.065284 3.864433 27.11500 66.43522 2.585346
5 0.067660 4.765715 27.78807 64.34291 3.103305
6 0.069414 5.400171 28.59430 62.55265 3.452883
7 0.070815 5.841146 29.46045 61.00367 3.694733
8 0.072004 6.149739 30.34027 59.63864 3.871354
9 0.073057 6.369522 31.20565 58.41536 4.009468
10 0.074017 6.529678 32.04046 57.30474 4.125119
Variance Decomposition of LINFQ:
Period S.E. LFDI LTO LREXR LINFQ
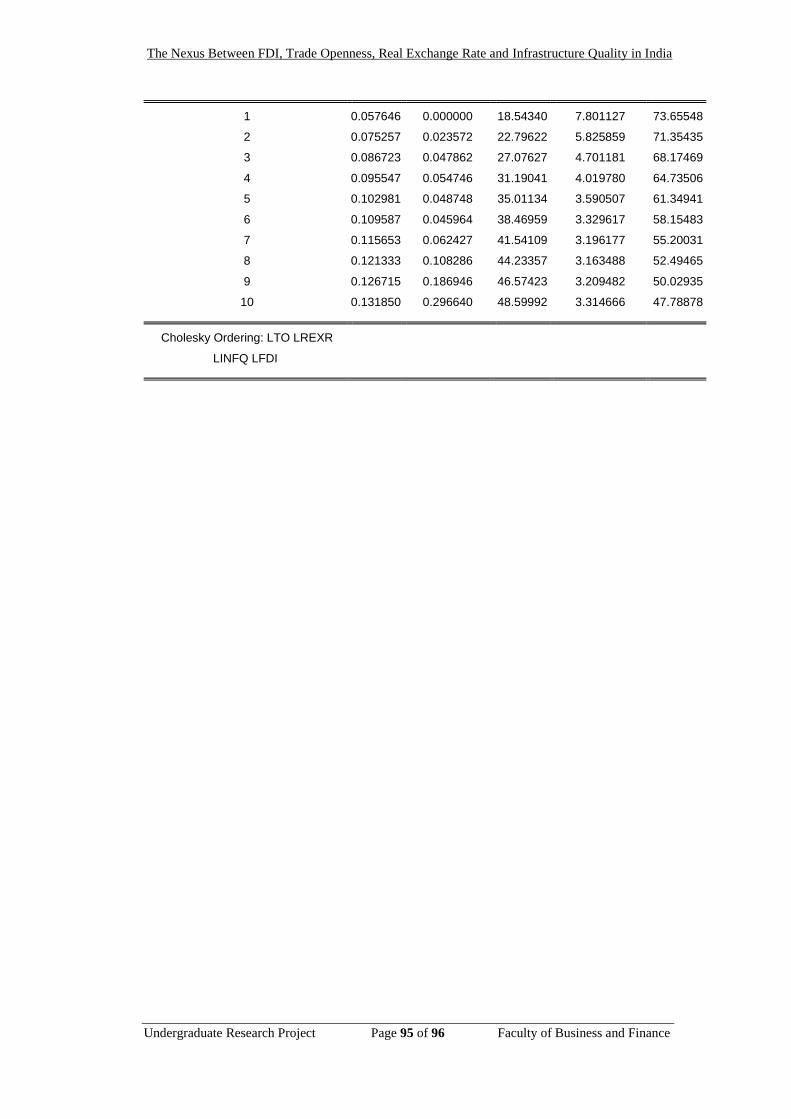
The Nexus Between FDI, Trade Openness, Real Exchange Rate and Infrastructure Quality in India
Undergraduate Research Project Page 95 of 96 Faculty of Business and Finance
1 0.057646 0.000000 18.54340 7.801127 73.65548
2 0.075257 0.023572 22.79622 5.825859 71.35435
3 0.086723 0.047862 27.07627 4.701181 68.17469
4 0.095547 0.054746 31.19041 4.019780 64.73506
5 0.102981 0.048748 35.01134 3.590507 61.34941
6 0.109587 0.045964 38.46959 3.329617 58.15483
7 0.115653 0.062427 41.54109 3.196177 55.20031
8 0.121333 0.108286 44.23357 3.163488 52.49465
9 0.126715 0.186946 46.57423 3.209482 50.02935
10 0.131850 0.296640 48.59992 3.314666 47.78878
Cholesky Ordering: LTO LREXR
LINFQ LFDI
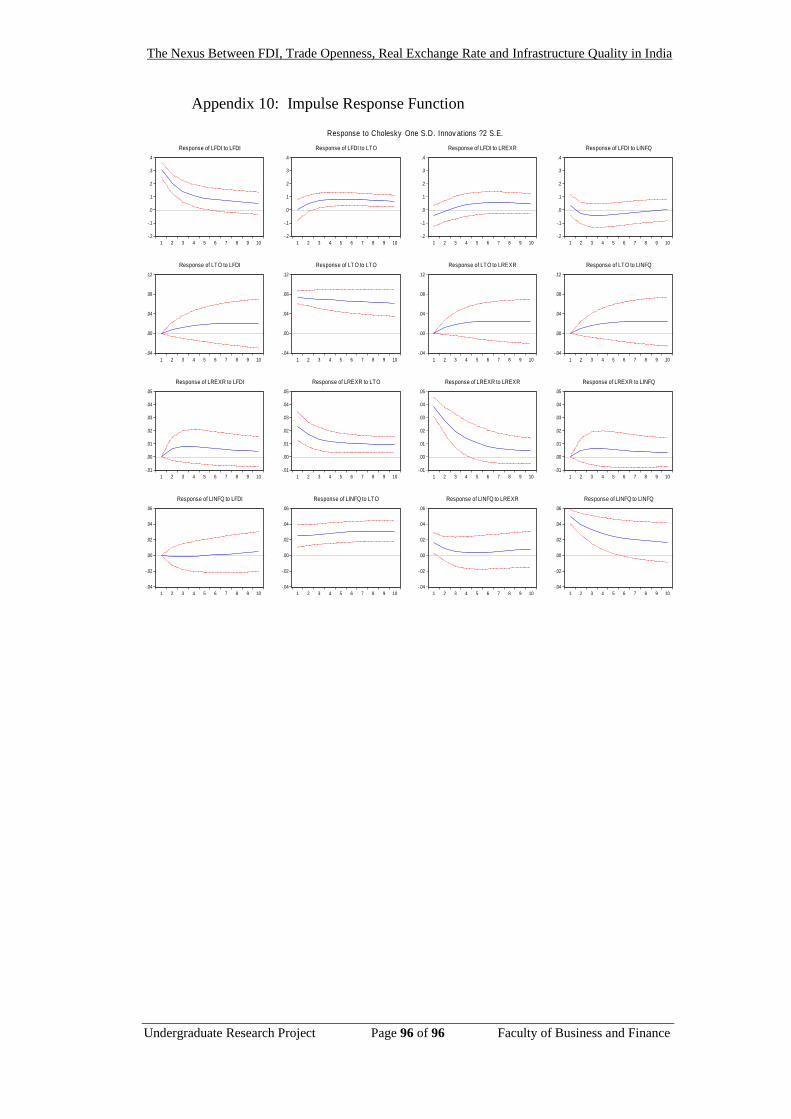
The Nexus Between FDI, Trade Openness, Real Exchange Rate and Infrastructure Quality in India
Undergraduate Research Project Page 96 of 96 Faculty of Business and Finance
Appendix 10: Impulse Response Function
-.2
-.1
.0
.1
.2
.3
.4
1 2 3 4 5 6 7 8 9 10
Response of LFDI to LFDI
-.2
-.1
.0
.1
.2
.3
.4
1 2 3 4 5 6 7 8 9 10
Response of LFDI to LTO
-.2
-.1
.0
.1
.2
.3
.4
1 2 3 4 5 6 7 8 9 10
Response of LFDI to LREXR
-.2
-.1
.0
.1
.2
.3
.4
1 2 3 4 5 6 7 8 9 10
Response of LFDI to LINFQ
-.04
.00
.04
.08
.12
1 2 3 4 5 6 7 8 9 10
Response of LTO to LFDI
-.04
.00
.04
.08
.12
1 2 3 4 5 6 7 8 9 10
Response of LTO to LTO
-.04
.00
.04
.08
.12
1 2 3 4 5 6 7 8 9 10
Response of LTO to LREXR
-.04
.00
.04
.08
.12
1 2 3 4 5 6 7 8 9 10
Response of LTO to LINFQ
-.01
.00
.01
.02
.03
.04
.05
1 2 3 4 5 6 7 8 9 10
Response of LREXR to LFDI
-.01
.00
.01
.02
.03
.04
.05
1 2 3 4 5 6 7 8 9 10
Response of LREXR to LTO
-.01
.00
.01
.02
.03
.04
.05
1 2 3 4 5 6 7 8 9 10
Response of LREXR to LREXR
-.01
.00
.01
.02
.03
.04
.05
1 2 3 4 5 6 7 8 9 10
Response of LREXR to LINFQ
-.04
-.02
.00
.02
.04
.06
1 2 3 4 5 6 7 8 9 10
Response of LINFQ to LFDI
-.04
-.02
.00
.02
.04
.06
1 2 3 4 5 6 7 8 9 10
Response of LINFQ to LTO
-.04
-.02
.00
.02
.04
.06
1 2 3 4 5 6 7 8 9 10
Response of LINFQ to LREXR
-.04
-.02
.00
.02
.04
.06
1 2 3 4 5 6 7 8 9 10
Response of LINFQ to LINFQ
Response to Cholesky One S.D. Innov ations ?2 S.E.
Recommended

![Openness Agreements: Part Two The Reality of Openness · Presented by © Adoptive Families Association of BC [2016] Openness Agreements: Part Two The Reality of Openness](https://img.pdfslide.us/doc/110x75/5e81797d22c1fb32191241b3/openness-agreements-part-two-the-reality-of-openness-presented-by-adoptive-families.jpg)