The money and capital markets
Statistical Yearbook 2011
The money and capital markets
Capital intermediation
Capital transfers from lenders to borrowers
A capital market is a market where financial products are traded, such as loans,
shares, bonds and credit. The market makes it possible to transfer capital from
persons with a savings surplus to persons with a savings shortage. This allows the
individual to time his investments and consumption in relation to his earnings.
The purpose of the money market is to ensure a smooth payment mechanism so
that transactions can be completed against payment without any major costs or
difficulty.
Thus, the money market concerns the liquidity applied for transfer of payments in
connection with financial transactions. There is no clear dividing line between the
money market and the capital market.
Increased internationalization
Since the early 1980s, the Danish financial markets have seen a distinct develop-
ment towards deregulation, internationalization and increasing competition. Dan-
ish citizens can make foreign investments or raise loans abroad without major dif-
ficulty or costs.
The free movement of capital has together with a credible exchange rate policy led
to equalization of the prices (interest rates) of the financial products between the
countries.
In 1980, the difference between the Danish and German long-term bond interest
rate was 10.6 percentage points. This difference has diminished until the begin-
ning of the 1990’s after which the two interest rates have developed in parallel. In
2010 was the Danish long-term bond interest rate 2.9 per cent while the German
long-term bond interest was 2.7 per cent.
Figure 1 Interest rate on 10-year government bonds
0
5
10
15
20
25
1982 1984 1986 1988 1990 1992 1994 1996 1998 2000 2002 2004 2006 2008 2010
Per cent
Denmark
Germany
� www.statbank.dk/dnrenta
1
Microsoft Word − 18 The money and capital markets.doc (X:100.0%, Y:100.0%) Created by Grafikhuset Publi PDF.
The money and capital markets
Statistical Yearbook 2011
Long-term interest rate reached 21 per cent in 1982
The interest on a financial claim reflects the lender’s compensation for the post-
ponement of the opportunities of consumption. A distinction is made between
short-term and long-term interest rates, i.e. the interest rates on short-term and
long-term claims.
Usually, the banks’ three-month interest rate is applied as an indicator of the short-
term interest rate, while the interest rate on ten-year government bonds is the in-
dicator of the long-term interest rate.
The short-term interest rate can be controlled centrally. The central bank of Den-
mark (Danmarks Nationalbank) can adjust the volume and price of liquidity in
relation to the banks. The interest that the banks receive from or pay to Danmarks
Nationalbank influences the interest rates fixed by the banks vis-à-vis their cus-
tomers.
The long-term interest rate reflects other market-driven factors, first of all inflation
and risk expectations. The longer the term of the claim, the greater influence will
these factors have on the fixing of the interest rate. The long-term interest rate will
usually be higher than the short-term interest rate.
In 1981, the short-term interest rate was as high as 21 per cent per annum, partly
because of high inflation expectations.
The Central Bank purchased foreign currency to keep the krone rate stable
The rate of the Danish krone depends on the supply and demand for foreign cur-
rencies. The demand for foreign currency increases at import payments and capital
exports (e.g. when Danes purchase foreign securities or make investments a-
broad).
Conversely, export payments and capital imports will increase the demand for
Danish kroner. An increased demand for foreign currency will force the exchange
rate upwards and the rate of Danish kroner will decrease.
Danmarks Nationalbank trades in the foreign exchange market with a view to sta-
bilise the krone rate through purchases and sales of foreign currency against Dan-
ish kroner. Thus, the primary purpose of foreign exchange reserves is to enable
Danmarks Nationalbank to use intervention as a tool to maintain a stable exchange
rate between the krone and the euro.
Purchases of Danish kroner thus tend to strengthen the krone rate, while sales of
Danish kroner, i.e. purchases of foreign currency, tend to weaken the krone rate.
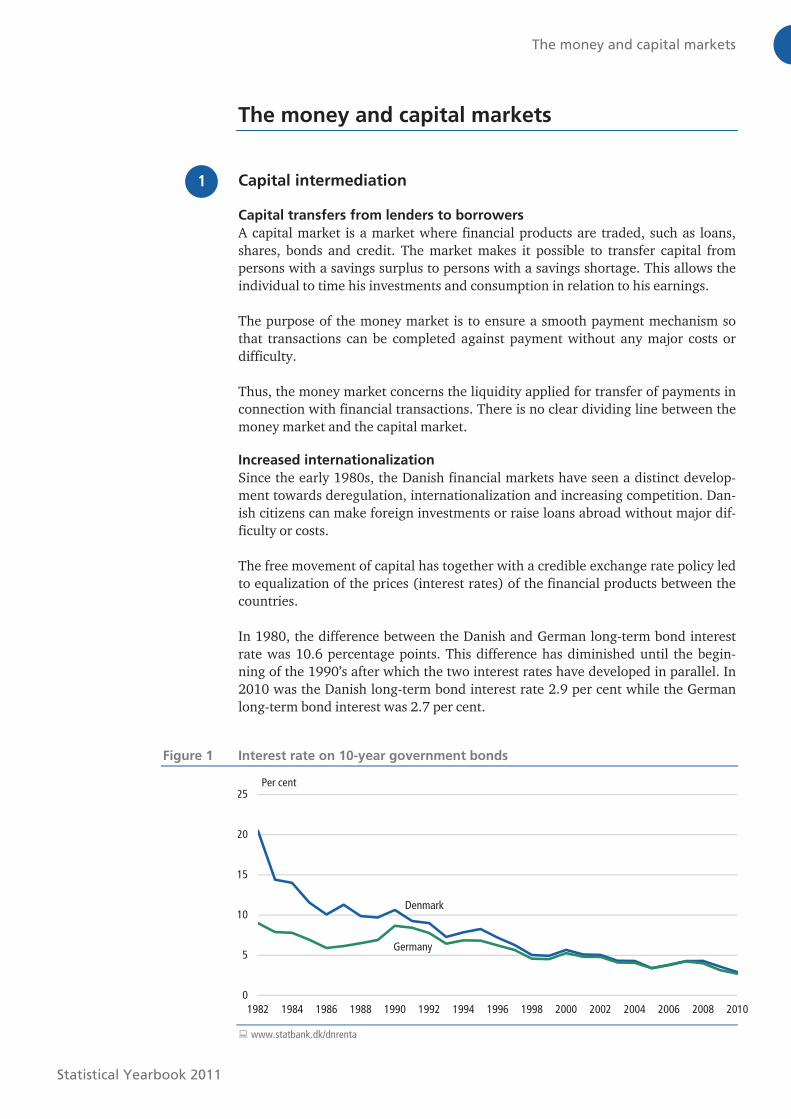
The volume of the Danish foreign exchange reserves has increased substantially
since the early 1990s to 2003. This indicates that in the past decade Danmarks
Nationalbank has made more purchases than sales of foreign currency in net terms
to keep the krone rate down. In the period 2003 – 2007 the volume of the foreign
exchange reserves decreased, but since the volume has increased, because of the
difference in interest rates between Denmark and especially the Euro-area. As the
interest rates have fallen in general even small differences have made it attractive
for foreign investors to invest en Danish securities, which has increased the de-
mand for Danish kroner. The Central Bank has in order to stabilise the exchange
rate purchased foreign currency.
Microsoft Word − 18 The money and capital markets.doc (X:100.0%, Y:100.0%) Created by Grafikhuset Publi PDF.
The money and capital markets
Statistical Yearbook 2011
Figure 2 Foreign exchange reserve
0
50
100
150
200
250
300
350
400
1982 1984 1986 1988 1990 1992 1994 1996 1998 2000 2002 2004 2006 2008 2010
DKK billion
� www.statbank.dk/dnivl
Denmark participating in ERM II
Since 1 January 1999, Denmark has participated in an exchange-rate co-operation
with the European Central Bank (ECB) for the EU member states, which do not
participate in the European Monetary Union. In the agreement called ERM II (Ex-
change Rate Mechanism II) Denmark is accompanied by Lithuania and Latvia.
The purpose of ERM II is to retain the exchange rates within the agreed fluctuation
band on +/- 15 per cent in relation to the central rate. Denmark has a narrower
fluctuation band on +/- 2.25 per cent in relation to the central rate. In case of ex-
traordinary pressure on the krone, in addition to selling some of its foreign ex-
change reserve Denmark may draw on an intervention credit/euro account with
the ECB. Thus, the ERM contributes to stabilizing the krone rate in relation to the
European currencies and the euro, but not in relation to other major currencies
such as the US-dollar or the yen.
Financial claims
Money as a means of payment
Today, the function of money as a means of payment is based exclusively on trust.
If a seller is to accept money as payment for his product, he must be able to trust
that others will also accept money as the means of payment. In case of high infla-
tion, the value of money as a means of payment will drop.
Until 1931, the value of notes and coins could be converted into gold at Danmarks
Nationalbank. Although the gold convertibility was subsequently abolished, the
gold standard existed formally until 1971. This implied that Danmarks National-
bank had a duty to maintain gold reserves corresponding to the value of notes and
coins in circulation. Today, money is still claims against Danmarks Nationalbank,
but these claims are no longer covered by the gold reserves of Danmarks National-
bank.
2
Microsoft Word − 18 The money and capital markets.doc (X:100.0%, Y:100.0%) Created by Grafikhuset Publi PDF.
The money and capital markets
Statistical Yearbook 2011
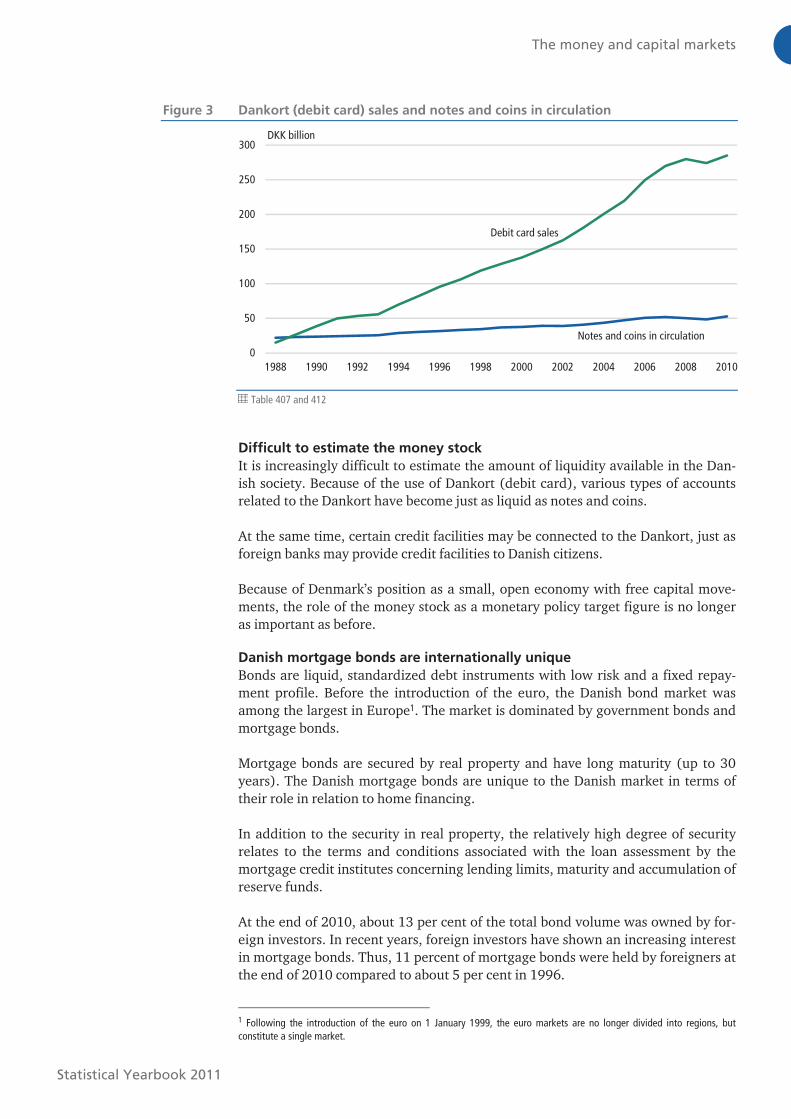
Figure 3 Dankort (debit card) sales and notes and coins in circulation
0
50
100
150
200
250
300
1988 1990 1992 1994 1996 1998 2000 2002 2004 2006 2008 2010
DKK billion
Debit card sales
Notes and coins in circulation
Table 407 and 412
Difficult to estimate the money stock
It is increasingly difficult to estimate the amount of liquidity available in the Dan-
ish society. Because of the use of Dankort (debit card), various types of accounts
related to the Dankort have become just as liquid as notes and coins.
At the same time, certain credit facilities may be connected to the Dankort, just as
foreign banks may provide credit facilities to Danish citizens.
Because of Denmark’s position as a small, open economy with free capital move-
ments, the role of the money stock as a monetary policy target figure is no longer
as important as before.
Danish mortgage bonds are internationally unique
Bonds are liquid, standardized debt instruments with low risk and a fixed repay-
ment profile. Before the introduction of the euro, the Danish bond market was
among the largest in Europe1. The market is dominated by government bonds and
mortgage bonds.
Mortgage bonds are secured by real property and have long maturity (up to 30
years). The Danish mortgage bonds are unique to the Danish market in terms of
their role in relation to home financing.
In addition to the security in real property, the relatively high degree of security
relates to the terms and conditions associated with the loan assessment by the
mortgage credit institutes concerning lending limits, maturity and accumulation of
reserve funds.
At the end of 2010, about 13 per cent of the total bond volume was owned by for-
eign investors. In recent years, foreign investors have shown an increasing interest
in mortgage bonds. Thus, 11 percent of mortgage bonds were held by foreigners at
the end of 2010 compared to about 5 per cent in 1996.
1 Following the introduction of the euro on 1 January 1999, the euro markets are no longer divided into regions, but
constitute a single market.
Microsoft Word − 18 The money and capital markets.doc (X:100.0%, Y:100.0%) Created by Grafikhuset Publi PDF.
The money and capital markets
Statistical Yearbook 2011
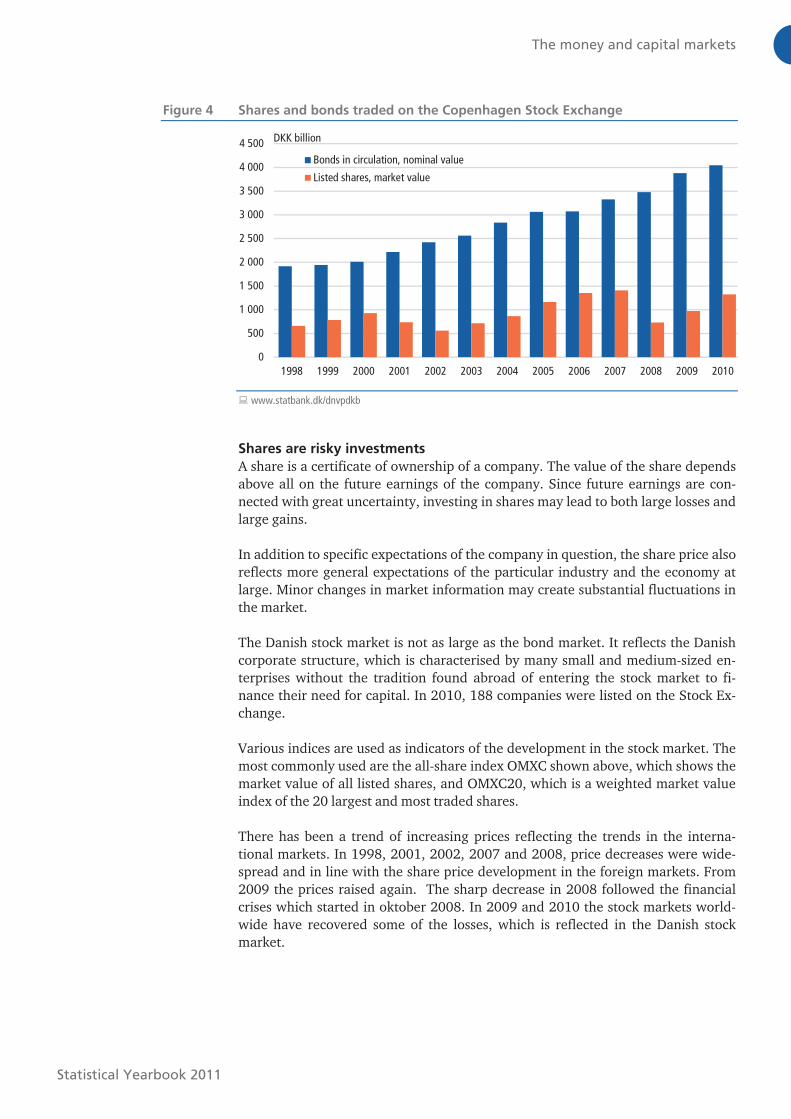
Figure 4 Shares and bonds traded on the Copenhagen Stock Exchange
0
500
1 000
1 500
2 000
2 500
3 000
3 500
4 000
4 500
1998 1999 2000 2001 2002 2003 2004 2005 2006 2007 2008 2009 2010
Bonds in circulation, nominal value
Listed shares, market value
DKK billion
� www.statbank.dk/dnvpdkb
Shares are risky investments
A share is a certificate of ownership of a company. The value of the share depends
above all on the future earnings of the company. Since future earnings are con-
nected with great uncertainty, investing in shares may lead to both large losses and
large gains.
In addition to specific expectations of the company in question, the share price also
reflects more general expectations of the particular industry and the economy at
large. Minor changes in market information may create substantial fluctuations in
the market.
The Danish stock market is not as large as the bond market. It reflects the Danish
corporate structure, which is characterised by many small and medium-sized en-
terprises without the tradition found abroad of entering the stock market to fi-
nance their need for capital. In 2010, 188 companies were listed on the Stock Ex-
change.
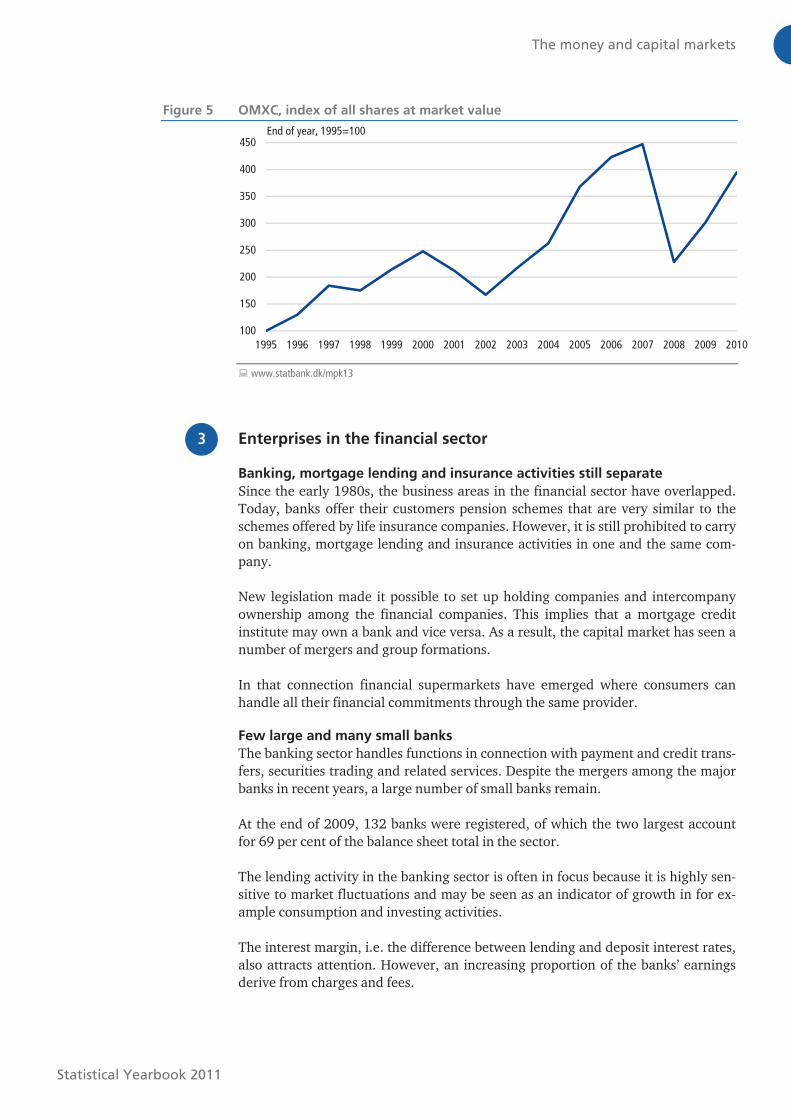
Various indices are used as indicators of the development in the stock market. The
most commonly used are the all-share index OMXC shown above, which shows the
market value of all listed shares, and OMXC20, which is a weighted market value
index of the 20 largest and most traded shares.
There has been a trend of increasing prices reflecting the trends in the interna-
tional markets. In 1998, 2001, 2002, 2007 and 2008, price decreases were wide-
spread and in line with the share price development in the foreign markets. From
2009 the prices raised again. The sharp decrease in 2008 followed the financial
crises which started in oktober 2008. In 2009 and 2010 the stock markets world-
wide have recovered some of the losses, which is reflected in the Danish stock
market.
Microsoft Word − 18 The money and capital markets.doc (X:100.0%, Y:100.0%) Created by Grafikhuset Publi PDF.
The money and capital markets
Statistical Yearbook 2011
Figure 5 OMXC, index of all shares at market value
100
150
200
250
300
350
400
450
1995 1996 1997 1998 1999 2000 2001 2002 2003 2004 2005 2006 2007 2008 2009 2010
End of year, 1995=100
� www.statbank.dk/mpk13
Enterprises in the financial sector
Banking, mortgage lending and insurance activities still separate
Since the early 1980s, the business areas in the financial sector have overlapped.
Today, banks offer their customers pension schemes that are very similar to the
schemes offered by life insurance companies. However, it is still prohibited to carry
on banking, mortgage lending and insurance activities in one and the same com-
pany.
New legislation made it possible to set up holding companies and intercompany
ownership among the financial companies. This implies that a mortgage credit
institute may own a bank and vice versa. As a result, the capital market has seen a
number of mergers and group formations.
In that connection financial supermarkets have emerged where consumers can
handle all their financial commitments through the same provider.
Few large and many small banks
The banking sector handles functions in connection with payment and credit trans-
fers, securities trading and related services. Despite the mergers among the major
banks in recent years, a large number of small banks remain.
At the end of 2009, 132 banks were registered, of which the two largest account
for 69 per cent of the balance sheet total in the sector.
The lending activity in the banking sector is often in focus because it is highly sen-
sitive to market fluctuations and may be seen as an indicator of growth in for ex-
ample consumption and investing activities.
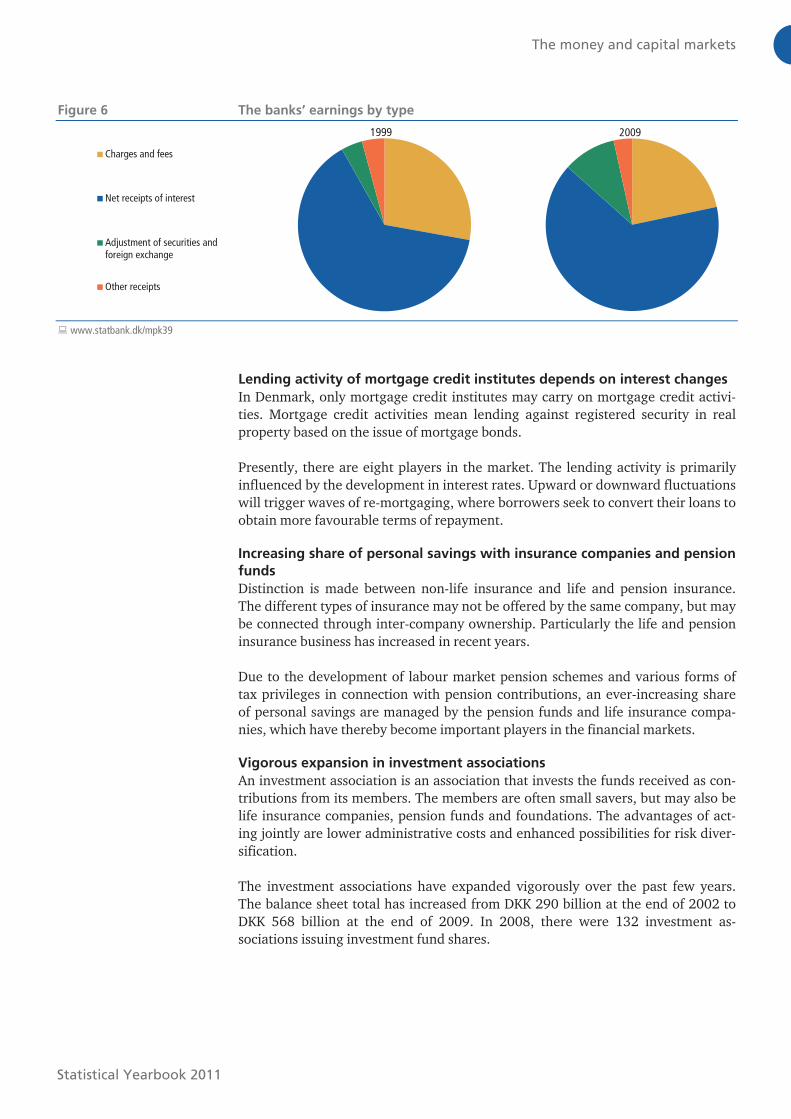
The interest margin, i.e. the difference between lending and deposit interest rates,
also attracts attention. However, an increasing proportion of the banks’ earnings
derive from charges and fees.
3
Microsoft Word − 18 The money and capital markets.doc (X:100.0%, Y:100.0%) Created by Grafikhuset Publi PDF.
The money and capital markets
Statistical Yearbook 2011
Figure 6 The banks’ earnings by type
Charges and fees
Net receipts of interest
Adjustment of securities andforeign exchange
Other receipts
1999 2009
� www.statbank.dk/mpk39
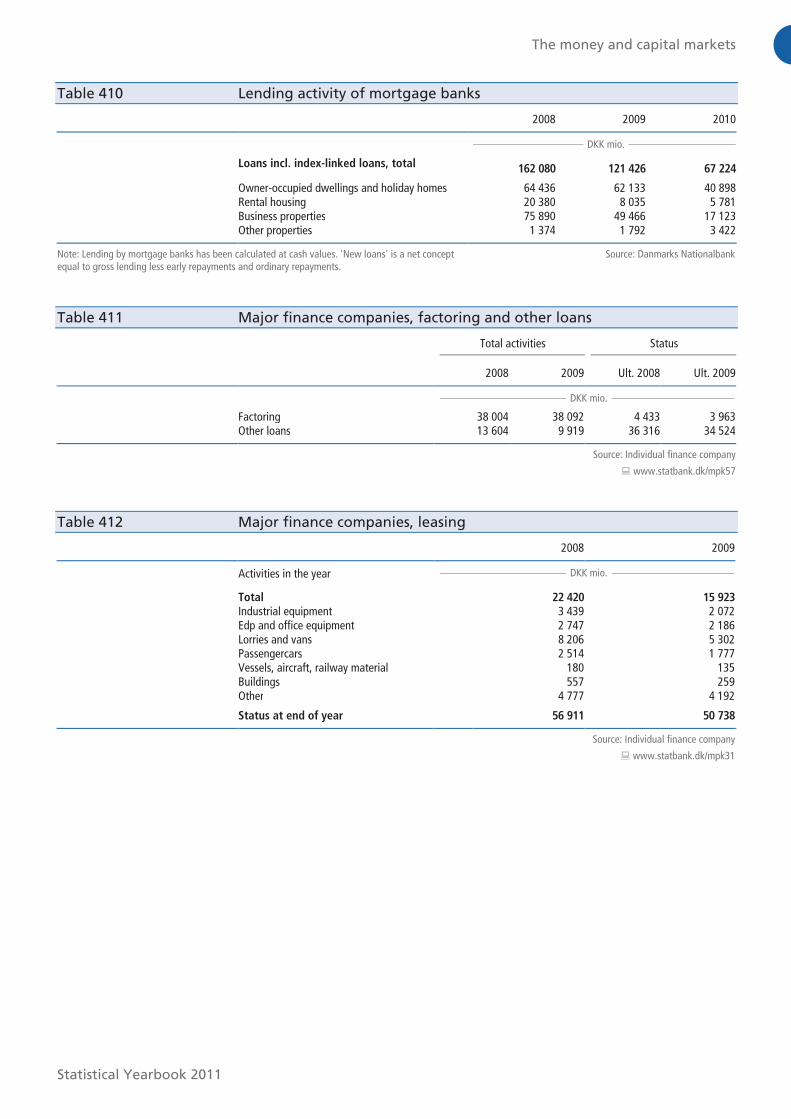
Lending activity of mortgage credit institutes depends on interest changes
In Denmark, only mortgage credit institutes may carry on mortgage credit activi-
ties. Mortgage credit activities mean lending against registered security in real
property based on the issue of mortgage bonds.
Presently, there are eight players in the market. The lending activity is primarily
influenced by the development in interest rates. Upward or downward fluctuations
will trigger waves of re-mortgaging, where borrowers seek to convert their loans to
obtain more favourable terms of repayment.
Increasing share of personal savings with insurance companies and pension
funds
Distinction is made between non-life insurance and life and pension insurance.
The different types of insurance may not be offered by the same company, but may
be connected through inter-company ownership. Particularly the life and pension
insurance business has increased in recent years.
Due to the development of labour market pension schemes and various forms of
tax privileges in connection with pension contributions, an ever-increasing share
of personal savings are managed by the pension funds and life insurance compa-
nies, which have thereby become important players in the financial markets.
Vigorous expansion in investment associations
An investment association is an association that invests the funds received as con-
tributions from its members. The members are often small savers, but may also be
life insurance companies, pension funds and foundations. The advantages of act-
ing jointly are lower administrative costs and enhanced possibilities for risk diver-
sification.
The investment associations have expanded vigorously over the past few years.
The balance sheet total has increased from DKK 290 billion at the end of 2002 to
DKK 568 billion at the end of 2009. In 2008, there were 132 investment as-
sociations issuing investment fund shares.
Microsoft Word − 18 The money and capital markets.doc (X:100.0%, Y:100.0%) Created by Grafikhuset Publi PDF.
The money and capital markets
Statistical Yearbook 2011
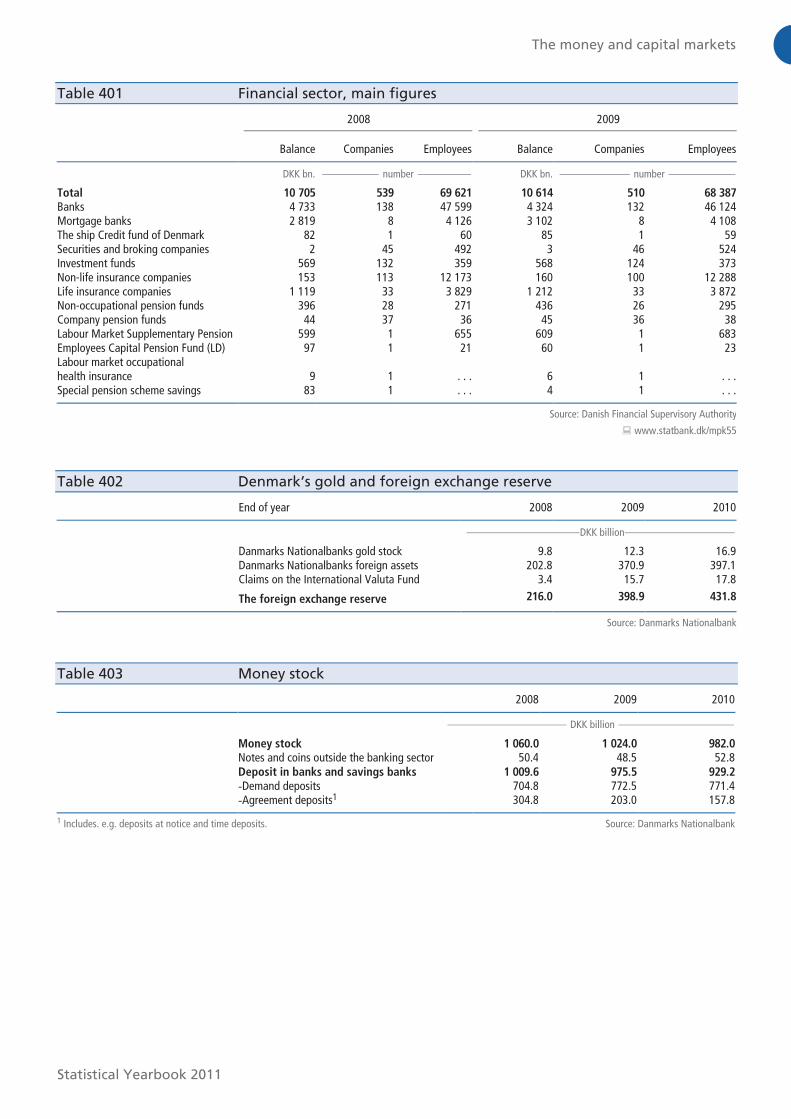
Table 401 Financial sector, main figures
2008 2009
Balance Companies Employees Balance Companies Employees
DKK bn. number DKK bn. number
Total 10 705 539 69 621 10 614 510 68 387
Banks 4 733 138 47 599 4 324 132 46 124 Mortgage banks 2 819 8 4 126 3 102 8 4 108 The ship Credit fund of Denmark 82 1 60 85 1 59 Securities and broking companies 2 45 492 3 46 524 Investment funds 569 132 359 568 124 373 Non-life insurance companies 153 113 12 173 160 100 12 288 Life insurance companies 1 119 33 3 829 1 212 33 3 872 Non-occupational pension funds 396 28 271 436 26 295 Company pension funds 44 37 36 45 36 38 Labour Market Supplementary Pension 599 1 655 609 1 683 Employees Capital Pension Fund (LD) 97 1 21 60 1 23 Labour market occupational health insurance 9 1 . . . 6 1 . . . Special pension scheme savings 83 1 . . . 4 1 . . .
Source: Danish Financial Supervisory Authority
� www.statbank.dk/mpk55
Table 402 Denmark’s gold and foreign exchange reserve
End of year 2008 2009 2010
DKK billion
Danmarks Nationalbanks gold stock 9.8 12.3 16.9 Danmarks Nationalbanks foreign assets 202.8 370.9 397.1 Claims on the International Valuta Fund 3.4 15.7 17.8 The foreign exchange reserve 216.0 398.9 431.8
Source: Danmarks Nationalbank
Table 403 Money stock
2008 2009 2010
DKK billion
Money stock 1 060.0 1 024.0 982.0
Notes and coins outside the banking sector 50.4 48.5 52.8 Deposit in banks and savings banks 1 009.6 975.5 929.2
-Demand deposits 704.8 772.5 771.4 -Agreement deposits1 304.8 203.0 157.8
1 Includes. e.g. deposits at notice and time deposits. Source: Danmarks Nationalbank
Microsoft Word − Table 401.docx (X:100.0%, Y:100.0%) Created by Grafikhuset Publi PDF.
The money and capital markets
Statistical Yearbook 2011
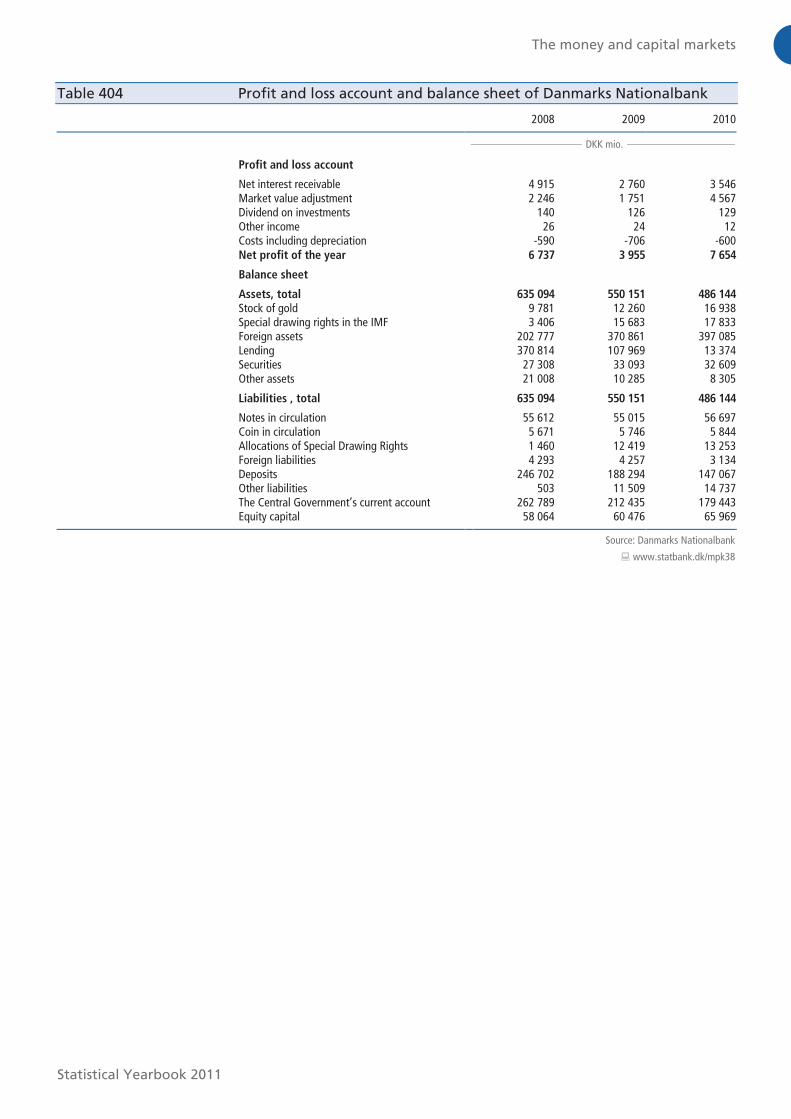
Table 404 Profit and loss account and balance sheet of Danmarks Nationalbank
2008 2009 2010
DKK mio.
Profit and loss account
Net interest receivable 4 915 2 760 3 546 Market value adjustment 2 246 1 751 4 567 Dividend on investments 140 126 129 Other income 26 24 12 Costs including depreciation -590 -706 -600 Net profit of the year 6 737 3 955 7 654
Balance sheet Assets, total 635 094 550 151 486 144
Stock of gold 9 781 12 260 16 938 Special drawing rights in the IMF 3 406 15 683 17 833 Foreign assets 202 777 370 861 397 085 Lending 370 814 107 969 13 374 Securities 27 308 33 093 32 609 Other assets 21 008 10 285 8 305
Liabilities , total 635 094 550 151 486 144
Notes in circulation 55 612 55 015 56 697 Coin in circulation 5 671 5 746 5 844 Allocations of Special Drawing Rights 1 460 12 419 13 253 Foreign liabilities 4 293 4 257 3 134 Deposits 246 702 188 294 147 067 Other liabilities 503 11 509 14 737 The Central Government’s current account 262 789 212 435 179 443 Equity capital 58 064 60 476 65 969
Source: Danmarks Nationalbank
� www.statbank.dk/mpk38
Microsoft Word − Table 404.docx (X:100.0%, Y:100.0%) Created by Grafikhuset Publi PDF.
The money and capital markets
Statistical Yearbook 2011
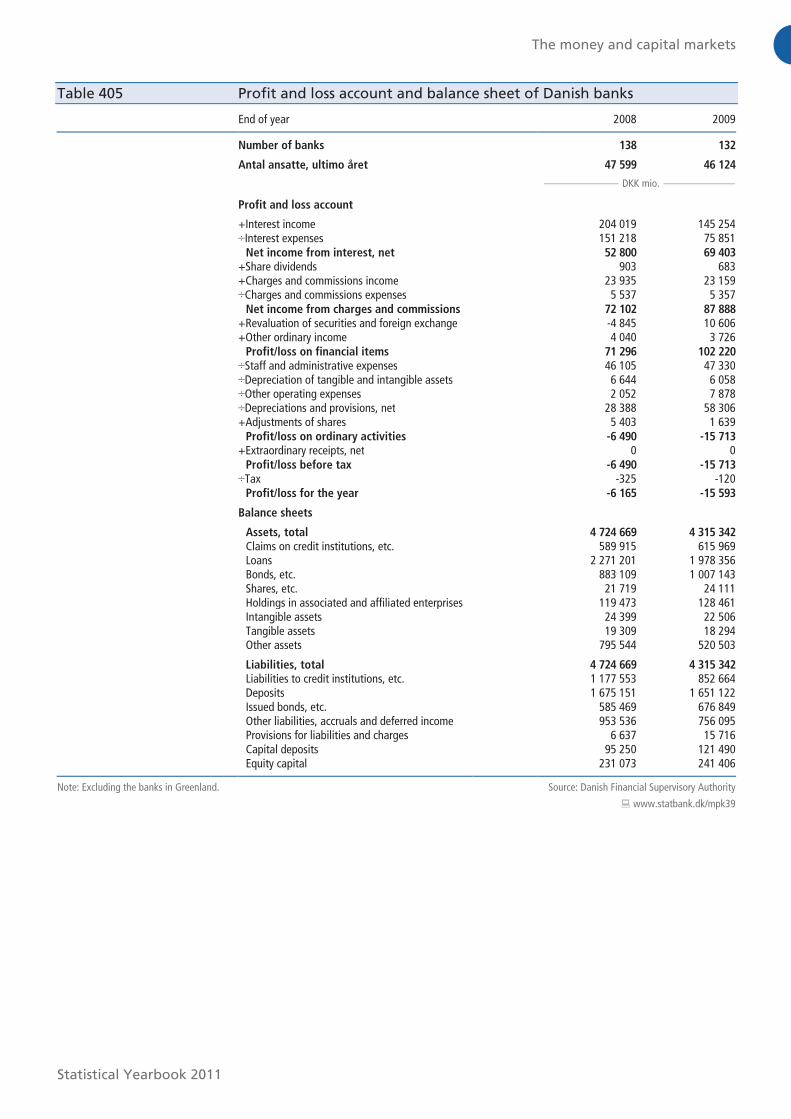
Table 405 Profit and loss account and balance sheet of Danish banks
End of year 2008 2009
Number of banks 138 132
Antal ansatte, ultimo året 47 599 46 124
DKK mio.
Profit and loss account
+Interest income 204 019 145 254 ÷Interest expenses 151 218 75 851 Net income from interest, net 52 800 69 403
+Share dividends 903 683 +Charges and commissions income 23 935 23 159 ÷Charges and commissions expenses 5 537 5 357 Net income from charges and commissions 72 102 87 888
+Revaluation of securities and foreign exchange -4 845 10 606 +Other ordinary income 4 040 3 726 Profit/loss on financial items 71 296 102 220
÷Staff and administrative expenses 46 105 47 330 ÷Depreciation of tangible and intangible assets 6 644 6 058 ÷Other operating expenses 2 052 7 878 ÷Depreciations and provisions, net 28 388 58 306 +Adjustments of shares 5 403 1 639 Profit/loss on ordinary activities -6 490 -15 713
+Extraordinary receipts, net 0 0 Profit/loss before tax -6 490 -15 713
÷Tax -325 -120 Profit/loss for the year -6 165 -15 593
Balance sheets Assets, total 4 724 669 4 315 342
Claims on credit institutions, etc. 589 915 615 969 Loans 2 271 201 1 978 356 Bonds, etc. 883 109 1 007 143 Shares, etc. 21 719 24 111 Holdings in associated and affiliated enterprises 119 473 128 461 Intangible assets 24 399 22 506 Tangible assets 19 309 18 294 Other assets 795 544 520 503
Liabilities, total 4 724 669 4 315 342
Liabilities to credit institutions, etc. 1 177 553 852 664 Deposits 1 675 151 1 651 122 Issued bonds, etc. 585 469 676 849 Other liabilities, accruals and deferred income 953 536 756 095 Provisions for liabilities and charges 6 637 15 716 Capital deposits 95 250 121 490 Equity capital 231 073 241 406
Note: Excluding the banks in Greenland.
Source: Danish Financial Supervisory Authority
� www.statbank.dk/mpk39
Microsoft Word − Table 405.docx (X:100.0%, Y:100.0%) Created by Grafikhuset Publi PDF.
The money and capital markets
Statistical Yearbook 2011
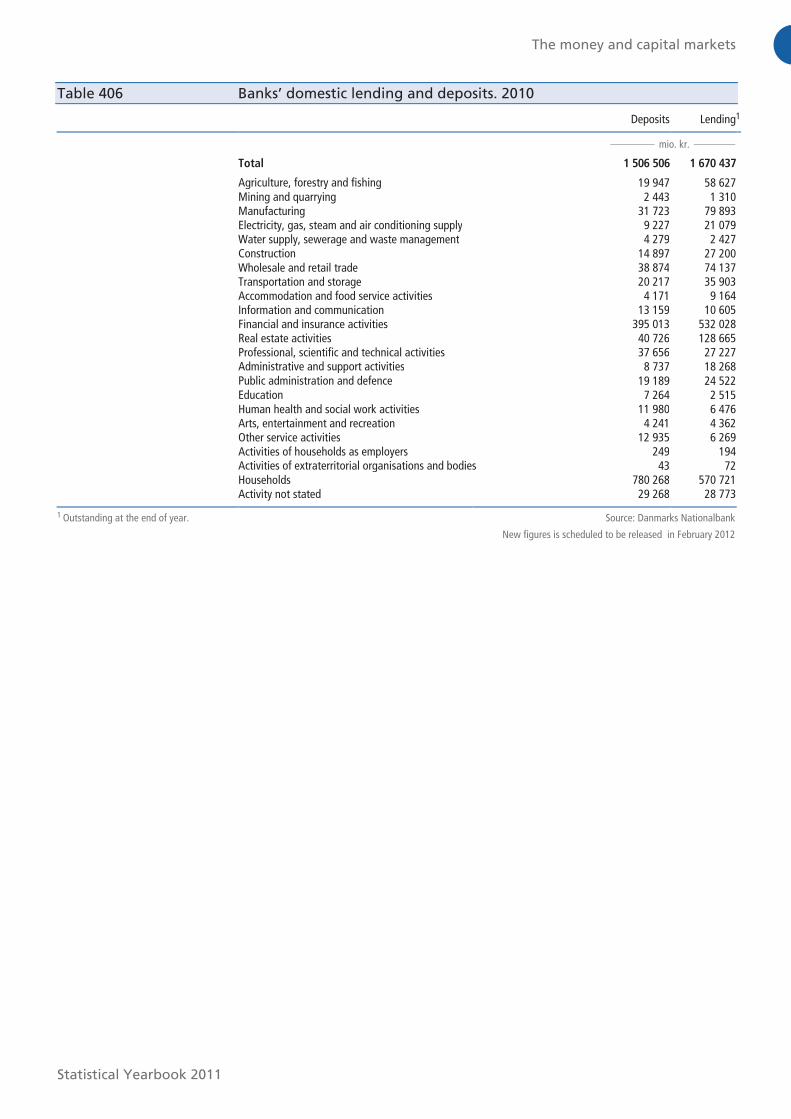
Table 406 Banks’ domestic lending and deposits. 2010
Deposits Lending1
mio. kr.
Total 1 506 506 1 670 437
Agriculture, forestry and fishing 19 947 58 627 Mining and quarrying 2 443 1 310 Manufacturing 31 723 79 893 Electricity, gas, steam and air conditioning supply 9 227 21 079 Water supply, sewerage and waste management 4 279 2 427
Construction 14 897 27 200 Wholesale and retail trade 38 874 74 137 Transportation and storage 20 217 35 903 Accommodation and food service activities 4 171 9 164 Information and communication 13 159 10 605 Financial and insurance activities 395 013 532 028 Real estate activities 40 726 128 665 Professional, scientific and technical activities 37 656 27 227 Administrative and support activities 8 737 18 268 Public administration and defence 19 189 24 522 Education 7 264 2 515 Human health and social work activities 11 980 6 476 Arts, entertainment and recreation 4 241 4 362 Other service activities 12 935 6 269 Activities of households as employers 249 194 Activities of extraterritorial organisations and bodies 43 72 Households 780 268 570 721 Activity not stated 29 268 28 773
1 Outstanding at the end of year. Source: Danmarks Nationalbank
New figures is scheduled to be released in February 2012
Microsoft Word − Table 406.docx (X:100.0%, Y:100.0%) Created by Grafikhuset Publi PDF.
The money and capital markets
Statistical Yearbook 2011
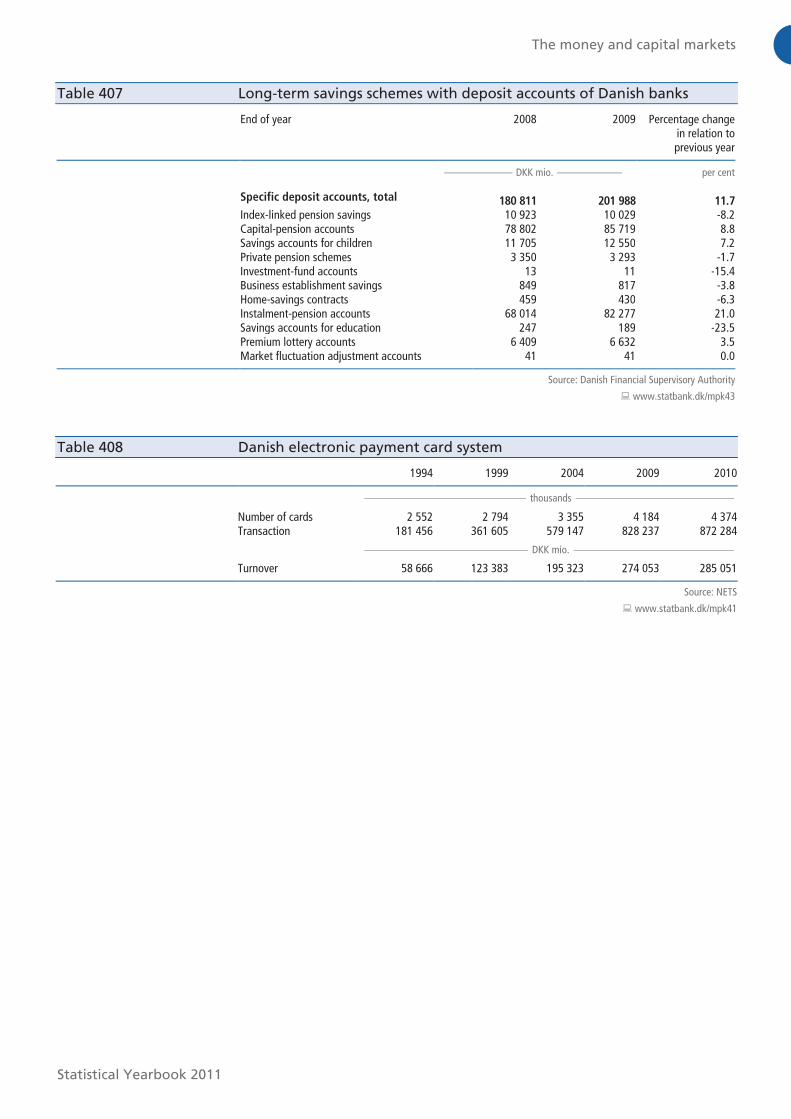
Table 407 Long-term savings schemes with deposit accounts of Danish banks
End of year 2008 2009 Percentage change in relation to previous year
DKK mio. per cent
Specific deposit accounts, total 180 811 201 988 11.7
Index-linked pension savings 10 923 10 029 -8.2 Capital-pension accounts 78 802 85 719 8.8 Savings accounts for children 11 705 12 550 7.2 Private pension schemes 3 350 3 293 -1.7 Investment-fund accounts 13 11 -15.4 Business establishment savings 849 817 -3.8 Home-savings contracts 459 430 -6.3 Instalment-pension accounts 68 014 82 277 21.0 Savings accounts for education 247 189 -23.5 Premium lottery accounts 6 409 6 632 3.5 Market fluctuation adjustment accounts 41 41 0.0
Source: Danish Financial Supervisory Authority
� www.statbank.dk/mpk43
Table 408 Danish electronic payment card system
1994 1999 2004 2009 2010
thousands
Number of cards 2 552 2 794 3 355 4 184 4 374 Transaction 181 456 361 605 579 147 828 237 872 284
DKK mio.
Turnover 58 666 123 383 195 323 274 053 285 051
Source: NETS
� www.statbank.dk/mpk41
Microsoft Word − Table 407.docx (X:100.0%, Y:100.0%) Created by Grafikhuset Publi PDF.
The money and capital markets
Statistical Yearbook 2011
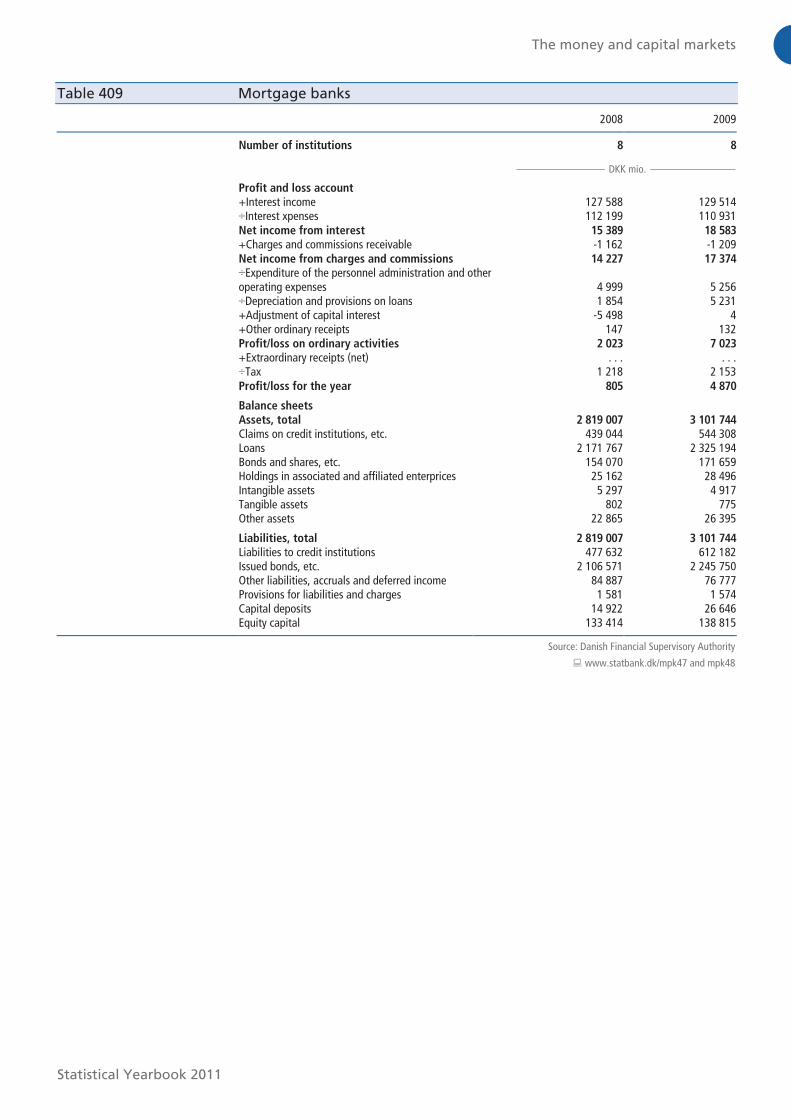
Table 409 Mortgage banks
2008 2009
Number of institutions 8 8
DKK mio.
Profit and loss account +Interest income 127 588 129 514 ÷Interest xpenses 112 199 110 931 Net income from interest 15 389 18 583
+Charges and commissions receivable -1 162 -1 209 Net income from charges and commissions 14 227 17 374
÷Expenditure of the personnel administration and other operating expenses 4 999 5 256
÷Depreciation and provisions on loans 1 854 5 231 +Adjustment of capital interest -5 498 4 +Other ordinary receipts 147 132 Profit/loss on ordinary activities 2 023 7 023
+Extraordinary receipts (net) . . . . . . ÷Tax 1 218 2 153 Profit/loss for the year 805 4 870
Balance sheets
Assets, total 2 819 007 3 101 744
Claims on credit institutions, etc. 439 044 544 308 Loans 2 171 767 2 325 194 Bonds and shares, etc. 154 070 171 659 Holdings in associated and affiliated enterprices 25 162 28 496 Intangible assets 5 297 4 917 Tangible assets 802 775 Other assets 22 865 26 395
Liabilities, total 2 819 007 3 101 744
Liabilities to credit institutions 477 632 612 182 Issued bonds, etc. 2 106 571 2 245 750 Other liabilities, accruals and deferred income 84 887 76 777 Provisions for liabilities and charges 1 581 1 574 Capital deposits 14 922 26 646 Equity capital 133 414 138 815
Source: Danish Financial Supervisory Authority
� www.statbank.dk/mpk47 and mpk48
Microsoft Word − Table 409.docx (X:100.0%, Y:100.0%) Created by Grafikhuset Publi PDF.
The money and capital markets
Statistical Yearbook 2011
Table 410 Lending activity of mortgage banks
2008 2009 2010
DKK mio.
Loans incl. index-linked loans, total 162 080 121 426 67 224
Owner-occupied dwellings and holiday homes 64 436 62 133 40 898 Rental housing 20 380 8 035 5 781 Business properties 75 890 49 466 17 123 Other properties 1 374 1 792 3 422
Note: Lending by mortgage banks has been calculated at cash values. 'New loans' is a net concept equal to gross lending less early repayments and ordinary repayments.
Source: Danmarks Nationalbank
Table 411 Major finance companies, factoring and other loans
Total activities Status
2008 2009 Ult. 2008 Ult. 2009
DKK mio.
Factoring 38 004 38 092 4 433 3 963 Other loans 13 604 9 919 36 316 34 524
Source: Individual finance company
� www.statbank.dk/mpk57
Table 412 Major finance companies, leasing
2008 2009
Activities in the year DKK mio.
Total 22 420 15 923
Industrial equipment 3 439 2 072 Edp and office equipment 2 747 2 186 Lorries and vans 8 206 5 302 Passengercars 2 514 1 777 Vessels, aircraft, railway material 180 135 Buildings 557 259 Other 4 777 4 192
Status at end of year 56 911 50 738
Source: Individual finance company
� www.statbank.dk/mpk31
Microsoft Word − Table 410.docx (X:100.0%, Y:100.0%) Created by Grafikhuset Publi PDF.
The money and capital markets
Statistical Yearbook 2011
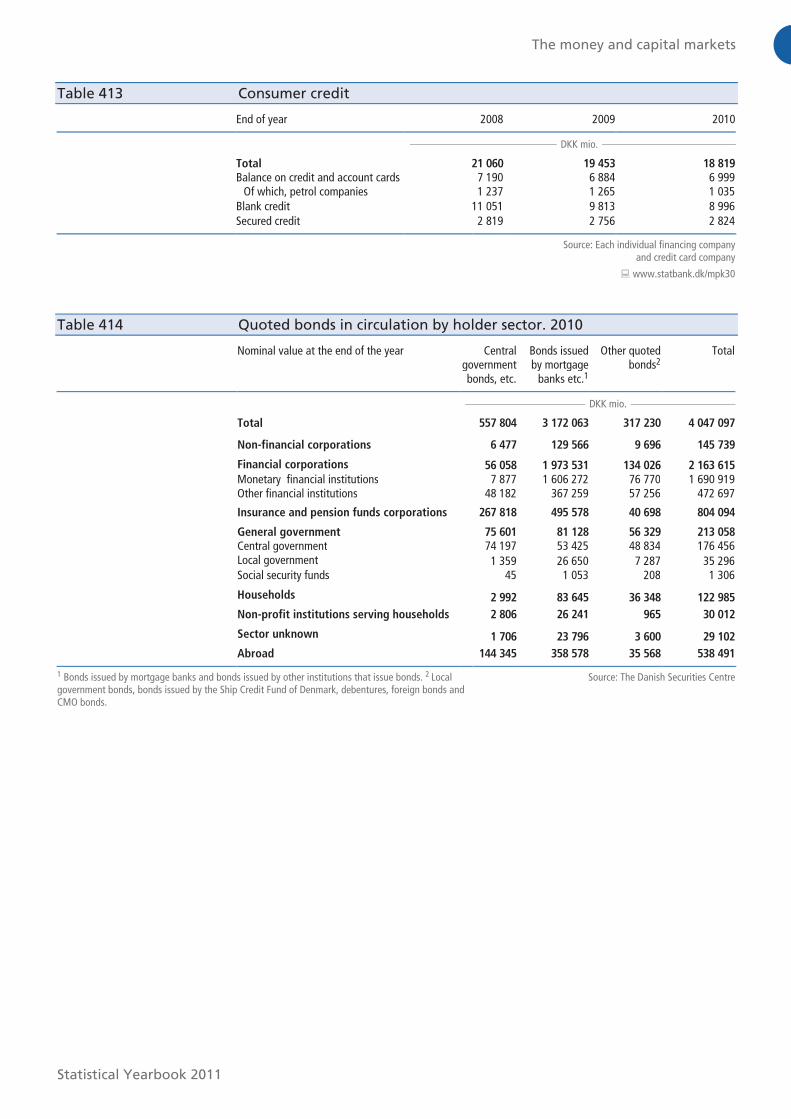
Table 413 Consumer credit
End of year 2008 2009 2010
DKK mio.
Total 21 060 19 453 18 819
Balance on credit and account cards 7 190 6 884 6 999
Of which, petrol companies 1 237 1 265 1 035
Blank credit 11 051 9 813 8 996 Secured credit 2 819 2 756 2 824
Source: Each individual financing company and credit card company
� www.statbank.dk/mpk30
Table 414 Quoted bonds in circulation by holder sector. 2010
Nominal value at the end of the year Central government bonds, etc.
Bonds issued by mortgage
banks etc.1
Other quoted bonds2
Total
DKK mio.
Total 557 804 3 172 063 317 230 4 047 097
Non-financial corporations 6 477 129 566 9 696 145 739
Financial corporations 56 058 1 973 531 134 026 2 163 615
Monetary financial institutions 7 877 1 606 272 76 770 1 690 919 Other financial institutions 48 182 367 259 57 256 472 697
Insurance and pension funds corporations 267 818 495 578 40 698 804 094
General government 75 601 81 128 56 329 213 058
Central government 74 197 53 425 48 834 176 456 Local government 1 359 26 650 7 287 35 296 Social security funds 45 1 053 208 1 306
Households 2 992 83 645 36 348 122 985
Non-profit institutions serving households 2 806 26 241 965 30 012
Sector unknown 1 706 23 796 3 600 29 102
Abroad 144 345 358 578 35 568 538 491
1 Bonds issued by mortgage banks and bonds issued by other institutions that issue bonds. 2 Local government bonds, bonds issued by the Ship Credit Fund of Denmark, debentures, foreign bonds and CMO bonds.
Source: The Danish Securities Centre
Microsoft Word − Table 413.docx (X:100.0%, Y:100.0%) Created by Grafikhuset Publi PDF.
The money and capital markets
Statistical Yearbook 2011
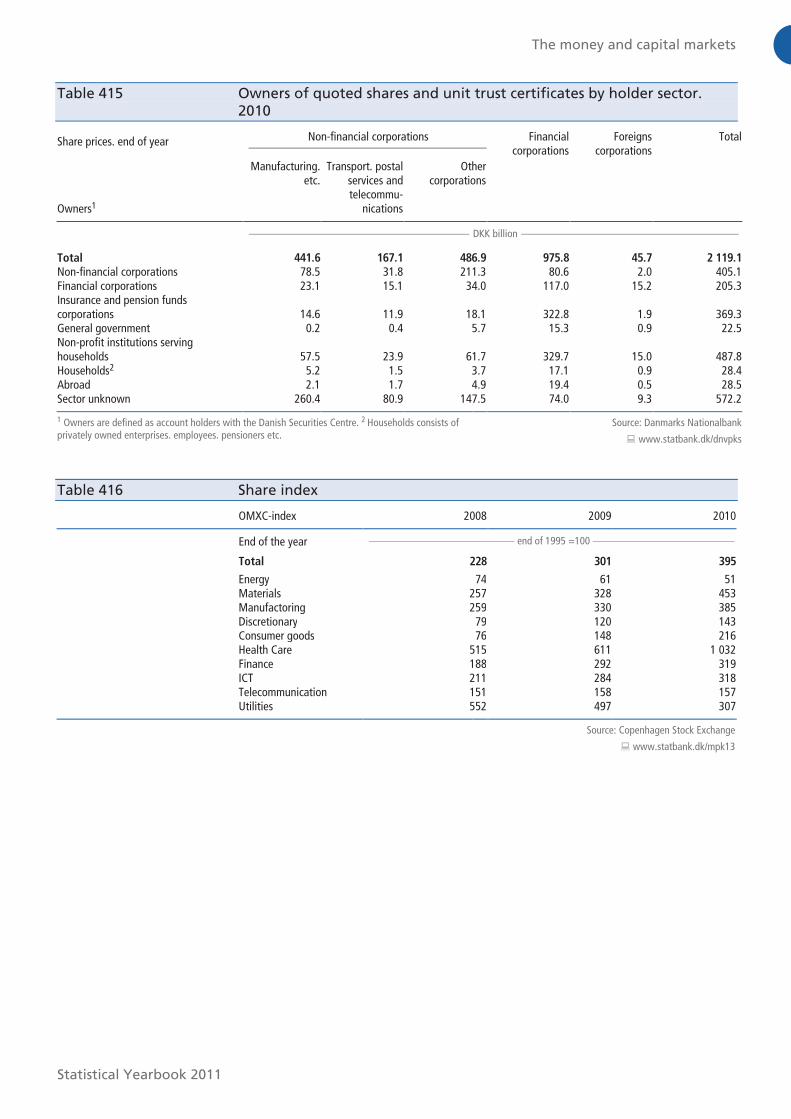
Table 415 Owners of quoted shares and unit trust certificates by holder sector. 2010
Share prices. end of year Non-financial corporations Financial corporations
Foreigns corporations
Total
Owners1
Manufacturing. etc.
Transport. postal services and telecommu-
nications
Other corporations
DKK billion
Total 441.6 167.1 486.9 975.8 45.7 2 119.1
Non-financial corporations 78.5 31.8 211.3 80.6 2.0 405.1 Financial corporations 23.1 15.1 34.0 117.0 15.2 205.3 Insurance and pension funds corporations 14.6 11.9 18.1 322.8 1.9 369.3 General government 0.2 0.4 5.7 15.3 0.9 22.5 Non-profit institutions serving households 57.5 23.9 61.7 329.7 15.0 487.8 Households2 5.2 1.5 3.7 17.1 0.9 28.4 Abroad 2.1 1.7 4.9 19.4 0.5 28.5 Sector unknown 260.4 80.9 147.5 74.0 9.3 572.2
1 Owners are defined as account holders with the Danish Securities Centre. 2 Households consists of privately owned enterprises. employees. pensioners etc.
Source: Danmarks Nationalbank
� www.statbank.dk/dnvpks
Table 416 Share index
OMXC-index 2008 2009 2010
End of the year end of 1995 =100
Total 228 301 395
Energy 74 61 51 Materials 257 328 453 Manufactoring 259 330 385 Discretionary 79 120 143 Consumer goods 76 148 216 Health Care 515 611 1 032 Finance 188 292 319 ICT 211 284 318 Telecommunication 151 158 157 Utilities 552 497 307
Source: Copenhagen Stock Exchange
� www.statbank.dk/mpk13
Microsoft Word − Table 415.docx (X:100.0%, Y:100.0%) Created by Grafikhuset Publi PDF.
The money and capital markets
Statistical Yearbook 2011
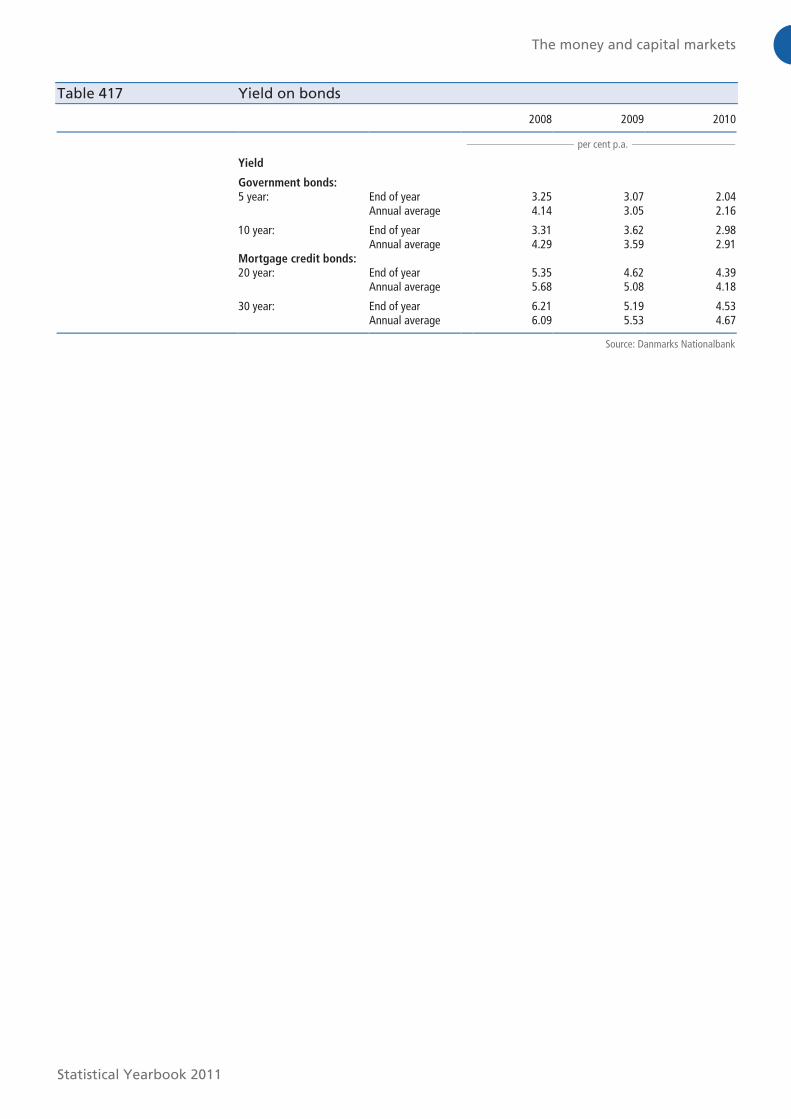
Table 417 Yield on bonds
2008 2009 2010
per cent p.a.
Yield
Government bonds:
5 year: End of year 3.25 3.07 2.04 Annual average 4.14 3.05 2.16
10 year: End of year 3.31 3.62 2.98 Annual average 4.29 3.59 2.91 Mortgage credit bonds: 20 year: End of year 5.35 4.62 4.39 Annual average 5.68 5.08 4.18
30 year: End of year 6.21 5.19 4.53 Annual average 6.09 5.53 4.67
Source: Danmarks Nationalbank
Microsoft Word − Table 417.docx (X:100.0%, Y:100.0%) Created by Grafikhuset Publi PDF.
The money and capital markets
Statistical Yearbook 2011
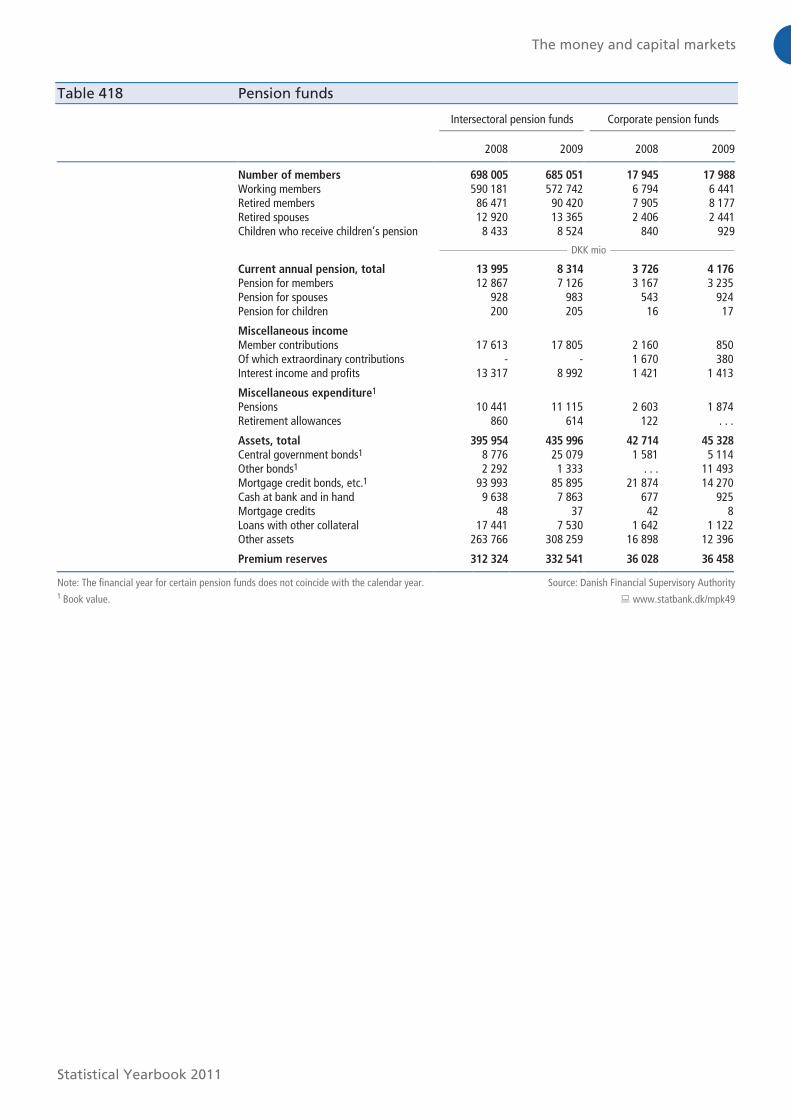
Table 418 Pension funds
Intersectoral pension funds Corporate pension funds
2008 2009 2008 2009
Number of members 698 005 685 051 17 945 17 988
Working members 590 181 572 742 6 794 6 441 Retired members 86 471 90 420 7 905 8 177 Retired spouses 12 920 13 365 2 406 2 441 Children who receive children’s pension 8 433 8 524 840 929
DKK mio
Current annual pension, total 13 995 8 314 3 726 4 176
Pension for members 12 867 7 126 3 167 3 235 Pension for spouses 928 983 543 924 Pension for children 200 205 16 17
Miscellaneous income
Member contributions 17 613 17 805 2 160 850 Of which extraordinary contributions - - 1 670 380 Interest income and profits 13 317 8 992 1 421 1 413
Miscellaneous expenditure1
Pensions 10 441 11 115 2 603 1 874 Retirement allowances 860 614 122 . . .
Assets, total 395 954 435 996 42 714 45 328
Central government bonds1 8 776 25 079 1 581 5 114 Other bonds1 2 292 1 333 . . . 11 493 Mortgage credit bonds, etc.1 93 993 85 895 21 874 14 270 Cash at bank and in hand 9 638 7 863 677 925 Mortgage credits 48 37 42 8 Loans with other collateral 17 441 7 530 1 642 1 122 Other assets 263 766 308 259 16 898 12 396
Premium reserves 312 324 332 541 36 028 36 458
Note: The financial year for certain pension funds does not coincide with the calendar year. 1 Book value.
Source: Danish Financial Supervisory Authority
� www.statbank.dk/mpk49
Microsoft Word − Table 418.docx (X:100.0%, Y:100.0%) Created by Grafikhuset Publi PDF.
The money and capital markets
Statistical Yearbook 2011
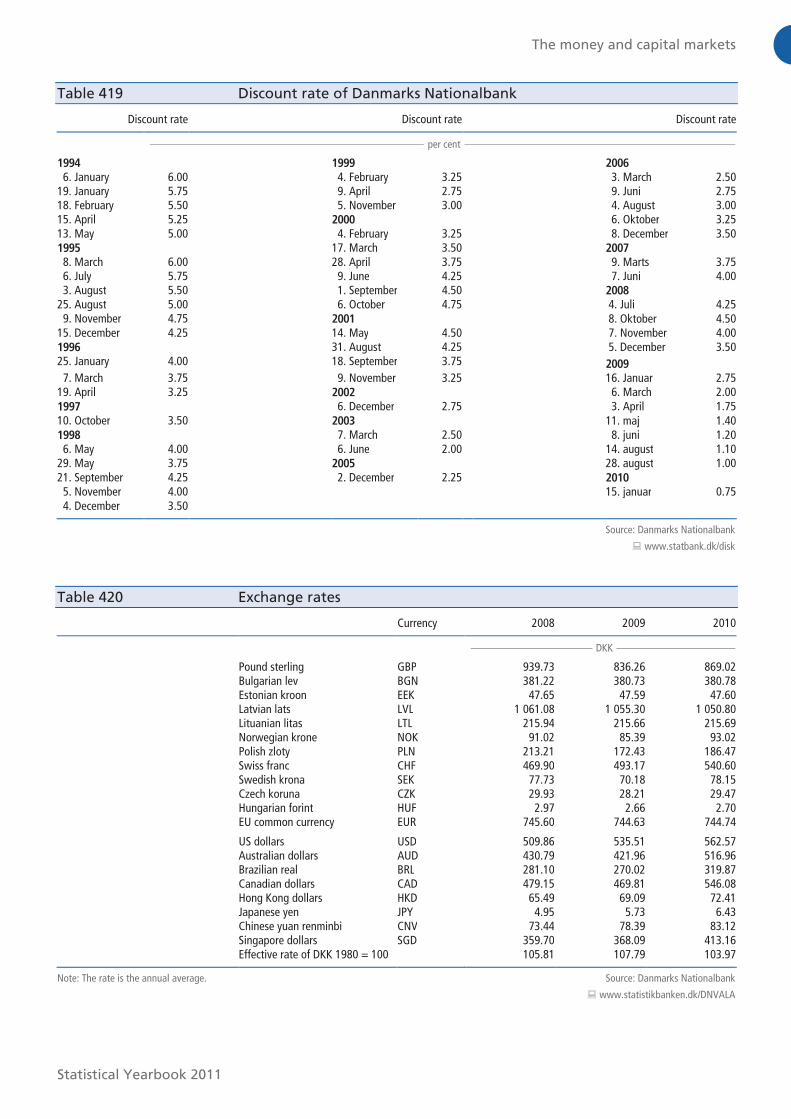
Table 419 Discount rate of Danmarks Nationalbank
Discount rate Discount rate Discount rate
per cent
1994 1999 2006 6. January 6.00 4. February 3.25 3. March 2.50 19. January 5.75 9. April 2.75 9. Juni 2.75 18. February 5.50 5. November 3.00 4. August 3.00 15. April 5.25 2000 6. Oktober 3.25 13. May 5.00 4. February 3.25 8. December 3.50 1995 17. March 3.50 2007 8. March 6.00 28. April 3.75 9. Marts 3.75 6. July 5.75 9. June 4.25 7. Juni 4.00 3. August 5.50 1. September 4.50 2008
25. August 5.00 6. October 4.75 4. Juli 4.25 9. November 4.75 2001 8. Oktober 4.50 15. December 4.25 14. May 4.50 7. November 4.00 1996 31. August 4.25 5. December 3.50 25. January 4.00 18. September 3.75 2009 7. March 3.75 9. November 3.25 16. Januar 2.75 19. April 3.25 2002 6. March 2.00 1997 6. December 2.75 3. April 1.75 10. October 3.50 2003 11. maj 1.40 1998 7. March 2.50 8. juni 1.20 6. May 4.00 6. June 2.00 14. august 1.10 29. May 3.75 2005 28. august 1.00 21. September 4.25 2. December 2.25 2010 5. November 4.00 15. januar 0.75 4. December 3.50
Source: Danmarks Nationalbank
� www.statbank.dk/disk
Table 420 Exchange rates
Currency 2008 2009 2010
DKK
Pound sterling GBP 939.73 836.26 869.02 Bulgarian lev BGN 381.22 380.73 380.78 Estonian kroon EEK 47.65 47.59 47.60 Latvian lats LVL 1 061.08 1 055.30 1 050.80 Lituanian litas LTL 215.94 215.66 215.69 Norwegian krone NOK 91.02 85.39 93.02 Polish zloty PLN 213.21 172.43 186.47 Swiss franc CHF 469.90 493.17 540.60 Swedish krona SEK 77.73 70.18 78.15 Czech koruna CZK 29.93 28.21 29.47 Hungarian forint HUF 2.97 2.66 2.70 EU common currency EUR 745.60 744.63 744.74
US dollars USD 509.86 535.51 562.57 Australian dollars AUD 430.79 421.96 516.96 Brazilian real BRL 281.10 270.02 319.87 Canadian dollars CAD 479.15 469.81 546.08 Hong Kong dollars HKD 65.49 69.09 72.41 Japanese yen JPY 4.95 5.73 6.43 Chinese yuan renminbi CNV 73.44 78.39 83.12 Singapore dollars SGD 359.70 368.09 413.16 Effective rate of DKK 1980 = 100 105.81 107.79 103.97
Note: The rate is the annual average. Source: Danmarks Nationalbank
� www.statistikbanken.dk/DNVALA
Microsoft Word − Table 419.docx (X:100.0%, Y:100.0%) Created by Grafikhuset Publi PDF.
The money and capital markets
Statistical Yearbook 2011
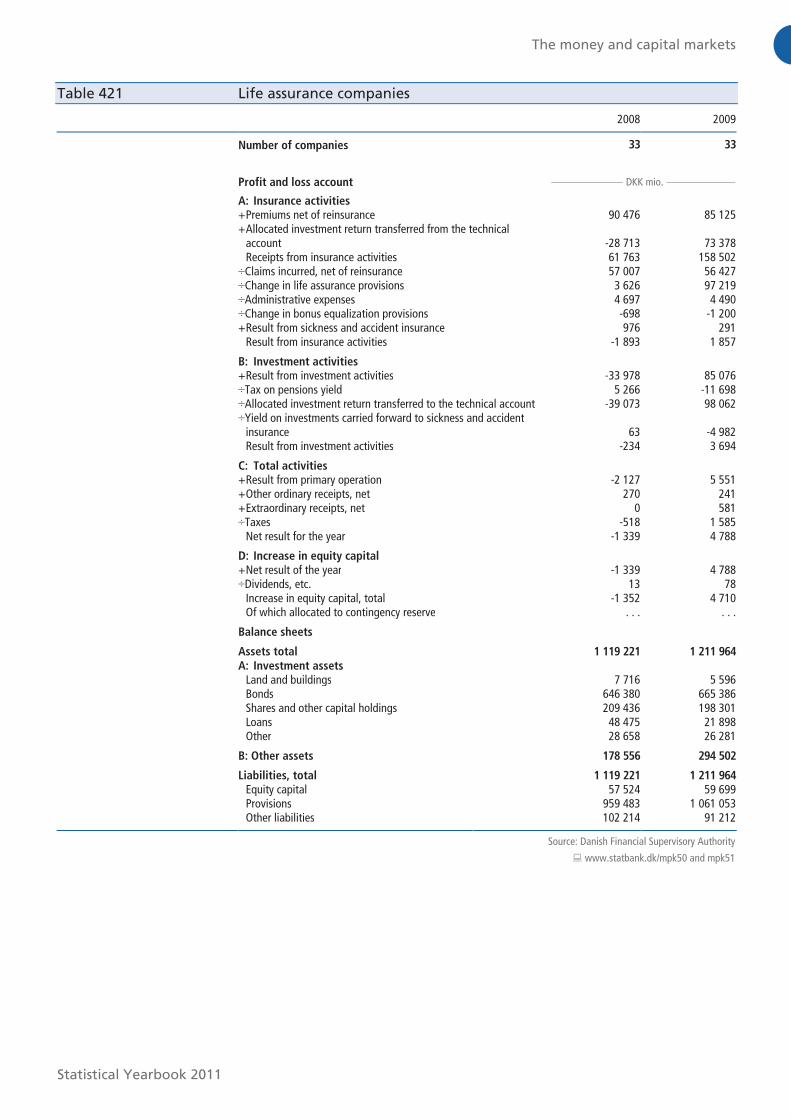
Table 421 Life assurance companies
2008 2009
Number of companies 33 33
Profit and loss account DKK mio.
A: Insurance activities
+ Premiums net of reinsurance 90 476 85 125 + Allocated investment return transferred from the technical
account -28 713 73 378 Receipts from insurance activities 61 763 158 502 ÷Claims incurred, net of reinsurance 57 007 56 427 ÷Change in life assurance provisions 3 626 97 219 ÷Administrative expenses 4 697 4 490 ÷Change in bonus equalization provisions -698 -1 200 + Result from sickness and accident insurance 976 291 Result from insurance activities -1 893 1 857
B: Investment activities
+ Result from investment activities -33 978 85 076 ÷Tax on pensions yield 5 266 -11 698 ÷Allocated investment return transferred to the technical account -39 073 98 062 ÷Yield on investments carried forward to sickness and accident
insurance 63 -4 982 Result from investment activities -234 3 694
C: Total activities
+ Result from primary operation -2 127 5 551 + Other ordinary receipts, net 270 241 + Extraordinary receipts, net 0 581 ÷Taxes -518 1 585 Net result for the year -1 339 4 788
D: Increase in equity capital
+ Net result of the year -1 339 4 788 ÷Dividends, etc. 13 78 Increase in equity capital, total -1 352 4 710 Of which allocated to contingency reserve . . . . . .
Balance sheets
Assets total 1 119 221 1 211 964
A: Investment assets
Land and buildings 7 716 5 596 Bonds 646 380 665 386 Shares and other capital holdings 209 436 198 301 Loans 48 475 21 898 Other 28 658 26 281
B: Other assets 178 556 294 502
Liabilities, total 1 119 221 1 211 964
Equity capital 57 524 59 699 Provisions 959 483 1 061 053 Other liabilities 102 214 91 212
Source: Danish Financial Supervisory Authority
� www.statbank.dk/mpk50 and mpk51
Microsoft Word − Table 421.docx (X:100.0%, Y:100.0%) Created by Grafikhuset Publi PDF.
The money and capital markets
Statistical Yearbook 2011
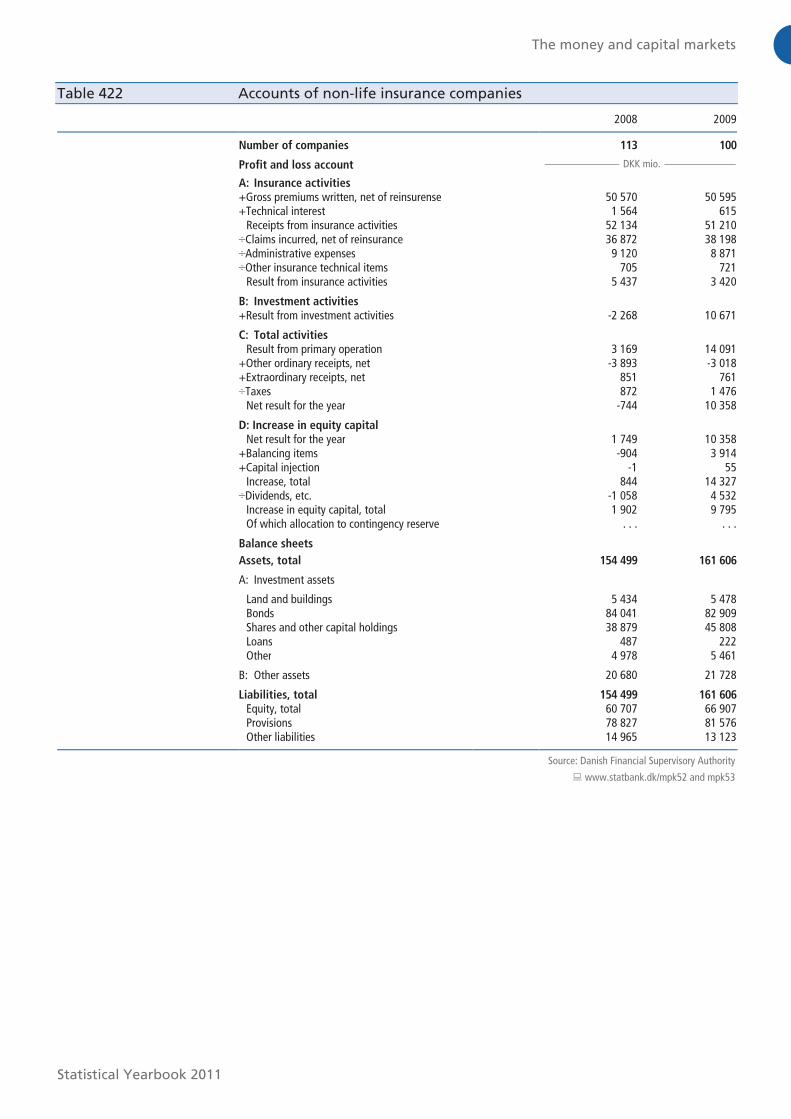
Table 422 Accounts of non-life insurance companies
2008 2009
Number of companies 113 100
Profit and loss account DKK mio.
A: Insurance activities
+Gross premiums written, net of reinsurense 50 570 50 595 +Technical interest 1 564 615 Receipts from insurance activities 52 134 51 210 ÷Claims incurred, net of reinsurance 36 872 38 198 ÷Administrative expenses 9 120 8 871 ÷Other insurance technical items 705 721 Result from insurance activities 5 437 3 420
B: Investment activities +Result from investment activities -2 268 10 671
C: Total activities Result from primary operation 3 169 14 091 +Other ordinary receipts, net -3 893 -3 018 +Extraordinary receipts, net 851 761 ÷Taxes 872 1 476 Net result for the year -744 10 358
D: Increase in equity capital Net result for the year 1 749 10 358 +Balancing items -904 3 914 +Capital injection -1 55 Increase, total 844 14 327 ÷Dividends, etc. -1 058 4 532 Increase in equity capital, total 1 902 9 795 Of which allocation to contingency reserve . . . . . .
Balance sheets Assets, total 154 499 161 606
A: Investment assets Land and buildings 5 434 5 478 Bonds 84 041 82 909 Shares and other capital holdings 38 879 45 808 Loans 487 222 Other 4 978 5 461
B: Other assets 20 680 21 728
Liabilities, total 154 499 161 606
Equity, total 60 707 66 907 Provisions 78 827 81 576 Other liabilities 14 965 13 123
Source: Danish Financial Supervisory Authority
� www.statbank.dk/mpk52 and mpk53
Microsoft Word − Table 422.docx (X:100.0%, Y:100.0%) Created by Grafikhuset Publi PDF.
The money and capital markets
Statistical Yearbook 2011
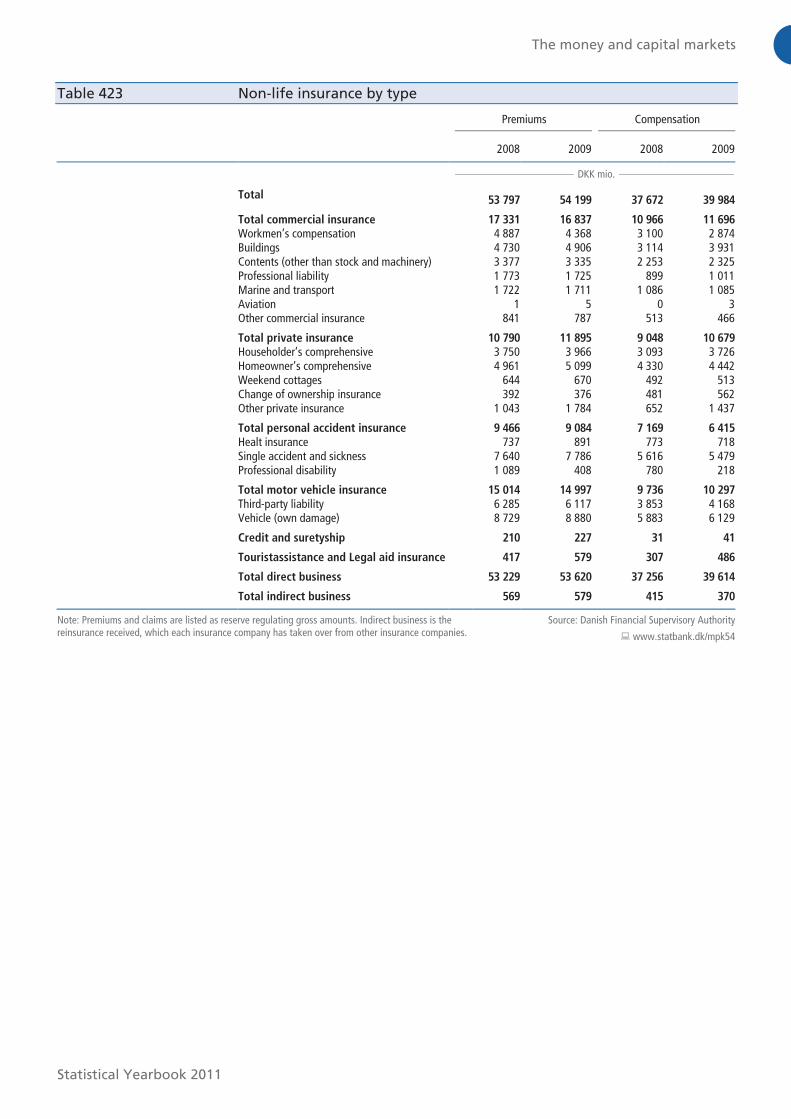
Table 423 Non-life insurance by type
Premiums Compensation
2008 2009 2008 2009
DKK mio.
Total
53 797 54 199 37 672 39 984
Total commercial insurance 17 331 16 837 10 966 11 696
Workmen’s compensation 4 887 4 368 3 100 2 874 Buildings 4 730 4 906 3 114 3 931 Contents (other than stock and machinery) 3 377 3 335 2 253 2 325 Professional liability 1 773 1 725 899 1 011 Marine and transport 1 722 1 711 1 086 1 085 Aviation 1 5 0 3 Other commercial insurance 841 787 513 466
Total private insurance 10 790 11 895 9 048 10 679
Householder’s comprehensive 3 750 3 966 3 093 3 726 Homeowner’s comprehensive 4 961 5 099 4 330 4 442 Weekend cottages 644 670 492 513 Change of ownership insurance 392 376 481 562 Other private insurance 1 043 1 784 652 1 437
Total personal accident insurance 9 466 9 084 7 169 6 415
Healt insurance 737 891 773 718 Single accident and sickness 7 640 7 786 5 616 5 479 Professional disability 1 089 408 780 218
Total motor vehicle insurance 15 014 14 997 9 736 10 297
Third-party liability 6 285 6 117 3 853 4 168 Vehicle (own damage) 8 729 8 880 5 883 6 129
Credit and suretyship 210 227 31 41
Touristassistance and Legal aid insurance 417 579 307 486
Total direct business 53 229 53 620 37 256 39 614
Total indirect business 569 579 415 370
Note: Premiums and claims are listed as reserve regulating gross amounts. Indirect business is the reinsurance received, which each insurance company has taken over from other insurance companies.
Source: Danish Financial Supervisory Authority
� www.statbank.dk/mpk54
Microsoft Word − Table 423.docx (X:100.0%, Y:100.0%) Created by Grafikhuset Publi PDF.
Recommended