THE LOW COST MICROWAVE RAIN SENSOR:
STATE CERTIFICATION AND IMPLEMENTATION ON THE OBSERVATIONAL NET.
A.V.Koldaev, A.I.Gusev, D.A.Konovalov.
Central Aerological Observatory, Federal Service of Russia for Hydrometerology
and Environmental Monitoring, 3 Pervomayskaya str., Dolgoprudny,
Moscow region, 141700 Russia
Tel./Fax: (7)(495)408 7758; e-mail: [email protected]
ABSTRACT
The low cost rain sensor based on measurements of reflectivity of the drops and their
Doppler velocities was developed. The main feature of the rain sensor is in microwave
transmitting-receiving module: it is a part of multiply industrially produced microwave security
alarm. For that reason the price of the main microwave component is very low, and the total price
of the device is twice cheaper then all analogs. The module operates at frequency 10.6GHz in
continuous mode. The microwave energy is generated by Gunn diode, reflected by the rain drops
and received by mixing diode. The mixing diode output is digitized and fast Furies processing is
made by specially pre-programmed processor which is part of the device. On the base of obtained
Doppler spectra of the falling drops, the rain drop size distribution (DSD) is calculated. On the base
of DSD, which is updated each 10 min, all rain parameters as intensity, accumulation, all
momentum of the spectra are calculated in real time. To introduce the new rain sensor on the
observation net of State Hydro Meteorological Service of Russian Federation, the certification and
inter comparisons with the recent sensors are required. Such comparisons were made with
Russian State Etalon for precipitation measurements, which is located on precipitation polygon
near Valday Lake (400km north from Moscow). The comparisons were conducted within two
summer seasons 2004-2005. As a result the Russian State certificate was obtained in May 2006
and the device is included in Russian State Register of tools for measurements. The procedure of
comparisons, algorithms of data processing, and results of it are presented in the current report.
Introduction The low cost rain sensor (LCR-11) based on measurements of reflectivity of the drops and
their Doppler velocities was developed within 2002-2003 (Koldaev at al, 2005). This development
was the alternative for the old accumulation type precipitation gages as O-1 (Tretyakov) or P-2.
Both these gages were the basic systems in former USSR and are still the same in Russia till now.
It is obvious, that current needs in operative information in rain intensity can not be fulfilled with the
accumulative devices, where data collection is performed manually and just twice per day. The
common view of all three devices is presented at the Fig.1
2
a) b) c)
Fig.1 Tretyakov precipitation gage (a), P-2 (b) , LCR-11 (c)
From the other hand, LCR-11 is able to transmit the data about rain intensity each 1 minute
with the standard rate of information update each 10 min. In this sense, the replacement of the old
rain observational net with the new absolutely unmanned automatic sensors like LCR-11, is not
questionable at all. But the problem is in a long term series of observations for precipitation regime
in thousands sites of Russian territory. All the models, as well as floating prediction algorithms are
based on the many decades measurements with the usage of O-1 or P-2 rain gages. For this
reason the basic step use to be made before implementation of the new instruments on the
observational net of such a big country like Russia. This step is State certification of the device with
the use of State Etalon for precipitation measurements.
The procedure of certification is exactly the same as for O-1 and for P-2. It includes parallel
measurements with the Etalon and with the device under comparisons. The statistically valuable
data sets use to be obtained for 4(four) intervals of accumulated rain within 12 hours. These
intervals are 0.1-0.5mm, 0.5-1.0mm, 1.0-10.0mm,10.0-200.0mm. Of course, it depends on the
each individual summer season, and in average about 4 summer season is required to provide
enough statistical material. In our case, we were lucky, that two consequent seasons of summer
2004 and summer 2005 were very wet at the experimental site, so enough statistics was achieved.
The procedure of measurements, data processing algorithms and the results are presented below.
Principle of operation and features of construction Theoretical background for the liquid precipitation measurements with the use of LCR-11
was described in the (Koldaev at al, 2005). Principle of measurements is based on the fact that
rain drops falling speed is in a definite relation with their size. It means that Doppler spectra of the
radio signal reflected by the rain in nadir direction can be definitely converted into drop size
distribution (DSD). As soon the drop size distribution is known, the number of drops within any time
period can be calculated by using measured radar reflectivity. The radar reflectivity is direct
proportional to the production of 6(six) moment of DSD and number of drops within the measured
volume.
The main feature of the rain sensor is in microwave transmitting-receiving module: it is a part
of multiply industrially produced microwave security alarm. For that reason the price of the main
3
microwave component is very low, and the total price of the device is twice cheaper then all
analogs. The module operates at frequency 10.6GHz in continuous mode. This frequency was
chosen specially to provide Relay Law of back scattering: if the frequency would be higher, then
the biggest drops will scatter radio waves according to Mee Law and radar reflectivity will not be a
linear with number of drops.
The microwave energy is generated by Gunn diode, reflected by the rain drops and received
by mixing diode. The mixing diode output is digitized and fast Furies processing is made by
specially pre-programmed processor which is a part of the device. On the base of obtained
Doppler spectra of the falling drops, the rain drop size distribution is calculated. On the base of
DSD, which is updated each 10 min, all rain parameters as intensity, accumulation, all momentum
of the spectra are calculated in real time.
The second feature of the device is in the fact that transmitting and receiving horn antenna is
the same horn. Such a solution allows us to minimize overall dimensions of the device. But the
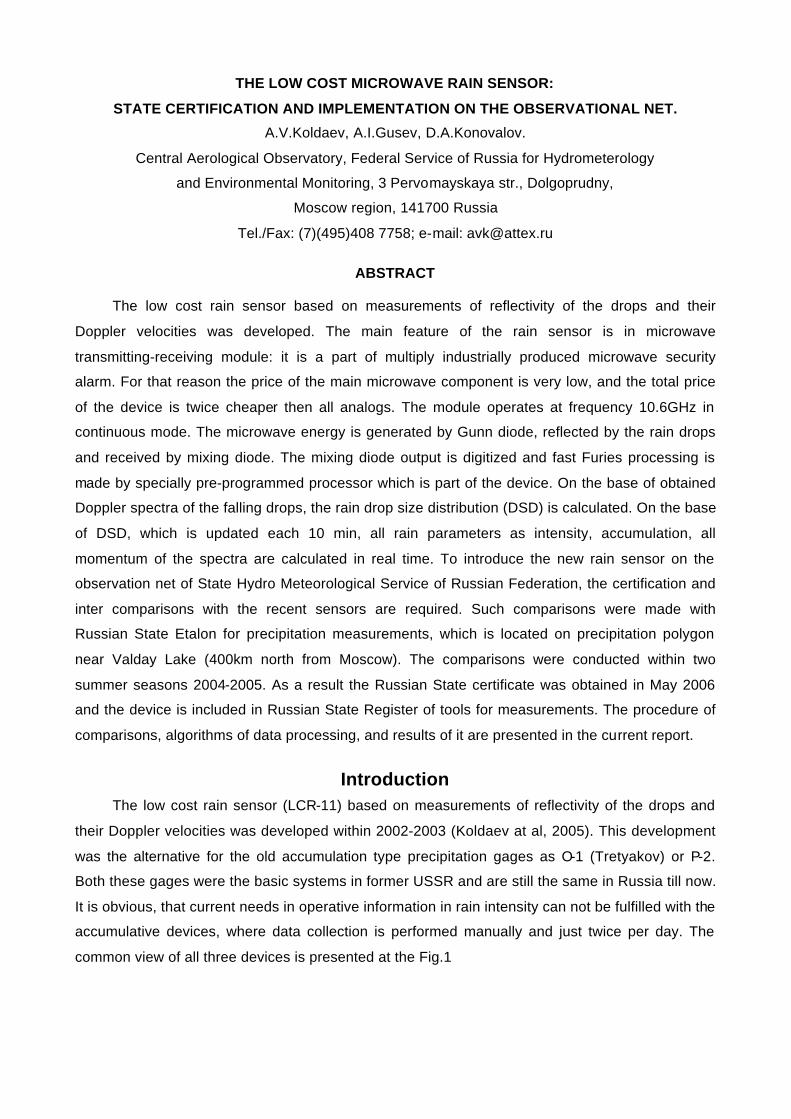
antenna pattern is still sufficiently wider then it use to be. The problem is in the fact that horizontal
drop speed, which is always exist due to wind, has the projection on the direction of radio wave
propagation (see Fig.2) If so, the Doppler spectra measured by the device will be disturbed by the
horizontal wind and huge errors can be expected for heavy rain with thunderstorm activity. To
minimize these errors the antenna pattern use to be as narrow as possible.
α
VH VH
VgVg
V = cosD1 g HV V sinα− α V =V cos V sinD2 g Hα+ α
VH
Vg Vg
α
VH
Sinα−>0V =VD1 D2
a) b)
Fig.2 Influence of horizontal wind due to antenna pattern: (a) –common case; (b) intersection
of antenna patterns in case of LCR-11.
Only two ways are known to get narrow antenna beam: or you have to use higher frequency
of radio waves, or just increase the geometrical sizes of the antenna. Higher frequency is not the
way in our case because of retrieving principle described above. Increasing of the antenna size
means increasing the final cost of the device , what is opposite the main goal of all development.
4
In this complicated situation we have sacrificed by the energy optimization in favor of narrow
antenna beam. The point is that transmitting and receiving sections of waveguide are in a different
phase centers while they are working via the same horn antenna. It means that transmitting and
receiving antenna patterns will be different with the narrow joint area of intersection. Due to such
construction, the big portion of the transmitted energy will not be received by receiver, but the
resulted antenna pattern (intersected one) will be much narrow then the separate transmitting and
receiving patterns.
Field comparisons As it was mentioned above, the main job is in certification and inter comparisons with the
recent sensors. Otherwise the introduction of a new rain sensor on the observation net of State
Hydro Meteorological Service of Russian Federation is just impossible. Thus the certification
procedure was carried out at State Hydrological Experimental Site (HES), which is located at
Valday Lake, Novgorod Reg. (400km to North from Moscow).
StateEtalon
1
23
45
6
7
8
9
10
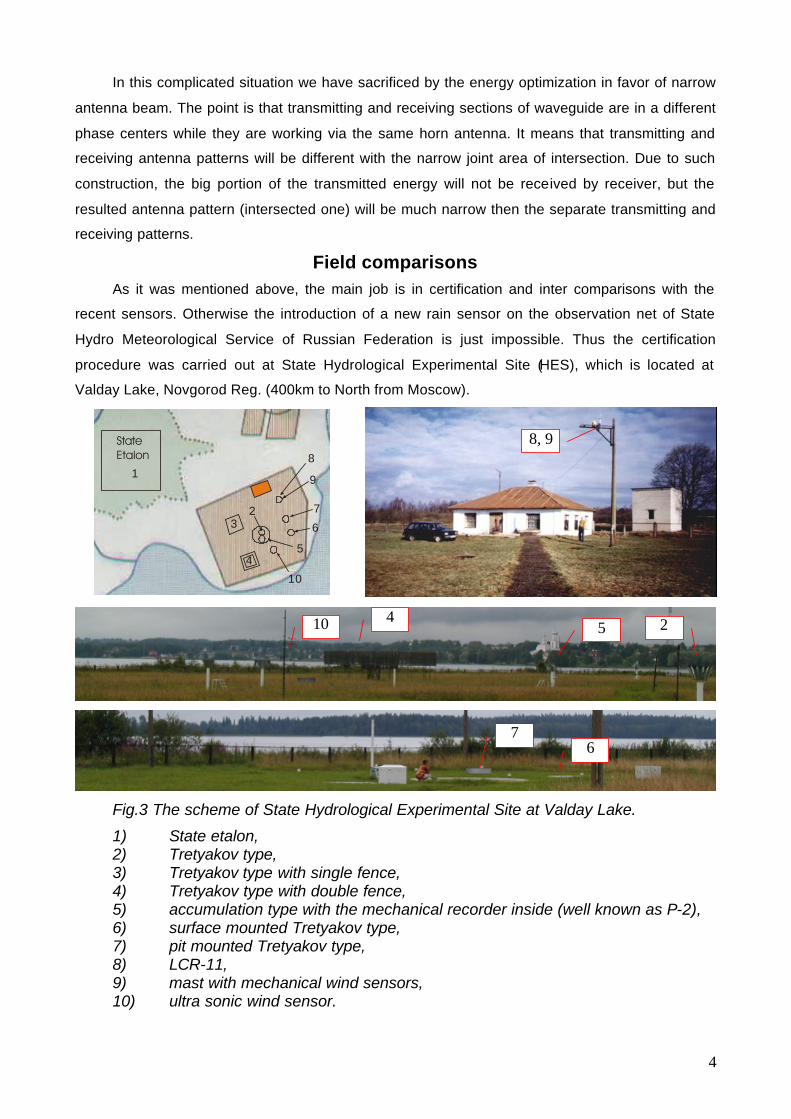
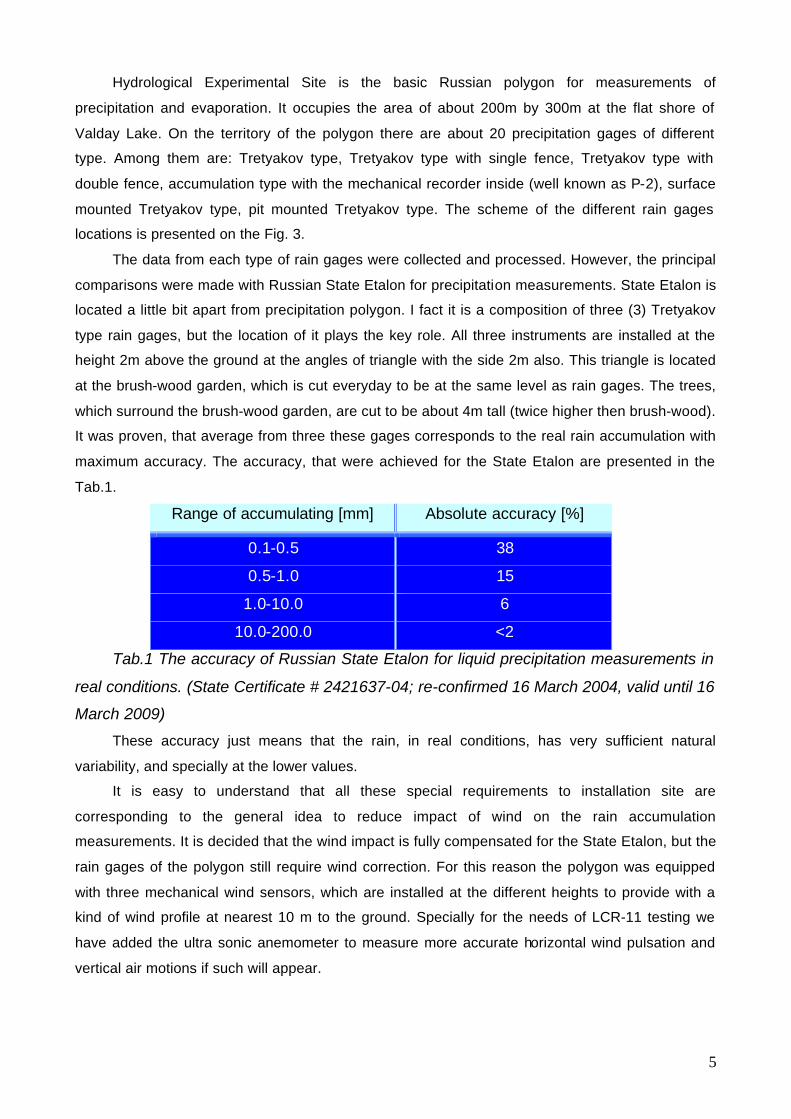
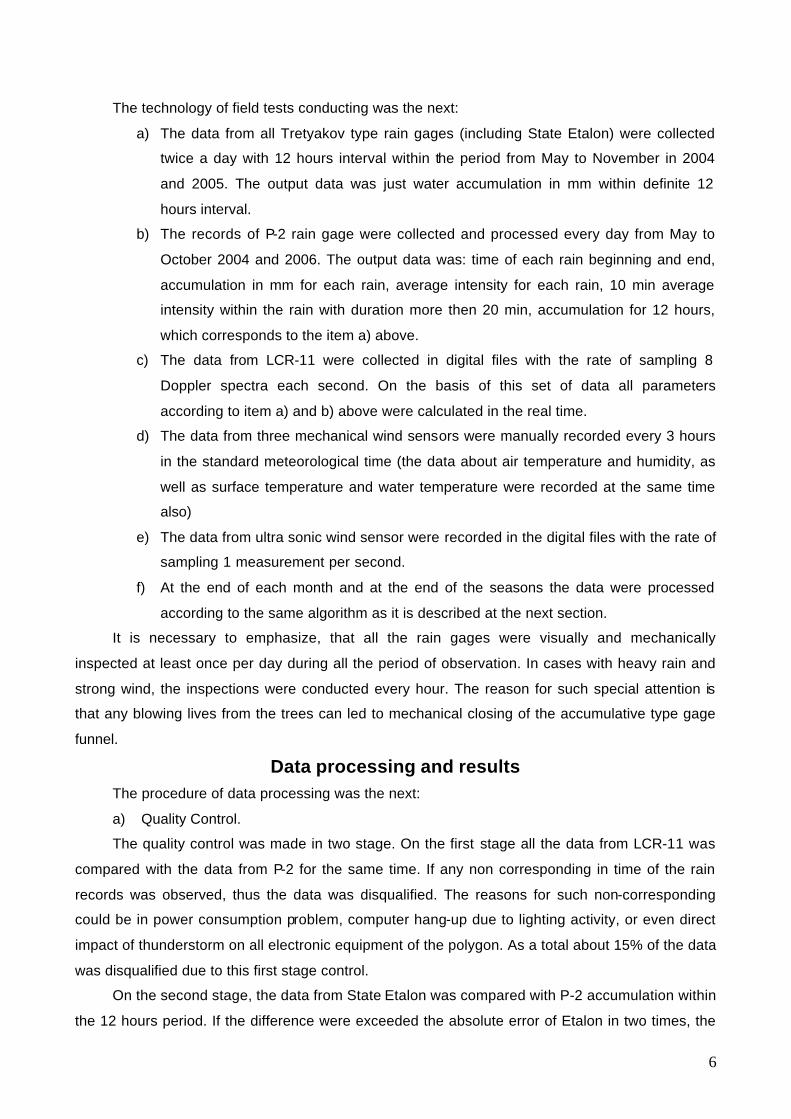
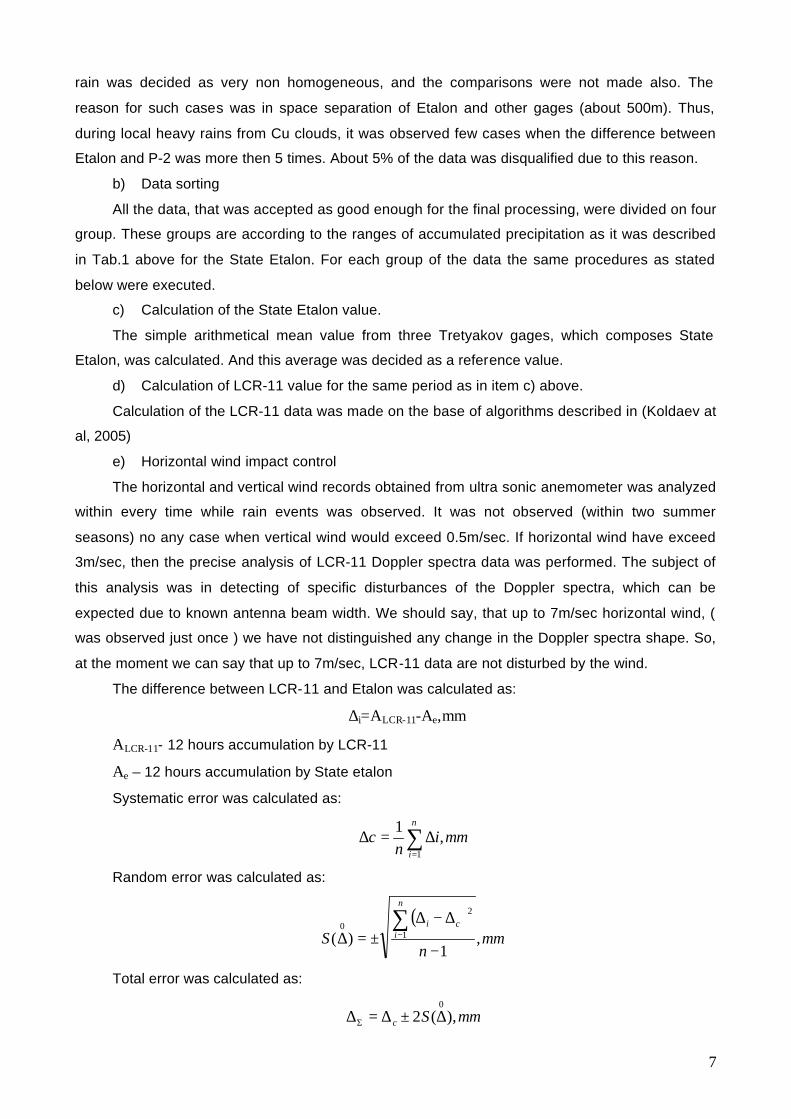
Fig.3 The scheme of State Hydrological Experimental Site at Valday Lake.
1) State etalon, 2) Tretyakov type, 3) Tretyakov type with single fence, 4) Tretyakov type with double fence, 5) accumulation type with the mechanical recorder inside (well known as P-2), 6) surface mounted Tretyakov type, 7) pit mounted Tretyakov type, 8) LCR-11, 9) mast with mechanical wind sensors, 10) ultra sonic wind sensor.
8, 9
10 4 5
7 6
2
5
Hydrological Experimental Site is the basic Russian polygon for measurements of
precipitation and evaporation. It occupies the area of about 200m by 300m at the flat shore of
Valday Lake. On the territory of the polygon there are about 20 precipitation gages of different
type. Among them are: Tretyakov type, Tretyakov type with single fence, Tretyakov type with
double fence, accumulation type with the mechanical recorder inside (well known as P-2), surface
mounted Tretyakov type, pit mounted Tretyakov type. The scheme of the different rain gages
locations is presented on the Fig. 3.
The data from each type of rain gages were collected and processed. However, the principal
comparisons were made with Russian State Etalon for precipitation measurements. State Etalon is
located a little bit apart from precipitation polygon. I fact it is a composition of three (3) Tretyakov
type rain gages, but the location of it plays the key role. All three instruments are installed at the
height 2m above the ground at the angles of triangle with the side 2m also. This triangle is located
at the brush-wood garden, which is cut everyday to be at the same level as rain gages. The trees,
which surround the brush-wood garden, are cut to be about 4m tall (twice higher then brush-wood).
It was proven, that average from three these gages corresponds to the real rain accumulation with
maximum accuracy. The accuracy, that were achieved for the State Etalon are presented in the
Tab.1.
Range of accumulating [mm] Absolute accuracy [%]
0.1-0.5 38
0.5-1.0 15
1.0-10.0 6
10.0-200.0 <2
Tab.1 The accuracy of Russian State Etalon for liquid precipitation measurements in
real conditions. (State Certificate # 2421637-04; re-confirmed 16 March 2004, valid until 16
March 2009)
These accuracy just means that the rain, in real conditions, has very sufficient natural
variability, and specially at the lower values.
It is easy to understand that all these special requirements to installation site are
corresponding to the general idea to reduce impact of wind on the rain accumulation
measurements. It is decided that the wind impact is fully compensated for the State Etalon, but the
rain gages of the polygon still require wind correction. For this reason the polygon was equipped
with three mechanical wind sensors, which are installed at the different heights to provide with a
kind of wind profile at nearest 10 m to the ground. Specially for the needs of LCR-11 testing we
have added the ultra sonic anemometer to measure more accurate horizontal wind pulsation and
vertical air motions if such will appear.
6
The technology of field tests conducting was the next:
a) The data from all Tretyakov type rain gages (including State Etalon) were collected
twice a day with 12 hours interval within the period from May to November in 2004
and 2005. The output data was just water accumulation in mm within definite 12
hours interval.
b) The records of P-2 rain gage were collected and processed every day from May to
October 2004 and 2006. The output data was: time of each rain beginning and end,
accumulation in mm for each rain, average intensity for each rain, 10 min average
intensity within the rain with duration more then 20 min, accumulation for 12 hours,
which corresponds to the item a) above.
c) The data from LCR-11 were collected in digital files with the rate of sampling 8
Doppler spectra each second. On the basis of this set of data all parameters
according to item a) and b) above were calculated in the real time.
d) The data from three mechanical wind sensors were manually recorded every 3 hours
in the standard meteorological time (the data about air temperature and humidity, as
well as surface temperature and water temperature were recorded at the same time
also)
e) The data from ultra sonic wind sensor were recorded in the digital files with the rate of
sampling 1 measurement per second.
f) At the end of each month and at the end of the seasons the data were processed
according to the same algorithm as it is described at the next section.
It is necessary to emphasize, that all the rain gages were visually and mechanically
inspected at least once per day during all the period of observation. In cases with heavy rain and
strong wind, the inspections were conducted every hour. The reason for such special attention is
that any blowing lives from the trees can led to mechanical closing of the accumulative type gage
funnel.
Data processing and results The procedure of data processing was the next:
a) Quality Control.
The quality control was made in two stage. On the first stage all the data from LCR-11 was
compared with the data from P-2 for the same time. If any non corresponding in time of the rain
records was observed, thus the data was disqualified. The reasons for such non-corresponding
could be in power consumption problem, computer hang-up due to lighting activity, or even direct
impact of thunderstorm on all electronic equipment of the polygon. As a total about 15% of the data
was disqualified due to this first stage control.
On the second stage, the data from State Etalon was compared with P-2 accumulation within
the 12 hours period. If the difference were exceeded the absolute error of Etalon in two times, the
7
rain was decided as very non homogeneous, and the comparisons were not made also. The
reason for such cases was in space separation of Etalon and other gages (about 500m). Thus,
during local heavy rains from Cu clouds, it was observed few cases when the difference between
Etalon and P-2 was more then 5 times. About 5% of the data was disqualified due to this reason.
b) Data sorting
All the data, that was accepted as good enough for the final processing, were divided on four
group. These groups are according to the ranges of accumulated precipitation as it was described
in Tab.1 above for the State Etalon. For each group of the data the same procedures as stated
below were executed.
c) Calculation of the State Etalon value.
The simple arithmetical mean value from three Tretyakov gages, which composes State
Etalon, was calculated. And this average was decided as a reference value.
d) Calculation of LCR-11 value for the same period as in item c) above.
Calculation of the LCR-11 data was made on the base of algorithms described in (Koldaev at
al, 2005)
e) Horizontal wind impact control
The horizontal and vertical wind records obtained from ultra sonic anemometer was analyzed
within every time while rain events was observed. It was not observed (within two summer
seasons) no any case when vertical wind would exceed 0.5m/sec. If horizontal wind have exceed
3m/sec, then the precise analysis of LCR-11 Doppler spectra data was performed. The subject of
this analysis was in detecting of specific disturbances of the Doppler spectra, which can be
expected due to known antenna beam width. We should say, that up to 7m/sec horizontal wind, (
was observed just once ) we have not distinguished any change in the Doppler spectra shape. So,
at the moment we can say that up to 7m/sec, LCR-11 data are not disturbed by the wind.
The difference between LCR-11 and Etalon was calculated as:
∆i=ALCR-11-Ae,mm
ALCR-11- 12 hours accumulation by LCR-11
Ae – 12 hours accumulation by State etalon
Systematic error was calculated as:
∑=
∆=∆n
i
mmin
c1
,1
Random error was calculated as:
( )mm
nS
n
ici
,1
)( 1
2
0
−
∆−∆±=∆
∑−
Total error was calculated as:
mmSc ),(20
∆±∆=∆Σ
8
Relative error was calculated as:
%100i
i AΣ∆
=σ
Absolute error was calculated as:
21
211 σσσ +=− eLCR
The same procedure was preformed for the data obtained from Tretyakov double fence rain
gage and the data of the absolute errors are presented at the Tab.2 together with LCR-11 absolute
accuracy.
Range of accumulating [mm] Absolute accuracy
LCR-11 [%]
Absolute accuracy Tretiakov
double fence [%]
0.1-1.0 63 79
1.0-10.0 27 26
10.0-200.0 3 8
Tab.2 Absolute accuracy of LCR-11 and Tretyakov rain gage in real conditions for four rain
accumulation ranges with respect to State Etalon.
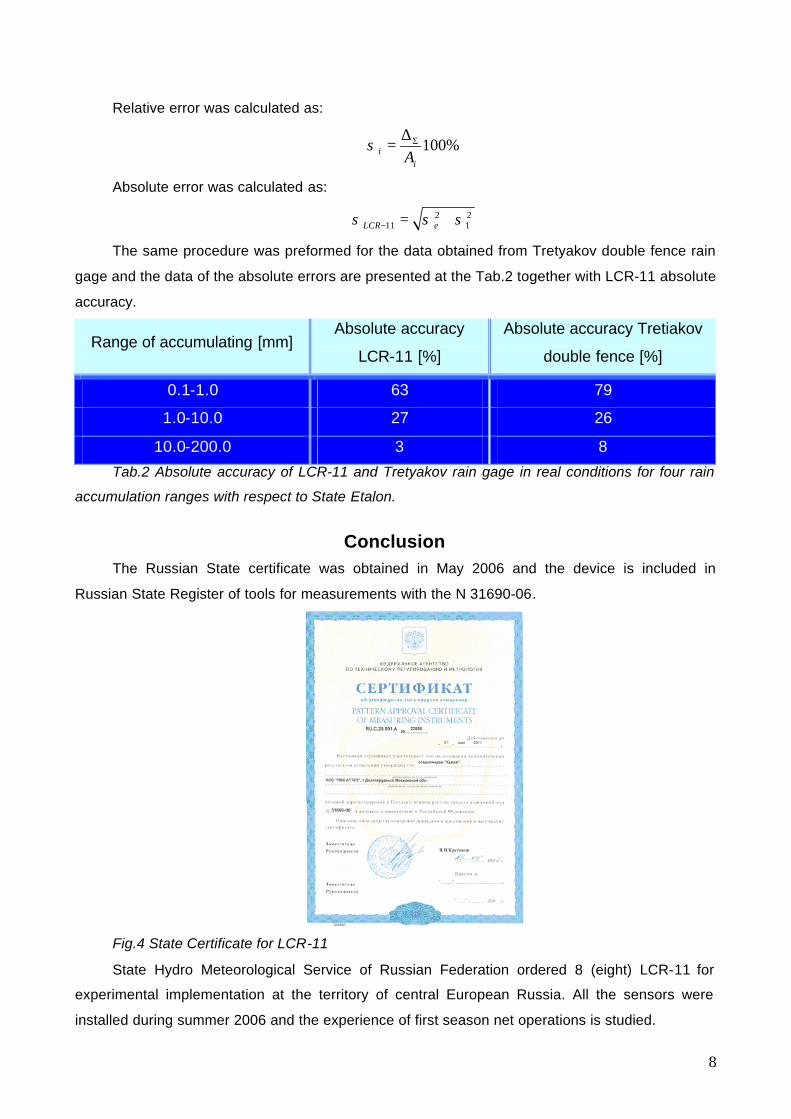
Conclusion The Russian State certificate was obtained in May 2006 and the device is included in
Russian State Register of tools for measurements with the N 31690-06.
Fig.4 State Certificate for LCR-11
State Hydro Meteorological Service of Russian Federation ordered 8 (eight) LCR-11 for
experimental implementation at the territory of central European Russia. All the sensors were
installed during summer 2006 and the experience of first season net operations is studied.

9
Acknowledgments All this work would not be possible at all without the high qualified staff of “Atmospheric
Technology” (ATTEX) company. It is our pleasure to thanks specially Alexi Kutarov, Evgeny Miller
and Tatiana Gubina, who invested a lot of personal efforts in this not simple two year experimental
stage. Implementation of LCR-11 to observation net of Russian Federation is direct result of their
job.
Reference: A.Koldaev, A.Kutarov, D.Konovalov, A.Mironov. 2005 The Low Cost Radio Frequency Rain
Meter. WMO/TD-No. 1265 Proc. Of TECO-2005, Bucharest.
Recommended


![rain[e] WEIGHING PRECIPITATION SENSOR](https://img.pdfslide.us/doc/110x75/61d3a6c570d2a1285014bbcb/raine-weighing-precipitation-sensor.jpg)