Department of Economics, University of Maryland, Baltimore County, 1000 Hilltop†
Circle, Baltimore, MD 21250, (410) 455-3243 (office), [email protected]
Department of Economics, University of Maryland, Baltimore County, 1000 Hilltop††
Circle, Baltimore, MD 21250, [email protected]
Working Paper Series, Paper No. 08-06
The Length and Success of NBA Careers:
Does College Production Predict Professional Outcomes?
Dennis Coates and Babatunde Oguntimein† ††
August 2008
Abstract
This paper uses data on players drafted in 1987 through 1989 covering both theircollegiate and their professional careers. This time period is chosen because we wanted recentplayers whose playing days have ended. Our analysis evaluates the role of college productivityon draft position and the relationship between college career productivity, measured in threedifferent ways, with professional career productivity measured similarly and with the length ofthe career. At issue is the effectiveness of NBA executives in identifying college players whowill be successful in the pros. Our results suggest an interesting puzzle regarding scoring. TheNBA literature suggests scoring is paramount for evaluating professional players, while ourresults suggest college scoring has little to do with draft position and is relatively weaklyassociated with professional scoring.
JEL Classification Codes: L83
Keywords: basketball, sports
Paper presented at the North American Association of Sports Economists sessions that were heldat the meetings of the Western Economic Association in Honolulu, Hawaii from June 29 to July3, 2008.

2
Can professional sports franchises identify quality players based on the information
available to them prior to a draft? Do the attributes that determine draft position also indicate
career success? Do those attributes imply something about what the drafting teams value and are
they the same attributes that professional teams compensate highly? At the heart of these
questions is an important issue in all of economics: Are economic decision makers rational? The
answer to this question is, of course, key to understanding the efficiency properties of the player
labor market. In this paper we use various college performance statistics to address each of these
questions. Our focus is on basketball, in part because basketball is our favorite sport, and in part
because the statistical measures of individual production are cleaner in basketball than in football,
and are far more available and comparable across players at the pre-draft level for basketball than
for baseball.
A variety of papers have addressed the effectiveness of teams to select quality players
during the annual amateur drafts held by professional sports leagues. The Major League Baseball
draft is studied by Spurr (2000), the National Football League draft by Hendricks, DeBrock and
Koenker (2003), Massey and Thaler (2006), and Boulier, Stekler, Coburn, and Rankins (2004).
Studies of the NBA draft are Staw and Hoang (1995), Camerer and Weber (1999), and Groothuis,
Hill and Perri (2007a, 2007b).
Hendricks, DeBrock and Koenker (2003) use the NFL draft to assess the way in which
signals about uncertain productivity influence hiring decisions. They argue that uncertainty
influences the decision in two ways, via statistical discrimination, in which a highly inefficient
signal about future productivity puts one group at a disadvantage, or via option value, in which
firms give members of the riskier group a probationary period in which to demonstrate their
productivity. They find support for both statistical discrimination and option value effects in the
NFL draft. Players taken early in the draft from less-visible college football programs tend to
have better careers than their counterparts from the highly regarded programs. Comparing two

3
players, early in the draft the NFL teams favor the one from the more highly ranked college
program. Later in the draft, players from the higher ranked programs are undervalued, suggesting
an option value explanation. The authors note that the NFL has an enormous amount of
information about the players, which should make systematic errors in hiring less likely. Their
evidence indicates that despite all this information, systematic errors are common.
Massey and Thaler (2006) also examine the NFL draft. The question they ask is whether
NFL franchises accurately value draft position. They begin be assessing the value of one draft
pick relative to another by using draft day trades of higher draft picks for lower ones. They find
that the relative value of draft picks drops off very quickly and that future draft picks are
discounted at extremely high rates. Following this, they evaluate the performance of players
drafted at different positions using a variety of measures of performance. They find that
performance does not drop nearly so steeply with draft position as does the value of draft position
relative to the top draft position. They find that high picks are overvalued, costing both a large
number of lower draft choices and a high salary, neither of which corresponds well with the added
performance from those positions.
In their study of the NBA draft, Staw and Hoang (1995) assess the draft position of a
player and that position’s relation to playing time and survival in the league. Their analysis is a
test of whether and how people respond to sunk costs, in this case the use of a high draft pick and
the money to sign that player to a contract. Their evidence is that franchises are more likely to
stick with high draft choices longer than low draft choices, even after controlling for productivity,
an activity described as escalation of commitment. One of their questions is specifically whether
draft position determines career length. Their data set covers a subset of players from the 1980
through 1986 drafts and follows them through the 1990-91 season. The players must have been
drafted in one of the first two rounds and stayed in the league for one year or more. When their

4
data end in 1991, 91 players drafted in the first two rounds between 1980 and 1986 are still
playing in the NBA.
Camerer and Weber (1999) also address the issue of escalation of commitment. Their
concern is that Staw and Hoang did not rule out alternative explanations for the apparent
escalation of commitment to early draft choices. For example, Camerer and Weber suggest that
the productivity of alternative players may be worse still than the drafted player, in which case it
would be rational to stick with the draftee. Using a different sample, from more recent seasons,
but following the Staw and Hoang methodology, Camerer and Weber replicate the Staw and
Hoang results. They then address other explanations for the persistence of draft position on
playing time and productivity. They conclude that their tests reduce the magnitude of the
escalation but that escalation persists.
Spurr (2000) examined the MLB draft for the ability of baseball clubs to identify talent.
The MLB draft is different from the NFL and NBA drafts in three important respects. First, the
MLB draft includes players right out of high school and, in fact, has only evolved toward
predominance of college players in the last 20 years, whereas draft of high school players is not
allowed in the NFL and has only recently become common in the NBA. Second, the MLB draft
continues for far more rounds than either the NFL or NBA drafts. Currently, the MLB draft stops
at 50 rounds, but it had been unlimited until 19XX. The NFL draft currently last seven rounds,
down from 12 as recently as 19XX, and the NBA draft is now limited to two rounds, down from 7
in 1987. His results showed that the probability of making the major leagues declines with draft
position. His analysis also focuses on player background, whether drafted out of high school,
community college, or a four year college, player position, and drafting club. His results do not
indicate any general effects of drafting club on the likelihood of making the majors, but he does
find that college players have a higher probability of making the majors than do those drafted out
of high school.

5
Groothuis, Hill, and Perri (2007b) study NBA performance for players between the 1987-
88 and 2003-2004 seasons to evaluate the ability of teams to identify superstar players. They
identify players whose NBA efficiency is more than three standard deviations above the mean
efficiency for a given year. Few players ever achieve this and fewer still achieve it multiple times.
In any given year, between 12 and 22 players have an efficiency greater than two standard
deviations above the mean. Groothuis, Hill, and Perri estimate a random effects model in which a
player’s efficiency is a function of his draft position, experience and experience squared, height
and weight, years of college, and race. They find that draft position is negatively related to NBA
efficiency in a given year. Among their explanatory variables, only height and weight are not
statistically significant.
Academic literature has also addressed the efficiency of the players labor market by
relating compensation to performance. We do not review this vast literature but focus on those
studies related to basketball and to our basic question. Staw and Hoang (1995) and Berri, Brook,
and Schmidt (2007) found that points scored is a, or the, dominant factor in assessing NBA player
productivity. Staw and Hoang reported that a one standard deviation increase in their scoring
index (a combination of points per minute, field goal percentage and free throw percentage)
resulted in a 4.6 year increase in career length. The scoring variable is statistically significant
with a p-value less than 0.001. By contrast, a one standard deviation increase in the “toughness”
index ( rebounds and blocked shots) has an effect less than half that of scoring and the variable
had a p-value of less than 0.05. Assists and steals (the quickness index) was not statistically
significant.
Berri, Brook, and Schmidt (2007b) argue points are so important to NBA evaluators that a
player interested in maximizing his draft position should take “as many shots as a coach allows”.
Moreover, they conclude, “Player evaluation in the NBA seems overly focused upon scoring.
Negative actions, such as inaccurate shooting or accumulating turnovers, do not seem to result in

6
corresponding declines in player compensation.” Consequently, we ask whether draft position is
or is not adversely affected by missed shots and turnovers in college and whether or not it is
improved by increasing points.
We also ask what relationship there is between college productivity and NBA productivity.
Groothuis, Hill, and Perri (2007) related NBA efficiency to draft position and Berri, Brook, and
Schmidt (2007) relate efficiency to pay, but none of the studies have examined college
performance as a determinant of draft position or as an indicator of NBA success. We use college
performance to predict draft position and NBA success.
The analysis first evaluates draft position. We use career college statistics, points,
rebounds, blocks, assists, steals, turnovers, personal fouls, and turnovers, per college career game
and college career field goal and free throw percentages, and we use the NBA formula for
productivity, as well as the two Berri, Schmidt, and Brook (2006) measures of productivity,
controlling for and ignoring the role of the team, for college to predict draft position. We also
interact performance with an indicator for a top college basketball conference and with one
indicating players from institutions whose teams played for a national championship in the 11
years prior to their draft year to allow for the possible statistical discrimination and option value
issues raised by Hendricks, DeBrock, and Koenker (2003). The evidence suggests that scoring,
good shooting, from the floor, blocking shots, making assists, and rebounding each individually
improves draft position for players from what we term big conferences. Players from lesser
conferences or schools not aligned with conferences have their draft position improved by good
shooting from the floor and from the free throw line and, to a lesser extent, by blocking shots, but
not by rebounding, scoring or making assists.
Next, we address NBA productivity. We estimate a probit model to predict whether a
player makes an NBA team, and tobit models relating draft position to length of NBA career.
Given a player made an NBA roster, we examine the relationship between various measures of
7
college productivity and the analogous measure of NBA productivity. For example, we use least
squares regressions to relate college points (rebounds, assists, etc.) per game to NBA points
(rebounds, assists, etc.) per game. Likewise, we relate college field goal and free throw
percentages to NBA percentages. Finally, we relate college values for efficiency to NBA career
values for efficiency. We also estimate these models using the maximum likelihood form of the
Heckman sample selection model. Our results suggest that some college statistics do well at
predicting NBA statistics, and others do not. Moreover, there is little evidence that players from
big conferences or highly regarded college programs are more productive over their NBA careers
than players from smaller conferences.
The rest of this paper is divided into three sections. In the next part, we describe
our data. Following that, we present our results. The paper ends with a summary of the results
and a discussion of the implications for the ability of teams to predict which college players will
be successful and the importance noisy signals about player ability.
I. Data Description
Our data set consists of players from the draft classes between the years 1987-1989. We
chose this span to study players whose professional careers had already been completed yet would
be as recent as possible. Studying retired players makes it possible to consider whether college
production can be used to predict successful NBA careers. For each player drafted between 1987
and 1989 who played at least one year in the NBA we collected draft year, college, conference, big
conference, class, height, weight, position, points, rebounds, assists, steals, blocks, free throws
attempted and made, field goals attempted and made, turnovers, games, minutes played, personal
fouls, and three different efficiency statistics. We gathered the same variables for their NBA
careers and also their draft round, draft position, and drafting team and years in the league.

8
College statistics for players who made the NBA, and their NBA statistics, are available at
(www.basketball-reference.com) and (www.databasebasketball.com).
Our data overlaps that of Camerer and Weber (1999) in that we use the 1987 through 1989
drafts while they use the 1986 through 1991 drafts. They limit their attention to the first two
rounds, but we include all draftees. In addition, their data, and that of Staw and Hoang (1995) is
annual while we focus on career statistics. Staw and Hoang and Camerer and Weber both find that
draft position effects decline over time, with each position in the draft reducing minutes played in
a season by 22 minutes in the second season and by 11 minutes in the fifth season. Neither
extends the analysis beyond the fifth season. We look at effects over the entire career.
We created a variable called big conference to identify players whose college was a
member of a premier basketball conference. This is more specific than Hendricks, DeBrock, and
Koenker’s (2003) Division IA variable but less specific than their top 30 variable. We define big
conference equal to 1 for a college in any of the Big 10, Southwest, Big East, Southeast, Metro,
Atlantic Coast, Pac-10, and Big 8 conference; big conference equals zero otherwise.
Given the college and NBA career statistics we computed three efficiency scores for the
players’ college and professional careers.1 First, we compute the efficiency formula used by the
NBA:
((PTS+ REBS+ ASTS+ STLS+ BLKS)-(FGA-FGM) + (FTA-CFTM) + (TO)) / (MP)
CNBA denotes the NBA efficiency measure computed with college career statistics, NBA the
same measure using NBA career statistics. We also compute the efficiency measures proposed by
Berri, Schmidt, and Brook (2006), which we denote CBSBu and BSBu:
((PTS + REBS+ STLS+ (0.5) BLKS+ FGA- (0.5) FTA- TO- (0.5) PF)/ (MP)
when not accounting for the role of assists, and CBSB and BSB:
1 This approach differs from Staw and Hoang (1995) who use factor analysis to combine individual statistics into indices. Camerer and Weber (1999) use both the indices and the raw statistics.

9
((PTS + REBS+ STLS+ (0.5) BLKS+ (0.5) ASTS - FGA- (0.5) FTA- TO- (0.5) PF)/ (MP)
when adjusting for assists.
Tables 1 and 2 report descriptive statistics for the full sample and split into big conference
and small conference players. Table 2 identifies those variables whose means are different
between big and small conference players. We must emphasize that we only have college
statistics for drafted players who played in the NBA, so these statistics may be upward biased
relative to the means of all drafted players. Table 2 shows that players from small conferences had
statistically significantly larger efficiencies than players from the big conferences. These gains
may have been driven by statistically significantly larger per game points and rebounds. Players
from small conferences were, on average, drafted in later rounds and with later picks than players
from big conferences. These results are consistent with the statistical discrimination and option
value arguments of Hendricks, DeBrock, and Koenker (2003). Moreover, comparing the mean
values of efficiencies or points, rebounds, etc, between late round small and big conference
players, one finds that the average for the small conference players is even bigger relative to the
average for the big conference players than appears in the table.
Players drafted from small conferences who made it to the NBA have significantly shorter
average careers than players from the bigger conferences. The smaller conference players that
make it to the NBA do not have significantly different NBA production than the big conference
players in the NBA. This finding is consistent with the Staw and Hoang (1995) and Camerer and
Weber (1999) findings that franchises stick with early draft picks longer than late draft picks even
after controlling for productivity.
Groothius, Hill, and Perri (2007b) addressed hard it is to find an elite player. We defined
an elite player as one whose career efficiency was more than two standard deviations above the
10
mean career efficiency in our data.2 Unlike Groothuis, Hill, and Perri, we determined who were
elite players in college as well as in the NBA, over their entire careers, and using all three
measures of efficiency, NBA, BSB, and BSBu. Very few players in our sample are elite over their
entire careers. We wanted to see how many elite players we had in our data and if being an elite
player at the college level translates to being an elite player at the professional level. Three
players met this condition at the college level for all three measures of efficiency: David
Robinson, Rik Smits, and Stanley Brundy. Two additional players, Greg Grant and Stacey King,
met the condition for the NBA measure of efficiency in college. Fans of the NBA will surely
recognize David Robinson and Rik Smits. Stanley Brundy and Greg Grant are less recognizable.
Robinson is the only player in our sample to be elite over his career in the NBA. Our data
encompasses three draft classes and 290 draftees. Only one of the 290 performed at an elite level
during his NBA career. Clearly, finding an elite player is not easy. We turn now to the ability of
NBA franchises to identify players who will have successful NBA careers.
II. Results
Table 3 is a first pass at relating college performance to NBA performance. Splitting the
sample between big and small conference players, the table reports simple correlation coefficients
between the college career value of some measure of productivity and the NBA career value of
that statistic. Below the correlation is the p-value for the hypothesis that the correlation is zero.
Notice that all of the correlations are positive, and only that between field goal percentage in
college and field goal percentage in the NBA is not statistically significant. These correlations
suggest that one can infer from college performance something about performance as a
2 If players in our sample are on average more efficient over their careers than are players from other drafts, then we are underestimating the number of elite players. If our players are less efficient than those from other drafts, then we are overestimating the number of elite.
11
professional. We will return to this relationship below, but first we must consider what determines
where a player is taken in the draft and whether they make it into the NBA at all.
Table 4 reports regressions using college productivity to explain draft position. The sample is
split between players from big conferences and those from conferences not deemed as big or from
colleges not in a conference. Hypothesis tests indicate that the data should not be pooled. The
determinants of draft position for big conference players differ from those for non-big conference
players. For example, it appears that field goal and free throw shooting percentages and, to a
lesser extent, shot blocking, are important determinants of draft position for the small conference
players. Of those three, only field goal percentage is a significant determinant of draft position for
big conference players, and its coefficient is about half the size as for the small conference
shooting percentage. The null that the small conference coefficient on field goal shooting
percentage is equal to the big conference coefficient cannot be rejected based on the small
conference regression. The large conference coefficient is not equal to the small conference
coefficient when that condition is imposed on the big conference sample data.
In the big conference data, rebounds, points, and assists per game are all individually
significant determinants of draft position, as is field goal percentage. Testing the null that all the
big conference coefficients, including the intercept, are the same as the small conference
coefficients produces an F-statistic of 3.46 with a p-value of 0.001. Consequently, this evidence
indicates that college productivity affects draft position differently for players coming from big
conferences than for players from small conferences. The implication is that players from small
conferences have to be good shooters to have a chance to be drafted, rebounding, passing, and
scoring in small conferences does not impress NBA scouts. However, players in big conferences
don’t have to be good shooters to catch the eye of NBA scouts.
One might contend that big versus small conference players is not a fine enough distinction
in the quality of the signal about player ability. Hendricks, DeBrock, and Koenker (2003) used

12
Division IA football players, a broader signal than our big conference, and the number of years
between 1980 and 1992 that a draftee’s college ended the season ranked in the top thirty to
identify players whose ability signal was most clear. We tried a second measure of signal quality,
namely the number of times in the 11 years prior to the draft in which a player was taken that the
player’s team was either national champion or played in the championship game. This is, perhaps,
too narrow a signal about the player’s ability. In any case, interacting this variable with the
college productivity numbers, one rejects the null hypothesis that these interaction terms are all
zero when they are the sole indicator of signal quality. However, including the big conference
interaction terms in the regression as well makes the championship participation variables
insignificant, while the big conference interaction variables remain jointly significant.
The next question is the extent to which draft position determines professional career
success. Of course, to have a successful career, one must first have a career, so we begin by
estimating a probit model of the likelihood a drafted player ever plays in the NBA. Our
explanatory variables are limited because college statistics are not readily available for players
who did not play in the NBA. We use draft position, big conference, and big conference
interacted with draft position as a starting point. This approach is consistent with Camerer and
Weber’s (1999) argument that draft position contains information about expected productivity or
other player attributes that are not observed by actual productivity measures and/or is a good index
of the available information about a player. Significance of the big conference and interaction
variables would be support for the statistical discrimination and option value arguments of
Hendricks, DeBrock, and Koenker (2003). The probit regression in Table 5 shows that draft
position influences the likelihood of playing in the NBA, with being taken earlier raising the
probability of playing at least one season. Neither the big conference nor the big conference-draft

13
position interaction is statistically significant. They are not jointly significant either.3 These
results are not consistent with the findings of Hendricks, DeBrock, and Koenker for the NFL
draftees that suggest teams exercise an option by drafting players whose future performance is less
certain but who may have great potential.4
Now we turn to the question of whether NBA success can be predicted from college
productivity. The answer depends upon what one uses as the measure of NBA success. For
example, college productivity is not relevant for predicting NBA career length, given one plays at
least one year in the NBA, when draft position is a regressor. Draft position is always statistically
significant and indicates that players drafted later have shorter NBA careers. This finding is
consistent whether college production is a list of per game statistics and shooting percentages or
simply a summary measure of college efficiency. These regressions are not reported but are
available upon request.
Table 5 reports Tobit regressions explaining years in the NBA for those individuals who
played at least one year and for all those who were drafted. For those who played at least one year,
college productivity variables are not significant determinants of career length. Note that in the
regression using only individuals who played at least one year in the NBA draft position squared
is not included but it is in the regression on all draftees. In fact, had draft position squared been in
the first regression, it would have been statistically significant. Indeed, draft position cubed would
be significant in the smaller sample as well, though not in the full sample of draftees. Draft
sample to the fourth power is not significant in either sample. This is interesting because the cubic
specification is the same that Spurr (2000) uses in his regressions on MLB draft data.
3 Draft position squared and draft position cubed are both individually statistically significant in the probit regression but draft position raised to the fourth power is not. Adding these variables does not make the big conference variables significant. 4 Groothuis, Hill, and Perri (2007a) suggested the option value argument applies for NBA draftees and assessed the possibility using draft of underclassman including players right out of high school. In our data very few underclassmen were drafted and all of them made the NBA. We do not have data on underclassmen that declared for the draft but were not selected.

14
The results in Table 5 indicate that the effect of draft position varies across players who
attended colleges in the big conferences versus those from smaller conferences, at least for those
players who were in the NBA for at least one year. This result does not hold when considering all
draftees. Moreover, this result disappears from the smaller sample when higher order terms of
draft position are added to the regression. This suggests that what appears as the impact of
conference size in the career length regression is really an indication of the non-linearity in the
relationship between draft position and career length.
Finally, we turn to the question of whether college statistics can predict NBA productivity,
and if there are differences between big conference and small conference statistics and between
championship participant’s and non-participant’s statistics. To assess these possibilities, we
regress NBA production against the college statistics. Because Staw and Hoang (1995) and
Camerer and Weber (1999) focus a great deal on minutes we present evidence on minutes separate
from evidence on other measures of productivity. Minutes regressions are reported in Table 6.
Points, rebounds, assists, steals, and blocks per game over the career and career field goal and free
throw percentages, and the efficiency measures are also regressed against the college statistics.
These are reported in Tables 7 and 8. For example, NBA career points per game is explained by
college points per game, college points per game interacted with the big conference dummy
variable and college points per game interacted with the championship participant dummy
variable, and draft position. We estimate this relationship two ways. Table 7 summarizes the
results of simple OLS regressions. Table 8 recognizes that the OLS results may be biased because
the regression is on a selected sample. In other words, there may be unobserved or unobservable
factors that make one more likely to make an NBA roster that are also correlated with the
explanatory variables in the productivity regressions. If this is the case, sample selection bias will
make the effects of college productivity on NBA productivity appear larger than they are.

15
Table 6 shows the results of explaining minutes per game or minutes per season during a
player’s NBA career using the player’s draft position and college minutes per game. The first two
columns report regressions explaining career minutes in the NBA divided by years in the NBA.
This is similar to the Staw and Hoang (1995) and Camerer and Weber (1999) analysis, where they
explain minutes played during a season. The last two columns show the results for minutes per
game during the NBA career. The results show that draft position is clearly a determinant of
minutes played, whether that is per year over the career or per game over the career. The per year
figures imply dropping one slot in the draft reduces minutes played per year fall by about 16.
Contrast this with the finding of Camerer and Weber of one draft position changing minutes
played by 29 in the second year of one’s career, by 32 in the third year, and by 23 in the fourth
year, with insignificant effects in year 5 of the career or the findings of Staw and Hoang of one
slot in the draft reducing minutes played by 23 minutes in the second year, 16 minutes in the third
and fourth year, and 14 minutes in the fifth year. Draft position reduces minutes per game over a
career by about 0.18 minutes for each slot. In our data, minutes per game for NBA players is
about 17.5, so falling one draft slot reduces minutes per game by just over 1%.
Camerer and Weber (1999) added other measures of productivity to the minutes played
equation. We use college statistics for this purpose. Note that college minutes per game is not
individually significant in the minutes per year specifications but is significant in the minutes per
game regressions. In unreported regressions we also add college points, rebounds, assists, blocks,
sand steals per game and college field goal and free throw shooting percentages. Doing so does
not alter the results with respect to draft position. This long list of college level productivity
variables is jointly statistically significant in both the minutes per year and the minutes per game
specifications. Depending on the specification, it is either college points per game or college
rebounds per game that is the strongest determinant of professional playing time among the

16
performance statistics. Paradoxically, more rebounds per game in college implies fewer minutes
per game or per year as a professional.
In Table 7, the NBA productivity measures of interest are listed across the top as column
headings.5 The row headings refer to the explanatory variables, the college value of the
productivity measure, the interaction between the college productivity and the big conference or
championship game dummies, and finally the draft position. Scoring one more point per game in
college implies scoring about a quarter of a point per game more in the NBA, for example. In
every case, draft position is statistically significant and negatively related to NBA production. In
other words, early draft picks have higher average per game points, rebounds, assists, and so on, as
pros than do later draft picks.
Few of the interaction terms reported in Table 7 are individually significant. Players from
big conferences average more assists per game as pros than do players from small conferences, but
they have lower free throw percentages. They also have higher BSBu efficiencies as pros than do
small conference players who make the NBA. Participants in the NCAA championship game
have lower assists and steals per game than players who never played in the championship game.
Participants also have significantly lower field goal percentages during the NBA careers than do
players who never appeared in the NCAA championship game.
Table 8 reports the results of estimating via maximum likelihood the Heckman selection
model of NBA productivity. The selection equation is specified the same as the probit equation
reported in Table 5 except that now there is an additional parameter which captures the correlation
between the error in the productivity equation and the error in the probit equation. The estimated
value of this correlation is reported for each productivity equation in the row labeled rho. Below
5 Log points is included in Table 7 for comparison to the results from the Heckman selection model in Table 8. There, log points per game in the NBA career is regressed against log points per game in college because the model did not converge using the level of points per game.

17
the estimated correlation coefficient is the p-value for the estimate. The bottom row reports the
test statistics for the null that the productivity and the selection equation are uncorrelated.
The results confirm the argument that selection bias would result in the OLS results
overstating the impact of college level production on NBA production. In the rebounds and
blocks equations, which have the strongest correlations with the selection equation, the
coefficients on the college statistics fall by 30 and 25%, respectively, after accounting for sample
selection. Other coefficients fall as a result of addressing selection, but the OLS estimates are very
close to the corrected ones.
III. Discussion
The results in Tables 6 through 8 paint a clear picture that NBA production over an entire
career can be predicted based on a player’s college production. An additional per game rebound
in college predicts about a quarter of game higher rebound average in the pros. Additional
collegiate blocked shots has a similar effect on professional blocked shots. One more steal per
game in college implies four-tenths of a steal per game more steals as a pro, and each additional
college assist per game translates into nearly three-fourths of an assist per game more as a
professional. Ten percent more points per game in college implies about four percent more points
per game as a professional.
Perhaps more interesting still is the role of draft position in the relationship between
college and professional production. Even after controlling for collegiate production and minutes
played, draft position is a statistically significant determinant of minutes played during the
player’s NBA career. This finding is consistent with escalating commitment as found by Staw and
Hoang (1995) and Camerer and Weber (1999). Our result is somewhat stronger than either of
theirs, however, because the result holds over the entire career of the players in our data but only
over the first five years of a career in those studies.

18
Draft position also predicts NBA production on the court. Consider the rebounds equation.
All other things constant, the first draft pick in a draft will average six-tenths more rebounds per
game over his career than the tenth pick in the draft and 1.2 more than the twentieth pick.
Average rebounds per game for an NBA career is 2.9 with a standard deviation of 2.0 suggesting
the difference between the first and the twentieth pick is quite large. Said differently, falling about
16 spots in the draft implies a reduction of one rebound per game. For assists, the difference
between the first and the twentieth pick is six-tenths of an assist per game compared to the average
assists per game in our sample of 1.76, and it takes a drop of over 33 spots in the draft to lose one
full assist per game.
Using the information in Berri, Brook, and Schmidt (2007) we can determine the value of
college production in terms of professional salary. Based on the results reported in their Table 5b,
one rebound per game in the NBA is worth about $638,910 toward the annual average free agent
salary over the period 2001-2006. For what follows, we assume that free agents are paid their
marginal revenue product. Our Table 7 implies that it takes about 4 rebounds per game in college
to produce one rebound per game for one’s career as a pro. Consequently, four rebounds per game
in college translates into about $638,910 of additional value per year to an NBA franchise.
Of course, Berri, Brook, and Schmidt (2007) argue that points are overvalued by the NBA
and recommend college players take as many shots as their coach will allow. They report that the
average annual free agent salary rises about 7.9% for every 10% increase in points per game (the
elasticity is reported as 0.788). Their elasticity of salary with respect to points per game combined
with our estimate of the elasticity of pro points per game with respect to college points per game
(0.403) implies that a 10% increase in college points per game will generate a 3.2% increase in
professional salary. Given the average field goal percentage in college of 51.6% and the average
points per game in college of 14.4, assuming all shots are two-point shots, and ignoring free
throws, a college player can raise his NBA salary by 3.2% by taking an extra 2.9 shots per game in

19
college. Moreover, assuming those extra shots don’t damage the shooting percentage, those extra
shots, and the points they imply, would improve the player’s draft position by about 2 spots.
Those extra two spots also significantly raise the probability a player will make an NBA team and
also extend their career in the NBA conditional on making a team.
But suppose the extra shots taken lower the shooting percentage. The results in Table 4
indicate that a big conference player loses one draft slot for every one point reduction is shooting
percentage; for the small conference player that one point reduction in field goal percentage
reduces draft slot by 1.8 spots. The probit results in Table 5 imply that being drafted one spot
lower reduces the probability of making the NBA by one percentage point. What this says is that
taking bad shots in hopes that some will go in and raise the scoring average carries a cost. This
cost comes in the form of being drafted later, if at all, and reduced likelihood of making an NBA
team if drafted. In other words, a college player firing up shots of dubious quality may not only be
bad basketball but it may be a bad career move.
Our results are mixed on the issues of rationality of NBA executives, over-commitment to
early draft choices, and discrimination against players whose productivity signals are most noisy.
We clearly see from the descriptive statistics that small conference players who make the NBA
scored and rebounded more in college than did their counterparts from big conferences. Small
conference players also have significantly shorter careers than did players from big conferences.
Moreover, the relationship between draft position and college production is not the same for big
and small conference players. Small conference players need to be sharpshooters, big conference
players do not.
Big conference versus small conference does not affect the likelihood of making an NBA
team, given one is drafted, nor does it affect the length of the career of drafted players. However,
a big conference player that makes an NBA team will have a significantly longer career than a
small conference player that makes a team. Simply being from a big conference adds almost four

20
years to the average career of a player who plays at least one year. However, a one spot worse
draft position for a small conference player lowers his career length by .06 years, while that same
change in draft position for a big conference player shortens his career by .17 years. These results
are also similar to those of Hendricks, DeBrock, and Koenker (2003).
The more specific productivity measures of Tables 6 through 8 generally do not produce
evidence that big and small conference draftees are different from one another. It may be that the
focus on the career rather than the season makes distinctions between big and small conference
players unidentifiable. It may also be that the greater specificity and objectivity of productivity
measures like points and rebounds per game compared to being drafted or Pro Bowl appearances
removes biases inherent in the Hendricks, DeBrock and Koenker (2003) productivity variables.
Consider again the questions posed at the start of the paper.
1) Can professional sports franchises identify quality players based on the information
available to them prior to a draft? The answer for the NBA appears to be yes. College
productivity is a significant determinant of draft position.
2) Do the attributes that determine draft position also indicate career success? Yes. Many
college level productivity measures do a good job of predicting/explaining NBA career
productivity. This is still true after controlling for draft position.
3) Do those attributes imply something about what the drafting teams value and are they the
same attributes that professional teams compensate highly? Yes. College level statistics
that are generally best at predicting NBA career success measure the types of NBA
statistics that correlate strongly with NBA compensation.
4) Are NBA economic decision makers rational? To a large extent they are. However, there
is some evidence here that NBA executives may draft players from small conferences in
accord with the statistical discrimination and option value types of rationales. The
evidence also suggests, in agreement with the published literature, that NBA teams may

21
stick with early draft choices longer than late draft choices with the same productivity.
Whether this is irrational “escalation of commitment” or rational based on better
information about expected costs and expected benefits can not be determined from this
analysis.

22
BIBLIOGRAPHY
Basketball Reference. Retrieved November, 2007, from www.basketball-reference.com Berri, D.J., Brook, S.L., and Schmidt, M.B., (2007). Does One Simply Need to Score to Score?, International Journal of Sport Finance, 2(4):190-205. Berri, D.J., Schmidt, M.B., and Brook, S.L., (2006). The Wages of Wins: Taking measure of the many myths in modern sport. Palo Alto, CA: Stanford University Press. Boulier, B. L., Stekler, H.O., Coburn, J. and T. Rankins. (2004). Evaluating National Football League Draft Choices: The Passing Game, mimeo. Camerer, C.F. and Weber, R. A. (1999). The Econometrics and Behavioral Economics of Escalation of Commitment: A re-examination of Staw and Hoang’s NBA data, Journal of Economic Behavior and Organization, 39:59-82. Database Basketball. Retrieved November, 2007, from www.databasebasketball.com Groothuis, P.A., Hill, J.R., Perri, T. (2007a). Early Entry in the NBA Draft: The Influence of Unraveling, Human Capital, and Option Value, Journal of Sports Economics, 8(3):223-243. Groothuis, P.A., Hill, J.R., Perri, T. (2007b). The Dilemma of Choosing Talent: Michael Jordans are Hard to Find. Appalachian State University Working Paper, 0701. Hendricks, W., DeBrock, L. and R. Koenker. (2003). Uncertainty, Hiring, and Subsequent Performance: The NFL Draft, Journal of Labor Economics, 21(4):857-886. Massey, C. and Thaler, R. H., The Losers’ Curse: Overconfidence vs. Market Efficiency in the National Football League" (2006). Available at: http://mba.yale.edu/faculty/pdf/massey_thaler_overconfidence_nfl_draft.pdf. Spurr, S. J. (2000). The Baseball Draft: A Study of the Ability to Find Talent, Journal of Sports Economics, 1(1):66-85. Staw, B. M. and Hoang, H. (1995). Sunk Costs in the NBA: Why draft order affects playing time and survival in professional basketball, Administrative Science Quarterly, 40(3):474-494.

23
Table 1: Descriptive Statistics - Full Sample Variable Obs Mean Std.Dev.Big Conferencea 290 0.56 0.50College NBA eff. 149 0.55 0.21College Berri-Schmidt-Brook eff. U 149 0.19 0.14College Berri-Schmidt-Brook eff. 149 0.23 0.13Draft round 290 3.02 1.92Draft position 290 59.92 44.03NBA eff. 161 0.39 0.16Berri-Schmidt-Brook eff. U 161 0.07 0.13Berri-Schmidt-Brook eff. 161 0.11 0.13College FG percentage 156 51.66 4.36College FT percentage 156 71.70 8.05College Points per game 157 14.38 4.33College Rebounds per game 157 5.65 2.23College Assists per game 157 2.30 1.64College Steals per game 157 1.13 0.62College Blocks per game 156 0.75 0.77College Turnovers per game 153 2.09 0.65College Personal Fouls per game 155 2.43 0.55College Minutes per game 149 29.00 5.30NBA FG percentage 161 43.05 8.25NBA FT percentage 158 71.11 13.46NBA Points per game 161 7.05 4.83NBA Rebounds per game 161 2.92 2.04NBA Assists per game 161 1.76 1.80NBA Blocks per game 161 0.34 0.41NBA Steals per game 161 0.63 0.45NBA Personal Fouls per game 160 1.78 0.81NBA Minutes per game 161 17.56 9.61NBA Minutes per year 161 978.04 778.12Years in the NBA 161 6.89 5.25
aBig conferences are: PAC 10, Big East, Big 8, Southwest, Southeast, ACC, Big 10, and Metro.

24
Table 2: Descriptive Statistics by Big Conference Small Conference Players Big Conference Players Variable Obs Mean Std.Dev. Min Max Obs Mean Std.Dev. Min Max College NBA eff. 52 0.61** 0.32 0.38 2.79 97 0.52 0.08 0.31 0.72 College Berri‐Schmidt‐Brook eff. U 52 0.23** 0.20 0.01 1.52 97 0.18 0.08 ‐0.01 0.33 College Berri‐Schmidt‐Brook eff. 52 0.27** 0.20 0.12 1.56 97 0.22 0.06 0.07 0.36 Draft round 128 3.46*** 2.00 1.00 7.00 162 2.67 1.79 1.00 7.00 Draft position 128 70.59*** 45.45 1.00 161.00 162 51.49 41.10 1.00 158.00 NBA eff. 60 0.38 0.22 ‐1.00 0.78 101 0.40 0.11 0.00 0.63 Berri‐Schmidt‐Brook eff. U 60 0.05 0.18 ‐1.00 0.35 101 0.08 0.10 ‐0.26 0.26 Berri‐Schmidt‐Brook eff. 60 0.10 0.18 ‐1.00 0.39 101 0.12 0.09 ‐0.25 0.28 College FG percentage 55 51.39 5.01 42.93 62.73 101 51.81 3.99 42.46 60.92 College FT percentage 55 70.94 8.63 49.04 87.78 101 72.11 7.72 51.64 89.77 College Points per game 56 16.00*** 4.39 7.32 30.72 101 13.48 4.05 2.43 21.34 College Rebounds per game 56 6.27*** 2.31 1.49 10.92 101 5.30 2.13 1.55 10.43 College Assists per game 56 2.35 1.60 0.27 7.17 101 2.27 1.67 0.33 6.96 College Steals per game 56 1.26* 0.64 0.21 3.65 101 1.06 0.59 0.15 3.80 College Blocks per game 55 0.83 0.88 0.02 4.06 101 0.70 0.71 0.03 3.05 College Turnovers per game 52 2.15 0.77 0.33 4.44 101 2.06 0.59 0.60 3.42 College Personal Fouls per game 54 2.56 0.56 1.02 3.65 101 2.37 0.53 1.13 3.59 College Minutes per game 52 30.09* 4.87 9.05 37.81 97 28.42 5.46 7.93 37.26 NBA FG percentage 60 42.23 8.11 0.00 52.46 101 43.53 8.33 0.00 66.67 NBA FT percentage 58 72.20 9.15 38.89 86.97 100 70.48 15.42 0.00 100.00 NBA Points per game 60 6.93 5.06 0.00 21.06 101 7.12 4.70 0.75 21.00 NBA Rebounds per game 60 3.02 2.42 0.00 10.64 101 2.86 1.78 0.18 9.47 NBA Assists per game 60 1.70 1.55 0.00 8.18 101 1.79 1.94 0.06 9.13 NBA Blocks per game 60 0.36 0.50 0.00 2.99 101 0.32 0.34 0.00 1.59 NBA Steals per game 60 0.64 0.45 0.00 1.96 101 0.63 0.45 0.00 2.33 NBA Personal Fouls per game 60 1.83 0.88 0.00 3.64 100 1.76 0.76 0.00 3.45 NBA Minutes per game 60 17.17 9.78 1 35.32 101 17.80 9.55 2.55 35.15 NBA Minutes per year 60 950.53 817.42 1 2464.15 101 994.39 757.50 8 2645.61 Years in the NBA 60 5.97*** 5.00 1.00 17.00 101 7.45 5.34 1.00 18.00
Significant difference between big and small conference players. *** p-value < 0.01, ** p-value<0.05, *p-value<0.10

25
Table 3: Correlations – College Performance and NBA Performanc Not Big Conference Players College NBA Points Rebounds Assists Steals Blocks FG Pct. FT Pct. NBA BSB BSBu Points 0.314 0.020 Rebounds 0.449 0.001 Assists 0.594 0.000 Steals 0.587 0.000 Blocks 0.753 0.000 FG Pct. 0.194 0.155 FT Pct. 0.668 0.000 NBA 0.326 0.020 BSB 0.301 0.032 BSBu 0.365 0.009 Big Conference Players Points 0.473 0.000 Rebounds 0.580 0.000 Assists 0.783 0.000 Steals 0.665 0.000 Blocks 0.770 0.000 FG Pct. 0.155 0.123 FT Pct. 0.446 0.000 NBA 0.331 0.001 BSB 0.429 0.000 BSBu 0.569 0.000
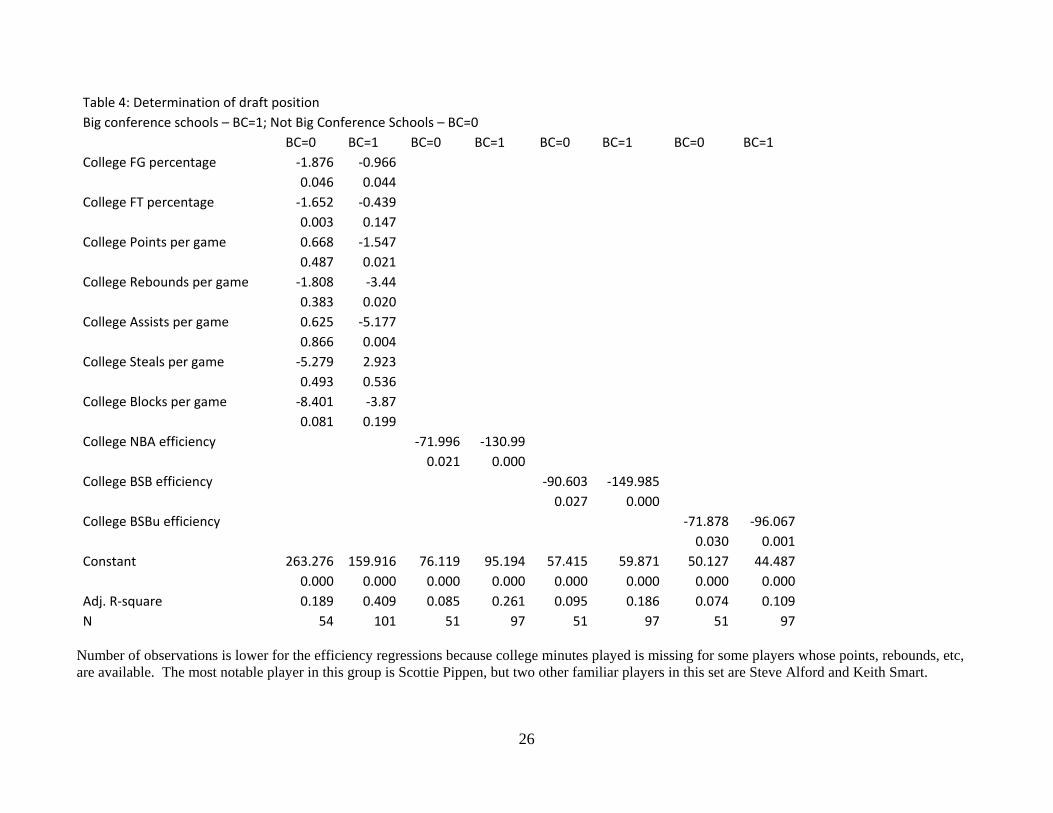
Table 4: Determination of draft position Big conference schools – BC=1; Not Big Conference Schools – BC=0
‐
BC=0 BC=1 BC=0 BC=1 BC=0 BC=1 BC=0 BC=1 College FG percentage ‐1.876 ‐0.966
0.046 0.044College FT percentage 1.652 ‐0.439
0.003 0.147College Points per game 0.668 ‐1.547
0.487 0.021College Rebounds per game ‐1.808 ‐3.44
0.383 0.020College Assists per game 0.625 ‐5.177
0.866 0.004College Steals per game ‐5.279 2.923
0.493 0.536College Blocks per game ‐8.401 ‐3.87
0.081 0.199College NBA efficiency ‐71.996 ‐130.99
0.021 0.000College BSB efficiency ‐90.603 ‐149.985
0.027 0.000College BSBu efficiency ‐71.878 ‐96.067
0.030 0.001Constant 263.276 159.916 76.119 95.194 57.415 59.871 50.127 44.487
0.000 0.000 0.000 0.000 0.000 0.000 0.000 0.000Adj. R‐square 0.189 0.409 0.085 0.261 0.095 0.186 0.074 0.109N 54 101 51 97 51 97 51 97
Number of observations is lower for the efficiency regressions because college minutes played is missing for some players whose points, rebounds, etc, are available. The most notable player in this group is Scottie Pippen, but two other familiar players in this set are Steve Alford and Keith Smart.
26

27
Table 5: Regressions explaining length of NBA career
Probit Play in NBA given drafted
Tobit Career length given Play at least one year
Tobit Career length given drafted
Draft position ‐0.031 ‐0.063 ‐0.258 0.000 0.032 0.000 Draft position squared 0.001 0.002 Big Conference 0.700 3.998 1.679 0.144 0.016 0.199 Big Conference*Draft position ‐0.013 ‐0.108 ‐0.033 0.104 0.011 0.193 Constant 1.950 7.419 11.595 0.000 0.000 0.000 Stand. Error 5.673 5.192 0.376 0.301 Psuedo R‐square 0.510 0.043 0.184 N 290 161 290
Marginal Std.Err. Marginal Std.Err. Effect Effect Unconditional expectation Draft position ‐0.051 0.024 ‐0.143 0.022 Draft position squared 0.458 0.148 Big Conference 3.137 1.341 0.918 0.723 Big Conference*Draft position ‐0.088 0.034 ‐0.018 0.014 Conditional on NBA career more than 1 year Draft position ‐0.038 0.017 ‐0.102 0.016 Draft position squared 0.326 0.105 Big Conference 2.291 0.986 0.655 0.514 Big Conference*Draft position ‐0.065 0.025 ‐0.013 0.010 Change in probability of NBA career more than 1 year Draft position ‐0.003 0.001 ‐0.020 0.003 Draft position squared 0.063 0.020 Big Conference 0.202 0.078 0.128 0.099 Big Conference*Draft position ‐0.005 0.002 ‐0.002 0.002

28
Table 6: Minutes regressions
Minutes per year of NBA career Minutes per game during NBA career
College Minutes per game 15.538 14.574 0.286 0.270 0.297 0.271 0.166 0.218 0.040 0.065 0.001 0.004 Draft position ‐16.462 16.139 ‐0.189 ‐0.184 ‐0.045 ‐0.036 0.000 0.000 0.000 0.000 0.056 0.159 Big conference*Draft position ‐0.812 ‐0.013 ‐0.022 0.794 0.730 0.360 Years in NBA 1.346 1.348 0.000 0.000 Constant 1026.816 1059.533 15.009 15.544 0.987 1.859 0.006 0.007 0.001 0.002 0.745 0.559 Adj. R‐squared 0.260 0.255 0.261 0.256 0.705 0.705

Table 7: Predicting NBA Productivity based on College Productivity
‐
Points Log points Rebound Assists Steals Blocks FG pct FT pct
NBA eff. BSB eff. BSBu eff.
College stat 0.235 0.401 0.354 0.751 0.412 0.354 0.226 0.817 ‐0.005 ‐0.030 0.0640.003 0.017 0.000 0.000 0.000 0.000 0.154 0.000 0.932 0.710 0.403
Big Conference*college stat 0.045 0.016 0.023 0.143 0.071 0.011 0.038 ‐0.050 0.033 0.147 0.275
0.354 0.731 0.624 0.068 0.115 0.790 0.186 0.096 0.522 0.131 0.010 Championship game*college stat ‐ ‐0.0580.043 0.028 ‐0.117 ‐0.001 0.003 ‐0.031 0.012 0.017 0.030 0.056
0.231 0.197 0.406 0.023 0.038 0.911 0.093 0.528 0.789 0.811 0.694 Draft position 0.098 ‐0.016 ‐0.027 ‐0.017 ‐0.007 ‐0.003 ‐0.057 ‐0.113 ‐0.002 ‐0.001 ‐0.001
0.000 0.000 0.000 0.000 0.000 0.003 0.071 0.011 0.003 0.014 0.040
Constant 6.324 1.110 1.537 0.452 0.344 0.135 32.329 17.903 0.440 0.137 0.0540.000 0.029 0.001 0.036 0.000 0.003 0.000 0.047 0.000 0.000 0.063
Adj. R‐squared 0.329 0.296 0.350 0.580 0.506 0.587 0.052 0.255 0.052 0.056 0.095
The models are estimated using ordinary least squares. p-values are below coefficient estimates.
29

Table 8: NBA Productivity – Heckman Selection Model
Log Points Rebounds Assists Steals Blocks FG pct FT pct NBA eff. BSB eff. BSBu eff.
College stat 0.403 0.247 0.742 0.408 0.267 0.218 0.789 ‐0.014 ‐0.040 0.0760.011 0.000 0.000 0.000 0.000 0.164 0.000 0.819 0.624 0.317
Draft position ‐ ‐0.0610.021 ‐0.032 ‐0.010 ‐0.008 ‐0.084 ‐0.108 ‐0.002 ‐0.002 ‐0.002
0.000 0.000 0.000 0.000 0.000 0.038 0.059 0.002 0.005 0.010
Constant 1.171 2.765 0.809 0.418 0.284 33.929 17.584 0.465 0.171 0.0990.011 0.000 0.003 0.000 0.000 0.000 0.048 0.000 0.000 0.000
rho 0.467 0.973 0.602 0.525 0.979 0.133 0.035 0.083 0.080 0.0740.194 0.021 0.190 0.194 0.017 0.169 0.168 0.150 0.156 0.163
Null hypothesis: Productivity and selection equations are independent Chi‐square 3.54 26.61 3.38 3.90 24.38 0.54 0.04 0.28 0.24 0.19p‐value 0.06 0.000 0.066 0.048 0.000 0.463 0.836 0.596 0.624 0.661
aThe points regression relates the natural logarithm of points per game in the NBA to the natural logarithm of points per game in college and draft position. This change was necessary because the Heckman selection model would not estimate with points per game in levels. The specification of the selection equation is identical to the NBA career probit reported in Table 5. Results are available upon request.
30
Recommended