RESEARCHREPORT
December 2001RR-01-25
Statistics & Research Division Princeton, NJ 08541
The International Adult LiteracySurvey (IALS): Understanding WhatWas Measured
Irwin Kirsch

The International Adult Literacy Survey (IALS):
Understanding What Was Measured
Irwin S. Kirsch
Educational Testing Service
December 2001
Research Reports provide preliminary and limited disseminationof ETS research prior to publication. They are available withoutcharge from:
Research Publications OfficeMail Stop 10-REducational Testing ServicePrinceton, NJ 08541
i
Abstract
This paper offers a framework that has been used for both developing the tasks used to measure
literacy and for understanding the meaning of what has been reported with respect to the
comparative literacy proficiencies of adults in participating countries. The framework consists of
six parts that represent a logical sequence of steps, from needing to define and represent a
particular domain of interest, to identifying and operationalizing characteristics used to construct
items, to providing an empirical basis for interpreting results. The various parts of the framework
are seen as important in that they help to provide a deeper understanding of the construct of
literacy and the various processes associated with it. A processing model is proposed and
variables associated with performance on the literacy tasks are identified and verified through
regression analyses. These variables are shown to account for between 79% and 89% of the
variance in task difficulty. Collectively, these process variables provide a means for moving
away from interpreting performance on large-scale surveys in terms of discrete tasks or a single
number, toward identifying levels of performance that have generalizability across pools of tasks
and toward what Messick (1989) has called a higher level of measurement.
Key words: assessment design, construct validity, evidence centered assessment design,
framework, large-scale assessment, literacy/reading, test interpretation

ii

iii
Table of Contents
Page
Introduction..................................................................................................................................... 1
Overview of the Framework .................................................................................................... 3
Defining Literacy..................................................................................................................... 4
Organizing the Domain................................................................................................................... 7
Identifying Task Characteristics.................................................................................................... 10
Identifying and Operationalizing the Variables............................................................................ 11
Context/Content ..................................................................................................................... 11
Materials/Texts....................................................................................................................... 12
Continuous Texts ............................................................................................................ 13
Noncontinuous Texts ...................................................................................................... 13
Processes/Strategies ............................................................................................................... 15
Type of Match................................................................................................................. 15
Type of Information Requested ...................................................................................... 16
Plausibility of Distractors............................................................................................... 17
Type of Calculation........................................................................................................ 18
Operation Specificity...................................................................................................... 18
Validating the Variables................................................................................................................ 19
Characterizing Prose Literacy Tasks...................................................................................... 21
Evaluating the Contribution of the Variables to Task Difficulty........................................... 26
Characterizing Document Literacy Tasks.............................................................................. 28
Evaluating the Contribution of the Variables to Task Difficulty........................................... 31
Characterizing Quantitative Literacy Tasks........................................................................... 33
Evaluating the Contribution of the Variables to Task Difficulty........................................... 37
Building an Interpretative Scheme................................................................................................ 39
Conclusion..................................................................................................................................... 44
References ..................................................................................................................................... 46
Notes ............................................................................................................................................. 50

iv
Appendixes.................................................................................................................................... 51
A - Coding Rules for the Process Variables............................................................................ 51
B - Data from Prose, Document, and Quantitative Items........................................................ 56
1
Introduction
The International Adult Literacy Survey (IALS) was the first-ever comparative survey of
adults designed to profile and explore the literacy distributions among participating countries. It
was a collaborative effort involving several international organizations, intergovernmental
agencies, and national governments. In 2000, a final report was released (Organization for
Economic Co-operation and Development [OECD] & Statistics Canada [STAT CAN], 2000),
which stated that “by 1998, the survey had covered 10.3 percent of the world population and
51.6 percent of the world GDP” (p.87).
Who are the constituencies that are likely to use the data from the IALS once they have
been collected and analyzed? It is expected that many individuals, including researchers,
practitioners, and individual citizens within each of the participating countries, will read the
survey results and make use of the data for a variety of purposes. Yet, the primary reason for
developing and conducting this large-scale international assessment is to provide empirically
grounded interpretations upon which to inform policy decisions. This places the IALS in the
context of policy research. In their classic volume on this topic, Lerner and Lasswell (1951)
argued that the appropriate role for policy research is not to define policy; rather, it is to establish
a body of evidence from which informed judgments can be made. Messick (1987) extended this
thinking to the area of large-scale assessments and noted that, in order to appropriately fulfill this
function, assessments should exhibit three key features: relevance, comparability, and
interpretability.
Relevance refers to the capability for measuring diverse background and program
information to illuminate context effects and treatment or process differences. The IALS will
develop and administer an extensive questionnaire covering a wide range of issues that will be
used to identify characteristics that are correlated with performance and that may differ across a
variety of language and cultural backgrounds.
Comparability deals with the capacity to provide data or measures that are
commensurable across time periods and across populations of interest. Complex sampling,
scaling, and translation procedures are being implemented to help ensure that common metrics
will exist across participating countries so that appropriate comparisons can be made between
countries and among major subpopulations of interest within a country. These comparisons are
important both in this initial survey and in future assessments where new countries may join the

2
survey and want to be placed onto existing scales, or where participating countries may want to
measure trends in the distributions of skills among various subpopulations of interest.
Interpretability focuses on collecting evidence that will enhance the understanding and
interpretation of what is being measured. In some assessments, the meaning of what is being
measured is constructed by examining performance on individual tasks, or by assuming it is
inherent in the label that is used to organize one or more sets of tasks—for example, reading
comprehension or critical thinking. All too often assessments focus on rank ordering populations
or countries by comparing mean scores or distributions. These data tell us that people differ
without telling us how they differ. One of the stated goals in the IALS is to try to address the
issue of interpretability not only by reporting that countries, groups, or individuals differ in their
proficiencies, but also by developing an interpretative scheme for reporting how they differ.
In considering the development of the literacy framework, a set of necessary components
has been identified:
• A framework should begin with a general definition or statement of purpose—one that
guides the rationale for the survey and what should be measured.
• A framework should identify various task characteristics and indicate how these
characteristics will be used in constructing the tasks.
• Variables associated with each task characteristic should be specified, and research
should be conducted to show which of these variables account for large percentages of
the variance in the distribution of tasks along a continuum or scale. Variables that appear
to have the largest impact on this variance should be used to create an interpretative
scheme. This is a crucial step in the process of measurement and validation.
While the chief benefit of constructing and validating a framework for literacy is
improved measurement, a number of other potential benefits are also evident. Namely:
• A framework provides a common language and a vehicle for discussing the definition of
the skill area.
• Such a discussion allows us to build consensus around the framework and measurement
goals.
• An analysis of the kinds of knowledge and skills associated with successful performance
provides a basis for establishing standards or levels of proficiency. As we increase our
3
understanding of what is being measured and our ability to interpret scores along a
particular scale, we have an empirical basis for communicating a richer body of
information to various constituencies.
• Identifying and understanding particular variables that underlie successful performance
further our ability to evaluate what is being measured and to make changes to the
measurement over time.
• Linking research, assessment, and public policy promotes not only the continued
development and use of the survey, but also understanding of what it is measuring.
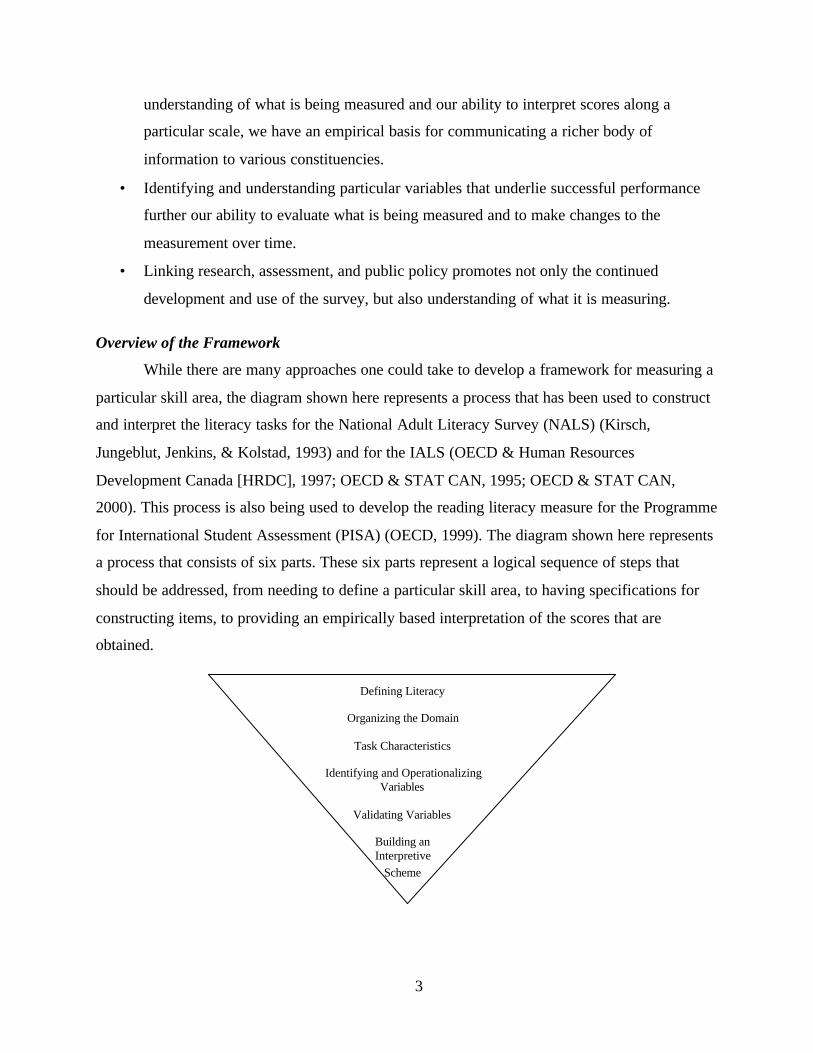
Overview of the Framework
While there are many approaches one could take to develop a framework for measuring a
particular skill area, the diagram shown here represents a process that has been used to construct
and interpret the literacy tasks for the National Adult Literacy Survey (NALS) (Kirsch,
Jungeblut, Jenkins, & Kolstad, 1993) and for the IALS (OECD & Human Resources
Development Canada [HRDC], 1997; OECD & STAT CAN, 1995; OECD & STAT CAN,
2000). This process is also being used to develop the reading literacy measure for the Programme
for International Student Assessment (PISA) (OECD, 1999). The diagram shown here represents
a process that consists of six parts. These six parts represent a logical sequence of steps that
should be addressed, from needing to define a particular skill area, to having specifications for
constructing items, to providing an empirically based interpretation of the scores that are
obtained.
Defining Literacy
Organizing the Domain
Task Characteristics
Identifying and OperationalizingVariables
Validating Variables
Building anInterpretive
Scheme
4
Part 1 of the framework focuses on the working definition for literacy, along with some
of the assumptions that underlie it. In doing so, the definition sets the boundaries for what the
survey seeks to measure as well as what it will not measure. Part 2 provides a discussion on how
we may choose to organize the set of tasks that are constructed to report to policymakers and
researchers on the distribution of a particular skill in the population. Determining how to report
the data should incorporate statistical, conceptual, and political considerations. Part 3 deals with
the identification of a set of key characteristics that will be manipulated by developers when
constructing tasks for a particular skill area. Part 4 identifies and begins to define the variables
associated with the set of key characteristics that will be used in test construction. These
definitions are based on the existing literature and on experience with building and conducting
other large-scale assessments. Part 5 lays out a procedure for validating the variables and for
assessing the contribution each makes toward understanding task difficulty across the various
participating countries. The final part, Part 6, discusses how an interpretative scheme was built
using the variables that have been shown through the research in Part 5 to account for task
difficulty and student performance.
Defining Literacy
Definitions of reading and literacy have changed over time in parallel with changes in our
society, economy, and culture. The growing acceptance of the importance of lifelong learning
has expanded the views and demands of reading and literacy. Literacy is no longer seen as an
ability that is developed during the early school years, but is instead viewed as an advancing set
of skills, knowledge, and strategies that individuals build on throughout their lives in various
contexts and through interaction with their peers and with the larger communities in which they
participate.
Historians remind us that the types and levels of literacy skills necessary for economic
participation, citizenship, parenting, and individual advancement in 1800 were different from
those required by 1900 and from those required in the year 2000 and beyond. We live in a
technologically advancing world, where both the number and types of written materials are
growing and where increasing numbers of citizens are expected to use information from these
materials in new and more complex ways.
As Resnick and Resnick (1977) point out, literacy in its earliest form consisted of
little more than signing one’s name. It was not until much later that fluent oral reading

5
became important, and not until the 20th century that reading to gain information was given
primary emphasis. Standardized tests became fashionable and reading-grade-level scores
became the focus of attention. Through the use of these instruments the term literacy has
implied the acquisition of intellectual skills associated with basic academic competencies
associated with reading and writing. Standards for literacy increased over the decades, from
being able to read at a fourth-grade level, to reading at an eighth-grade level, and then by
the early ’70s, to a 12th-grade level. These measures came under increasing criticism,
however, because they did not provide specific information about the kinds of
competencies that given levels of literacy imply. Perhaps more important was the
recognition that literacy relates not to some arbitrary standard for the purpose of
categorizing people as literate or illiterate, but to what people can do with printed and
written materials and how these skills relate to a host of social needs. As Beach and
Appleman (1984) noted,
The often heard charge, Johnny can’t read is a little like saying Johnny can’t cook.
Johnny may be able to read the directions for constructing a radio kit, but not a Henry
James novel, just as Johnny may be able to fry an egg but not cook Peking duck. In
discussing reading in the schools, we must recognize that reading involves as wide a
range of different types of texts as there are types of food. And, to imply, as does the
slogan, “Johnny can’t read,” that reading is a single skill suited to all types of texts does
not do justice to the range of reading types.
Thus, the multifaceted nature of literacy had often been glossed over through the use of
grade-level equivalent scores.
It was from this multifaceted perspective that several large-scale assessments of literacy
were conducted in Australia (Wickert, 1989), Canada (Montigny, Kelly, & Jones, 1991), and the
United States (Kirsch & Jungeblut, 1986; Kirsch et al., 1993).
In 1992, the Organization for Economic Co-operation and Development (OECD) (OECD
& STAT CAN, 1992) concluded that low literacy levels were a serious threat to economic
performance and social cohesion on an international level. But a broader understanding of
literacy problems across industrialized nations—and consequent lessons for policymakers—was
hindered due to a lack of comparable international data. Statistics Canada (STAT CAN) and
Educational Testing Service (ETS) teamed up to build and deliver an international comparative
6
study. After some discussion and debate, the framework and methodology used in NALS was
applied to the first large-scale International Adult Literacy Survey.
NALS, which was funded by the National Center for Education Statistics (NCES) as part
of its overall assessment program in adult literacy, was the largest and most comprehensive study
of adult literacy ever conducted in the United States. Like all large-scale assessments funded by
the NCES, NALS was guided by a committee, which was comprised of a group of nationally
recognized scholars, practitioners, and administrators who adopted the following definition of
literacy:
Literacy is using printed and written information to function in society,to achieve one’s goals, and to develop one’s knowledge and potential.
This definition captures the initial work of the committee guiding the development of the
assessment, and provides the basis for creating other aspects of the framework to be discussed. It
also carries several assumptions made by panel members; thus, it is important to consider various
parts of this definition in turn.
Literacy is …
The term literacy is used in preference to reading because it is likely to convey more
precisely to a nonexpert audience what the survey is measuring. Reading is often understood as
simply decoding or reading aloud, whereas the intention of the adult surveys is to measure
something broader and deeper. Researchers studying literacy within particular contexts noted
that different cultures and groups may value different kinds of literacy practices (Heath, 1980;
Sticht, 1975; Szwed, 1981). Heath, for example, found that uses for reading could be described
in terms of instrumental, social interactional, news-related, memory supportive, substitutes for
oral messages, provision of a permanent record, and personal confirmation. The fact that people
read different materials for different purposes implies a range of proficiencies that may not be
well captured by signing one’s name, completing a certain number of years of schooling, or
scoring at an eighth-grade level on a test of academic reading comprehension.
… using printed and written information
This phrase draws attention to the fact that panel members view literacy not as a set of
isolated skills associated with reading and writing, but more importantly as the application of
those skills for specific purposes in specific contexts. When literacy is studied within varying
contexts, diversity becomes its hallmark. First, people engage in literacy behaviors for a variety
7
of uses or purposes (Cook-Gumperz & Gumperz, 1981; Heath, 1980; Mikulecky, 1982; Sticht,
1978). These uses vary across contexts (Heath, 1980; Venezky, 1983) and among people within
the same context (Kirsch & Guthrie, 1984a). This variation in use leads to an interaction with a
broad range of materials that have qualitatively different linguistic forms (Diehl, 1980; Jacob,
1982; Miller, 1982). In some cases, these different types of literacy tasks have been associated
with different cognitive strategies or reading behaviors (Crandall, 1981; Kirsch & Guthrie,
1984b; Scribner & Cole, 1981; Sticht, 1978, 1982).
… to function in society, to achieve one’s goals,
and to develop one’s knowledge and potential.
This phrase is meant to capture the full scope of situations in which literacy plays a role
in the lives of adults, from private to public, from school to work, to lifelong learning and active
citizenship. “[T]o achieve one’s goals and to develop one’s knowledge and potential” points to
the view that literacy enables the fulfillment of individual aspirations—both defined ones such as
graduation or obtaining a job, and those less defined and less immediate, which extend and
enrich one’s personal life. The phrase “to function in society” is meant to acknowledge that
literacy provides individuals with a means of contributing to, as well as benefiting from, society.
Literacy skills are generally recognized as important for nations to maintain or improve their
standard of living and to compete in an increasingly global marketplace. Yet, they are equally as
important for individual participation in technologically advancing societies with their formal
institutions, complex legal systems, and large government programs.
Organizing the Domain
Having defined the domain of literacy and having laid out the set of assumptions that
were made in developing the definition, it is important to think about how to organize the
domain. This organization needs to focus on how to report the scores that result from
administering a pool of literacy tasks. This is an important issue because how the domain is
organized can affect test design. Because some believe that reading is not a single, one-
dimensional skill, literacy is not necessarily best represented by a single scale or single score
along that scale. Yet determining how many and which scales should be used for reporting
literacy scores is crucial for ensuring that sufficient numbers of tasks are developed to define and
interpret these scales adequately.
8
Different perspectives can be used to help organize a domain of tasks. Traditionally,
literacy skills have been categorized by modality into reading, writing, speaking, and listening.
Reading and writing are sometimes combined, as they are thought to require similar processes,
and speaking and listening are often grouped in terms of being too costly and difficult to assess.
Thus, they were not included in the survey. Committee members also wanted to include basic
arithmetic calculations as part of the assessment since adults are often required to use printed
information that involves these skills. As a result, this aspect of literacy was also included in the
surveys.
Work in the area of context of literacy clearly provides one possible organizing principle
for what may appear to be a disparate set of literacy tasks. There is the familiar academic or
school context (dealing primarily with prose or connected discourse) contrasted with nonschool
or “everyday life” contexts. And the nonschool contexts can be subdivided into the work-related
and home-related tasks. However, it is operationally difficult to separate tasks along these latter
dimensions since the work and home categories are not mutually exclusive in terms of the
literacy tasks engaged in.
Another organizing principle of some appeal involves categorizing literacy tasks in terms
of the types of materials or formats in which they occur, and to examine the associated purposes
or uses both within and across materials. The appeal for this type of organizational scheme stems
from research literature suggesting that different materials or formats are associated with
different contexts and that a significant proportion of adult reading tasks in the context of work
involve documents (Jacob, 1982; Kirsch & Guthrie, 1984a; Sticht, 1975)—graphs, charts, forms,
and the like—rather than prose. Frequently, these documents are embedded in the contexts of
home or work and community, as contrasted with prose, which is most frequently associated
with school or academia. Moreover, different materials and formats are often associated with
different purposes, and these purposes are frequently associated with different reading strategies.
This line of reasoning led to distinctions such as Sticht’s “reading to do” and “reading to learn.”
As another instance reflecting similar distinctions, the National Assessment of
Educational Progress (NAEP) (1972) came to aggregate reading exercises in terms of
“themes”—word meanings, visual aids, written directions, reference materials, significant facts,
main ideas, inferences, and critical reading. The areas of reference materials and significant facts
were among those in which young adults aged 26-35 performed better than did in-school 17-

9
year-olds, while in-school 17-year-olds performed higher than young adults in inferences and
critical reading. These and other NAEP results suggest the utility of a priori classifications that
allow for the examination of differential performance for subgroups both within a single
assessment and across groups over time.
In the end, a compromise was reached among the various organizing concepts that was
felt to reflect a number of salient notions from the literature. Three scales were hypothesized—a
prose literacy scale, a document literacy scale, and a quantitative literacy scale. In this way, it is
possible to acknowledge that the structure of prose passages are qualitatively different from the
structures associated with documents such as charts, tables, schedules, and the like, and to
provide for a separate scale for those tasks involving the processing of printed information in
combination with arithmetic operations.
The original data from the NAEP Young Adult Literacy Survey (YALS) was subjected to
factor analysis to explore dimensionality (Kirsch & Jungeblut, 1986). Following the logic of
Cattell’s scree test (1966), the breaks in the pattern of latent roots indicated at least three salient
factors, with the possibility of as many as five additional factors. Analysis of parallel random
data reinforced the judgment that a three-factor solution was appropriate. However, for
exploratory purposes, three separate analyses were conducted: In one analysis eight factors were
retained and rotated for interpretation; in another, five factors were retained; and, in the final
analysis, three factors were retained for rotation and interpretation.
In each instance, the factors were rotated to orthogonal simple structure by the varimax
procedure and to oblique simple structure by the DAPPER method (Tucker & Finkbeiner, 1981).
Tasks loading highest on the first and largest factor seemed to rely heavily on prose
comprehension, tasks loading highest on the second factor seemed to reflect skills in using
documents, while tasks loading highest on the third factor required the application of arithmetic
operations.
Interpretation of the five- and eight-factor solutions was much less clear. Although each
revealed three major factors reflecting prose, document, and quantitative operations, for the most
part these rotated solutions provide interesting clues for possible task modification and for future
item development, rather than clear-cut implications for scaling the existing data. That is, if
desired, one could devise a new set of tasks that could isolate a factor reflecting the importance
of procedural knowledge as it might apply, for example, to entering and using information in
10
forms. Alternatively, one might prefer to restrict the impact of this type of knowledge by
eliminating this type of task from the assessment. Thus, the empirical data provided by the
YALS tended not only to support the a priori judgment for the three literacy scales but also
suggested ways in which the assessment could be broadened. It is important to keep in mind that
the three literacy scales are not the only salient dimensions of literacy per se. These dimensions
are likely to shift as a function of different definitions and different perspectives on literacy.
More recent advisory committees involved with NALS and IALS have agreed that
literacy should not be measured along a single continuum and have chosen to adopt the general
definition and three scales defined here. These committees further recommended that new
literacy tasks, which were constructed for each of these assessments, should be developed to
enhance the three existing scales, and that these new tasks should continue to use open-ended
simulation tasks rather than multiple-choice questions and to emphasize measuring a broad range
of information-processing skills covering a variety of contexts.
Identifying Task Characteristics
Almond and Mislevy (1998) note that variables can take on one of five roles in an
assessment or test. They can be used to limit the scope of the assessment, characterize features
that should be used for constructing tasks, control the assembly of tasks into booklets or test
forms, characterize examinees’ performance on or responses to tasks, or help to characterize
aspects of competencies or proficiencies. Some of these variables can be used both to help in the
construction of tasks and the understanding of competencies, as well as in the characterization of
performance. A finite number of characteristics are likely to influence students’ performance on
a set of literacy tasks, and these can be taken into account when constructing or scoring the tasks.
These characteristics, which are thought to be important components of the literacy process,
were manipulated in the development of tasks for IALS. These characteristics include:
• Adult Contexts/Content. Since adults do not read written or printed materials in a
vacuum, but read within a particular context or for a particular purpose, materials for
the literacy assessment are selected that represent a variety of contexts and contents.
This helps ensure that no single group of adults is either advantaged or disadvantaged
due to the context or content included in the assessment.
11
• Materials/Texts. While no one would doubt that a literacy assessment should include a
range of material, what is critical to the design and interpretation of the scores that are
produced are the range and specific features of the text material that are included in
constructing the tasks. Thus, a broad range of both prose and document text types are
included in this survey.
• Processes/Strategies. This refers to the characteristics of the questions and directives
that are given to adults for their response. Generally speaking, the questions and
directives will refer to a goal or purpose the readers are asked to assume while they are
reading and interacting with texts, and relate to one or more strategies that the reader is
likely to use in producing their response.
Identifying and Operationalizing the Variables
In order to use these three main task characteristics in designing the assessment and, later,
in interpreting the results, the task characteristics need to be operationalized. That is, various
values that each of these characteristics can take on must be specified. This will allow item
developers to categorize the materials they are working with and the questions and directives
they construct so that they can be used in the reporting of the results. These variables can also be
used to specify what proportions of the assessment ought to come from each category.
Context/Content
Materials that are selected for inclusion in the assessment need to represent a broad range
of contexts and contents so that no single group is advantaged or disadvantaged in terms of
familiarity or exposure. Six adult context/content categories have been identified as follows:
• Home and family includes materials dealing with interpersonal relationships, personal
finance, housing, and insurance.
• Health and safety includes materials dealing with drugs and alcohol, disease prevention
and treatment, safety and accident prevention, first aid, emergencies, and staying healthy.
• Community and citizenship includes materials dealing with community resources and
staying informed.
• Consumer economics includes materials dealing with credit and banking, savings,
advertising, making purchases, and maintaining personal possessions.

12
• Work includes materials that deal in general with various occupations but not job-specific
texts, finding employment, finance, and being on the job.
• Leisure and recreation includes materials involving travel, recreational activities, and
restaurants.
It is important to note that with respect to this variable, an attempt should be made to
include as broad a range as possible across the six contexts, as well as to select universally
relevant materials. Following this procedure will help to ensure that the content and materials
that are included in the assessment are not so specialized as to be familiar only to certain groups
and that any disadvantages for people with limited background knowledge might be minimized.
Materials/Texts
Reading requires something for the reader to read. In an assessment, that something—a
text—must be coherent within itself. That is, the text must be able to stand alone without
requiring additional printed material. While it is obvious that there are many different kinds of
texts and that any assessment should include a broad range of them, it is not so obvious that there
is an ideal categorization of text types. There are any number of proposals as to the appropriate
categories, many of them created for practical rather than theoretical purposes. All of them share
the fact that no particular physical text seems to fit easily into only one category. For example, a
chapter in a textbook might include some definitions (often identified as a text type), some
instructions on how to solve particular problems (yet another text type), a brief historical
narrative of the discovery of the solution (still another text type), and descriptions of some
typical objects involved in the solution (a fourth text type).
It might be thought that a definition, for example, could be extracted and treated as a
single text for assessment purposes. But this would remove the definition from the context,
create an artificial text type (definitions almost never occur alone, except in dictionaries), and not
allow item writers to create tasks that deal with reading activities that require integrating
information from a definition with information from instructions.
A more important classification of texts, and one at the heart of this assessment, is the
distinction between continuous and noncontinuous texts. Continuous texts are typically
composed of sentences that are, in turn, organized into paragraphs. These may be fit into even
13
larger structures such as sections, chapters, and books. Noncontinuous texts are most frequently
organized in matrix format, based on combinations of lists.
Continuous Texts
Conventionally, continuous texts are formed of sentences organized into paragraphs. In
these texts, organization occurs by paragraph setting, indentation, and the breakdown of text into
a hierarchy signaled by headings that help the reader recognize the organization of the text. Text
types are standard ways of organizing the contents of and author’s purpose for continuous texts.1
1. Description is the type of text where the information refers to properties of objects in
space. Descriptive texts typically provide an answer to what questions.
2. Narration is the type of text where the information refers to properties of objects in time.
Narration texts typically provide answers to when, or in what sequence, questions.
3. Exposition is the type of text in which the information is presented as composite concepts
or mental constructs, or those elements into which concepts or mental constructs can be
analyzed. The text provides an explanation of how the component elements interrelate in
a meaningful whole and often answers how questions.
4. Argumentation is the type of text that presents propositions as to the relationship among
concepts or other propositions. Argument texts often answer why questions. Another
important subclassification of argument texts are persuasive texts.
5. Instruction (sometimes called injunction) is the type of text that provides directions on
what to do.
6. Document or record is a text that is designed to standardize and conserve information. It
can be characterized by highly formalized textual and formatting features.
7. Hypertext is a set of text slots linked together in such a way that the units can be read in
different sequences, allowing readers to follow various routes to the information.
Noncontinuous Texts
Noncontinuous texts are organized differently than continuous texts and so allow the
reader to employ different strategies for entering and extracting information from them. On the
surface, these texts appear to have many different organizational patterns or formats, ranging
from tables and schedules to charts and graphs, and from maps to forms. However, the
organizational pattern for these types of texts, which Mosenthal and Kirsch (1998) refer to as
14
documents, is said to have one of four basic structures: a simple list, a combined list, an
intersected list, or a nested list. Together, these four types of documents make up what they have
called matrix documents, or noncontinuous texts with clearly defined rows and columns. They
are also closely related to other noncontinuous texts that these authors refer to as graphic,
locative, and entry documents.2
1. Matrix Documents. This set of noncontinuous text consists of four types of increasingly
complex documents that have simple lists as their basic unit. A simple list consists of a
label and two or more items, where the label serves as the organizing category and the
items all share at least one feature with the other items in the list. Next are combined lists,
which consist of two or more simple lists. One list in a combined list is always primary
and, as such, is ordered to facilitate looking up information within the list and locating
parallel information within the other lists. Intersected lists are the third type of matrix
document and comprise exactly three lists. Two of the lists form a row and column
defining the cells of the third or intersected list. The fourth and most complex type of
matrix document is the nested list. In order to economize on space, as well as to display
comparative information, designers sometimes combine two or more intersecting lists to
form a nested list. In a nested list, one type of information will be repeated in each of the
intersecting lists. The intersecting list of unemployment rates, for example, may have
separate entries under each month for males and females; in this case, gender would be
nested under month.
2. Graphic Documents. A major function of graphic documents is to provide a succinct
visual summary of quantitative information. Included in this group of documents or
noncontinuous texts are pie charts, bar charts, and line graphs. While these appear to be
very different types of documents on the surface, they all derive or can be transformed
into either a combined, intersecting, or nested list.
3. Locative Documents. Like graphic documents, locative documents or maps portray
information visually. Unlike graphic documents that display quantitative information,
maps either portray the location of persons, places, or things in space, or depict
characteristics of different geographic regions (e.g., types of vegetation or characteristics
of a population).
15
4. Entry Documents. In matrix and graphic documents, the author provides the information
that must be read and used. In contrast, entry documents or forms require the reader to
provide information that can range from very simple to complex. For example, the reader
may be asked to simply check a box; write a single word, number, or phrase; or construct
a series of phrases or sentences. Generally speaking, forms provide the reader with a label
or category for which the reader is asked to provide specifics.
5. Combination Documents. It is important to keep in mind that some displays, especially
graphic documents, rely on the use of other documents for their interpretation. Maps and
graphs, for instance, often include legends that display important information that must
be read and understood. In addition, designers sometimes include more than one
document for display or comparative purposes.
Processes/Strategies
This task characteristic refers to the way in which examinees process text to respond
correctly to a question or directive. It includes the processes used to relate information in the
question (the given information) to the necessary information in the text (the new information),
as well as the processes needed to either identify or construct the correct response from the
information available. Three variables in the reading/literacy research used to investigate tasks
from national and international surveys will be considered here. These are: type of match, type of
information requested, and plausibility of distracting information. They are briefly described
here. They are characterized through a discussion of exemplary tasks in the next section and fully
operationalized in the appendix at the end of this paper.
Type of Match
Four types of matching strategies were identified: locating, cycling, integrating, and
generating. Locating tasks require examinees to match one or more features of information stated
in the question to either identical or synonymous information provided in the text. Cycling tasks
also require examinees to match one or more features of information, but unlike locating tasks,
they require respondents to engage in a series of feature matches to satisfy conditions stated in
the question. Integrating tasks require examinees to pull together two or more pieces of
information from the text according to some type of specified relationship. For example, this
relationship might call for examinees to identify similarities (i.e., make a comparison),
16
differences (i.e., contrast), degree (i.e., smaller or larger), or cause-and-effect relationships. This
information may be located within a single paragraph or it may appear in different paragraphs or
sections of the text. In integrating information, examinees draw upon information categories
provided in a question to locate the corresponding information in the text. They then relate the
text information associated with these different categories based upon the relationship term
specified in the question. In some cases, however, examinees must generate these categories
and/or relationships before integrating the information stated in the text.
In addition to requiring examinees to apply one of these four strategies, the type of match
between a question and the text is influenced by several other processing conditions that
contribute to a task’s overall difficulty. The first of these is the number of phrases that must be
used in the search. Task difficulty increases with the amount of information in the question for
which the examinee must search in the text. For instance, questions that consist of only one
independent clause tend to be easier, on average, than those that contain several independent or
dependent clauses. Difficulty also increases with the number of responses that examinees are
asked to provide. Questions that request a single answer are easier than those that require three or
more answers. Further, questions that specify the number of responses tend to be easier than
those that do not. For example, a question that states, “List the three reasons . . .” would be easier
than one that said, “List the reasons . . .” Tasks are also influenced by the degree to which
examinees have to make inferences to match the given information in a question to
corresponding information in the text, and to identify the requested information. An additive
scoring model defining type of match for prose and document literacy tasks is provided in
Appendix A.
Type of Information Requested
This refers to the kinds of information that readers identify to answer a test question
successfully. The more concrete the requested information, the easier the task is judged to be. In
previous research based on large-scale assessments of adults’ and children’s literacy (Kirsch,
Jungeblut, & Mosenthal, 1998; Kirsch & Mosenthal, 1994), the type of information variable was
scored on a 5-point scale. A score of 1 represented information that was the most concrete and
therefore the easiest to process, while a score of 5 represented information that was the most
abstract and therefore the most difficult to process. For instance, questions that asked examinees
to identify a person, animal, or thing (i.e., imaginable nouns) were said to request highly concrete
17
information and were assigned a value of 1. Questions asking respondents to identify goals,
conditions, or purposes were said to request more abstract types of information. Such tasks were
judged to be more difficult and received a value of 3. Questions that required examinees to
identify an “equivalent” were judged to be the most abstract and were assigned a value of 5. In
such cases, the equivalent tended to be an unfamiliar term or phrase for which respondents had to
infer a definition or interpretation from the text.
Plausibility of Distractors
This concerns the extent to which information in the text shares one or more features with
the information requested in the question but does not fully satisfy what has been requested.
Tasks are judged to be easiest when no distractor information is present in the text. They tend to
become more difficult as the number of distractors increases, as the distractors share more
features with the correct response, and as the distractors appear in closer proximity to the correct
response. For instance, tasks tend to be judged more difficult when one or more distractors meet
some but not all of the conditions specified in the question and appear in a paragraph or section
of text other than the one containing the correct answer. Tasks are judged to be most difficult
when two or more distractors share most of the features with the correct response and appear in
the same paragraph or node of information as the correct response.
At first glance, the skills involved in performing quantitative tasks might appear to be
fundamentally different from those involved in processing prose and document tasks. An
analysis of tasks along this scale shows, however, that processing printed information plays an
important role in affecting the difficulty of quantitative tasks. In general, it appears that many
individuals can perform single arithmetic operations using printed materials when both the
numbers and operations are made explicit. Yet, when the numbers for these same operations
must be extracted from materials that contain similar but irrelevant information, or when the
operations must be inferred, the tasks become increasingly difficult.
As with the prose and document tasks, quantitative tasks require individuals to match
information in a question or directive with information stated in one or more texts where a text
could be either continuous or noncontinuous. In addition, quantitative tasks may require
respondents to deal with plausible distractors when extracting information for an arithmetic
operation. Individuals are also required to process some type of information. While type of
information varies for the prose and document tasks, requested information is always an amount

18
in quantitative tasks. Thus, the process variables for quantitative tasks are type of match and
plausibility of distractors—like those defined for prose and document literacy—plus two
additional variables that are unique to this scale. These are type of calculation and operation
specificity. These two variables are briefly described here. They are more fully characterized
through a discussion of exemplary tasks and fully operationalized in Appendix A.
Type of Calculation
This variable includes both the type of arithmetic operation (addition, subtraction,
multiplication, or division) required and whether that operation must be performed alone or in
combination. Tasks involving multiplication and division tend to be more difficult than those
requiring addition and subtraction, and tasks requiring two or more operations tend to be more
difficult than tasks requiring only a singe operation. Codes for this variable ranged from 1
(easiest) to 5 (most difficult).
Operation Specificity
This variable refers to the process of identifying and sometimes entering numbers into an
arithmetic expression, including determining the appropriate operation to be performed. Tasks
tend to be more difficult when the numbers that must be identified appear in a text and are
neither in column format nor adjacent to each other. Tasks also tend to become more difficult
when the operation(s) is not specified and when the wording in the question or directive does not
contain an explicit semantic relationship statement such as “how many” or “calculate the
difference.” The codes for operation specificity ranged from 1 (easiest) to 9 (most difficult)
based on a set of additive rules reflecting the various facets described here and fully
operationalized in Appendix A.
In previous surveys, the goal has been to develop pools of prose, document, and
quantitative tasks that represent the range of contexts, texts, and processes outlined here, with no
specific requirement for particular numbers of any type of task. The goal was to draw materials
from a wide variety of adult contexts that represented a wide range of linguistic structures such
as those outlined in this paper. With respect to continuous or prose texts, the focus has been on
expository texts since much of what adults read for work and in their community is associated
with this type of discourse. However, some surveys did include narratives and poetry in small
numbers. In terms of processes/strategies, the goal was to engage adults in the full range of
19
processes that might reasonably be associated with each type of material. That is, the goal was to
use the framework to construct questions/directives that were thought to be authentic to the kinds
of information someone might want to understand or use from a particular text.
Validating the Variables
In a previous section, three task characteristics labeled context, texts, and process/strategy
were introduced. It was followed by a section in which each task characteristic was
operationalized into a number of variables. This part of the framework describes a procedure for
validating the set of variables developed from these characteristics that have been shown to
affect task performance and the placement of tasks along each of the reporting scales. This
process borrows heavily from work that has been done in the area of adult literacy where several
national and international surveys have reported data that followed this approach:
• The U.S. Department of Labor’s Literacy Assessment (Kirsch & Jungeblut, 1992)
• The International Association for the Evaluation of Educational Achievement (IEA)
Reading Literacy Study (Kirsch & Mosenthal 1994)
• The National Adult Literacy Survey (Kirsch et al., 1993)
Reading tasks for these surveys were developed to represent a broad range of purposes
for which students and adults read continuous and noncontinuous texts in both school and
nonschool settings. To identify the variables contributing to task difficulty in each of the literacy
domains, Kirsch and Mosenthal (Kirsch et al., 1998; Kirsch & Mosenthal, 1990) began by
modeling the processes required to complete prose, document, and quantitative tasks in the
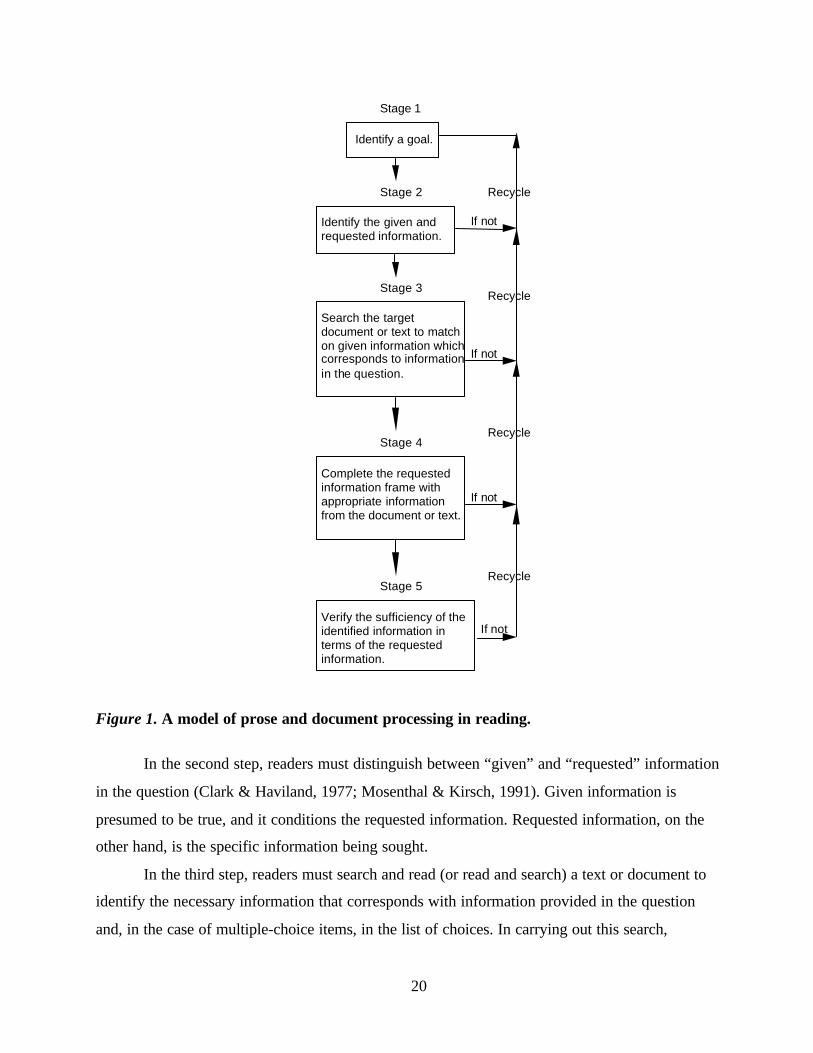
literacy assessments. This model is shown in Figure 1 and grew out of earlier exploratory work
(Fisher, 1981; Guthrie, 1988; Kirsch & Guthrie, 1984b).
In the first step, readers identify a goal or purpose for searching and processing a text or
document. In a test or an instructional situation, questions and directives determine the primary
purpose for interacting with a text or document, and therefore also determine the information that
readers must process in order to complete a cognitive activity. In open-ended tasks, the reader’s
goal is to identify information in the text that meets the conditions set forth in the question or
directive. In multiple-choice tasks, the reader’s goal is to identify information in the text that
meets the conditions set forth in the question or directive and then to select the best choice from
a list of options (Kirsch & Mosenthal, 1994).
20
Stage 1
Identify a goal.
Stage 2
Identify the given and requested information.
Stage 3
Search the target document or text to match on given information which corresponds to information in the question.
Stage 4
Complete the requested information frame with appropriate information from the document or text.
Stage 5
Verify the sufficiency of the identified information in terms of the requested information.
If not
If not
If not
If not
Recycle
Recycle
Recycle
Recycle
Figure 1. A model of prose and document processing in reading.
In the second step, readers must distinguish between “given” and “requested” information
in the question (Clark & Haviland, 1977; Mosenthal & Kirsch, 1991). Given information is
presumed to be true, and it conditions the requested information. Requested information, on the
other hand, is the specific information being sought.
In the third step, readers must search and read (or read and search) a text or document to
identify the necessary information that corresponds with information provided in the question
and, in the case of multiple-choice items, in the list of choices. In carrying out this search,

21
several matches may be tried before one or more adequate matches are achieved. If a literal or
synonymous match is made between requested or given information and corresponding text or
document information, readers may proceed to the next step. If such a match is not deemed
adequate, readers may choose to make a match based on a low- or high-level text-based
inference or on prior knowledge; or readers may recycle to the first step.
This test-taking model of reading can be applied to multiple-choice as well as open-ended
tasks. Based on this model, Kirsch and Mosenthal identified three variables as being among the
best predictors of task difficulty for the prose and document scales. Two additional variables
were constructed for the quantitative scales. These variables (type of requested information, type
of match, plausibility of distractors, type of calculation, and operation specificity) were described
in the previous section and are elaborated in Appendix A.
In order to understand how these variables interact with one another to affect the
difficulty of items developed for the IALS, each literacy scale will be characterized in terms of
several exemplary tasks. Next, these variables will be evaluated in terms of their contribution
toward explaining the placement of literacy tasks along their respective scales.
Characterizing Prose Literacy Tasks
There are 34 tasks ordered along the IALS 500-point prose literacy scale. These tasks
range in difficulty value from 188 to 377. The easiest task (receiving a difficulty value of 188)
22
directs the reader to look at a medicine label to determine the “maximum number of days you
should take this medicine.” In terms of our process variables, type of match (TOM) was scored a
1 because the reader was required to locate a single piece of information that was literally stated
in the medicine label. The label contained only one reference to number of days and this
information was located under the label dosage. Type of information (TOI) was scored a 2
because it asked for a number of days, and plausibility of distractor (POD) received a 1 because
there is no other reference to days in the medicine label.
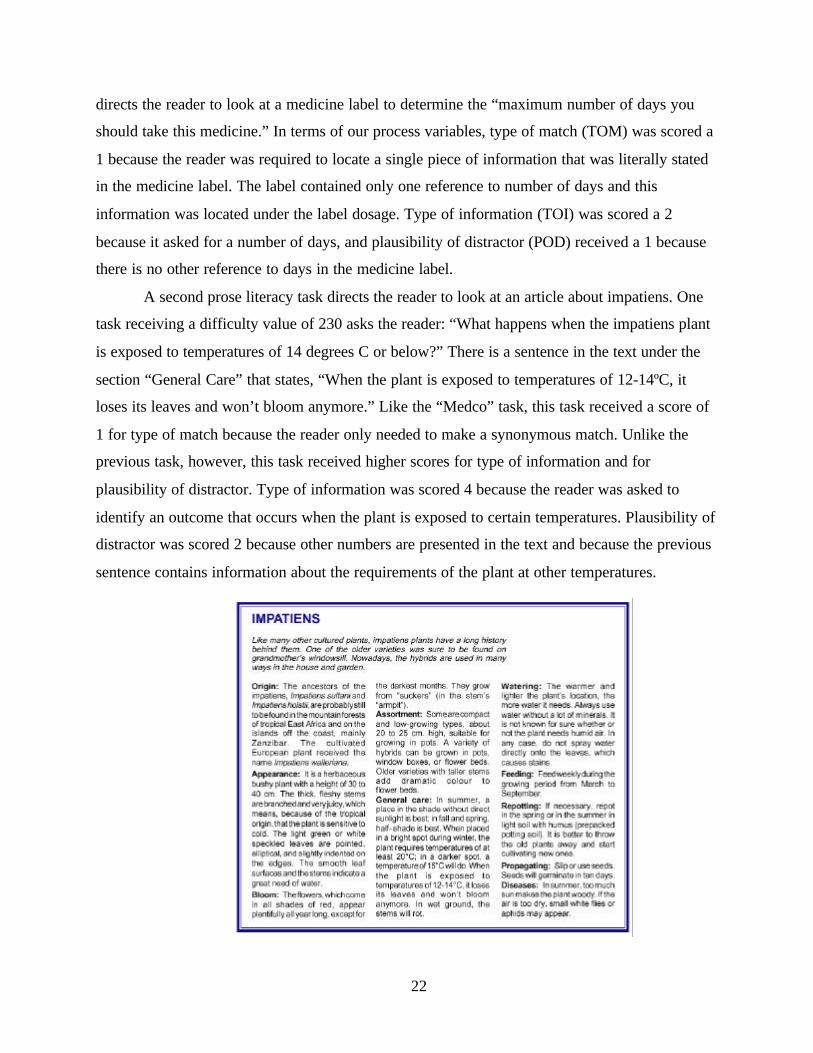
A second prose literacy task directs the reader to look at an article about impatiens. One
task receiving a difficulty value of 230 asks the reader: “What happens when the impatiens plant
is exposed to temperatures of 14 degrees C or below?” There is a sentence in the text under the
section “General Care” that states, “When the plant is exposed to temperatures of 12-14ºC, it
loses its leaves and won’t bloom anymore.” Like the “Medco” task, this task received a score of
1 for type of match because the reader only needed to make a synonymous match. Unlike the
previous task, however, this task received higher scores for type of information and for
plausibility of distractor. Type of information was scored 4 because the reader was asked to
identify an outcome that occurs when the plant is exposed to certain temperatures. Plausibility of
distractor was scored 2 because other numbers are presented in the text and because the previous
sentence contains information about the requirements of the plant at other temperatures.
23
A similar task involving the same text asks the reader to identify “what the smooth leaf
and stem suggest about the plant.” This task received a difficulty value of 254. Again, the task
directed the reader to locate information contained in the text so it was scored 1 for type of
match. The last sentence in the second paragraph under the heading Appearance states: “The
smooth leaf surfaces and the stems indicate a great need of water.” Type of information was
scored a 3 because it directs the reader to identify a condition. Plausibility of distractor was
scored a 3 because the same paragraph contained a sentence that serves to distract a number of
readers. This sentence states, “… stems are branched and very juicy, which means, because of
the tropical origin, that the plant is sensitive to cold.”
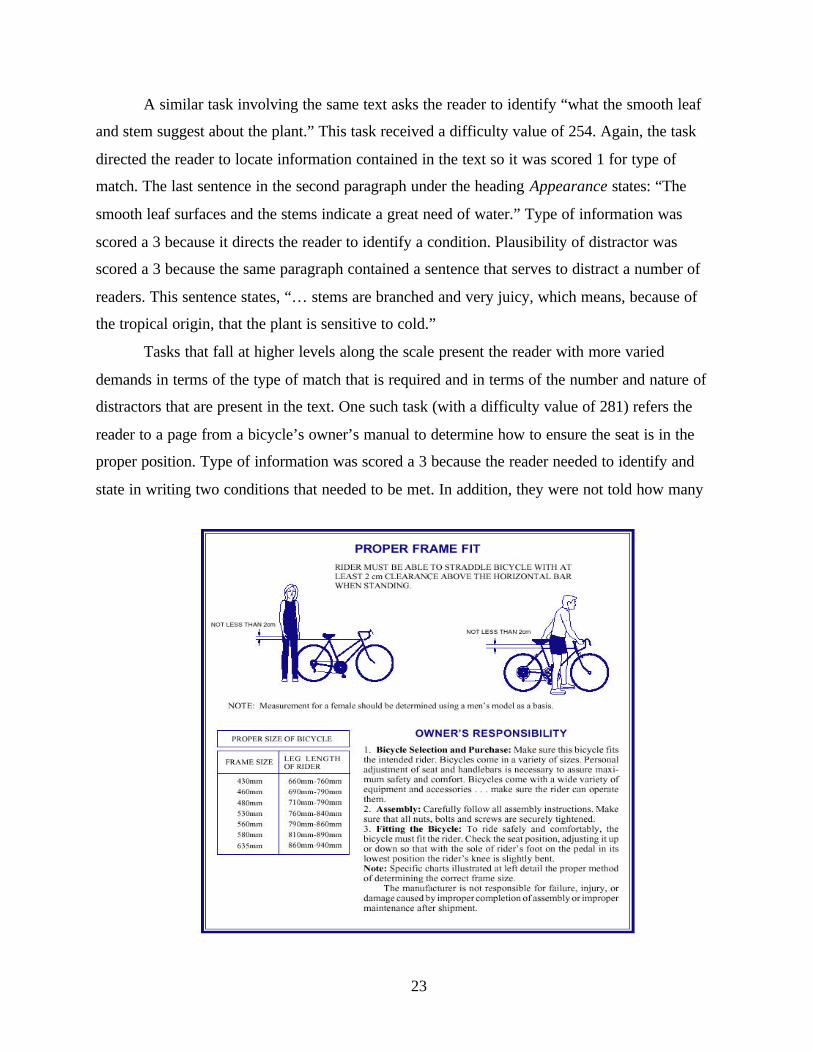
Tasks that fall at higher levels along the scale present the reader with more varied
demands in terms of the type of match that is required and in terms of the number and nature of
distractors that are present in the text. One such task (with a difficulty value of 281) refers the
reader to a page from a bicycle’s owner’s manual to determine how to ensure the seat is in the
proper position. Type of information was scored a 3 because the reader needed to identify and
state in writing two conditions that needed to be met. In addition, they were not told how many
24
features they needed to provide from among those stated. Type of information was also scored a
3 because it involved identifying a condition, and plausibility of distractor received a score of 2.
A somewhat more difficult task (with a difficulty value of 318) involves an article about
cotton diapers and directs the reader to “list three reasons why the author prefers to use
disposable rather than cotton diapers.” This task is made more difficult because of several of our
process variables. First, type of match was scored a 5 because the reader had to provide multiple
responses, each of which required a text-based inference. Nowhere in the text does the author
say, “I prefer cotton diapers because …” These inferences are made somewhat more difficult
because the type of information being requested is a “reason” rather than something more
concrete. This variable received a score of 4. Finally, plausibility of distractor was scored a 3
because the text contains information that may serve to distract the reader.
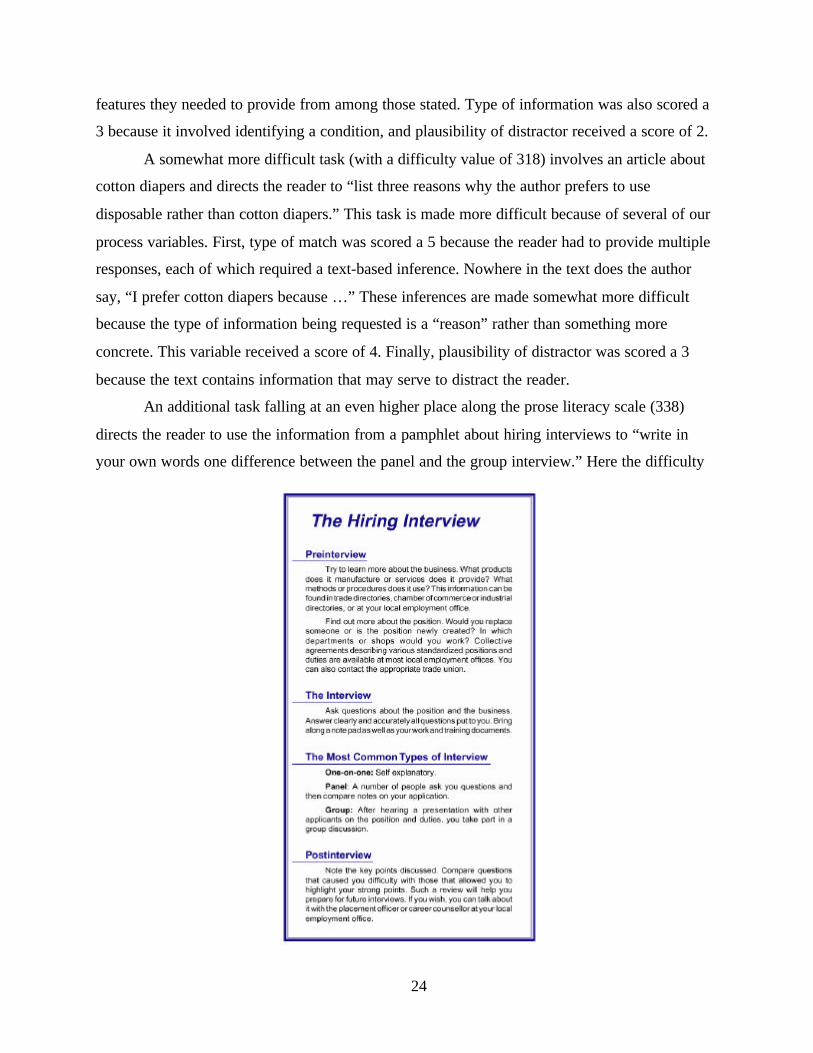
An additional task falling at an even higher place along the prose literacy scale (338)
directs the reader to use the information from a pamphlet about hiring interviews to “write in
your own words one difference between the panel and the group interview.” Here the difficulty

25
does not come from locating information in the text. Rather than merely locating a fact about
each type of interview, readers need to integrate what they have read to infer a characteristic on
which the two types of interviews differ. Experience from other surveys of this kind reveal that
tasks in which readers are asked to contrast information are more difficult, on average, than tasks
in which they are asked to find similarities. Thus, type of match was scored 6. Type of
information was scored 5 because it directs the reader to provide a difference. Differences tend to
be more abstract in that they ask for the identification of distinctive or contrastive features
related, in this case, to an interview process. Plausibility of distractor was scored 1 because no
distracting information was present in the text. Thus, this variable was not seen as contributing to
the overall difficulty of this task.
The most difficult task on the prose literacy scale (377) requires readers to look at an
announcement from a personnel department and to “list two ways in which CIEM (an employee
support initiative within a company) helps people who lose their jobs because of departmental
reorganization.” Type of match was scored 7 because the question contained multiple phrases
26
that the reader needed to keep in mind when reading the text. In addition, readers had to provide
multiple responses and make low text-based inferences. Type of information was scored 3
because readers were looking for a purpose or function, and plausibility of distractor was scored
a 4. This task is made somewhat more difficult because the announcement is organized around
information that is different from what is being requested in the question. Thus, while the correct
information is listed under a single heading, this information is embedded under a list of
headings describing CIEM’s activities for employees looking for other work. Thus, the list of
headings in this text serves as an excellent set of distractors for the reader who does not search
for or locate the phrase in the question containing the conditional information—those who lose
their jobs because of a departmental reorganization.
Evaluating the Contribution of the Variables to Task Difficulty
The Item Response Theory (IRT) scaling procedures that were used in the IALS
constitute a statistical solution to the challenge of establishing one or more scales for a set of
tasks with an ordering of difficulty that is essentially the same for everyone. Each scale can be
characterized in terms of how tasks are ordered along it. The scale point assigned to each task is
the point at which individuals with that proficiency score have a given probability of responding
correctly. In IALS, a response probability of 80% (RP80) was used. This means that individuals
estimated to have a particular scale score are expected to perform tasks at that point on the scale
correctly with an 80% probability. It also means they will have a greater than 80% chance of
performing tasks that are lower on the scale. It does not mean, however, that individuals with
given proficiencies can never succeed at tasks with higher difficulty values; they may do so some
of the time. It does suggest that their probability of success is “relatively” low—that is, the more
difficult the task relative to their proficiency, the lower the likelihood of a correct response.
An analogy might help clarify this point. The relationship between task difficulty and
individual proficiency is much like the high jump event in track and field, in which an athlete
tries to jump over a bar that is placed at increasing heights. Each high jumper has a height at
which he or she is proficient—that is, the jumper can clear the bar at that height with a high
probability of success, and can clear the bar at lower heights almost every time. When the bar is
higher than the athlete’s level of proficiency, however, it is expected that the athlete will be
unable to clear the bar consistently.

27
Once the literacy tasks are placed along each of the scales using the criterion of 80%
(RP80), it is possible to see to what extent the variables associated with task characteristics
explain the placement of tasks along the scales. A multiple regression was run using RP80 as the
dependent variable.3 The independent variables were the three process variables (TOM, TOI, and
POD) used to characterize the prose tasks, plus a traditional measure of readability4 (READ).
The results are shown here in Table 1.
Table 1 shows the zero order correlation of each predictor variable with RP80 along with
the results of the regression analysis. These data reveal that type of match had the largest zero
order correlation with RP80 (.89) and received the largest standardized regression weight,
followed by plausibility of distractor and type of information. Together these variables, along
with readability, accounted for 89% of the variance in predicting RP80 values.
Table 1
Standardized Beta and T-Ratios Representing the Regression of Readability and ProcessVariables Against RP80 Values on Prose Tasks, Along with Their Zero Order Correlation
Variable Beta Coef. T- ratio Significance Corr. w/ RP80
TOM .74 10.0 .00 .89
TOI .16 2.3 .03 .55
POD .20 2.8 .01 .54
READ .11 1.8 .09 .28
Multiple R = .94Adjusted R2 = .87
Easy tasks on the prose literacy scale tended to require readers to make a literal match on
the basis of a single piece of concrete information where few, if any, distractors were present in
the text. Tasks further along the prose scale become somewhat more varied. While some may
still require a single feature match, more distracting information may be present in the text or the
match may require a low text-based inference. Some tasks may require the reader to cycle
through information to arrive at a correct response. Tasks that are more difficult can take on a
28
variety of characteristics. They may still require the reader to make a match, but usually the
reader has to match on multiple features or take conditional information into account. Tasks may
also require the reader to integrate information from within a text or to provide multiple
responses. The most difficult tasks typically require the reader to make higher-level inferences,
process conditional information, and deal with highly plausible distracting information.
Characterizing Document Literacy Tasks
There are 34 tasks ordered along the IALS 500-point document literacy scale. These tasks
range in difficulty value from 182 to 408. One document literacy task with a difficulty value of
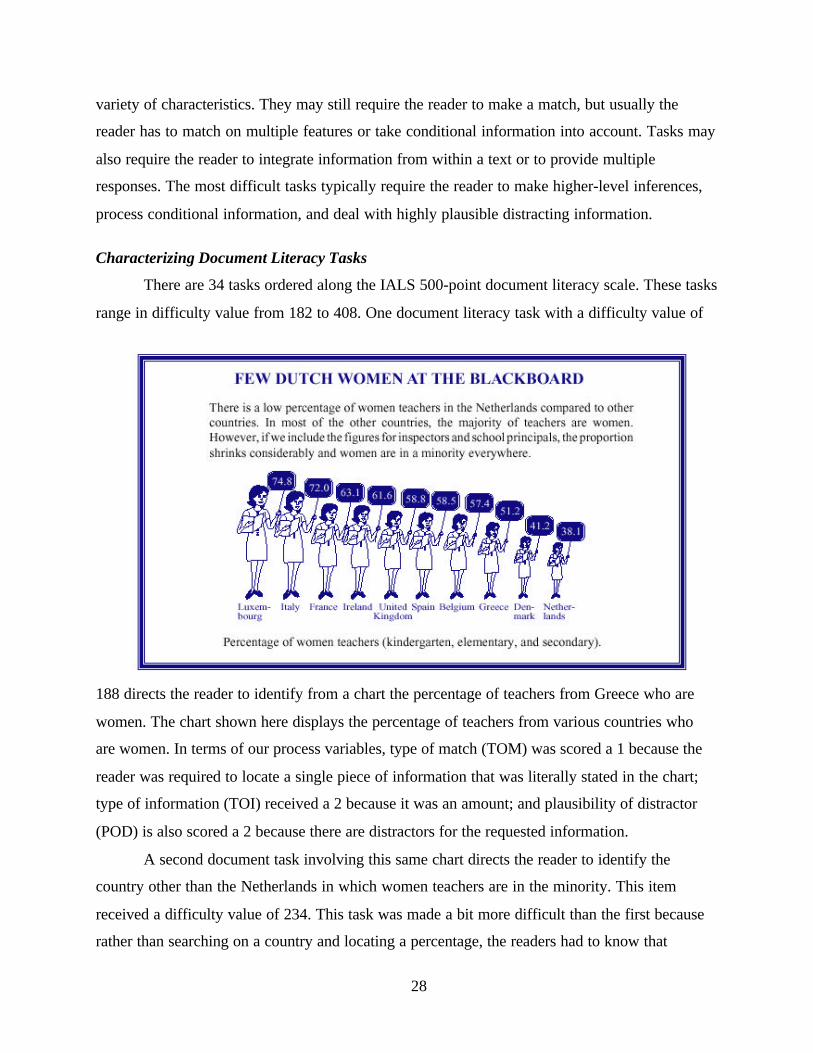
188 directs the reader to identify from a chart the percentage of teachers from Greece who are
women. The chart shown here displays the percentage of teachers from various countries who
are women. In terms of our process variables, type of match (TOM) was scored a 1 because the
reader was required to locate a single piece of information that was literally stated in the chart;
type of information (TOI) received a 2 because it was an amount; and plausibility of distractor
(POD) is also scored a 2 because there are distractors for the requested information.
A second document task involving this same chart directs the reader to identify the
country other than the Netherlands in which women teachers are in the minority. This item
received a difficulty value of 234. This task was made a bit more difficult than the first because
rather than searching on a country and locating a percentage, the readers had to know that
29
minority means less than 50%. Then they had to cycle through to identify the countries in which
the percentage of women teachers was less then 50%. In addition, they had to remember the
condition “other than the Netherlands”; otherwise, they might have chosen it over the correct
response. As a result, type of match was scored a 3; type of information was scored a 1 because
the requested information is a country or place; and plausibility of distractor was given a 2
because there are distractors associated with the requested information.
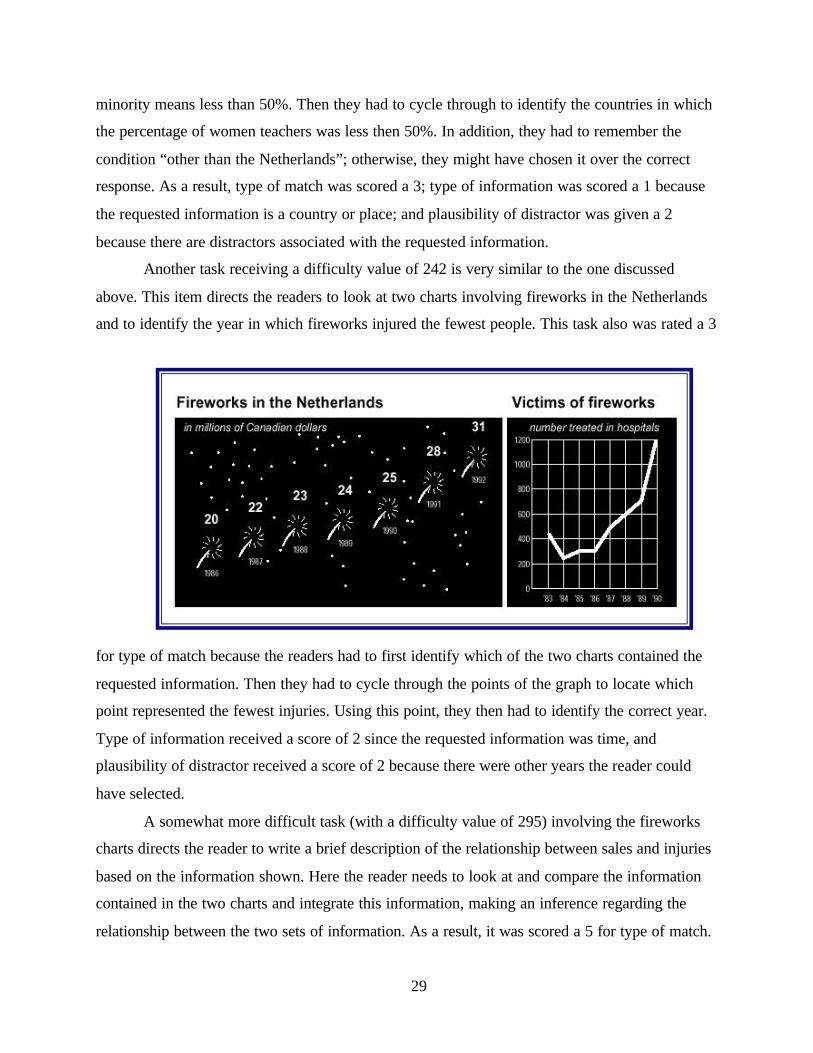
Another task receiving a difficulty value of 242 is very similar to the one discussed
above. This item directs the readers to look at two charts involving fireworks in the Netherlands
and to identify the year in which fireworks injured the fewest people. This task also was rated a 3
for type of match because the readers had to first identify which of the two charts contained the
requested information. Then they had to cycle through the points of the graph to locate which
point represented the fewest injuries. Using this point, they then had to identify the correct year.
Type of information received a score of 2 since the requested information was time, and
plausibility of distractor received a score of 2 because there were other years the reader could
have selected.
A somewhat more difficult task (with a difficulty value of 295) involving the fireworks
charts directs the reader to write a brief description of the relationship between sales and injuries
based on the information shown. Here the reader needs to look at and compare the information
contained in the two charts and integrate this information, making an inference regarding the
relationship between the two sets of information. As a result, it was scored a 5 for type of match.
30
Type of information received a 4 because the requested information is asking for a pattern or
similarity in the data. Plausibility of distractor was scored 3, primarily because both given and
requested information is present in the task. For example, one of the things that may have
contributed to the difficulty of this task is the fact that the sales graph goes from 1986 to 1992,
while the injuries graph goes from 1983 to 1990. The reader should have compared the
information from the two charts for the comparable period of time.
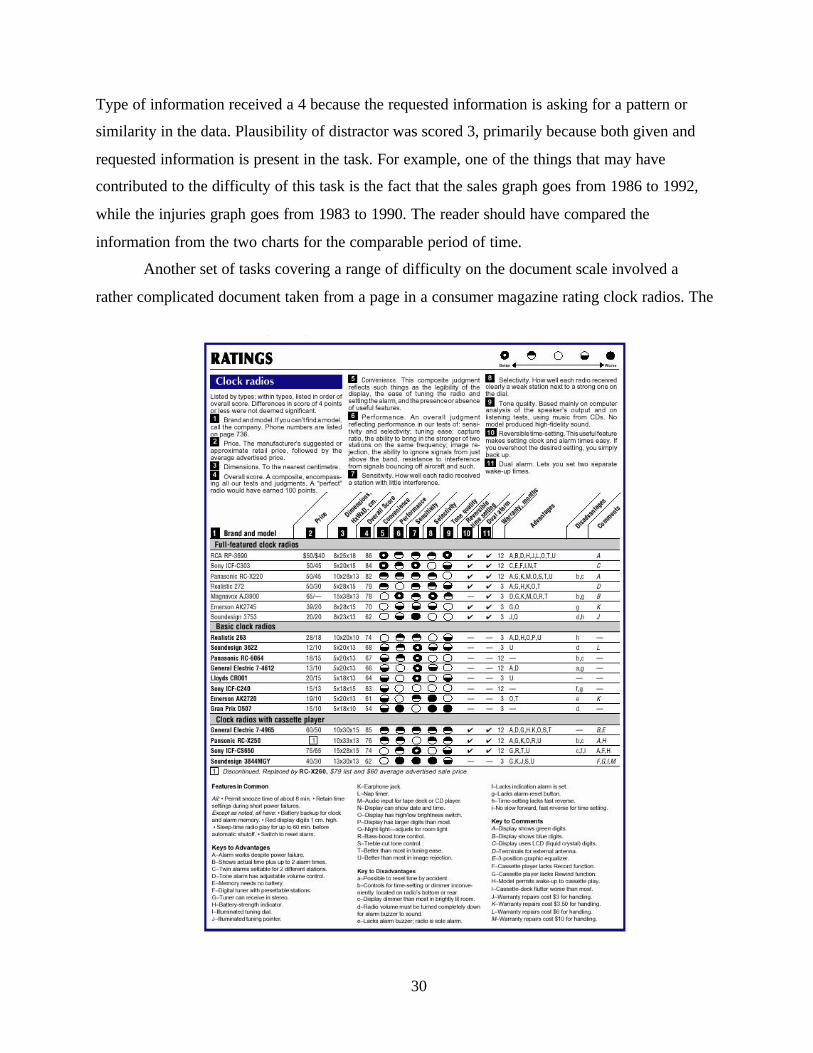
Another set of tasks covering a range of difficulty on the document scale involved a
rather complicated document taken from a page in a consumer magazine rating clock radios. The
31
easiest of the three tasks, receiving a difficulty value of 287, asks the reader: “Which two
features are not on any basic clock radio?” In looking at the document, the reader has to cycle
through the document to find the listing for basic clock radios and then determine that a dash
represents the absence of a feature. The reader then has to locate the two features indicated by
the set of dashes. As a result, type of match received a score of 4 because it is a cycle requiring
multiple responses with a condition or low text-based inference. Type of information was scored
a 2 because its features are attributes of the clock radio, and plausibility of distractor is a 2
because there are some characteristics that are not associated with other clock radios.
A somewhat more difficult task associated with this document received a difficulty value
of 327 and asks the reader: “Which full-featured clock radio is rated highest on performance?”
Here, the reader must make a three-feature match (full-featured, performance, and highest),
where one of the features requires the reader to process conditional information. It is possible,
for example, that some readers were able to find the full-featured clock radios and the column
listed under performance but selected the first clock radio listed, assuming it was the one rated
highest. In this case, they did not understand the conditional information, which is a legend
stating what the symbols mean. Others may have gone to the column labeled “Overall Score”
and found the highest numerical number and chosen the clock radio associated with it. For these
reasons, type of match received a score of 4 and plausibility of distractor was scored a 3. Type of
information received a 1 because the requested information is a thing.
The most difficult task associated with this document (with a difficulty value of 408) asks
the reader to identify the average advertised price for the basic clock radio receiving the highest
overall score. This task was made more difficult because the reader had to match four rather than
three features; the reader also had to process conditional information, and there was a highly
plausible distractor in the same node as the correct answer. As a result of these factors, type of
match received a score of 5, type of information a score of 2, and plausibility of distractor a score
of 5.
Evaluating the Contribution of the Variables to Task Difficulty
As with the prose scale, IRT was used to establish the document literacy scale as well as
to characterize tasks along it. Again, a response probability of 80% was used as an indicator that
someone at a specified point on the document literacy scale has mastered or is proficient with
tasks at that place on the scale. It does not mean that they cannot perform tasks above their
32
estimated proficiency; rather, they may do so, but with less consistency. Their expected
consistency on tasks above their level of proficiency depends on how far the task is from their
estimated proficiency.
Once the document literacy tasks are placed along each of the scales using the criterion of
80% (RP80), it is possible to determine to what extent the variables associated with the task
characteristics explain the placement of tasks along the scales. A multiple regression was run
using RP80 as the dependent variable (see note number 3). The independent variables were the
three process variables (TOM, TOI, and POD) used to characterize the prose and document
literacy tasks, plus a newly developed measure of document readability (READ) (Mosenthal &
Kirsch, 1998).5 The results are shown here in Table 2.
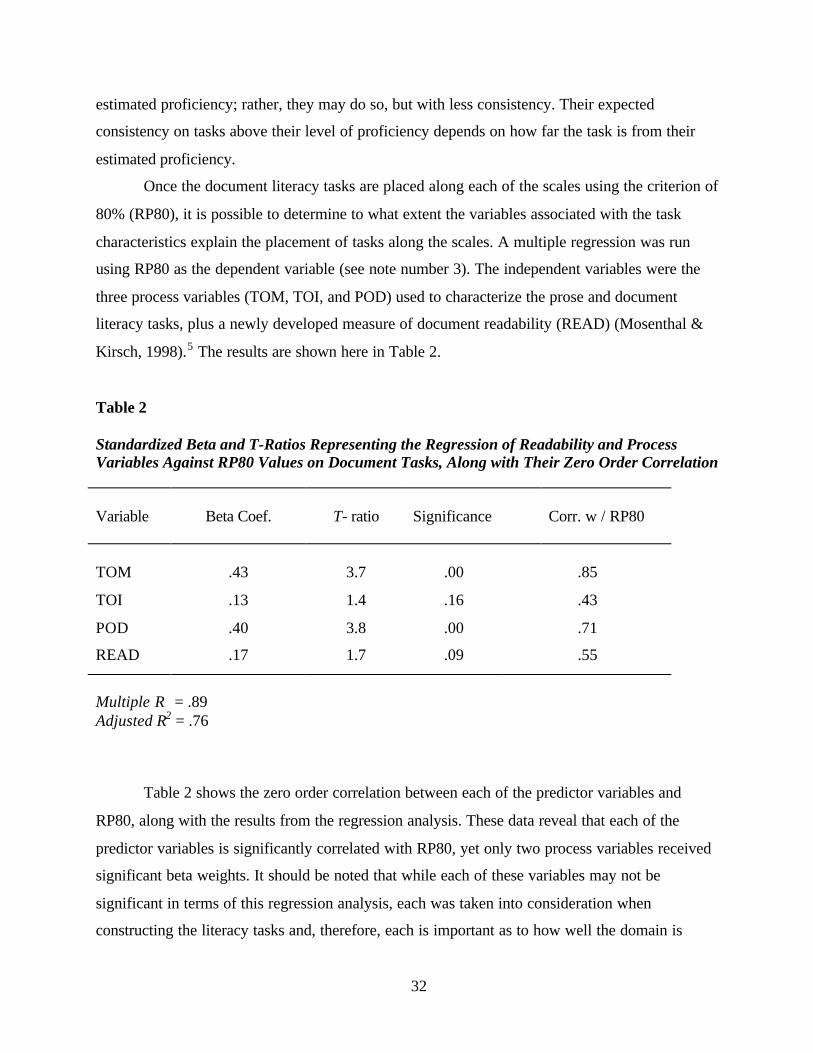
Table 2
Standardized Beta and T-Ratios Representing the Regression of Readability and ProcessVariables Against RP80 Values on Document Tasks, Along with Their Zero Order Correlation
Variable Beta Coef. T- ratio Significance Corr. w / RP80
TOM .43 3.7 .00 .85
TOI .13 1.4 .16 .43
POD .40 3.8 .00 .71
READ .17 1.7 .09 .55
Multiple R = .89Adjusted R2 = .76
Table 2 shows the zero order correlation between each of the predictor variables and
RP80, along with the results from the regression analysis. These data reveal that each of the
predictor variables is significantly correlated with RP80, yet only two process variables received
significant beta weights. It should be noted that while each of these variables may not be
significant in terms of this regression analysis, each was taken into consideration when
constructing the literacy tasks and, therefore, each is important as to how well the domain is
33
represented. Together the set of variables accounted for 79% of the variance in RP80 values.
Type of match received the largest standardized regression weight, followed by plausibility of
distractors.
Easy tasks on the document literacy scale tended to require readers to make a literal
match on the basis of a single piece of information. Tasks further along the document scale
become somewhat more varied. While some may still require a single feature match, more
distracting information may be present in the document or the match may require a low text-
based inference. Some tasks may require the reader to cycle through information to arrive at a
correct response. Tasks that are more difficult can take on a variety of characteristics. They may
still require the reader to make a match, but usually the reader has to match on multiple features
or take conditional information into account. Tasks may also require the reader to integrate
information from one or more documents, or cycle through a document to provide multiple
responses. The most difficult tasks typically require the reader to match on multiple features, to
cycle through documents, and to integrate information. Frequently, these tasks require the reader
to make higher-level inferences, process conditional information, and deal with highly plausible
distractors. These tasks also tend to be associated with more complex displays of information.
Characterizing Quantitative Literacy Tasks
There are 33 tasks ordered along the IALS 500-point quantitative literacy scale. These
tasks range in difficulty value from 225 to 409. The easiest quantitative literacy task (with a
difficulty value of 225) directs the reader to complete an order form. The last line on this form
says, “Total with Handling.” The line above it says, “Handling Charge $2.00.” The reader simply
had to add the $2.00 to the $50.00 they had entered on a previous line to indicate the cost of the
tickets. In terms of our process variables, this item received a code of 1. The design of the form
set the problem up in simple column format for the reader and the amount for handling was
stipulated, so there was little required of them in terms of type of match (TOM) or plausibility of
distractor (POD). In addition, the last line on the form said, “Total with Handling,” indicating the
type of operation and the numbers did not require the reader to carry or borrow. As a result, both
type of calculation (TOC) and operation specificity (OSP) were each coded 1.
A second quantitative literacy task directs the reader to use a weather chart in a
newspaper to determine how many degrees warmer today’s high temperature is expected to be in
Bangkok than in Seoul. This item received a difficulty value of 255. This task was made more
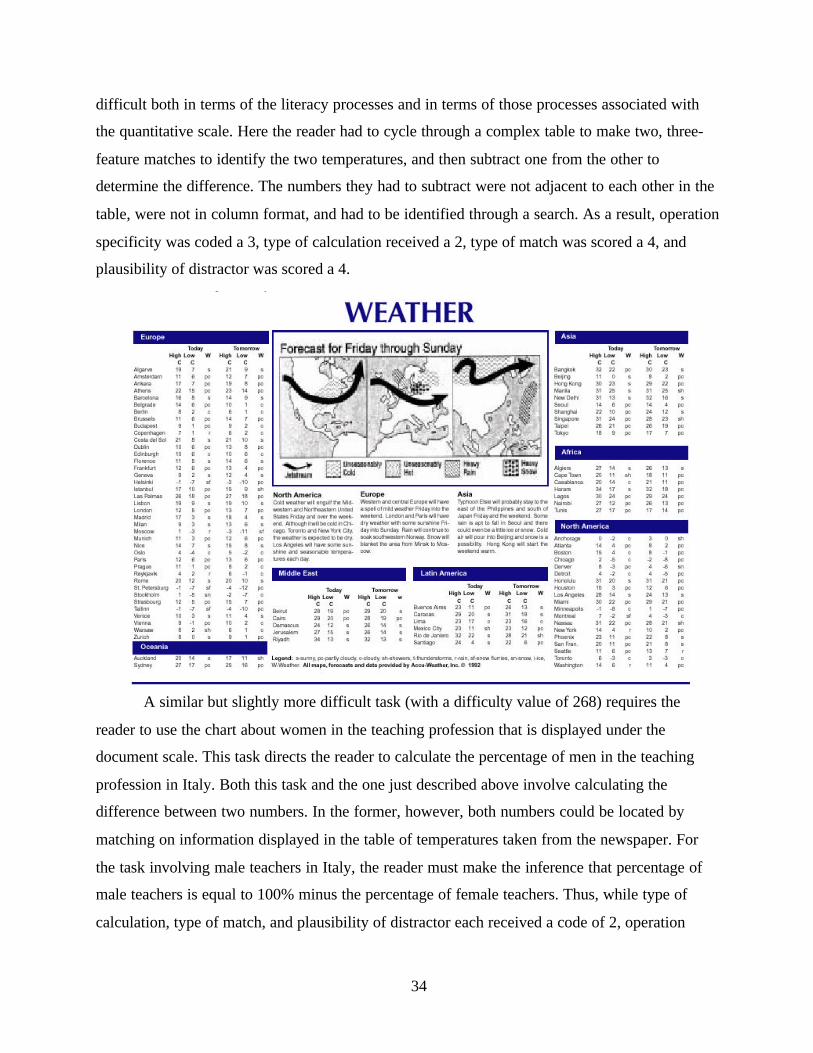
34
difficult both in terms of the literacy processes and in terms of those processes associated with
the quantitative scale. Here the reader had to cycle through a complex table to make two, three-
feature matches to identify the two temperatures, and then subtract one from the other to
determine the difference. The numbers they had to subtract were not adjacent to each other in the
table, were not in column format, and had to be identified through a search. As a result, operation
specificity was coded a 3, type of calculation received a 2, type of match was scored a 4, and
plausibility of distractor was scored a 4.
A similar but slightly more difficult task (with a difficulty value of 268) requires the
reader to use the chart about women in the teaching profession that is displayed under the
document scale. This task directs the reader to calculate the percentage of men in the teaching
profession in Italy. Both this task and the one just described above involve calculating the
difference between two numbers. In the former, however, both numbers could be located by
matching on information displayed in the table of temperatures taken from the newspaper. For
the task involving male teachers in Italy, the reader must make the inference that percentage of
male teachers is equal to 100% minus the percentage of female teachers. Thus, while type of
calculation, type of match, and plausibility of distractor each received a code of 2, operation
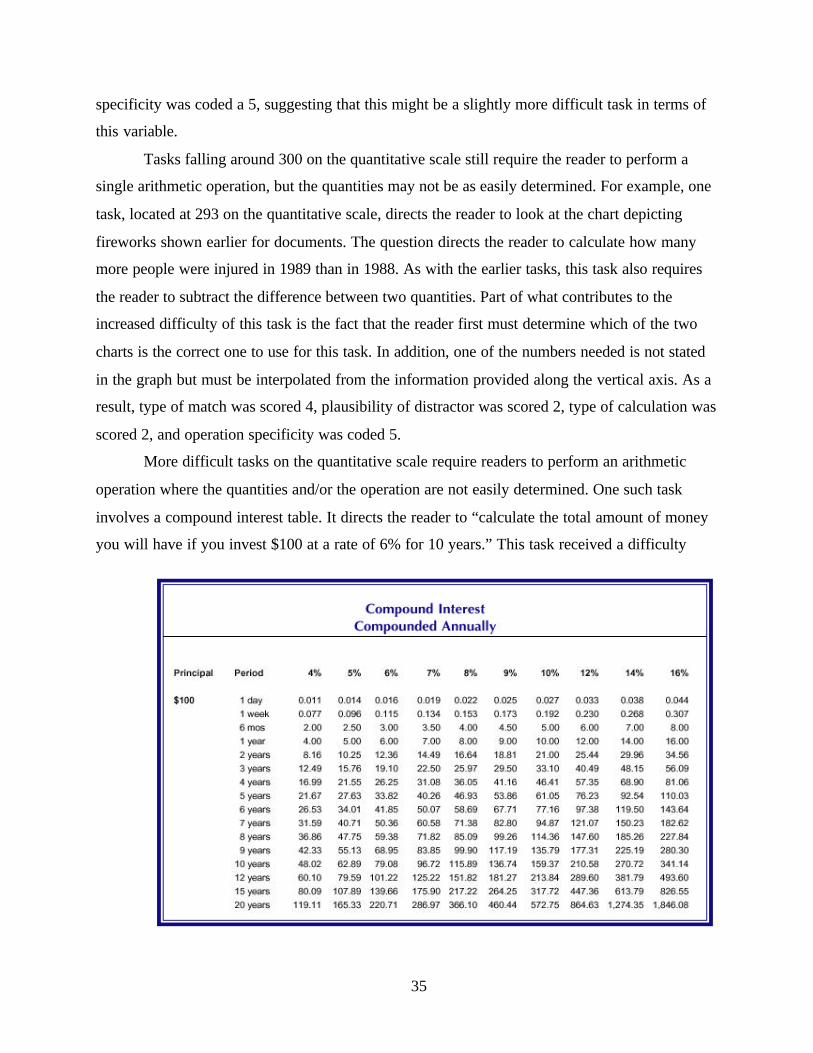
35
specificity was coded a 5, suggesting that this might be a slightly more difficult task in terms of
this variable.
Tasks falling around 300 on the quantitative scale still require the reader to perform a
single arithmetic operation, but the quantities may not be as easily determined. For example, one
task, located at 293 on the quantitative scale, directs the reader to look at the chart depicting
fireworks shown earlier for documents. The question directs the reader to calculate how many
more people were injured in 1989 than in 1988. As with the earlier tasks, this task also requires
the reader to subtract the difference between two quantities. Part of what contributes to the
increased difficulty of this task is the fact that the reader first must determine which of the two
charts is the correct one to use for this task. In addition, one of the numbers needed is not stated
in the graph but must be interpolated from the information provided along the vertical axis. As a
result, type of match was scored 4, plausibility of distractor was scored 2, type of calculation was
scored 2, and operation specificity was coded 5.
More difficult tasks on the quantitative scale require readers to perform an arithmetic
operation where the quantities and/or the operation are not easily determined. One such task
involves a compound interest table. It directs the reader to “calculate the total amount of money
you will have if you invest $100 at a rate of 6% for 10 years.” This task received a difficulty
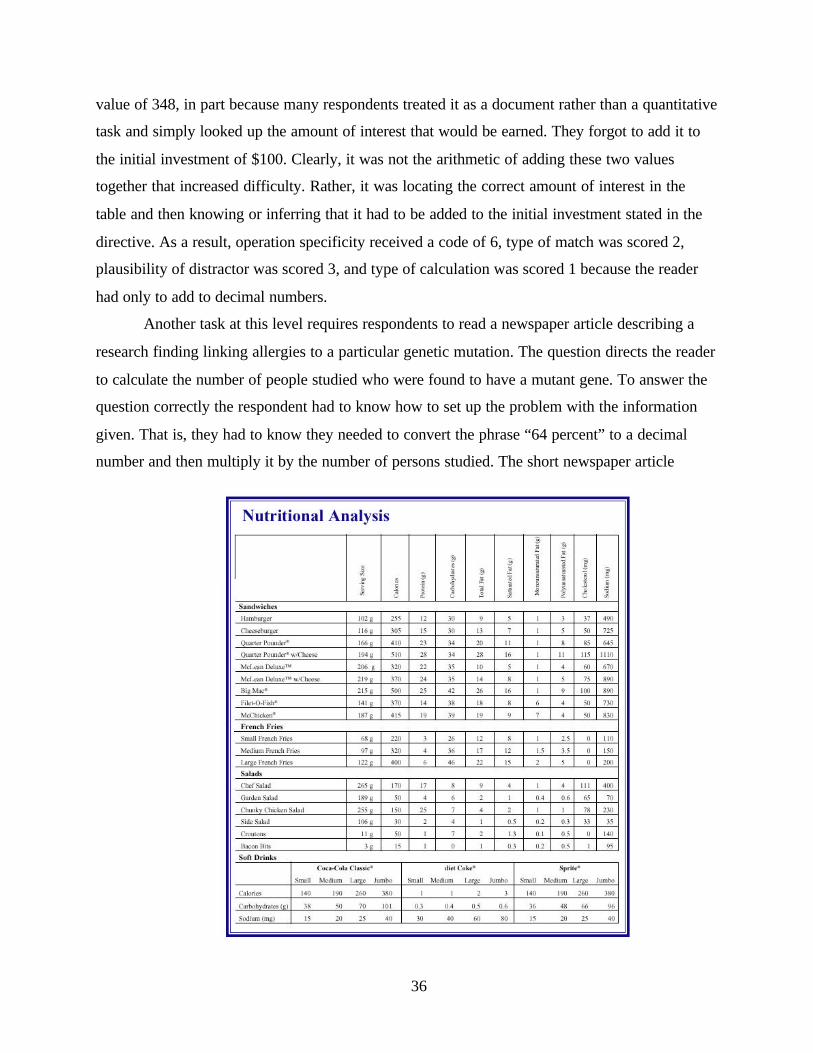
36
value of 348, in part because many respondents treated it as a document rather than a quantitative
task and simply looked up the amount of interest that would be earned. They forgot to add it to
the initial investment of $100. Clearly, it was not the arithmetic of adding these two values
together that increased difficulty. Rather, it was locating the correct amount of interest in the
table and then knowing or inferring that it had to be added to the initial investment stated in the
directive. As a result, operation specificity received a code of 6, type of match was scored 2,
plausibility of distractor was scored 3, and type of calculation was scored 1 because the reader
had only to add to decimal numbers.
Another task at this level requires respondents to read a newspaper article describing a
research finding linking allergies to a particular genetic mutation. The question directs the reader
to calculate the number of people studied who were found to have a mutant gene. To answer the
question correctly the respondent had to know how to set up the problem with the information
given. That is, they had to know they needed to convert the phrase “64 percent” to a decimal
number and then multiply it by the number of persons studied. The short newspaper article
37
provided no clues on how to set up this problem. As a result, type of calculation was coded 3
because it involved a multiplication, and operation specificity was coded 6 because it required
the reader to convert to a decimal and to infer the operation that was needed. Type of match and
plausibility of distractor each received a code of 1.
One of the most difficult quantitative literacy tasks directs the reader to look at a table
providing nutritional analysis of food and then, using the information given, determine the
percentage of calories in a Big Mac® that comes from total fat. This task was at 381 on the scale
as a result of how readers responded to this task. To answer this question, readers first must cycle
through a long table with lots of distractors to identify the correct numbers needed for this task.
Next, they must recognize that the information about total fat is provided in grams. Therefore,
they must convert the number of fat grams to calories before calculating this number of calories
as a percentage of the total calories given for a Big Mac®. As a result, type of match and
plausibility of distractor each received a code of 4. Type of calculation was scored a 5 because
the task required multiple calculations, and operation specificity received a score of 9 because of
the inferencing needed to discern the features of the problem and to set it up correctly.
Evaluating the Contribution of the Variables to Task Difficulty
As with the prose and document scales, IRT was used to establish the quantitative
literacy scale as well as to characterize tasks along it. Again, a response probability of 80% was
used as an indicator that someone at a specified point on the quantitative literacy scale has
mastered or is proficient with tasks at that place on the scale. It does not mean that they cannot
perform tasks above their estimated proficiency; rather, they may do so, but with less
consistency. Their expected consistency on tasks above their level of proficiency depends on
how far the task is from their estimated proficiency.
Once the quantitative literacy tasks are placed along the scale using the criterion of 80%
(RP80), it is possible to determine to what extent the variables associated with task
characteristics explain the placement of tasks along the scales. A multiple regression was run
using RP80 as the dependent variable (see note 3). The independent variables were the two
process variables used to characterize the prose and document literacy tasks—type of match
(TOM) and plausibility of distractor (POD)—plus a newly developed measure of document
readability (READ) (Mosenthal & Kirsch, 1998).6 Type of information (TOI) is a constant on
this scale since each question requires the reader to determine an amount. In addition, we
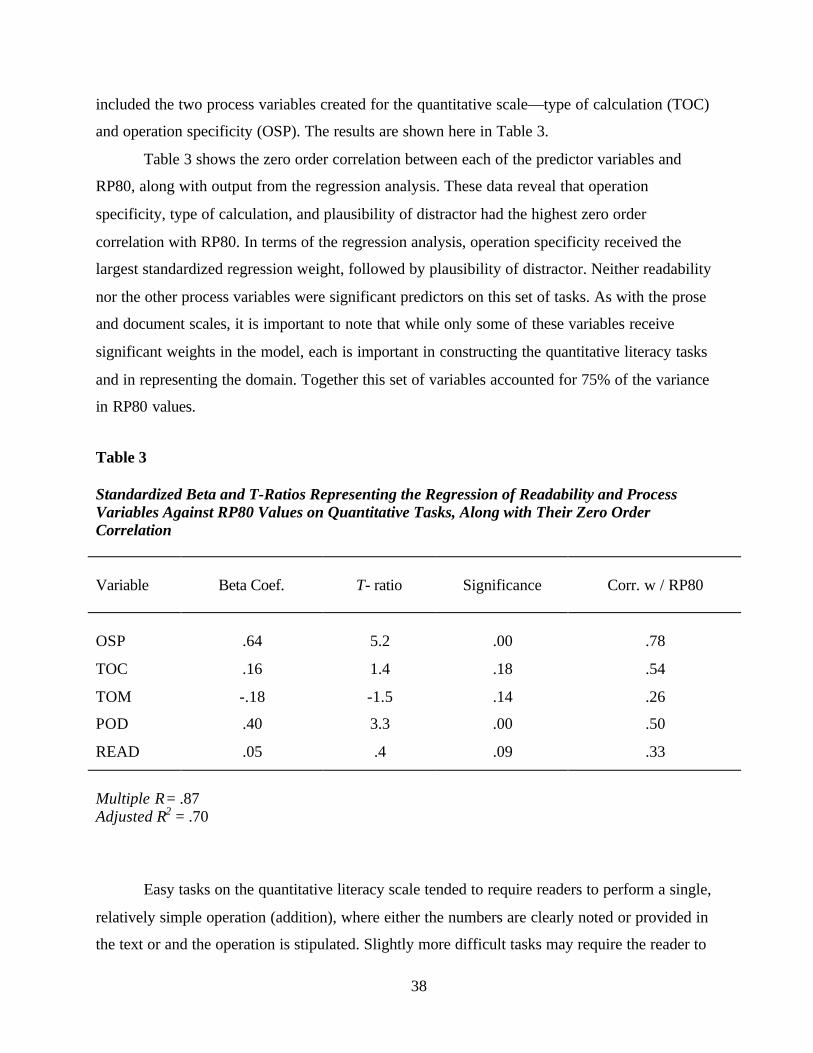
38
included the two process variables created for the quantitative scale—type of calculation (TOC)
and operation specificity (OSP). The results are shown here in Table 3.
Table 3 shows the zero order correlation between each of the predictor variables and
RP80, along with output from the regression analysis. These data reveal that operation
specificity, type of calculation, and plausibility of distractor had the highest zero order
correlation with RP80. In terms of the regression analysis, operation specificity received the
largest standardized regression weight, followed by plausibility of distractor. Neither readability
nor the other process variables were significant predictors on this set of tasks. As with the prose
and document scales, it is important to note that while only some of these variables receive
significant weights in the model, each is important in constructing the quantitative literacy tasks
and in representing the domain. Together this set of variables accounted for 75% of the variance
in RP80 values.
Table 3
Standardized Beta and T-Ratios Representing the Regression of Readability and ProcessVariables Against RP80 Values on Quantitative Tasks, Along with Their Zero OrderCorrelation
Variable Beta Coef. T- ratio Significance Corr. w / RP80
OSP .64 5.2 .00 .78
TOC .16 1.4 .18 .54
TOM -.18 -1.5 .14 .26
POD .40 3.3 .00 .50
READ .05 .4 .09 .33
Multiple R = .87Adjusted R2 = .70
Easy tasks on the quantitative literacy scale tended to require readers to perform a single,
relatively simple operation (addition), where either the numbers are clearly noted or provided in
the text or and the operation is stipulated. Slightly more difficult tasks may require the reader to
39
perform either an addition or a subtraction with numbers that are relatively easy to locate in the
text but where the operation can be easily inferred from the wording in the question or directive.
Tasks further along the quantitative scale become more varied both in terms of the type of
operation they may be asked to perform, and in terms of the extent to which the numbers are
embedded in more complex displays or the amount of inferencing that may be required to
determine the appropriate operation that is needed. A distinguishing characteristic of the most
difficult tasks along this scale is the fact that the reader is required to perform multiple operations
sequentially and they must discern the features of the problem from the material and directive
given.
Building an Interpretative Scheme
Identifying and validating a set of variables that predict performance along each of the
literacy scales provides a basis for building an interpretative scheme. This scheme provides a
useful means for exploring the progression of information-processing demands across each of the
scales and what scores along a particular scale mean. Thus, it contributes to the construct validity
of inferences based on scores from a measure (Messick, 1989). This section summarizes an
interpretative scheme that was adopted by IALS. The procedure builds on Beaton’s anchored
proficiency procedures (Beaton & Allen, 1992; Messick, Beaton, & Lord, 1983), but it is more
flexible and inclusive than the one originally developed and used in the 1980s by NAEP. It has
been used in various large-scale surveys of literacy in North America (Kirsch & Jungeblut, 1992;
Kirsch et al., 1993).
As shown in the previous section of this paper, there is empirical evidence that a set of
variables can be identified that summarize some of the skills and strategies that are involved in
accomplishing various kinds of prose, document, and quantitative literacy tasks. More difficult
tasks tend to feature more varied and complex information-processing demands than are required
by easier tasks. This suggests that literacy is neither a single skill suited to all types of tasks nor
an infinite number of skills each associated with a particular type of task.
In the North American literacy surveys, when researchers coded each literacy task in
terms of the process variables described in this paper they noted that the values for these
variables tended to “shift” at various places along each of the literacy scales. These places
seemed to be around 50-point intervals, beginning around 225 on each scale (Kirsch et al., 1998).
While most of the tasks at the lower end of the scales had code values of 1 on each of the process

40
variables, tasks with scores around 225 were more likely to have code values of 2. Among tasks
with scores around 275, many of the codes were 2s and an increasing number were 3s. Among
tasks with response probability values of 325, at least one of the three variables had a code value
of 4. Code values of 4 or higher predominated tasks at around 375 or higher on the literacy
scales.
Although there were some variations across the literacy scales at the points where the
coding shifts occurred, the patterns were remarkably consistent. Further, as was shown in this
paper with the IALS tasks, this system of coding tasks accounts for much (although not all) of
the variance associated with tasks along the literacy scales. Based on these findings, researchers
defined five levels of proficiency having the following score ranges:
Level 1: 0–225
Level 2: 226–275
Level 3: 276–325
Level 4: 326–375
Level 5: 376–500
Once the literacy levels were identified based on the noted shifts in code values for the
three process variables, criteria were identified that would describe the placement of tasks within
these levels. These criteria are summarized along with the data to which they were applied in a
chapter appearing in the IALS technical report (Kirsch et al., 1998). Based on evidence resulting
from this work, the five literacy levels were used for reporting results from literacy surveys in
both national and international surveys using these literacy scales.
One of the advantages resulting from this approach for reporting results is the fact that it
is possible to estimate the probability that an individual who is estimated to be in a particular
literacy level will be able to perform the typical task in that level and in other levels. Unlike
traditional test scores, which provide a single estimate of ability, these probability estimates offer
a richer and more accurate reflection of the range of tasks that a person can be expected to
perform successfully. After all, while each individual task used in an assessment is of some
interest and importance, we are more likely to be interested in the class of tasks each item is
intended to represent—that is, items that have similar characteristics and that we want to
generalize outside the testing situation. Any assessment is likely to be more useful if we are able
41
to generalize from the particular items used in the survey to the set of behaviors we are most
concerned about.
These results mean that the literacy levels not only provide a means for exploring the
progression of information-processing demands across each of the literacy scales, but they also
can be used to help explain how the proficiencies demonstrated by various countries and various
subpopulations reflect the likelihood they will respond correctly to a broad range of tasks used
not only in IALS but to tasks having similar characteristics as well. In practical terms, this means
that individuals performing at 250 on a literacy scale are expected to be able to perform the
average Level 1 and Level 2 task with a high degree of proficiency. That is, they are expected to
be able to perform these kinds of tasks with an average probability of 80% or higher. It is
important to note that this does not mean they will not be able to perform correctly on literacy
tasks in Levels 3 or higher. They will be expected to do so some of the time, but not with the
same level of consistency.
The three tables shown here (Tables 4, 5, and 6) display the probability that individuals
performing at selected points on each of the scales will give a correct response to tasks of
varying difficulty. For example, Table 4 shows that a reader whose prose proficiency is 150 has
less than a 50% chance of giving a correct response to the Level 1 tasks. Individuals whose
proficiency score is 200, in contrast, have about an 80% probability of responding correctly to
these tasks.
In terms of task demands, it can be inferred that adults performing at 200 on the prose
scale are likely to be able to locate a single piece of information in a brief text when there is no
distracting information, or if plausible but incorrect information is present but located away from
the correct answer. However, these individuals are likely to encounter far more difficulty with
tasks in Levels 2 through 5. For example, they would have only a 40% chance of performing the
average Level 2 task correctly, an 18% chance of success with tasks in Level 3, and no more than
a 7% chance with tasks in Levels 4 and 5.
In contrast, respondents demonstrating a proficiency of 300 on the prose scale have about
an 80% chance or higher of succeeding with tasks in Levels 1, 2, and 3. This means that they
demonstrate success with tasks that require them to make low-level inferences and with those
that entail taking some conditional information into account. They can also integrate or compare
and contrast information that is easily identified in the text. On the other hand, they are likely to
42
encounter difficulty with tasks where they must make more sophisticated text-based inferences,
or where they need to process more abstract types of information. These more difficult tasks may
also require them to draw on less familiar or more specialized types of knowledge beyond that
given in the text. On average, they have about a 50% probability of performing Level 4 tasks
correctly; with Level 5 tasks, their likelihood of responding correctly decreases to 40%.
Table 4
Average Probabilities of Successful Performance, Prose Scale
Selected Proficiency ScoresProse level 150 200 250 300 350
%
1 48 81 95 99 100
2 14 40 76 94 99
3 6 18 46 78 93
4 2 7 21 50 80
5* 2 6 18 40 68
*Probabilities are based on one task.
43
Table 5
Average Probabilities of Successful Performance, Document Scale
Selected Proficiency ScoresDocumentlevel
150 200 250 300 350
%
1 40 72 94 99 100
2 20 51 82 95 99
3 7 21 50 80 94
4* 4 13 34 64 85
5* <1 1 3 13 41
*Probabilities are based on one task.

44
Table 6
Average Probabilities of Successful Performance, Quantitative Scale
Selected Proficiency ScoresDocumentlevel
150 200 250 300 350
%
1* 34 67 89 97 99
2 20 45 75 92 98
3 7 20 48 78 93
4 1 6 22 58 87
5 <1 2 7 20 53
*Probabilities are based on one task.
Similar kinds of interpretations can be made using the information presented for the
document and quantitative scales. For example, someone who is at 250 on the document scale
has, on average, an 82% chance of responding correctly to Level 2 tasks. His or her likelihood of
responding correctly decreases to 50% for Level 3 tasks, 34% for Level 4 tasks, and only 3% for
Level 5 tasks. Similarly, someone at 300 on the quantitative scale has a 78% chance of
responding correctly to tasks at this level, but only a 58% chance with Level 4 tasks and a 20%
chance with Level 5 tasks. Conversely, they would be expected to perform Level 1 and 2 tasks
correctly more than 90% of the time.
Conclusion
One of the goals of large-scale surveys is to provide information that can help
policymakers during the decision-making process. Presenting that information in a way that will
enhance understanding of what has been measured and the conclusions to be drawn from the data
is important to reaching this goal. This paper offers a framework that has been used for both

45
developing the tasks used to measure literacy as well as for understanding the meaning of what is
being reported with respect to the comparative literacy proficiencies of adults. The framework
identifies a set of variables that have been shown to underlie successful performance on a broad
array of literacy tasks. Collectively, they provide a means for moving away from interpreting
survey results in terms of discrete tasks or a single number, and toward identifying levels of
performance sufficiently generalized to have validity across assessments and groups. As concern
ceases to center on discrete behaviors or isolated observations and focuses more on providing
meaningful interpretations of performance, a higher level of measurement is reached (Messick,
1989).
46
References
Almond, R. G., & Mislevy, R. J. (1998). Graphical models and computerized adaptive testing.
(TOEFL Tech. Rep. No. 14). Princeton, NJ: Educational Testing Service.
Beach, R., & Appleman, D. (1984). Reading strategies for expository and literacy text types. In
A. Purves & 0. Niles (Eds.), Becoming readers in a complex society: Eighty-third
yearbook of the National Society for the Study of Education (p.115). Chicago: University
of Chicago Press.
Beaton, A. E., & Allen, N. L. (1992). Interpreting scales through scale anchoring. Journal of
Educational Statistics, 17, 191–204.
Cattel, R. B. (1966). The scree test for the number of factors. Multivariate Behavioral Research,
1, 140–161.
Clark, H., & Haviland, S. E. (1977). Comprehension and the given–new contract. In R. O.
Freedle (Ed.), Discourse production and comprehension (pp. 1–39). Norwood, NJ:
Ablex.
Cook-Gumperz, J., & Gumperz, J. (1981). From oral to written culture: The transition to literacy.
In M. Whitman (Ed.), Writing: The nature, development and teaching of written
communication: Vol. 1. Hillsdale, NJ: Erlbaum.
Crandall, J. (1981, December). Functional literacy of clerical workers: Strategies for minimizing
literacy demands and maximizing available information. Paper presented at the annual
meeting of the American Association for Applied Linguistics, New York.
Diehl, W. (1980). Functional literacy as a variable construct: An examination of the attitudes,
behaviors, and strategies related to occupational literacy. Unpublished doctoral
dissertation, Indiana University.
Fisher, D. L. (1981). Functional literacy tests: A model of question-answering and an analysis of
errors. Reading Research Quarterly, 16, 418–448.
Guthrie, J. T. (1988). Locating information in documents: A computer simulation and cognitive
model. Reading Research Quarterly, 23, 178–199.
Heath, S. B. (1980). The functions and uses of literacy. Journal of Communication, 30, 123–133.
Jacob, E. (1982). Literacy on the job: Final report of the ethnographic component of the
industrial literacy project. Washington, DC: Center for Applied Linguistics.
47
Kirsch, I. S., & Guthrie, J. T. (1984a). Adult reading practices for work and leisure. Adult
Education Quarterly, 34(4), 213–232.
Kirsch, I. S., & Guthrie, J. T. (1984b). Prose comprehension and text search as a function of
reading volume. Reading Research Quarterly, 19, 331–342.
Kirsch, I. S., & Jungeblut, A. (1986). Literacy: Profiles of America’s young adults—Final report
(NAEP Report No. 16–PL–Ol). Princeton, NJ: National Assessment of Educational
Progress.
Kirsch, I. S., & Jungeblut, A. (1992). Profiling the literacy proficiencies of JTPA and ES/UI
populations: Final report to the Department of Labor. Princeton, NJ: Educational Testing
Service.
Kirsch, I. S., Jungeblut, A., Jenkins, L., & Kolstad, A. (1993). Adult literacy in America: A first
look at the results of the National Adult Literacy Survey. Washington, DC: U.S.
Department of Education.
Kirsch, I. S., Jungeblut, A., & Mosenthal, P. B. (1998). The measurement of adult literacy. In T.
S. Murray, I. S. Kirsch, & L. Jenkins (Eds.), Adult literacy in OECD countries: Technical
report on the first international adult literacy survey. Washington, DC: U.S. Department
of Education, National Center for Education Statistics.
Kirsch, I. S., & Mosenthal, P. B. (1990). Exploring document literacy: Variables underlying the
performance of young adults. Reading Research Quarterly, 25, 5–30.
Kirsch, I. S., & Mosenthal, P. B. (1994). Interpreting the IEA Reading Literacy Scales. In M.
Binkley, K. Rust, & M. Winglee (Eds.), Methodological issues in comparative
educational studies: The case of the IEA Reading Literacy Study. Washington, DC:
National Center for Education Statistics, United States Department of Education.
Lerner, D., & Lasswell, H. D. (1951). The policy sciences: Recent developments in scope and
method. Stanford, CA: Stanford University Press.
Messick, S. (1987). Large-scale educational assessment as policy research: Aspirations and
limitations. European Journal of Psychology and Education, 2(2), 157–165.
Messick, S. (1989). Validity. In R. Linn (Ed.), Educational measurement (3rd ed.). New York:
Macmillan.
48
Messick, S., Beaton, A., & Lord, F. (1983). National assessment of educational progress
reconsidered: A new design for a new era. (NAEP Report 83–1). Princeton, NJ: National
Assessment of Educational Progress.
Mikulecky, L. (1982). Job literacy: The relationship between school preparation and workplace
actuality. Reading Research Quarterly, 17(3), 400–419.
Miller, P. (1982). Reading demands in a high-technology industry. Journal of Reading, 26(2),
109–115.
Montigny, G., Kelly, K., & Jones, S. (1991). Adult Literacy in Canada: Results of a National
Study. (Statistics Canada, Catalogue No. 89–525–XPE). Ottawa, Canada: Minister of
Industry, Science and Technology.
Mosenthal, P. B., & Kirsch, I. S. (1989–1991). Understanding documents [monthly column].
Journal of Reading. Newark, DE: International Reading Association.
Mosenthal, P. B., & Kirsch, I. S. (1991). Toward an explanatory model of document process.
Discourse Processes, 14, 147–180.
Mosenthal, P. B., & Kirsch, I. S. (1998). A new measure for assessing document complexity:
The PMOSE/IKIRSCH document readability formula. Journal of Adolescent and Adult
Literacy, 41(8), 638–657.
Organization for Economic Co-operation and Development. (1999). Measuring student
knowledge and skills: A new framework for assessment. Paris, France: Author.
Organization for Economic Co-operation and Development & Human Resources Development
Canada. (1997). Literacy skills for the knowledge society: Further results of the
international adult literacy survey. Paris, France, and Ottawa, Canada: Author.
Organization for Economic Co-operation and Development. (1992). Adult illiteracy and
economic performance. Paris, France: Author.
Organization for Economic Co-operation and Development & Statistics Canada. (1995).
Literacy, economy and society: results of the first international adult literacy survey.
Paris, France, and Ottawa, Canada: Author.
Organization for Economic Co-operation and Development & Statistics Canada. (2000). Literacy
in the information age: Final report of the international adult literacy survey. Paris,
France, and Ottawa, Canada: Author.

49
Resnick, D., & Resnick, L. (1977). The nature of literacy—An historical exploration. Harvard
Educational Review, 43, 370–385.
Scribner, S., & Cole, M. (1981). The psychology of literacy. Cambridge, MA: Harvard
University Press.
Sticht, T. G. (Ed.). (1975). Reading for working: A functional literacy anthology. Alexandria,
VA: Human Resources Research Organization.
Sticht, T. G. (1978). Literacy and vocational competency (Occasional Paper 39, National Center
for Research in Vocational Education). Columbus, OH: Ohio State University.
Sticht, T. G. (1982, January). Evaluation of the reading potential concept for marginally literate
adults. (Final Report FR–ET50–82–2). Alexandria, VA: Human Resources Research
Organization.
Szwed, J. (1981). The ethnography of literacy. In M. Whitman (Ed.), Writing: The nature,
development, and teaching of written communication: Vol. 1. Hillsdale, NJ: Erlbaum.
Tucker, L. R., & Finkbeiner, C. T. (1981). Transformation of factors by artificial personal
probability functions (ETS Research Report 81–58). Princeton, NJ: Educational Testing
Service.
Venezky, R. L. (1983). The origins of the present-day chasm between adult literacy needs and
school literacy instruction. Visible Language, 16, 113–136.
Werlich, E. (1976). A text grammar of English. Heidelberg: Quelle & Meyer.
Wickert, R. (1989). No single measure. Canberra, Australia: The Commonwealth Department of
Employment, Education and Training.

50
Notes
1 This section is based on the work of Werlich, 1976. Category names in parentheses are
alternative ways of labeling the class.2 Mosenthal and Kirsch wrote a monthly column on Understanding Documents, which appeared
in the Journal of Reading between 1989 and 1991.3 While most of the tasks in IALS received common RP80 values, a few tasks were assigned
values unique to a particular country when warranted by the data. Since the value assigned to
each variable used in the regression analyses was based on the evaluation of each task in English,
it was decided to use the RP80 values for the U.S. as well.4 The data used in the regression of prose literacy items are provided in Appendix B.5 The data used in the regression of document literacy items are provided in Appendix B.6 The data used in the regression of document literacy items are provided in Appendix B.
51
Appendix A
Coding Rules for the Process Variables
Type of Information
Type of information requested refers to the nature of information that readers must
identify to complete a question or directive. Types of information form a continuum of
concreteness, which was operationalized as follows for purposes of this analysis:
• When the requested information is a person, animal, place, or thing, score 1.
• When the requested information is an amount(s), time(s), attribute(s), action(s), or
location(s), score 2.
• When the requested information is a manner, goal, purpose, condition, or predicate
adjective, score 3.
• When the requested information is a cause, result, reason, evidence, similarity, or pattern,
score 4.
• When the requested information is an equivalent, difference, or theme, score 5.
Plausibility of Distracting Information
Plausibility of distracting information refers to whether or not an identifiable match exists
between information in the question and the text, or between the text and the distractors in a
multiple-choice question, which makes it difficult for readers to identify the correct answer. The
scoring rules for plausibility of distracting information are as follows:
• When there is no distracting information in the text, score 1.
• When distractors contain information that corresponds literally or synonymous
to information in the text but not in the same paragraph as the answer, score 2.
• When distractors contain information that represent plausible invited inferences not based
on information related to the paragraph in which the answer occurs, score 3.
• When one distractor in the choices contains information that is related to the
information in the same paragraph as the answer, score 4.
• When two or more distractors in the choices contain information that is
related to the information in the same paragraph as the answer, score 5.
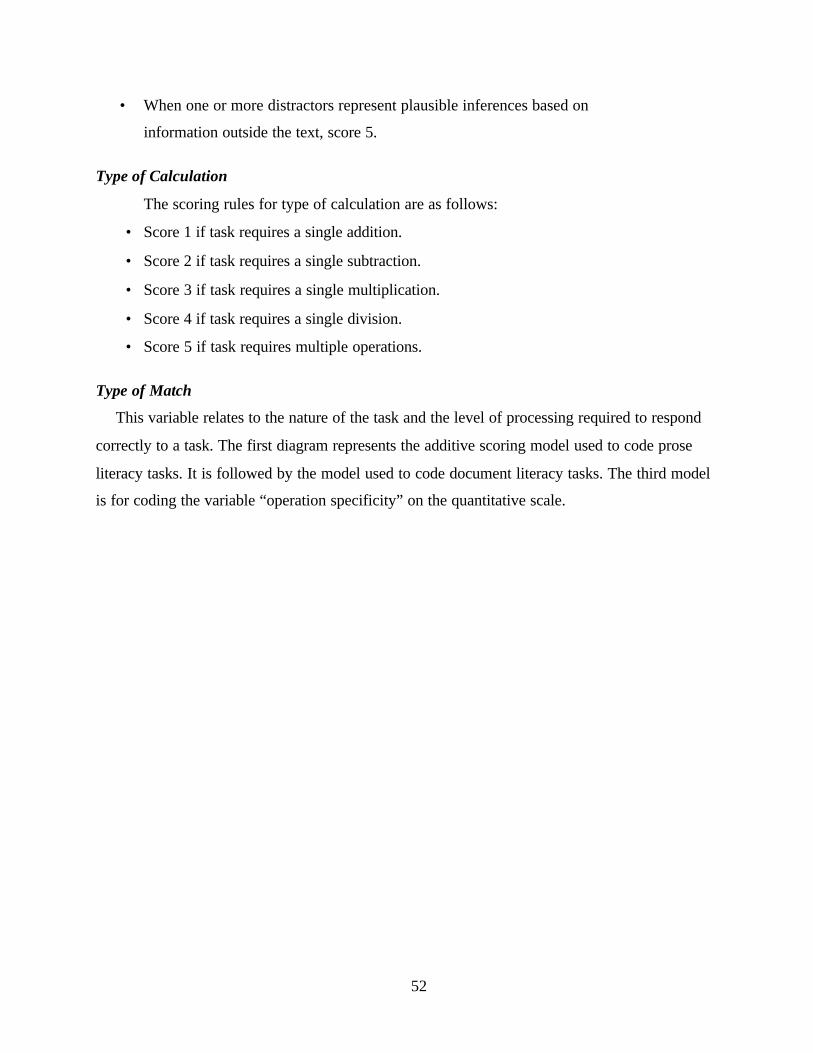
52
• When one or more distractors represent plausible inferences based on
information outside the text, score 5.
Type of Calculation
The scoring rules for type of calculation are as follows:
• Score 1 if task requires a single addition.
• Score 2 if task requires a single subtraction.
• Score 3 if task requires a single multiplication.
• Score 4 if task requires a single division.
• Score 5 if task requires multiple operations.
Type of Match
This variable relates to the nature of the task and the level of processing required to respond
correctly to a task. The first diagram represents the additive scoring model used to code prose
literacy tasks. It is followed by the model used to code document literacy tasks. The third model
is for coding the variable “operation specificity” on the quantitative scale.

53
An Additive Scoring Model for Prose Literacy Tasks
If locate,If cycle,If integrate,If generate,
If within paragraph, add 0;If between paragraphs, add 1.
For multiple responses:If number of responses is specified, add 0;If number of responses is unspecified, add 1.
If infer condition is based on synthesis of features identifiedthroughout paragraph, or if compare, add 0;If infer condition is based on synthesis of features identifiedbetween paragraphs, or if contrast, add 1.
add 1;add 2;add 3;add 5.
If 1 phrase to search on, add 0;If 2 phrases to search on, add 1;If 3 phrases to search on, add 2,If 4 phrases to search on, add 3.
dd 0;
If 1 item response, add 0;If 2 item response, add 1;If 3-4 item response, add 2;If 5 or more item response, add 3.
For given information:If match is literal or synonymous, add 0;If match requires a low-level text-based inference, add 1;If match requires a high-level text-based inference, add 3.
For requested information:If completion of new information frame requires no inferenceor the identification of a paradigmatic relationship, add 0;If completion of new information frame requires a low-leveltext-based inference, identification of a condition or anantecedent, or restatement of type of information, add 2;If completion of new information frame requires some specializedprior knowledge or the identification of a syntagmatic relationship, add 3;If completion of new information frame requires a high-leveltext-based inference, add 4.
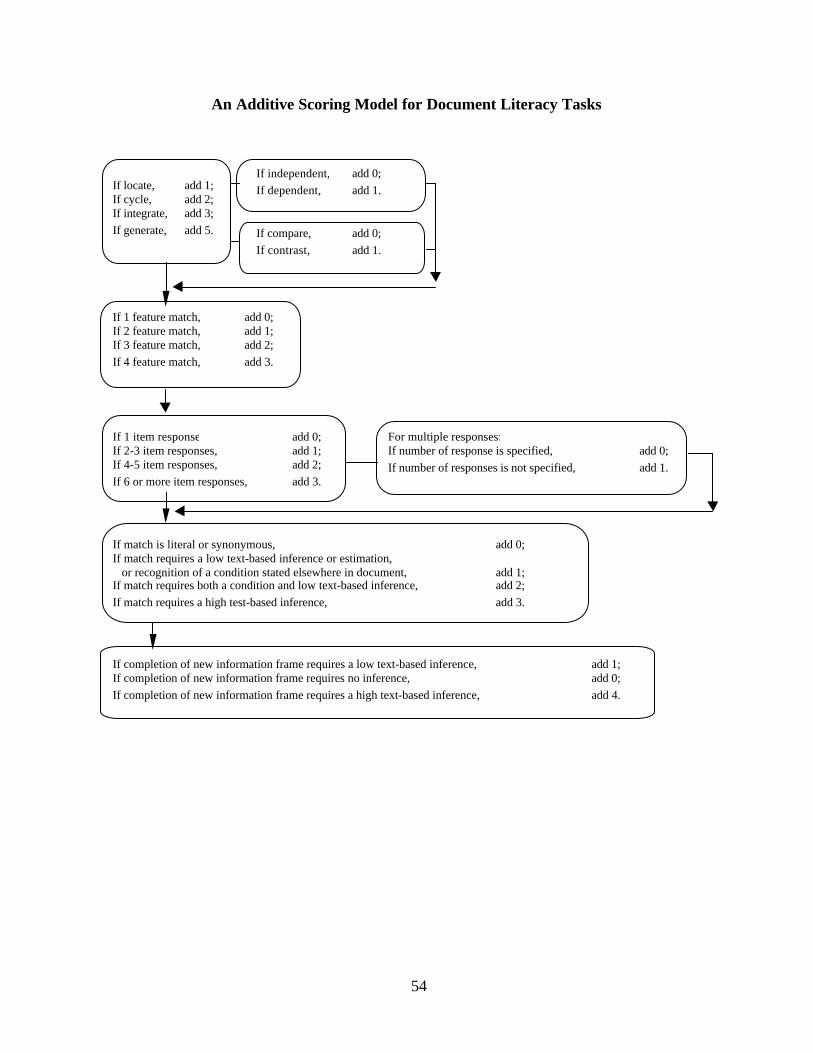
54
If independent, add 0;If dependent, add 1.
An Additive Scoring Model for Document Literacy Tasks
If 1 item response add 0;If 2-3 item responses, add 1;If 4-5 item responses, add 2;If 6 or more item responses, add 3.
If compare, add 0;If contrast, add 1.
If locate, add 1;If cycle, add 2;If integrate, add 3;If generate, add 5.
For multiple responses:If number of response is specified, add 0;If number of responses is not specified, add 1.
If completion of new information frame requires a low text-based inference, add 1;If completion of new information frame requires no inference, add 0;If completion of new information frame requires a high text-based inference, add 4.
If match is literal or synonymous, add 0;If match requires a low text-based inference or estimation, or recognition of a condition stated elsewhere in document, add 1;If match requires both a condition and low text-based inference, add 2;If match requires a high test-based inference, add 3.
If 1 feature match, add 0;If 2 feature match, add 1;If 3 feature match, add 2;If 4 feature match, add 3.
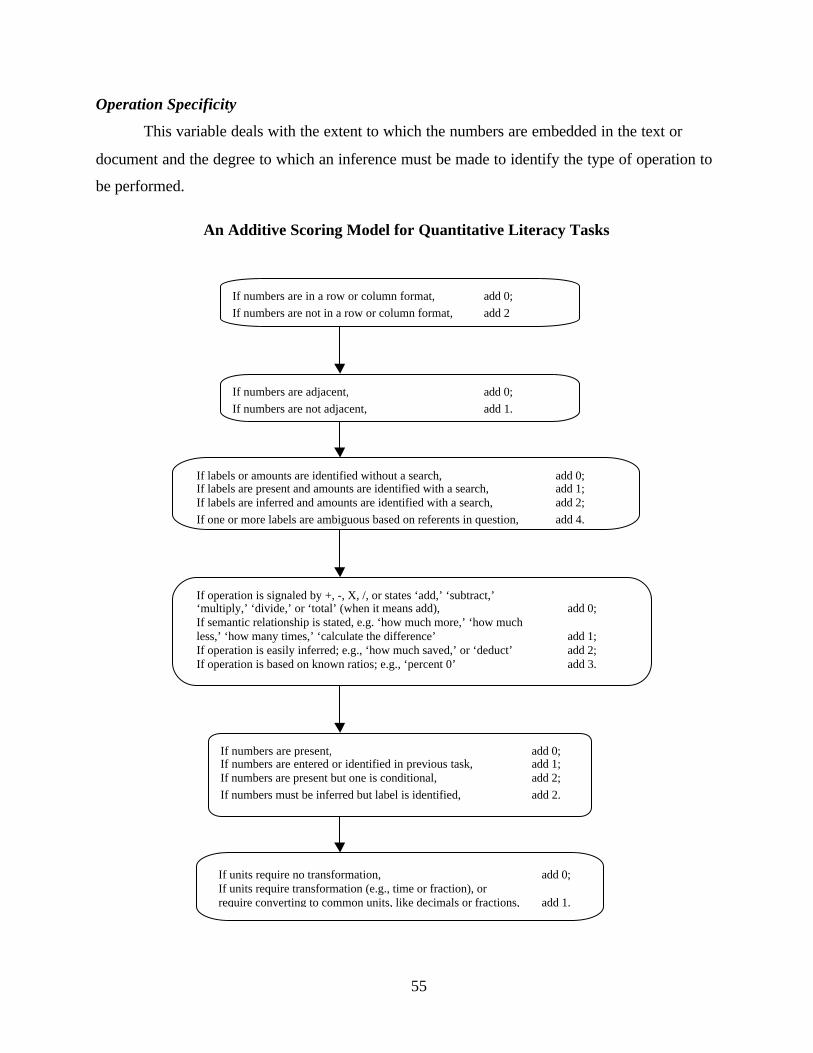
55
Operation Specificity
This variable deals with the extent to which the numbers are embedded in the text or
document and the degree to which an inference must be made to identify the type of operation to
be performed.
An Additive Scoring Model for Quantitative Literacy Tasks
If numbers are adjacent, add 0;If numbers are not adjacent, add 1.
If labels or amounts are identified without a search, add 0;If labels are present and amounts are identified with a search, add 1;If labels are inferred and amounts are identified with a search, add 2;If one or more labels are ambiguous based on referents in question, add 4.
If numbers are in a row or column format, add 0;If numbers are not in a row or column format, add 2
If operation is signaled by +, -, X, /, or states ‘add,’ ‘subtract,’‘multiply,’ ‘divide,’ or ‘total’ (when it means add), add 0;If semantic relationship is stated, e.g. ‘how much more,’ ‘how muchless,’ ‘how many times,’ ‘calculate the difference’ add 1;If operation is easily inferred; e.g., ‘how much saved,’ or ‘deduct’ add 2;If operation is based on known ratios; e.g., ‘percent 0’ add 3.
If units require no transformation, add 0;If units require transformation (e.g., time or fraction), orrequire converting to common units, like decimals or fractions, add 1.
If numbers are present, add 0;If numbers are entered or identified in previous task, add 1;If numbers are present but one is conditional, add 2;If numbers must be inferred but label is identified, add 2.

56
Appendix B:
Data from Prose, Document, and Quantitative Items
Table B1Code values for IALS prose literacy items
Item RP80 TOM TOI POD READ
core1 190.00 1.00 2.00 1.00 6.00
b1q5 318.00 5.00 4.00 3.00 7.00
b1q6 297.00 3.00 3.00 3.00 7.00
b1q10 248.00 1.00 1.00 2.00 9.00
b1q11 377.00 7.00 3.00 4.00 9.00
b2q1 254.00 1.00 3.00 3.00 8.00
b2q3 230.00 1.00 4.00 2.00 8.00
b2q6 329.00 5.00 4.00 4.00 8.00
b2q7 374.00 6.00 4.00 4.00 8.00
b3q7 306.00 5.00 2.00 3.00 7.00
b3q8 338.00 6.00 5.00 1.00 7.00
b3q9 287.00 3.00 3.00 2.00 7.00
b3q11 281.00 3.00 3.00 2.00 8.00
b3q12 318.00 4.00 4.00 4.00 8.00
b3q13 297.00 3.00 3.00 2.00 17.00
b3q15 246.00 2.00 2.00 2.00 8.00
b4q1 188.00 1.00 2.00 1.00 6.00
(Table continues)
57
Table B1 (continued)
Item RP80 TOM TOI POD READ
b4q2 298.00 4.00 3.00 2.00 6.00
b4q6 314.00 3.00 3.00 2.00 8.00
b4q7 306.00 4.00 5.00 2.00 8.00
b5q1 192.00 1.00 1.00 1.00 8.00
b5q2 226.00 2.00 2.00 4.00 8.00
b5q3 255.00 1.00 2.00 3.00 12.00
b5q4 350.00 6.00 5.00 3.00 12.00
b5q5 324.00 3.00 3.00 4.00 12.00
b5q6 316.00 5.00 3.00 2.00 12.00
b6q1 209.00 1.00 4.00 1.00 6.00
b6q7 275.00 4.00 2.00 2.00 13.00
b6q8 310.00 5.00 3.00 3.00 13.00
b7q10 271.00 4.00 1.00 1.00 8.00
b7q11 349.00 7.00 3.00 2.00 8.00
b7q13 206.00 1.00 2.00 2.00 6.00
b7q14 294.00 5.00 2.00 3.00 6.00
b7q15 275.00 3.00 2.00 1.00 6.00

58
Table B2Code values for IALS document literacy items
Item RP80 TOM TOI POD READ
core2 182.00 1.00 1.00 2.00 1.00
b1q1 291.00 2.00 3.00 2.00 2.00
b1q2 254.00 1.00 2.00 2.00 2.00
b1q13 237.00 1.00 2.00 3.00 2.00
b2q8 322.00 4.00 2.00 3.00 5.00
b2q10 304.00 3.00 2.00 4.00 4.00
b2q11a 231.00 1.00 2.00 1.00 4.00
b2q11b 280.00 4.00 2.00 3.00 4.00
b2q11c 227.00 1.00 1.00 1.00 4.00
b2q11d 221.00 1.00 1.00 1.00 4.00
b2q11e 237.00 2.00 1.00 1.00 4.00
b3q2 341.00 6.00 5.00 2.00 5.00
b3q5 296.00 4.00 2.00 3.00 7.00
b4q4 321.00 4.00 3.00 4.00 1.00
b4q5a 294.00 3.00 2.00 3.00 1.00
b4q12a 229.00 1.00 1.00 1.00 2.00
b4q12b 256.00 1.00 1.00 2.00 2.00
b4q12c 222.00 1.00 1.00 1.00 2.00
b4q12d 195.00 1.00 1.00 1.00 2.00
b5q7 242.00 2.00 2.00 2.00 5.00
b5q8 291.00 3.00 2.00 2.00 5.00
b5q10 295.00 5.00 4.00 3.00 5.00
b5q11d 302.00 4.00 2.00 2.00 3.00
(Table continues)
59
Table B2 (continued)
Item RP80 TOM TOI POD READ
b5q12 313.00 5.00 1.00 4.00 3.00
b6q4 218.00 1.00 1.00 2.00 2.00
b6q6 250.00 2.00 4.00 1.00 2.00
b6q9 270.00 3.00 2.00 3.00 9.00
b6q11 297.00 4.00 2.00 3.00 9.00
b7q1 188.00 1.00 2.00 2.00 2.00
b7q3 234.00 3.00 1.00 2.00 2.00
b7q4 270.00 4.00 2.00 4.00 6.00
b7q7 327.00 4.00 1.00 3.00 11.00
b7q8 287.00 4.00 2.00 2.00 11.00
b7q9 408.00 5.00 2.00 5.00 11.00

60
Table B3Code values for IALS quantitative literacy items
Item RP80- TOM POD TOC OSPEC READ
Core 262.00 2.00 2.00 2.00 3.00 1.00
Core 232.00 1.00 1.00 1.00 1.00 1.00
b1q4 289.00 1.00 3.00 1.00 3.00 7.00
b1q7 300.00 2.00 2.00 2.00 4.00 6.00
b1q9 302.00 3.00 4.00 1.00 3.00 6.00
b1q14 327.00 3.00 4.00 5.00 4.00 2.00
b1q15 265.00 3.00 2.00 1.00 3.00 2.00
b2q4 315.00 2.00 3.00 5.00 5.00 2.00
b2q5 408.00 2.00 4.00 5.00 7.00 2.00
b2q9 255.00 4.00 4.00 2.00 3.00 5.00
b3q1 276.00 2.00 2.00 2.00 4.00 5.00
b3q3 277.00 3.00 4.00 1.00 2.00 5.00
b3q6 308.00 3.00 4.00 2.00 4.00 7.00
b3q14 328.00 1.00 1.00 3.00 6.00 17.00
b4q3 272.00 1.00 1.00 3.00 3.00 6.00
b4q5b 302.00 1.00 3.00 3.00 2.00 1.00
b4q9 324.00 3.00 4.00 2.00 3.00 11.00
b4q10 381.00 4.00 4.00 5.00 9.00 11.00
b4q11 280.00 4.00 3.00 1.00 4.00 11.00
b4q12 229.00 1.00 1.00 1.00 1.00 2.00
b4q12 225.00 1.00 1.00 1.00 1.00 2.00
b5q9 293.00 4.00 2.00 2.00 5.00 5.00
b5q11 336.00 1.00 1.00 1.00 6.00 3.00
b5q11 331.00 7.00 3.00 5.00 6.00 3.00
(Table continues)
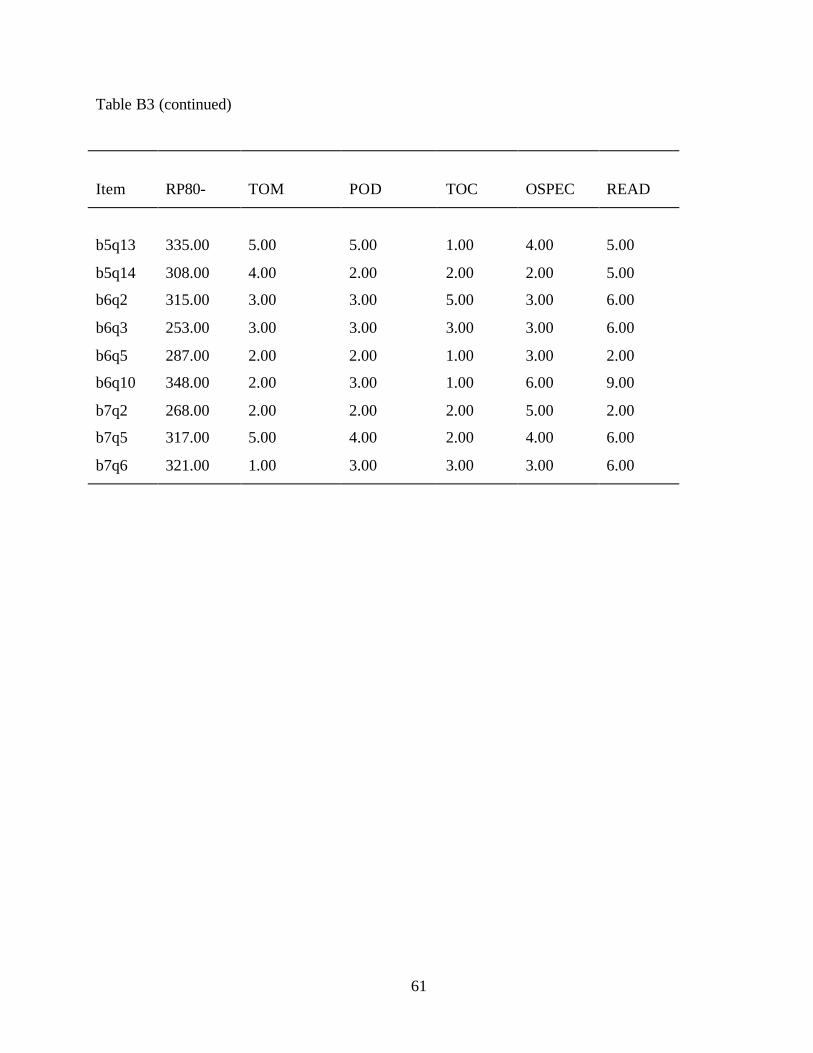
61
Table B3 (continued)
Item RP80- TOM POD TOC OSPEC READ
b5q13 335.00 5.00 5.00 1.00 4.00 5.00
b5q14 308.00 4.00 2.00 2.00 2.00 5.00
b6q2 315.00 3.00 3.00 5.00 3.00 6.00
b6q3 253.00 3.00 3.00 3.00 3.00 6.00
b6q5 287.00 2.00 2.00 1.00 3.00 2.00
b6q10 348.00 2.00 3.00 1.00 6.00 9.00
b7q2 268.00 2.00 2.00 2.00 5.00 2.00
b7q5 317.00 5.00 4.00 2.00 4.00 6.00
b7q6 321.00 1.00 3.00 3.00 3.00 6.00


Recommended